Embed Size (px)
Citation preview
Stephan Engels | CFO | Frankfurt | 02 November 2015
Overall stable performance in Q3 2015 and further strengthened capital ratiosAnalyst conference – Q3 2015 results

2Stephan Engels | CFO | Frankfurt | 02 November 2015
Summary Q3 2015
CET1 ratio fully phased-in increased to 10.8% and leverage ratio to 4.1% – further dividend accrual in Q3 2015
Group LLPs of €146m at low level – Expenses of €1.734m in line with our expectations
NCA with further asset run down of €5.1bn in Commercial Real Estate and Ship Finance –Ship Finance already below €10bn – NPL in NCA reduced to €3.1bn / 4.5%
Core Bank revenues 12% lower q-o-q in challenging capital markets (C&M / Treasury) –on 9M 2015 basis good increase of 7% / ~€450m
Group operating result of €429m above Q2 2015 (€385m) and also Q3 2014 (€343m) –net result of €207m leads to €853m in 9M 2015 well above 9M 2014 (€525m)

3Stephan Engels | CFO | Frankfurt | 02 November 2015
Key financial figures at a glance
Q3 2015 vs. Q2 2015 9M 2015 vs. 9M 2014
Fin
anci
alR
esul
tB
3 C
ET
1
fully
pha
sed-
in
416
641
429385
207280
Q3 2015Q2 2015
Net result1)
Op. resultGroup
Op. resultCore Bank
924 853
525
9M 2015
1,4991,828
9M 2014
1,535
10.810.5
Q3 20152)Q2 2015
10.89.6
9M 20152)9M 2014
1) Consolidated result attributable to Commerzbank shareholders 2) Includes net result of 9M 2015
€m
%

4Stephan Engels | CFO | Frankfurt | 02 November 2015
Quarterly transition, Group€m
Net RoE (%) 2.9Net RoTE (%) 3.2
1) 1)
1) Consolidated result attributable to Commerzbank shareholders
Group operating result of €429m above Q2 2015 and Q 3 2014
225207
401429
385343
194134109
Restructuring Expenses
28
Operating result
Q3 2015
Costs
19
LLPRevenuesOperating result
Q2 2015
Net resultQ3 2014
Net resultQ3 2015
Tax, Minorities
Pre-tax profit
Operating result
Q3 2014
Highlights
▲ 9M 2015 operating result of €1.5bn significantly above 9M 2014 (€0.9bn)
▲ Lower revenues q-o-q more than compensated by lower LLPs benefiting from high quality of loan book
▲ Restructuring charges of €28m to further streamline backoffice operations in Corporate Center and Corporates & Markets
► Tax rate of 41% due to swing in DTAs from temporary differences (capital neutral) and tax payment for prior period
Op. RoE (%) 5.8Op. RoTE (%) 6.5
5Stephan Engels | CFO | Frankfurt | 02 November 2015
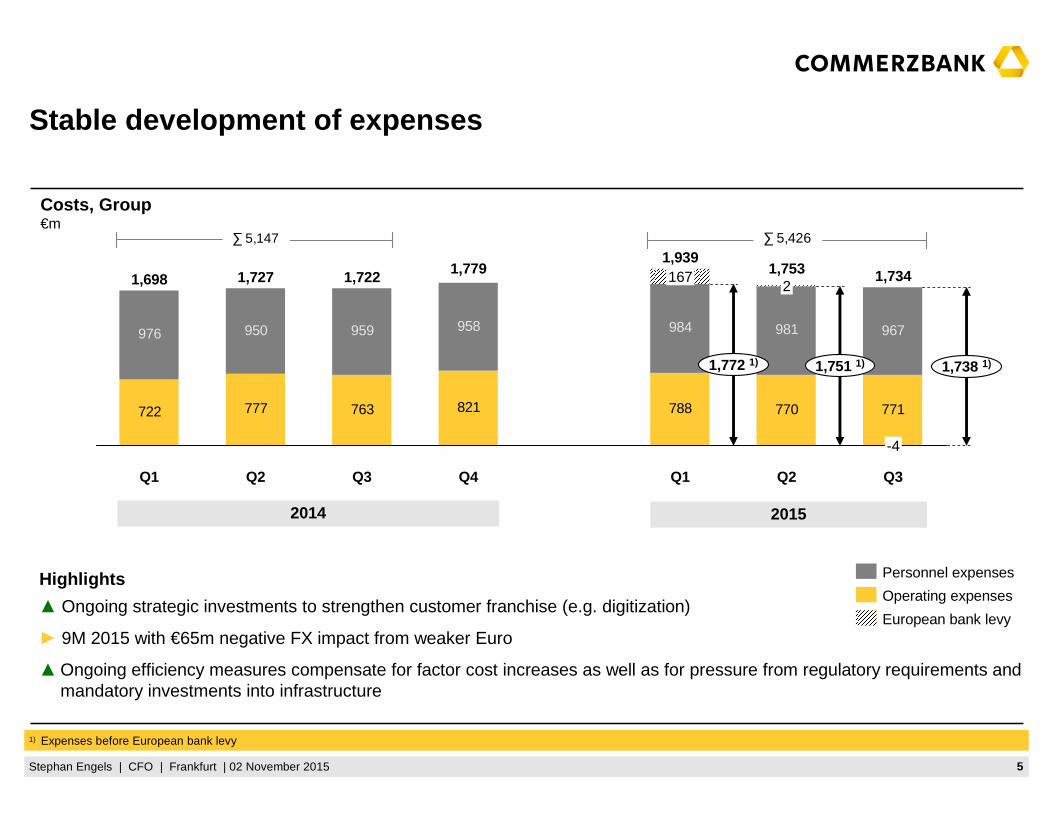
Costs, Group€m
Highlights
▲ Ongoing strategic investments to strengthen customer franchise (e.g. digitization)
► 9M 2015 with €65m negative FX impact from weaker Euro
▲Ongoing efficiency measures compensate for factor cost increases as well as for pressure from regulatory requirements and mandatory investments into infrastructure
2014 2015
722 777 763 821 771
976 950 959 958 967
770788
981984
1,734
1,738 1)1,751 1)
1,753
1,772 1)
Q3
-4
Q2
2
Q1
1,939167
Q4
1,779
Q3
1,722
Q2
1,727
Q1
1,698
Personnel expenses
European bank levy
Operating expenses
1) Expenses before European bank levy
∑ 5,147 ∑ 5,426
Stable development of expenses

6Stephan Engels | CFO | Frankfurt | 02 November 2015
Provisions for loan losses, Group€m
104
193
90 10361
138
134
64 251 205
97
142
74
Q1
238
158
Q4
308
Q3
341
Q2
257
Q3
146
72
280
Q2Q1
Core Bank
NCA
2014 2015
∑ 836 ∑ 584
Reduced LLPs due to high quality of loan book
Highlights
▲ Low LLPs in Core Bank driven by high quality of loan book and an ongoing robust German economy
▲ Ship Finance LLPs of €70m in Q3 2015 and €239m in 9M 2015 significantly down by 38% compared to 9M 2014
▲Decreased LLPs in CRE due to provisions of €51m for portfolio sales in Q2 2015

7Stephan Engels | CFO | Frankfurt | 02 November 2015
Quarterly transitionOperating result, €m
Core Bank: Operating result affected by challenging ca pital markets
416
641
771
-56
595
442498
129
10777
Q1 2015Q4 2014Q3 2014Q2 2014Q1 2014 O&CCMCEE
29
MSBPC
59
Q2 2015 Q3 2015
Ø equity (€ bn) 19.8Op. RoE (%) 12.0
Op. RoTE (%) 14.2
CIR (%) 70.6
Ø equity (€ bn) 22.0Op. RoE (%) 11.7
Op. RoTE (%) 13.6
CIR (%) 68.3
Ø equity (€ bn) 22.6Op. RoE (%) 7.4Op. RoTE (%) 8.5
CIR (%) 77.3
Highlights▲Good return level in 9M 2015 of 13.2% in operating RoTE despite lower operating result in Q3 2015▲PC and CEE with sound operating performance – PC with net one-off gain (€81m) from extraordinary dividend and higher
net additional provisions for litigation and recourses ►MSB stable taking into account negative q-o-q revenue swings from a one off (€-41m) and net CVA/DVA (€-47m)▼ Lower operating revenues in Corporates & Markets and Treasury (O&C) in challenging capital markets in Q3 2015► Initial recognition of FVA through P&L (-131m) mostly compensated by a release of a valuation adjustment (both O&C)

8Stephan Engels | CFO | Frankfurt | 02 November 2015
Quarterly transitionOperating result, €m
171161
71
120115111
149
54
16
RevenuesQ2 2015Q1 2015Q4 2014Q3 2014Q2 2014Q1 2014 Q3 2015
+35%
230
Costs
11
LLP
81
Highlights
▲Revenues include positive net one-off effect of €81m from extraordinary dividend from EURO Kartensysteme payment provider and higher net additional provisions for litigation and recourses
►NII excluding one-off item burdened by the persistingly low interest rate environment, while NCI has been stable q-o-q
▲Another 87k net new customers in Q3 2015 / 753k since year end 2012 – well on track for our target in 2016
Ø equity (€ bn) 4.2Op. RoE (%) 11.4Op. RoTE (%) 16.3CIR (%) 84.2
Ø equity (€ bn) 4.0Op. RoE (%) 17.3Op. RoTE (%) 25.4CIR (%) 79.0
Ø equity (€ bn) 4.0Op. RoE (%) 23.3Op. RoTE (%) 34.1
CIR (%) 75.7
Private Customers: Profitable growth path continues
Net one-off effect

9Stephan Engels | CFO | Frankfurt | 02 November 2015
Direct Banking – Revenues before LLP €m
Filialbank – Revenues before LLP €m
Commerz Real – Revenues before LLP €m
PC divisional split
9286
Q32015
94
Q22015
Q32014
364537
Q32015
Q22015
Q32014
Q22015
Q32015
838777
Q32014
740▲Ratio of assets in premium and
managed accounts increased again from 44% to 46% q-o-q
▲ New mortgage loans of more than €9bn ytd – loan book with further growth of +2% q-o-q and +8% y-o-y
▲ 55k net new customers in Q3 2015
▲Growth in flagship fund "hausInvest": AuM exceeded 10bn EUR
► Stable revenues y-o-y – after a strong Q2 2015 in Asset Structuring business
▲ Increased fee income from securities transactions (+€1m q-o-q and +€7m y-o-y)
▲ Strong customer growth with 33k net new customers in Q3 2015

10Stephan Engels | CFO | Frankfurt | 02 November 2015
Quarterly transitionOperating result, €m
Mittelstandsbank: Almost stable operating performance burdened by a one-off and net CVA/DVA
216
293
342
252
365
269
339
106
Q3 2015
-26%
Costs
1
LLP
30
RevenuesQ2 2015Q1 2015Q4 2014Q3 2014Q2 2014Q1 2014
Highlights
►Almost stable revenues from client business in the low interest rate environment
▼Q-o-q impact from impairment on a shareholding of a tech provider (€-41m) and net CVA/DVA (€-47m) have driven revenue decrease
▲ Loan volume stable q-o-q and +5% compared to 9M 2014
Ø equity (€ bn) 7.6Op. RoE (%) 19.1Op. RoTE (%) 21.5CIR (%) 46.1
Ø equity (€ bn) 8.1Op. RoE (%) 14.5Op. RoTE (%) 16.1CIR (%) 50.4
Ø equity (€ bn) 8.1Op. RoE (%) 10.7Op. RoTE (%) 11.8
CIR (%) 59.4

11Stephan Engels | CFO | Frankfurt | 02 November 2015
Financial Institutions – Revenues before LLP €m
119 102122
Q32015
Q22015
Q32014
Großkunden & International – Revenues before LLP €m
Mittelstand Germany – Revenues before LLP €m
MSB divisional split
157
252241
Q32015
Q22015
Q32014
335377
340
Q32015
Q22015
Q32014
▲Almost stable revenues from client business
►Declining loan volume due to economic slow down in BRICS countries and continued de-risking in Russia
►Negative swing in net CVA/DVA
▲Growth in lending volume +2% q-o-q; +9% compared to 9M 2014
▼Negative swing in net CVA/DVA and impairment on a shareholding of a tech provider
▼ Lower NCI from interest and currency hedging and lower NII from loans due to margins
▲ Increased net commission income from currency hedging and corporate finance
►Q-o-q stable loan volumes and margins (loan volume +4% vs. 9M 2014)

12Stephan Engels | CFO | Frankfurt | 02 November 2015
Quarterly transitionOperating result, €m
Central & Eastern Europe: Further sound operational development
Highlights
▲ Increased revenues q-o-q driven by net interest income as well as sound net trading income
▲ Again strong performance of net commission income which is benefiting from cooperation with AXA
▲Continued increase of loan volume in corporates and deposits from corporates and retail clients
►Uncertainty from potential legislative initiatives regarding conversion of CHF-mortgages and banking levy in Poland remains
70
46
Q4 2014
89
Q3 2014
93
Q2 2014
84
Q1 2014
98
Q3 2015
+45%
93
Costs
13
LLP
4
Revenues
20
Q2 2015
64
Q1 2015
116
Sale of insurance business
Ø equity (€ bn) 1.7Op. RoE (%) 21.5Op. RoTE (%) 26.6CIR (%) 46.1
Ø equity (€ bn) 1.9Op. RoE (%) 13.2Op. RoTE (%) 16.0CIR (%) 57.7
Ø equity (€ bn) 2.0Op. RoE (%) 19.0Op. RoTE (%) 23.0
CIR (%) 46.9

13Stephan Engels | CFO | Frankfurt | 02 November 2015
Quarterly transitionOperating result excl. OCS and net CVA/DVA1), €m
32
143
255
151148
193202
119
Q3 2015
-78%
Costs
8
LLP
0
RevenuesQ2 2015Q1 2015Q4 2014Q3 2014Q2 2014Q1 2014
Corporates & Markets: Concerns over global growth we igh on seasonally slow quarter
Result excl. OCSand net CVA/DVA1)
1) Net of hedges 2) Excl. OCS effect and net CVA/DVA (net of hedges)
2)
Reported result
Highlights
►Client activity affected by increased uncertainty in September in a traditionally slow quarter, impacting both primary issuance and sales & trading
►Expenses and LLPs remain stable
▲Restructuring charges to further streamline backoffice operations in New York
214 157 120
Ø equity (€ bn) 4.6
Op. RoE (%) 12.9 2)
Op. RoTE (%) 13.4 2)
CIR (%) 68.8 2)
Ø equity (€ bn) 4.8Op. RoE (%) 11.9 2)
Op. RoTE (%) 12.3 2)
CIR (%) 68.6 2)
Ø equity (€ bn) 4.6Op. RoE (%) 2.7 2)
Op. RoTE (%) 2.8 2)
CIR (%) 88.5 2)
185 302 184 77

14Stephan Engels | CFO | Frankfurt | 02 November 2015
Corporate Finance – Revenues before LLPs(excl. CVA/DVA 1))€m
FIC – Revenues before LLPs(excl. OCS effect, CVA/DVA 1))€m
CPM – Revenues before LLPs(excl. CVA/DVA 1))€m
EMC – Revenues before LLPs€m
261
115
Q32015
91
Q22015
Q32014
8576
Q32015
89
Q22015
Q32014
51
134
Q32015
88
Q22015
Q32014
1) Net of hedges
97118
156
Q32015
Q22015
Q32014
Corporates & Markets divisional split
▼ Lower deal activity both in primary debt and equitymarkets due to market uncertainty
►Ongoing lower deposit income as a result of the low interest rate environment
► After an exceptionally strong Q2, increased levels of uncertainty due to developments in global markets lead to lower demand for investments products and impact institutional business
►Performance in credit affected by market liquidity
►Continued positive FX product performance unable to compensate fully for ongoing impact of low interest rate environment on rates business
▲ Stable development in volatile markets
15Stephan Engels | CFO | Frankfurt | 02 November 2015
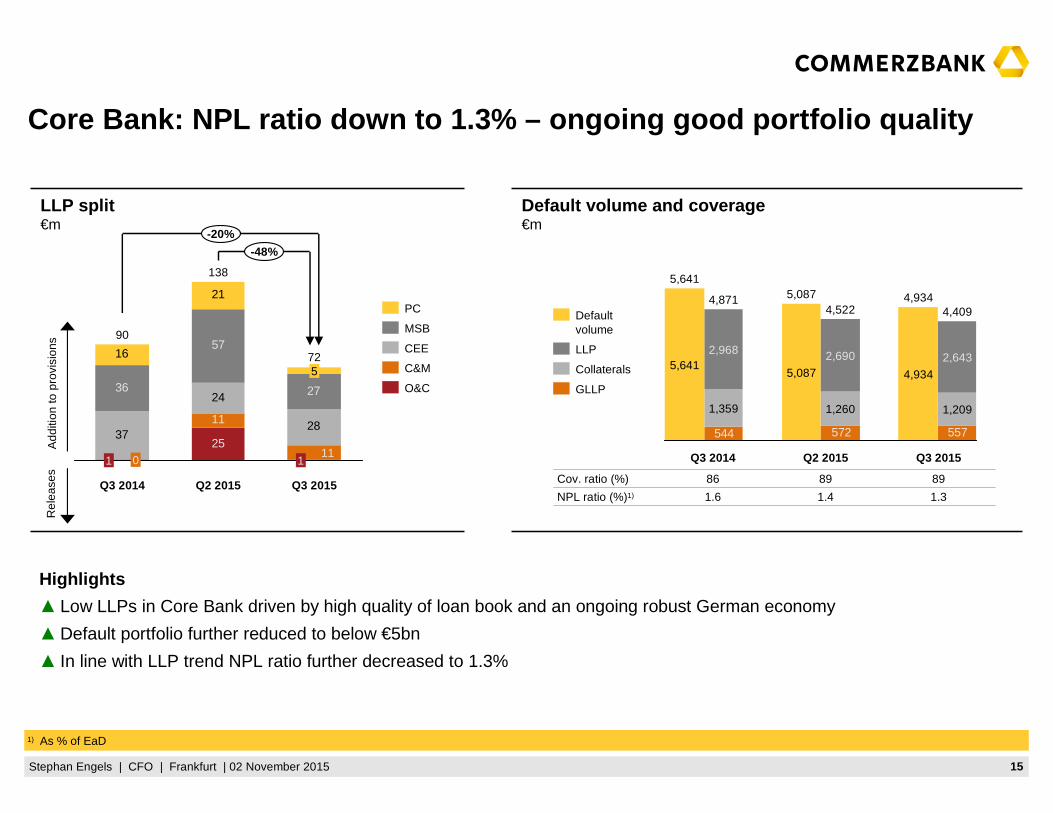
Highlights
▲ Low LLPs in Core Bank driven by high quality of loan book and an ongoing robust German economy
▲Default portfolio further reduced to below €5bn
▲ In line with LLP trend NPL ratio further decreased to 1.3%
LLP split€m
Default volume and coverage€m
1) As % of EaD
Add
ition
to p
rovi
sion
sR
elea
ses
Q3 2014 Q2 2015 Q3 2015
Cov. ratio (%) 86 89 89
NPL ratio (%)1) 1.6 1.4 1.3
557572544
5,087
2,690
1,260
5,0874,522
4,934
2,643
4,934
1,209
4,8714,409
5,641
5,641
2,968
1,359
GLLP
Collaterals
LLP
Default volume
37
24
28
36
57
27
16
21
25
11
-48%
Q3 2015
72
111
5
Q2 2015
138
Q3 2014
90
1 0
-20%
O&C
CEE
C&M
MSB
PC
Core Bank: NPL ratio down to 1.3% – ongoing good por tfolio quality

16Stephan Engels | CFO | Frankfurt | 02 November 2015
Quarterly transitionOperating result, €m
1) CRE and Ship Finance (=Deutsche Schiffsbank – this shall apply throughout the document)
13
-256
-86
-184
-252
-185-174
Q3 2015Costs
>100%
9
LLPRevenues
192
Q2 2015Q1 2015Q4 2014Q3 2014Q2 2014Q1 2014
68
Highlights▲ Strong revenue increase q-o-q mainly due to positive valuation gains – in contrast to negative valuation effects in
Q2 2015
▲ Successfully closed Q2 2015 portfolio transactions in CRE and ship restructuring platform in Ship Finance
► Lower LLPs q-o-q primarily due to €51m LLPs booked in Q2 2015 for CRE portfolio transactions
NCA: Operating result driven by valuations and lower pro visioningneeds
Ø equity (€ bn) 7.7
EaD incl. NPL (€ bn) 36 1)
Ø equity (€ bn) 7.4
EaD incl. NPL (€ bn) 27 1)
Ø equity (€ bn) 7.0
EaD incl. NPL (€ bn) 22 1)

17Stephan Engels | CFO | Frankfurt | 02 November 2015
▲Overall EaD for CRE and Ship Finance of €22bn only €2bn above target 2016
▲ LLPs in NCA almost completely driven by Ship Finance portfolio (€70m in Q3 2015; 9M 2015: €239m vs. 9M 2014: €383m)
▲NPL ratio significantly reduced to 4.5% – default portfolio reduced in CRE as well as in Ship Finance
Default volume and coverage 2)
€m
LLP split€m
EaD incl. default volume€bn
Q3 2014 Q2 2015 Q3 2015
Cov. ratio (%) 105 105 111
NPL ratio (%)1) 7.7 7.1 4.5
82
173
96
7046
-71%
254
-48%
Q3 2015
74
5
Q2 2015
142
Q3 2014
CRE
Ship Finance
2316
12
13
1110
-39%
Q3 2015
22
Q2 2015
27
Q3 2014
36 -19%
CRE
ShipFinance
1,788
2,309
4,4863,511
291
3,068
297
5,326 1,088
264
2,040
6,779
7,092
5,326
3,3923,068
6,779
5,590
Default volume
Collaterals
GLLP
LLP
Note: Numbers may not add up due to rounding 1) As % of EaD 2) Incl. CRE, Ship Finance and Public Finance
CRE / Ship Finance: NPL reduced to €3.1bn / 4.5% – E aD in Ship Finance already down to €9.7bn

18Stephan Engels | CFO | Frankfurt | 02 November 2015
RWA (B3 fully phased-in) development and segmental split€ bn
NCA
41.7
Core Bank
171.8
Stable development of RWA
NCA
41.2
Core Bank
173.3
Q22015
Q32015
Note: Numbers may not add up due to rounding
Q2 2015
214.4
171.4
Q3 2015
213.5
171.0
20.5
22.0
20.4
22.7
Credit Risk
Market Risk
Operational Risk
19Stephan Engels | CFO | Frankfurt | 02 November 2015
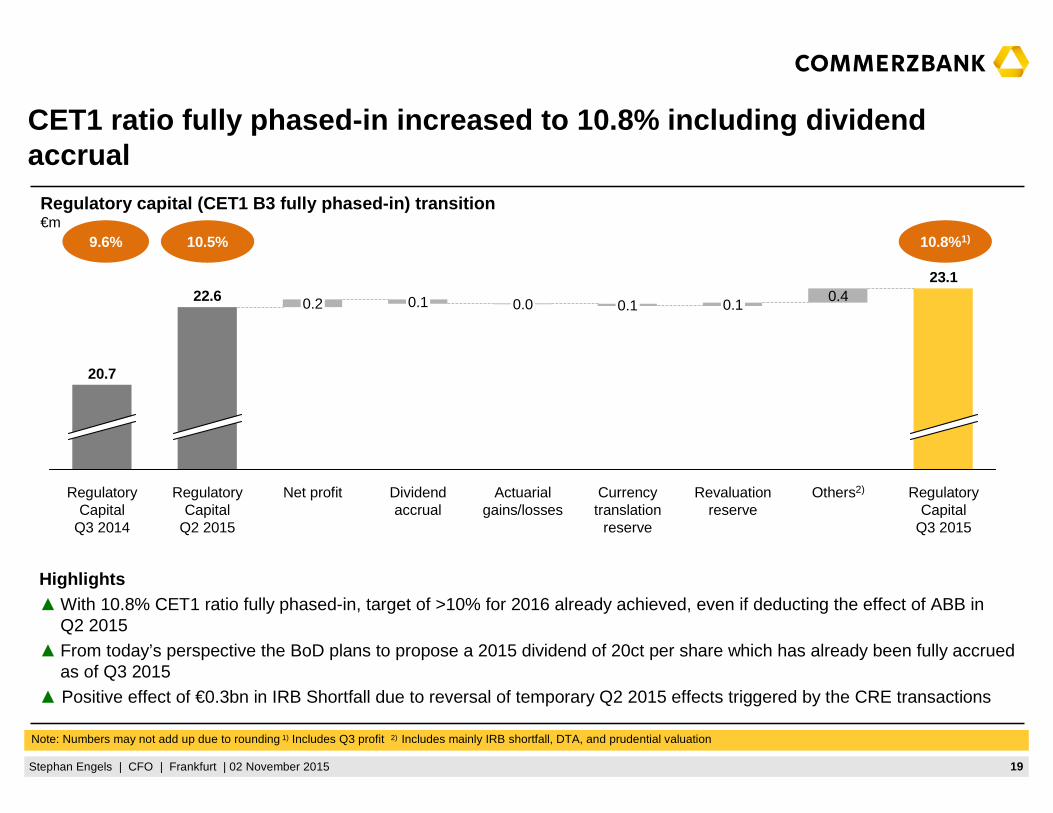
Regulatory capital (CET1 B3 fully phased-in) transi tion€m
Highlights▲With 10.8% CET1 ratio fully phased-in, target of >10% for 2016 already achieved, even if deducting the effect of ABB in
Q2 2015▲ From today’s perspective the BoD plans to propose a 2015 dividend of 20ct per share which has already been fully accrued
as of Q3 2015▲ Positive effect of €0.3bn in IRB Shortfall due to reversal of temporary Q2 2015 effects triggered by the CRE transactions
CET1 ratio fully phased-in increased to 10.8% includi ng dividend accrual
10.8%1)9.6%
Note: Numbers may not add up due to rounding 1) Includes Q3 profit 2) Includes mainly IRB shortfall, DTA, and prudential valuation
23.1
RegulatoryCapital
Q3 2015
Others2)
0.4
Revaluation reserve
0.1
Currency translation
reserve
0.1
Actuarial gains/losses
0.0
Dividend accrual
0.1
Net profit
0.2
RegulatoryCapital
Q2 2015
22.6
RegulatoryCapital
Q3 2014
20.7
10.5%

20Stephan Engels | CFO | Frankfurt | 02 November 2015
Total assets and LR exposure€bn
Leverage ratio increased to 4.1% fully phased-in
Leverage ratio fully phased-in 1) as of Q3 2015 %
Q3 20152)
4.1
Q2 2015
4.0
Q3 2014
3.4
Note: Numbers may not add up due to rounding 1) Leverage ratio according to revised CRD4/CRR rules published 10 October 2014 2) Includes net profit as of reporting date
564561596
563
609568
Q3 2015Q2 2015Q3 2014
LR exposure
Total assets

21Stephan Engels | CFO | Frankfurt | 02 November 2015
Financial Outlook 2015
We expect a CET1 ratio of at least 10.8% – from today’s perspective the BoD plans to propose a 2015 dividend of 20ct per share
We expect Loan Loss Provisions of less than €0.9bn for 2015 with lower LLPs in NCA as well as in the Core Bank
We expect expenses to be slightly above €7.0bn excluding European Bank levy
We will continue on our growth track in the Core Bank and aim to further grow revenues and market share by expanding our customer and asset base

22Stephan Engels | CFO | Frankfurt | 02 November 2015
Appendix

23Stephan Engels | CFO | Frankfurt | 02 November 2015
German economy 2015/2016 – Mounting headwinds for th e Economy
GDP (Change vs previous year in %)
Mounting headwinds from EM
› 40% of German exports go to EM, of which 6%pts to China.
› EM suffer from increased levels of private sector debt, …
› ... high current account deficits, …
› ... imminent US interest rate hike.
› Commodity exporting EM are hit by persistently low commodity prices, particularly oil prices.
Current development
› The recovery of the German economy is going on. Annualized growth rate in Q3 was probably around 1.9%.
› Main driver of the recovery is private consumption helped also by the lower oil price. Exports has slowed down somewhat amid the stabilizing Euro.
› Labor market has improved further.
› Government is re-regulating the economy which will push up labor costs significantly.
Our expectation for 2015/2016
› Recovery will continue as the oil price and the – compared to last year – still weak Euro will push the economy.
› The expansionary monetary policy will continue to mask the dampening impetus from politics. We are looking for a growth rate of 1.8% in 2015.
› Growth should slow down to 1.5% in 2016 amid mounting headwinds from the EM.
› Inflation will be just 0.4% in 2015 and is set to rise to 1.9% in 2016.
DAX (average p.a.)
Euriborin % (average p.a.)
Source: Commerzbank Economic Research
2016e2015e
1.51.8
2014
0.91.6
2013
-0.4
0.1
2012
-0.7
0.4
2011
1.7
3.6
1.5 1.3
EurozoneGermany
2015e
10,800
2014
9,450
2013
8,297
2012
6,843
2011
6,586
2016e
0.00
0.57
2011
1.39
2015e
0.00
2014
0.19
2013
0.22
2012

24Stephan Engels | CFO | Frankfurt | 02 November 2015
Figures per sharein €
Earnings per sharein € 1) 3)
Key figures of Commerzbank share
ytd as of 31 Dec 2013 31 Dec 2014 30 Sep 2015
Number of shares issued (m) 1,138.5 1,138.5 1,252.4
Average number of shares outstanding (m) 913.2 1,138.5 1,195.4
Market capitalisation (€bn) 13.3 12.5 11.8
Net asset value per share (€) 21.31 21.28 21.75
Low/high Xetra intraday prices ytd (in €) 5.56/12.96 9.91/14.48 9.05/13.39
1) Result for the quarter on accumulative basis 2) After reverse stock split 10:1 3) After restatements of hedge accounting and credit protection insurance
Q3
0.17
Q2
0.23
Q1
0.32
Q4
-0.23
Q3
0.20
Q2
0.08
Q1
0.18
Q4
0.07
Q3
0.11
Q2
0.08
Q12)
-0.17
9M 2015
0.71
1.25
FY 2014
0.23
0.60
FY 2013
0.09
0.80
EPS (incl. restructuring expenses)
Operating result
2013 2014 2015

25Stephan Engels | CFO | Frankfurt | 02 November 2015
Commerzbank financials at a glance
1) Attributable to Commerzbank shareholders 2) Includes net profit of 9M 2015 excl. dividend accrual
Group Q3 2014 Q2 2015 Q3 2015 9M 2014 9M 2015
Operating result (€m) 343 385 429 924 1,499
Net result (€m) 225 280 207 1) 525 853 1)
CET 1 ratio B3 phase-in (%) 11.8 12.4 12.5 2) 11.8 12.5 2)
CET 1 ratio B3 fully phased-in (%) 9.6 10.5 10.8 2) 9.6 10.8 2)
Total assets (€bn) 596 561 564 596 564
RWA B3 fully phased-in (€bn) 215 214 213 215 213
Leverage ratio (fully phased-in revised rules) (%) 3.4 4.0 4.1 3.4 4.1
Cost/income ratio (%) 71.6 72.5 75.1 74.5 72.3
RoE of net result (%) 3.4 3.9 2.9 1) 2.7 4.1 1)
Net RoTE (%) 3.8 4.4 3.2 1) 3.0 4.5 1)
Core Bank (incl. O&C) Q3 2014 Q2 2015 Q3 2015 9M 2014 9M 2015
Operating result (€m) 595 641 416 1,535 1,828
Op. RoE (%) 12.0 11.7 7.4 10.8 11.3
Op. RoTE (%) 14.2 13.6 8.5 12.8 13.2
CIR (%) 70.6 68.3 77.3 71.9 71.1
NCA Q3 2014 Q2 2015 Q3 2015 9M 2014 9M 2015
Operating result (€m) -252 -256 13 -611 -329
EaD incl. NPL volume - CRE and Ship Finance (€bn) 36 27 22 36 22

26Stephan Engels | CFO | Frankfurt | 02 November 2015
Hedging & Valuation adjustments
Note: Numbers may not add up due to rounding
€m Q1 14 Q2 14 Q3 14 Q4 14 FY 14 Q1 15 Q2 15 Q3 15
PC OCS, FVA & Net CVA/DVA - - - - - - - -
MSB OCS, FVA & Net CVA/DVA 2 14 -6 -7 3 20 23 -23
CEE OCS, FVA & Net CVA/DVA - -1 - - -2 1 1 2
OCS -5 -27 15 -40 -56 7 39 57
C&M FVA & Net CVA / DVA 17 19 -7 9 37 40 2 -12
OCS, FVA & Net CVA/DVA 12 -8 9 -31 -19 47 41 45
O&C OCS, FVA & Net CVA/DVA -11 -17 14 8 -5 8 22 -136
CoreBank
OCS, FVA & Net CVA/DVA 3 -12 16 -30 -22 75 87 -111
NCA OCS, FVA & Net CVA/DVA 48 - 2 56 105 58 -2 7
Group OCS, FVA & Net CVA/DVA 51 -13 19 26 83 133 85 -104

27Stephan Engels | CFO | Frankfurt | 02 November 2015
Promissory notes
14%
53% Covered Bonds
19%
Subordinated debt 14%
Unsecured Bonds
Capital markets funding activities
Capital market funding structureas at 30 September 2015
Capital market funding activitiesYTD September 2015 – Notional €5.4bn
Funding strategy
about€84bn
Commerzbank uses for funding purposes covered bonds (Pfandbriefe) and senior unsecured instruments.
Funding is done via private placements and public transactions
Issuance programs in the Euromarkets
– EMTN, domestic issuance program and structured notes issuance programs
Since 2011 USD 10bn senior and subordinated Medium-Term Note Program (format 144a/3a2)
The Commerzbank Group raised a total of €5.4bn in long-term funding on capital markets in YTD September 2015.
In H1 2015 a seven year mortgage Pfandbrief with a total notional of €1.000m was issued. In Q3 a five and a seven year mortgage Pfandbriefwith a notional of €500m each followed.
In H1 2015 a three-year unsecured benchmark bond with a total notional of €1.000m was issued. In September a seven year unsecured benchmark bond with a notional of €500m followed.
A further €1.5bn was raised through unsecured private placements.
The total issues had an average term of almost six years.
Funding YTD September 2015 highlights
Benchmark Private placements Benchmark Private placements€1.5bn €1.5bn €2.0bn €0.4bn
Unsecured bonds Secured bonds
€3.0bn €2.4bn

28Stephan Engels | CFO | Frankfurt | 02 November 2015
NPL ratio in Core Bank%
NPL ratio
1.31.61.8Core Bank
0.20.20.2O&C
1.21.62.0C&M
4.04.54.0CEE
1.71.92.2MSB
0.70.81.1PC
NPL ratio 1) & Cost of Risk 2) (CoR)
1) NPL ratio = Default volume / Exposure at Default 2) Cost of Risk = Loan Loss Provisions / Exposure at Default (annualised)
CoR
91420Core Bank
1607O&C
---C&M
344542CEE
112538MSB
5913PC
Cost of Risk in Core Bankbps
FY 2013 9M 2015
1.61.8
FY 2014
1.3
20
9
14
FY 2013 9M 2015FY 2014

29Stephan Engels | CFO | Frankfurt | 02 November 2015
Note: Numbers may not add up due to rounding 1) Utility and infrastructure transactions (mostly UK) – taken over from PRU in mid-2012; without value-impairing securities 2) Deutsche Schiffsbank 3) Claims in the category LaR Loans; 4) Incl. regions
NCA: Diversified portfolio EaD (incl. NPL) per 30 September 2015, in €bn
Commercial Real Estate
Public Finance
(incl. PFI1))
Ship Finance 2)
(incl. CR Warehouse)
1.1
0.0
0.0
1.0
0.0
POR
15.3
0.0
4.7
8.0
2.7
Rest
10.60.10.04.21.6Rest
46.03.88.79.08.0Sum
0.00.00.00.00.0NPL3)
28.81.88.64.54.9Sovereign4)
6.51.90.10.31.5FI
SumESITUSAGER
1.3
0.0
1.2
POR
2.8
0.4
2.4
Rest
12.50.80.47.3Sum
1.30.10.30.6NPL3)
11.20.70.16.7Performing
SumITUSAGER
1.5
0.4
1.1
Rest
9.72.02.33.7Sum
1.80.30.30.7NPL3)
7.91.72.13.0Performing
SumBulkerTankerContainer
Others
EaD RWA
12.5 10.5
EaD RWA
46.0 21.9
EaD RWA
9.7 8.8
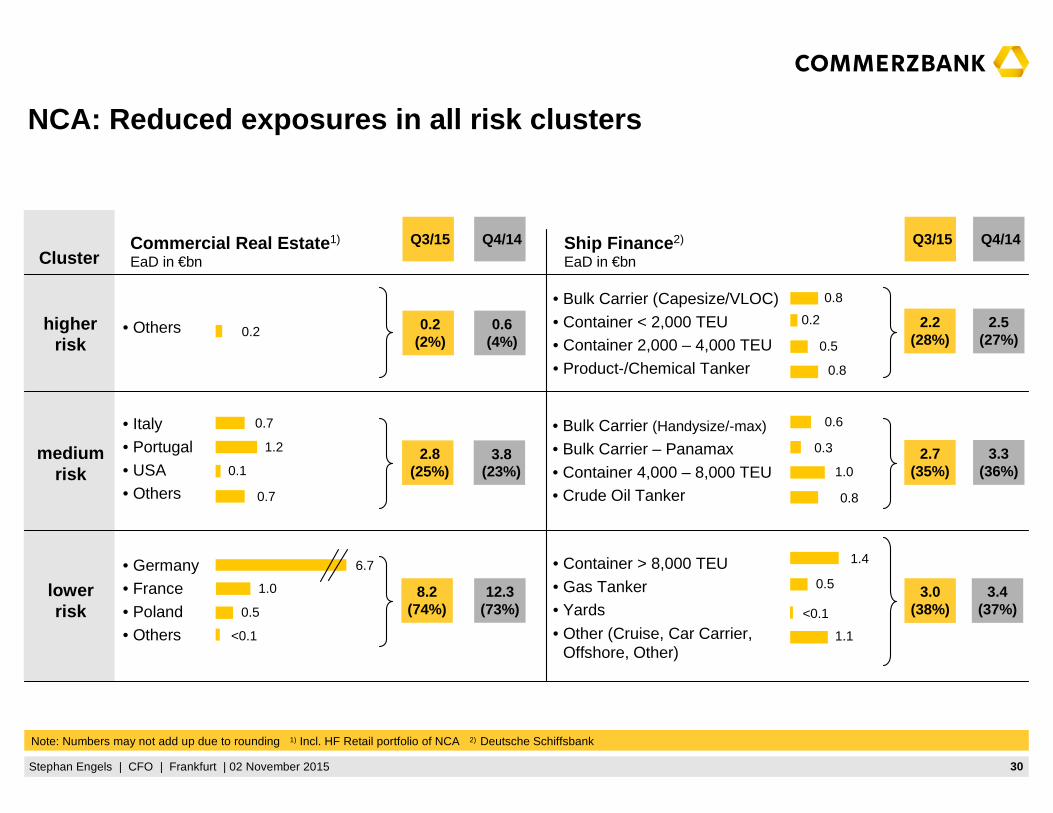
30Stephan Engels | CFO | Frankfurt | 02 November 2015
Cluster
• Bulk Carrier (Handysize/-max)
• Bulk Carrier – Panamax
• Container 4,000 – 8,000 TEU• Crude Oil Tanker
NCA: Reduced exposures in all risk clusters
• Container > 8,000 TEU
• Gas Tanker• Yards
• Other (Cruise, Car Carrier, Offshore, Other)
Ship Finance 2)
EaD in €bn
2.5(27%)
• Bulk Carrier (Capesize/VLOC)
• Container < 2,000 TEU• Container 2,000 – 4,000 TEU
• Product-/Chemical Tanker
• Italy• Portugal
• USA• Others
• Germany• France
• Poland• Others
Commercial Real Estate 1)
EaD in €bn
0.6(4%)
3.8 (23%)
12.3(73%)
• Othershigherrisk
lowerrisk
mediumrisk
Q4/14 Q4/14
Note: Numbers may not add up due to rounding 1) Incl. HF Retail portfolio of NCA 2) Deutsche Schiffsbank
3.3(36%)
3.4(37%)
Q3/15Q3/15
0.8
0.5
0.8
0.2
0.8
1.0
0.3
0.6
<0.1
1.4
0.5
1.1
2.2(28%)
2.7(35%)
3.0(38%)
0.7
0.1
0.2 0.2(2%)
2.8 (25%)
8.2(74%)
1.2
0.7
6.7
0.5
<0.1
1.0

31Stephan Engels | CFO | Frankfurt | 02 November 2015
Default portfolios CRE and Ship Finance 1) as of 30 September 2015
41(53)57(39)31(59)56(53)56Coverage ratio incl. GLLP excl. collaterals (%)
31 Dec 201330 September 2015 (31 Dec 2014)
(24.0)
(106)
(1,549)
(224)
(1,296)
(2,893)
(13.5)
(123)
(218)
(30)
(133)
(311)
(20.0)
(102)
(384)
(46)
(192)
(609)
(31.4)
(105)
(697)
(133)
(777)
(1,534)
27.016.311.919.818.1NPL ratio (%)
99116108104107Coverage ratio incl. GLLP and collaterals (%)
2,252200218353894Collaterals
281361179173GLLP
1,29115575337804Loan loss provisions
3,8713382817391,751 Default volume
TotalBulkerTankerContainerTotalDefault portfolio SF 1) by ship type | €m
1) Deutsche Schiffsbank
35(21)24(28)29(29)28Coverage ratio incl. GLLP excl. collaterals (%)
31 Dec 201330 September 2015 (31 Dec 2014)
(16.7)
(105)
(2,523)
(80)
(900)
(3,335)
(73.6)
(100)
(224)
(0)
(59)
(283)
(15.6)
(105)
(1,373)
(1)
(508)
(1,796)
15.971.28.410.5NPL ratio (%)
10311697116Coverage ratio incl. GLLP and collaterals (%)
3,8472463931,146Collaterals
11941887GLLP
1,88262152284Loan loss provisions
5,6622695831,311Default volume
TotalUSGermanyTotalDefault portfolio CRE by country | €m

32Stephan Engels | CFO | Frankfurt | 02 November 2015
Commerzbank Group
in € mQ1
2014Q2
2014Q3
20149M
2014Q4
2014FY
2014Q1
2015Q2
2015Q3
20159M
2015% yoy % qoq
Total Revenues 2,260 2,241 2,406 6,907 1,847 8,754 2,782 2,418 2,309 7,509 -4.0 -4.5
o/w Total net interest and net trading income 1,538 1,426 1,595 4,559 1,441 6,000 2,017 1,509 1,501 5,027 -5.9 -0.5
o/w Net commission income 815 782 799 2,396 809 3,205 900 839 810 2,549 1.4 -3.5
o/w Other income -93 33 12 -48 -403 -451 -135 70 -2 -67 >-100 >-100
Provision for possible loan losses -238 -257 -341 -836 -308 -1,144 -158 -280 -146 -584 57.2 47.9
Operating expenses 1,698 1,727 1,722 5,147 1,779 6,926 1,939 1,753 1,734 5,426 0.7 -1.1
o/w European bank levy - - - - - - 167 2 -4 165 - >-100
Operating profit 324 257 343 924 -240 684 685 385 429 1,499 25.1 11.4
Impairments on goodw ill - - - - - - - - - - - -
Restructuring expenses - - - - 61 61 66 - 28 94 - >100
Net gain or loss from sale of disposal groups - - - - - - - - - - - -
Pre-tax profit 324 257 343 924 -301 623 619 385 401 1,405 16.9 4.2
Taxes on income 95 132 93 320 -67 253 218 83 165 466 77.4 98.8
Minority Interests 29 25 25 79 27 106 35 22 29 86 16.0 31.8
Consolidated Result attributable to Commerzbank sha reholders 200 100 225 525 -261 264 366 280 207 853 -8.0 -26.1
Average capital employed 27,077 27,285 27,454 27,272 27,372 27,297 27,524 29,372 29,657 28,851 8.0 1.0
RWA credit risk fully phased in (end of period) 173,069 171,018 172,011 172,011 172,457 172,457 176,024 171,399 171,005 171,005 -0.6 -0.2
RWA market risk fully phased in (end of period) 20,117 22,461 20,013 20,013 20,055 20,055 22,471 20,368 20,481 20,481 2.3 0.6
RWA operational risk fully phased in (end of period) 25,073 23,534 22,683 22,683 21,560 21,560 23,053 22,655 21,978 21,978 -3.1 -3.0
RWA fully phased in (end of period) 218,259 217,013 214,707 214,707 214,072 214,072 221,547 214,422 213,465 213,465 -0.6 -0.4
Cost/income ratio (%) 75.1% 77.1% 71.6% 74.5% 96.3% 79.1% 69.7% 72.5% 75.1% 72.3% - -
Operating return on equity (%) 4.8% 3.8% 5.0% 4.5% -3.5% 2.5% 10.0% 5.2% 5.8% 6.9% - -
Operating return on tangible equity (%) 5.4% 4.2% 5.6% 5.1% -3.9% 2.8% 11.2% 5.9% 6.5% 7.8% - -
Return on equity of net result (%) 3.1% 1.5% 3.4% 2.7% -3.9% 1.0% 5.5% 3.9% 2.9% 4.1% - -
Net return on tangible equity (%) 3.4% 1.7% 3.8% 3.0% -4.4% 1.1% 6.2% 4.4% 3.2% 4.5% - -

33Stephan Engels | CFO | Frankfurt | 02 November 2015
Core Bank
in € mQ1
2014Q2
2014Q3
20149M
2014Q4
2014FY
2014Q1
2015Q2
2015Q3
20159M
2015% yoy % qoq
Total Revenues 2,219 2,281 2,330 6,830 1,756 8,586 2,666 2,455 2,154 7,275 -7.6 -12.3
o/w Total net interest and net trading income 1,419 1,501 1,509 4,429 1,357 5,786 1,711 1,502 1,366 4,579 -9.5 -9.1
o/w Net commission income 810 777 789 2,376 803 3,179 895 833 808 2,536 2.4 -3.0
o/w Other income -10 3 32 25 -404 -379 60 120 -20 160 >-100 >-100
Provision for possible loan losses -104 -193 -90 -387 -103 -490 -61 -138 -72 -271 20.0 47.8
Operating expenses 1,617 1,646 1,645 4,908 1,709 6,617 1,834 1,676 1,666 5,176 1.3 -0.6
o/w European bank levy - - - - - - 140 1 -4 137 - >-100
Operating profit 498 442 595 1,535 -56 1,479 771 641 416 1,828 -30.1 -35.1
Impairments on goodw ill - - - - - - - - - - - -
Restructuring expenses - - - - - - 50 - 28 78 - >100
Net gain or loss from sale of disposal groups - - - - - - - - - - - -
Pre-tax profit 498 442 595 1,535 -56 1,479 721 641 388 1,750 -34.8 -39.5
Average capital employed 18,563 18,601 19,767 18,977 19,882 19,203 19,965 21,989 22,607 21,521 14.4 2.8
RWA credit risk fully phased in (end of period) 122,695 126,899 130,811 130,811 133,843 133,843 136,990 135,818 135,413 135,413 3.5 -0.3
RWA market risk fully phased in (end of period) 14,987 15,534 15,560 15,560 15,244 15,244 17,958 16,850 16,468 16,468 5.8 -2.3
RWA operational risk fully phased in (end of period) 23,670 22,268 21,419 21,419 20,297 20,297 21,103 20,589 19,887 19,887 -7.2 -3.4
RWA fully phased in (end of period) 161,352 164,701 167,791 167,791 169,384 169,384 176,051 173,257 171,768 171,768 2.4 -0.9
Cost/income ratio (%) 72.9% 72.2% 70.6% 71.9% 97.3% 77.1% 68.8% 68.3% 77.3% 71.1% - -
Operating return on equity (%) 10.7% 9.5% 12.0% 10.8% -1.1% 7.7% 15.4% 11.7% 7.4% 11.3% - -
Operating return on tangible equity (%) 12.8% 11.3% 14.2% 12.8% -1.3% 9.1% 18.2% 13.6% 8.5% 13.2% - -
34Stephan Engels | CFO | Frankfurt | 02 November 2015
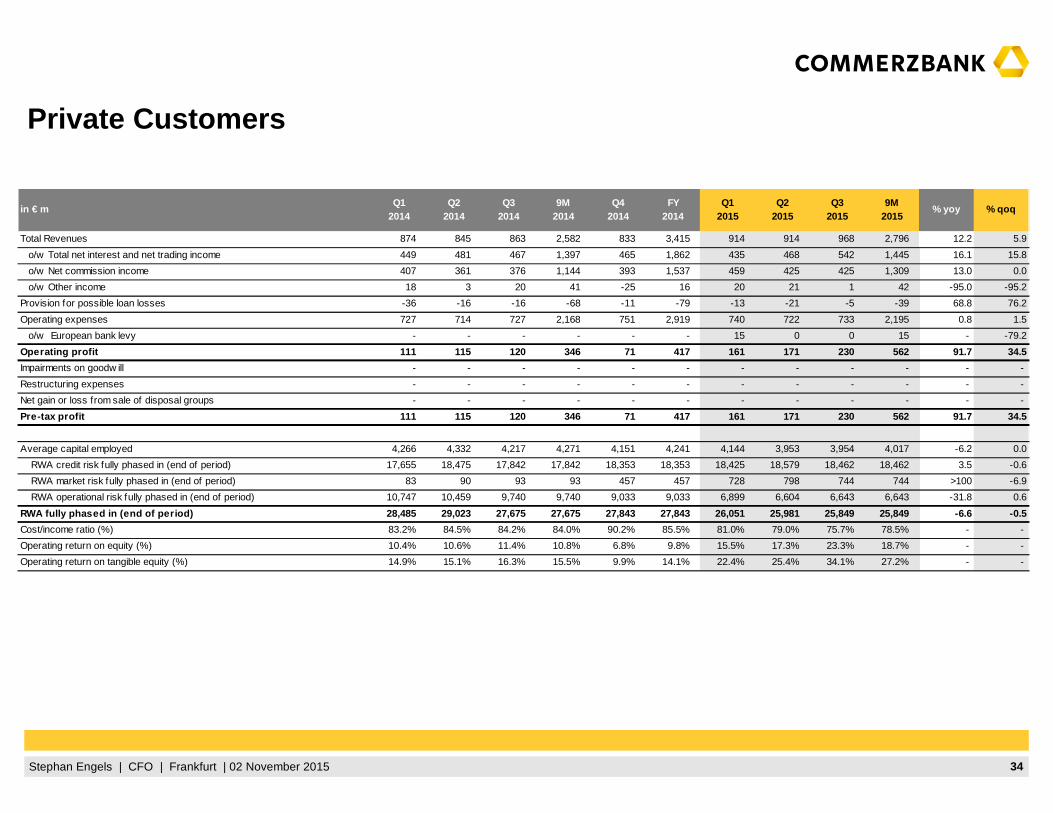
Private Customers
in € mQ1
2014Q2
2014Q3
20149M
2014Q4
2014FY
2014Q1
2015Q2
2015Q3
20159M
2015% yoy % qoq
Total Revenues 874 845 863 2,582 833 3,415 914 914 968 2,796 12.2 5.9
o/w Total net interest and net trading income 449 481 467 1,397 465 1,862 435 468 542 1,445 16.1 15.8
o/w Net commission income 407 361 376 1,144 393 1,537 459 425 425 1,309 13.0 0.0
o/w Other income 18 3 20 41 -25 16 20 21 1 42 -95.0 -95.2
Provision for possible loan losses -36 -16 -16 -68 -11 -79 -13 -21 -5 -39 68.8 76.2
Operating expenses 727 714 727 2,168 751 2,919 740 722 733 2,195 0.8 1.5
o/w European bank levy - - - - - - 15 0 0 15 - -79.2
Operating profit 111 115 120 346 71 417 161 171 230 562 91.7 34.5
Impairments on goodw ill - - - - - - - - - - - -
Restructuring expenses - - - - - - - - - - - -
Net gain or loss from sale of disposal groups - - - - - - - - - - - -
Pre-tax profit 111 115 120 346 71 417 161 171 230 562 91.7 34.5
Average capital employed 4,266 4,332 4,217 4,271 4,151 4,241 4,144 3,953 3,954 4,017 -6.2 0.0
RWA credit risk fully phased in (end of period) 17,655 18,475 17,842 17,842 18,353 18,353 18,425 18,579 18,462 18,462 3.5 -0.6
RWA market risk fully phased in (end of period) 83 90 93 93 457 457 728 798 744 744 >100 -6.9
RWA operational risk fully phased in (end of period) 10,747 10,459 9,740 9,740 9,033 9,033 6,899 6,604 6,643 6,643 -31.8 0.6
RWA fully phased in (end of period) 28,485 29,023 27,675 27,675 27,843 27,843 26,051 25,981 25,849 25,849 -6.6 -0.5
Cost/income ratio (%) 83.2% 84.5% 84.2% 84.0% 90.2% 85.5% 81.0% 79.0% 75.7% 78.5% - -
Operating return on equity (%) 10.4% 10.6% 11.4% 10.8% 6.8% 9.8% 15.5% 17.3% 23.3% 18.7% - -
Operating return on tangible equity (%) 14.9% 15.1% 16.3% 15.5% 9.9% 14.1% 22.4% 25.4% 34.1% 27.2% - -

35Stephan Engels | CFO | Frankfurt | 02 November 2015
Mittelstandsbank
in € mQ1
2014Q2
2014Q3
20149M
2014Q4
2014FY
2014Q1
2015Q2
2015Q3
20159M
2015% yoy % qoq
Total Revenues 719 743 744 2,206 723 2,929 760 705 599 2,064 -19.5 -15.0
o/w Total net interest and net trading income 443 466 448 1,357 440 1,797 470 463 386 1,319 -13.8 -16.6
o/w Net commission income 275 264 266 805 283 1,088 291 262 265 818 -0.4 1.1
o/w Other income 1 13 30 44 - 44 -1 -20 -52 -73 >-100 >-100
Provision for possible loan losses -57 -143 -36 -236 -106 -342 -35 -57 -27 -119 25.0 52.6
Operating expenses 323 331 343 997 365 1,362 383 355 356 1,094 3.8 0.3
o/w European bank levy - - - - - - 44 -0 0 44 - >100
Operating profit 339 269 365 973 252 1,225 342 293 216 851 -40.8 -26.3
Impairments on goodw ill - - - - - - - - - - - -
Restructuring expenses - - - - - - - - - - - -
Net gain or loss from sale of disposal groups - - - - - - - - - - - -
Pre-tax profit 339 269 365 973 252 1,225 342 293 216 851 -40.8 -26.3
Average capital employed 7,335 7,545 7,638 7,506 7,953 7,618 8,191 8,094 8,105 8,130 6.1 0.1
RWA credit risk fully phased in (end of period) 58,085 62,284 63,955 63,955 66,789 66,789 66,600 64,535 65,467 65,467 2.4 1.4
RWA market risk fully phased in (end of period) 874 783 908 908 827 827 1,206 1,169 1,008 1,008 11.0 -13.8
RWA operational risk fully phased in (end of period) 3,917 3,512 3,352 3,352 3,301 3,301 3,845 3,495 3,174 3,174 -5.3 -9.2
RWA fully phased in (end of period) 62,877 66,579 68,215 68,215 70,918 70,918 71,651 69,199 69,650 69,650 2.1 0.7
Cost/income ratio (%) 44.9% 44.5% 46.1% 45.2% 50.5% 46.5% 50.4% 50.4% 59.4% 53.0% - -
Operating return on equity (%) 18.5% 14.3% 19.1% 17.3% 12.7% 16.1% 16.7% 14.5% 10.7% 14.0% - -
Operating return on tangible equity (%) 20.9% 16.0% 21.5% 19.5% 14.1% 18.1% 18.6% 16.1% 11.8% 15.5% - -
36Stephan Engels | CFO | Frankfurt | 02 November 2015
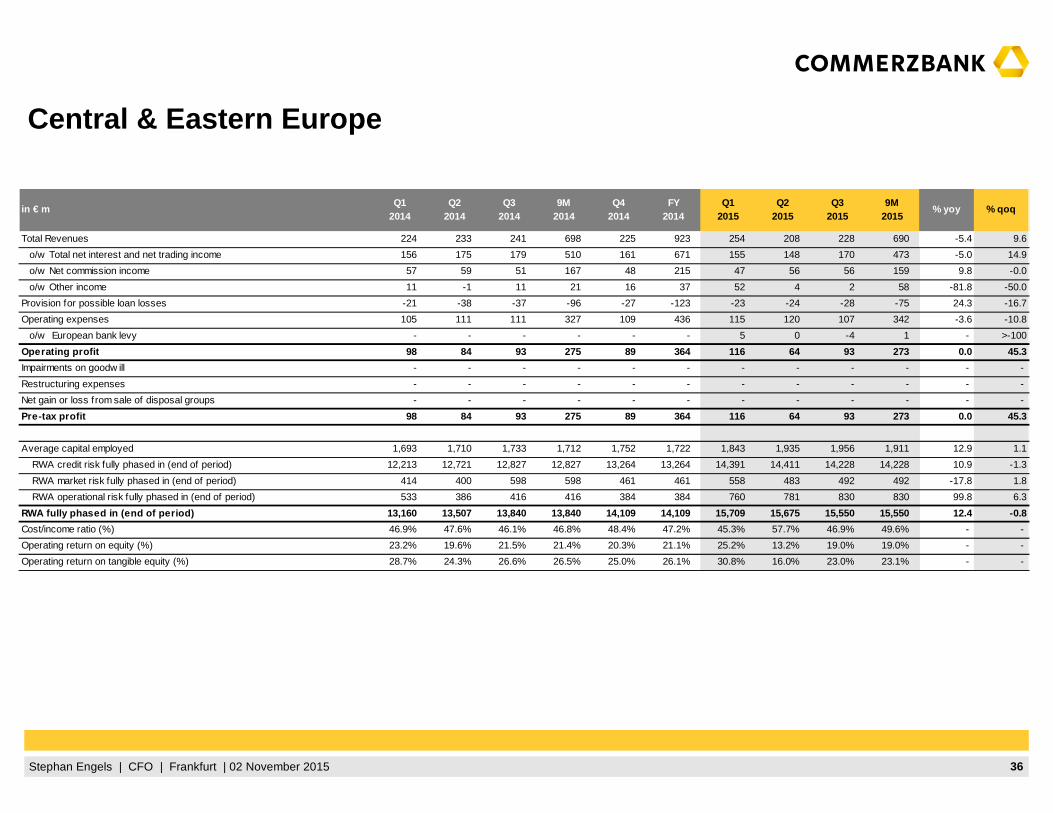
Central & Eastern Europe
in € mQ1
2014Q2
2014Q3
20149M
2014Q4
2014FY
2014Q1
2015Q2
2015Q3
20159M
2015% yoy % qoq
Total Revenues 224 233 241 698 225 923 254 208 228 690 -5.4 9.6
o/w Total net interest and net trading income 156 175 179 510 161 671 155 148 170 473 -5.0 14.9
o/w Net commission income 57 59 51 167 48 215 47 56 56 159 9.8 -0.0
o/w Other income 11 -1 11 21 16 37 52 4 2 58 -81.8 -50.0
Provision for possible loan losses -21 -38 -37 -96 -27 -123 -23 -24 -28 -75 24.3 -16.7
Operating expenses 105 111 111 327 109 436 115 120 107 342 -3.6 -10.8
o/w European bank levy - - - - - - 5 0 -4 1 - >-100
Operating profit 98 84 93 275 89 364 116 64 93 273 0.0 45.3
Impairments on goodw ill - - - - - - - - - - - -
Restructuring expenses - - - - - - - - - - - -
Net gain or loss from sale of disposal groups - - - - - - - - - - - -
Pre-tax profit 98 84 93 275 89 364 116 64 93 273 0.0 45.3
Average capital employed 1,693 1,710 1,733 1,712 1,752 1,722 1,843 1,935 1,956 1,911 12.9 1.1
RWA credit risk fully phased in (end of period) 12,213 12,721 12,827 12,827 13,264 13,264 14,391 14,411 14,228 14,228 10.9 -1.3
RWA market risk fully phased in (end of period) 414 400 598 598 461 461 558 483 492 492 -17.8 1.8
RWA operational risk fully phased in (end of period) 533 386 416 416 384 384 760 781 830 830 99.8 6.3
RWA fully phased in (end of period) 13,160 13,507 13,840 13,840 14,109 14,109 15,709 15,675 15,550 15,550 12.4 -0.8
Cost/income ratio (%) 46.9% 47.6% 46.1% 46.8% 48.4% 47.2% 45.3% 57.7% 46.9% 49.6% - -
Operating return on equity (%) 23.2% 19.6% 21.5% 21.4% 20.3% 21.1% 25.2% 13.2% 19.0% 19.0% - -
Operating return on tangible equity (%) 28.7% 24.3% 26.6% 26.5% 25.0% 26.1% 30.8% 16.0% 23.0% 23.1% - -

37Stephan Engels | CFO | Frankfurt | 02 November 2015
Corporates & Markets
in € mQ1
2014Q2
2014Q3
20149M
2014Q4
2014FY
2014Q1
2015Q2
2015Q3
20159M
2015% yoy % qoq
Total Revenues 541 504 484 1,529 443 1,972 667 531 416 1,614 -14.0 -21.7
o/w Total net interest and net trading income 464 403 368 1,235 326 1,561 571 407 346 1,324 -6.0 -15.0
o/w Net commission income 76 101 102 279 89 368 104 99 67 270 -34.3 -32.3
o/w Other income 1 - 14 15 28 43 -8 25 3 20 -78.6 -88.0
Provision for possible loan losses 9 5 - 14 41 55 47 -11 -11 25 >-100 0.0
Operating expenses 336 324 327 987 364 1,351 412 336 328 1,076 0.3 -2.4
o/w European bank levy - - - - - - 65 2 0 67 - -98.6
Operating profit 214 185 157 556 120 676 302 184 77 563 -51.0 -58.2
Impairments on goodw ill - - - - - - - - - - - -
Restructuring expenses - - - - - - 50 - 7 57 - >100
Net gain or loss from sale of disposal groups - - - - - - - - - - - -
Pre-tax profit 214 185 157 556 120 676 252 184 70 506 -55.4 -62.0
Average capital employed 4,552 4,669 4,595 4,605 4,427 4,561 4,624 4,818 4,607 4,683 0.3 -4.4
RWA credit risk fully phased in (end of period) 19,457 22,089 19,747 19,747 20,012 20,012 21,524 21,021 21,157 21,157 7.1 0.6
RWA market risk fully phased in (end of period) 10,372 11,275 11,732 11,732 10,897 10,897 11,920 11,585 10,997 10,997 -6.3 -5.1
RWA operational risk fully phased in (end of period) 5,922 5,088 5,011 5,011 4,684 4,684 5,717 5,602 5,201 5,201 3.8 -7.2
RWA fully phased in (end of period) 35,752 38,453 36,490 36,490 35,593 35,593 39,161 38,208 37,355 37,355 2.4 -2.2
Cost/income ratio (%) 62.1% 64.3% 67.6% 64.6% 82.2% 68.5% 61.8% 63.3% 78.8% 66.7% - -
Operating return on equity (%) 18.8% 15.8% 13.7% 16.1% 10.8% 14.8% 26.1% 15.3% 6.7% 16.0% - -
Operating return on tangible equity (%) 19.4% 16.4% 14.1% 16.6% 11.2% 15.3% 27.0% 15.8% 6.9% 16.6% - -

38Stephan Engels | CFO | Frankfurt | 02 November 2015
Non-Core Assets
in € mQ1
2014Q2
2014Q3
20149M
2014Q4
2014FY
2014Q1
2015Q2
2015Q3
20159M
2015% yoy % qoq
Total Revenues 41 -40 76 77 91 168 116 -37 155 234 >100 >100
o/w Total net interest and net trading income 119 -75 86 130 84 214 306 7 135 448 57.0 >100
o/w Net commission income 5 5 10 20 6 26 5 6 2 13 -80.0 -66.7
o/w Other income -83 30 -20 -73 1 -72 -195 -50 18 -227 >100 >100
Provision for possible loan losses -134 -64 -251 -449 -205 -654 -97 -142 -74 -313 70.5 47.9
Operating expenses 81 81 77 239 70 309 105 77 68 250 -11.7 -11.7
o/w European bank levy - - - - - - 27 0 0 28 - -1.4
Operating profit -174 -185 -252 -611 -184 -795 -86 -256 13 -329 >100 >100
Impairments on goodw ill - - - - - - - - - - - -
Restructuring expenses - - - - 61 61 16 - - 16 - -
Net gain or loss from sale of disposal groups - - - - - - - - - - - -
Pre-tax profit -174 -185 -252 -611 -245 -856 -102 -256 13 -345 >100 >100
Average capital employed 8,514 8,684 7,687 8,295 7,490 8,094 7,559 7,383 7,050 7,330 -8.3 -4.5
RWA credit risk fully phased in (end of period) 50,374 44,119 41,199 41,199 38,614 38,614 39,034 35,580 35,592 35,592 -13.6 0.0
RWA market risk fully phased in (end of period) 5,130 6,926 4,453 4,453 4,812 4,812 4,512 3,518 4,014 4,014 -9.9 14.1
RWA operational risk fully phased in (end of period) 1,403 1,267 1,264 1,264 1,263 1,263 1,950 2,066 2,091 2,091 65.5 1.2
RWA fully phased in (end of period) 56,907 52,312 46,916 46,916 44,688 44,688 45,497 41,164 41,696 41,696 -11.1 1.3
Operating return on equity (%) -8.2% -8.5% -13.1% -9.8% -9.8% -9.8% -4.6% -13.9% 0.7% -6.0% - -
Operating return on tangible equity (%) -8.2% -8.5% -13.1% -9.8% -9.8% -9.8% -4.6% -13.9% 0.7% -6.0% - -
39Stephan Engels | CFO | Frankfurt | 02 November 2015
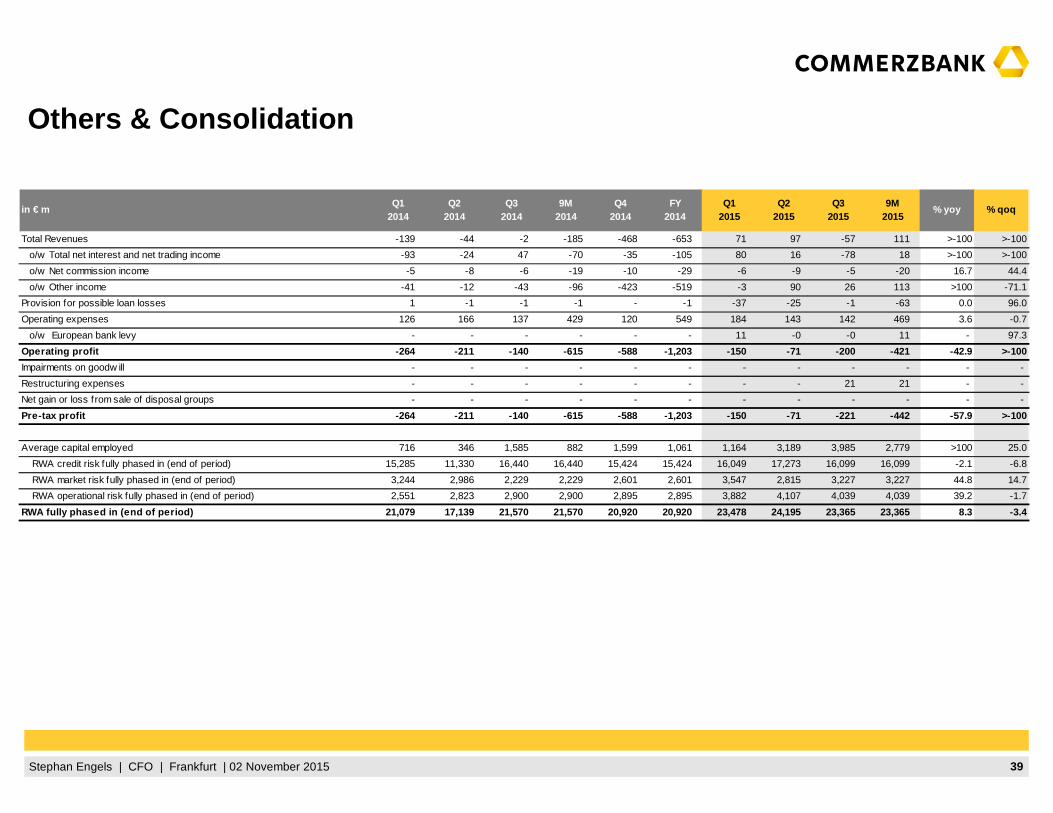
Others & Consolidation
in € mQ1
2014Q2
2014Q3
20149M
2014Q4
2014FY
2014Q1
2015Q2
2015Q3
20159M
2015% yoy % qoq
Total Revenues -139 -44 -2 -185 -468 -653 71 97 -57 111 >-100 >-100
o/w Total net interest and net trading income -93 -24 47 -70 -35 -105 80 16 -78 18 >-100 >-100
o/w Net commission income -5 -8 -6 -19 -10 -29 -6 -9 -5 -20 16.7 44.4
o/w Other income -41 -12 -43 -96 -423 -519 -3 90 26 113 >100 -71.1
Provision for possible loan losses 1 -1 -1 -1 - -1 -37 -25 -1 -63 0.0 96.0
Operating expenses 126 166 137 429 120 549 184 143 142 469 3.6 -0.7
o/w European bank levy - - - - - - 11 -0 -0 11 - 97.3
Operating profit -264 -211 -140 -615 -588 -1,203 -150 -71 -200 -421 -42.9 >-100
Impairments on goodw ill - - - - - - - - - - - -
Restructuring expenses - - - - - - - - 21 21 - -
Net gain or loss from sale of disposal groups - - - - - - - - - - - -
Pre-tax profit -264 -211 -140 -615 -588 -1,203 -150 -71 -221 -442 -57.9 >-100
Average capital employed 716 346 1,585 882 1,599 1,061 1,164 3,189 3,985 2,779 >100 25.0
RWA credit risk fully phased in (end of period) 15,285 11,330 16,440 16,440 15,424 15,424 16,049 17,273 16,099 16,099 -2.1 -6.8
RWA market risk fully phased in (end of period) 3,244 2,986 2,229 2,229 2,601 2,601 3,547 2,815 3,227 3,227 44.8 14.7
RWA operational risk fully phased in (end of period) 2,551 2,823 2,900 2,900 2,895 2,895 3,882 4,107 4,039 4,039 39.2 -1.7
RWA fully phased in (end of period) 21,079 17,139 21,570 21,570 20,920 20,920 23,478 24,195 23,365 23,365 8.3 -3.4

40Stephan Engels | CFO | Frankfurt | 02 November 2015
Group equity composition
Note: Numbers may not add up due to rounding 1) Include mainly AT1 positions and phase-in impacts 2) Excluding consolidated P&L 3) Includes net profit of 9M 2015 4) Excl dividend accrual
Capital Capital Capital Ratios Ratios RatiosQ2 2015 Q3 2015 Q3 2015 Q3 2015 9M 2015 Sep 2015
End of period End of period Average€bn €bn €bn % % %
Common equity tier 1 B3 capital (phase in) 26.6 26.8 4)� CET1 ratio phase-in: 12.5%
Transition adjustments 4.1 3.7 1)
Common equity tier 1 B3 capital (fully phased-in) 22 .6 23.1 23.0 4)� Op. RoCET: 7.5% 9.1% CET1 ratio fully phased-in: 10.8%
DTA 1.1 0.8
Deductions on securitizations 0.3 0.3
Deductions related to non-controlling interests 0.4 0.4
IRB shortfall 1.3 1.0
Other regulatory adjustments 0.9 1.1
Tangible equity 26.6 26.7 26.5 4)� Op. RoTE: 6.5% 7.8%
Goodwill and other intangible assets 3.1 3.2 3.1 Pre-tax RoE: 5.4% 6.5%
IFRS capital 29.7 29.9 29.7 4)� Op. RoE: 5.8% 6.9%
Subscribed capital 1.3 1.3
Capital reserve 17.2 17.2
Retained earnings 10.5 10.4 2),4)
Currency translation reserve 0.0 -0.0
Revaluation reserve -0.7 -0.6
Cash flow hedges -0.2 -0.2
Consolidated P&L 0.6 0.9 3)
IFRS capital without non-controlling interests 28.7 28.9 28.7 4)� RoE on net result: 2.9% 4.1%
Non-controlling interests (IFRS) 0.9 1.0 1.0 RoTE on net result: 3.2% 4.5%
41Stephan Engels | CFO | Frankfurt | 02 November 2015
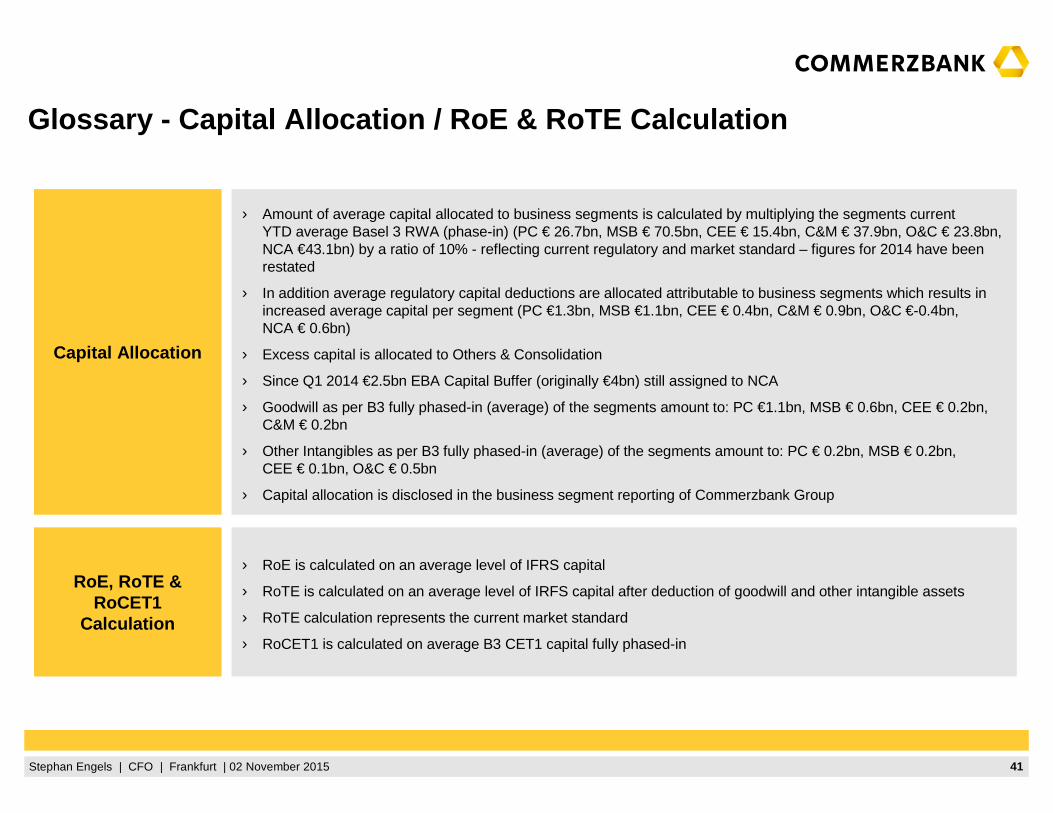
Glossary - Capital Allocation / RoE & RoTE Calculation
Capital Allocation
› Amount of average capital allocated to business segments is calculated by multiplying the segments currentYTD average Basel 3 RWA (phase-in) (PC € 26.7bn, MSB € 70.5bn, CEE € 15.4bn, C&M € 37.9bn, O&C € 23.8bn, NCA €43.1bn) by a ratio of 10% - reflecting current regulatory and market standard – figures for 2014 have been restated
› In addition average regulatory capital deductions are allocated attributable to business segments which results in increased average capital per segment (PC €1.3bn, MSB €1.1bn, CEE € 0.4bn, C&M € 0.9bn, O&C €-0.4bn,NCA € 0.6bn)
› Excess capital is allocated to Others & Consolidation
› Since Q1 2014 €2.5bn EBA Capital Buffer (originally €4bn) still assigned to NCA
› Goodwill as per B3 fully phased-in (average) of the segments amount to: PC €1.1bn, MSB € 0.6bn, CEE € 0.2bn, C&M € 0.2bn
› Other Intangibles as per B3 fully phased-in (average) of the segments amount to: PC € 0.2bn, MSB € 0.2bn,CEE € 0.1bn, O&C € 0.5bn
› Capital allocation is disclosed in the business segment reporting of Commerzbank Group
RoE, RoTE & RoCET1
Calculation
› RoE is calculated on an average level of IFRS capital
› RoTE is calculated on an average level of IRFS capital after deduction of goodwill and other intangible assets
› RoTE calculation represents the current market standard
› RoCET1 is calculated on average B3 CET1 capital fully phased-in

42Stephan Engels | CFO | Frankfurt | 02 November 2015
Disclaimer
Investor Relations
This presentation contains forward-looking statements. Forward-looking statements are statements that are not historical facts; they include, inter alia, statements about Commerzbank’s beliefs and expectations and the assumptions underlying them. These statements are based on plans, estimates, projections and targets as they are currently available to the management of Commerzbank. Forward-looking statements therefore speak only as of the date they are made, and Commerzbank undertakes no obligation to update any of them in light of new information or future events. By their very nature, forward-looking statements involve risks and uncertainties. A number of important factors could therefore cause actual results to differ materially from those contained in any forward-looking statement. Such factors include, among others, the conditions in the financial markets in Germany, in Europe, in the United States and elsewhere from which Commerzbank derives a substantial portion of its revenues and in which it hold a substantial portion of its assets, the development of assetprices and market volatility, potential defaults of borrowers or trading counterparties, the implementation of its strategic initiatives and the reliability of its risk management policies.
In addition, this presentation contains financial and other information which has been derived from publicly available information disclosed by persons other than Commerzbank (“external data”). In particular, external data has been derived from industry and customer-related data and other calculations taken or derived from industry reports published by third parties, market research reports and commercial publications. Commercial publications generally state that the information they contain has originated from sources assumed to be reliable, but that the accuracy and completeness of such information is not guaranteed and that the calculations contained therein are based on a series of assumptions. The external data has not been independently verified by Commerzbank. Therefore, Commerzbank cannot assume any responsibility for the accuracy of the external data taken or derived from public sources.
Copies of this document are available upon request or can be downloaded from https://www.commerzbank.de/en/hauptnavigation/aktionaere/investor_relations.html
43

43Stephan Engels | CFO | Frankfurt | 02 November 2015
For more information, please contact Commerzbank’s I R team:
Institutional Investors and Financial Analysts
Michael H. KleinP: +49 69 136 24522M: [email protected]
Maximilian BickerP: +49 69 136 28696M: [email protected]
Tanja Birkholz (Head of Investor Relations / Executiv e Management Board Member)P: +49 69 136 23854M: [email protected]
Retail Investors
Florian Neumann P: +49 69 136 41367M: [email protected]
Simone NuxollP: +49 69 136 45660M: [email protected]
Dirk Bartsch (Head of Strategic IR / Rating Agency R elations)P: +49 69 136 22799 M: [email protected]
Christoph Wortig (Head of IR Communications)P: +49 69 136 52668M: [email protected]