Embed Size (px)
Citation preview
61
Overreaction and Underreaction in the Commodity Futures Market
Chuan-Hao Hsua, Yi-Chein Chiang
b, Tung Liang Liao
c
a. Ph.D. Program in Business, Feng Chia University, Taichung, Taiwan
b. Department of International Trade, Feng Chia University, Taichung, Taiwan
c. Department of Finance, Feng Chia University, Taichung, Taiwan
_________________________________________________________
Abstract: Using an event-study methodology, this study examines the overreaction and
underreaction in the commodity futures markets, including softs, grains, livestocks,
metals and energies. An underreaction phenomenon in agricultural commodities (softs,
grains and livestocks) and an overreaction phenomenon in non-agricultural commodities
(metals and energies) are found. Even after controlling for potentially confounding
factors, the cross-sectional analysis confirms that the non-agricultural commodities,
especially for the winners, experience stronger degrees of overreaction than the
agricultural commodities.
JEL Code: G13; G14
Key Words: Overreaction, Underreaction, Geopolitical Risk
_________________________________________________________
Volume 5, No. 3/4, Fall/Winter 2013 Page 61~83 2013
Overreaction and Underreaction in the Commodity Futures Market
62
1. Introduction
The possibility of market irrationality has generated significant discussion among
financial economics journals over last three decades. One particular area of interest is the
adjustment process of asset prices in reaction to the release of information. Some
scholars have asserted that most investors tend to overreact to bad news and underreact to
good news. The overreaction and underreaction hypotheses of asset prices have been
investigated in several studies. DeBondt and Thaler (1985) are the first to document the
evidence of stock price overreaction. They divide the sample stocks into ten portfolios
based on three years of performance and document that the lowest portfolio dominates
the highest portfolio by 24.6% during the subsequent 3-year period. DeBondt and Thaler
(1987) reinvestigate investor overreaction while controlling for firm size and differences
in systematic risk. The results still support the overreaction hypothesis.
Some previous studies (Howe, 1986; Brown et al., 1988; Atkins and Dyl, 1990;
Bremer and Sweeney, 1991; Cox and Peterson, 1994; Peterson, 1995; Akhigbe et al.,
1998) have also explored post-event abnormal returns pursuant to extreme, one-day stock
price changes (daily return) for U.S. stock markets. Some of their findings support the
overreaction or underreaction hypothesis and the remaining results support efficient
markets hypothesis. Thus, the findings of these studies are obviously inconclusive. In
addition, Brown et al. (1988) and Ajayi and Mehdian (1994) examine overreaction and
underreaction relating to stock market indices for U.S. and non-U.S. markets. Their
findings show that the impact of macroeconomic events is not immediately reflected in
stock prices.
Some studies extend the above research for other financial markets. For example,
Ma et al. (1990) have found that the futures prices of agricultural commodities tend to
overreact to significant events. In addition, Allen et al. (1994) have documented that spot
prices of agricultural commodities tend to reverse after significant events, which evidence
also supports the overreaction hypothesis. Recently, Larson and Madura (2001) have
found that an overreaction phenomenon for currencies in emerging markets and an
underreaction phenomenon for currencies in industrial markets.
The previous studies of market rationality focus, as noted above, mainly on stock
markets, with little attention given to commodity futures markets in literature. According
IRABF 2013 Volume 5, Number 3/4
63
to the annual volume survey of Futures Industry Association (FIA), the growth rate of the
trading volumes for agriculture, energy and non-precious metals futures and options were
27.5%, 11.2% and 27.4% in 2012, respectively.20
Bodie and Rosansky (1980), Gorton
and Rouwenhorst (2006), Erb and Harvey (2006), Miffre and Rallis (2007) and Fuertes et
al. (2010) have also found that the portfolios of commodity futures have had average
returns similar to the S&P 500 Index. These report and research indicate that it is
important for investors and academicians to realize the price behaviors of various
commodity futures. Therefore, the first marginal contribution of this study is to
investigate whether extreme one-day commodity futures price adjustments fully reflect
new information or to check whether they exist in systematical bias. Twenty-eight futures
contracts, including 8 metal futures, 6 soft futures, 7 grain futures, 4 livestock futures and
3 energy futures, are examined in this study.21
This study develops six hypotheses to examine the price behaviors of various
commodity futures around the period of significant events. The three traditional
hypotheses, including the efficient markets hypothesis (Hypothesis 1), the overreaction
hypothesis (Hypothesis 2) and the underreaction hypothesis (Hypothesis 3), are first
examined by estimating commodity futures price changes following extreme one-day
changes in prices.22
Larson and Madura (2001) have documented that the political events have a higher
degree of overreaction than economic events in the foreign exchange markets, as the
political events should be more difficult for market participants to assess than economic
events. Belgrave (1985), an early study, discusses how geopolitical forces affect energy
supplies between states. Recently, Billon (2001), Varisco (2009) and Wolfe and Tessman
(2012) or some websites also examine or report how the geopolitical risks influence
energy and metal prices.23
It is reasonably conjectured that the non-agricultural
20. Please refer to the report of Acworth (2012) “Volume climbs 11.4% to 25 billion contracts worldwide”, p. 24-33,
www.futuresindustry.com. 21. As noted above, Ma et al. (1990) only examines the price behavior around the period of significant events for some
agricultural commodities futures. However, this study includes all kinds of commodity futures, which are taken from
DataStream. 22. In some papers, “price changes” means “return”, so two terms are interchangeably used in this study. 23. For example, a conflict exists between Iran and the West about nuclear program during the second season of 2012,
so one of the headlines in New York Times in 11 May, 2012 is “Geopolitical Risks Keep Oil Expense, but Plentiful”.
Carr (2012) also asserts that “A much-noted characteristic of energy markets last year was that prices were
influenced more by geopolitics and macroeconomics than pure supply and demand fundamentals.” in Energy Risk (7
Feb, 2012). These reports obviously explain why geopolitical risks influence the energy prices. In addition, the
Overreaction and Underreaction in the Commodity Futures Market
64
commodities (including metals and energies) are more easily affected by the geopolitical
risks than other commodities, that is, the price behavior of non-agricultural commodities
is high fluctuation around the period of the geopolitical events.24
Therefore, the second
marginal contribution of this study is that a new hypothesis, geopolitical risks
(Hypothesis 4), is examined to check whether the degree of overreaction is stronger when
the commodities are related to non-agricultural commodities.
Regression analysis is used to test whether the degree of overreaction of non-
agricultural commodities is stronger than agricultural commodities and to examine
whether larger initial futures price changes is associated with stronger degrees of
overreaction (Hypothesis 5). Post-event futures price changes are also regressed against
the pre-event period cumulative price changes to find possible support for the information
leakage hypothesis (Hypothesis 6).
The results of this study suggest that the losers (winners) of the agricultural
commodities (softs, grains and livestocks) subsequently earn negative (positive) mean-
adjusted returns to support the underreaction hypothesis. On the other hand, the evidence
suggests that the winners of the non-agricultural commodities (metals and energies)
subsequently earn negative mean-adjusted returns to support the overreaction hypothesis.
Next, the cross-sectional analysis shows that non-agricultural commodities are associated
with stronger degrees of overreaction than the agricultural commodities. Finally, the
results show that the magnitude of overreaction varies according to the degree of the
initial commodity change and information leakage.
The remainder of this paper is organized as follows. Section 2 explains the research
hypotheses, Section 3 introduces the data and event definition, Section 4 describes the
methodology and Section 5 presents the empirical results. Finally, Section 6 provides the
conclusion that we draw from the study.
relationship between geopolitical risks and metal production is often reported in some websites, such as Bloomberg
(http://www.bloomberg.com) or BabyBullTwits (www.theaureport.com). 24
. For example, the mean and standard deviation of daily returns for crude oil futures during the 1983/3-
2012/12 are 0.06% and 2.31%, respectively, however, those during the Gulf War (1991/1/17-2/28) are -
0.87% and 7.48%, respectively, and those during the Iraq War (2003/3/21-5/1) are 0.02%% and 3.40%,
respectively. So the prices are obviously high fluctuation during the geopolitical events.
IRABF 2013 Volume 5, Number 3/4
65
2. Research Hypotheses
As mentioned above, six hypotheses are examined in this study. Their assertions or
discussion are respectively stated as follows.25
Three traditional hypotheses are first applied to extreme, one-day futures price
changes (return): the efficient markets, overreaction and underreaction hypotheses. The
efficient markets hypothesis (Hypothesis 1) asserts that investors can appropriately
estimate the futures price when new information is released. The efficient markets
hypothesis is rejected if empirical findings support either the overreaction hypothesis
(Hypothesis 2) or the underreaction hypothesis (Hypothesis 3). The overreaction
hypothesis asserts the responses of investors are too strong to new information and
subsequently revise their estimates of futures price. The underreaction hypothesis asserts
investors do not respond strongly enough to new information and subsequently revise
their futures price. These three hypotheses are examined by assessing futures price
change following extreme one-day changes in futures prices. Three hypotheses are
respectively stated as follows.
Efficient Markets Hypothesis (Hypothesis 1): Extreme one-day (event day) changes in
futures price are not followed by significant futures price changes.
Overreaction Hypothesis (Hypothesis 2): Extreme one-day (event day) changes in
futures price are followed by significant futures price changes in the opposite direction.
Underreaction Hypothesis (Hypothesis 3): Extreme one-day (event day) changes in
futures price are followed by significant futures changes in the same direction.
As noted above, Larson and Madura (2001) have documented that the political
events have a higher degree of overreaction than economic events in the foreign exchange
markets as the political events should be more difficult for investors to assess than
economic events. As noted above, it is reasonably conjecture that the non-agricultural
commodities (energies and metals) are more easily affected by the geopolitical risks than
agricultural commodities. The geopolitical risks hypothesis is stated below.
Geopolitical Risks Hypothesis (Hypothesis 4): The degree of overreaction is stronger for
non-agricultural commodity futures.
25. Six hypotheses are examined by some previous studies, such as Akhigbe et al. (1998), Atkins and Dyl, (1990),
Larson and Madura (2001) and so on, for different markets except Hypothesis 4.
Overreaction and Underreaction in the Commodity Futures Market
66
Some studies, such as Brown and Harlow (1988), Bremer and Sweeney (1991) and
Akhigbe et al. (1998), assert that larger initial stock price changes are associated with
higher degrees of uncertainty, and their results show that the tendency for a reversal is
stronger when the initial stock price changes is more extreme.26
Larson and Madura
(2001) find the same phenomenon in the exchange rate markets as well. The similar
phenomenon may exist in commodity futures markets, so the following hypothesis is also
developed in this study.
Initial Futures Price Changes Hypothesis (Hypothesis 5): Larger initial futures price
changes (futures price changes on event day) are expected to be associated with stronger
degrees of overreaction.
Daniel et al. (1998) also assert that investors overweigh private signals causing stock
price overreaction. In addition, Larson and Madura (2001) find that larger degrees of
leakage are associated with larger degrees of overreaction for losers in the exchange rate
markets. Based on the findings of these studies, the following hypothesis is developed for
commodity futures markets.
Private Information Leakage Hypothesis (Hypothesis 6): Higher degrees of information
leakage, as evidenced by pre-event futures price changes that are in the same direction as
the extreme futures price changes, are expected to be associated with larger degrees of
overreaction.
3. Data and Event Definition
The daily settlement prices on 28 commodity futures for different maturity contracts
are obtained from Datastream over the period January 1979 to December 2012. Our
sample consists of 8 metal futures (aluminum, copper high grade, gold 100oz, lead, nickel,
silver 5000oz, tin and zinc), 6 soft futures (cocoa, coffee C, cotton #2, lumber, orange
juice FCOJ-A and sugar #11), 7 grain futures (corn, oats, rough rice, soybeans, soybean
oil, soybean meal and wheat), 4 livestock futures (feeder cattle, lean hogs, live cattle and
frozen pork bellies) and 3 energy futures (light sweet crude oil, New York heating oil and
natural gas). Details of the each futures contract used in this paper can be found in
Appendix.
26. “initial stock price changes” means stock price changes on event day.
IRABF 2013 Volume 5, Number 3/4
67
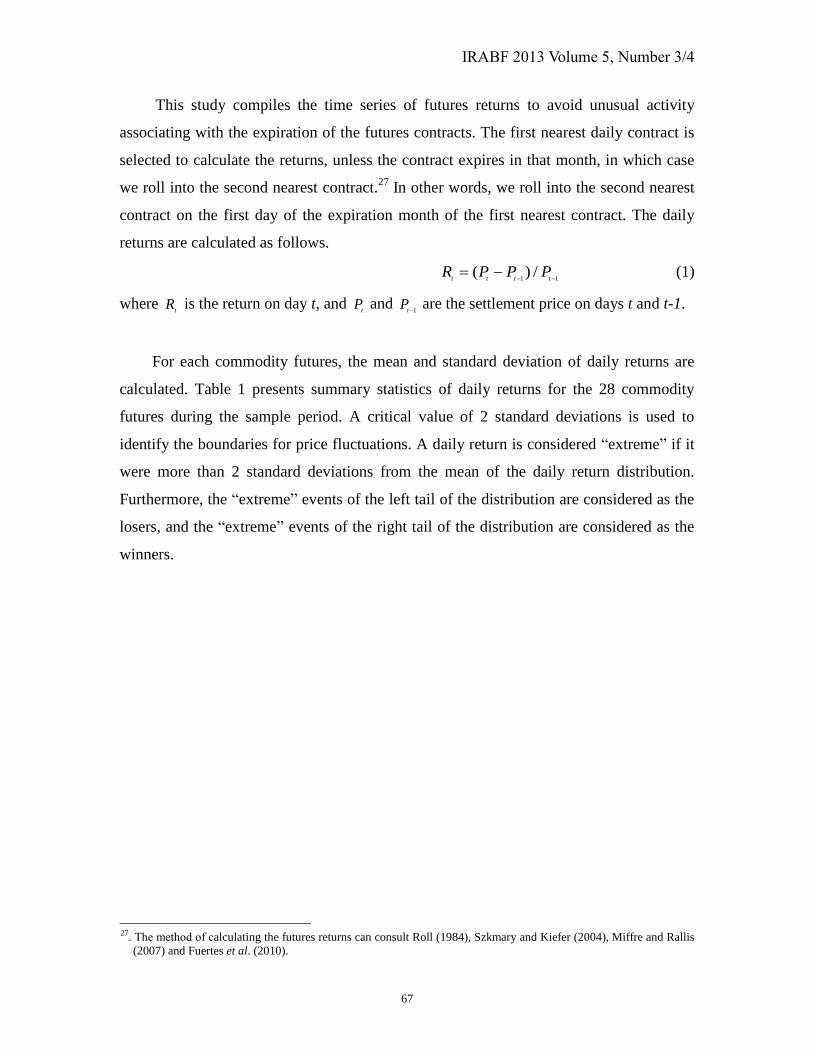
This study compiles the time series of futures returns to avoid unusual activity
associating with the expiration of the futures contracts. The first nearest daily contract is
selected to calculate the returns, unless the contract expires in that month, in which case
we roll into the second nearest contract.27
In other words, we roll into the second nearest
contract on the first day of the expiration month of the first nearest contract. The daily
returns are calculated as follows.
11/)(
ttttPPPR (1)
where t
R is the return on day t, and t
P and 1t
P are the settlement price on days t and t-1.
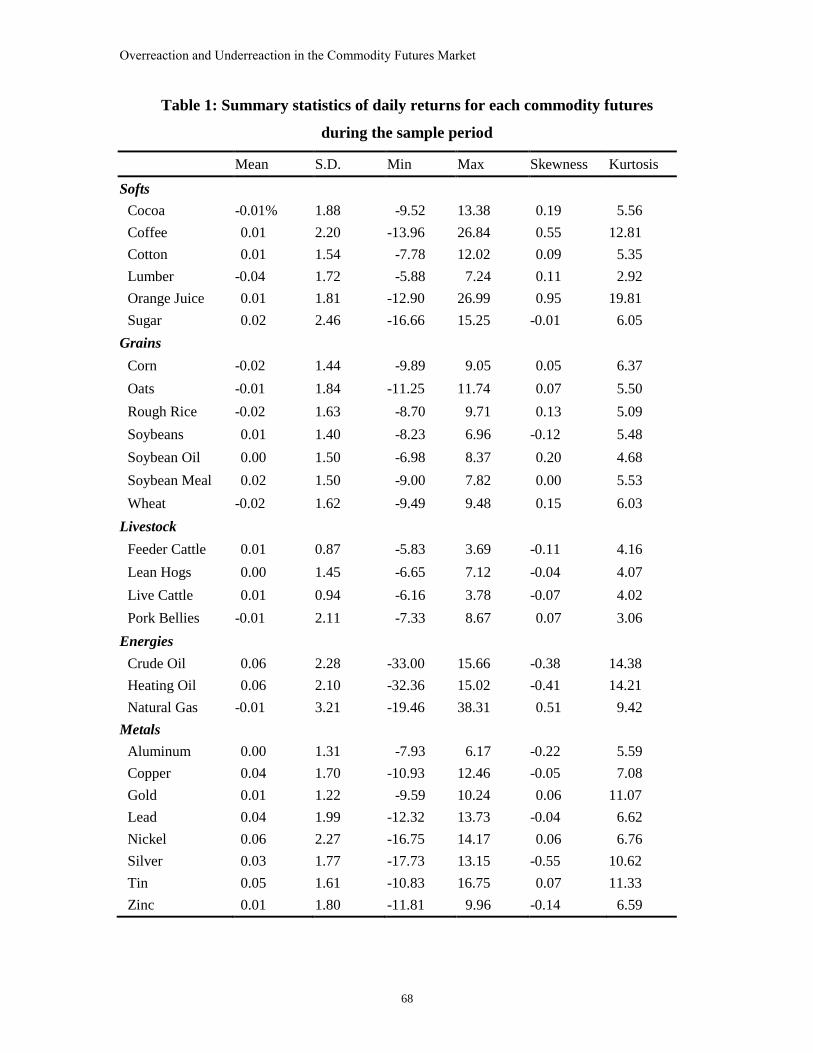
For each commodity futures, the mean and standard deviation of daily returns are
calculated. Table 1 presents summary statistics of daily returns for the 28 commodity
futures during the sample period. A critical value of 2 standard deviations is used to
identify the boundaries for price fluctuations. A daily return is considered “extreme” if it
were more than 2 standard deviations from the mean of the daily return distribution.
Furthermore, the “extreme” events of the left tail of the distribution are considered as the
losers, and the “extreme” events of the right tail of the distribution are considered as the
winners.
27. The method of calculating the futures returns can consult Roll (1984), Szkmary and Kiefer (2004), Miffre and Rallis
(2007) and Fuertes et al. (2010).
Overreaction and Underreaction in the Commodity Futures Market
68
Table 1: Summary statistics of daily returns for each commodity futures
during the sample period
Mean S.D. Min Max Skewness Kurtosis
Softs
Cocoa -0.01% 1.88 -9.52 13.38 0.19 5.56
Coffee 0.01 2.20 -13.96 26.84 0.55 12.81
Cotton 0.01 1.54 -7.78 12.02 0.09 5.35
Lumber -0.04 1.72 -5.88 7.24 0.11 2.92
Orange Juice 0.01 1.81 -12.90 26.99 0.95 19.81
Sugar 0.02 2.46 -16.66 15.25 -0.01 6.05
Grains
Corn -0.02 1.44 -9.89 9.05 0.05 6.37
Oats -0.01 1.84 -11.25 11.74 0.07 5.50
Rough Rice -0.02 1.63 -8.70 9.71 0.13 5.09
Soybeans 0.01 1.40 -8.23 6.96 -0.12 5.48
Soybean Oil 0.00 1.50 -6.98 8.37 0.20 4.68
Soybean Meal 0.02 1.50 -9.00 7.82 0.00 5.53
Wheat -0.02 1.62 -9.49 9.48 0.15 6.03
Livestock
Feeder Cattle 0.01 0.87 -5.83 3.69 -0.11 4.16
Lean Hogs 0.00 1.45 -6.65 7.12 -0.04 4.07
Live Cattle 0.01 0.94 -6.16 3.78 -0.07 4.02
Pork Bellies -0.01 2.11 -7.33 8.67 0.07 3.06
Energies
Crude Oil 0.06 2.28 -33.00 15.66 -0.38 14.38
Heating Oil 0.06 2.10 -32.36 15.02 -0.41 14.21
Natural Gas -0.01 3.21 -19.46 38.31 0.51 9.42
Metals
Aluminum 0.00 1.31 -7.93 6.17 -0.22 5.59
Copper 0.04 1.70 -10.93 12.46 -0.05 7.08
Gold 0.01 1.22 -9.59 10.24 0.06 11.07
Lead 0.04 1.99 -12.32 13.73 -0.04 6.62
Nickel 0.06 2.27 -16.75 14.17 0.06 6.76
Silver 0.03 1.77 -17.73 13.15 -0.55 10.62
Tin 0.05 1.61 -10.83 16.75 0.07 11.33
Zinc 0.01 1.80 -11.81 9.96 -0.14 6.59
IRABF 2013 Volume 5, Number 3/4
69
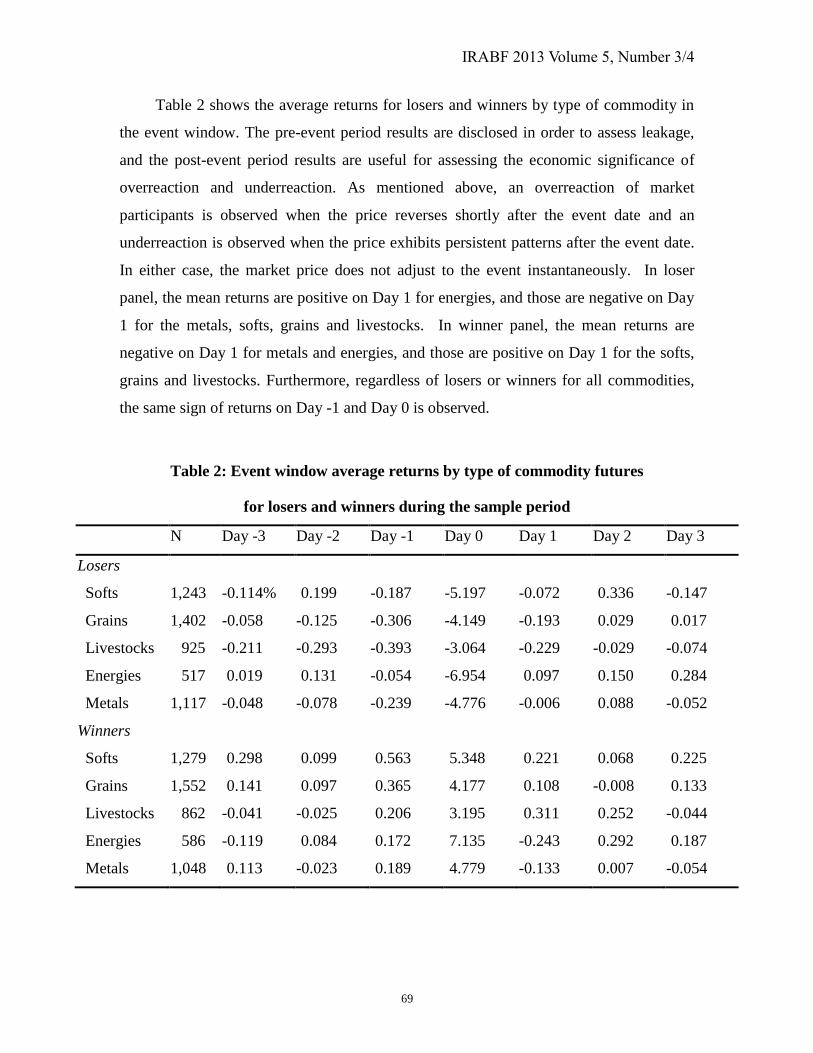
Table 2 shows the average returns for losers and winners by type of commodity in
the event window. The pre-event period results are disclosed in order to assess leakage,
and the post-event period results are useful for assessing the economic significance of
overreaction and underreaction. As mentioned above, an overreaction of market
participants is observed when the price reverses shortly after the event date and an
underreaction is observed when the price exhibits persistent patterns after the event date.
In either case, the market price does not adjust to the event instantaneously. In loser
panel, the mean returns are positive on Day 1 for energies, and those are negative on Day
1 for the metals, softs, grains and livestocks. In winner panel, the mean returns are
negative on Day 1 for metals and energies, and those are positive on Day 1 for the softs,
grains and livestocks. Furthermore, regardless of losers or winners for all commodities,
the same sign of returns on Day -1 and Day 0 is observed.
Table 2: Event window average returns by type of commodity futures
for losers and winners during the sample period
N Day -3 Day -2 Day -1 Day 0 Day 1 Day 2 Day 3
Losers
Softs 1,243 -0.114% 0.199 -0.187 -5.197 -0.072 0.336 -0.147
Grains 1,402 -0.058 -0.125 -0.306 -4.149 -0.193 0.029 0.017
Livestocks 925 -0.211 -0.293 -0.393 -3.064 -0.229 -0.029 -0.074
Energies 517 0.019 0.131 -0.054 -6.954 0.097 0.150 0.284
Metals 1,117 -0.048 -0.078 -0.239 -4.776 -0.006 0.088 -0.052
Winners
Softs 1,279 0.298 0.099 0.563 5.348 0.221 0.068 0.225
Grains 1,552 0.141 0.097 0.365 4.177 0.108 -0.008 0.133
Livestocks 862 -0.041 -0.025 0.206 3.195 0.311 0.252 -0.044
Energies 586 -0.119 0.084 0.172 7.135 -0.243 0.292 0.187
Metals 1,048 0.113 -0.023 0.189 4.779 -0.133 0.007 -0.054
Overreaction and Underreaction in the Commodity Futures Market
70
4. Methodology
4.1 Event-study methodology28
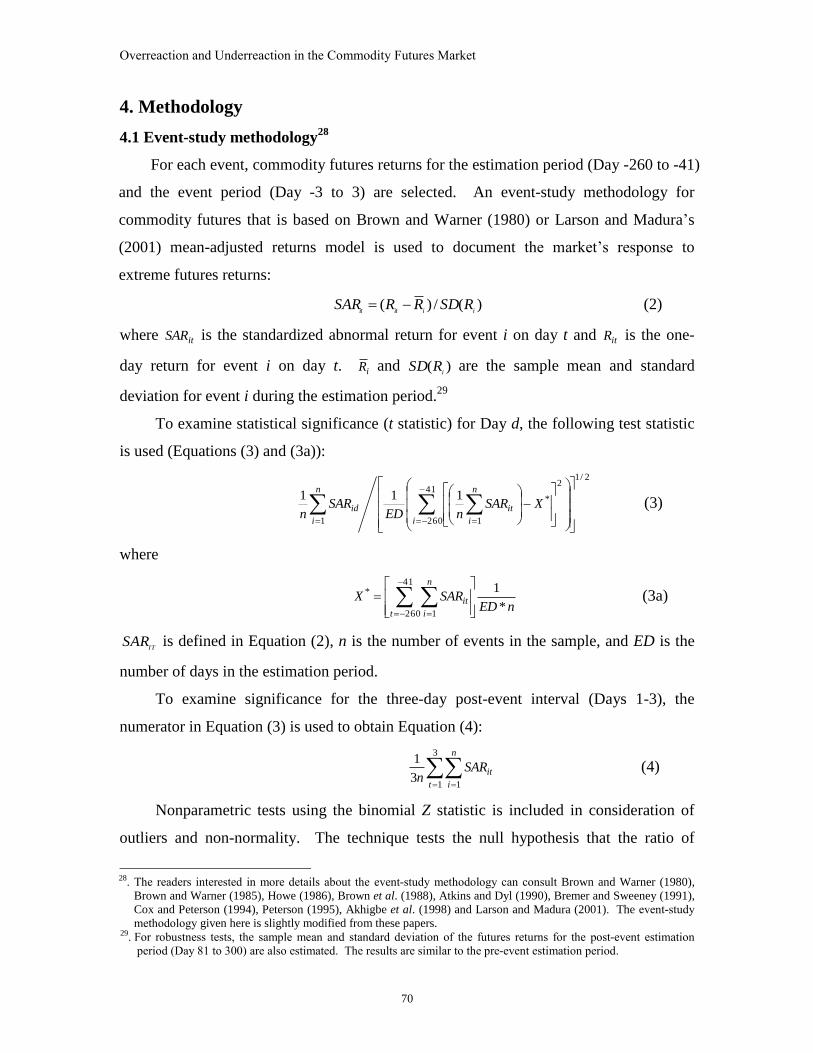
For each event, commodity futures returns for the estimation period (Day -260 to -41)
and the event period (Day -3 to 3) are selected. An event-study methodology for
commodity futures that is based on Brown and Warner (1980) or Larson and Madura’s
(2001) mean-adjusted returns model is used to document the market’s response to
extreme futures returns:
)(/)(iiitit
RSDRRSAR (2)
where itSAR is the standardized abnormal return for event i on day t and itR is the one-
day return for event i on day t. iR and )(i
RSD are the sample mean and standard
deviation for event i during the estimation period.29
To examine statistical significance (t statistic) for Day d, the following test statistic
is used (Equations (3) and (3a)):
2/12
41
260
*
11
111
i
n
i
it
n
i
id XSARnED
SARn
(3)
where
nED
SARX
t
n
i
it*
141
260 1
*
(3a)
ITSAR is defined in Equation (2), n is the number of events in the sample, and ED is the
number of days in the estimation period.
To examine significance for the three-day post-event interval (Days 1-3), the
numerator in Equation (3) is used to obtain Equation (4):
3
1 13
1
t
n
i
itSARn
(4)
Nonparametric tests using the binomial Z statistic is included in consideration of
outliers and non-normality. The technique tests the null hypothesis that the ratio of
28. The readers interested in more details about the event-study methodology can consult Brown and Warner (1980),
Brown and Warner (1985), Howe (1986), Brown et al. (1988), Atkins and Dyl (1990), Bremer and Sweeney (1991),
Cox and Peterson (1994), Peterson (1995), Akhigbe et al. (1998) and Larson and Madura (2001). The event-study
methodology given here is slightly modified from these papers. 29. For robustness tests, the sample mean and standard deviation of the futures returns for the post-event estimation
period (Day 81 to 300) are also estimated. The results are similar to the pre-event estimation period.
IRABF 2013 Volume 5, Number 3/4
71
positive return observations on Day d is different from 50%. The corresponding Z
statistic nP /)]5.0)(5.0[(/)5.0( , where P is the ratio of positive returns on Day d and n
is the number of events on Day d.
4.2 Regression Analysis
In order to control for potentially confounding factors while assessing the above
hypotheses, post-event returns (Day 1 or Days 1-3) are regressed on the initial returns
(Day 0), the degree of information leakage and geopolitical risks. Moreover, some
dummy variables, the day of the week and month of the year (January and December),
are also considered. The following regression model is used to test the stated
hypotheses.30
iiii
iiiiii
eFriThuTueMon α
JanαDecαNonagrαLeakαArααSAR
9876
5432100
(5)
where i
SAR is the post-event standardized abnormal return, i
Ar0 is the standardized
abnormal return on the event day (Day 0), i
Leak is the three-day pre-event period
cumulative abnormal return and i
Nonagr is a dummy variable equal to 1 if the event
corresponds to non-agricultural commodities (energies and metals). As the seasonality
effects may exist in commodity futures, such as the day-of-the-week and the monthly
effects. Several dummy variables are included in Equation (5). i
Dec (December) or
iJan (January) is a dummy variable equal to 1 if the event occurs in that month,
otherwise 0. i
M o n (Monday), i
Tue (Tuesday), i
Thu (Thursday), or i
Fri (Friday) is a
dummy variable equal to 1 if the event occurs on that weekday, otherwise 0.
iAr0 , the standardized abnormal return on the event day, is included in Equation (5)
to test the initial futures price changes (Hypothesis 5) that larger initial returns are
expected to be associated with stronger degrees of overreaction. The hypothesis is
supported if the sign on the coefficient )(1
is negative and statistically significant.
As mentioned above, some previous studies have found that larger degrees of
leakage are associated with larger degrees of overreaction for various financial markets
30. The regression analysis model and contents are slightly modified from Larson and Madura (2001).
Overreaction and Underreaction in the Commodity Futures Market
72
during the significant events. Therefore, this study conjectures that higher degrees of
information leakage, as evidenced by pre-event futures price changes that are in the same
direction as the extreme futures price changes, is associated with larger degrees of
overreaction. The private information leakage hypothesis (Hypothesis 6) is accepted if
the sign on this coefficient )(2
is negative and statistically significant at the chosen
levels.
As mentioned above, the dummy variable, i
Nonagr , is examined to check whether
the degree of overreaction is stronger when the commodities are related to the non-
agricultural commodities (Hypothesis 4). The geopolitical risk hypothesis is accepted if
the sign on the coefficient )(3
for losers (winners) is positive (negative) when the
dummy variable corresponds to the non-agricultural commodities (energies and metals).
5. Empirical results
5.1 Event-study results
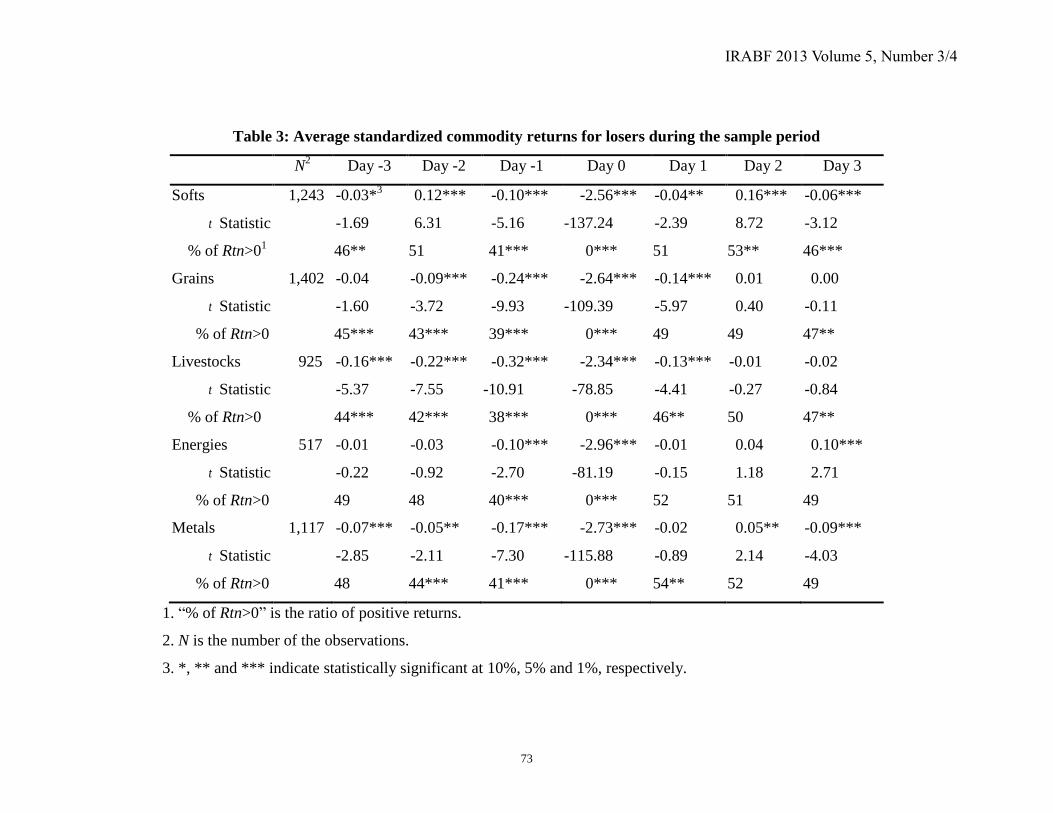
Tables 3 and 4 display the event-study results pursuant to overreaction and
underreaction for losers and winners, respectively. The first row for any type of
commodity discloses the standardized abnormal returns, the second row discloses the t
statistic for the standardized abnormal returns, and the third row discloses the results of
the binomial Z tests.
Table 3 shows that the efficient markets hypothesis (Hypothesis 1) is rejected in
favor of the underreaction hypothesis (Hypothesis 3) for all agricultural losers. The signs
of the standardized abnormal returns for the softs, grains and livestocks on Day 1 are
negative and significant at 5% or 1% level. However, the efficient markets hypothesis
(Hypothesis 1) is not rejected for two non-agricultural losers (metal and energy futures).
In other words, the signs of the standardized abnormal returns for metal and energy
futures on Day 1 are not significant.
IRABF 2013 Volume 5, Number 3/4
73
Table 3: Average standardized commodity returns for losers during the sample period
1. “% of Rtn>0” is the ratio of positive returns.
2. N is the number of the observations.
3. *, ** and *** indicate statistically significant at 10%, 5% and 1%, respectively.
N2
Day -3 Day -2 Day -1 Day 0 Day 1 Day 2 Day 3
Softs 1,243 -0.03*3
0.12*** -0.10*** -2.56*** -0.04** 0.16*** -0.06***
t Statistic -1.69 6.31 -5.16 -137.24 -2.39 8.72 -3.12
% of Rtn>01
46** 51 41*** 0*** 51 53** 46***
Grains 1,402 -0.04 -0.09*** -0.24*** -2.64*** -0.14*** 0.01 0.00
t Statistic -1.60 -3.72 -9.93 -109.39 -5.97 0.40 -0.11
% of Rtn>0 45*** 43*** 39*** 0*** 49 49 47**
Livestocks 925 -0.16*** -0.22*** -0.32*** -2.34*** -0.13*** -0.01 -0.02
t Statistic -5.37 -7.55 -10.91 -78.85 -4.41 -0.27 -0.84
% of Rtn>0 44*** 42*** 38*** 0*** 46** 50 47**
Energies 517 -0.01 -0.03 -0.10*** -2.96*** -0.01 0.04 0.10***
t Statistic -0.22 -0.92 -2.70 -81.19 -0.15 1.18 2.71
% of Rtn>0 49 48 40*** 0*** 52 51 49
Metals 1,117 -0.07*** -0.05** -0.17*** -2.73*** -0.02 0.05** -0.09***
t Statistic -2.85 -2.11 -7.30 -115.88 -0.89 2.14 -4.03
% of Rtn>0 48 44*** 41*** 0*** 54** 52 49
Overreaction and Underreaction in the Commodity Futures Market
74
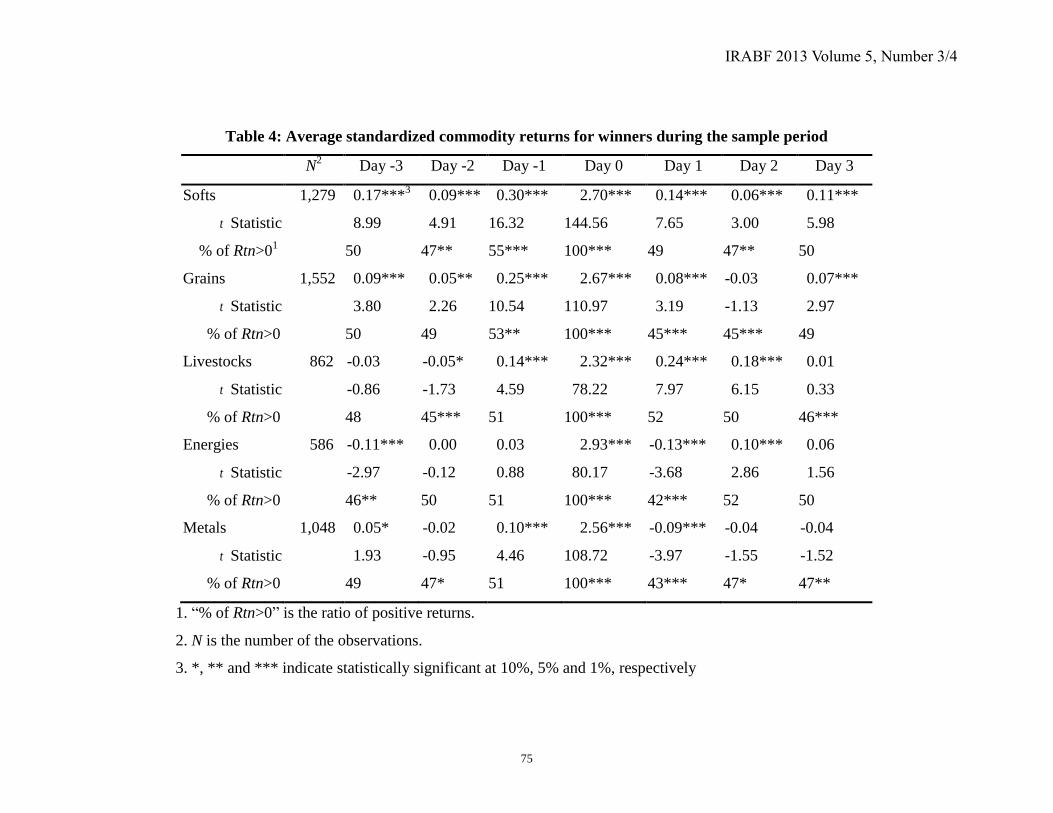
The efficient markets hypothesis (Hypothesis 1) is rejected, shown in Table 4, in
favor of the underreaction hypothesis (Hypothesis 3) for all agricultural winners. For
Day 1, the signs of the standardized abnormal returns are positive and significant for the
softs, grains and livestocks at 1% level. In addition, the efficient markets hypothesis
(Hypothesis 1) is also rejected in favor of the overreaction hypothesis (Hypothesis 2) for
metal and energy winners. The signs of the standardized abnormal returns for metal and
energy winners on Day 1 are negative and statistically significant at 1% level.
The pre-event standardized abnormal daily returns are used to determine whether
there is leakage of information before the extreme change in commodity prices. The
findings of Table 3 for all losers show that all signs of the standardized abnormal returns
on Day -1 are negative and statistically significant at the 1% level. The results of Table 4
for all winners also present the similar phenomenon except for energy winner. The
evidence indicates that there is leakage of information prior to the extreme change in
commodity prices.
IRABF 2013 Volume 5, Number 3/4
75
Table 4: Average standardized commodity returns for winners during the sample period
N2
Day -3 Day -2 Day -1 Day 0 Day 1 Day 2 Day 3
Softs 1,279 0.17***3
0.09*** 0.30*** 2.70*** 0.14*** 0.06*** 0.11***
t Statistic 8.99 4.91 16.32 144.56 7.65 3.00 5.98
% of Rtn>01
50 47** 55*** 100*** 49 47** 50
Grains 1,552 0.09*** 0.05** 0.25*** 2.67*** 0.08*** -0.03 0.07***
t Statistic 3.80 2.26 10.54 110.97 3.19 -1.13 2.97
% of Rtn>0 50 49 53** 100*** 45*** 45*** 49
Livestocks 862 -0.03 -0.05* 0.14*** 2.32*** 0.24*** 0.18*** 0.01
t Statistic -0.86 -1.73 4.59 78.22 7.97 6.15 0.33
% of Rtn>0 48 45*** 51 100*** 52 50 46***
Energies 586 -0.11*** 0.00 0.03 2.93*** -0.13*** 0.10*** 0.06
t Statistic -2.97 -0.12 0.88 80.17 -3.68 2.86 1.56
% of Rtn>0 46** 50 51 100*** 42*** 52 50
Metals 1,048 0.05* -0.02 0.10*** 2.56*** -0.09*** -0.04 -0.04
t Statistic 1.93 -0.95 4.46 108.72 -3.97 -1.55 -1.52
% of Rtn>0 49 47* 51 100*** 43*** 47* 47**
1. “% of Rtn>0” is the ratio of positive returns.
2. N is the number of the observations.
3. *, ** and *** indicate statistically significant at 10%, 5% and 1%, respectively
Overreaction and Underreaction in the Commodity Futures Market
76
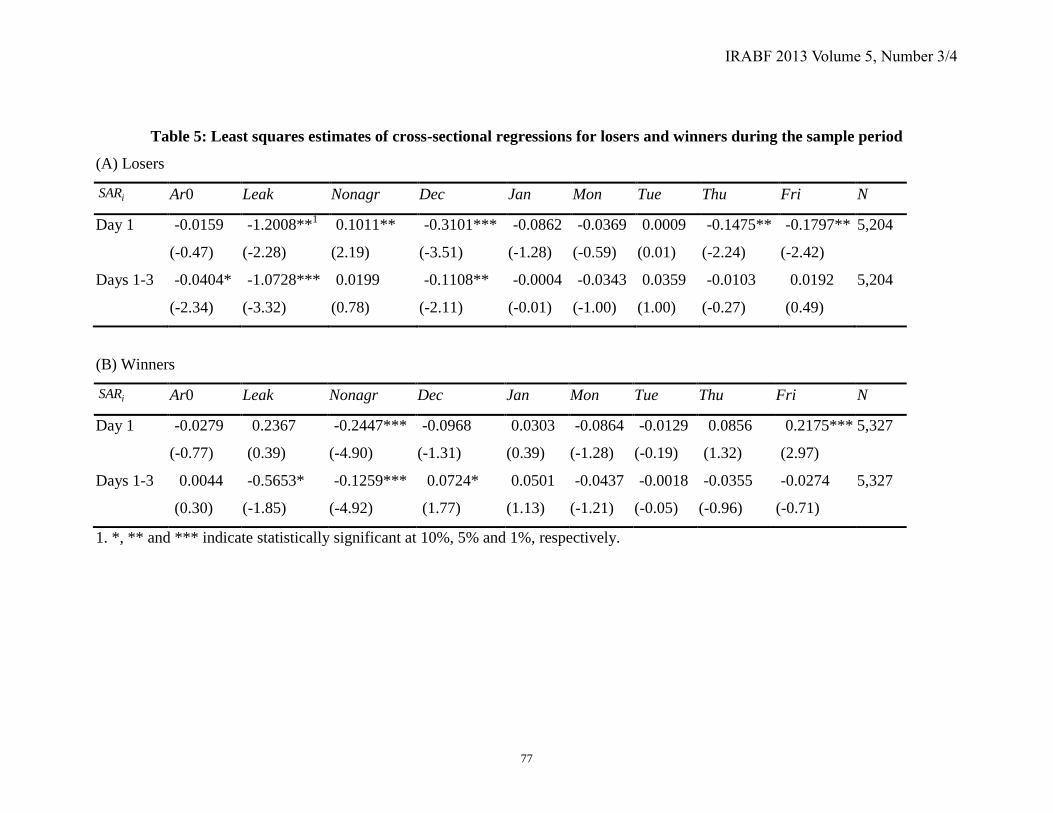
5.2 Cross-sectional results
Cross-sectional results are exhibited in Table 5. Panel A contains results for all
(agricultural and non-agricultural futures) losers. As noted above, Nonagr, was set equal
to 1 if the event corresponds to non-agricultural commodity futures. The coefficient on
Nonagr for Day 1 is positive and statistically significant at 5% level. Thus, the
geopolitical risks hypothesis (Hypothesis 4), non-agricultural commodities will be
associated with a stronger tendency toward overreaction than agricultural commodities, is
supported. The variable Ar0 pertains to the initial futures price changes. The coefficient
on Ar0 for Days 1-3 is negative and statistically significant at 10% level. That is to say,
the initial price change hypothesis (Hypothesis 5), larger initial futures price changes will
be associated with larger degrees of overreaction, is supported. The variable Leak
pertains to the degree of pre-event leakage. For Day 1 and Days 1-3, the signs of the
coefficients are negative and statistically significant at 5% and 1%, respectively. These
findings support that higher degrees of information leakage are expected to be associated
with larger degrees of overreaction (Hypothesis 6).
Panel B contains results for all (agricultural and non-agricultural futures) winners.
The coefficients on Nonagr for Day 1 and Days 1-3 are negative and statistically
significant at 1% level. Thus, the geopolitical risks hypothesis (Hypothesis 4), non-
agricultural commodities will be associated with a stronger tendency toward overreaction
than agricultural commodities, is obviously supported. The coefficients on Ar0 for Day 1
and Days 1-3 are not statistically significant. Thus, there is no evidence in favor of the
initial price changes hypothesis (Hypothesis 5), i.e., larger initial price changes will not
be associated with larger degrees of overreaction. In addition, the coefficient on Leak for
Days 1-3 is negative and significant at 10% level, which evidence weakly supports that
larger degrees of leakage will be associated with larger degrees of overreaction
(Hypothesis 6).
IRABF 2013 Volume 5, Number 3/4
77
Table 5: Least squares estimates of cross-sectional regressions for losers and winners during the sample period
(A) Losers
iSAR Ar0 Leak Nonagr Dec Jan Mon Tue Thu Fri N
Day 1 -0.0159 -1.2008**1
0.1011** -0.3101*** -0.0862 -0.0369 0.0009 -0.1475** -0.1797** 5,204
(-0.47) (-2.28) (2.19) (-3.51) (-1.28) (-0.59) (0.01) (-2.24) (-2.42)
Days 1-3 -0.0404* -1.0728*** 0.0199 -0.1108** -0.0004 -0.0343 0.0359 -0.0103 0.0192 5,204
(-2.34) (-3.32) (0.78) (-2.11) (-0.01) (-1.00) (1.00) (-0.27) (0.49)
(B) Winners
iSAR Ar0 Leak Nonagr Dec Jan Mon Tue Thu Fri N
Day 1 -0.0279 0.2367 -0.2447*** -0.0968 0.0303 -0.0864 -0.0129 0.0856 0.2175*** 5,327
(-0.77) (0.39) (-4.90) (-1.31) (0.39) (-1.28) (-0.19) (1.32) (2.97)
Days 1-3 0.0044 -0.5653* -0.1259*** 0.0724* 0.0501 -0.0437 -0.0018 -0.0355 -0.0274 5,327
(0.30) (-1.85) (-4.92) (1.77) (1.13) (-1.21) (-0.05) (-0.96) (-0.71)
1. *, ** and *** indicate statistically significant at 10%, 5% and 1%, respectively.
Overreaction and Underreaction in the Commodity Futures Market
78
In general, the results of this study suggest that commodity futures market
participants overreact to information pursuant to non-agriculture commodities, but they
underreact information pursuant to agriculture commodities. The cross-sectional analysis
confirms that non-agriculture commodities experience stronger degrees of overreaction
than agriculture commodities, even after controlling for potentially confounding factors.
6. Conclusion
Using the event-study methodology, this study examines the overreaction and
underreaction in the commodity futures markets, including softs, grains, livestocks,
metals and energies. The findings of this study suggest that the efficient market
hypothesis should be rejected with regard to extreme fluctuations pursuant to commodity
futures. For losers and winners of agriculture commodity futures, the evidence suggests
that market participants underreact, but for winners of non-agriculture commodity futures,
the evidence suggests that market participants overreact.
Cross-sectional regression analyses control for other possibly confounding factors,
such as initial price change, leakage, day of the week and change in the year. Even when
controlling for these factors, there is still evidence that non-agriculture commodity
futures are associated with stronger degrees of overreaction than those of agricultural
futures.
IRABF 2013 Volume 5, Number 3/4
79
References
Acworth, W., 2012. Volume climbs 11.4% to 25 billion contracts worldwide, 24-33,
www.futuresindustry.com.
Allen, M. T., Ma, C. K., and Pace, R. D., 1994. Over-reactions in US agricultural
commodity prices, Journal of Agricultural Economics 45(2), 240-251.
Ajayi, R. A. and Mehdian, S., 1994. Rational investors’ reaction to uncertainty: Evidence
from the world’s major markets, Journal of Business Finance and Accounting 21(4),
533-545.
Akhigbe, A., Gosnell, T., and Harikumar, T., 1998. Winners and losers on NYSE: A re-
examination using daily closing bid-ask spreads, Journal of Financial Research 21(1),
53-64.
Atkins, A. B. and Dyl, E. A., 1990. Price reversals, bid-ask spreads, and market
efficiency, Journal of Financial and Quantitative Analysis 25(4), 535-547.
Belgrave, R., 1985. The uncertainty of energy supplies in a geopolitical perspective,
International Affairs 61(2), 253-261.
Billon, P. L., 2001. The political ecology of war: Natural resources and armed conflicts,
Political Geography 20(5), 561-584.
Bodie, Z. and Rosansky, V. I., 1980. Risk and return in commodity futures, Financial
Analysts Journal 36(3), 27-39.
Bremer, M. and Sweeney, R. J., 1991. The reversal of large stock-price decreases,
Journal of Finance 46(2), 747-754.
Brown, K. C. and Harlow, W. V., 1988. Market overreaction: magnitude and intensity,
Journal of Portfolio Management 14(2), 6-13.
Brown, K. C., Harlow, W. V., and Tinic, S. M., 1988. Risk aversion, uncertain
information, and market efficiency, Journal of Financial Economics 22(2), 355-385.
Brown, S. J. and Warner, J. B., 1980. Measuring security price performance, Journal of
Financial Economics 8(3), 205-258.
Brown, S. J. and Warner, J. B., 1985. Using daily stock returns: The case of event study,
Journal of Financial Economics 14(1), 3-32.
Carr, G., 2012. Managing geopolitical risk in energy markets, Energy Risk (7 Feb, 2012).
Overreaction and Underreaction in the Commodity Futures Market
80
Cox, D. R. and Peterson, D. R., 1994. Stock returns following large one-day declines:
evidence on short-term reversals and longer-term performance, Journal of Finance
49(1), 255-267.
Daniel, K., Hirshleifer, D., and Subrahmanyam, A., 1998. Investor psychology and
security market under- and overreactions, Journal of Finance 53(6), 1839-1885.
DeBondt, W. F. M. and Thaler, R. H., 1985. Does the stock market overreact? Journal of
Finance 40(3), 793-805.
DeBondt, W. F. M. and Thaler, R. H., 1987. Further evidence on investor overreaction
and stock market seasonality, Journal of Finance 42(3), 557-581.
Erb, C. B. and Harvey, C. R., 2006. The strategic and tactical value of commodity futures,
Financial Analysts Journal 62(2), 69-97.
Fuertes, A., Miffre, J., and Rallis, G., 2010. Tactical allocation in commodity futures
markets: Combining momentum and term structure signals, Journal of Banking and
Finance 34(10), 2530-2548.
Gorton, G. and Rouwenhorst, G., 2006. Facts and fantasies about commodity futures,
Financial Analysts Journal 62(2), 47–68.
Howe, J. S., 1986. Evidence on stock market overreaction, Financial Analysts Journal
42(3), 74–77.
Larson, S. J. and Madura, J., 2001. Overreaction and underreaction in the foreign
exchange market, Global Finance Journal 12(2), 153-177.
Ma, C. K., Dare, W. H., and Donaldson, D. R., 1990. Testing rationality in futures
markets, Journal of Futures Markets 10(2), 137-152.
Miffre, J. and Rallis, G., 2007. Momentum strategies in commodity futures markets,
Journal of Banking and Finance 31(6), 1863-1886.
Peterson, D. R., 1995. The influence of organized options trading on stock price behavior
following large one-day stock price declines, Journal of Financial Research 18(1), 33-
44.
Roll, R., 1984. Orange juice and weather, American Economic Review 74(5), 861–880.
Szakmary, A. C. and Kiefer, D. B., 2004. The disappearing January/turn of the year
effect: Evidence from stock index futures and cash markets, Journal of Futures
Markets 24(8), 755-784.
IRABF 2013 Volume 5, Number 3/4
81
Varisco, A. D. 2009. A study on the inter-relation between armed conflict and natural
resources and its implication for conflict resolution and peacebuilding, Journal of
Peace, Conflict and Development 14, 38-58.
Wolfe, W. M. and Tessman B. F., 2012. China’s global equity oil investments: Economic
and geopolitical influence, Journal of Strategic Studies 35(2), 175-196.
Overreaction and Underreaction in the Commodity Futures Market
82
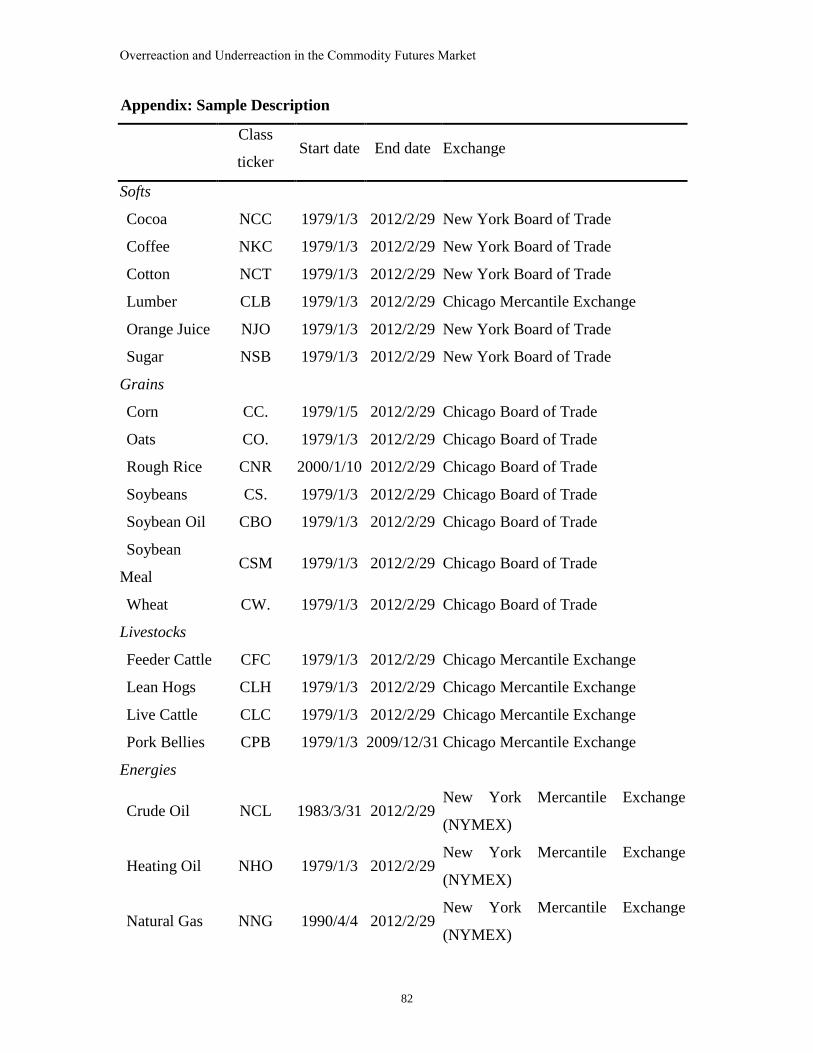
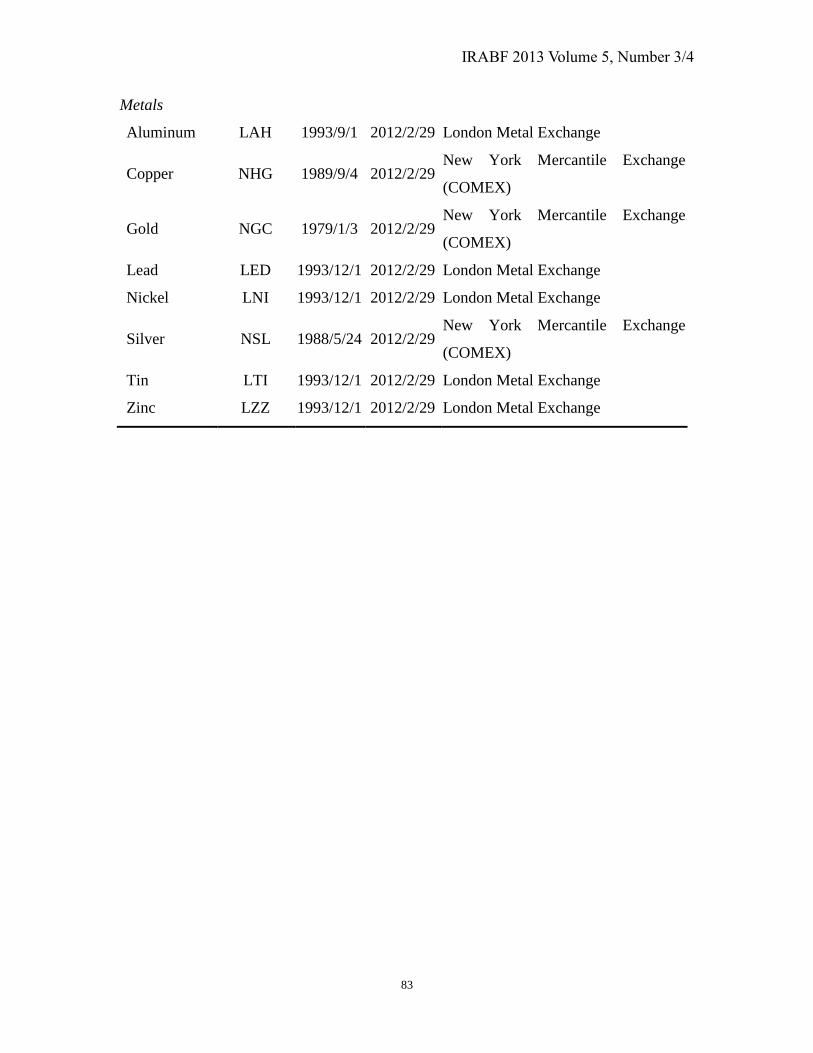
Appendix: Sample Description
Class
ticker Start date End date Exchange
Softs
Cocoa NCC 1979/1/3 2012/2/29 New York Board of Trade
Coffee NKC 1979/1/3 2012/2/29 New York Board of Trade
Cotton NCT 1979/1/3 2012/2/29 New York Board of Trade
Lumber CLB 1979/1/3 2012/2/29 Chicago Mercantile Exchange
Orange Juice NJO 1979/1/3 2012/2/29 New York Board of Trade
Sugar NSB 1979/1/3 2012/2/29 New York Board of Trade
Grains
Corn CC. 1979/1/5 2012/2/29 Chicago Board of Trade
Oats CO. 1979/1/3 2012/2/29 Chicago Board of Trade
Rough Rice CNR 2000/1/10 2012/2/29 Chicago Board of Trade
Soybeans CS. 1979/1/3 2012/2/29 Chicago Board of Trade
Soybean Oil CBO 1979/1/3 2012/2/29 Chicago Board of Trade
Soybean
Meal CSM 1979/1/3 2012/2/29 Chicago Board of Trade
Wheat CW. 1979/1/3 2012/2/29 Chicago Board of Trade
Livestocks
Feeder Cattle CFC 1979/1/3 2012/2/29 Chicago Mercantile Exchange
Lean Hogs CLH 1979/1/3 2012/2/29 Chicago Mercantile Exchange
Live Cattle CLC 1979/1/3 2012/2/29 Chicago Mercantile Exchange
Pork Bellies CPB 1979/1/3 2009/12/31 Chicago Mercantile Exchange
Energies
Crude Oil NCL 1983/3/31 2012/2/29 New York Mercantile Exchange
(NYMEX)
Heating Oil NHO 1979/1/3 2012/2/29 New York Mercantile Exchange
(NYMEX)
Natural Gas NNG 1990/4/4 2012/2/29 New York Mercantile Exchange
(NYMEX)
IRABF 2013 Volume 5, Number 3/4
83
Metals
Aluminum LAH 1993/9/1 2012/2/29 London Metal Exchange
Copper NHG 1989/9/4 2012/2/29 New York Mercantile Exchange
(COMEX)
Gold NGC 1979/1/3 2012/2/29 New York Mercantile Exchange
(COMEX)
Lead LED 1993/12/1 2012/2/29 London Metal Exchange
Nickel LNI 1993/12/1 2012/2/29 London Metal Exchange
Silver NSL 1988/5/24 2012/2/29 New York Mercantile Exchange
(COMEX)
Tin LTI 1993/12/1 2012/2/29 London Metal Exchange
Zinc LZZ 1993/12/1 2012/2/29 London Metal Exchange