Embed Size (px)
Citation preview
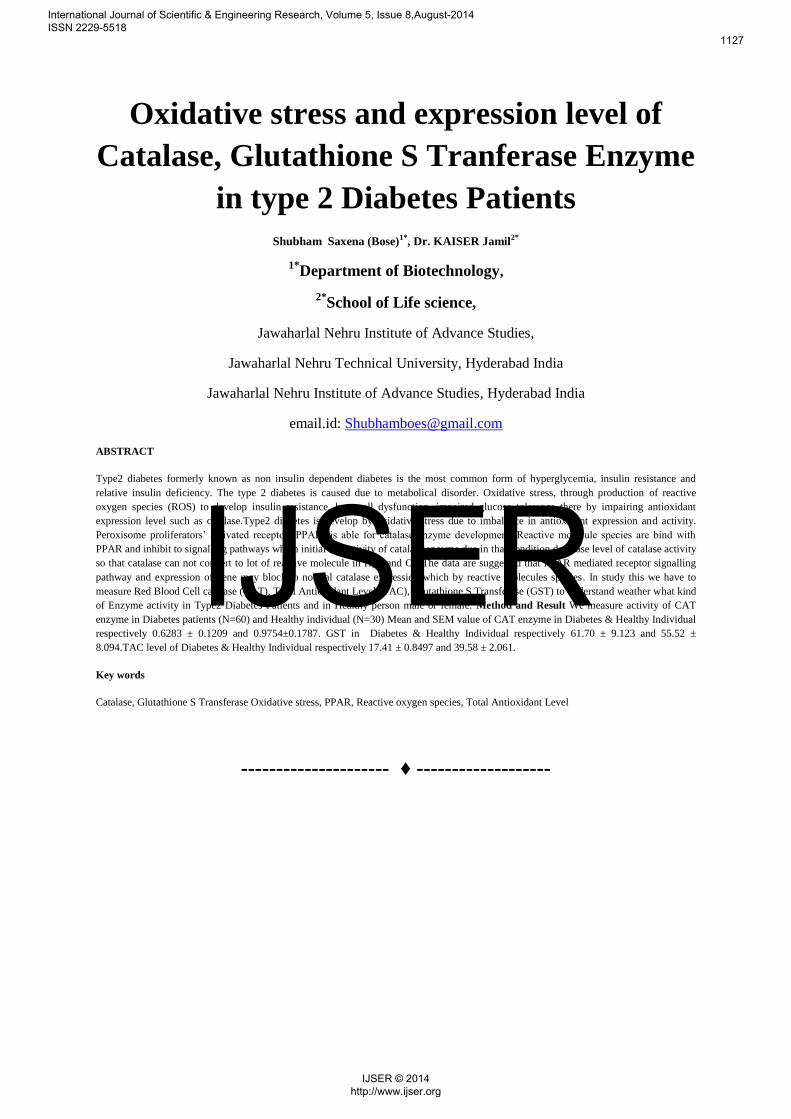
Oxidative stress and expression level of
Catalase, Glutathione S Tranferase Enzyme
in type 2 Diabetes Patients
Shubham Saxena (Bose)1*, Dr. KAISER Jamil2*
1*Department of Biotechnology,
2*School of Life science,
Jawaharlal Nehru Institute of Advance Studies,
Jawaharlal Nehru Technical University, Hyderabad India
Jawaharlal Nehru Institute of Advance Studies, Hyderabad India
email.id: [email protected]
ABSTRACT
Type2 diabetes formerly known as non insulin dependent diabetes is the most common form of hyperglycemia, insulin resistance and
relative insulin deficiency. The type 2 diabetes is caused due to metabolical disorder. Oxidative stress, through production of reactive
oxygen species (ROS) to develop insulin resistance, beta cell dysfunction, impaired glucose tolerance there by impairing antioxidant
expression level such as catalase.Type2 diabetes is develop by oxidative stress due to imbalance in antioxidant expression and activity.
Peroxisome proliferators’ activated receptor (PPAR) is able for catalase enzyme development. Reactive molecule species are bind with
PPAR and inhibit to signalling pathways which initial for activity of catalase enzyme due in that condition decrease level of catalase activity
so that catalase can not convert to lot of reactive molecule in H2O and O2. The data are suggested that PPAR mediated receptor signalling
pathway and expression of gene may block to normal catalase expression which by reactive molecules species. In study this we have to
measure Red Blood Cell catalase (CAT), Total Antioxidant Level (TAC), Glutathione S Transferase (GST) to understand weather what kind
of Enzyme activity in Type2 Diabetes Patients and in Healthy person male or female. Method and Result We measure activity of CAT
enzyme in Diabetes patients (N=60) and Healthy individual (N=30) Mean and SEM value of CAT enzyme in Diabetes & Healthy Individual
respectively 0.6283 ± 0.1209 and 0.9754±0.1787. GST in Diabetes & Healthy Individual respectively 61.70 ± 9.123 and 55.52 ±
8.094.TAC level of Diabetes & Healthy Individual respectively 17.41 ± 0.8497 and 39.58 ± 2.061.
Key words
Catalase, Glutathione S Transferase Oxidative stress, PPAR, Reactive oxygen species, Total Antioxidant Level
--------------------- ♦ -------------------
International Journal of Scientific & Engineering Research, Volume 5, Issue 8,August-2014 ISSN 2229-5518
1127
IJSER © 2014 http://www.ijser.org
IJSER
INTRODUCTION:
Diabetes mellitus is a heterogonous metabolic disorder.
In case of type2 diabetes mellitus which generally
develops by Reactive oxygen species(ROS) in kindly
ageing persons the principle of type2 diabetes is defect is
insulin resistance leading to relative insulin deficiency in
liver and peripheral tissues could lead to hyperglycemia
up to turn cause fourfold increase glucose. The principal
source of type2diabetes develop by reactive oxygen
species in cells which generate by metabolically reaction
increase level of ROS called to oxidative stress which are
main effect to cause type2diabetes in human. Increase
level of ROS is equal to decrease level of antioxidant
enzyme. Oxidative stress is wildly playing key role in
electron for inhibit the process of reactive oxygen
species. Catalase an endogenous antioxidant enzyme are
initial for regulate to inhibit process of ROS. Catalase
interact with reactive molecules (Free Radical) split to
reactive molecule in to H2O and O2. Glutathione S
Transferase and Catalase both are necessary enzyme
which protect to cell from oxidative damage and prevent
the formation of free radical. The Total antioxidant
capacity (TAC) in the red blood cell is not simple sum of
the various antioxidant substances. It is a dynamic
equilibrium that is influenced by the interaction such as
protein and cholesterol.
MATERIAL AND METHOD:
Human Blood Sample:
Human’s Diabetes Blood Samples 100 and Healthy 100
were collected from south India Hyderabad. The Blood
were rinsed from human body and then stored at -4oc
temperature.
Extraction and Purification Procedure of Red Blood
Cells:
All steps were carried out at 0–4OC. Human blood
samples was centrifuge 3000rpm for four times with
0.9%NaCl for each 10minute.The homogenate was
immediately stored at - 4oc.
Activity Assay:
Activity was measured spectrophotometrically (Varian
UV visible spectrophotometer, Cary 1C, Australia) at
room temperature by following the decrease in
absorbance at 240 nm in case of catalase resulting from
the disappearance of H2O2. The molar extinction
coefficient of H2O2 was 0.071/M/cm at 240 nm
(Kaur et al). One unit of catalase activity is defined as the
amount of activity required to convert 1m mole of
hydrogen peroxide to H2O and O2per minute at 25C.
Experimental studies were carried out in triplicate, and
the results were expressed by statically analysis the value
means and standard error of mean.
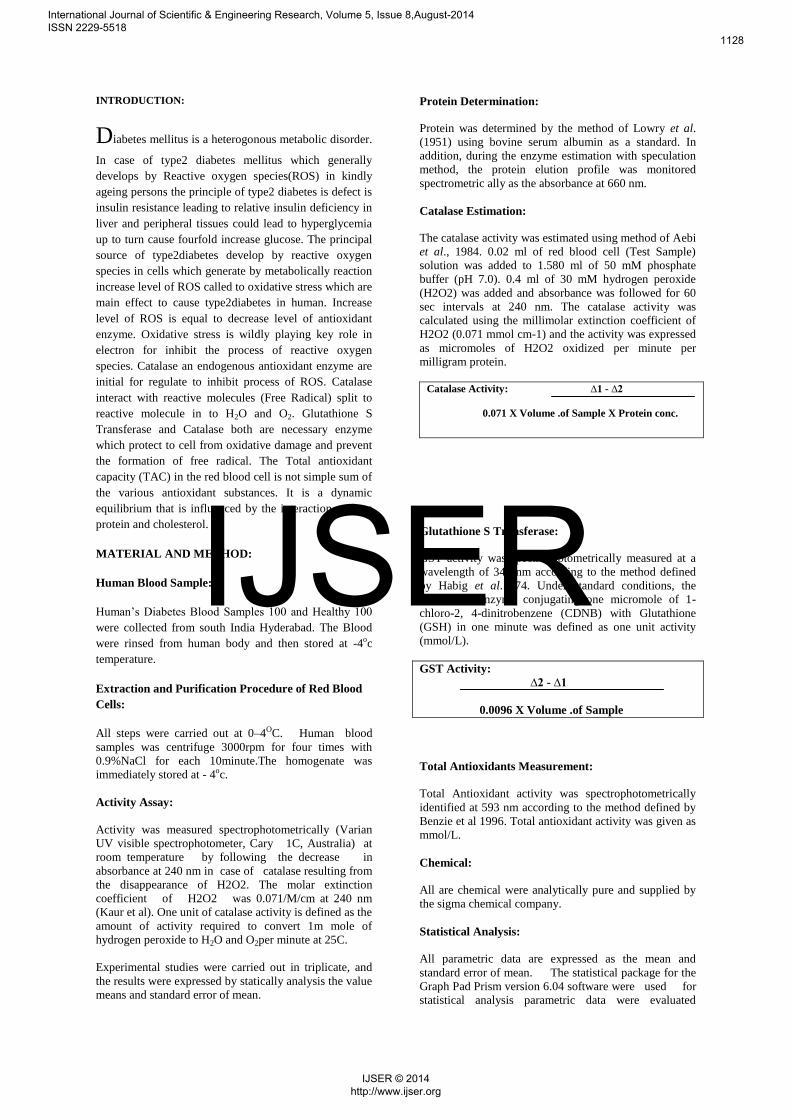
Protein Determination:
Protein was determined by the method of Lowry et al.
(1951) using bovine serum albumin as a standard. In
addition, during the enzyme estimation with speculation
method, the protein elution profile was monitored
spectrometric ally as the absorbance at 660 nm.
Catalase Estimation:
The catalase activity was estimated using method of Aebi
et al., 1984. 0.02 ml of red blood cell (Test Sample)
solution was added to 1.580 ml of 50 mM phosphate
buffer (pH 7.0). 0.4 ml of 30 mM hydrogen peroxide
(H2O2) was added and absorbance was followed for 60
sec intervals at 240 nm. The catalase activity was
calculated using the millimolar extinction coefficient of
H2O2 (0.071 mmol cm-1) and the activity was expressed
as micromoles of H2O2 oxidized per minute per
milligram protein.
Catalase Activity: ∆1 - ∆2
0.071 X Volume .of Sample X Protein conc.
Glutathione S Transferase:
GST activity was spectrophotometrically measured at a
wavelength of 340 nm according to the method defined
by Habig et al.1974. Under standard conditions, the
amount of enzyme conjugating one micromole of 1-
chloro-2, 4-dinitrobenzene (CDNB) with Glutathione
(GSH) in one minute was defined as one unit activity
(mmol/L).
GST Activity:
∆2 - ∆1
0.0096 X Volume .of Sample
Total Antioxidants Measurement:
Total Antioxidant activity was spectrophotometrically
identified at 593 nm according to the method defined by
Benzie et al 1996. Total antioxidant activity was given as
mmol/L.
Chemical:
All are chemical were analytically pure and supplied by
the sigma chemical company.
Statistical Analysis:
All parametric data are expressed as the mean and
standard error of mean. The statistical package for the
Graph Pad Prism version 6.04 software were used for
statistical analysis parametric data were evaluated
International Journal of Scientific & Engineering Research, Volume 5, Issue 8,August-2014 ISSN 2229-5518
1128
IJSER © 2014 http://www.ijser.org
IJSER
independent sample t- test value ≤ 0.05 was considered
as significant.
RESULTS
Hundred patients of type2diabetes mellitus and 100 Healthy as control subjects were recruited for the study of diabetes patients.
Table1. Mean Standard error of mean, CAT, GST and
TAC levels of Type2Diabetes and controls.
Mean/SEM
Patients(n=100)
Mean/SEM
Healthy(n=100)
P
Total
Protein
Level
(mg/ml)
11.09± 1.944 9.702± 0.6822 0.0002
Catalase
(U/ml)
0.6283± 0.1209 0.9754±0.1787 0.0005
GST
(μmol/ml
)
61.70± 9.123 55.52± 8.094 0.0001
TAC
(mmol/ml)
17.41± 0.8497 39.58± 2.061 0.0004
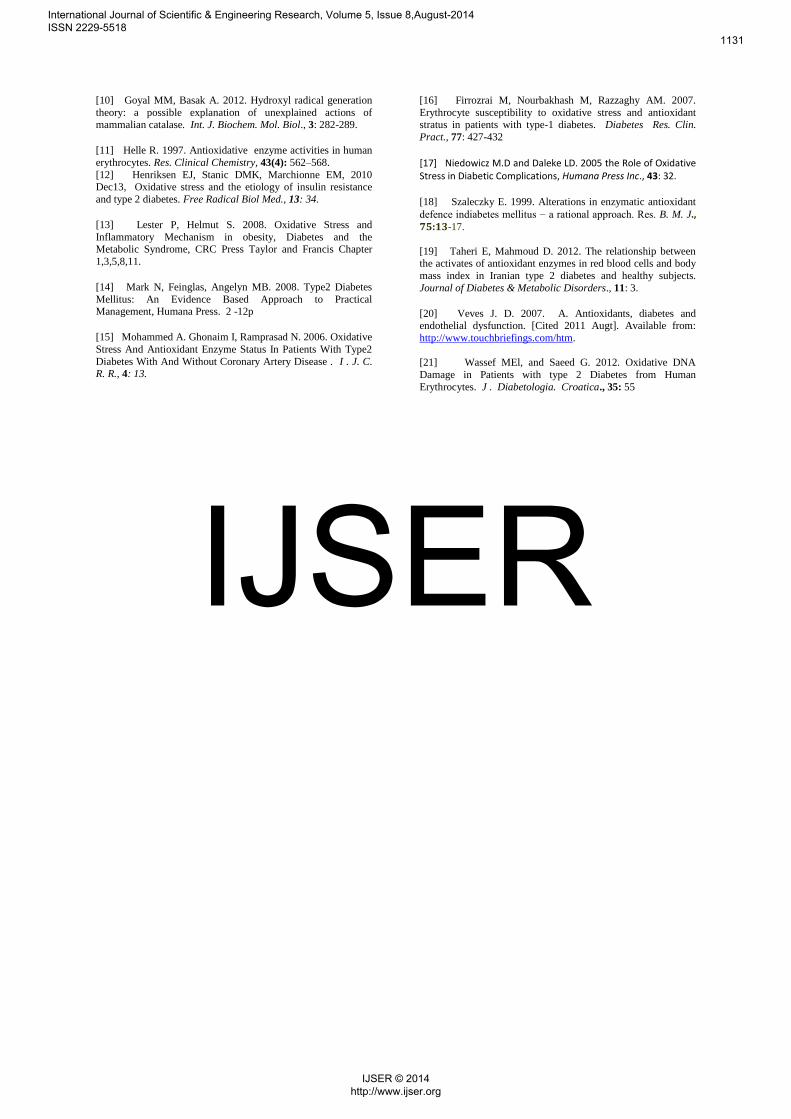
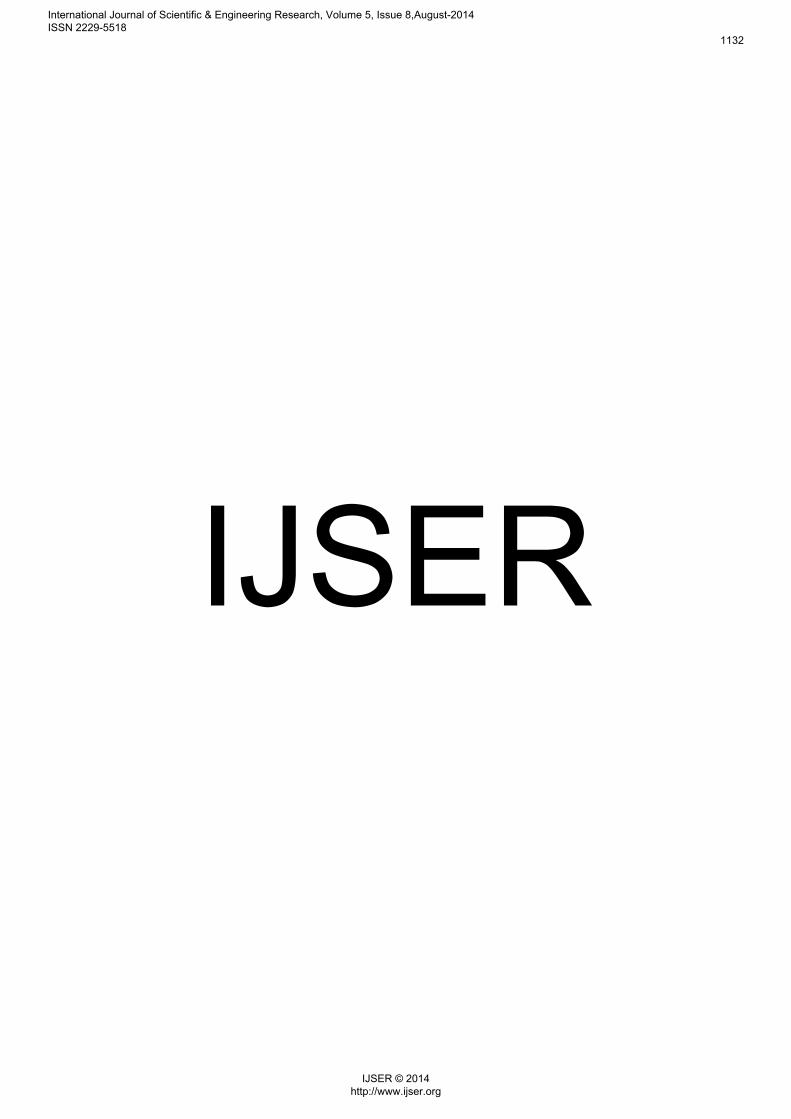
Fig1. Total Protein Level (TPL) in both groups
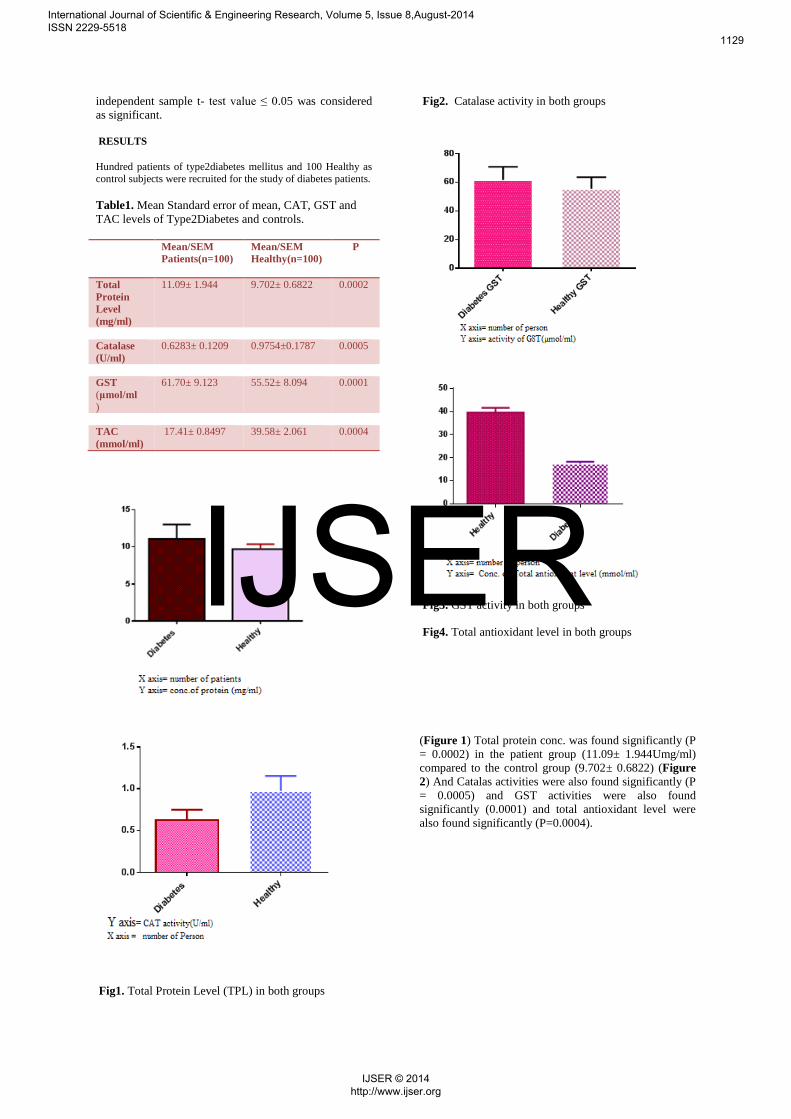
Fig2. Catalase activity in both groups
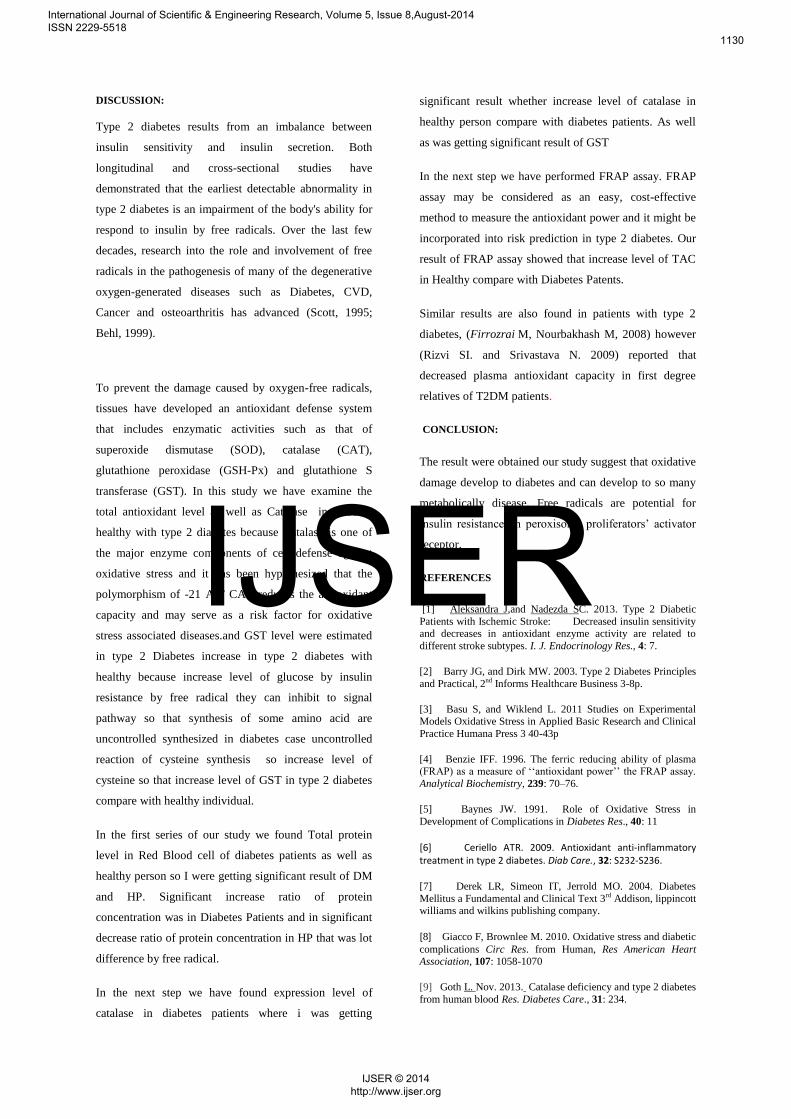
Fig3. GST activity in both groups
Fig4. Total antioxidant level in both groups
(Figure 1) Total protein conc. was found significantly (P
= 0.0002) in the patient group (11.09± 1.944Umg/ml)
compared to the control group (9.702± 0.6822) (Figure
2) And Catalas activities were also found significantly (P
= 0.0005) and GST activities were also found
significantly (0.0001) and total antioxidant level were
also found significantly (P=0.0004).
International Journal of Scientific & Engineering Research, Volume 5, Issue 8,August-2014 ISSN 2229-5518
1129
IJSER © 2014 http://www.ijser.org
IJSER
DISCUSSION:
Type 2 diabetes results from an imbalance between
insulin sensitivity and insulin secretion. Both
longitudinal and cross-sectional studies have
demonstrated that the earliest detectable abnormality in
type 2 diabetes is an impairment of the body's ability for
respond to insulin by free radicals. Over the last few
decades, research into the role and involvement of free
radicals in the pathogenesis of many of the degenerative
oxygen-generated diseases such as Diabetes, CVD,
Cancer and osteoarthritis has advanced (Scott, 1995;
Behl, 1999).
To prevent the damage caused by oxygen-free radicals,
tissues have developed an antioxidant defense system
that includes enzymatic activities such as that of
superoxide dismutase (SOD), catalase (CAT),
glutathione peroxidase (GSH-Px) and glutathione S
transferase (GST). In this study we have examine the
total antioxidant level as well as Catalase increase in
healthy with type 2 diabetes because Catalase is one of
the major enzyme components of cell defense against
oxidative stress and it has been hypothesized that the
polymorphism of -21 A/T CAT reduces the antioxidant
capacity and may serve as a risk factor for oxidative
stress associated diseases.and GST level were estimated
in type 2 Diabetes increase in type 2 diabetes with
healthy because increase level of glucose by insulin
resistance by free radical they can inhibit to signal
pathway so that synthesis of some amino acid are
uncontrolled synthesized in diabetes case uncontrolled
reaction of cysteine synthesis so increase level of
cysteine so that increase level of GST in type 2 diabetes
compare with healthy individual.
In the first series of our study we found Total protein
level in Red Blood cell of diabetes patients as well as
healthy person so I were getting significant result of DM
and HP. Significant increase ratio of protein
concentration was in Diabetes Patients and in significant
decrease ratio of protein concentration in HP that was lot
difference by free radical.
In the next step we have found expression level of
catalase in diabetes patients where i was getting
significant result whether increase level of catalase in
healthy person compare with diabetes patients. As well
as was getting significant result of GST
In the next step we have performed FRAP assay. FRAP
assay may be considered as an easy, cost-effective
method to measure the antioxidant power and it might be
incorporated into risk prediction in type 2 diabetes. Our
result of FRAP assay showed that increase level of TAC
in Healthy compare with Diabetes Patents.
Similar results are also found in patients with type 2
diabetes, (Firrozrai M, Nourbakhash M, 2008) however
(Rizvi SI. and Srivastava N. 2009) reported that
decreased plasma antioxidant capacity in first degree
relatives of T2DM patients.
CONCLUSION:
The result were obtained our study suggest that oxidative
damage develop to diabetes and can develop to so many
metabolically disease. Free radicals are potential for
insulin resistance on peroxisome proliferators’ activator
receptor.
REFERENCES
[1] Aleksandra J,and Nadezda SC. 2013. Type 2 Diabetic
Patients with Ischemic Stroke: Decreased insulin sensitivity and decreases in antioxidant enzyme activity are related to
different stroke subtypes. I. J. Endocrinology Res., 4: 7.
[2] Barry JG, and Dirk MW. 2003. Type 2 Diabetes Principles
and Practical, 2nd Informs Healthcare Business 3-8p.
[3] Basu S, and Wiklend L. 2011 Studies on Experimental Models Oxidative Stress in Applied Basic Research and Clinical
Practice Humana Press 3 40-43p
[4] Benzie IFF. 1996. The ferric reducing ability of plasma (FRAP) as a measure of ‘‘antioxidant power’’ the FRAP assay.
Analytical Biochemistry, 239: 70–76.
[5] Baynes JW. 1991. Role of Oxidative Stress in
Development of Complications in Diabetes Res., 40: 11
[6] Ceriello ATR. 2009. Antioxidant anti-inflammatory treatment in type 2 diabetes. Diab Care., 32: S232-S236.
[7] Derek LR, Simeon IT, Jerrold MO. 2004. Diabetes
Mellitus a Fundamental and Clinical Text 3rd Addison, lippincott williams and wilkins publishing company.
[8] Giacco F, Brownlee M. 2010. Oxidative stress and diabetic
complications Circ Res. from Human, Res American Heart Association, 107: 1058-1070
[9] Goth L. Nov. 2013. Catalase deficiency and type 2 diabetes
from human blood Res. Diabetes Care., 31: 234.
International Journal of Scientific & Engineering Research, Volume 5, Issue 8,August-2014 ISSN 2229-5518
1130
IJSER © 2014 http://www.ijser.org
IJSER
[10] Goyal MM, Basak A. 2012. Hydroxyl radical generation
theory: a possible explanation of unexplained actions of mammalian catalase. Int. J. Biochem. Mol. Biol., 3: 282-289.
[11] Helle R. 1997. Antioxidative enzyme activities in human
erythrocytes. Res. Clinical Chemistry, 43(4): 562–568.
[12] Henriksen EJ, Stanic DMK, Marchionne EM, 2010 Dec13, Oxidative stress and the etiology of insulin resistance
and type 2 diabetes. Free Radical Biol Med., 13: 34.
[13] Lester P, Helmut S. 2008. Oxidative Stress and
Inflammatory Mechanism in obesity, Diabetes and the Metabolic Syndrome, CRC Press Taylor and Francis Chapter
1,3,5,8,11.
[14] Mark N, Feinglas, Angelyn MB. 2008. Type2 Diabetes
Mellitus: An Evidence Based Approach to Practical Management, Humana Press. 2 -12p
[15] Mohammed A. Ghonaim I, Ramprasad N. 2006. Oxidative
Stress And Antioxidant Enzyme Status In Patients With Type2
Diabetes With And Without Coronary Artery Disease . I . J. C. R. R., 4: 13.
[16] Firrozrai M, Nourbakhash M, Razzaghy AM. 2007.
Erythrocyte susceptibility to oxidative stress and antioxidant stratus in patients with type-1 diabetes. Diabetes Res. Clin.
Pract., 77: 427-432
[17] Niedowicz M.D and Daleke LD. 2005 the Role of Oxidative Stress in Diabetic Complications, Humana Press Inc., 43: 32.
[18] Szaleczky E. 1999. Alterations in enzymatic antioxidant
defence indiabetes mellitus − a rational approach. Res. B. M. J., 75:13-17.
[19] Taheri E, Mahmoud D. 2012. The relationship between the activates of antioxidant enzymes in red blood cells and body
mass index in Iranian type 2 diabetes and healthy subjects.
Journal of Diabetes & Metabolic Disorders., 11: 3.
[20] Veves J. D. 2007. A. Antioxidants, diabetes and endothelial dysfunction. [Cited 2011 Augt]. Available from:
http://www.touchbriefings.com/htm.
[21] Wassef MEl, and Saeed G. 2012. Oxidative DNA
Damage in Patients with type 2 Diabetes from Human
Erythrocytes. J . Diabetologia. Croatica., 35: 55
International Journal of Scientific & Engineering Research, Volume 5, Issue 8,August-2014 ISSN 2229-5518
1131
IJSER © 2014 http://www.ijser.org
IJSER
International Journal of Scientific & Engineering Research, Volume 5, Issue 8,August-2014 ISSN 2229-5518
1132
IJSER © 2014 http://www.ijser.org
IJSER