Embed Size (px)
Citation preview
Marine Biology 110, 37-47 (1991)
Marine . . . . . . . . . . . . . . . . . Biology
@ Springer-Verlag 1991
Oxygen and carbon stable isotopes in the otoliths of wild and laboratory-reared Australian salmon (Arripis trutta) J .M. Kalish *
Department of Zoology, University of Tasmania, G.P.O. Box 252C, Hobart, Tasmania 7001, Australia
Date of final manuscript acceptance: March 27, 1991. Communicated by G. E Humphrey, Sydney
Abstract. Australian salmon, Arripis trutta, collected from the east coast of Tasmania, Australia, in 1987, were weighed and measured and their otoliths marked by im- mersing fish in an oxytetracycline hydrochloride/seawa- ter solution before placement in constant-temperature aquaria. Individual somatic and otolith growth rates were determined for input into mass balance models. Mass balance models were used to determine the oxygen and carbon isotopic composition of otolith material pro- duced during captivity. There was a significant relation- ship between filsO measured in the otolith aragonite and ambient temperature (r 2 = 0.77). The linear relationship between these data, where 6180 = 6.69 - 0.326 (T, °C), was not significantly different from a relationship indica- tive of equilibrium deposition of oxygen isotopes in aragonite. Otolith carbon was significantly depleted in 13C relative to equilibrium deposition, with depletions > 6.0%o at all temperatures. There was no relationship between 6~3C and temperature. It was estimated that > 30% of the otolith carbon was from metabolically derived sources. Significant differences in otolith carbon isotopes among wild juvenile Australian salmon were hy- pothesised to be attributable to differences in diet. Levels of variability for both oxygen and carbon isotopes in laboratory-maintained and wild fish were similar to that found by other researchers for foraminifera and these results highlight the importance of large sample sizes when estimating environmental temperatures from oxy- gen isotopes measured in fish otoliths.
Introduction
Oxygen- and carbon-isotope chemistry of biogenic calci- um carbonate is a powerful tool in studies of ocean palaeoenvironments and the life histories of marine or- ganisms, and may be a valuable source of information in
* Present address: MAF Fisheries, Greta Point, P.O. Box 297, Wellington, New Zealand
studies offish biology. Data on the oxygen isotopic com- position of carbonates can be used to estimate the tem- peratures at which carbonates were formed. Carbon-iso- tope data from biogenic calcium carbonate can provide information relating to metabolic processes and the sources of carbon involved in calcification (Craig 1953, Tanaka et al. 1986, Spero and Willams 1988). Stable iso- topes may be useful in determining the ages of marine animals by helping to discern seasonal cycles of tempera- ture, approximating past environmental temperatures ex- perienced by an individual, and in investigations of growth rates, metabolism and diet. Data on oxygen and carbon stable isotopes in carbonates have been applied to investigations of the biology of corals (Weber and Wood- head 1970), foraminifera (Spero and Williams 1988), gas- tropods (Killingley and Rex 1985), cephalopods (Taylor and Ward 1983), whales (Killingley 1980) and turtles (Killingley and Lutcavage 1983), to mention a few. Sever- al studies have investigated, albeit briefly, the isotopic composition of fish otoliths, primarily to aid in develop- ing an understanding of fish biology (Devereux 1967, Degens et al. 1969, Mulcahy et al. 1979, Radtke 1984a, Radtke et al. 1987). Only one of these studies (Radtke 1984a) included any laboratory-controlled validation. Furthermore, isotopic studies of fish otoliths have been flawed by use of inappropriate equations for conversion of 6180 data to temperature, and this has resulted in the incorrect interpretation of data in relation to both envi- ronmental temperature and isotopic fractionation. Rela- tively little attention has been given to the significance of 613C values obtained from fish otoliths. Degens et al. (1969) stated that fish otolith aragonite was derived, al- most exclusively, from seawater bicarbonate, whereas Radtke (1984 a, 1987) concluded that metabolic process- es resulted in the fractionation of carbon isotopes in fish otoliths. Further investigations of stable isotopes in fish otoliths are required to clarify the nature of isotopic frac- tionation in these structures and to determine the utility of isotopic data to studies of fish biology.
This study investigates the stable oxygen and carbon isotopic composition of aragonitic fish otoliths from both
38
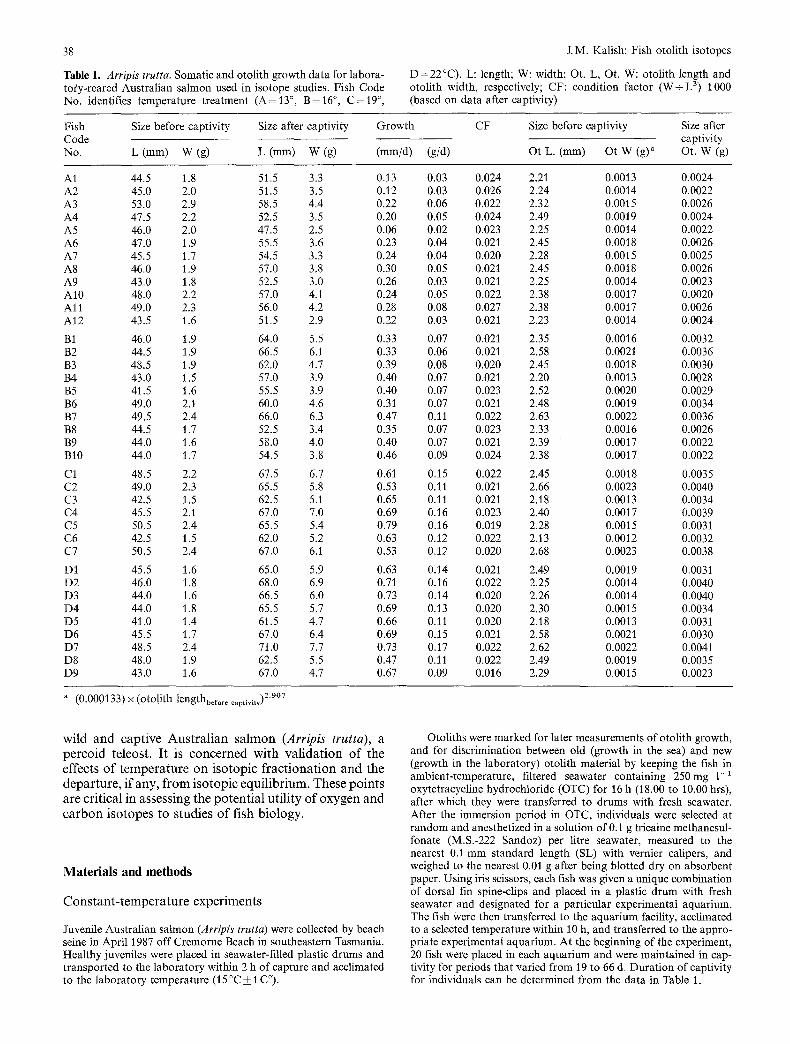
Table 1, Arripis trutta. Somatic and otolith growth data for labora- tory-reared Australian salmon used in isotope studies. Fish Code No. identifies temperature treatment (A=13 °, B=16 °, C = 1 9 °,
J.M. Kalish: Fish otolith isotopes
D=22°C) . L: length; W: width; Ot. L, Ot. W: otolith length and otolith width, respectively; CF: condition factor ( W + L 3) 1000 (based on data after captivity)
Fish Size before captivity Size after captivity Growth Code No. L (mm) W (g) L (mm) W (g) (mm/d) (g/d)
CF Size before captivity Size after captivity
Ot L. (ram) Ot W (g)" Ot. W (g)
A1 44.5 1.8 51.5 3.3 0.13 0.03 A2 45.0 2.0 51.5 3.5 0.12 0.03 A3 53.0 2.9 58.5 4.4 0.22 0.06 A4 47.5 2.2 52.5 3.5 0.20 0.05 A5 46.0 2.0 47.5 2.5 0.06 0.02 A6 47.0 1.9 55.5 3.6 0.23 0.04 A7 45.5 1.7 54.5 3.3 0.24 0.04 A8 46.0 1.9 57.0 3.8 0.30 0.05 A9 43.0 1.8 52.5 3.0 0.26 0.03 A10 48.0 2.2 57.0 4.1 0.24 0.05 A11 49.0 2.3 56.0 4.2 0.28 0.08 A12 43.5 1.6 51.5 2.9 0.22 0.03
B1 46.0 1.9 64.0 5.5 0.33 0.07 B2 44.5 1.9 66.5 6.1 0.33 0.06 B3 48.5 1.9 62.0 4.7 0.39 0.08 B4 43.0 1.5 57.0 3.9 0.40 0.07 B5 41.5 1.6 55.5 3.9 0.40 0.07 B6 49.0 2.1 60.0 4.6 0.31 0.07 B7 49.5 2.4 66.0 6.3 0.47 0.11 B8 44.5 1.7 52.5 3.4 0.35 0.07 B9 44.0 1.6 58.0 4.0 0.40 0.07 B10 44.0 1.7 54.5 3.8 0.46 0.09
C1 48.5 2.2 67.5 6.7 0.61 0.15 C2 49.0 2.3 65.5 5.8 0.53 0.11 C3 42.5 1.5 62.5 5.1 0.65 0.11 C4 45.5 2.1 67.0 7.0 0.69 0.16 C5 50.5 2.4 65.5 5.4 0.79 0.16 C6 42.5 1.5 62.0 5.2 0.63 0.12 C7 50.5 2.4 67.0 6.1 0.53 0.12
DI 45.5 1.6 65.0 5.9 0.63 0.14 D2 46.0 1.8 68.0 6.9 0.71 0.16 D3 44.0 1.6 66.5 6.0 0.73 0.14 D4 44.0 1.8 65.5 5.7 0.69 0.13 D5 41.0 1.4 61.5 4.7 0.66 0.11 D6 45.5 1.7 67.0 6.4 0.69 0.15 D7 48.5 2.4 71.0 7.7 0.73 0.17 D8 48.0 1.9 62.5 5.5 0.47 0.11 D9 43.0 1.6 67.0 4.7 0.67 0.09
0.024 2.21 0.0013 0.0024 0.026 2.24 0.0014 0.0022 0.022 2.32 0.0015 0.0026 0.024 2.49 0.0019 0.0024 0.023 2.25 0.0014 0.0022 0.021 2.45 0.0018 0.0026 0.020 2.28 0.0015 0.0025 0.021 2.45 0.0018 0.0026 0.021 2.25 0.0014 0.0023 0.022 2.38 0.0017 0.0020 0.027 2.38 0.0017 0.0026 0.021 2.23 0.0014 0.0024
0.021 2.35 0.0016 0.0032 0.021 2.58 0.0021 0.0036 0.020 2.45 0.0018 0.0030 0.021 2.20 0.0013 0.0028 0.023 2.52 0.0020 0.0029 0.021 2.48 0.0019 0.0034 0.022 2.63 0.0022 0.0036 0.023 2.33 0.0016 0.0026 0.021 2.39 0.0017 0.0022 0.024 2.38 0.0017 0.0022
0.022 2.45 0.0018 0.0035 0.021 2.66 0.0023 0.0040 0.021 2.18 0.0013 0.0034 0.023 2.40 0.0017 0.0039 0.019 2.28 0.0015 0.0031 0.022 2.13 0.0012 0.0032 0.020 2.68 0.0023 0.0038
0.021 2.49 0.0019 0.0031 0.022 2.25 0.0014 0.0040 0.020 2.26 0.0014 0.0040 0.020 2.30 0.0015 0.0034 0.020 2.18 0.0013 0.0031 0.021 2.58 0.0021 0.0030 0.022 2.62 0.0022 0.0041 0.022 2.49 0.0019 0.0035 0.016 2.29 0.0015 0.0023
a (0.000133) x (oto!ith lengthbe f . . . . . tivity) 2'907 • p
wild a n d c a p t i v e A u s t r a l i a n s a l m o n (Arripis trutta), a p e r c o i d te leost . I t is c o n c e r n e d w i t h v a l i d a t i o n o f the effects o f t e m p e r a t u r e on i s o t o p i c f r a c t i o n a t i o n a n d the d e p a r t u r e , i f any , f r o m i s o t o p i c e q u i l i b r i u m . T h e s e p o i n t s a r e c r i t ica l in assess ing the p o t e n t i a l u t i l i ty o f o x y g e n a n d c a r b o n i so topes to s tudies o f f ish b io logy .
M a t e r i a l s a n d m e t h o d s
C o n s t a n t - t e m p e r a t u r e e x p e r i m e n t s
Juvenile Australian salmon (Arripis trutta) were collected by beach seine in April 1987 off Cremorne Beach in southeastern Tasmania. Healthy juveniles were placed in seawater-filled plastic drums and transported to the laboratory within 2 h of capture and acclimated to the laboratory temperature (15 °C_+ 1 C°).
Otoliths were marked for later measurements of otolith growth, and for discrimination between old (growth in the sea) and new (growth in the laboratory) otolith material by keeping the fish in ambient-temperature, filtered seawater containing 250mg 1-1 oxytetracycline hydrochloride (OTC) for 16 h (18.00 to 10.00 hrs), after which they were transferred to drums with fresh seawater. After the immersion period in OTC, individuals were selected at random and anesthetized in a solution of 0.1 g tricaine methanesul- fonate (M.S.-222 Sandoz) per litre seawater, measured to the nearest 0.1 mm standard length (SL) with vernier calipers, and weighed to the nearest 0.01 g after being blotted dry on absorbent paper. Using iris scissors, each fish was given a unique combination of dorsal fin spine-clips and placed in a plastic drum with fresh seawater and designated for a particular experimental aquarium. The fish were then transferred to the aquarium facility, acclimated to a selected temperature within 10 h, and transferred to the appro- priate experimental aquarium. At the beginning of the experiment, 20 fish were placed in each aquarium and were maintained in cap- tivity for periods that varied from 19 to 66 d. Duration of captivity for individuals can be determined from the data in Table 1.
J.M. Kalish: Fish otolith isotopes
Constant-temperature rearing experiments were carried out with one aquarium each at 13.0, 16.0, 19.0 and 22.0 °C _+ 0.2C ° and 34.8 _+ 0.2%0 S. A 14 h light: 10 h dark photoperiod was provided, incorporating a gradual change from light to dark, with light inten- sities of 2000 and <20 lx, respectively. Fish were maintained in 250-1itre insulated, opaque polypropylene aquaria with separate recirculating water-filter systems and temperature control. Temper- ature was recorded twice each day and pH, salinity, ammonia, nitrite, nitrate and phosphate levels were determined once each week. Before experimental fish were placed in aquaria, ammonia and nitrite-nitrogen levels were stabilized below 1.0 mg 1-1, while pH fluctuated between 7.8 and 8.1. A 10% water change was carried out each day in order to maintain water quality.
Fish were fed to satiation once each morning (09.00 hrs) with freshly caught live mysids, predominantly Tenagomysis sp., a regu- lar item in the diet of Australian salmon• There were no fish mortal- ities during the course of these constant-temperature experiments. At the end of each experiment, fish were killed in a benzocaine/sea- water solution, weighed, measured and then frozen for later extrac- tion of sagittal otoliths.
Sagittae were extracted from thawed specimens, the adhering otolith capsule was removed using fine forceps, and the otoliths were further cleaned in a sodium hypochlorite solution (12 g 1- available chlorine), then ultrasonically cleaned in deionized water and finally rinsed several times in deionized water. Cleaned otoliths were placed on glass slides and oven-dried at 50 °C for 10 h. After cleaning and drying, otolith rostral length was measured to the nearest 0.01 mm with a binocular microscope equipped with a graticule, and otolith weight was determined to the nearest 0.1 mg. Otoliths were stored in glass vials in a light-proof box.
Due to minimum sample-size requirements of the available sta- ble isotope mass spectrometer (1.5 mg), it was necessary to use a mass balance relationship to determine the composition of the otolith material formed in captivity. Therefore, before further sam- ple-processing, whole otoliths were observed using both reflected and transmitted light with a binocular dissecting microscope and with incident ultraviolet light excitation on a Leitz Diaplan micro- scope, to determine the rostral length of otoliths before the fish were placed in aquaria. The fluorescence microscope was equipped with a PLOEMOPAK 4 incident-light illuminator and OTC bands in the otoliths were made visible with a D filter block incorporating a 355 to 425 nm excitation filter, a 455 nm dichroic mirror and 460 nm barrier filter (Leitz-Wetzlar). New otolith material formed in captiv- ity at all four temperatures was discriminated from older material laid down before the captive phase as a transparent hyaline zone with transmitted light illumination. Material produced in the period before capture was generally opaque in transmitted light. Otolith size before captivity could be determined both by visualization of the fluorescent band resulting from immersion offish in OTC before fish were put into the aquaria and the presence of the capture check mark (a highly opaque zone of about 15/~m width) between the old and new growth material.
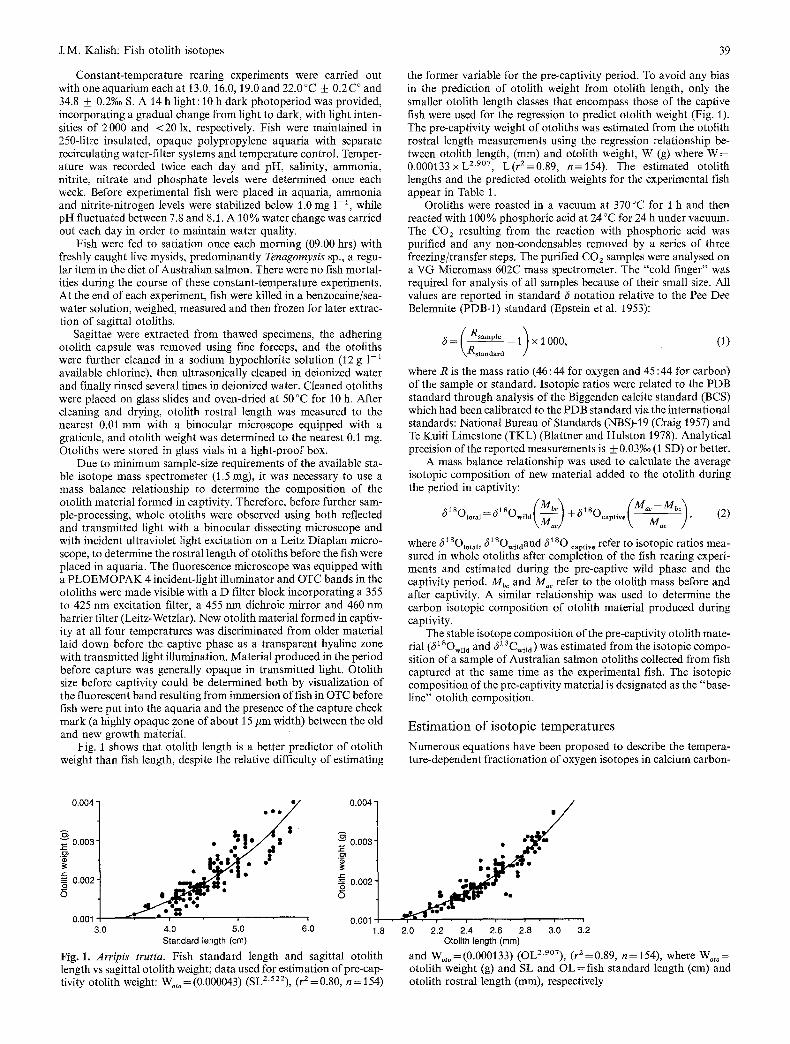
Fig. 1 shows that otolith length is a better predictor of otolith weight than fish length, despite the relative difficulty of estimating
39
the former variable for the pre-captivity period• To avoid any bias in the prediction of otolith weight from otolith length, only the smaller otolith length classes that encompass those of the captive fish were used for the regression to predict otolith weight (Fig. 1). The pre-captivity weight of otoliths was estimated from the otolith rostral length measurements using the regression relationship be- tween otolith length, (ram) and otolith weight, W (g) where W = 0.000133 x L 2"907, L(r /=0 .89 , n=154). The estimated otolith lengths and the predicted otolith weights for the experimental fish appear in Table 1.
Otoliths were roasted in a vacuum at 370 °C for 1 h and then reacted with 100% phosphoric acid at 24 °C for 24 h under vacuum. The CO 2 resulting from the reaction with phosphoric acid was purified and any non-condensables removed by a series of three freezing/transfer steps. The purified CO z samples were analysed on a VG Micromass 602C mass spectrometer. The "cold finger" was required for analysis of all samples because of their small size. All values are reported in standard h notation relative to the Pee Dee Belemnite (PDB-1) standard (Epstein et al. 1953):
& = ( Rsample --13 X 1000, (1) \Rstandard /
where R is the mass ratio (46 : 44 for oxygen and 45 : 44 for carbon) of the sample or standard. Isotopic ratios were related to the PDB standard through analysis of the Biggenden calcite standard (BCS) which had been calibrated to the PDB standard via the international standards: National Bureau of Standards (NBS)-19 (Craig 1957) and Te Kuiti Limestone (TKL) (Blattner and Hnlston 1978). Analytical precision of the reported measurements is _+0.03%0 (1 SD) or better.
A mass balance relationship was used to calculate the average isotopic composition of new material added to the otolith during the period in captivity:
8 18 fMbc'~ 1 s [M,c -- Mb~'X Ototal:l~ Owild~ac)-}-(~ O c a p t i v e l \ M a c / , - -] (2)
18 where c51SOtot,l, 6~SOwilaand 6 O cap,vo refer to isotopic ratios mea- sured in whole otoliths after completion of the fish rearing experi- ments and estimated during the pre-captive wild phase and the captivity period. Mbc and Mac refer to the otolith mass before and after captivity. A similar relationship was used to determine the carbon isotopic composition of otolith material produced during captivity.
The stable isotope composition of the pre-captivity otolith mate- rial (6 ~ SOwil a and b 13Cwil d ) was estimated from the isotopic compo- sition of a sample of Australian salmon otoliths collected from fish captured at the same time as the experimental fish. The isotopic composition of the pre-captivity material is designated as the "base- line" otolith composition.
Estimation of isotopic temperatures Numerous equations have been proposed to describe the tempera- ture-dependent fractionation of oxygen isotopes in calcium carbon-
°°°41 10-003 0.004" o o o
~_ 0.003 • • o ° ° 7 ill E
$ • 8
x= .lz
0.001 | ""~">vm ° °~'e 0.001 / '0" 3.0 4. 5.0 6.0 1.8 Standard length (cm)
Fig. 1. Arripis trutta. Fish standard length and sagittal otolith length vs sagittal otolith weight; data used for estimation of pre-cap- tivity otolith weight: Wot o = (0.000043) (SLZ522), (r2= 0.80, n = 154)
S • o o
0 " °
".:u,~,t
• i • i , J , , - i , i
2.0 2.2 2.4 2.6 2.8 3.0 3.2 Otolith length (ram)
and Wot o = (0.000133) (OL2'9°7), (r 2 =0.89, n= 154), where Wot o = otolith weight (g) and SL and OL = fish standard length (cm) and otolith rostral length (ram), respectively
40
ate. This study employs the empirical relationship derived by Gross- man (1982) using the aragonitic foraminiferan Hoeglundina elegans to calculate isotopic temperatures:
T(°C)=20.19 -4.56(61SOar-5180~)
+0.19 (6180,~--6180~) 2 , (3)
where 6 ~ sO,~ and ~ lsO~ represent the oxygen isotopic composition measured in the aragonitic sample and the oxygen isotopic compo- sition of the seawater from which the aragonite was precipitated, respectively. The b~80 of aragonite formed in equilibrium with seawater is a function of the water temperature and the seawater c51sO, respresented as 6 w in palaeotemperature equations such as the one above.
The 6w factor that appears in palaeotemperature equations is often a source of confusion and can result in significant errors when applying the palaeoternperature equation or when considering devi- ations from equilibrium precipitation. The value ~ refers to the oxygen isotopic composition of CO 2 gas equilibrated with the water sample relative to the isotopic composition of a sample of CO 2 produced by the reaction of the international standard PDB calcite with 100% phosphoric acid at 25 °C. If the relationship between 61 s O and salinity from Epstein and Mayeda (I 953) is used, then the resulting value does not require conversion to 6~ because Epstein and Mayeda used CO 2 produced from the acidification of PDB with phosphoric acid at 25 °C as their standard. In many cases, such as the present study and that of Romanek et al. (1987), the 6~80 and salinity data from Craig and Gordon (1965) are used to estimate seawater c51sO. Craig and Gordon reported their data relative to CO2 equilibrated with "standard mean ocean water" (SMOW) at 25 °C and, therefore it is necessary to convert 6 ~ 8OsMow to c5 W before using palaeotemperature equations. The relationship between 6*8OsMow and c5 is (Friedman and O'Neil 1977):
6w = 0.99978 (c51SOsMow) _ 0.22. (4)
In order to measure the 6180 and 6~3C of water it is necessary to equilibrate a volume of carbon dioxide gas with the water sample and then analyse an aliquot of the gas (Epstein and Mayeda 1953, Kroopnick 1974), but facilities for this type of analysis were not available. Alternatively, the 6 ~ 80 of seawater can be estimated from the known relationship between 6180 and salinity. There are no published data relating the ~ ~ 80 and salinity from the Tasman Sea; however, data relating 6lSO to salinity in South Pacific Ocean surface waters (Craig and Gordon 1965) probably provide a suit- able approximation for Tasman Sea surface waters:
61SOsraow = 0.6956 S - 24.04, (5)
where S is equal to salinity (%0) and the 618Osraow value is converted to 6~ as shown in Eq. (4).
C o n t r i b u t i o n o f m e t a b o l i c c a r b o n
It is possible to estimate the percentage of metabolically derived carbon (M%[6 ~ s C]) in the otolith with data on otolith 513C, seawa- ter 613C and carbon reservoirs in the form of metabolic carbon using a mass balance model:
~)13Coto:(~13Cbsw+C,s_b)( 1 M°/° [~ 13C1) , ~ J
1- . / M % [al~C]\ + ( 3 ' C .. . . +e~_,) ~ 1 ~ ) ' (6)
where 6 ~ 3Co~o, ~13Cb ' sw and 613C,,,,~ are the carbon isotopic ratios measured in the otolith, seawater bicarbonate and metabolically derived CO2, respectively. The variables g,_ b and e,_~ are fraction- ation factors between HCO~ and C a C O 3 and, CO 2 and CaCOa, respectively (Tanaka et al. 1986). These variables are discussed in greater detail in the following paragraphs. A similar type of rela- tionship has been used by several authors (Weber and Woodhead
J.M. Kalish: Fish otolith isotopes
1970, Williams et al. 1977, 1981, Erez and Honjo 1981) to estimate the contribution of metabolically derived bicarbonate to the make- up of calcium carbonate tests.
The value used for the calcium carbonate-bicarbonate enrich- ment factor, e S b, is from Emrich et al. (1970) as modified by Gross- man (1984b):
2980 es_b(%O ) = 12.40-- T(°K ~ . (7)
Grossman and Ku (1986) empirically determined two equations for lSC fractionation in aragonite, one based on the benthic foraminifera Hoeglundina elegans and the other on coeval molluscs, both of which resulted in 13 C fractionation factors about 3%0 lower than in Eq. (7) above. The lsC fractionation relationships from Grossman and Ku indicate decreasing skeletal b* s C with increasing temperature, whereas Eq. (7) predicts increasing skeletal 6~sC. The use of these two alternate equations for 1 s C fractionation does not result in significant changes in the estimates of the metabolic contri- bution to otolith carbon, but should be considered when discussing deviations from equilibrium fractionation.
The fractionation factor between aqueous COz and CaCO 3 (as_b) involves two steps, as CaCO 3 is actually formed from bicar- bonate and calcium ions. Therefore, it is necessary to sum a,_b, just discussed, and ab c, the fractionation factor between aqueous CO 2 and HCOf:
es_,=es_b+%_c. (8)
The value for e b c is also temperature-dependent, and was deter- mined from Mook et al. (1974) (see their Table 4) with the relation- ship
%_~=-- - - +24.12%o. (9)
The carbon isotopic composition of Tasman Sea surface water (c~13C~) is estimated to be approximately 2.0%0 using the relation- ship between AOU (apparent oxygen utilisation) and 61sC of the total dissolved CO2 (Kroopnick 1974, Williams et al. 1977). AOU is the difference between the saturated O z content of water at a particular salinity and temperature and the measured 0 2 content (Williams et al. 1977). Surface waters are typically saturated with 0 2 in the first few meters, and this was assumed to be the case for the habitat of juvenile Australian salmon. This is in agreement with values typically measured in surface waters at similar latitudes (Kroopnick 1974, 1980). Because the value of 61sCm~ t (i.e. 613C for metabolic aqueous CO2) cannot be measured directly, the 5saC value obtained from isotopic measurements of whole juvenile Aus- tralian salmon (20.1%o) was used (Fenton 1985).
Results
E s t i m a t i o n o f base l ine 6 l s o a n d ~13C va lues in Arripis trutta
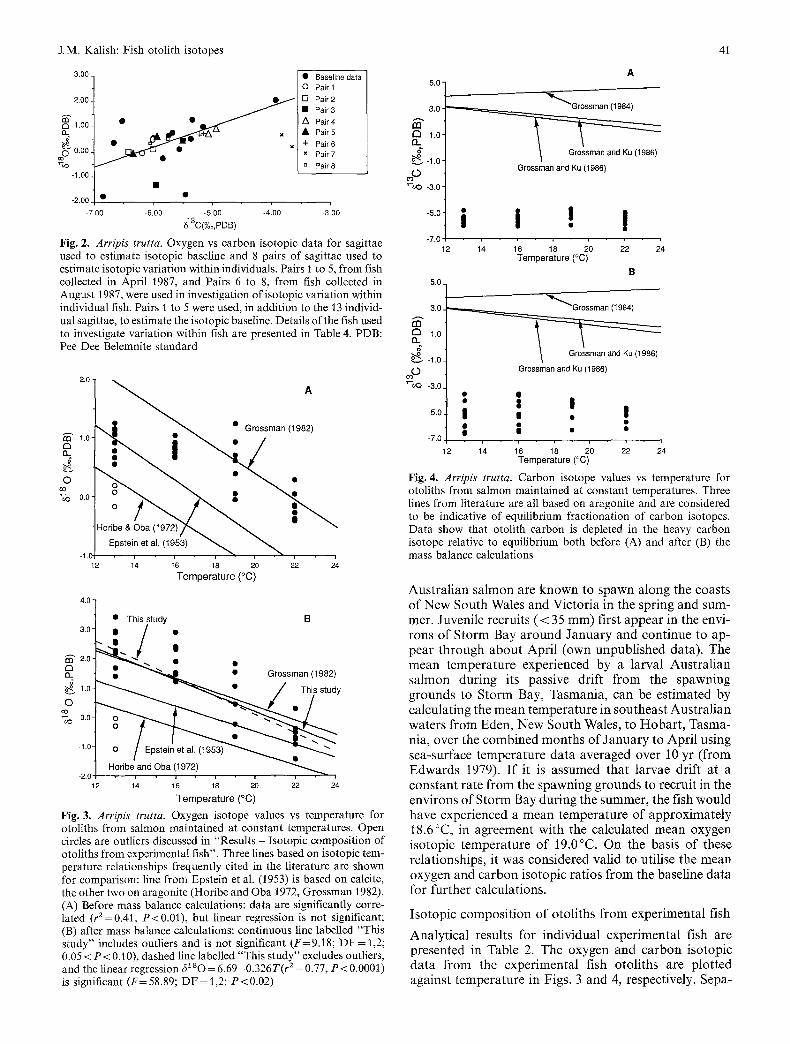
The m e a n o x y g e n a n d c a r b o n i so top ic ra t ios for the base- l ine fish were 0.31_+0.91%o ( n = 2 3 ) a n d -5 .76_+0 .65%0 (n = 23), respect ively. The re were s ign i f i can t v a r i a t i o n s in o x y g e n a n d c a r b o n i so topes f r o m the A u s t r a l i a n s a l m o n o to l i ths u sed to e s t ima te the i so top ic base l ine , w i th sever- al out l ie rs in b o t h o x y g e n a n d c a r b o n i so top ic ra t ios (Fig. 2).
C a l c u l a t i o n o f a m e a n i so top ic t e m p e r a t u r e u s ing oxy- gen i so tope d a t a f r o m the base l ine A u s t r a l i a n s a l m o n a n d the empi r i ca l ly de r ived r e l a t i o n s h i p f r o m G r o s s m a n (1982) for a r a g o n i t e y ie lded a m e a n t e m p e r a t u r e o f 19 .0°C, wh ich w o u l d be w i t h i n the r ange o f expected m e a n t e m p e r a t u r e s exper i enced b y these j u v e n i l e fish.
J.M. Kalish: Fish otolith isotopes
3.00.
2.00.
m 1.00. Q. S
~ 0.00.
-1.00.
-2.00 • •
• Baseline data O Pair 1
[ ] Pair 2 • Pair 3
A Pair 4 • Pair 5
+ Pair 6 x Pair 7
[] Pair 8
-700 -6;00 -5;0o -4100 -3100 813C(%o,PDB)
Fig. 2. Arripis trutta. Oxygen vs carbon isotopic data for sagittae used to estimate isotopic baseline and 8 pairs of sagittae used to estimate isotopic variation within individuals. Pairs 1 to 5, from fish collected in April 1987, and Pairs 6 to 8, from fish collected in August 1987, were used in investigation of isotopic variation within individual fish. Pairs 1 to 5 were used, in addition to the 13 individ- ual sagittae, to estimate the isotopic baseline• Details of the fish used to investigate variation within fish are presented in Table 4. PDB: Pee Dee Belemnite standard
2 . 0 -
1.0 C3 13-
G
O co
~,o 0 . 0
-1.0 12
. '7 A • • • Grossman (1982)
% . . . . :
o f - . , . - ,-...
L ",., . '>., 14 16 18 20 22 24
Temperature (°C)
4 . 0 -
3.0-
~" 2.o- £3 IX.
G 1.0-
0.0- e,o
-1 .0-
-2.0
• This study B
|
,~_ ~ - " ~ ' ~ I Grossman (1982)
, / Thisstody
O a(,1972) . . . . . - 7 " > - , 12 14 16 18 20 22 24
Temperature (°C)
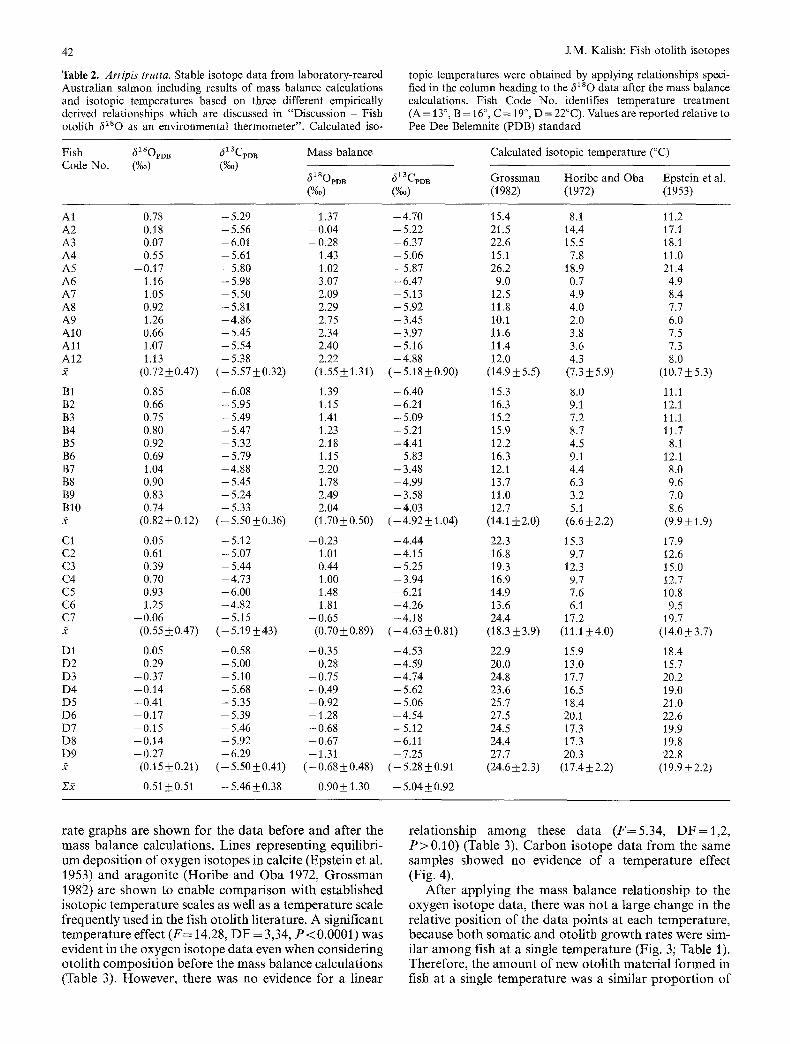
Fig. 3. Arr ip is trutta. Oxygen isotope values vs temperature for otoliths from salmon maintained at constant temperatures. Open circles are outliers discussed in "Results - Isotopic composition of otoliths from experimental fish". Three lines based on isotopic tem- perature relationships frequently cited in the literature are shown for comparison: line from Epstein et al. (1953) is based on calcite, the other two on aragonite (Horibe and Oba 1972, Grossman 1982). (A) Before mass balance calculations: data are significantly corre- lated (r z =0.41, P < 0.01), but linear regression is not significant; (B) after mass balance calculations: continuous line labelled "This study" includes outliers and is not significant (F=9.18; D F = 1,2; 0.05 < P < 0.10), dashed line labelled "This study" excludes outliers, and the linear regression c5180 = 6.69 - 0.326 T (r 2 = 0•77, P < 0.0001) is significant ( F = 58.89; D F = 1,2; P<0 .02 )
41
5.0-
3.0-
m t~ 1.0- 13.
J -1 .0 -
~e,O -3.0 -
-5.0"
A
\ Grossman and Ku (1986)
Grossman and Ku (1986)
i i ! ! -7£
12 14 16 18 20 22 24 Temperature (°C)
B 5.0
3 . 0 ~
123
~ 1.0] 1 o~ssmanandKu(19~6 ) G r -I .0 Grossman and Ku (1986)
"1 ~.O -3.0
-5.0
-7.0
: I i I , . I
II O • -
12 14 16 18 20 22 24 Temperature (°C)
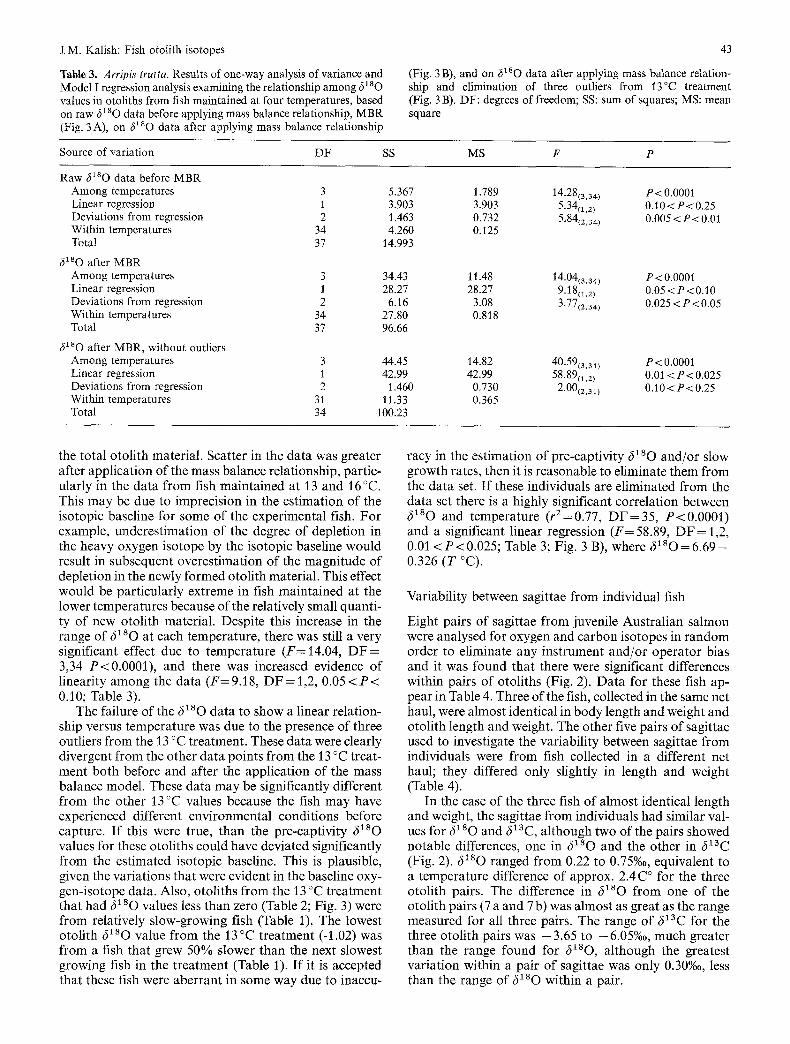
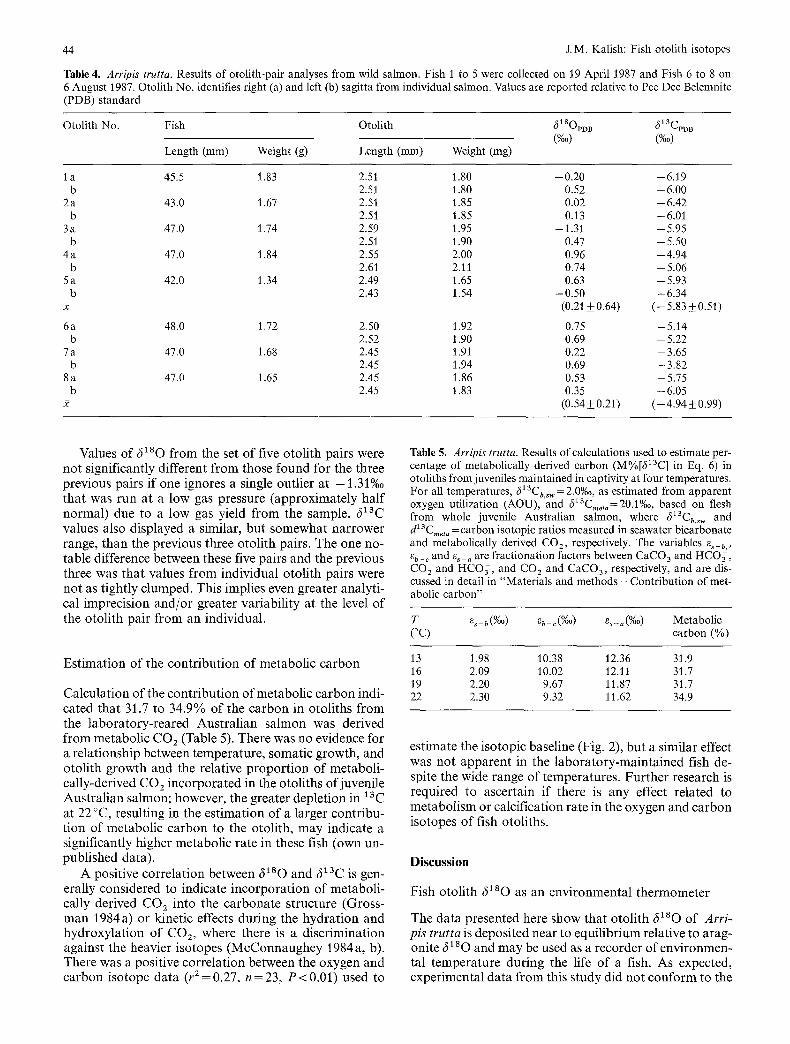
Fig. 4. Arripis trutta. Carbon isotope values vs temperature for otoliths from salmon maintained at constant temperatures• Three lines from literature are all based on aragonite and are considered to be indicative of equilibrium fractionation of carbon isotopes. Data show that otolith carbon is depleted in the heavy carbon isotope relative to equilibrium both before (A) and after (B) the mass balance calculations
Australian salmon are known to spawn along the coasts of New South Wales and Victoria in the spring and sum- mer. Juvenile recruits ( < 35 mm) first appear in the envi- rons of Storm Bay around January and continue to ap- pear through about April (own unpublished data). The mean temperature experienced by a larval Australian salmon during its passive drift f rom the spawning grounds to Storm Bay, Tasmania, can be estimated by calculating the mean temperature in southeast Australian waters f rom Eden, New South Wales, to Hobar t , Tasma- nia, over the combined months of January to April using sea-surface temperature data averaged over 10 yr (from Edwards 1979). I f it is assumed that larvae drift at a constant rate f rom the spawning grounds to recruit in the environs of Storm Bay during the summer, the fish would have experienced a mean temperature of approximately 18.6 °C, in agreement with the calculated mean oxygen isotopic temperature of 19.0°C. On the basis of these relationships, it was considered valid to utilise the mean oxygen and carbon isotopic ratios f rom the baseline data for further calculations.
Isotopic composit ion of otoliths f rom experimental fish
Analytical results for individual experimental fish are presented in Table 2. The oxygen and carbon isotopic data f rom the experimental fish otoliths are plotted against temperature in Figs. 3 and 4, respectively. Sepa-
42
Table 2. Arrip& trutta. Stable isotope data from laboratory-reared Australian salmon including results of mass balance calculations and isotopic temperatures based on three different empirically derived relationships which are discussed in "Discussion - Fish otolith 6180 as an environmental thermometer". Calculated ±so-
J.M. Kalish: Fish otolith isotopes
topic temperatures were obtained by applying relationships speci- fied in the column heading to the 6180 data after the mass balance calculations. Fish Code No. identifies temperature treatment (A= 13 °, B = 16 °, C = 19 °, D = 22°C). Values are reported relative to Pee Dee Belemnite (PDB) standard
Fish 61sopi~ 513CpDB Mass balance Code No. (%0) (%0)
61sopoB 613Cm B (%0) (%0)
Calculated isotopic temperature (°C)
Grossman Horibe and Oba Epstein et al. (1982) (1972) (1953)
AI 0.78 - 5.29 A2 0.18 -5 .56 A3 0.07 -6.01 A4 0.55 - 5 . 6 i A5 -0 .17 -5 .80 A6 1.16 -5 .98 A7 1.05 - 5.50 A8 0.92 - 5.81 A9 1.26 -4 .86 A10 0.66 - 5.45 A l l 1.07 - 5.54 A12 1.13 -5 .38 :~ (0.72_+0.47) (-5.57_+0.32
B1 0.85 -6 .08 B2 0.66 - 5.95 B3 0.75 - 5.49 B4 0.80 - 5.47 B5 0.92 - 5.32 B6 0.69 - 5.79 B7 1.04 -4 .88 B8 0.90 - 5.45 B9 0.83 - 5.24 BI0 0.74 -5 .33 2 (0.82_+0.12) (-5.50_+0.36
C1 0.05 - 5.12 C2 0.61 - 5.07 C3 0.39 - 5.44 C4 0.70 - 4.73 C5 0.93 -6 .00 C6 1.25 -4 .82 C7 -0 .06 -5 .15 2 (0.55-t-0.47) (--5.19_+43)
D1 0.05 -0 .58 D2 0.29 - 5.00 D3 -0 .37 -5 .10 D4 -0 .14 -5 .68 D5 -0 .41 -5 .35 D6 -0 .17 -5 .39 D7 -0 .15 -5 .46 D8 -0 .14 -5 .92 D9 - 0.27 - 6.29 2 (0.15_+0.21) (--5.50_+0.41
212 0.51 +0.51 - 5.46-+0.38
1.37 -4 .70 15.4 8.1 11.2 - 0.04 - 5.22 21.5 14.4 17.1 -0 .28 -6 .37 22.6 15.5 18.1
1.43 - 5.06 15.1 7.8 11.0 - 1.02 -5 .87 26.2 18.9 21.4
3.07 - 6.47 9.0 0.7 4.9 2.09 -5 .13 12.5 4.9 8.4 2.29 - 5.92 11.8 4.0 7.7 2.75 -3 .45 10.1 2.0 6.0 2.34 -3 .97 11.6 3.8 7.5 2.40 - 5.16 11.4 3.6 7.3 2.22 --4.88 12.0 4.3 8.0
(1.55_+1.31) (--5.18_+0.90) (14.9_+5.5) (7.3_+5.9) (10.7_+5.3)
1.39 -6 .40 15.3 8.0 11.1 1.15 -6 .21 16.3 9.1 12.1 1.41 - 5.09 15.2 7.2 11.1 1.23 --5.21 15.9 8.7 11.7 2.18 --4.41 12.2 4.5 8.1 1.15 --5.83 16.3 9.1 12.1 2.20 -- 3.48 12.1 4.4 8.0 1.78 --4.99 13.7 6.3 9.6 2.49 --3.58 11.0 3.2 7.0 2.04 -4 .03 12.7 5.1 8.6
(1.70+_0.50) (--4.92_+1.04) (14.1_+2.0) (6.6±2.2) (9.9_+1.9)
--0.23 --4.44 22.3 15.3 17.9 1.01 --4.15 16.8 9.7 12.6 0.44 -- 5.25 19.3 12.3 15.0 1.00 -- 3.94 16.9 9.7 12.7 1.48 -- 6.21 14.9 7.6 10.8 1.81 --4.26 13.6 6.1 9.5
-0 .65 --4.18 24.4 17.2 19.7 (0.70-t-0.89) (--4.63-1-0.81) (18.3-t-3.9) (11.1_+4.0) (14.0-+3.7)
--0.35 -4 .53 22.9 15.9 18.4 0.28 -- 4.59 20.0 13.0 15.7
--0.75 --4.74 24.8 17.7 20.2 - 0.49 -- 5.62 23.6 16.5 19.0 --0.92 -- 5.06 25.7 18.4 21.0 --1.28 --4.54 27.5 20.1 22.6 --0.68 -5 .12 24.5 17.3 19.9 --0.67 -6.11 24.4 17.3 19.8 -- 1.31 --7.25 27.7 20.3 22.8
(-0.68_+0.48) (-5.28_+0.91 (24.6_+2.3) (17.4-t-2.2) (19.9_+2.2)
0.90_+1.30 --5.04_+0.92
r a t e g r a p h s a re s h o w n fo r the d a t a b e f o r e a n d a f te r the m a s s b a l a n c e ca l cu la t ions . L ines r e p r e s e n t i n g equ i l ib r i - u m d e p o s i t i o n o f o x y g e n i so topes in ca lc i te (Eps t e in e t al. 1953) a n d a r a g o n i t e ( H o r i b e a n d O b a 1972, G r o s s m a n 1982) a re s h o w n to e n a b l e c o m p a r i s o n w i t h e s t ab l i shed i s o t o p i c t e m p e r a t u r e scales as wel l as a t e m p e r a t u r e scale f r e q u e n t l y used in the f ish o t o l i t h l i t e ra tu re . A s ign i f i can t t e m p e r a t u r e ef fec t (F= 14.28, D F = 3,34, P < 0.0001) was e v i d e n t in the o x y g e n i s o t o p e d a t a e v e n w h e n c o n s i d e r i n g o t o l i t h c o m p o s i t i o n b e f o r e the m a s s b a l a n c e c a l c u l a t i o n s (Tab le 3). H o w e v e r , t he re was no e v i d e n c e fo r a l inea r
r e l a t i o n s h i p a m o n g these d a t a ( F : 5 . 3 4 , D F = I , 2 , P > 0 . 1 0 ) (Tab le 3). C a r b o n i s o t o p e d a t a f r o m the s a m e samples s h o w e d no e v i d e n c e o f a t e m p e r a t u r e e f fec t (Fig . 4).
A f t e r a p p l y i n g the m a s s b a l a n c e r e l a t i o n s h i p to the o x y g e n i s o t o p e da ta , t he re was n o t a l a rge c h a n g e in the r e l a t ive p o s i t i o n o f the d a t a p o i n t s a t e a c h t e m p e r a t u r e , b e c a u s e b o t h s o m a t i c a n d o t o l i t h g r o w t h ra tes were s im- i la r a m o n g f ish a t a s ingle t e m p e r a t u r e (Fig. 3; Tab le 1). T h e r e f o r e , the a m o u n t o f n e w o t o l i t h m a t e r i a l f o r m e d in f ish a t a s ingle t e m p e r a t u r e w a s a s imi la r p r o p o r t i o n o f
J.M. Kalish: Fish otolith isotopes
Table 3. Arripis trutta. Results of one-way analysis of variance and Model I regression analysis examining the relationship among 61 s O values in otoliths from fish maintained at four temperatures, based on raw ~ 1 s o data before applying mass balance relationship, MBR (Fig. 3A), on 6180 data after applying mass balance relationship
43
(Fig. 3 B), and on 61sO data after applying mass balance relation- ship and elimination of three outliers from 13°C treatment (Fig. 3 B). DF: degrees of freedom; SS: sum of squares; MS: mean square
Source of variation DF SS MS F P
Raw ~180 data before MBR Among temperatures 3 5.367 1.789 14.28(3,34) P<0.000] Linear regression 1 3.903 3.903 5-34(1,2) 0.10 < P < 0.25 Deviations from regression 2 1.463 0.732 5-84(2,34) 0.005 < P < 0.01 Within temperatures 34 4.260 0.125 Total 37 14.993
6180 after MBR Among temperatures 3 34.43 11.48 14.04(3,34) P< 0.0001 Linear regression 1 28.27 28.27 9.1811,2 ) 0.05<P<0.10 Deviations from regression 2 6.16 3.08 3.77(2,34) 0.025 < P < 0.05 Within temperatures 34 27.80 0.818 Total 37 96.66
6xsO after MBR, without outliers Among temperatures 3 44.45 14.82 40-59(3.31) P < 0.0001 Linear regression 1 42.99 42.99 58.89(1,2) 0.01 < P < 0.025 Deviations from regression 2 1.460 0.730 2.00(2,31) 0.10<P<0.25 Within temperatures 31 11.33 0.365 Total 34 100.23
the total otolith material. Scatter in the data was greater after application of the mass balance relationship, partic- ularly in the data from fish maintained at 13 and 16 °C. This may be due to imprecision in the estimation of the isotopic baseline for some of the experimental fish. For example, underestimation of the degree of depletion in the heavy oxygen isotope by the isotopic baseline would result in subsequent overestimation of the magnitude of depletion in the newly formed otolith material. This effect would be particularly extreme in fish maintained at the lower temperatures because of the relatively small quanti- ty of new otolith material. Despite this increase in the range of 6280 at each temperature, there was still a very significant effect due to temperature (F=14.04, D F = 3,34 P<0.0001), and there was increased evidence of linearity among the data (F= 9.18, DF = 1,2, 0.05 < P < 0.10; Table 3).
The failure of the 6180 data to show a linear relation- ship versus temperature was due to the presence of three outliers from the 13 °C treatment. These data were clearly divergent from the other data points from the 13 °C treat- ment both before and after the application of the mass balance model. These data may be significantly different from the other 13 °C values because the fish may have experienced different environmental conditions before capture. If this were true, than the pre-captivity 6280 values for these otoliths could have deviated significantly from the estimated isotopic baseline. This is plausible, given the variations that were evident in the baseline oxy- gen-isotope data. Also, otoliths from the 13 °C treatment that had 6280 values less than zero (Table 2; Fig. 3) were from relatively slow-growing fish (Table 1), The lowest otolith 6280 value from the 13 °C treatment (-1.02) was from a fish that grew 50% slower than the next slowest growing fish in the treatment (Table 1). If it is accepted that these fish were aberrant in some way due to inaccu-
racy in the estimation of pre-captivity 6~so and/or slow growth rates, then it is reasonable to eliminate them from the data set. If these individuals are eliminated from the data set there is a highly significant correlation between ~ s o and temperature (r2=0.77, D F = 3 5 , P<0.0001) and a significant linear regression (F= 58.89, DF = 1,2, 0.01 < P < 0 . 0 2 5 ; Table 3; Fig. 3 B), where 61sO=6.69 - 0.326 (T °C).
Variability between sagittae from individual fish
Eight pairs of sagittae from juvenile Australian salmon were analysed for oxygen and carbon isotopes in random order to eliminate any instrument and/or operator bias and it was found that there were significant differences within pairs of otoliths (Fig. 2). Data for these fish ap- pear in Table 4. Three of the fish, collected in the same net haul, were almost identical in body length and weight and otolith length and weight. The other five pairs of sagittae used to investigate the variability between sagittae from individuals were from fish collected in a different net haul; they differed only slightly in length and weight (Table 4).
In the case of the three fish of almost identical length and weight, the sagittae from individuals had similar val- ues for 6180 and 613C, although two of the pairs showed notable differences, one in 6180 and the other in 613C (Fig. 2). 6180 ranged from 0.22 to 0.75%o, equivalent to a temperature difference of approx. 2.4 C ° for the three otolith pairs. The difference in 6280 from one of the otolith pairs (7 a and 7 b) was almost as great as the range measured for all three pairs. The range of 613C for the three otolith pairs was - 3 . 6 5 to -6.05%Q, much greater than the range found for 6280, although the greatest variation within a pair of sagittae was only 0.30%0, less than the range of 6280 within a pair.
44 J.M. Kalish: Fish otolith isotopes
Table 4. Arripis trutta. Results of otolith-pair analyses from wild salmon. Fish 1 to 5 were collected on 19 April 1987 and Fish 6 to 8 on 6 August 1987. Otolith No. identifies right (a) and left (b) sagitta from individual salmon. Values are reported relative to Pee Dee Belemnite (PDB) standard
Otolith No. Fish Otolith 618OpDB ~13CpD B (%0) (%0)
Length (mm) Weight (g) Length (mm) Weight (mg)
I a 45.5 1.83 2.51 1.80 -0.20 -6.19 b 2.51 1.80 0.52 -6.00
2 a 43.0 1.67 2.51 1.85 0.02 - 6.42 b 2.51 1.85 0.13 -6.01
3 a 47.0 1.74 2.59 1.95 - 1.31 - 5.95 b 2.51 1.90 0.47 - 5.50
4 a 47.0 1.84 2.55 2.00 0.96 - 4.94 b 2.61 2.11 0.74 -5.06
5 a 42.0 1.34 2.49 1.65 0.63 - 5.93 b 2.43 1.54 -0.50 -6.34
x (0.21+0.64) (-5.83±0.51)
6a 48.0 1.72 2.50 1.92 0.75 -5.14 b 2.52 1.90 0.69 - 5.22
7 a 47.0 1.68 2.45 1.91 0.22 - 3.65 b 2.45 1.94 0.69 - 3.82
8 a 47.0 1.65 2.45 1.86 0.53 - 5.75 b 2.45 1.83 0.35 -6.05
2 (0.54_+0.21) (--4.94+_0.99)
Values o f (~180 f rom the set o f five o to l i th pa i rs were no t s ignif icant ly di f ferent f rom those found for the three prev ious pai rs i f one ignores a single out l ier a t -1 .31%o tha t was run at a low gas pressure ( a p p r o x i m a t e l y ha l f no rma l ) due to a low gas yield f rom the sample. 613C values also d i sp layed a s imilar , bu t s o m e w h a t n a r r o w e r range, t han the p rev ious three o to l i th pairs . The one no- table difference be tween these five pa i rs and the p rev ious three was tha t values f rom ind iv idua l o to l i th pa i rs were no t as t ight ly c lumped . This implies even greater ana ly t i - cal imprec i s ion a n d / o r grea ter va r i ab i l i ty at the level o f the o to l i th pa i r f rom an individual .
Es t ima t ion o f the con t r i bu t ion o f me tabo l i c c a r b o n
Ca lcu la t ion o f the c o n t r i b u t i o n o f me tabo l i c c a r b o n indi- ca ted tha t 31.7 to 34.9% o f the c a r b o n in o to l i ths f rom the l a b o r a t o r y - r e a r e d A u s t r a l i a n sa lmon was der ived f rom me tabo l i c CO2 (Table 5). There was no evidence for a re la t ionsh ip be tween t empera tu re , somat ic growth , and o to l i th g rowth and the relat ive p r o p o r t i o n o f me tabo l i - ca l ly-der ived CO 2 i n c o r p o r a t e d in the o to l i ths o f juveni le A u s t r a l i a n sa lmon; however , the grea te r dep le t ion in x 3C at 22 °C, resul t ing in the e s t ima t ion o f a larger con t r ibu - t ion o f me tabo l i c c a r b o n to the o tol i th , m a y indicate a s ignif icant ly h igher me tabo l i c ra te in these fish (own un- pub l i shed data) .
A posi t ive co r re la t ion be tween ~180 and ~ 3 C is gen- era l ly cons idered to indicate i n c o r p o r a t i o n o f me tabo l i - cal ly der ived CO 2 into the c a r b o n a t e s t ruc ture (Gross - m a n 1984a) or kinet ic effects dur ing the h y d r a t i o n and h y d r o x y l a t i o n o f C O > where there is a d i sc r imina t ion aga ins t the heavier i so topes ( M c C o n n a u g h e y 1984a, b). There was a posi t ive co r re la t ion be tween the oxygen and c a r b o n i so tope d a t a ( r2=0 .27 , n = 2 3 , P < 0 . 0 1 ) used to
Table 5. Arripis trutta. Results of calculations used to estimate per- centage of metabolically derived carbon (M%[~13C] in Eq. 6) in otoliths from juveniles maintained in captivity at four temperatures. For all temperatures, 613Cb,~w = 2.0%0, as estimated from apparent oxygen utilization (AOU), and 613Cmeta=20.1%o, based on flesh from whole juvenile Australian salmon, where cS~3Cb,sw and d 13Cruet, = carbon isotopic ratios measured in seawater bicarbonate and metabolically derived CO 2, respectively. The variables es_b, eb_ c and e~_, are fractionation factors between CaCO3 and HCO3, CO 2 and I-ICOn, and CO 2 and CaCO3, respectively, and are dis- cussed in detail in "Materials and methods - Contribution of met- abolic carbon"
T as - b (%0) eb - ~ (%0) ~ s - . (%0) Metabolic (°C) carbon (%)
13 1.98 10.38 12.36 31.9 16 2.09 10.02 12.11 31.7 19 2.20 9.67 11.87 31.7 22 2.30 9.32 11.62 34.9
es t imate the i so top ic basel ine (Fig. 2), bu t a s imi lar effect was no t a p p a r e n t in the l a b o r a t o r y - m a i n t a i n e d fish de- spite the wide range o f t empera tures . F u r t h e r research is requi red to ascer ta in if there is any effect re la ted to m e t a b o l i s m or ca lc i f ica t ion ra te in the oxygen and c a r b o n i so topes o f fish otol i ths .
D i s c u s s i o n
Fish o to l i th 6180 as an env i ronmen ta l t h e r m o m e t e r
The d a t a p resen ted here show tha t o to l i th (~180 of Arri- pis trutta is depos i t ed near to equ i l ib r ium relat ive to a rag- oni te 6~sO and m a y be used as a r ecorde r o f env i ronmen- tal t empe ra tu r e dur ing the life o f a fish. As expected, exper imen ta l d a t a f rom this s tudy d id no t c o n f o r m to the
J.M. Kalish: Fish otolith isotopes
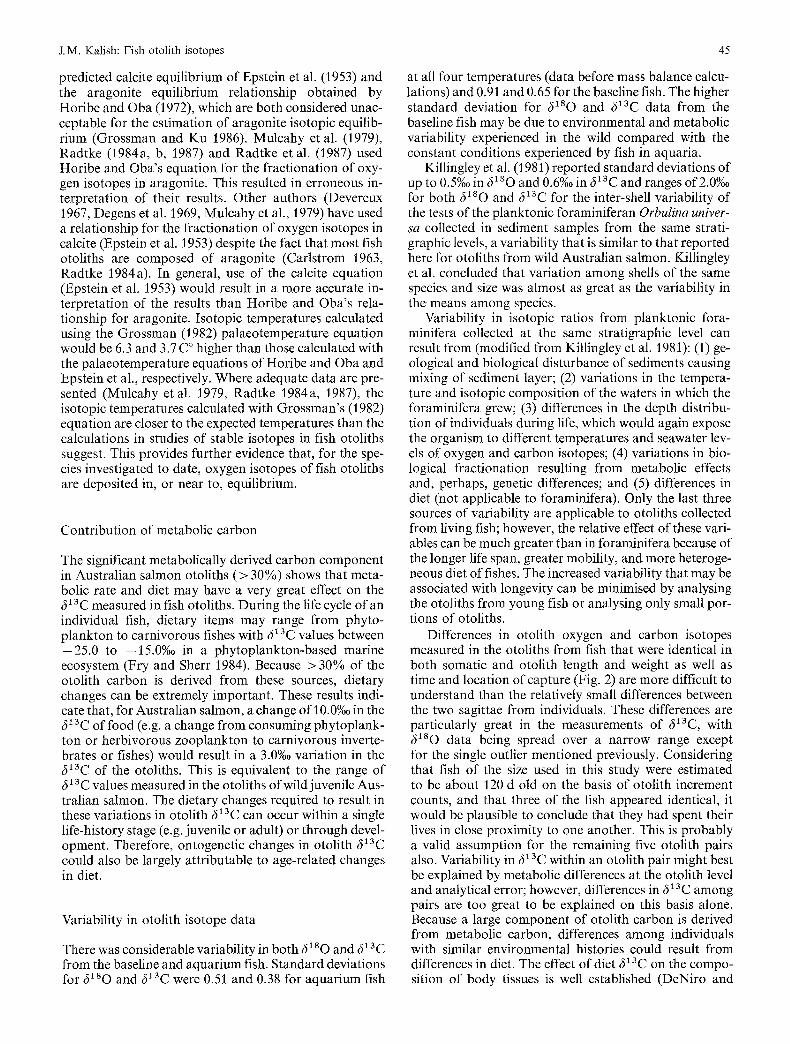
predicted calcite equilibrium of Epstein et al. (1953) and the aragonite equilibrium relationship obtained by Horibe and Oba (1972), which are both considered unac- ceptable for the estimation of aragonite isotopic equilib- rium (Grossman and Ku 1986). Mulcahy et al. (1979), Radtke (1984a, b, 1987) and Radtke et al. (1987) used Horibe and Oba's equation for the fractionation of oxy- gen isotopes in aragonite. This resulted in erroneous in- terpretation of their results. Other authors (Devereux 1967, Degens et al. 1969, Mulcahy et al., 1979) have used a relationship for the fractionation of oxygen isotopes in calcite (Epstein et al. 1953) despite the fact that most fish otoliths are composed of aragonite (Carlstrom /963, Radtke 1984a). In general, use of the calcite equation (Epstein et al. 1953) would result in a more accurate in- terpretation of the results than Horibe and Oba's rela- tionship for aragonite. Isotopic temperatures calculated using the Grossman (1982) palaeotemperature equation would be 6.3 and 3.7 C ° higher than those calculated with the palaeotemperature equations of Horibe and Oba and Epstein et al., respectively. Where adequate data are pre- sented (Mulcahy et al. 1979, Radtke 1984a, 1987), the isotopic temperatures calculated with Grossman's (1982) equation are closer to the expected temperatures than the calculations in studies of stable isotopes in fish otoliths suggest. This provides further evidence that, for the spe- cies investigated to date, oxygen isotopes of fish otoliths are deposited in, or near to, equilibrium.
Contribution of metabolic carbon
The significant metabolically derived carbon component in Australian salmon otoliths (> 30%) shows that meta- bolic rate and diet may have a very great effect on the
13 C measured in fish otoliths. During the life cycle of an individual fish, dietary items may range from phyto- plankton to carnivorous fishes with 613C values between -25.0 to -15.0%o in a phytoplankton-based marine ecosystem (Fry and Sherr 1984). Because > 30% of the otolith carbon is derived from these sources, dietary changes can be extremely important. These results indi- cate that, for Australian salmon, a change of 10.0%o in the c51ac of food (e.g. a change from consuming phytoplank- ton or herbivorous zooplankton to carnivorous inverte- brates or fishes) would result in a 3.0%0 variation in the c~x3c of the otoliths. This is equivalent to the range of 613 C values measured in the otoliths of wild juvenile Aus- tralian salmon. The dietary changes required to result in these variations in otolith 613C can occur within a single life-history stage (e.g. juvenile or adult) or through devel- opment. Therefore, ontogenetic changes in otolith ~13C could also be largely attributable to age-related changes in diet.
Variability in otolith isotope data
There was considerable variability in both 6180 and 613C from the baseline and aquarium fish. Standard deviations for 6180 and 613C were 0.51 and 0.38 for aquarium fish
45
at all four temperatures (data before mass balance calcu- lations) and 0.91 and 0.65 for the baseline fish. The higher standard deviation for 6180 and 613C data from the baseline fish may be due to environmental and metabolic variability experienced in the wild compared with the constant conditions experienced by fish in aquaria.
Killingley et al. (1981) reported standard deviations of up to 0.5%0 in c~lSO and 0.6%0 in c513C and ranges of 2.0%o for both ~180 and 613C for the inter-shell variability of the tests of the planktonic foraminiferan Orbulina univer- sa collected in sediment samples from the same strati- graphic levels, a variability that is similar to that reported here for otoliths from wild Australian salmon. Killingley et al. concluded that variation among shells of the same species and size was almost as great as the variability in the means among species.
Variability in isotopic ratios from planktonic fora- minifera collected at the same stratigraphic level can result from (modified from Killingley et al. 1981): (1) ge- ological and biological disturbance of sediments causing mixing of sediment layer; (2) variations in the tempera- ture and isotopic composition of the waters in which the foraminifera grew; (3) differences in the depth distribu- tion of individuals during life, which would again expose the organism to different temperatures and seawater lev- els of oxygen and carbon isotopes; (4) variations in bio- logical fractionation resulting from metabolic effects and, perhaps, genetic differences; and (5) differences in diet (not applicable to foraminifera). Only the last three sources of variability are applicable to otoliths collected from living fish; however, the relative effect of these vari- ables can be much greater than in foraminifera because of the longer life span, greater mobility, and more heteroge- neous diet of fishes. The increased variability that may be associated with longevity can be minimised by analysing the otoliths from young fish or analysing only small por- tions of otoliths.
Differences in otolith oxygen and carbon isotopes measured in the otoliths from fish that were identical in both somatic and otolith length and weight as well as time and location of capture (Fig. 2) are more difficult to understand than the relatively small differences between the two sagittae from individuals. These differences are particularly great in the measurements of 613C, with 6180 data being spread over a narrow range except for the single outlier mentioned previously. Considering that fish of the size used in this study were estimated to be about 120 d old on the basis of otolith increment counts, and that three of the fish appeared identical, it would be plausible to conclude that they had spent their lives in close proximity to one another. This is probably a valid assumption for the remaining five otolith pairs also. Variability in ~13C within an otolith pair might best be explained by metabolic differences at the otolith level and analytical error; however, differences in 613 C among pairs are too great to be explained on this basis alone. Because a large component of otolith carbon is derived from metabolic carbon, differences among individuals with similar environmental histories could result from differences in diet. The effect of diet 613C on the compo- sition of body tissues is well established (DeNiro and
46
Epstein 1978). In the case of small juvenile Australian salmon, differences in otolith 613C might result f rom in- dividual dietary preferences for, perhaps, crustaceans versus polychaetes, two of the more common compo- nents of the diet for individuals collected f rom Cremorne Beach (own unpublished data). Gearing et al. (1984) in- vestigated the 61aC of a wide range of benthic and zooplanktonic organisms and found total 613C values that ranged f rom - 23.0 to - 15.5%o, with herbivorous zooplankton (e.g. mysids, euphausiidds, copepods) hav- ing the lowest 813C, and carnivorous benthic organisms (e.g., polychaetes, gastropods, nemerteans) having the highest. Dietary differences before recruitment to the es- tuary should also be considered, al though the relative weight of the otolith would be quite small compared with the final weight of the otolith used in isotopic analyses.
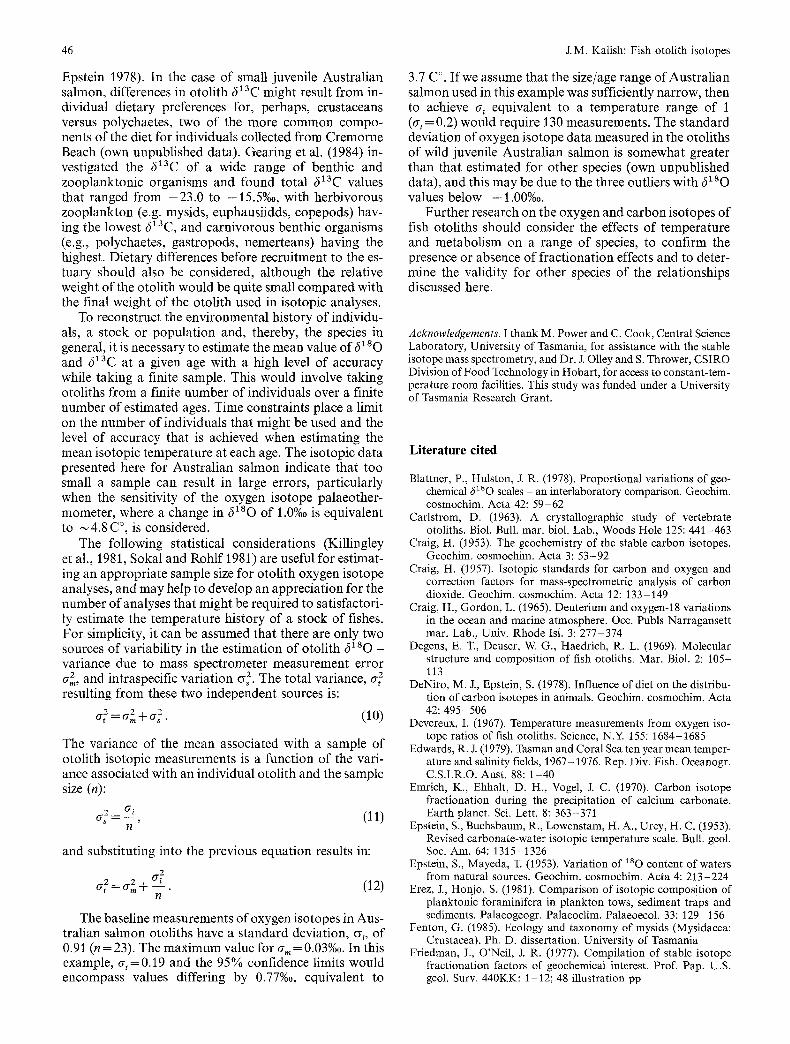
To reconstruct the environmental history of individu- als, a stock or populat ion and, thereby, the species in general, it is necessary to estimate the mean value o f f l s o and 613C at a given age with a high level of accuracy while taking a finite sample. This would involve taking otoliths from a finite number of individuals over a finite number of estimated ages. Time constraints place a limit on the number of individuals that might be used and the level of accuracy that is achieved when estimating the mean isotopic temperature at each age. The isotopic data presented here for Australian salmon indicate that too small a sample can result in large errors, particularly when the sensitivity of the oxygen isotope palaeother- mometer , where a change in 61sO of 1.0%o is equivalent to ~4 .8 C °, is considered.
The following statistical considerations (Killingley et al., 1981, Sokal and Rohlf 1981) are useful for estimat- ing an appropriate sample size for otolith oxygen isotope analyses, and may help to develop an appreciation for the number of analyses that might be required to satisfactori- ly estimate the temperature history of a stock of fishes. For simplicity, it can be assumed that there are only two sources of variability in the estimation of otolith 6180 - variance due to mass spectrometer measurement error
2 The total variance, 0-2 2 and intraspecific variation % . O'm,
resulting from these two independent sources is:
2. (10)
The variance of the mean associated with a sample of otolith isotopic measurements is a function of the vari- ance associated with an individual otolith and the sample size (n):
2 O-i (11) 0" 8 ~ - -
n
and substituting into the previous equation results in:
a 2 0-2 2 t = o-" + - - . (12)
n
The baseline measurements of oxygen isotopes in Aus- tralian salmon otoliths have a standard deviation, %, of 0.91 (n = 23). The max imum value for 0-,. = 0.03%0. In this example, 0-t=0.19 and the 95% confidence limits would encompass values differing by 0.77%o, equivalent to
J.M. Katish: Fish otolith isotopes
3.7 C °. I f we assume that the size/age range of Australian salmon used in this example was sufficiently narrow, then to achieve at equivalent to a temperature range of 1 (at = 0.2) would require 130 measurements. The standard deviation of oxygen isotope data measured in the otoliths of wild juvenile Australian salmon is somewhat greater than that estimated for other species (own unpublished data), and this may be due to the three outliers with 6~80 values below - 1.00%o.
Further research on the oxygen and carbon isotopes of fish otoliths should consider the effects of temperature and metabolism on a range of species, to confirm the presence or absence of fractionation effects and to deter- mine the validity for other species of the relationships discussed here.
Acknowledgements. I thank M. Power and C. Cook, Central Science Laboratory, University of Tasmania, for assistance with the stable isotope mass spectrometry, and Dr. J. Olley and S. Thrower, CSIRO Division of Food Technology in Hobart, for access to constant-tem- perature room facilities. This study was funded under a University of Tasmania Research Grant.
Literature cited
Blattner, P., Hulston, J. R. (1978). Proportional variations of geo- chemical 8180 scales - an interlaboratory comparison. Geochim. cosmochim. Acta 42:59-62
Carlstrom, D. (1963). A crystallographic study of vertebrate otoliths. Biol. Bull. mar. biol. Lab., Woods Hole 125:441-463
Craig, H. (1953). The geochemistry of the stable carbon isotopes. Geochim. cosmochim. Acta 3:53-92
Craig, H. (1957). Isotopic standards for carbon and oxygen and correction factors for mass-spectrometric analysis of carbon dioxide. Geochim. cosmochim. Acta 12:133-149
Craig, H., Gordon, L. (1965). Deuterium and oxygen-18 variations in the ocean and marine atmosphere. Occ. Publs Narragansett mar. Lab., Univ. Rhode Isl. 3:277-374
Degens, E. T., Deuser, W. G., Haedrich, R. L. (1969). Molecular structure and composition of fish otoliths. Mar. Biol. 2: 105- 113
DeNiro, M. J., Epstein, S. (1978). Influence of diet on the distribu- tion of carbon isotopes in animals. Geochim. cosmochim. Acta 42:495-506
Devereux, I. (1967). Temperature measurements from oxygen iso- tope ratios of fish otoliths. Science, N.Y. 155:1684-1685
Edwards, R. J. (1979). Tasman and Coral Sea ten year mean temper- ature and salinity fields, 1967-1976. Rep. Div. Fish. Oceanogr. C.S.I.R.O. Aust. 88:1-40
Emrich, K., Ehhalt, D. H., Vogel, J. C. (1970). Carbon isotope fractionation during the precipitation of calcium carbonate. Earth planet. Sci. Lett. 8:363-371
Epstein, S., Buchsbaum, R., Lowenstam, It. A., Urey, H. C. (1953). Revised carbonate-water isotopic temperature scale. Bull. geol. Soc. Am. 64:1315-1326
Epstein, S., Mayeda, T. (1953). Variation of 180 content of waters from natural sources. Geochim. cosmochim. Acta 4:213-224
Erez, J., Honjo, S. (1981). Comparison of isotopic composition of planktonic foraminifera in plankton tows, sediment traps and sediments. Palaeogeogr. Palaeoclim. Palaeoecol. 33:129-156
Fenton, G. (1985). Ecology and taxonomy of mysids (Mysidacea: Crustacea), Ph.D. dissertation. University of Tasmania
Friedman, I., O'Neil, J. R. (1977). Compilation of stable isotope fractionation factors of geochemical interest. Prof. Pap. U.S. geol. Surv. 440KK: 1-12; 48 illustration pp
J.M. Kalish: Fish otolith isotopes
Fry, B., Sherr, E. B: (1984). 613C measurements as indicators of carbon flow in marine and freshwater ecosystems. Contr.mar. Sci. Univ. Tex. 27:13-47
Gearing, J. N., Gearing, P. J., Rudnick, D. T., Requejo, A. G., Hutchins, M. J. (1984). Isotopic variability of organic carbon in a phytoplankton-based, temperate estuary. Geochim. cosmochim. Acta 48:1089-1098
Grossman, E. L. (1982). Stable isotopes in live benthic foraminifera from the Southern California Borderland. Ph. D. dissertation. University of Southern California
Grossman, E. L. (1984a). Stable isotope fractionation in live ben- thic foraminifera from the Southern California Borderland. Palaeogeogr. Palaeoclim. Palaeoecol. 47:301-327
Grossman, E. L. (1984b). Carbon isotopic fractionation in live benthic foraminifera - comparison with inorganic precipitate studies. Geochim. cosmochim. Acta 48:1505-1512
Grossman, E. L., Ku, T.-L. (1986). Oxygen and carbon isotope fractionation in biogenic aragonite: temperature effects. Chem. Geol. (Isotope Geosci. Sect.) 59:59-74
Horibe, Y., Oba, T. (1972). Temperature scales of aragonite-water and calcite-water systems. [In Japanese] Fossils 23/24:69-79 [Cited after Grossman and Ku (1986)]
Killingley, J. S. (1980). Migrations of California gray whales tracked by oxygen-18 variations in their epizoic barnacles. Science, N.Y. 207:759-760
Killingley, J. S., Johnson, R. E, Berger, W. H. (1981). Oxygen and carbon isotopes of individual shells of planktonic foraminifera from Ontong-Java Plateau, equatorial Pacific. Palaeogeogr., Palaeoclimatol., Palaeoecol. 33:193 204
Killingley, J. S., Lutcavage, M. 0983). Loggerhead turtle move- ments reconstructed from 180 and 13 C profiles from commensal barnacle shells. Estuar., cstl Shelf Sci. 16:345-349
Killingley, J. S., Rex, M. A. (1985). Mode of larval development in some deep-sea gastropods indicated by oxygen-18 values of their carbonate shells. Deep-Sea Res. 32:809-818
Kroopnick, P. (1974). The dissolved O2-CO2-13C system in the eastern equatorial Pacific. Deep-Sea Res. 21:211-227
13 Kroopnick, P. (1980). The distribution of C in the Atlantic Ocean. Earth planet. Sci. Lett. 49:469-484
McConnaughey, T. (1989 a). 13 C and 180 isotopic disequilibrium in biological carbonates: I. Patterns. Geochim. cosmochim. Acta 53:151-162
McConnaughey, T. (1989 b). 13 C and 18 0 isotopic disequilibrium in biological carbonates. II. In vitro simulation of kinetic isotope effects. Geochim. cosmochim. Acta 53:163-171
47
Mook, W. G., Bommerson, J. C., Staverman, W H. (1974). Carbon isotope fractionation between dissolved bicarbonate and gas- eous carbon dioxide. Earth planet. Sci. Lett. 22:169-176
Mulcahy, S. A., Killingley, J. S., Phleger, C. E, Berger, W H. (1979). Isotopic composition of otoliths from a benthopelagic fish, Coryphaenoides acrolepis, Macrouridae: Gadiformes. Oceanol. Acta 2:423-427
Radtke, R. L. (1984a). Formation and structural composition of larval striped mullet otoliths. Trans. Am. Fish. Soc. 113: 186- 191
Radtke, R. L. (1984 b). Cod fish otoliths: information storage struc- tures. Flodevigen Rapp. 1:273-298
Radtke, R. L. (1987). Age and growth information available from the otoliths of the Hawaiian snapper, Pristipomoidesfilamento- sus. Coral Reefs 6:19-25
Radtke, R. L., Williams, D. F., Hurley, P. C. F. (1987). The stable isotopic composition of bluefin tuna (Thunnus thynnus) otoliths: evidence for physiological regulation. Comp. Biochem. Physiol. 87A: 797-801
Romanek, C. S., Jones, D. S., Williams, D. E, Krantz, D. E., Radtke, R. (1987). Stable isotopic investigation of physiological and environmental changes recorded in shell carbonate from the giant clam Tridacna maxima. Mar. Biol. 94:385-393
Sokal, R. R., Rohlf, F. J. (1981). Biometry. The principles and practice of statistics in biological research. 2nd ed.W H. Free- man & Co., San Francisco
Spero, H. J., Williams, D. E (1988). Extracting environmental infor- mation from planktonic foraminiferal 613 C data. Nature, Lond. 335:717-719
Tanaka, N., Monaghan, M. C., Rye, D. M. (1986). Contribution of metabolic carbon to mollusc and barnacle shell carbonate. Na- ture, Lond. 320:520-523
Taylor, B. E., Ward, P. D. (1983). Stable isotopic studies of Nautilus macromphalus Sowerby (New Caledonia) and Nautilus pomp# lius L. (Fiji). Palaeogeogr. Palaeoclim. Palaeoecol. 41:1-16
Weber, J. N., Woodhead, P. M. J. (1970). Carbon and oxygen iso- tope fractionation in the skeletal carbonate of reef-building corals. Chem. Geol. 6:93-117
Williams, D. E, B6, A. W. H., Fairbanks, R. G. (1981). Seasonal stable isotopic variations in living planktonic foraminifera from Bermuda plankton tows. Palaeogeogr. Palaeoclim. Palaeoecol. 33:71-102
Williams, D. F., Sommer, M. A., Bender, M. L. (1977). Carbon isotopic compositions of Recent planktonic formanifera of the Indian Ocean. Earth planet. Sci. Lett. 36:391-403