Embed Size (px)
Citation preview
Oxygen transport and consumption in germinating seeds
Budko, N.; Corbetta, A.; Duijn, van, B.; Hille, S.C.; Krehel, O.; Rottschäfer, V.; Wiegman, L.;Zhelyazov, D.Published in:Proceedings of the 90th European Study Group Mathematics in Industry (SWI 2013, Leiden, The Netherlands,January 28-February 1, 2013)
Published: 01/01/2013
Document VersionPublisher’s PDF, also known as Version of Record (includes final page, issue and volume numbers)
Please check the document version of this publication:
• A submitted manuscript is the author's version of the article upon submission and before peer-review. There can be important differencesbetween the submitted version and the official published version of record. People interested in the research are advised to contact theauthor for the final version of the publication, or visit the DOI to the publisher's website.• The final author version and the galley proof are versions of the publication after peer review.• The final published version features the final layout of the paper including the volume, issue and page numbers.
Link to publication
General rightsCopyright and moral rights for the publications made accessible in the public portal are retained by the authors and/or other copyright ownersand it is a condition of accessing publications that users recognise and abide by the legal requirements associated with these rights.
• Users may download and print one copy of any publication from the public portal for the purpose of private study or research. • You may not further distribute the material or use it for any profit-making activity or commercial gain • You may freely distribute the URL identifying the publication in the public portal ?
Take down policyIf you believe that this document breaches copyright please contact us providing details, and we will remove access to the work immediatelyand investigate your claim.
Download date: 10. Jul. 2018
Oxygen transport and consumption in germinatingseeds
Neil Budko (Delft University of Technology)Alessandro Corbetta (Eindhoven University of Technology)
Bert van Duijn (Fytagoras) Sander Hille (Leiden University)∗Oleh Krehel (Eindhoven University of Technology)
Vivi Rottschäfer (Leiden University)Linda Wiegman (Delft University of Technology)
Delyan Zhelyazov (Centrum voor Wiskunde en Informatica)
Abstract
Three mathematical models were formulated to describe the oxygen con-sumption of seeds during germination. These models were fitted to measure-ment data of oxygen consumption curves for individual germinating seeds ofSavoy cabbage, barley and sugar beet provided by Fytagoras. The first modelbuilds on a logistic growth model for the increasing population of mitochondriain the embryo during growth. The other two take the anatomy and physiologi-cal properties of the seed into account. One describes the oxygen uptake duringthe germination phase only. An extension of this model is capable of fittingthe complete oxygen consumption curve, including the initial ‘repair’ phase inwhich the embryonic cells recover from their dormant state before extensive celldivision and growth commences.
Keywords: Modelling, seed germination, cellular respiration, oxygen trans-port
1 Introduction
At the 90th Study Group Mathematics with Industry (SWI) held at Leiden Universityfrom 28 January to 1 February 2013 one of the questions was formulated by thecompany Fytagoras. Fytagoras is a company that is oriented on science with muchexpertise in the fields of sensor technology, seed technology and plant breeding. Thequestion concerned the uptake and consumption of oxygen by germinating seeds. Ourstudy considers the seeds of three particular species among the ∼ 250, 000 species of
∗Corresponding author
6 SWI 2013 Proceedings
flowering plants: barley (Hordeum vulgare L.), sugar beet (Beta vulgaris) and Savoycabbage (Brassica olerecea var. sabauda L.).
Describing the dynamics of chemical compounds dissolved in liquid solvents (e.g.water) one typically uses the concept of concentration to describe the state of thesystem. Dealing with mixtures of gasses it is better to use the concept of partialpressure. It is the hypothetical pressure of a particular constituent of the gas mixtureif the amount of it that is present would have occupied the total volume of the mixturealone, at the same temperature.1 Gasses dissolve, diffuse and react according to theirpartial pressures, not their concentrations.
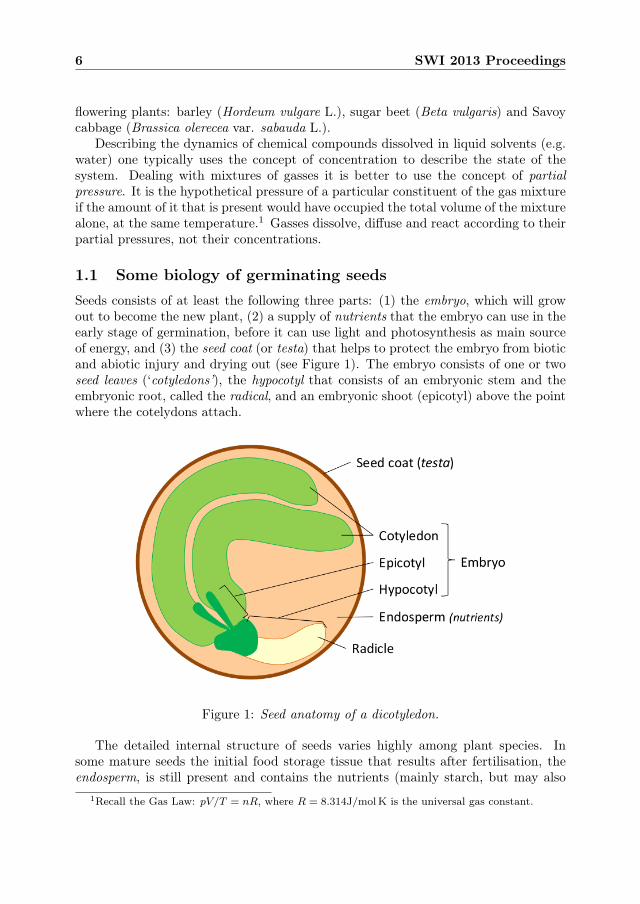
1.1 Some biology of germinating seedsSeeds consists of at least the following three parts: (1) the embryo, which will growout to become the new plant, (2) a supply of nutrients that the embryo can use in theearly stage of germination, before it can use light and photosynthesis as main sourceof energy, and (3) the seed coat (or testa) that helps to protect the embryo from bioticand abiotic injury and drying out (see Figure 1). The embryo consists of one or twoseed leaves (‘cotyledons’), the hypocotyl that consists of an embryonic stem and theembryonic root, called the radical, and an embryonic shoot (epicotyl) above the pointwhere the cotelydons attach.
Figure 1: Seed anatomy of a dicotyledon.
The detailed internal structure of seeds varies highly among plant species. Insome mature seeds the initial food storage tissue that results after fertilisation, theendosperm, is still present and contains the nutrients (mainly starch, but may also
1Recall the Gas Law: pV/T = nR, where R = 8.314J/molK is the universal gas constant.
Oxygen transport and consumption in germinating seeds 7
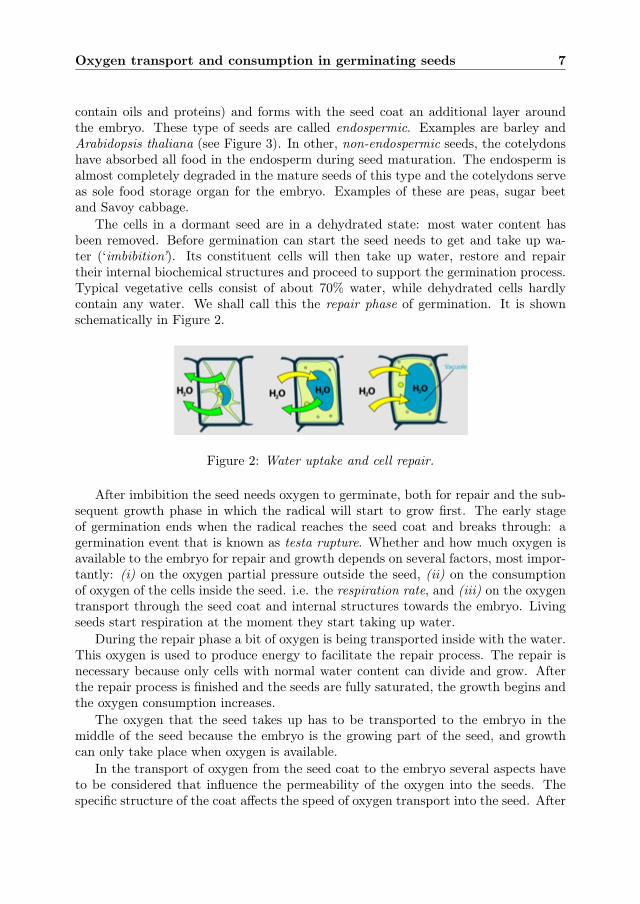
contain oils and proteins) and forms with the seed coat an additional layer aroundthe embryo. These type of seeds are called endospermic. Examples are barley andArabidopsis thaliana (see Figure 3). In other, non-endospermic seeds, the cotelydonshave absorbed all food in the endosperm during seed maturation. The endosperm isalmost completely degraded in the mature seeds of this type and the cotelydons serveas sole food storage organ for the embryo. Examples of these are peas, sugar beetand Savoy cabbage.
The cells in a dormant seed are in a dehydrated state: most water content hasbeen removed. Before germination can start the seed needs to get and take up wa-ter (‘imbibition’). Its constituent cells will then take up water, restore and repairtheir internal biochemical structures and proceed to support the germination process.Typical vegetative cells consist of about 70% water, while dehydrated cells hardlycontain any water. We shall call this the repair phase of germination. It is shownschematically in Figure 2.
Figure 2: Water uptake and cell repair.
After imbibition the seed needs oxygen to germinate, both for repair and the sub-sequent growth phase in which the radical will start to grow first. The early stageof germination ends when the radical reaches the seed coat and breaks through: agermination event that is known as testa rupture. Whether and how much oxygen isavailable to the embryo for repair and growth depends on several factors, most impor-tantly: (i) on the oxygen partial pressure outside the seed, (ii) on the consumptionof oxygen of the cells inside the seed. i.e. the respiration rate, and (iii) on the oxygentransport through the seed coat and internal structures towards the embryo. Livingseeds start respiration at the moment they start taking up water.
During the repair phase a bit of oxygen is being transported inside with the water.This oxygen is used to produce energy to facilitate the repair process. The repair isnecessary because only cells with normal water content can divide and grow. Afterthe repair process is finished and the seeds are fully saturated, the growth begins andthe oxygen consumption increases.
The oxygen that the seed takes up has to be transported to the embryo in themiddle of the seed because the embryo is the growing part of the seed, and growthcan only take place when oxygen is available.
In the transport of oxygen from the seed coat to the embryo several aspects haveto be considered that influence the permeability of the oxygen into the seeds. Thespecific structure of the coat affects the speed of oxygen transport into the seed. After
8 SWI 2013 Proceedings
Figure 3: Embryo of Arabidopsis thaliana.(M. Bayer; Max Planck Inst. for Develop-mental Biology)
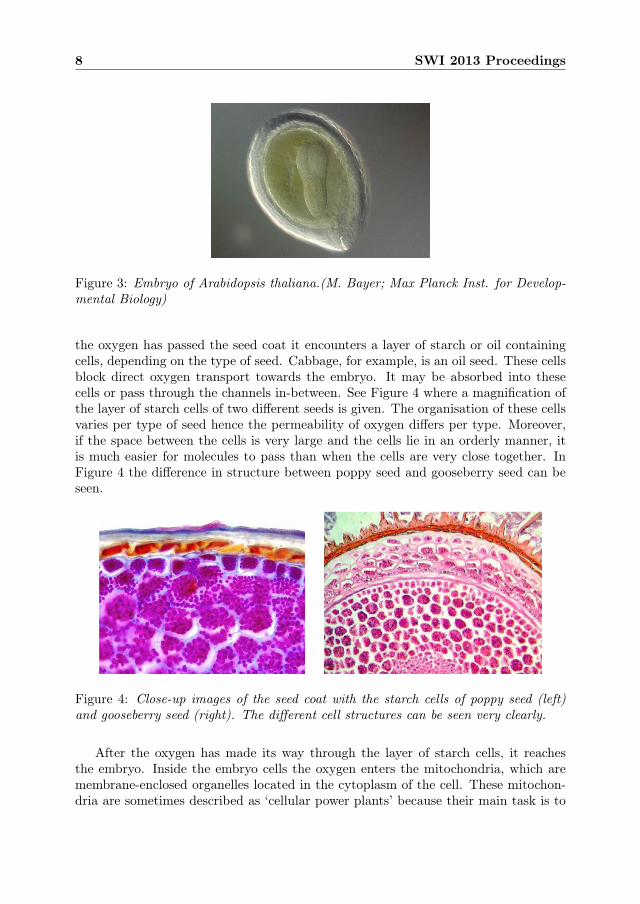
the oxygen has passed the seed coat it encounters a layer of starch or oil containingcells, depending on the type of seed. Cabbage, for example, is an oil seed. These cellsblock direct oxygen transport towards the embryo. It may be absorbed into thesecells or pass through the channels in-between. See Figure 4 where a magnification ofthe layer of starch cells of two different seeds is given. The organisation of these cellsvaries per type of seed hence the permeability of oxygen differs per type. Moreover,if the space between the cells is very large and the cells lie in an orderly manner, itis much easier for molecules to pass than when the cells are very close together. InFigure 4 the difference in structure between poppy seed and gooseberry seed can beseen.
Figure 4: Close-up images of the seed coat with the starch cells of poppy seed (left)and gooseberry seed (right). The different cell structures can be seen very clearly.
After the oxygen has made its way through the layer of starch cells, it reachesthe embryo. Inside the embryo cells the oxygen enters the mitochondria, which aremembrane-enclosed organelles located in the cytoplasm of the cell. These mitochon-dria are sometimes described as ‘cellular power plants’ because their main task is to
Oxygen transport and consumption in germinating seeds 9
produce energy that is needed for other processes inside the cell. They produce thisenergy in the form of ATP molecules by breaking down glucose to carbon dioxideusing oxygen. This energy is used for growth, repair and transport in the cell. Notethat the number of mitochondria per cell can vary from a few up to hundreds.
We are interested in the connection between oxygen availability and the growthof the embryo, so we will now take a closer look at this growth process. The embryoconsists of two parts: an ‘idle’ part where hardly any growth occurs and the embryonicroot (the radicle) that grows first to break the seed coat.
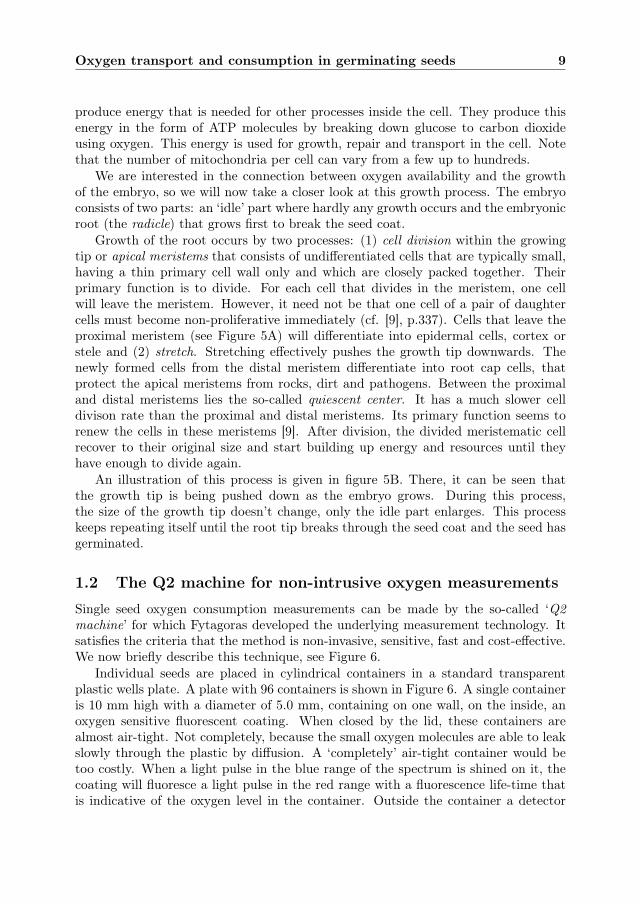
Growth of the root occurs by two processes: (1) cell division within the growingtip or apical meristems that consists of undifferentiated cells that are typically small,having a thin primary cell wall only and which are closely packed together. Theirprimary function is to divide. For each cell that divides in the meristem, one cellwill leave the meristem. However, it need not be that one cell of a pair of daughtercells must become non-proliferative immediately (cf. [9], p.337). Cells that leave theproximal meristem (see Figure 5A) will differentiate into epidermal cells, cortex orstele and (2) stretch. Stretching effectively pushes the growth tip downwards. Thenewly formed cells from the distal meristem differentiate into root cap cells, thatprotect the apical meristems from rocks, dirt and pathogens. Between the proximaland distal meristems lies the so-called quiescent center. It has a much slower celldivison rate than the proximal and distal meristems. Its primary function seems torenew the cells in these meristems [9]. After division, the divided meristematic cellrecover to their original size and start building up energy and resources until theyhave enough to divide again.
An illustration of this process is given in figure 5B. There, it can be seen thatthe growth tip is being pushed down as the embryo grows. During this process,the size of the growth tip doesn’t change, only the idle part enlarges. This processkeeps repeating itself until the root tip breaks through the seed coat and the seed hasgerminated.
1.2 The Q2 machine for non-intrusive oxygen measurements
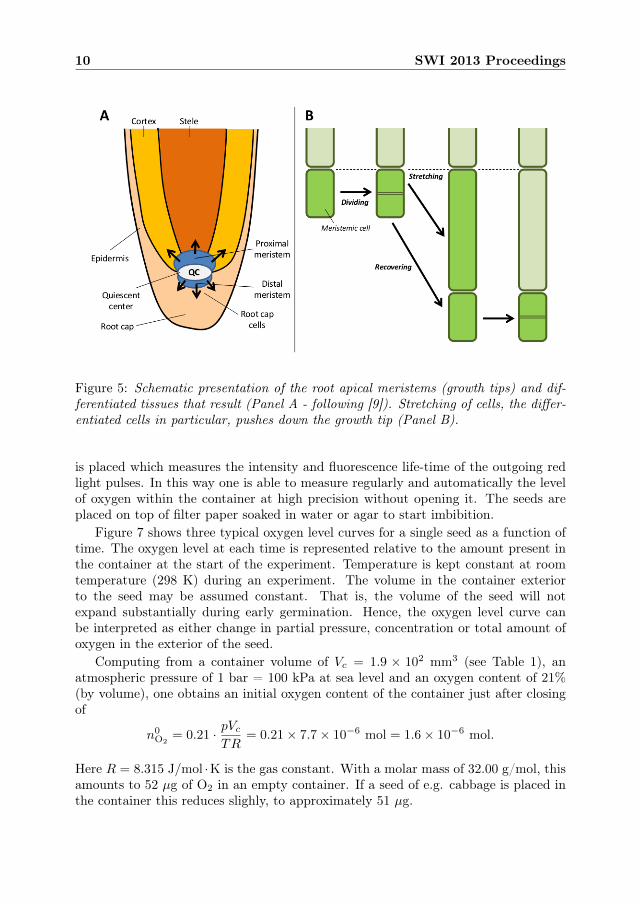
Single seed oxygen consumption measurements can be made by the so-called ‘Q2machine’ for which Fytagoras developed the underlying measurement technology. Itsatisfies the criteria that the method is non-invasive, sensitive, fast and cost-effective.We now briefly describe this technique, see Figure 6.
Individual seeds are placed in cylindrical containers in a standard transparentplastic wells plate. A plate with 96 containers is shown in Figure 6. A single containeris 10 mm high with a diameter of 5.0 mm, containing on one wall, on the inside, anoxygen sensitive fluorescent coating. When closed by the lid, these containers arealmost air-tight. Not completely, because the small oxygen molecules are able to leakslowly through the plastic by diffusion. A ‘completely’ air-tight container would betoo costly. When a light pulse in the blue range of the spectrum is shined on it, thecoating will fluoresce a light pulse in the red range with a fluorescence life-time thatis indicative of the oxygen level in the container. Outside the container a detector
10 SWI 2013 Proceedings
Figure 5: Schematic presentation of the root apical meristems (growth tips) and dif-ferentiated tissues that result (Panel A - following [9]). Stretching of cells, the differ-entiated cells in particular, pushes down the growth tip (Panel B).
is placed which measures the intensity and fluorescence life-time of the outgoing redlight pulses. In this way one is able to measure regularly and automatically the levelof oxygen within the container at high precision without opening it. The seeds areplaced on top of filter paper soaked in water or agar to start imbibition.
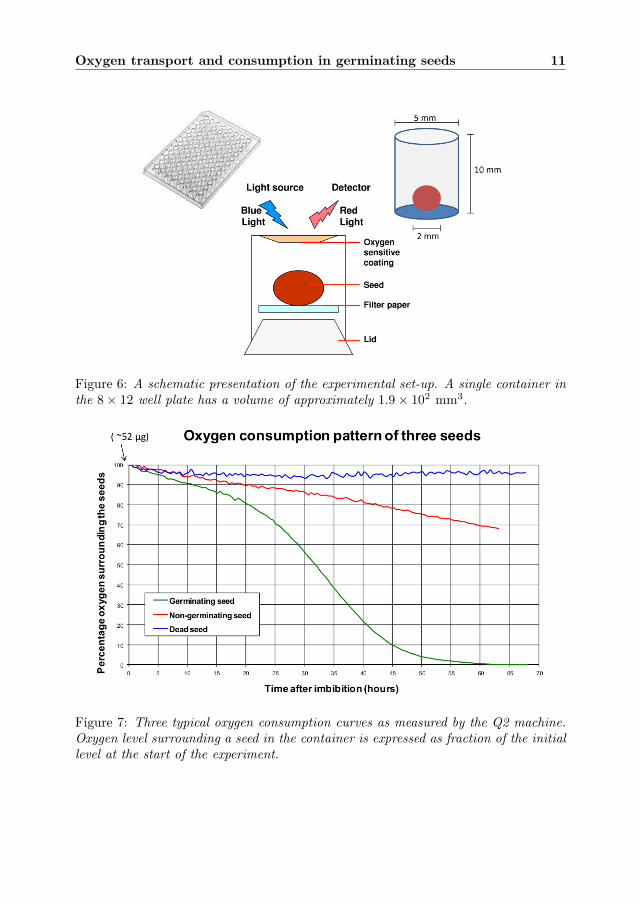
Figure 7 shows three typical oxygen level curves for a single seed as a function oftime. The oxygen level at each time is represented relative to the amount present inthe container at the start of the experiment. Temperature is kept constant at roomtemperature (298 K) during an experiment. The volume in the container exteriorto the seed may be assumed constant. That is, the volume of the seed will notexpand substantially during early germination. Hence, the oxygen level curve canbe interpreted as either change in partial pressure, concentration or total amount ofoxygen in the exterior of the seed.
Computing from a container volume of Vc = 1.9 × 102 mm3 (see Table 1), anatmospheric pressure of 1 bar = 100 kPa at sea level and an oxygen content of 21%(by volume), one obtains an initial oxygen content of the container just after closingof
n0O2
= 0.21 · pVcTR
= 0.21× 7.7× 10−6 mol = 1.6× 10⁻⁶ mol.
Here R = 8.315 J/mol ·K is the gas constant. With a molar mass of 32.00 g/mol, thisamounts to 52 µg of O2 in an empty container. If a seed of e.g. cabbage is placed inthe container this reduces slighly, to approximately 51 µg.
Oxygen transport and consumption in germinating seeds 11
Figure 6: A schematic presentation of the experimental set-up. A single container inthe 8× 12 well plate has a volume of approximately 1.9× 102 mm3.
Figure 7: Three typical oxygen consumption curves as measured by the Q2 machine.Oxygen level surrounding a seed in the container is expressed as fraction of the initiallevel at the start of the experiment.
12 SWI 2013 Proceedings
1.3 Problem description
Measured single seed oxygen consumption curves can be used to evaluate the qualityof the seed since oxygen consumption is believed to be one of the main characteristicsdescribing quality. However, the interpretation of the data in terms of physical, mor-phological and physiological properties and processes within the seed is still difficult,due to the lack of knowledge of the basic aspects of gas exchange in seeds and its rolein the germination process.
The main goal of this study is to interpret characteristics of individual seedoxygen consumption curves as presented in Figure 7 in terms of underlyingprocesses and seed properties.
We focus on the first stage of germination until the point when the radical breaksthrough the seed coat, because this is the stage of seed germination in which the datacurves are obtained.
1.4 Outline
During the study group we developed three mathematical models for the oxygenconsumption of seeds that takes into account current biological knowledge of theseprocesses. The measured oxygen consumption curves as provided by Fytagoras forbarley (Hordeum vulgare L.), Savoy cabbage (Brassica oleracea var. sabuada L.) andsugar beet (Beta vulgaris) have been fitted to the corresponding curves predicted bythese models.
In Section 2 we present a high-level phenomenological model that is able to describethe measured curves for Savoy cabbage and barley well. It results in a correlationamong model parameters that can be interesting to look at in more detail (see Section2.4). In Section 3 we develop a model starting from anatomical considerations in orderto investigate the possibilities of relating characteristics of the oxygen consumptioncurve to seed structure and particular seed properties. In Section 3.4 the latter modelis extended.
2 A logistic model for oxygen consumption
The experimental curves of oxygen consumption by germinating seeds of all threedifferent plant species (barley, sugar beet and Savoy cabbage) provided by Fytagorashave a very characteristic ‘sigma’ shape, similar to the example shown in Figure 7.This indicates that this aspect of the curves originates from a universal underlyingmechanism independent of the detailed seed morphology. In this section we propose amathematical model for respiration of germinating seeds that does not require detailson seed anatomy as input, but can reproduce the mentioned characteristic shape ofthe oxygen consumption curves.
Oxygen transport and consumption in germinating seeds 13
Our central assumption is, that most of the oxygen that is taken up by the seed isconsumed by the mitochondria within the cells that constitute the seed. According tothe endosymbiotic theory, key organelles in eukaryotic cells, e.g. mitochondria, haveevolved from bacteria and still largely behave as such. Bacterial replication underconditions of limited food/oxygen supply is well understood and is governed by thelogistic equation.
We set up a general logistic equation for our problem, obtain its analytical solution,and fit it to the provided experimental data by tuning three independent parameters.It turns out that for the majority of the seeds that have been investigated in this study,two of these parameters, namely, the rate of growth of the mitochondria populationand the final relative increase in this population, are proportional to each other. Wepropose a modification of the logistic equation that takes this effect into account.
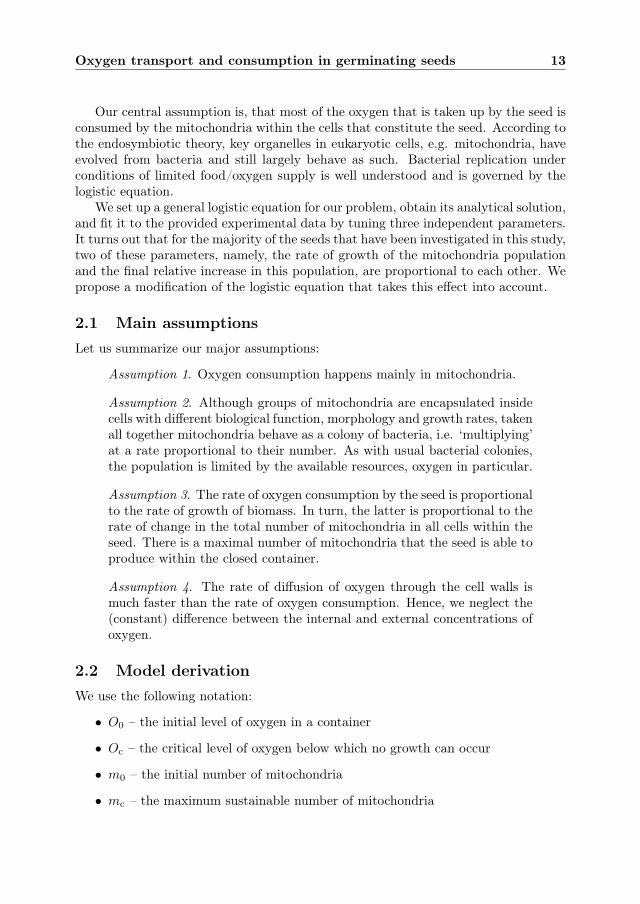
2.1 Main assumptionsLet us summarize our major assumptions:
Assumption 1. Oxygen consumption happens mainly in mitochondria.
Assumption 2. Although groups of mitochondria are encapsulated insidecells with different biological function, morphology and growth rates, takenall together mitochondria behave as a colony of bacteria, i.e. ‘multiplying’at a rate proportional to their number. As with usual bacterial colonies,the population is limited by the available resources, oxygen in particular.
Assumption 3. The rate of oxygen consumption by the seed is proportionalto the rate of growth of biomass. In turn, the latter is proportional to therate of change in the total number of mitochondria in all cells within theseed. There is a maximal number of mitochondria that the seed is able toproduce within the closed container.
Assumption 4. The rate of diffusion of oxygen through the cell walls ismuch faster than the rate of oxygen consumption. Hence, we neglect the(constant) difference between the internal and external concentrations ofoxygen.
2.2 Model derivationWe use the following notation:
• O0 – the initial level of oxygen in a container
• Oc – the critical level of oxygen below which no growth can occur
• m0 – the initial number of mitochondria
• mc – the maximum sustainable number of mitochondria
14 SWI 2013 Proceedings
If mitochondria behave as a colony of bacteria, then their number will be changingat the following rate:
dm
dt= αm
(1− m
mc
), (1)
where α is the maximum rate of growth. This is a logistic equation with the well-known analytical solution
m(t) =mc
1 +(mc
m0− 1)e−αt
, (2)
which satisfies the initial condition m(0) = m0. Assumption 3 can be written as
dO
dt= −β dm
dt. (3)
It leads to the following equation for the amount of oxygen present in a container attime t:
O(t) = C − βm(t), (4)
where the constants β and C must be such that
O(0) = O0, limt→∞
O(t) = Oc. (5)
Solving these equations for β and C gives:
C = O0 +m0O0 −Oc
mc −m0, β =
O0 −Oc
mc −m0. (6)
The final equation for the amount of oxygen is thus
O(t) = O0 +O0 −Oc
mc −m0
m0 −
mc
1 +(mc
m0− 1)e−αt
. (7)
Introducing the normalized quantities,
O(t) =O(t)
O0, Oc =
Oc
O0, mc =
mc
m0(8)
we arrive at the dimensionless result:
O(t) = 1 +1− Oc
mc − 1
[1− mc
1 + (mc − 1) e−αt
]. (9)
Note that the measured oxygen consumption curve as presented e.g. in Figure 7 showsO(t). The functional expression (9) for the latter has three parameters that allow itto be fitted to the experimental data.
Oxygen transport and consumption in germinating seeds 15
2.3 Fitting results
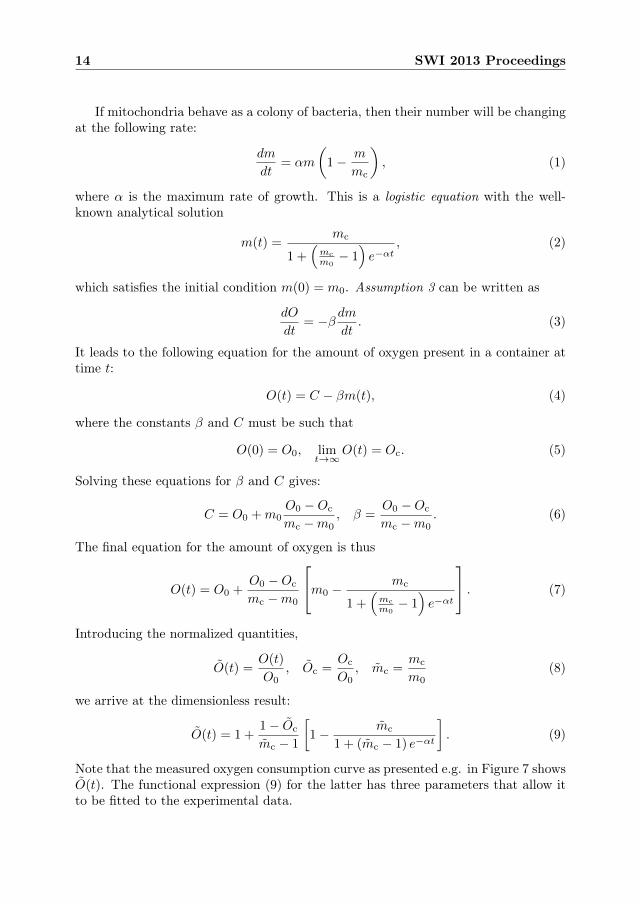
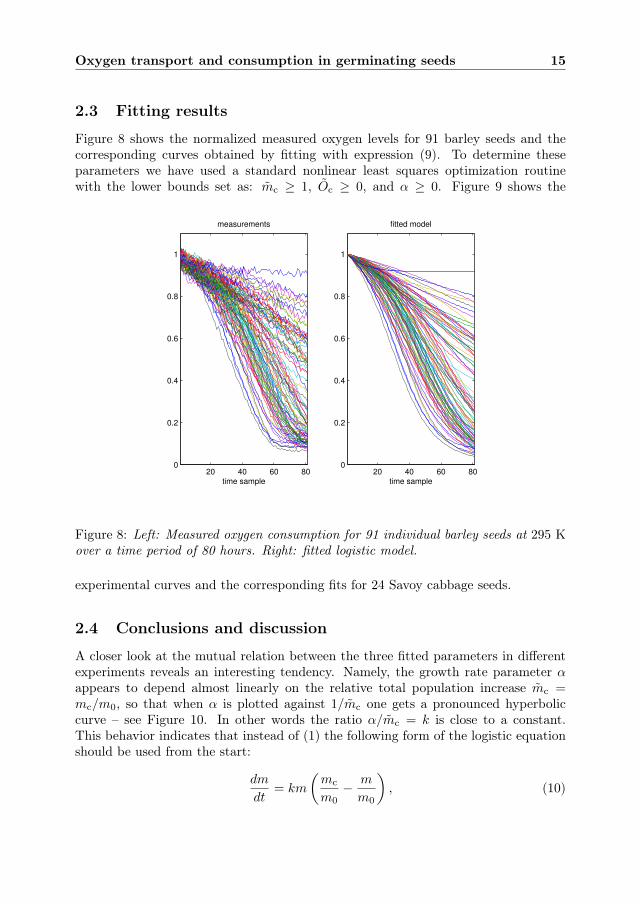
Figure 8 shows the normalized measured oxygen levels for 91 barley seeds and thecorresponding curves obtained by fitting with expression (9). To determine theseparameters we have used a standard nonlinear least squares optimization routinewith the lower bounds set as: mc ≥ 1, Oc ≥ 0, and α ≥ 0. Figure 9 shows the
20 40 60 800
0.2
0.4
0.6
0.8
1
time sample
measurements
20 40 60 800
0.2
0.4
0.6
0.8
1
time sample
fitted model
Figure 8: Left: Measured oxygen consumption for 91 individual barley seeds at 295 Kover a time period of 80 hours. Right: fitted logistic model.
experimental curves and the corresponding fits for 24 Savoy cabbage seeds.
2.4 Conclusions and discussion
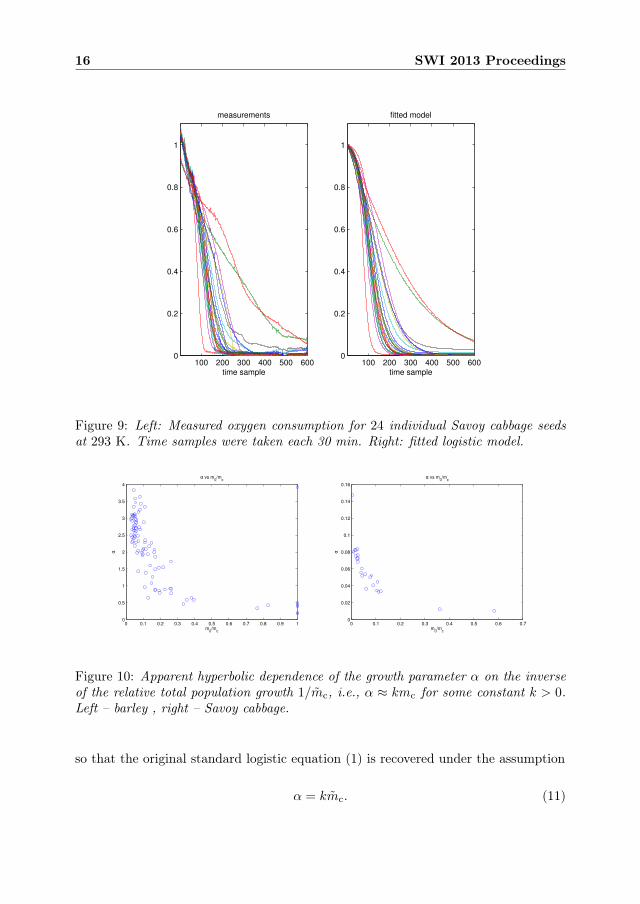
A closer look at the mutual relation between the three fitted parameters in differentexperiments reveals an interesting tendency. Namely, the growth rate parameter αappears to depend almost linearly on the relative total population increase mc =mc/m0, so that when α is plotted against 1/mc one gets a pronounced hyperboliccurve – see Figure 10. In other words the ratio α/mc = k is close to a constant.This behavior indicates that instead of (1) the following form of the logistic equationshould be used from the start:
dm
dt= km
(mc
m0− m
m0
), (10)
16 SWI 2013 Proceedings
100 200 300 400 500 6000
0.2
0.4
0.6
0.8
1
time sample
measurements
100 200 300 400 500 6000
0.2
0.4
0.6
0.8
1
time sample
fitted model
Figure 9: Left: Measured oxygen consumption for 24 individual Savoy cabbage seedsat 293 K. Time samples were taken each 30 min. Right: fitted logistic model.
0 0.1 0.2 0.3 0.4 0.5 0.6 0.7 0.8 0.9 10
0.5
1
1.5
2
2.5
3
3.5
4
α vs m0/m
c
m0/m
c
α
0 0.1 0.2 0.3 0.4 0.5 0.6 0.70
0.02
0.04
0.06
0.08
0.1
0.12
0.14
0.16
α vs m0/m
c
m0/m
c
α
Figure 10: Apparent hyperbolic dependence of the growth parameter α on the inverseof the relative total population growth 1/mc, i.e., α ≈ kmc for some constant k > 0.Left – barley , right – Savoy cabbage.
so that the original standard logistic equation (1) is recovered under the assumption
α = kmc. (11)
Oxygen transport and consumption in germinating seeds 17
Of course, the actual values of all fitted parameters reconstructed in our simulationsshould not be taken too literally as we have used a normalized time axis. This fact,however, does not invalidate our conclusions about the mutual relation between thefitted parameters. In any case, further interpretation of the biological meaning ofthese parameters will require a much wider statistical analysis in an absolute timeframe (say, in hours), as well as deeper understanding and an additional mathematicalmodel of the apparent link between the growth rate and the final relative increase inthe mitochondria population.
3 An anatomically structured model for oxygen up-take
As mentioned in Section 1.3, the main objective is to interpret the characteristicsof the oxygen consumption curve in terms of physical, biological and morphologicalproperties of the seed. The logistic model that we discussed in the previous sectioncannot be used for such explanatory purposes as it does not take any details ofunderlying shape or processes into account in its derivation.
In this section we take a first step in developing a mathematical model for oxygenuptake in a germinating seed that can be used to assess seed quality using oxygenconsumption measurements. We have chosen to focus on a seed with the simplestmorphology: the Savoy cabbage seed (Brassica oleracea var. sabuada L.). Thesehave an almost perfect spherical appearance, with a radius of approximately 1.5 mm.Although its external shape is simple, internally the anatomy can still be quite com-plicated. Sugar beet seeds (Beta vulgaris) for example have a much more complicatedmorphology both externally and internally.
3.1 Driving processes and their time and spatial scalesWe identify four processes that play a major role in the early germination stage ofthe seed.
P0. The process of water uptake (imbibition), that allows the embryonic cells torestore their water content, repair the internal molecular constitution and startfunctioning ‘normally’ in the early germination stage, i.e. targeted at supportinggrowth of the embryonic root (the radical).
P1. The process of oxygen diffusion: first through the seed coat and next through theseed’s interior to reach the embryonic cells where it is finally used in metabolism.
P2. The process of celullar respiration, i.e. the oxygen uptake and consumption bythe cells in the seed.
P3. The process of asymmetric cell division of the embryonic cells in the growthtip in the radical that results in growth. (We shall discuss this process in moredetail below).
18 SWI 2013 Proceedings
The initial repair process P0 is hard to describe in detail. In view of the oxygenconsumption curve it corresponds to the first 15 hour time period in Figure 7, whenoxygen consumption appears to happen at an approximately constant rate. We shallignore this phase and focus on capturing the increased consumption rate and latersteady decrease. Hence, we assume that P0 has been completed and only considerP1, P2 and P3.
As a first step toward the deduction of the model it is important to assess thecharacteristic time scales of processes P1–P3 (see e.g. [6]). We will use the availableexperimental data as much as possible. Otherwise, assumptions will be made. Aware-ness of these time scales motivates modelling decisions concerning its mathematicalstructure: i.e. whether the model will be formulated in terms of either ordinary differ-ential equations or partial differential equations, depending on whether the processesinvolving the spatial variables can be neglected.
We now consider processes P1–P3 in further detail.
3.1.1 Oxygen uptake through seed coat and internal diffusion
The seed coat forms a barrier for oxygen transport. The physical and biochemicaldetails of oxygen uptake through the seed coat, which is part of P1, are largelyunknown. The application of artificial coatings to the seed coat are known to stronglyinfluence oxygen uptake. Therefore, this process is taken as an important unknownin our model. Measurements have been performed on the permeability of the skin offruits like apple, pear and nectarine though, cf. [8]. Such results for the seed coats ofseeds of cabbage or sugar beet were not found in the literature.
The seeds of all species discussed in the report will have a complicated internalstructure (cf. Figure 4). It is possible that there is free intercellular space in celltissue through which oxygen and carbon dioxide can diffuse freely (see e.g. the freeintercellular space volumes reported for flesh tissue in fruits like apple, pear andnectarine ranging from 17 to 2% respectively, cf. [8]). Similar structures are expectedin seeds, but quantitive information was lacking. However, imbibition may havecaused such channels to become water-filled. This makes a great difference for theeffective diffusivity of oxygen through the cell tissue from the seed coat to the tissuewhere it is consumed most during germination. In fact, diffusion of oxygen in airis four orders of magnitude faster than that in water (cf. [2, 7]). The estimateddiffusivity of oxygen in fruit flesh tissue is approximately 1.5× 10⁻⁷ m2/s on average[8].
Diffusivity: Value: Description:DO2−water 2× 10⁻⁹ m2/s Diffusivity of oxygen in water at 298 K
(Wilke & Chang [2])DO2−air 1.8× 10⁻⁵ m2/s Diffusivity of oxygen in air at standard
temperature (273 K) and pressure(1013 hPa; Massman [7], Table 8).
DO2−fruit 0.3− 2.7× 10⁻⁷m2/s Estimated diffusivity of oxygen in fruitflesh (at 293 K, Rajapakse et al. [8]).
Oxygen transport and consumption in germinating seeds 19
Collis-George & Melville [3] computed and discussed oxygen distribution profilesin four models for a spherical seed with specific assumptions on the properties ofcellular respiration. In these models it is assumed that all seed tissue cells respire inthe same fashion, i.e. the functional description for the local oxygen consumption rateis the same throughout the whole seed. In our study, we assume that most of oxygenuptake takes place in the dividing embryonic root cells. A steep oxygen gradient aspredicted by the models in [3] in the tissue between seed coat and embryonic rootis then expected to be more shallow. No measurements were available to supportthe theoretically reasonable oxygen gradient from seed coat to embryonic root byexperimental data.
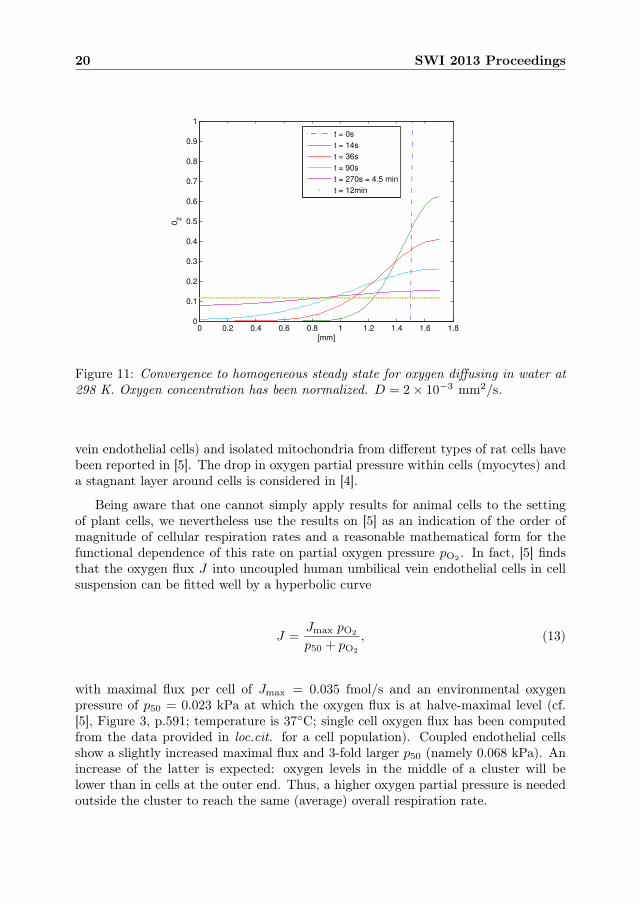
The time scale of convergence to a homogeneous steady state has been investigatednumerically in a one-dimensional linear diffusion problem
∂u
∂t= D
∂2u
∂x2on [0, 1.7]
(in units mm and s for length and time). We took D = 2× 10⁻³ mm2/s, the minimalreported diffusivity for oxygen. In other cases equilibration will be faster. The initialcondition is a step-wise normalized oxygen distribution u0:
u0(x) =
{0, x ∈ [0, 1.5],
1, x ∈ (1.5, 1.7].
Neumann boundary conditions (i.e. zero-flux) are imposed at both boundaries.The computed evolution of the normalized oxygen concentration profile is shown
in Figure 11. The system equilibrates on a time scale
Td ≈ 700 s ≈ 12 min = 0.2 h.
The partitioning of oxygen between water and air is given by Henry’s Law,
[O2]water = kH,cp pO2 , (12)
where the Henry’s Law constant kH,cp, or oxygen solubility, equals 12 µM/kPa [5, 4](at 293 K). Equivalently one may use the dimensionless Henry’s Law constant kH interms of concentrations:
[O2]water = kH [O2]air,
where kH = 0.03 at 293 K.
3.1.2 Cellular respiration: oxygen uptake and consumption
Detailed information on cellular respiration of (different types of) cells in seeds is hardto obtain. Rajapakse et al. [8] provide measured respiration rates for some fruits.Detailed measurement of changes in cellular respiration as a function of external oxy-gen pressure around mammalian cells (e.g. rat cardiomyocytes and human umbilical
20 SWI 2013 Proceedings
0 0.2 0.4 0.6 0.8 1 1.2 1.4 1.6 1.80
0.1
0.2
0.3
0.4
0.5
0.6
0.7
0.8
0.9
1
[mm]
02
t = 0s
t = 14s
t = 36s
t = 90s
t = 270s = 4.5 min
t = 12min
Figure 11: Convergence to homogeneous steady state for oxygen diffusing in water at298 K. Oxygen concentration has been normalized. D = 2× 10⁻³ mm2/s.
vein endothelial cells) and isolated mitochondria from different types of rat cells havebeen reported in [5]. The drop in oxygen partial pressure within cells (myocytes) anda stagnant layer around cells is considered in [4].
Being aware that one cannot simply apply results for animal cells to the settingof plant cells, we nevertheless use the results on [5] as an indication of the order ofmagnitude of cellular respiration rates and a reasonable mathematical form for thefunctional dependence of this rate on partial oxygen pressure pO2 . In fact, [5] findsthat the oxygen flux J into uncoupled human umbilical vein endothelial cells in cellsuspension can be fitted well by a hyperbolic curve
J =Jmax pO2
p50 + pO2
, (13)
with maximal flux per cell of Jmax = 0.035 fmol/s and an environmental oxygenpressure of p50 = 0.023 kPa at which the oxygen flux is at halve-maximal level (cf.[5], Figure 3, p.591; temperature is 37◦C; single cell oxygen flux has been computedfrom the data provided in loc.cit. for a cell population). Coupled endothelial cellsshow a slightly increased maximal flux and 3-fold larger p50 (namely 0.068 kPa). Anincrease of the latter is expected: oxygen levels in the middle of a cluster will belower than in cells at the outer end. Thus, a higher oxygen partial pressure is neededoutside the cluster to reach the same (average) overall respiration rate.
Oxygen transport and consumption in germinating seeds 21
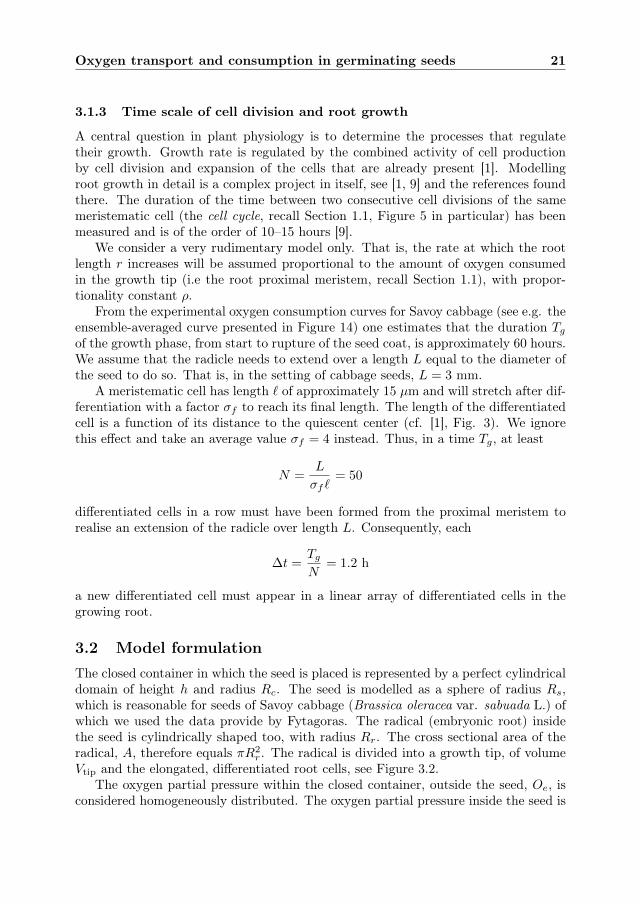
3.1.3 Time scale of cell division and root growth
A central question in plant physiology is to determine the processes that regulatetheir growth. Growth rate is regulated by the combined activity of cell productionby cell division and expansion of the cells that are already present [1]. Modellingroot growth in detail is a complex project in itself, see [1, 9] and the references foundthere. The duration of the time between two consecutive cell divisions of the samemeristematic cell (the cell cycle, recall Section 1.1, Figure 5 in particular) has beenmeasured and is of the order of 10–15 hours [9].
We consider a very rudimentary model only. That is, the rate at which the rootlength r increases will be assumed proportional to the amount of oxygen consumedin the growth tip (i.e the root proximal meristem, recall Section 1.1), with propor-tionality constant ρ.
From the experimental oxygen consumption curves for Savoy cabbage (see e.g. theensemble-averaged curve presented in Figure 14) one estimates that the duration Tgof the growth phase, from start to rupture of the seed coat, is approximately 60 hours.We assume that the radicle needs to extend over a length L equal to the diameter ofthe seed to do so. That is, in the setting of cabbage seeds, L = 3 mm.
A meristematic cell has length ` of approximately 15 µm and will stretch after dif-ferentiation with a factor σf to reach its final length. The length of the differentiatedcell is a function of its distance to the quiescent center (cf. [1], Fig. 3). We ignorethis effect and take an average value σf = 4 instead. Thus, in a time Tg, at least
N =L
σf `= 50
differentiated cells in a row must have been formed from the proximal meristem torealise an extension of the radicle over length L. Consequently, each
∆t =TgN
= 1.2 h
a new differentiated cell must appear in a linear array of differentiated cells in thegrowing root.
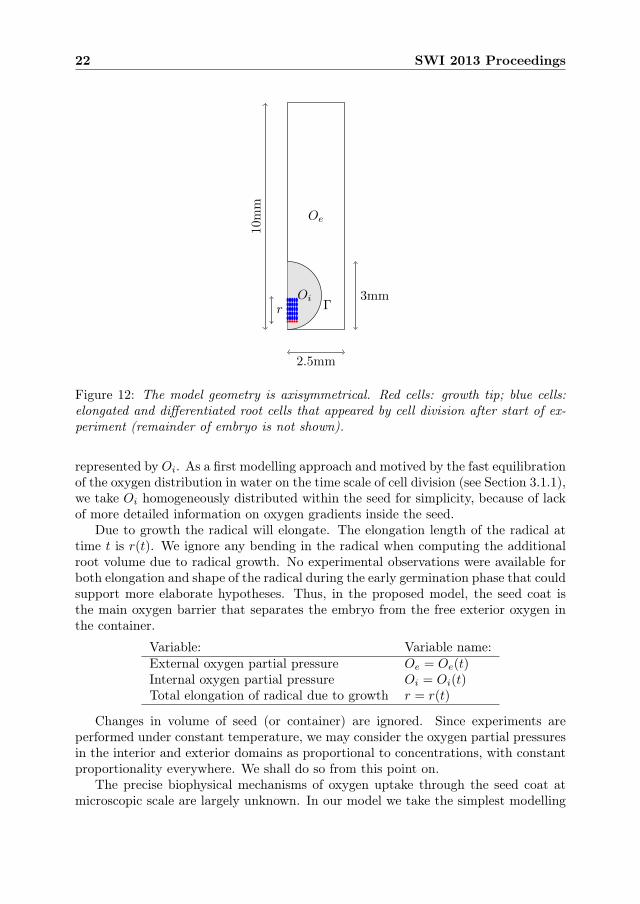
3.2 Model formulationThe closed container in which the seed is placed is represented by a perfect cylindricaldomain of height h and radius Rc. The seed is modelled as a sphere of radius Rs,which is reasonable for seeds of Savoy cabbage (Brassica oleracea var. sabuada L.) ofwhich we used the data provide by Fytagoras. The radical (embryonic root) insidethe seed is cylindrically shaped too, with radius Rr. The cross sectional area of theradical, A, therefore equals πR2
r . The radical is divided into a growth tip, of volumeVtip and the elongated, differentiated root cells, see Figure 3.2.
The oxygen partial pressure within the closed container, outside the seed, Oe, isconsidered homogeneously distributed. The oxygen partial pressure inside the seed is
22 SWI 2013 Proceedings
10m
m
3mm
2.5mm
Oe
OiΓr
Figure 12: The model geometry is axisymmetrical. Red cells: growth tip; blue cells:elongated and differentiated root cells that appeared by cell division after start of ex-periment (remainder of embryo is not shown).
represented by Oi. As a first modelling approach and motived by the fast equilibrationof the oxygen distribution in water on the time scale of cell division (see Section 3.1.1),we take Oi homogeneously distributed within the seed for simplicity, because of lackof more detailed information on oxygen gradients inside the seed.
Due to growth the radical will elongate. The elongation length of the radical attime t is r(t). We ignore any bending in the radical when computing the additionalroot volume due to radical growth. No experimental observations were available forboth elongation and shape of the radical during the early germination phase that couldsupport more elaborate hypotheses. Thus, in the proposed model, the seed coat isthe main oxygen barrier that separates the embryo from the free exterior oxygen inthe container.
Variable: Variable name:External oxygen partial pressure Oe = Oe(t)Internal oxygen partial pressure Oi = Oi(t)Total elongation of radical due to growth r = r(t)
Changes in volume of seed (or container) are ignored. Since experiments areperformed under constant temperature, we may consider the oxygen partial pressuresin the interior and exterior domains as proportional to concentrations, with constantproportionality everywhere. We shall do so from this point on.
The precise biophysical mechanisms of oxygen uptake through the seed coat atmicroscopic scale are largely unknown. In our model we take the simplest modelling
Oxygen transport and consumption in germinating seeds 23
approach, by representing the seed coat as a barrier with unknown permeability a foroxygen (of dimension of velocity). The total flux of oxygen from the exterior into theseed through the seed coat is then given by
Jsc := aSΓ(R∗Oe −Oi), (14)
where R∗ is the so-called accumulation ratio and allows for modelling asymmetrictransport properties of the barrier. SΓ is the total area of the spherical seed coat:SΓ = 4πR2
s. At steady state, i.e. when there is no flux through the barrier, Oi =R∗Oe. We have taken R∗ = kH , Henry’s Law constant, thinking of oxygen dissolvinginto water inside the seed.
The uptake of oxygen by cells in the embryo and any remaining cells in the en-dosperm is considered to be due mainly to mitochondrial activity, which depends onthe oxygen partial pressure (see [5]). We let J(Oi) denote the average amount ofoxygen consumed by cells per unit time per unit volume. It is of the form:
J(Oi) =JmaxOiJ0 +Oi
(15)
(see Section 3.1.2). We allow cells in the growth tip to consume a factor α more thanthis average amount, because these cells are most active.
We thus arrive at the following model equations:
VidOidt
= −J(Oi)(αVtip +Ar + Vi) + aSΓ(kHOe −Oi), (16)
VedOedt
= aSΓ(Oi − kHOe), (17)
dr
dt= ρJ(Oi)Vtip, (18)
with initial conditions
Oi(0) = Oi,0, Oe(0) = Oe,0, r(0) = 0. (19)
The factor ρ in equation (18) is the oxygen-to-root biomass conversion factor. Itmeasures the amount of oxygen needed in the growth tip to divide, differentiate andstretch to produce root biomass in terms of increased root length.
3.3 Fit to experimental data
The model equations (16)–(18) contain 12 parameters and two initial conditions.The dimension of this parameter space is too high to determine all of them from theexperimental data that gives detailed time series of just one component of the solutiononly. The approach would be to solve an optimisation problem to minimize thedistance between the solution of the model equations and the averaged experimentalcurve for a suitably chosen objective function. There may be difficulties in solving the
24 SWI 2013 Proceedings
optimisation problem due to this limited information. Moreover, even if a sufficientlygood solution is found, some of the parameters obtained may not be in a biologicallyreasonable range, causing interpretation issues.
However, some of the parameters and initial conditions can be estimated a priori,based on the given geometry of the experimental environment, anatomical informationon the seeds and values found in the literature (often for other organisms however).In Section 3.3.1 we discuss these estimates that allow us to reduce the number ofunknown parameters to two: the seed coat permeability a and the excess oxygenconsumption factor α.
3.3.1 A priori estimating model parameters
Table 1 summarizes the parameter values that can be fixed by the geometric set-upof the experiments and seed morphology. We now discuss the constraints imposed onphysiological parameter values using information found in the literature (see Sections3.1.1–3.1.3) and the estimation of initial values.
The initial external oxygen concentration outside the seed just after the containerhas been closed, O0
e can be computed using an atmospheric pressure of 100 kPa,temperature of 293 K and oxygen content of 20%:
O0e = 0.2× p
TR= 0.2× 100 kPa
293 K · 8.315 L/mol K kPa
= 8.21× 10⁻³ mol/L = 2.6× 10⁻⁴ mg/mm3.
We assume that the initial internal oxygen concentration at that time is at equilibriumwith the external initial oxygen concentration over the seed coat barrier:
O0i = kHO
0e = 0.03× 2.6× 10−4 mg/mm3 = 7.8× 10⁻⁶ mg/mm3.
The model (16)–(19) describes the oxygen consumption during the growth phase,following the repair phase. The start of the growth phase has been determined byvisual inspection of average oxygen consumption curve (i.e. the consumption curveby averaging the individual curves of all seeds in the experimental run). It is taken atapproximately time t = 30 h after the start of the experiment (see Figure 14). At thattime, the oxygen level within the container has dropped to 79% of the initial level.At the end of the experiment, it has dropped to 19% of the initial level. The initialconditions Oe,0 and Oi,0 are computed from O0
e and O0i by taking this reduction into
account:Oe,0 = 0.79×O0
e , Oi,0 = 0.79×O0i .
Gnaiger et al. [5] report on various values for the oxygen partial pressure withinthe cells such that cellular oxygen consumption or mitochondrial oxygen consumptionis at halve-maximal value. At 298 K, these values are in a range of roughly 0.005–0.08 kPa for mitochondria in animal cells, with a bias towards the lower values in the
Oxygen transport and consumption in germinating seeds 25
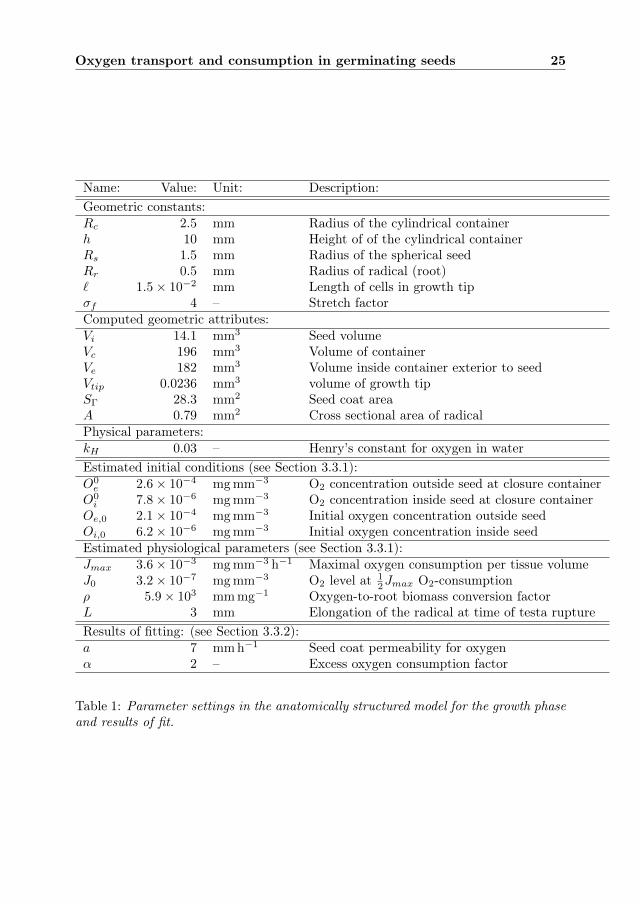
Name: Value: Unit: Description:Geometric constants:Rc 2.5 mm Radius of the cylindrical containerh 10 mm Height of of the cylindrical containerRs 1.5 mm Radius of the spherical seedRr 0.5 mm Radius of radical (root)` 1.5× 10⁻² mm Length of cells in growth tipσf 4 – Stretch factorComputed geometric attributes:Vi 14.1 mm3 Seed volumeVc 196 mm3 Volume of containerVe 182 mm3 Volume inside container exterior to seedVtip 0.0236 mm3 volume of growth tipSΓ 28.3 mm2 Seed coat areaA 0.79 mm2 Cross sectional area of radicalPhysical parameters:kH 0.03 – Henry’s constant for oxygen in waterEstimated initial conditions (see Section 3.3.1):O0e 2.6× 10⁻⁴ mg mm−3 O2 concentration outside seed at closure container
O0i 7.8× 10⁻⁶ mg mm−3 O2 concentration inside seed at closure container
Oe,0 2.1× 10⁻⁴ mg mm−3 Initial oxygen concentration outside seedOi,0 6.2× 10⁻⁶ mg mm−3 Initial oxygen concentration inside seedEstimated physiological parameters (see Section 3.3.1):Jmax 3.6× 10⁻³ mg mm−3 h−1 Maximal oxygen consumption per tissue volumeJ0 3.2× 10⁻⁷ mg mm−3 O2 level at 1
2Jmax O2-consumptionρ 5.9× 103 mm mg−1 Oxygen-to-root biomass conversion factorL 3 mm Elongation of the radical at time of testa ruptureResults of fitting: (see Section 3.3.2):a 7 mm h−1 Seed coat permeability for oxygenα 2 – Excess oxygen consumption factor
Table 1: Parameter settings in the anatomically structured model for the growth phaseand results of fit.
26 SWI 2013 Proceedings
range. We take 0.025 kPa. This yields an intracellular oxygen concentration of
J0 =pO2
RT=
0.025 kPa
8.315 kPa L/mol K · 298 K= 1.0× 10⁻⁵ M
= 3.2× 10⁻⁷ mg/mm3.
We ignore at this point the effects of an intracellular oxygen gradient from cell mem-brane towards the mitochondria.
Moreover, Gnaiger et al. [5] provide values for the maximal oxygen consumptionof human umbilical vein endothelial cells of 80− 100 pmol/s per cm3 of experimentalmedium that contained 2.6 × 10⁶ cells per cm3. For the value of 100 pmol/s thisimplies a maximal consumtion rate of 0.038 fmol/s per cell. For a cylindrical cellwith a length of 15 µm and diameter of 10 µm (i.e. of volume 1.2× 10⁻⁶ mm3), thisamounts to
Jmax = 3.1× 10⁴ fmol/mm3 s = 3.6× 10⁻³ mg/mm3 h.
The oxygen-to-biomass conversion factor ρ can be estimated in the following man-ner. The oxygen consumption function J(Oi) is such that it has a quite sharp switchbetween maximal consumption and almost no consumption (cf. [5]). So we assumethat it operates at maximal value for most of the growth phase. Therefore,
ρ ≈ ∆r
∆t· 1
Jmax · Vtip=
3 mm
60 h· 1
8.5× 10⁻⁵ mg/h= 5.7× 103 mm/mg.
3.3.2 Fitting results
The remaining two parameters, a and α, in the model were determined by solvingan optimisation problem to fit the experimental data. As targets in the optimisationprocess the following were considered:
• The ensemble-averaged time historyO∗e(t) of the measured external oxygen level;
• The final root length r∗f := r(Tg) = L.
The optimisation problem consisted of minimising the cost function
F = ‖Oe −O∗e‖22 + w|r(Tg)− r∗f |2,
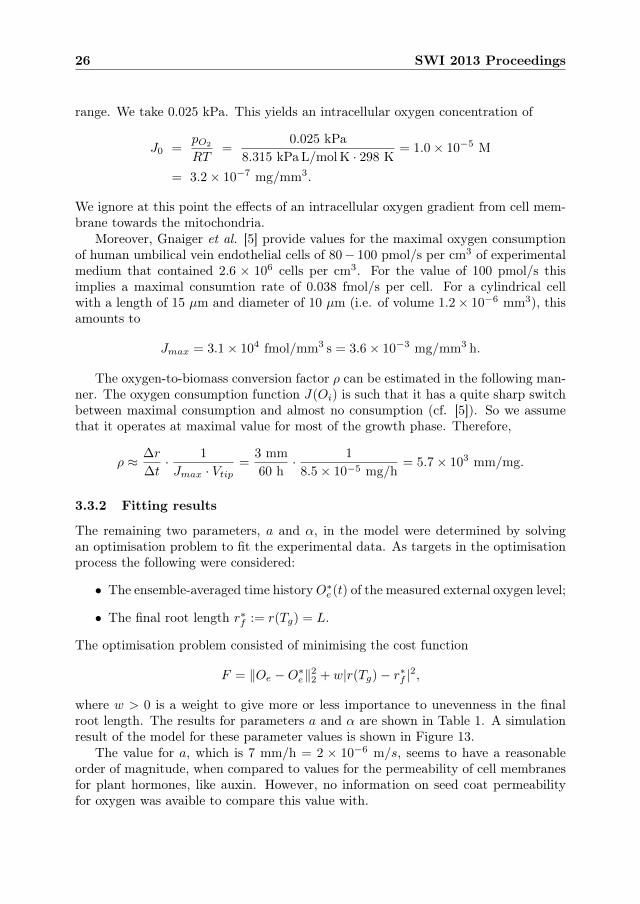
where w > 0 is a weight to give more or less importance to unevenness in the finalroot length. The results for parameters a and α are shown in Table 1. A simulationresult of the model for these parameter values is shown in Figure 13.
The value for a, which is 7 mm/h = 2 × 10⁻⁶ m/s, seems to have a reasonableorder of magnitude, when compared to values for the permeability of cell membranesfor plant hormones, like auxin. However, no information on seed coat permeabilityfor oxygen was avaible to compare this value with.
Oxygen transport and consumption in germinating seeds 27
0 10 20 30 40 50 600
0.1
0.2
0.3
0.4
0.5
0.6
0.7
0.8
0.9
1
time [hours]
O
e simulated
Oe measured
embryo length
Figure 13: Simulation result for the anatomically structured model (16)–(19) for thegrowth phase with parameter settings as summarised in Table 1. The data are obtainedfrom Savoy cabbage.
3.4 An extended model including the initial repair phase
The model (16)–(19) does not describe the repair phase that preceeds the growthphase. In this section we suggest an extension of the former model, which can beused to fit the entire oxygen consumption curve, including the initial repair process.Moreover, the experimental oxygen consumption curve is almost flat after approxi-mately 80 hours. This fact seems difficult to account for directly with the oxygenconsumption function J(Oi) that was used in the previous model.
We suggest two modifications. Firstly, we realise that a higher oxygen level outsidethe growing cells is needed to create an internal oxygen concentration at the mitochon-dria to keep these ‘maximally’ functioning (see e.g. [4]). The simplest way to includethis into the model, is to introduce a threshold value Oi for the oxygen concentrationoutside the cells: if the oxygen concentration is below this value, the intra-cellularconcentration near the mitochondria becomes so low that they stop functioning. Thisis realised mathematically by replacing Oi in J(Oi) by (Oi − Oi)+, where (x)+ is thepositive part of x:
(x)+ :=
{x, if x ≥ 0,
0, if x < 0.
Secondly, in model (16)–(19) we implicitly assumed that all cells in the embryonicroot need the same, fixed, time to complete their repair phase and start the growthphase. A more relaxed assumption is that these times are normally distributed.
Thus, in our extended model, equations (16)–(18) remain the same except for
28 SWI 2013 Proceedings
0 10 20 30 40 50 60 70 80 900
0.1
0.2
0.3
0.4
0.5
0.6
0.7
0.8
0.9
1
time [hours]
O
e simulated
Oe measured
embryo length
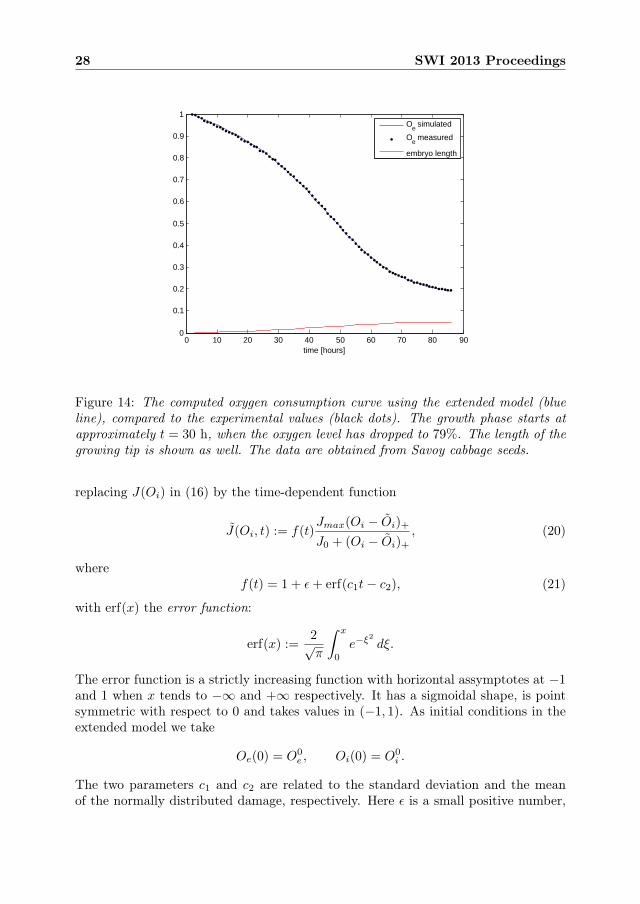
Figure 14: The computed oxygen consumption curve using the extended model (blueline), compared to the experimental values (black dots). The growth phase starts atapproximately t = 30 h, when the oxygen level has dropped to 79%. The length of thegrowing tip is shown as well. The data are obtained from Savoy cabbage seeds.
replacing J(Oi) in (16) by the time-dependent function
J(Oi, t) := f(t)Jmax(Oi − Oi)+
J0 + (Oi − Oi)+
, (20)
wheref(t) = 1 + ε+ erf(c1t− c2), (21)
with erf(x) the error function:
erf(x) :=2√π
∫ x
0
e−ξ2
dξ.
The error function is a strictly increasing function with horizontal assymptotes at −1and 1 when x tends to −∞ and +∞ respectively. It has a sigmoidal shape, is pointsymmetric with respect to 0 and takes values in (−1, 1). As initial conditions in theextended model we take
Oe(0) = O0e , Oi(0) = O0
i .
The two parameters c1 and c2 are related to the standard deviation and the meanof the normally distributed damage, respectively. Here ε is a small positive number,
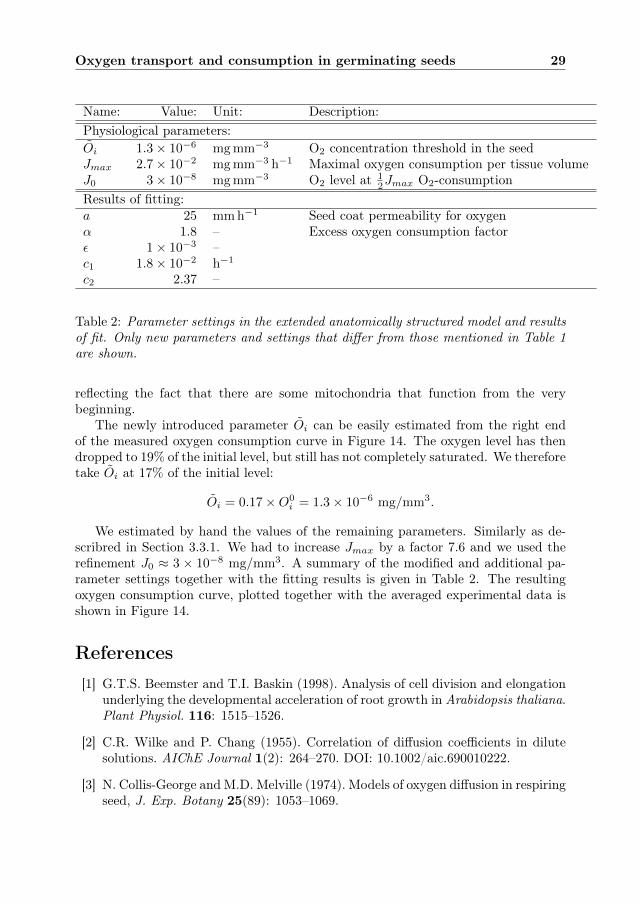
Oxygen transport and consumption in germinating seeds 29
Name: Value: Unit: Description:Physiological parameters:Oi 1.3× 10⁻⁶ mg mm−3 O2 concentration threshold in the seedJmax 2.7× 10⁻² mg mm−3 h−1 Maximal oxygen consumption per tissue volumeJ0 3× 10⁻⁸ mg mm−3 O2 level at 1
2Jmax O2-consumptionResults of fitting:a 25 mm h−1 Seed coat permeability for oxygenα 1.8 – Excess oxygen consumption factorε 1× 10⁻³ –c1 1.8× 10⁻² h−1
c2 2.37 –
Table 2: Parameter settings in the extended anatomically structured model and resultsof fit. Only new parameters and settings that differ from those mentioned in Table 1are shown.
reflecting the fact that there are some mitochondria that function from the verybeginning.
The newly introduced parameter Oi can be easily estimated from the right endof the measured oxygen consumption curve in Figure 14. The oxygen level has thendropped to 19% of the initial level, but still has not completely saturated. We thereforetake Oi at 17% of the initial level:
Oi = 0.17×O0i = 1.3× 10⁻⁶ mg/mm3.
We estimated by hand the values of the remaining parameters. Similarly as de-scribred in Section 3.3.1. We had to increase Jmax by a factor 7.6 and we used therefinement J0 ≈ 3 × 10⁻⁸ mg/mm3. A summary of the modified and additional pa-rameter settings together with the fitting results is given in Table 2. The resultingoxygen consumption curve, plotted together with the averaged experimental data isshown in Figure 14.
References[1] G.T.S. Beemster and T.I. Baskin (1998). Analysis of cell division and elongation
underlying the developmental acceleration of root growth in Arabidopsis thaliana.Plant Physiol. 116: 1515–1526.
[2] C.R. Wilke and P. Chang (1955). Correlation of diffusion coefficients in dilutesolutions. AIChE Journal 1(2): 264–270. DOI: 10.1002/aic.690010222.
[3] N. Collis-George and M.D. Melville (1974). Models of oxygen diffusion in respiringseed, J. Exp. Botany 25(89): 1053–1069.
30 SWI 2013 Proceedings
[4] K.E. Dionne (1990). Oxygen transport to respiring myocytes, J. Biol. Chem.265: 15400–15402.
[5] E. Gnaiger, R. Steinlechner-Maran, G. Méndez, Th. Eberl and R. Margreiter(1995). Control of mitochondrial and cellular respiration by oxygen, J. Bioener-getics and Biomembranes 27(6): 583–596.
[6] J. Mauseth (2011). An Introduction to Plant Biology, Jones & Bartlett Learning.
[7] W.J. Massman (1998). A review of molecular diffusivities of H2O, CO2, CH4, CO,O3, SO3, NH3, N2O, NO, and NO2 in air, O2 and N2 near STP, AtmosphericEnvironment 32(6): 1111–1127.
[8] N.C. Rajapakse, N.H. Banks, E.W. Hewett and D.J. Cleland (1990). Develop-ment of oxygen concentration gradients in flesh tissues of bulky plant organs, J.Amer. Soc. Hort. Sci. 115(5): 793–797.
[9] P.L. Webster and R.D. MacLeod (1980). Characteristics of root apical meristemcell population kinetics: a review of analyses and concepts, Environmental Exp.Bot. 20: 335–358.