Embed Size (px)
DESCRIPTION
Engineering Transactions, 58, 15-74, 2010.
Citation preview

ENGINEERING TRANSACTIONS • Engng. Trans. • 58, 1–2, 15–74, 2010Polish Academy of Sciences • Institute of Fundamental Technological Research
THE THERMODYNAMICAL THEORY OF ELASTO-VISCOPLASTICITYFOR DESCRIPTION OF NANOCRYSTALLINE METALS
P. P e r z y n a
Institute of Fundamental Technological ResearchPolish Academy of Sciences
Pawińskiego 5B, 02-106 Warszawa, Poland
The main objective of the present paper is the development of thermodynamical elasto-viscoplastic constitutive model describing the behaviour of nanocrystalline metals. Only fcc,bcc and hcp metals will be covered in this description, because they are the classes of metals forwhich systematic experimental observation data sets are available. Investigation of the deforma-tion mechanisms is important for understanding, controlling and optimizing of the mechanicalproperties of nanocrystalline metals. Strengthening with grain size refinement in metals andalloys, with an average grain size of 100 nm or larger, has been well characterized by theHall-Petch (H-P) relationship, where dislocation pile-up against grain boundaries, along withother transgranular dislocations mechanisms, are the dominant strength-controlling processes.When the average, and entire range of grain sizes is reduced to less than 100 nm, the dislo-cation operation becomes increasingly more difficult and grain boundary-mediated processesbecome increasingly more important. The principal short-range barrier, the Peierls-Nabarrostress, is important for ultrafine crystalline bcc metals, whereas in ultrafine crystalline fcc andhcp metals, forest dislocations are the primary short-range barriers at lower temperatures. Ex-perimental observations have shown that nanosized grains rotate during plastic deformationand can coalesce along directions of shear, creating larger paths for dislocation movement.
The model is developed within the thermodynamic framework of the rate-type covarianceconstitutive structure with a finite set of the internal state variables.
The thermodynamic restrictions have been satisfied and the rate-type constitutive equa-tions have been determined. Fracture criterion based on the evolution of the anisotropic intrin-sic microdamage is formulated. The fundamental features of the proposed constitutive theoryhave been carefully discussed.
1. Prologue
Application of nanocrystalline metals, ceramics and composites in moderntechnology are recently multiplying rapidly. Nanocrystalline materials have beenthe subject of widespread investigations over the past couple of decades, withsignificant advancement in their processing as well as understanding of the me-chanical properties and novel deformation mechanisms. Nanocrystalline materi-als are defined as those with their average and entire range of grain size, typicallyfiner than 100 nm; ultrafine crystalline materials are defined as those with grain

16 P. PERZYNA
sizes of the order of 100 nm – 1 µm; when one or more dimensions on averageare smaller than 100 nm, the material is often termed “a nanostructured mater-ial”. Comparison of the average grain size of crystalline materials with length ofelectromagnetic waves is shown in Fig. 1.
nc – nanocrystalline materials = with their average and entire range of grain size finer than 100 nmufc – ultrafine crystalline materials = with grain size on the order of 100 nm – 1 µmmc – microcrystalline materials = with average grain sizes greater than 1 µmns – nanostructured materials = with one or more dimensions on average smaller than 100 nm
Fig. 1. Comparison of the average grain size of crystalline materials with lengthof electromagnetic waves.
The main objective of the present paper is the development of thermodynam-ical elasto-viscoplastic constitutive model describing the behaviour of nanocrys-talline metals. Only fcc, bcc and hcp metals will be covered in this description,because they are the classes of metals for which systematic experimental obser-vation data sets are available.
Experimental observations and physical foundations concerning the behav-iour of nanocrystalline metals under quasistatic and dynamic loading are dis-cussed. Analysis of strength, ductility, strain rate sensitivity, temperature depen-dence, strain-induced anisotropy, anisotropy of microdamage processes, micros-hear and macroshear banding, have been presented. Investigation of the defor-mation mechanisms is important for understanding, controlling and optimizingthe mechanical properties of nanocrystalline metals.
Based on experimental observations we can suggest that intrinsic microdam-age processes in nanocrystalline metals depend very much on the strain-rateeffects. A microdamage process is treated as a sequence of nucleation, growthand coalescence of micro(nano)voids or micro(nano)cracks. The spacing of dim-ples, however for nanocrystalline metals, is considerably larger than the grainsize in their specimen, cf. Meyers et al. [24]. It is important to note that a mi-crodamage process in nanocrystalline metals, is of a very anisotropic nature.
A set of internal state variables µ = (εp,ξ,α, d) consists of two scalars andtwo tensors, namely the equivalent inelastic deformation εp, the second-order
THE THERMODYNAMICAL THEORY OF ELASTO-VISCOPLASTICITY ... 17
microdamage tensor ξ with the physical interpretation that (ξ : ξ)1/2 = ξ definesthe volume fraction porosity, the residual stress tensor (the back stress) α and d– the mean grain diameter. The equivalent inelastic deformation εp describes thedissipation effects generated by viscoplastic flow phenomena, the microdamagetensor ξ takes into account the anisotropic intrinsic microdamage mechanisms oninternal dissipation, the back stress tensor α aims at the description of dissipationeffects caused by the kinematic hardening, and d describes the dynamic graingrowth during intensive deformation process.
2. Experimental observations
2.1. The behaviour of nanocrystalline metals under quasistatic loadings
Grain size is known to have a significant effect on the mechanical behaviourof materials. The yield stress for metals is increasing when the grain size isdecreasing.
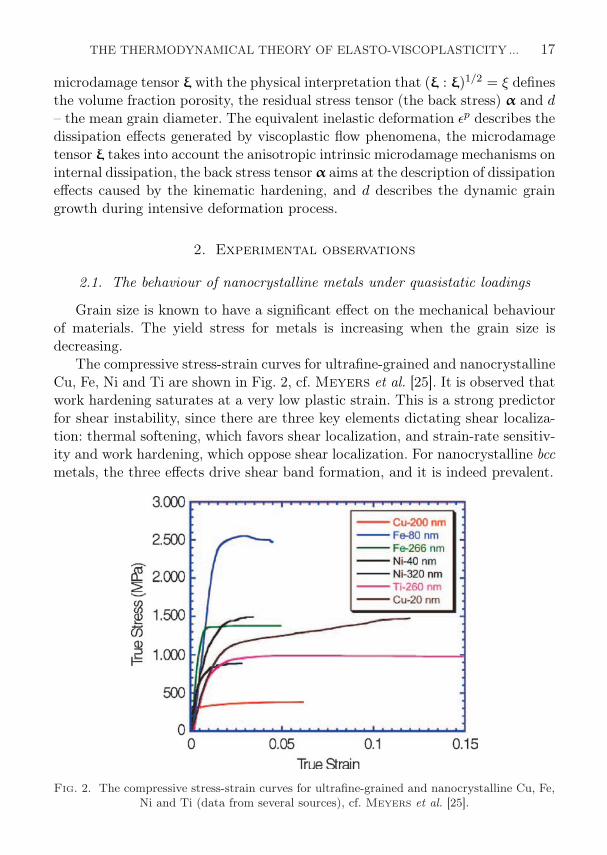
The compressive stress-strain curves for ultrafine-grained and nanocrystallineCu, Fe, Ni and Ti are shown in Fig. 2, cf. Meyers et al. [25]. It is observed thatwork hardening saturates at a very low plastic strain. This is a strong predictorfor shear instability, since there are three key elements dictating shear localiza-tion: thermal softening, which favors shear localization, and strain-rate sensitiv-ity and work hardening, which oppose shear localization. For nanocrystalline bccmetals, the three effects drive shear band formation, and it is indeed prevalent.
Fig. 2. The compressive stress-strain curves for ultrafine-grained and nanocrystalline Cu, Fe,Ni and Ti (data from several sources), cf. Meyers et al. [25].
18 P. PERZYNA
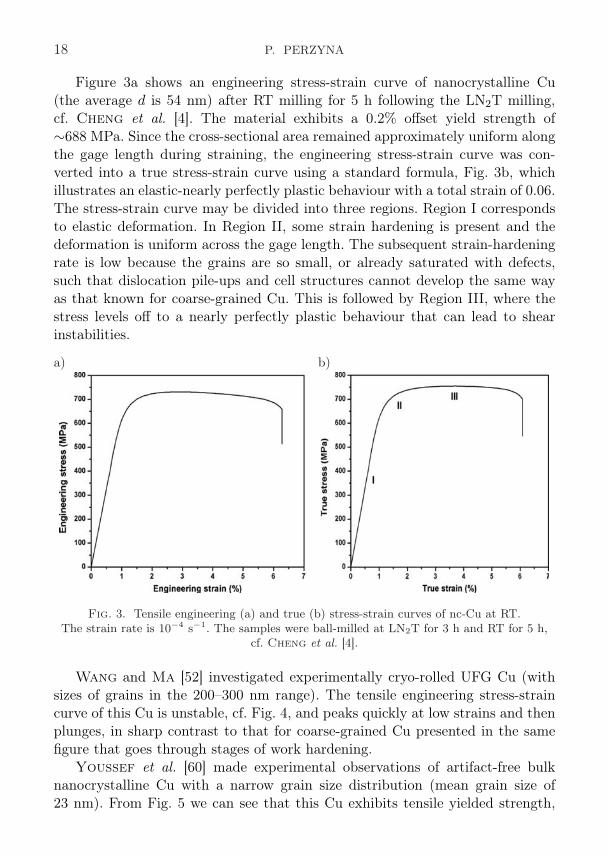
Figure 3a shows an engineering stress-strain curve of nanocrystalline Cu(the average d is 54 nm) after RT milling for 5 h following the LN2T milling,cf. Cheng et al. [4]. The material exhibits a 0.2% offset yield strength of∼688 MPa. Since the cross-sectional area remained approximately uniform alongthe gage length during straining, the engineering stress-strain curve was con-verted into a true stress-strain curve using a standard formula, Fig. 3b, whichillustrates an elastic-nearly perfectly plastic behaviour with a total strain of 0.06.The stress-strain curve may be divided into three regions. Region I correspondsto elastic deformation. In Region II, some strain hardening is present and thedeformation is uniform across the gage length. The subsequent strain-hardeningrate is low because the grains are so small, or already saturated with defects,such that dislocation pile-ups and cell structures cannot develop the same wayas that known for coarse-grained Cu. This is followed by Region III, where thestress levels off to a nearly perfectly plastic behaviour that can lead to shearinstabilities.
a) b)
Fig. 3. Tensile engineering (a) and true (b) stress-strain curves of nc-Cu at RT.The strain rate is 10−4 s−1. The samples were ball-milled at LN2T for 3 h and RT for 5 h,
cf. Cheng et al. [4].
Wang and Ma [52] investigated experimentally cryo-rolled UFG Cu (withsizes of grains in the 200–300 nm range). The tensile engineering stress-straincurve of this Cu is unstable, cf. Fig. 4, and peaks quickly at low strains and thenplunges, in sharp contrast to that for coarse-grained Cu presented in the samefigure that goes through stages of work hardening.
Youssef et al. [60] made experimental observations of artifact-free bulknanocrystalline Cu with a narrow grain size distribution (mean grain size of23 nm). From Fig. 5 we can see that this Cu exhibits tensile yielded strength,

THE THERMODYNAMICAL THEORY OF ELASTO-VISCOPLASTICITY ... 19
Fig. 4. Tensile engineering stress-strain curve of cryo-rolled Cu compared with that ofcoarse-grained Cu. The neck developed in the former sample is shown in the inset,
cf. Wang and Ma [52].
Fig. 5. A typical tensile true stress-strain curve for a bulk in situ consolidatednanocrystalline Cu sample (with an average grain size of 23 nm) with high purity and high
density in comparison with that of coarse-grained polycrystalline Cu sample (with an averagegrain size larger than 80 µm) and a nanocrystalline Cu sample (with a mean grain size
of 26 nm), prepared by an inert-gas consolidation and compaction techniques,cf. Youssef et al. [60].

20 P. PERZYNA
about 11 times higher than that of conventional coarse-grained copper, whileretaining a 14% uniform tensile elongation.
Jia, Ramesh and Ma [16] studied the mechanical behaviour of consolidatediron with average grain sizes from tens of nanometers to tens of microns, underuniaxial compression over a wide range of strain rates. The solid lines in Fig. 6
Fig. 6. Typical stress-strain obtained for the consolidated iron under quasistatic(1− 4× 10⁻⁴ s−1) and high-strain-rate (3− 6× 10³ s−1) uniaxial compression
for all of the grain sizes, cf. Jia, Ramesh and Ma [16].
Fig. 7. Reduction of ductility as grain size is reduced for ball milled Zn tested at a constantstrain rate of 10−4 − 10−3 s−1 at room temperature, cf. Zhang et al. [61].

THE THERMODYNAMICAL THEORY OF ELASTO-VISCOPLASTICITY ... 21
shows the true stress-strain curves of the consolidated iron with various averagegrain sizes obtained from the quasi-static compression tests. It is apparent thatthe yield strength (or flow stress) increases with decreasing grain size. Comparedwith the 20 µm Fe, the strength of the nano-Fe (80 nm) is increased by one orderof magnitude. The strain hardening rate (the slope of the stress-strain curve)changes with the grain size. Ductile behaviour is observed at relatively largegrain sizes, the samples with grain sizes smaller than 200 nm fail relatively early(the stress-strain curves presented end because of specimen failure).
Figure 7 shows the mechanical response of nanocrystalline zinc samples withdifferent grain sizes. There is a significant drop in ductility as the grain size goesdown from 238 nm to 23 nm.
2.2. Yield strength
Strengthening with grain size refinement in metals and alloys, with an aver-age grain size of 100 nm or larger, has been characterized by the Hall-Petch(H-P) relationship, where dislocation pile-up against grain boundaries alongwith other transgranular dislocations mechanisms, are the dominant strength-controlling processes. When the average and entire range of grain sizes is re-duced to less than 100 nm, the dislocation operation becomes increasingly moredifficult and grain boundary-mediated processes become increasingly more im-portant.
The dependence of yield stress on grain size in metals is well establishedin the conventional polycrystalline range (micrometer and larger sized grains).Yield stress, σy, for materials with grain size d, is found to follow the Hall-Petchrelation
(2.1) σy = σo + kd−1/2,
where σ0 is the friction stress and k is a constant. This is an approximation, anda more general formulation is to use a power expression with exponent −n, i.e.
(2.2) σy = σo + kd−n,
where 0.3 ≤ n ≤ 0.7.The Hall-Petch trends for a range of grain sizes from the micro to the
nanocrystalline, are plotted in Fig. 8 for four different metals: Cu, Fe, Ni and Ti,cf. Meyers et al. [24]. Data points have been collected from different sourcesfor grain sizes ranging from a micrometer to the nanometer range. The authorspointed out that the data points in the conventional polycrystalline range formost of these plots overlap while they are more spread out in the nanocrystalline

22 P. PERZYNA
range. The Hall-Petch curve for the nanocrystalline range clearly shows a devi-ation from the regular trend in the microcrystalline range. However, there is noclear evidence on the nature of the curves at grain sizes below 15 nm.
Fig. 8. Plots showing the trend of yield stress with grain size for different metals ascompared to the conventional Hall-Petch response: (a) copper, (b) iron, (c) nickel and
(d) titanium, cf. Meyers et al. [24].
The difficulty in making realistic predictions of the strength of nanocrystallinemetals based on experiments is illustrated by the results presented by Meyerset al. [25] in Fig. 9. This figure represents a compilation of data from severalsources for copper. This plot is of the Hall-Petch type, albeit with the abscissain nanometer units. Although for larger grain sizes the linearity is clear, for grainsizes of 100 nm or larger (d−1/2 > 0.1 nm−1/2) there is no clear trend. Whilesome results show a decrease in the yield stress (negative Hall-Petch slope), some

THE THERMODYNAMICAL THEORY OF ELASTO-VISCOPLASTICITY ... 23
Fig. 9. The compiled yield stress versus grain size plot for copper from various sourcesranging from coarse to nanograin size. The plots show different trend as the grain size falls
below a critical size, cf. Meyers et al. [25].
show an increase (positive Hall-Petch slope, albeit of a lower magnitude), andothers still a plateau.
2.3. The behaviour of nanocrystalline metals under dynamic loadings
Schwaiger et al. [47] systematically changed the loading rate and strainrate during controlled identification of electrodeposited nc Ni (average grain size∼40 nm) and showed that the flow stress of samples was highly sensitive to therate of deformation. Their results are reproduced in Fig. 10.
Wang and Ma [52] for the Cu discussed in Subsec. 2.1 determined (in com-pression tests) the strain rate sensitivity. Figure 11a shows results of the testsat various fixed strain rates, using several different samples. Figure 11b, instead,uses repeated loading, unloading and reloading to observe effects of strain ratejumps on the flow stress for a given microstructure, so that the deformationprocess can be separated from the kinetics of microstructure evolution.
Figure 12 displays the engineering stress-strain curves of the 6 h RT-millednc-Cu tested at different strain rates, ranging from 10−4 to 10−2 s−1, cf. Chenget al. [4]. Compared to Fig. 3, the curve with a rate of 10−4 s exhibits a largerelongation (∼12%), but at the expense of some strength. This decreased strengthcan be attributed to a coarsened average grain size (average d = 62 nm) as

24 P. PERZYNA
Fig. 10. Engineering stress-strain curves of an electrodeposited nanocrystalline Ni withan average grain size of 40 nm, obtained from tensile tests at different strain rates,
cf. Schwaiger et al. [47].
a) b)
Fig. 11. (a) Compressive true stress-true strain curves of cryo-rolled Cu at several differentstrain rates and (b) a repeated loading-unloading-reloading compressive test curve for thecryo-rolled Cu to determine the strain rate sensitivity through rate jumps, cf. Wang and
Ma [52].
a result of the longer RT ball milling. One salient feature in Fig. 12 is theincreased strength at higher strain rates. The elongation, however, decreaseswith the strain rate. The strain rate sensitivity of the flow stress, defined as
(2.3) m =∂ log σ
∂ log ε
∣∣∣∣ε,ϑ
,

THE THERMODYNAMICAL THEORY OF ELASTO-VISCOPLASTICITY ... 25
where σ is the flow stress and ε the corresponding strain rate, was estimated tobe ∼0.027 from the flow stress data at a fixed strain of 2.5%, as shown in theinset of Fig. 12. The magnitude of m seen here represents a fourfold increase overthat of conventional coarse-grained Cu (m = 0.006), cf. Wang and Ma [52].
Fig. 12. Tensile test of nc-Cu at RT with different strain rates: A – ε = 10−2 s−1;B – ε = 10−3 s−1; C – ε = 10−4 s−1. The inset is used to estimate the strain ratesensitivity, m. The samples were ball milled at LN2T for 3 h and RT for 6 h,
cf. Cheng et al. [4].
Figure 6 (cf. Jia, Ramesh and Ma [16]) also shows a set of stress-strainresponses at high strain rates of 3 × 10³ − 6 × 10³ s−1 (the dashed lines), forthe consolidated iron for several grain sizes. Strain-rate hardening is evident forall the grain sizes considered. Small influence of the strain rate on the strainhardening (the slope of the curves) is observed, which is typical for bcc metals.The ends of the high-rate stress-strain curves for the smallest two grain sizesrepresent specimen failures. The influence of the rate of deformation on the flowstress is plotted in Fig. 13 for the entire range of grain sizes and strain rates,using a conventional semi-log format, with the flow stresses, corresponding toa fixed strain of 4%.
Wei et al. [56] investigated the plastic deformation behaviour of ultrafine-grained (UFG) bulk Fe. The UFGmicrostructure (grain size)∼300 and∼150 nm,

26 P. PERZYNA
Fig. 13. Rate dependence of the flow stress of the consolidated iron for each grain size,with the flow stresses plotted at a fixed strain of 4%, cf. Jia, Ramesh and Ma [16].
was obtained through combined equal channel angular extrusion (ECAE) andlow-temperature rolling (ECAE+R), and confirmed using the transmission elec-tron microscopy.
Fig. 14. Quasi-static stress-strain curves under compressive loading for Fe in annealed,ECAE processed, and ECAE+R conditions. Note the significant strain hardening in the
annealed Fe which is absent in the SPD processed Fe. Also note the apparently reduced ratedependence in the SPD Fe. The strain rates are given in the figure, cf. Wei et al. [56].
THE THERMODYNAMICAL THEORY OF ELASTO-VISCOPLASTICITY ... 27
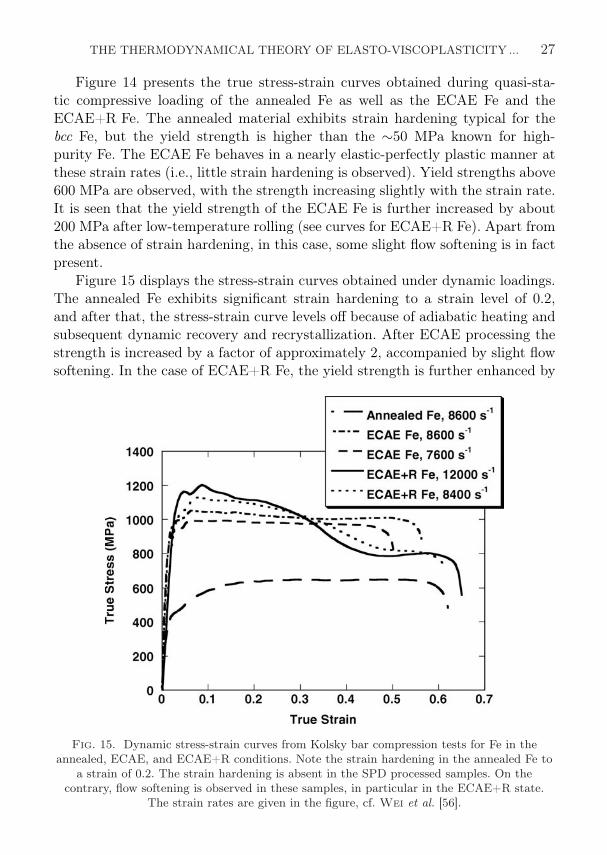
Figure 14 presents the true stress-strain curves obtained during quasi-sta-tic compressive loading of the annealed Fe as well as the ECAE Fe and theECAE+R Fe. The annealed material exhibits strain hardening typical for thebcc Fe, but the yield strength is higher than the ∼50 MPa known for high-purity Fe. The ECAE Fe behaves in a nearly elastic-perfectly plastic manner atthese strain rates (i.e., little strain hardening is observed). Yield strengths above600 MPa are observed, with the strength increasing slightly with the strain rate.It is seen that the yield strength of the ECAE Fe is further increased by about200 MPa after low-temperature rolling (see curves for ECAE+R Fe). Apart fromthe absence of strain hardening, in this case, some slight flow softening is in factpresent.
Figure 15 displays the stress-strain curves obtained under dynamic loadings.The annealed Fe exhibits significant strain hardening to a strain level of 0.2,and after that, the stress-strain curve levels off because of adiabatic heating andsubsequent dynamic recovery and recrystallization. After ECAE processing thestrength is increased by a factor of approximately 2, accompanied by slight flowsoftening. In the case of ECAE+R Fe, the yield strength is further enhanced by
Fig. 15. Dynamic stress-strain curves from Kolsky bar compression tests for Fe in theannealed, ECAE, and ECAE+R conditions. Note the strain hardening in the annealed Fe to
a strain of 0.2. The strain hardening is absent in the SPD processed samples. On thecontrary, flow softening is observed in these samples, in particular in the ECAE+R state.
The strain rates are given in the figure, cf. Wei et al. [56].

28 P. PERZYNA
∼150 MPa compared to the ECAE Fe. What is striking is that the ECAE+R Feexhibits much more pronounced flow softening in comparison with the ECAE Fe.Similarly to the ECAE Fe, the rate dependence of the flow stress is reducedcompared to the annealed state.
2.4. Strain rate sensitivity and temperature dependence of yield strength
The strain rate and temperature dependence of strength have been found tobe rather in nc or ns metals, more so than it had been realized previously.
The engineering parameter measuring strain-rate sensitivity m is one of thekey engineering parameters for controlling and understanding of the deformationin nanocrystalline metals. For example, a highly strain rate sensitive material isexpected to resists localized deformation and hence be ductile.
With decreasing grain size, an increase in the strain rate sensitivity has beenfound to be common for nanocrystalline fcc metals, cf. Dao et al. [7]. For thebehaviour of nanocrystalline bcc metals the situation is different, and more com-plex, cf. Jia et al. [16].
Dao et al. [7] summarized the variation of m as a function of grain size, d,for Cu samples, based on literature data. The m value increases with a decreaseof grain size from the micron to the submicrometer scale (m from 0.06 to about0.02), followed by an obvious rise when the grain sizes are reduced to belowa couple of hundred nanometers.
In the nanoscale regime, m is much larger than that reported for conventionalCu. The current suggestion is that the highly localized dislocation activity (e.g.dislocation nucleation and/or dislocation de-pinning) at the grain boundaries,leads to an enhanced strain-rate sensitivity for nanocrystalline metals.
The overall strain-rate dependence of a material is influenced by disloca-tion activity, grain boundary diffusion and lattice diffusion. For microcrystallinefcc metals, the rate-controlling process is the cutting of forest dislocations re-sulting in a low strain-rate sensitivity. With d decreasing into submicrometerand nanocrystalline regime, forest cutting mechanisms subside since now it isthe large number of grain boundaries and/or subgrain boundaries that serveas obstacles to the dislocation motion. The rate-limiting process is increasinglyinfluenced by dislocation-grain boundary interactions.
There have been indications that the elevated strain rate sensitivity m innc/ns metals plays a role in improving the strength/ductility properties. Thestrength increase due to the rate sensitivity is seen in Fig. 10.
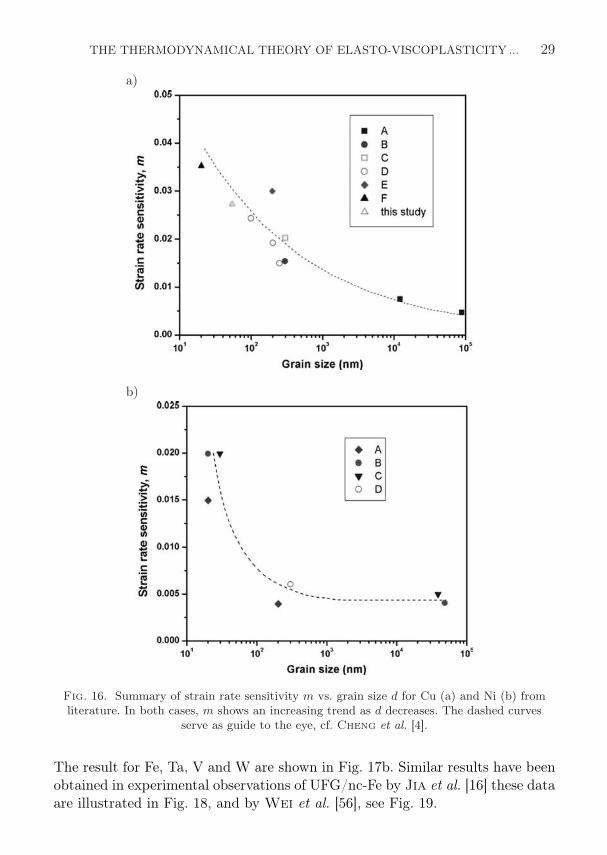
The general trend of increasing of the strain-rate sensitivity m occurs withdecreasing d for fcc nanocrystalline metals from the known data for Cu in Fig. 16aand Ni in Fig. 16b, as well as in Fig. 17a for Cu and Ni. For bcc nanocrystallinemetals, the strain-rate sensitivity m shows an opposite dependence on grain size.
THE THERMODYNAMICAL THEORY OF ELASTO-VISCOPLASTICITY ... 29
a)
b)
Fig. 16. Summary of strain rate sensitivity m vs. grain size d for Cu (a) and Ni (b) fromliterature. In both cases, m shows an increasing trend as d decreases. The dashed curves
serve as guide to the eye, cf. Cheng et al. [4].
The result for Fe, Ta, V and W are shown in Fig. 17b. Similar results have beenobtained in experimental observations of UFG/nc-Fe by Jia et al. [16] these dataare illustrated in Fig. 18, and by Wei et al. [56], see Fig. 19.

30 P. PERZYNA
a) b)
Fig. 17. The strain-rate sensitivity as a function of grain size for: a) fcc metals: Cu and Ni;b) bcc metals: Fe, Ta and W, cf. Meyers et al. [25].
Fig. 18. The variation of the normalized flow stress σf/σf0 with strain rate for various grainsizes. Note the reduction in the effective rate sensitivity at the smaller grain sizes, cf. Jia,
Ramesh and Ma [16].
These important differences for the dependence of the strain-rate sensitiv-ity parameter m on grain size for fcc and bcc ns-metals are caused by variousrate-controlling mechanisms. The rate-controlling mechanism for fcc ns-metals iscutting of dislocation forests by a moving dislocation, while for bcc nc-metals it

THE THERMODYNAMICAL THEORY OF ELASTO-VISCOPLASTICITY ... 31
Fig. 19. Rate dependence of different states of Fe. The values of the strain rate sensitivity,m, are given in the figure. Note the substantial reduction in m in the SPD processed Fe in
comparison to the annealed state, cf. Wei et al. [56].
is the thermally activated motion of screw dislocations by the Seeger kink-pairlateral movement and this is controlled by Peierls-Nabarro stresses.
Very interesting results were presented by Wang and Ma [52] for cryo-rolledUFG Cu (with sizes of grains in the 200–300 nm range), cf. Fig. 20. They showedthat for the strain-rate range used, the m is 0.03–0.04 which is higher than thatfor conventional Cu (0.01). We can also observe the important difference of thestrain-rate sensitivity parameter m for the load-unload test, in comparison tothe simple loading test.
Corresponding to the enhanced strain-rate dependence, there is also a morepronounced temperature dependence, arising from the thermally activated defor-mation mechanisms controlling the plastic flow. A rapid increase in yield strengthhas been documented for nc Ni and nc Cu, when the deformation temperatureis lowered to below the room temperature. This feature could be useful for cryo-genic applications.
Cheng et al. [4] reported strong temperature dependence of the flow stressin situ consolidated nanocrystalline Cu and explained the results in terms ofthe thermally activated deformation mechanism operative in the nanocrystallinegrains. In Fig. 21 we observe the large jump in the yield strength from RTto 77 K.

32 P. PERZYNA
Fig. 20. Flow stress vs. strain rate plot for the cryo-rolled Cu compared with that forconventional Cu. The strain rate sensitivity m has been determined from double-log plots
(not shown), cf. Wang and Ma [52].
Fig. 21. Tensile test of nc-Cu at RT and 77 K, with a strain rate ε = 10−4 s−1; the sampleswere ball-milled at LN2T for 3 h and RT for 6 h, cf. Cheng et al. [4].

THE THERMODYNAMICAL THEORY OF ELASTO-VISCOPLASTICITY ... 33
Ebrahimi et al. [11] investigated nickel foils with nano-size grains in ten-sile tests at room temperature and −196C. Figure 22 presents the stress-straincurves for two different grain sizes tested at room and liquid nitrogen tempera-ture. Decreasing of test temperature increased the strength significantly. Nickelhas a high stacking fault energy and therefore, its strain hardening rate is ex-pected to be relatively temperature insensitive. However, the smaller grain sizespecimen showed a noticeable increase in the strain hardening rate with reducingthe test temperature. The increase in strength was also more significant for thesmaller grain size specimen.
Fig. 22. Effect of grain size on tensile stress-strain curves of nickel at RT and liquid nitrogentemperature, cf. Ebrahimi et al. [11].
2.5. Analysis of microshear and macroshear banding
Jia, Ramesh and Ma [16] presented analysis of phenomenology of shearbands in UFG and nc Fe. They observed that the deformation mode of thesematerials changed dramatically as the grain size was decreased into the ultra-fine-grain range. In the 20 µm-Fe and 980 nm-Fe, the compressive deformationswere uniform at all strain rates, and no shear bands were evident under either theoptical microscope or SEM. However, for all smaller grain sizes (d < 300 nm) theshear band localization development is often observed to occur immediately afterthe onset of plastic deformation. This has been correlated to changes in strain

34 P. PERZYNA
hardening behaviour at those grain sizes, since the ability to work hardened bythe increase in dislocations density is lost.
Shear bands were observed during both the quasistatic and high-rate defor-mations for these grain sizes. Comparative optical micrographs are presentedin Fig. 23 after low-rate compressive deformations to similar plastic strains,showing (a) the uniform deformations in the 980 nm-Fe and (b) the stronglynon-uniform deformations in the 268 nm-Fe. In both cases, the microshear isvisible. Figure 23c shows the strongly non-uniform deformations observed in the268 nm-Fe after high-rate loading to a similar strain as those shown in Figs. 23aand 23b.
Fig. 23. Change in deformation mode of consolidated iron with grain size for uniaxialcompression: a) uniform low-rate deformations with d = 980 nm, ε = 13.7%; b) non-uniform
low-rate deformations with d = 268 nm, ε = 11.6% and c) non-uniform high-ratedeformations with d = 268 nm, cf. Jia, Ramesh and Ma [16].
The process of macroshear banding that develops during a quasistatic ex-periment can be observed in Fig. 24, which shows a single area (far away fromthe edges) of a 268 nm-Fe specimen at nominal plastic strains of (a) 3.7% and(b) 7.8%. The loading axis is vertical in these figures. Authors suggested, bas-ing on observations with optical microscopy and TEM for the deformed UFGand nc-Fe specimens, that large plastic deformations are developed within thebands. Thus, it appears that the process of macroshear banding in this materialinvolves the nucleation of new bands, propagation along the shear plane, increasein width (broadening) and increase in strain (flow) within the band.
Figure 25a shows a high magnification view of a simple band with well-definedboundaries (this band was observed at a nominal plastic strain of 0.3%, just afteryield in the 268 nm-Fe). The measured width of the macroshear band is ∼16 µmand the shear strain in the band is ∼25% (nearly two orders of magnitudes higherthan the nominal specimen strain).

THE THERMODYNAMICAL THEORY OF ELASTO-VISCOPLASTICITY ... 35
Fig. 24. Evolution and development of shear bands in 268 nm-Fe. Observations of shearbands at the same location at different nominal strain levels: a) 3.7%; b) 7.8%. Loading axisis vertical. Note the development of new shear bands, the broadening of existing shear bands,
and the propagation of a shear band tip, cf. Jia, Ramesh and Ma [16].
Fig. 25. a) Shear strain developed in shear band immediately after onset of plasticdeformation (0.3% plastic strain) in 268 nm-Fe under uniaxial compression, b) Shear bandnetwork formed in 268 nm-Fe after uniaxial compression at low rates to 7.8%. Note thecompatible deformations at the intersections of the shear bands, cf. Jia, Ramesh and
Ma [16].
Figure 25b shows a network of macroshear bands at about±45 to the loadingaxis in a 268 nm-Fe specimen after low-rate loading to 7.8% of the nominal plasticstrain. For most of the bands, the two boundaries can be clearly identified,so that the width can be accurately measured. Wider bands were observed inthe 268 nm-Fe than in 138 or 80 nm-Fe. An example of the TEM results ispresented in Fig. 26, which shows TEM micrographs obtained from within and

36 P. PERZYNA
outside the macroshear bands in the 110 nm-Fe, deformed in compression at lowrates. Figure 26a is a typical picture obtained from within the macroshear band,and shows elongated grains (elongated along the shearing direction) containinghigh dislocation densities. Figure 26b was obtained from a region outside themacroshear bands.
Fig. 26. TEM micrographs taken within (a) and outside (b) a shear band in 138 nm-Fe.Note the equiaxed grains outside the band, and the elongated grains in the band oriented
along the shear direction, cf. Jia, Ramesh and Ma [16].
Wei et al. [56] have been shown that under dynamic loading, the plasticflow mode changes from the uniform deformation of conventional coarse-grainedFe to substantial, localized deformation in UFG Fe. They observed that ECAEprocessed Fe did exhibit signs of localized deformation under dynamic compres-sive loading. Figure 27 depicts the concentrated shear in local regions of one ofthe samples (loading is along the vertical direction). The specimen was loadedto a true strain level of ∼0.55 at a strain rate of ∼7000 s−1. Figure 27a showsthe low magnification SEM image of the shear marks on the surface of the sam-ple. Figure 27b shows an overall view of some of the shear lines. More detailedstructure of the shear lines is revealed in Fig. 27c.
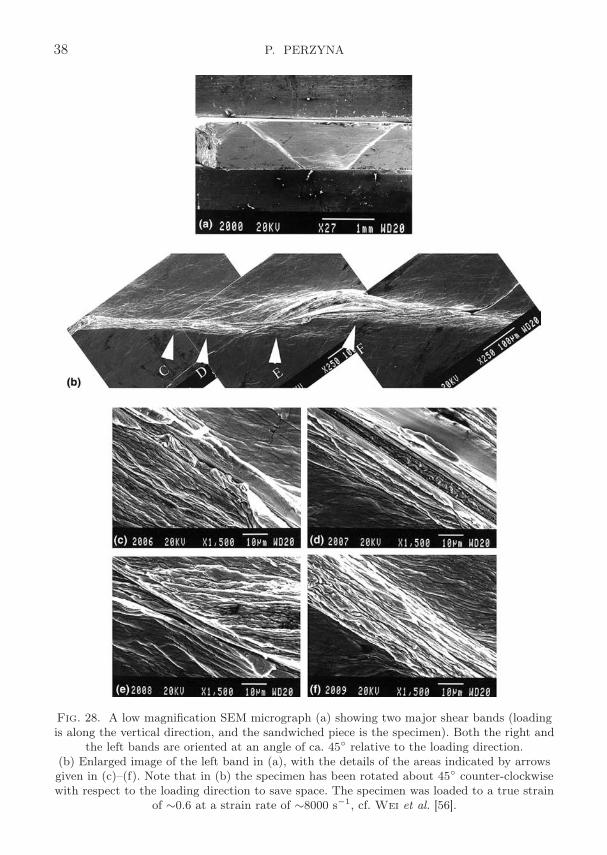
Figure 28 shows the post-dynamic loading SEM images of the ECAE+R Fe.The specimen was loaded to a true strain level of ∼0.6 at a strain rate of around8000 s−1. In this case, macroshear banding is ostensive. The low magnificationSEMmicrograph in Fig. 28a shows two major macroshear bands. Figure 28b is anenlarged image of the left band in Fig. 28a, with details of the areas indicated byarrows given in Fig. 28c–f. These images demonstrate that the macroshear bandshave accommodated highly concentrated strain and local adiabatic temperature

THE THERMODYNAMICAL THEORY OF ELASTO-VISCOPLASTICITY ... 37
Fig. 27. SEM micrographs of the side face of a dynamically loaded ECAE Fe. a) Overallsurface at a low magnification (loading is along the vertical direction and the sandwichedpiece is the specimen); b) A collage showing the shear band contrast; c) An enlarged imageshowing the details of some shear bands. Note that in (b) the specimen has been rotatedabout 45 clockwise with respect to the loading direction to save space. The specimen was
loaded to a true strain of ∼0.55 at a strain rate of ∼7000 s−1, cf. Wei et al. [56].
rise. What is more, in Fig. 28d, a layer of wavy structure within the macroshearband can be seen, suggesting rotation and twisting of the material therein underdynamic loading.
Figure 29 shows the etched specimen, where the macroshear band is clearlyrevealed with a well-defined width of about 15 µm. The two white lines are addedto identify better the macroshear band boundaries in the specimen.
38 P. PERZYNA
Fig. 28. A low magnification SEM micrograph (a) showing two major shear bands (loadingis along the vertical direction, and the sandwiched piece is the specimen). Both the right and
the left bands are oriented at an angle of ca. 45 relative to the loading direction.(b) Enlarged image of the left band in (a), with the details of the areas indicated by arrowsgiven in (c)–(f). Note that in (b) the specimen has been rotated about 45 counter-clockwisewith respect to the loading direction to save space. The specimen was loaded to a true strain
of ∼0.6 at a strain rate of ∼8000 s−1, cf. Wei et al. [56].

THE THERMODYNAMICAL THEORY OF ELASTO-VISCOPLASTICITY ... 39
Fig. 29. Post-loading sample was polished and then etched using 5% Nital to reveal themicrostructure, where the shear band is clearly seen with a width of about 15 µm. The
boundaries of the adiabatic shear band have been marked out by a pair of white lines for theease of identification, cf. Wei et al. [56].
Cheng et al. [4] observed the mode and evolution of the plastic deforma-tion in nc-Cu. Their tensile tests were terminated before failure. The sampleswere unloaded, as shown for example at the end of the stress-strain curve ofFig. 30a. Figure 30b is a close view of the surface morphology for the sampleunloaded right before the eventual failure, shoving a further development of theslanted macroshear zone. The shear offset on the sample edges is obvious. Signsof necking and off-axis banding become visible only in the large stage of plasticdeformation. The macroshear zone contains numerous slip markings due to shearbands micrometers in width. At this point a crack begins to develop, causing theonset of load drop. Figure 30c displays the development of the macroshear lo-calization as captured by a high-speed camera for a sample tested at 10−4 s−1.The onset of plastic instability was found to be as early as around 3% of strain,whereas signs of necking appeared only much later (last three pictures).
Figure 31 shows an SEM micrograph of the fracture surface after tensile test.The image clearly indicates ductile fracture as characterized by the dimpledfeatures.
Jia et al. [15] investigated deformation behaviour and plastic instabilitiesof ultrafine-grained titanium. Figure 32 shows a true stress-strain curve for theas-processed UFG-Ti, in comparison with that for the CG-Ti, obtained uniaxialcompression at 2 × 10⁻⁴ s−1. At a strain of 6% the flow stress of the UFG-Ti (1.02 GPa) is more than twice that of CG-Ti (0.45 GPa), consistent withthe Hall-Patch relationship for conventional Ti. The as-processed UFG-Ti ex-hibits little strain hardening, with a nearly perfectly plastic behaviour at strain

40 P. PERZYNA
Fig. 30. (a) Tensile test, terminated before failure, of nc-Cu at RT, ε = 10−4 s−1. Shearlocation was observed. (b) An optical micrograph showing the shear zone and shear stepsbefore cracking fails the sample. (c) The evolution of shear localization as captured by
a high-speed camera. The corresponding engineering strain is as follows: (1) 0%; (2) ∼3.2%;(3) ∼3.9%; (4) ∼4.3%; and (5)–(9) were taken in the strain range of 4.6–7.0%. These pictures
were captured from one sample that was tested at a strain rate 10−4 s−1. The use ofa high-speed camera avoids the smearing of images during strain. The samples were
ball-milled at LN2T for 3 h and RT for 5 h, cf. Cheng et al. [4].
above 5%. In comparison, CG-Ti shows obvious strain hardening. The stress-strain curve for UFG-Ti after annealing is also included in Fig. 32. Comparedwith the as-processed case, the yield strength of the annealed UFG-Ti is lower.The strain-hardening rate, on the other hand, is higher than the as-processedcase for strains less than ∼5%, which is attributable to the recovery of the

THE THERMODYNAMICAL THEORY OF ELASTO-VISCOPLASTICITY ... 41
Fig. 31. Fracture surface of nc-Cu after tensile test to failure (cf. Fig. 3). The samples wereball milled at LN2T for 3 h and RT for 5 h. The white circle shows a pore possibility left-over
after consolidation, cf. Cheng et al. [4].
Fig. 32. Typical compressive true stress-strain curves for UFG-Ti (as processed andannealed) at a quasistatic-strain rate, with a curve for CG-Ti for comparison are shown,
cf. Jia et al. [15].
cold-worked grains. However, due to the small grain size, the capacity for theaccumulation of dislocations and twin boundaries and hence strain hardening,remains very limited and far less than that of CG-Ti. The higher strain hard-ening of the annealed UFG-Ti would also help to overcome softening caused byflaws or damage sites operative in tension. These predictions agree well with the

42 P. PERZYNA
tension test curves (cf. Fig. 33a) and the necking morphology (cf. Fig. 33b), theauthors have observed. The tensile fracture surface also shows clear ductile (cupand cone) features (cf. Fig. 33c), as expected from the large ductility seen incompression.
Fig. 33. (a) Tensile true stress-strain curves for as-processed and annealed UFG-Ti, incomparison with that of CG-Ti; (b) Optical micrograph showing necking in the annealed
UFG-Ti; (c) Scanning electron microscopy of typical ductile features on the fracture surfaceof the sample in (b), cf. Jia et al. [15].

THE THERMODYNAMICAL THEORY OF ELASTO-VISCOPLASTICITY ... 43
A typical true stress-strain curve for annealed UFG-Ti at a high-strain rate4.3 × 103 s−1 is compared with a quasistatic curve in Fig. 34a, together withtwo corresponding curves for the CG-Ti at similar strain rates. The strain-ratesdependence of the flow stress at a constant strain 6% is plotted in Fig. 34b for thestrain-rate range from 2×10⁻⁴ to 9×10⁻⁴ s−1. If a linear relationship is assumed,the UFG-Ti lines have similar slopes (∂σ/∂ log ε)ε, indicating that he magnitude
Fig. 34. (a) Comparison of high-strain-rate true stress-strain curves with those atquasistatic-strain rates for both the annealed UFG-Ti and CG-Ti are shown. (b) Strain-ratedependence of the flow stress of UFG-Ti and CG-Ti at a strain of 6% is presented, cf. Jia
et al. [15].

44 P. PERZYNA
of the strain-rate enhancement of the flow stress (∼200 MPa) is similar for thesetwo very different grain sizes. However, due to the elevated strength of UFG-Ti,
the strain-rate sensitivity, m, defined as (∂ log σ/∂ log ε)ε =(
1σ
)(∂σ/∂ log ε)ε,
drops by a factor of 2–3 relative to that for CG-Ti (from 0.025 to 0.009). Thevalue of m affects the necking instability, the material with a higher value of mis more stable. Thus, the low m renders the UFG-Ti less resistant to necking,and contributes to the fast post-necking softening and reduced elongation to thefailure observed in Fig. 33.
In the paper (cf. Wang et al. [51]) extended the mechanical testing of nanos-tructured Ti to much larger strains and a wide range of strain rates, in order tounderstand what factors and how they control the deformation/failure behaviourof UFG-Ti. They paid special attention to the possibility of twinning activitiesin nanostructured Ti that were previously overlooked. In order to do so, the me-chanical properties of commercial purity of nanostructured titanium prepared byequal channel angular pressing plus cold rolling (grain size ∼260 nm) were sys-tematically characterized. Hexagonal close-packed (hcp) ultrafine-grained (UFG)titatnium processed by sever plastic deformation (SPD) has gained wide interestdue to its excellent mechanical properties and potential applications as biomed-ical implants.
It is well-established that deformation twinning is an important mode ofdeformation in coarse-grained (CG) hcp materials. Experimental observationsconfirmed that the nanostructured titanium prepared by SPD contains not onlyhigh densities of dislocations but also a significant amount of deformation twins.Such unique microstructural characteristic suggests that the deformation mecha-nism and failure mode of nanostructured Ti may be different from those of otherUFG materials.
Figure 35 shows true stress-strain curves of UFG-Ti with the strain rate inthe range of 10−4 s−1 – 10−1 s−1. For comparison, the stress-strain curve of a CG-Ti is also included. A considerably elevated strength was observed in UFG-Tiwith the yield stress 3–4 times higher than that of CG-Ti. In terms of ductility,UFG-Ti fails after a total compressive strain of ∼30%, as compared to ∼60% inCG-Ti. Careful examinations of the strain hardening behaviour in UFG-Ti andCG-Ti reveal distinctive differences. The CG-Ti demonstrates a strong strainhardening behaviour throughout the test. Such an increasing strain hardeningbehaviour in CG-Ti is believed to be associated with extensive twinning. In con-trast, a different scenario is observed for the plastic flow of UFG-Ti, which ex-hibits initially strain hardening, with a near perfectly plastic behaviour at strainup to 15%. This is strain hardening behaviour at small strain agrees with previ-ous observations (cf. Jia et al. [15]) and is believed to render tensile instability innanostructured Ti. At large strains, however, a non-negligible strain hardening

THE THERMODYNAMICAL THEORY OF ELASTO-VISCOPLASTICITY ... 45
Fig. 35. Room temperature compressive true stress-strain curves of nanostructured Ti andthe coarse-grained Ti over strain rate range of 10−4 s−1–10−1 s−1, cf. Wang et al. [51].
is observed. The strain hardening for UFG-Ti becomes more pronounced whenthe samples were tested at high strain rates, as shown in Fig. 36.
Fig. 36. Dynamic compressive true stress-strain curves of nanostructured Ti at roomtemperature, cf. Wang et al. [51].
46 P. PERZYNA
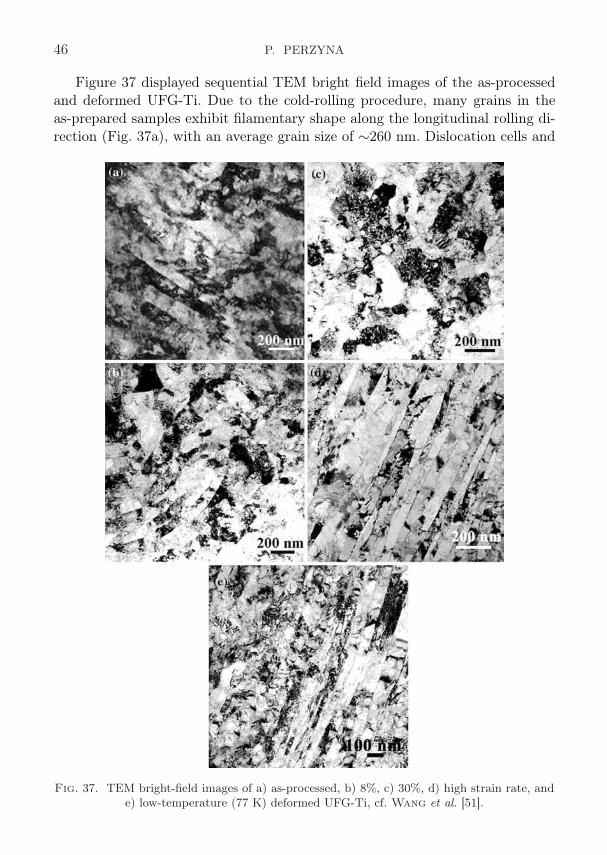
Figure 37 displayed sequential TEM bright field images of the as-processedand deformed UFG-Ti. Due to the cold-rolling procedure, many grains in theas-prepared samples exhibit filamentary shape along the longitudinal rolling di-rection (Fig. 37a), with an average grain size of ∼260 nm. Dislocation cells and
Fig. 37. TEM bright-field images of a) as-processed, b) 8%, c) 30%, d) high strain rate, ande) low-temperature (77 K) deformed UFG-Ti, cf. Wang et al. [51].

THE THERMODYNAMICAL THEORY OF ELASTO-VISCOPLASTICITY ... 47
extremely high density of dislocations are the typical microstructural features.Deformation twins resulting from severe plastic deformation are also visible in-side grains with the twin band width of the order of ∼150 nm. After 10% defor-mation (Fig. 37b), the ultra-fine-grains become more or less equiaxed, thoughsome grains with straight boundaries and elongated contours are still observ-able. The average grain size remains approximate constant across the transversedirection. After 30% strain (Fig. 37c), the grains look completely equi-axed (thesample failed at this point). The transformation of grain shape from fibrous typeto equi-axial type during the quasi-static compressions implies the change ofgrain orientations and evolution of the texture, suggesting that the dislocationslip plays a significant role during plastic deformation of UFG-Ti.
TEM examinations in quasi-static deformed samples supports the notion thatdislocation slip is the major deformation in nanostructured Ti at slow deforma-tion and room temperature (cf. Zhu et al. [62]).
At dynamic loading rates (103–104 s−1), however, a different scenario is ob-served (Fig. 37d). Deformation twin with the band width in the range of 50–100 nm becomes the characteristic microstructural feature. The twin bands inas-processed samples are noticeably wider, suggesting that deformation twinninghas become an important event of the high strain rate deformation of UFG-Ti.
Extensive twinning activities were also observed when nanostructured Ti wasdeformed at cryogenic temperature (77 K), as shown in Fig. 37e, cf. Wang etal. [52]. The twin bands observed in low-temperature deformation is narrower(in the range of 10–50 nm) than those seen at high strain rates. This indicatesthat the twinning activity in nanostructured Ti is closely tied to deformationconditions such as strain rates and temperature.
The strain hardening behaviour has direct influence on the failure mode ofUFG-Ti. The development crack during dynamic testing was captured by a high-speed camera in Fig. 38. The alphabetic order of the pictures is the same asthose marked on the stress-strain curve of UFG-Ti (Fig. 36), with each letterrepresenting a different strain level. The time interval between two frames is10 ms, and the camera exposure time for each image is 1 ms. The cracks startedto develop in the late stage of deformation (Fig. 36f) where the substantial strainsoftening has advanced.
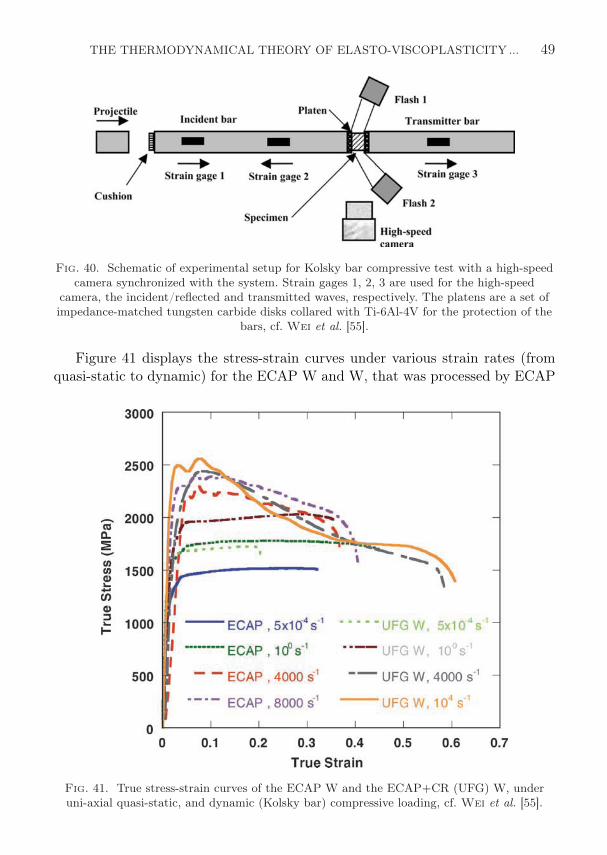
In two papers (cf.Wei et al. [55] andWei et al. [57]), the authors investigatedthe quasi-static and dynamic mechanical behaviour (especially dynamic failure)of ultra-fine grained tungsten (UFG W) under uniaxial compression. They usedsever plastic deformation (SPD) to refine the microstructure of conventional Wwith commercial impurity levels. The microstructure was analyzed using TEM,cf. Fig. 39. The UFG W was tested at both quasi-static loading rates (10−4–100 s−1) and dynamic loading rates (∼ 103 s−1) using a compression Kolsky bar,cf. Fig. 40.

48 P. PERZYNA
Fig. 38. (a)–(f) In situ high speed camera pictures of UFG-Ti during a dynamic compressiontest. Note the development of cracks with Increasing strains, cf. Wang et al. [51].
a) b)
Fig. 39. Transmission electron micrographs of SPD-processed (ECAP + rolling) UFG W(a, b), showing grains and dislocation cell structures refined to sizes of the order of 500 nm,
cf. Wei et al. [55].
THE THERMODYNAMICAL THEORY OF ELASTO-VISCOPLASTICITY ... 49
Fig. 40. Schematic of experimental setup for Kolsky bar compressive test with a high-speedcamera synchronized with the system. Strain gages 1, 2, 3 are used for the high-speed
camera, the incident/reflected and transmitted waves, respectively. The platens are a set ofimpedance-matched tungsten carbide disks collared with Ti-6Al-4V for the protection of the
bars, cf. Wei et al. [55].
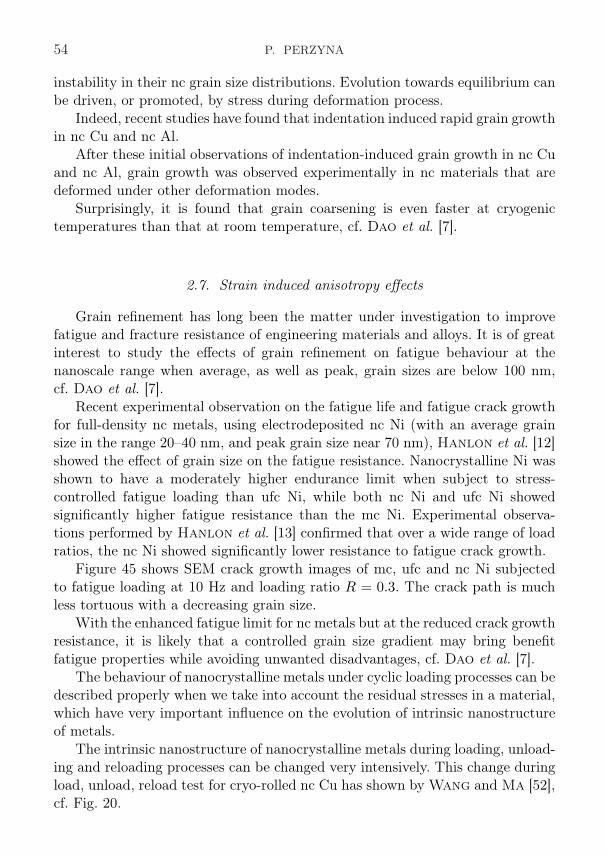
Figure 41 displays the stress-strain curves under various strain rates (fromquasi-static to dynamic) for the ECAP W and W, that was processed by ECAP
Fig. 41. True stress-strain curves of the ECAP W and the ECAP+CR (UFG) W, underuni-axial quasi-static, and dynamic (Kolsky bar) compressive loading, cf. Wei et al. [55].

50 P. PERZYNA
at 1000C followed by cold-rolling (referred to hereafter as ECAP+CR W).ECAP at 1000C (six passes in this case) has elevated the quasi-static flowstress to ∼1.5 times that of the CGW. ECAP has also markedly reduced thestrain hardening. Cold rolling further strengthens the material until the flowstress is nearly doubled compared to the CGW. Under dynamic loading, boththe ECAPW and ECAP+CRW exhibit flow softening after small plastic strains,in contrast to the dynamic behaviour of CGW where slight work-hardening isobserved. This flow softening is in part due to the accumulation of plastic workthat is converted into heat during dynamic loading.
Due to combination of high strength and ductility and the reduced roleof stabilizing mechanisms (strain hardening and strain rate hardening), theUFG bcc microstructure will have an unprecedented low resistance to soft-ening mechanisms. Plastic flow will be more likely to localize in zones andbands, in which very high strains and strain rates are concentrated. This was in-deed observed upon uniaxial high-rate compressive loading of the high-strengthUFG-W.
Figure 42a shows an optical micrograph of the UFG-W after loading ata strain rate of 7500 s−1. Two major shear zones, at an angle of approximately45 relative to the loading direction, are clearly observed. A scanning electronimage of a side face, with marked shear zones, is shown in Fig. 42b. Figure 42cshows clearly evidence for the closely bundled flow lines as well as the subsequentincipient fracture along the localized adiabatic shearing.
To investigate the dynamics of the shear banding process and its relationwith other phenomena, a high-speed camera was synchronized with the Kolskybar system. In situ high-speed photography shows the evolution of the adia-batic shear band and subsequent fracture of the specimen. Figure 43 displaysthe corresponding stress-time and stress-strain curves from one such experiment(cf. Figs. 43a and 43b) and show two frames taken at the time or the strain indi-cated by the square symbols on the curves (cf. Figs. 43C and 43I). The first frame(cf. Fig. 43C) was taken before the plastic deformation occurred. Latter frame(cf. Fig. 43I) shows the well-developed shear bands. The authors pointed out thatboth post-mortem microscopic observations and in-situ high-speed photographyreveal intensive plastic shear localization in the UFG-W, and the letter indicatesthat the shear localization takes place at a very small strain level. Fracture hasalso been observed as a consequence of the sever adiabatic shear localization inthe UFG-W.
It is important to stress that materials with high flow stress, high thermalsensitivity, small strain hardening and small strain-rate sensitivity are more sus-ceptible to adiabatic shear band localization under dynamic compression.
Thus, it is very important to investigate strain rate sensitivity for UFG-W.Figure 44a displays double-log plots for W with different microstructure (grain

THE THERMODYNAMICAL THEORY OF ELASTO-VISCOPLASTICITY ... 51
a)
b)
c)
Fig. 42. (a) Optical and (b) scanning electron microscope images showing the shear zones,and (c) the intense concentrated plastic flow with crack initiation inside the shear zone,
cf. Wei et al. [55].

52 P. PERZYNA
a)
b)
Fig. 43. The stress-time curve (a) and stress-strain curve (b) for a uniaxial compressionKolsky bar test of an SPD UFG W. The square boxes in each figure indicate the time or
strain level at which each frame was captured, cf. Wei et al. [55].
sizes), showing that the strain rate sensitivity of UFG-W has been cut to halfthe value of the CG-W (the CG-W of commercial purity has an m of ∼0.04).Figure 44b includes previous results on bcc Fe, Ta and V showing that m candrop substantially when grain size is refined.
Microstructure and mechanical properties of super-strong nanocrystallinetungsten processed by high-pressure torsion have been recently investigated byWei et al. [58].

THE THERMODYNAMICAL THEORY OF ELASTO-VISCOPLASTICITY ... 53
a)
b)
Fig. 44. (a) Flow stress-strain rate curves of W after working under various conditions. TheCG W of commercial purity has an m of ∼0.04 from an early investigation. (b) Strain rate
sensitivity, m, is reduced monotonically with microstructure refinement into the UFG regime,in several bcc (Fe, Ta, V) metals (open symbols), cf. Wei et al. [55].
2.6. Yield strength reduction due to dynamic grain growth
During prolonged mechanical test, or for samples that have very high purity,the high strength may degrade with time. This is due to the large excess energyassociated with grain boundaries in nc materials, which is expected to cause
54 P. PERZYNA
instability in their nc grain size distributions. Evolution towards equilibrium canbe driven, or promoted, by stress during deformation process.
Indeed, recent studies have found that indentation induced rapid grain growthin nc Cu and nc Al.
After these initial observations of indentation-induced grain growth in nc Cuand nc Al, grain growth was observed experimentally in nc materials that aredeformed under other deformation modes.
Surprisingly, it is found that grain coarsening is even faster at cryogenictemperatures than that at room temperature, cf. Dao et al. [7].
2.7. Strain induced anisotropy effects
Grain refinement has long been the matter under investigation to improvefatigue and fracture resistance of engineering materials and alloys. It is of greatinterest to study the effects of grain refinement on fatigue behaviour at thenanoscale range when average, as well as peak, grain sizes are below 100 nm,cf. Dao et al. [7].
Recent experimental observation on the fatigue life and fatigue crack growthfor full-density nc metals, using electrodeposited nc Ni (with an average grainsize in the range 20–40 nm, and peak grain size near 70 nm), Hanlon et al. [12]showed the effect of grain size on the fatigue resistance. Nanocrystalline Ni wasshown to have a moderately higher endurance limit when subject to stress-controlled fatigue loading than ufc Ni, while both nc Ni and ufc Ni showedsignificantly higher fatigue resistance than the mc Ni. Experimental observa-tions performed by Hanlon et al. [13] confirmed that over a wide range of loadratios, the nc Ni showed significantly lower resistance to fatigue crack growth.
Figure 45 shows SEM crack growth images of mc, ufc and nc Ni subjectedto fatigue loading at 10 Hz and loading ratio R = 0.3. The crack path is muchless tortuous with a decreasing grain size.
With the enhanced fatigue limit for nc metals but at the reduced crack growthresistance, it is likely that a controlled grain size gradient may bring benefitfatigue properties while avoiding unwanted disadvantages, cf. Dao et al. [7].
The behaviour of nanocrystalline metals under cyclic loading processes can bedescribed properly when we take into account the residual stresses in a material,which have very important influence on the evolution of intrinsic nanostructureof metals.
The intrinsic nanostructure of nanocrystalline metals during loading, unload-ing and reloading processes can be changed very intensively. This change duringload, unload, reload test for cryo-rolled nc Cu has shown by Wang and Ma [52],cf. Fig. 20.

THE THERMODYNAMICAL THEORY OF ELASTO-VISCOPLASTICITY ... 55
Fig. 45. Scanning electron micrographs of mc, ufc and nc Ni subjected to sinusoidal fatigueloading at the initial stress intensity factor values of 10, 6.2, and 8.5 MPa m1/2, respectively.A cyclic frequency of 10 Hz and loading ratio R = 0.3 were used in all cases. Crack pathtortuosity clearly decreases with grain refinement. Images (d)–(f) are high-magnificationimages of (a)–(c), respectively, and the magnification of (f) is 10 times of (d) and (e),
cf. Hanlon et al. [13].
2.8. Ductility and fracture
For many nanocrystalline metals, low ductility and premature fracture, some-times the failure occurring even in the elastic range, were due to processing flaws

56 P. PERZYNA
and artifacts, cf.Dao et al. [7]. However, nanocrystalline metals are characterizedby a low work-hardening rate, which is a direct consequence of the low densityof dislocation encountered after plastic deformation. This low work-hardeningrate leads to tensile instability and a low tensile ductility. There are reports,recently published on increased ductility in nanocrystalline metals; very goodexample of this is the experimental investigation work by Cheng et al. [4] insitu consolidated nanocrystalline Cu. The authors reported on a much improvedcombination of tensile strength and ductility, over the tensile properties of othernc-Cu materials documented in the literature, cf. Fig. 46.
Fig. 46. Comparison of tensile yield strength and elongation to failure of various truly nc-Cu(average d < 100 nm) in literature. The dashed line shows a general trend as guide to the eye,
cf. Cheng et al. [4].
The authors suggested that in most of the previous tensile tests, the nc-Cuused suffered from sample flaw problems. Flaws possibly accelerated the onsetof cracking in the local regions with concentrated strains (shear band zones ornecked regions). Although residual defects (porosity, microcracks) may still bepresent in situ consolidated nc-Cu, they are such a low population that tensileflow can be maintained to appreciable strain levels before cracking finally failsthe sample, cf. Fig. 30. It is, therefore, conceivable that in samples without anyresidual porosity, an even larger tensile elongation could be achievable.
Fracture in nanocrystalline metals is a complex phenomenon of initiation,propagation and coalescence of micro(nano)voids or micro(nano)cracks, leading

THE THERMODYNAMICAL THEORY OF ELASTO-VISCOPLASTICITY ... 57
to the separation of a body into two or more parts. The spacing/size of dimples,however for nanocrystalline metals, is considerably larger than the grain size ontheir specimens. Kumar et al. [19] presented the interpretation of the evolutionof micro(nano)cracks, cf. Fig. 47. The mechanisms responsible for void initiationare: (i) existing voids at grain boundaries and triple points; (ii) voids created bydislocation emission from grain boundaries; (iii) voids created by grain-boundarysliding which leaves wedges at triple junction; (iv) cavities created by the actionof grain-boundary sliding on the ledges. The spacing of these initiation sites,which is larger than the grain size, determines the dimple size, cf. Fig. 48 andFig. 31.
Fig. 47. Schematic illustration showing how deformation evolves in the nanocrystallinenickel and leads to (a) dislocation emission from grain boundaries, void formation/growth atgrain boundaries and triple junctions, grain-boundary sliding; (b) the formation of partiallyunconstrained ligaments that deform plastically; (c) generation of cavities at grain-boundaryledges and (d) the interaction of these various features to produce final dimple size, Kumar
et al. [19].
Recent experimental observations have shown the interesting possibility, thatnanosized grains rotate during plastic deformation and can coalescence along thedirections of shear, creating larger paths for dislocation movement. As plasticdeformation takes place, two neighboring grains might rotate in a fashion thatbrings their orientation closer together. This leads to the elimination of thebarrier presented by the boundary between them, providing a path for more
58 P. PERZYNA
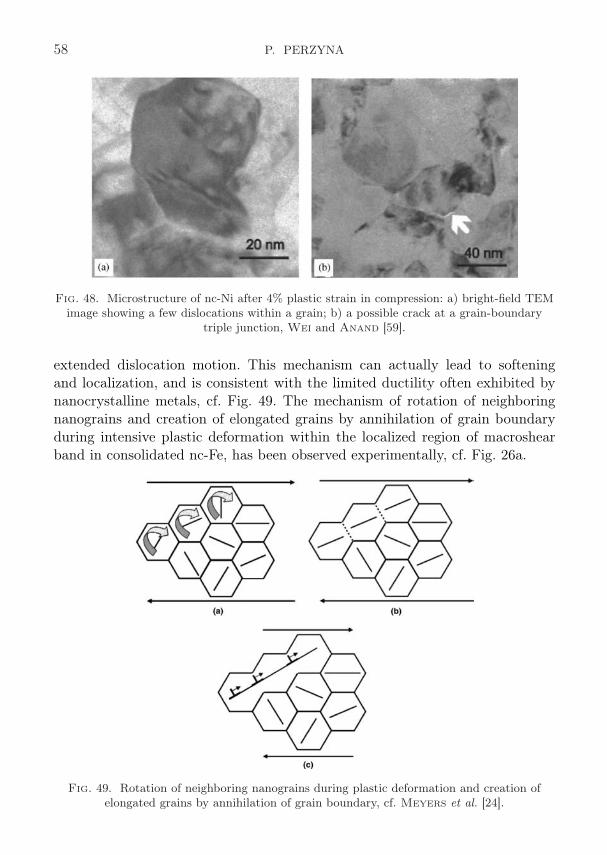
Fig. 48. Microstructure of nc-Ni after 4% plastic strain in compression: a) bright-field TEMimage showing a few dislocations within a grain; b) a possible crack at a grain-boundary
triple junction, Wei and Anand [59].
extended dislocation motion. This mechanism can actually lead to softeningand localization, and is consistent with the limited ductility often exhibited bynanocrystalline metals, cf. Fig. 49. The mechanism of rotation of neighboringnanograins and creation of elongated grains by annihilation of grain boundaryduring intensive plastic deformation within the localized region of macroshearband in consolidated nc-Fe, has been observed experimentally, cf. Fig. 26a.
Fig. 49. Rotation of neighboring nanograins during plastic deformation and creation ofelongated grains by annihilation of grain boundary, cf. Meyers et al. [24].

THE THERMODYNAMICAL THEORY OF ELASTO-VISCOPLASTICITY ... 59
3. Physical foundations
The rate and temperature dependence of the flow stress of metal crystals canbe explained by various physical mechanisms of dislocation motion. The micro-scopic processes combine in different ways to give several group of deformationmechanisms, each of which can be limited to the particular range of temperatureand strain rate changes.
The principal short-range barrier, the Peierls-Nabarro stress, is importantfor ultrafine crystalline bcc metals, whereas in ultrafine crystalline fcc and hcpmetals, forest dislocations are the primary short-range barriers at lower temper-atures, cf. Dao et al. [7] and Meyers et al. [24]).
Schematic representations of these two mechanisms in which the obstaclesare overcome are given in Fig. 50. In each case, thermal fluctuations assist theapplied stress in getting a dislocation segment L past the barrier. Both of thesemechanisms lead to viscoplastic response of the crystal.
Fig. 50. Schematic representations of the physical mechanisms responsible for inelastic flowof fcc, bcc and hcp nc metals.
The main idea of the viscoplastic flow mechanism is to accomplish in onemodel the description of behaviour of single crystals valid for the entire range ofstrain rate changes. In other words, the main concept is to encompass the interac-tion of the thermally activated and phonon damping mechanisms, cf. Perzyna[28–32].

60 P. PERZYNA
To achieve this aim, the empirical overstress function Φ has been introducedand the plastic strain rate is postulated in the form as follows (cf. Perzyna [41])
(3.1) εp =1T
⟨Φ
[τ
τY (εp, ϑ,µ∗, d)− 1
]⟩sgn τ,
where T is the relaxation time, 〈·〉 denotes the Macauley bracket, τ is the actualstress and τY is the yield stress function, which may depend on the inelastic strainεp, temperature ϑ and the internal state variables µ∗ and d (d is the average grainsize). The internal state variable vector µ∗ may represent the density of obstacledislocations, the density of mobile dislocations and the concentration of pointdefects.
We can use the Hall-Petch relation (2.2), then
(3.2) τY = τ0(εp, ϑ,µ∗) + kd−n,
where k is a constant and 0.3 ≤ n ≤ 0.7.Finally we have the constitutive assumption in the form
(3.3) εp =1T
⟨Φ
[τ
τ0(εp, ϑ,µ∗) + kd−n− 1
]⟩sgn τ.
It is noteworthy that the empirical overstress function Φ may be determinedbasing on available experimental results performed under dynamic loading.
4. Kinematics of finite deformation and fundamental definitions
Let XA and xa denote coordinate systems on B and S respectively.Then we refer to B ⊂ R3 as the reference configuration of a continuum bodywith particles X ∈ B and to S = φ(B) as the current configuration with pointsx ∈ S. The matrix F(X, t) = ∂φ(X, t)/∂X with respect to the coordinate basesEA(X) and ea(x) is given by
(4.1) F aA(X, t) =
∂φa
∂XA(X, t),
where a mapping x = φ(X, t) represents a motion of a body B.We consider the local multiplicative decomposition
(4.2) F = Fe · Fp,
where (Fe)−1 is the deformation gradient that releases elastically the stress onthe neighborhood φ(N (X)) in the current configuration.
THE THERMODYNAMICAL THEORY OF ELASTO-VISCOPLASTICITY ... 61
Let us define the total and elastic Finger deformation tensors
(4.3) b = F · FT , be = Fe · FeT,
respectively, and the Eulerian strain tensors as follows:
(4.4) e =12
(g − b−1
), ee =
12
(g − be−1
),
where g denotes the metric tensor in the current configuration.By definition1)
(4.5) ep = e− ee =12
(be−1 − b−1
)
we introduce the plastic Eulerian strain tensor.To define objective rates for vectors and tensors we use the Lie derivative2).
Let us define the Lie derivative of a spatial tensor field t with respect to thevelocity field υ as
(4.6) Lυt = φ∗∂
∂t(φ∗t),
where φ∗ and φ∗ denote the pull-back and push-forward operations, respectively.The rate of deformation is defined as follows:
(4.7) d[ = Lυe[ =12Lυg =
12
(gacυc |b +gcbυ
c |a) ea ⊗ eb,
where the symbol [ denotes the index lowering operator and ⊗ the tensor pro-duct,
(4.8) υa |b= ∂υa
∂xb+ γa
bcυc,
and γabc denotes the Christoffel symbol for the general coordinate systems xa.
The components of the spin ω are given by
(4.9) ωab =12
(gacυc |b −gcbυ
c |a) =12
(∂υa
∂xb− ∂υb
∂xa
).
Similarly
(4.10) de[= Lυee[
, dp[= Lυep[
,
1)For precise definition of the finite elasto-plastic deformation see Perzyna [38].2)The algebraic and dynamic interpretations of the Lie derivative have been presented by
Abraham et al. [2], Abraham and Marsden [1], cf. also Marsden and Hughes [22].

62 P. PERZYNA
and
(4.11) d = de + dp.
Let τ denote the Kirchhoff stress tensor related to the Cauchy stress tensorσ by
(4.12) τ = Jσ =ρRefρ
σ,
where the Jacobian J is the determinant of the linear transformation
F(X, t) = (∂/∂X)φ(X, t),
ρRef(X) and ρ(x, t) denote the mass density in the reference and current config-uration, respectively.
The Lie derivative of the Kirchhoff stress tensor τ ∈ T2(S) (elements ofT2(S) are called tensors on S, contravariant of order 2) gives
(4.13) Lυτ = φ∗∂
∂t(φ∗τ) =
F · ∂
∂t
[F−1 · (τ φ) · F−1T
]· FT
φ−1
= τ− (d + ω) · τ− τ · (d + ω)T ,
where denotes the composition of mappings.
5. Thermo-elasto-viscoplasticity constitutive model
5.1. Constitutive postulate
Let us assume that: (i) conservation of mass, (ii) balance of momentum,(iii) balance of moment of momentum, (iv) balance of energy, (v) entropy pro-duction inequality, hold.
We introduce the four fundamental postulates:(i) Existence of the free energy function. It is assumed that the free energy
function is given by
(5.1) ψ = ψ(e,F, ϑ;µ),
where ϑ is temperature and µ denotes a set of the internal state variables.To extend the domain of the description of the material properties andparticularly, to take into consideration different dissipation effects, we haveto introduce the internal state variables represented by the vector µ.
(ii) Axiom of objectivity (spatial covariance). The constitutive structure shouldbe invariant with respect to any diffeomorphism (any motion) ζ : S → S.

THE THERMODYNAMICAL THEORY OF ELASTO-VISCOPLASTICITY ... 63
(iii) The axiom of the entropy production. For any regular motion of a bodyB, the constitutive functions are assumed to satisfy the reduced dissipationinequality
(5.2)1
ρRefτ : d− (ηϑ + ψ)− 1
ρϑq · gradϑ ≥ 0,
where η is the specific (per unit mass) entropy, and q denotes the heat flowvector field.
(iv) The evolution equation for the internal state variable vector µ is assumedin the form as follows:
(5.3) Lυµ = m(e,F, ϑ,µ),
where the evolution function m has to be determined based on careful phys-ical interpretation of a set of the internal state variables and the analysisof available experimental observations.The determination of the evolution function m (in practice, a finite set ofthe evolution functions) appears to be the main problem of the modernconstitutive modeling.
5.2. Fundamental assumptions
Experimental observation results and analysis of physical foundations (cf.Secs. 2 and 3) suggest that the fundamental mechanism of visciplastic flow ismost important for proper description of fcc, bcc and hcp nanocrystalline metals.We intend to describe this main mechanism of viscoplastic flow by introducingthe equivalent viscoplastic deformation εP as the internal state variable.
Strain rate sensitivity of these materials is very mech influenced by mi-cro(nano)shear banding, which occurs very early during both the quasi-staticand high-rate deformation processes.
Since the process of macroshear localization in these materials for all smallergrain sizes (d < 300 nm) develops almost immediately after the onset of vis-coplastic deformation, the mechanisms of anisotropic intrinsic micro(nano)damageplay a very important role. To describe the effects of anisotropic intrinsic mi-cro(nano)damage, we intend to introduce the tensorial micro(nano)damage in-ternal state variable ξ.
Based on experimental observations, we can suggest that the intrinsic mi-cro(nano)damage process in nanocrystalline metals depends very much on thestrain-rate effects and has very anisotropic nature.
Experimental observation results presented by Shockey et al. [48] haveshown that coalescence mechanism can be treated as nucleation and growth

64 P. PERZYNA
process on a smaller scale. This conjecture simplifies very much the descrip-tion of the intrinsic micro(nano)damage process by taking account only of thenucleation and growth mechanisms.
Recent investigations of plastic behaviour of nanocrystalline metals suggestthat the anisotropy induced by finite plastic deformation plays also a fundamen-tal role. This induced anisotropy is mainly caused by the residual stresses whichare generated by the heterogeneous nature of plastic deformation in nanocrys-talline metals. To describe these effects of plastic strain-induced anisotropy, theresidual stress tensor (the back stress tensor) α has to be introduced to the con-stitutive structure as the internal state variable. The aim of this is to take intoaccount the kinematic hardening phenomenon, which can be treated as the firstapproximation of the description of plastic deformation-induced anisotropy.
The mechanism of rotation of neighboring nanograins during intense vis-coplastic deformation process observed experimentally has to be described bytaking account of finite viscoplastic deformation and the viscoplastic spin.
The dynamic grain growth process observed experimentally is easy to takeinto account by introducing the mean grain diameter d as the internal statevariable.
For our practical purposes it is sufficient to assume that the internal statevector µ has the form(5.4) µ = (εp,ξ,α, d),
where εp is the equivalent viscoplastic deformation, i.e.
(5.5) εp =
t∫
0
(23
dp : dp
)1/2
dt,
ξ denotes the microdamage second-order tensor, with the physical interpretationthat (ξ : ξ)1/2 = ξ defines the volume fraction porosity and takes account formicrodamaged effects, α denotes the residual stress (the back stress) and aimsat the description of the kinematic hardening effects, d defines the mean graindiameter and is introduced as the internal state variable to describe the dynamicgrain growth during deformation process.
Let us introduce the plastic potential function f = f(J1, J2, ϑ,µ), where J1,J2 denote the first two invariants of the stress tensor τ = τ− α.
Let us postulate the evolution equations as follows:
(5.6) dp = ΛP, ωp = ΛΩΩΩ, Lυξ = ΞΞΞ, Lυα = A, d = D,
where for elasto-viscoplastic model of a material we assume (cf. Perzyna [28–30,38, 42])
(5.7) Λ =1
Tm
⟨Φ
(f
κ− 1
)⟩,
THE THERMODYNAMICAL THEORY OF ELASTO-VISCOPLASTICITY ... 65
Tm denotes the relaxation time for mechanical disturbances, the isotropic work-hardening-softening function κ is
(5.8) κ = κ(εp, ϑ, ξ, d),
Φ is the empirical overstress function, the bracket 〈·〉 defines the ramp function,
(5.9) P =∂f
∂τ
∣∣∣∣ξ=const
(∣∣∣∣∣∣∣∣∂f
∂τ
∣∣∣∣∣∣∣∣)−1
,
ΩΩΩ, Ξ, A and D denote the evolution functions which have to be determined.
5.3. Microshear banding effects
To describe the microshear banding effects let us assume that the relaxationtime Tm depends on the active microshear bands fraction fms and on the rate ofequivalent viscoplastic deformation εP (cf. Pęcherski [46], Nowak, Perzynaand Pęcherski [27] and Perzyna [43]), i.e.
(5.10) Tm = Tm
(fms, ε
P).
Additionally, we introduce the simplification as follows:
(5.11) Tm = T 0mφ1 (fms) φ2
(εP
),
where T 0m is material function of the mean grain diameter d.
For example, for nanocrystalline iron we can postulate
(5.12) φ1 (fms) =[1− fms
(εP
)]=
[1− f0
ms
11 + exp (a− bεP )
],
and
(5.13) φ2
(εP
)=
(εP
εPs
− 1)1/p
,
where f0ms, a, b, p and εP
s are material function of d.Finally we have
(5.14) Tm = T 0m
[1− f0
ms
11 + exp (a− bεP )
](εP
εPs
− 1)1/p
.

66 P. PERZYNA
5.4. Constitutive assumption for the viscoplastic spin
Based on experimental observations that the nanosized grains rotate duringplastic deformation (cf. Subsec. 2.8), we suggest that in the proper descriptionof nanocrystalline metals the viscoplastic spin may play a very important role.
Let us postulate that ΩΩΩ has the form3) (cf. Dafalias [6] and Loret [21])
(5.15) ΩΩΩ = η∗(α ·P−P · α),
where η∗ denotes the scalar-valued function of the invariants of the tensors α, ξ
and P, and may depend on temperature ϑ and the mean grain diameter d.
5.5. Anisotropic intrinsic microdamage mechanisms
To take into consideration the observed time-dependent effects, it is advan-tageous to use the proposition of the description of the intrinsic microdamageprocess presented by Perzyna [34, 35], Duszek–Perzyna and Perzyna [10],and Dornowski and Perzyna [8].
Let us assume that the intrinsic microdamage process consists of the nucle-ation and growth mechanisms.
Based on the heuristic suggestions and taking into account the influenceof the stress triaxiality and anisotropic effects on the nucleation and growthmechanisms, we assume the evolution equation for the microdamage tensor ξ asfollows (cf. Perzyna [43]):
(5.16) Lυξ =∂h∗
∂τ
1Tm
⟨Φ
[In
τn(ξ,α, ϑ, εp, d)− 1
]⟩
+∂g∗
∂τ
1Tm
⟨Φ
[Ig
τeq(ξ,α, ϑ, εp, d)− 1
]⟩.
The tensorial function ∂h∗/∂τ describes the mutual microcrack interaction fornucleation mechanism, while the tensorial function ∂g∗/∂τ represents the mu-tual microcrack interaction for growth process, τn and τeq denote the thresholdstresses for microcrack nucleation and growth, respectively.
(5.17) In = a1J1 + a2
√J′2 + a3
(J′3
)1/3
3)For a thorough discussion of a concept of the plastic spin and its constitutive descriptionin phenomenological theories for macroscopic large plastic deformations, please consult thecritical review paper by Van der Giessen [50].

THE THERMODYNAMICAL THEORY OF ELASTO-VISCOPLASTICITY ... 67
defines the stress intensity invariant for nucleation, ai (i = 1, 2, 3) are the ma-terial coefficients which can depend on d, J
′2 and J
′3 are the second and third
invariants of the stress deviator τ′= (τ− α)
′,
(5.18) Ig = b1J1 + b2
√J′2 + b3
(J′3
)1/3,
defines the stress intensity invariant for growth and bi (i = 1, 2, 3) are the mater-ial coefficient which can depend on d. This determines the evolution function Ξ.
In the evolution Eq. (5.16) the functions
h = h(τ, ϑ, εP , ξ,α, d
),(5.19)
g = g(τ, ϑ, εP , ξ,α, d
),(5.20)
play the fundamental role, and have to be determined based on available exper-imental observation data. We also introduced the denotations as follows
(5.21)∂h∗
∂τ=
∂h
∂τ
(∣∣∣∣∣
∣∣∣∣∣∂h
∂τ
∣∣∣∣∣
∣∣∣∣∣
)−1
,∂g∗
∂τ=
∂g
∂τ
(∣∣∣∣∣∣∣∣∂g
∂τ
∣∣∣∣∣∣∣∣)−1
.
The threshold stresses τn and τeq for microcrack nucleation and growth, respec-tively, can be assumed as the material functions in the form
(5.22) τn = τn
(ξ,α, ϑ, εP , d
), τeq = τeq
(ξ,α, ϑ, εP , d
).
5.6. Kinematic hardening
To determine the evolution function A we shall follow some results obtainedby Duszek and Perzyna [9]. The kinematic hardening evolution law takes theform
(5.23) Lυα =1
Tm
⟨Φ
(f
κ− 1
)⟩[r1P + r2
P : Qτ : Q + r3ξ : Q
(τ + r3ξ)]
,
where r1, r2 and r3 are the grain diameter-dependent material coefficients and
(5.24) Q =[∂f
∂τ+
(∂f
∂ξ− ∂κ
∂ξ
):∂ξ
∂τ
] ∣∣∣∣∣∣∣∣∂f
∂τ+
(∂f
∂ξ− ∂κ
∂ξ
):∂ξ
∂τ
∣∣∣∣∣∣∣∣−1
.
The kinetic law (5.23) represents the linear combination of the Prager and Zieglerkinematic hardening rules and additionally depends linearly on the microdamagetensor ξ.

68 P. PERZYNA
5.7. Description of dynamic grain growth
Based on the heuristic suggestion and taking into consideration the conclu-sion from the experimental observation and the physical foundations that thedynamic grain growth is the rate-dependent mechanism, we can postulate
(5.25) d =G(ϑ,µ)
Tm
⟨Φ
[Id
τd(ϑ,µ)− 1
]⟩,
where G = G(ϑ,µ) is the material function, and
(5.26) Id = c1J1 + c2
√J′2 + c3
(J′3
)1/3
represents the stress intensity invariant for grain growth, ci (i = 1, 2, 3) are thematerial coefficients which may depend on d, and
(5.27) τd = τd(ϑ,µ)
denotes the threshold stress for dynamic grain growth mechanism.It is noteworthy that evolution equation (5.25) is dependent on the stress
triaxility.
5.8. Thermodynamic restrictions and rate type constitutive relations
Suppose the axiom of the entropy production holds. Then the constitutiveassumption (5.1) and the evolution equations (5.6) lead to the results as follows:
(5.28) τ = ρRef∂ψ
∂e, η = −∂ψ
∂ϑ, −∂ψ
∂µ· Lυµ− 1
ρϑq · gradϑ ≥ 0.
The rate of internal dissipation is determined by
(5.29) ϑi = −∂ψ
∂µ· Lυµ
= −[√
23
∂ψ
∂εP+
∂ψ
∂α:(
r1P + r2P : Q
τ : Q + r3ξ : Q(τ + r3ξ)
)]Λ
− ∂ψ
∂ξ: Ξ− ∂ψ
∂dD.
Operating on the stress relation (5.28)1 with the Lie derivative and keeping theinternal state vector constant, we obtain
(5.30) Lυτ = Le : d− Lthϑ− [(Le + gτ + τg +W) : P]1
Tm
⟨Φ
(f
κ− 1
)⟩,

THE THERMODYNAMICAL THEORY OF ELASTO-VISCOPLASTICITY ... 69
where
(5.31)Le = ρRef
∂2ψ
∂e2, Lth = −ρRef
∂2ψ
∂e∂ϑ,
W = η∗[(gτ− τg) : (αg − gα)].
Substituting ψ into the energy balance equation and taking into account theresults (5.28)3 and (5.29), we obtain
(5.32) ρϑη = −divq + ρϑi.
Operating on the entropy relation (5.28)2 with the Lie derivative and substi-tuting the result into (5.32), we obtain
(5.33) ρcpϑ = −divq + ϑρ
ρRef
∂τ
∂ϑ: d + ρχ∗τ : dp + ρχ∗∗K : Lυξ + ρχ∗∗∗d,
where the specific heat cp = −ϑ∂2ψ
∂ϑ2and we introduce the denotations
(5.34) χ∗∗K = −(
∂ψ
∂ξ− ϑ
∂2ψ
∂ϑ∂ξ
), χ∗∗∗ = −
(∂ψ
∂d− ϑ
∂2ψ
∂ϑ∂d
)
and χ∗, χ∗∗ and χ∗∗∗ are the irreversibility coefficients.
5.9. Length-scale sensitivity of the constitutive model
The constitutive equations for a thermo-elastic-viscoplastic model introduceimplicitly a length-scale parameter into the dynamic initial-boundary value prob-lem, i.e.
(5.35) l = βcTm = β(d)cT 0mφ1(fms)φ2(εP ),
where c denotes the velocity of the propagation of the elastic waves in the prob-lem under consideration and the proportionality factor β depends on the par-ticular initial-boundary value problem and may also depend on the nanoscopicproperties of the material as well as on the mean grain diameter.
As an example for nanocrystalline iron we have
(5.36) l = β(d)cT 0m(d)
1− f0
ms(d)1
1 + exp [a(d)− b(d)εP ]
[εP
εPs (d)
− 1]1/p
.
It is noteworthy to stress that the length-scale sensitivity of the constitu-tive structure is of great importance for proper description of particular initial-boundary value problems by using the numerical methods.

70 P. PERZYNA
To expect the proper description we have to postulate l < d. This assump-tion can be treated as the important condition which has to be satisfied in theidentification procedure.
For particular one-dimensional case for nanocrystalline iron we have
(5.37) l=2σ0+kd−n
√ρE
T 0m(d)
1−f0
ms(d)1
1+ exp [a(d)−b(d)εP ]
[εP
εPs (d)
−1]1/p
.
6. Fracture criterion based on the evolution of microdamage
We base the fracture criterion on the evolution of the microdamage tensor ξ.Let us assume that for (ξ : ξ)1/2 = ξF catastrophe takes place (cf. Perzy-
na [33]), that is
(6.1) κ = κ(εp, ϑ,ξ, d)|(ξ:ξ)1/2=ξF = 0.
It means that for (ξ : ξ)1/2 = ξF the material loses its carrying capacity. Thecondition (6.1) describes the main feature observed experimentally that the loadtends to zero at the fracture point.
In is noteworthy that the isotropic hardening-softening material function κproposed in Eq. (5.8) should satisfy the fracture criterion (6.1).
From the condition (6.1) we may have the critical value of the equivalentinelastic deformation at the fracture point
(6.2) εPF = F(ϑ, ξF , d).
7. Epilogue
The thermodynamical theory of elasto-viscoplasticity of nanocrystalline met-als has been developed within the framework of the rate-type covariance consti-tutive structure, with a finite set of the internal state variables. The crucial ideain the present theory is the very efficient physical interpretation of the assumedinternal state variables (as the equivalent inelastic deformation εP , the micro-damage tensor ξ, the residual stress tensor (the back-stress tensor) α and themean grain diameter d) and the proposition of the evolution equations for them.
We may say that this developed theory is the realization of our previoushope presented in the papers by Perzyna [43, 44]. We have to admit thatthe developed theory is very general and very complex. However, in practicalapplication of it and particularly, in the solution of the initial-boundary valueproblems in modern manufactoring processes, we may use its special versionwhen only some of the internal state variables will play a fundamental role.
It is noteworthy that the thermodynamical theory of elasto-viscoplasticity ofnanocrystalline metals developed in this paper has been inspired by the brilliant

THE THERMODYNAMICAL THEORY OF ELASTO-VISCOPLASTICITY ... 71
new developments in experimental investigations, as well as several mechanismsbased and physically motivated models published in the literature, especiallyduring the last ten years.
It is important to stress that very fundamental feature of the developedtheory is its length-scale sensitivity. This has particularly a great effect for thesolution of the initial-boundary value problems by using the numerical methods.
Acknowledgment
The support of the Polish Ministry of Higher Education and Science, undergrants N N519 419435 and 0364/B/T02/2008/35, is kindly acknowledged.
References
1. R. Abraham, J. E. Marsden, Foundations of Mechanics, Second Edition, Addison-Wesley, Reading Mass., 1988.
2. R. Abraham, J. E. Marsden, T. Ratiu, Manifolds, Tensor Analysis and Applications,Springer, Berlin 1988.
3. R. J. Asaro, S. Suresh,Mechanistic models for the activation volume and rate sensitivityin metals with nanocrystalline grains and nano-scale twins, Acta Materialia, 53, 3369–3382, 2005.
4. S. Cheng, E. Ma, Y.M. Wang, L.Y. Kecskes, K.M. Youssef, C.C. Koch,U. P. Trociewitz, K. Han, Tensile properties of in situ consolidated nanocrystallineCu, Acta Materialia, 53, 1521–1533, 2005.
5. B.D. Coleman, W. Noll, The thermodynamics of elastic materials with heat conductionand viscosity, Arch. Rational Mech. Anal., 13, 167–178, 1963.
6. Y.F. Dafalias, Corotational rates for kinematic hardening at large plastic deformations,J. Appl. Mech., 50, 561–565, 1983.
7. M. Dao, L. Lu, R. J. Asaro, J. T.M. De Hosson, E. Ma, Toward a quantitativeunderstanding of mechanical behaviour of nanocrystalline metals, Acta Materialia, 55, 12,4041–4065, 2007.
8. W. Dornowski, P. Perzyna, Localization phenomena in thermo-viscoplastic flowprocesses under cyclic dynamic loadings, Computer Assisted Mechanics and EngineeringSciences, 7, 117–160, 2000.
9. M.K. Duszek–Perzyna, P. Perzyna, On combined isotropic and kinematic hardeningeffects in plastic flow processes, Int. J. Plasticity, 7, 351–363, 1991.
10. M.K. Duszek–Perzyna, P. Perzyna, Analysis of the influence of different effects oncriteria for adiabatic shear band localization in inelastic solids, [in:] Material Instabilities:Theory and Applications, ASME Congress, Chicago, 9–11 November 1994, R.C. Batraand H.M. Zbib [Eds.], AMD–Vol. 183/MD–Vol.50, ASME, New York, 1994, pp. 59–85.
11. R. Ebrahimi, G.R. Bourne, M. S. Kelly, T. E. Matthews, Mechanical properties ofnanocrystalline nickel produced by electrodeposition, NanoStructured Materials, 11, 343–350, 1999.
72 P. PERZYNA
12. T. Hanlon, N.Y. Kwon, S. Suresh, Grain size effects on the fatigue response ofnanocrystalline metals, Scripta Mater., 49, 675–680, 2003.
13. T. Hanlon, E.D. Tabachnikowa, S. Suresh, Fatigue behaviour of nanocrystallinemetals and alloys, Int. J. Fatigue, 27, 1147–1158, 2005.,
14. A. Glema, T. Łodygowski, W. Sumelka, P. Perzyna, The numerical analysis of theintrinsic anisotropic microdamage evolution in elastic-viscoplastic solids, Int. J. DamageMechanics, 18, 205–231, 2009.
15. D. Jia, Y.M. Wang, K.T. Ramesh, E. Ma, Y.T. Zhu, R. Z. Valiev, Deformationbehavior and plastic instabilities of ultrafine-grain titanium, Applied Physics Letters, 79,611–613, 2001.
16. S. P. Jia, K.T. Ramesh, E. Ma, Effects of nanocrystalline and ultrafine grain sizes onconstitutive behaviour and shear bands in iron, Acta Materialia, 51, 3495–3509, 2003.
17. S. P. Joshi, K.T. Ramesh, Grain size dependent shear instabilities in body-centered andface-centered cubic materials, Materials Science and Engineering A, 493, 65–70, 2008.
18. K. Korbel, Z. Nowak, P. Perzyna, R.B. Pęcherski, Viscoplasticity of nanometalsbased on Burzyński yield condition, 35th Solid Mechanics Conference, Kraków, Poland,September 4–8, 2006.
19. K. S. Kumar, S. Suresh, M. F. Chisolm, J.A. Horton, P. Wang, Deformation ofelectrodeposited nanocrystalline nickel, Acta Materialia, 51, 387–405, 2003.
20. R.A. Lebenson, E.M. Bringa, A. Caro, A viscoplastic micromechanical model forthe yield strength of nanocrystalline materials, Acta Materialia, 55, 261–271, 2007.
21. B. Loret, On the effects of plastic rotation in the finite deformation of anisotropic elasto-plastic materials, Mech. Mater., 2, 287–304, 1983.
22. J. E. Marsden, T. J. R. Hughes,Mathematical Foundations of Elasticity, Prentice-Hall,Englewood Cliffs, New York 1983.
23. H.C. Meyers, Dynamic Behaviour of Materials, John Wiley, New York 1994.
24. M.A. Meyers, A. Mishra, D. J. Benson, Mechanical properties of nanocrystallinematerials, Progress in Materials Science, 51, 427–556, 2006.
25. M.A. Meyers, A. Mishra, D. J. Benson, The deformation physics of nanocrystallinemetals: Experiments, analysis and computations, JOM, 41–48, 2006.
26. M.A. Meyers, C.T. Aimone, Dynamic fracture (spalling) of metals, Prog. Mater. Sci.,28, 1–96, 1983.
27. Z. Nowak, P. Perzyna, R.B. Pęcherski, Description of viscoplastic flow accountingfor shear banding, Arch. of Metallurgy and Materials, 52, 217–222, 2007.
28. P. Perzyna, The constitutive equations for rate sensitive plastic materials, Quart. Appl.Math., 20, 321–332, 1963.
29. P. Perzyna, Fundamental problems in viscoplasticity, Advances in Applied Mechanics,9, 343–377, 1966.
30. P. Perzyna, Thermodynamic theory of viscoplasticity, Advances in Applied Mechanics,11, 313–354, 1971.

THE THERMODYNAMICAL THEORY OF ELASTO-VISCOPLASTICITY ... 73
31. P. Perzyna, Coupling of dissipative mechanisms of viscoplastic flow, Arch. Mechanics,29, 607–624, 1977.
32. P. Perzyna, Modified theory of viscoplasticity. Application to advanced flow and insta-bility phenomena, Arch. Mechanics, 32, 403–420, 1980.
33. P. Perzyna, Constitutive modelling of dissipative solids for postcritical behaviour andfracture, ASME J. Eng. Materials and Technology, 106, 410–419, 1984.
34. P. Perzyna, Internal state variable description of dynamic fracture of ductile solids, Int.J. Solids Structures, 22, 797–818, 1986.
35. P. Perzyna, Constitutive modelling for brittle dynamic fracture in dissipative solids,Arch. Mechanics, 38, 725–738, 1986.
36. P. Perzyna, Temperature and rate dependent theory of plasticity of crystalline solids,Revue Phys. Appl., 23, 445–459, 1988.
37. P. Perzyna, Instability phenomena and adiabatic shear band localization in thermoplasticflow processes, Acta Mechanica, 106, 173–205, 1994.
38. P. Perzyna, Interactions of elastic–viscoplastic waves and localization phenomena insolids, IUTAM Symposium on Nonlinear Waves in Solids, August 15–20, 1993, Victoria,Canada, J.L. Wegner and F.R. Norwood [Eds.], ASME 1995, pp. 114–121.
39. P. Perzyna, Constitutive modelling of dissipative solids for localization and fracture, in:Localization and Fracture Phenomena in Inelastic Solids, P. Perzyna [Ed.], Springer,Wien, New York, pp. 99–242, 1998.
40. P. Perzyna, Thermo-elasto-viscoplasticity and damage, [in:] Handbook of Materials Be-haviour Models, J. Lemaitre [Ed.], Academic Press, New York, pp. 821–834, 2001.
41. P. Perzyna, Thermodynamical theory of inelastic single crystals, Engineering Transac-tions, 50, 107–164, 2002.
42. P. Perzyna, The thermodynamical theory of elasto-viscoplasticity, Engineering Transac-tions, 53, 235–316, 2005.
43. P. Perzyna, The thermodynamical theory of elasto-viscoplasticity accounting for micros-hear banding and induced anisotropy effects, Mechanics, 27, 25–42, 2008.
44. P. Perzyna, Application of the thermodynamical theory of elasto-viscoplasticity in mod-ern manufacturing processes, CISM Courses and Lectures, Springer: Wien, New York,2010 (in print).
45. P. Perzyna, G. Z. Voyiadjis, Thermodynamic theory of elasto-viscoplasticity for in-duced anisotropy effects, McMat 2005, Mechanics and Materials Conference, June 1–3,2005, Baton Rouge, LA, USA, 2005.
46. R.B. Pęcherski, Macroscopic effects of microshear banding in plasticity of metals, ActaMechanica, 131, 203–224, 1998.
47. R. Schwaiger, B. Moser, M. Dao, N. Chollacoop, S. Suresh, Some critical ex-periments on the strain-rate sensitivity of nanocrystalline nickel, Acta Materialia, 51,5159–5172, 2003.
48. D.A. Shockey, L. Seaman, D.R. Curran, The microstatistical fracture mechanicsapproach to dynamic fracture problem, Int. J. Fracture, 27, 145–157, 1985.

74 P. PERZYNA
49. C. Truesdell, W. Noll, The Non-Linear Field Theories of Mechanics, [in:] Handbuchder Physik III/3, S. Flűgge [Ed.], Springer-Verlag, Berlin 1965.
50. E. Van der Giessen, Micromechanical and thermodynamic aspects of the plastic spin,Int. J. Plasticity, 7, 365–386, 1991.
51. Y.M. Wang, J.Y. Huang, T. Jiao, Y.T. Zhu, A.V. Hamza, Abnormal strain hard-ening in nanostructered titanium at high strain rates and large strains, J. Mater. Sci., 42,1751–1756, 2007.
52. Y.M. Wang, E. Ma, Strain hardening, strain sensitivity, and ductility of nanostructuredmetals, Materials Science and Engineering, A375–377, 46–52, 2004.
53. Y.M. Wang, E. Ma, Three strategies to achieve uniform tensile deformation in nanos-tructured metal, Acta Materialia, 52, 1699–1709, 2004.
54. Y.M. Wang, E. Ma, R. Z. Valiev, Y.T. Zhu, Tough nanostructured metals at cryo-genic temperatures, Adv. Mater., 16, 328–331, 2004.
55. Q. Wei, T. Jiao, K.T. Ramesh, E. Ma, L. J. Keckes, L. Magness, R. J. Dowding,V.U. Kazykhanov, R. Z. Valiev, Mechanical behavior and dynamic failure of high-strength ultrafine grained tungsen under uniaxial compression, Acta Materialia, 54, 77–87,2006.
56. Q. Wei, L. Keckes, T. Jiao, KT. Hartwig, K.T. Ramesh, E. Ma, Adiabatic shearbending in ultrafine-grained Fe processed by severe plastic deformation, Acta Materialia,52, 1859–1869, 2004.
57. Q. Wei, K.T. Ramesh, E. Ma, L. J. Keckes, R. J. Dowding, V.U. Kazykhanov,R. Z. Valiev, Plastic flow localization in bulk tungsten with ultrafine microstructure, Ap-plied Physics Letters, 86, 101907(1–3), 2005.
58. Q. Wei, H.T. Zhang, B. E. Schuster, K.T. Ramesh, R. Z. Valiev, L. J. Keckes,R. J. Dowding, L. Magness, K. Cho, Microstructure and mechanical properties ofsuper-strong nanocrystalline tungsten processed by high-pressure torsion, Acta Materialia,54, 4079–4089, 2006.
59. Y. J. Wei, L. Anand, Grain-boundary sliding and separation in polycrystalline metals:Application to nanocrystalline fcc metals, J. Mech. Phys. Sol., 52, 2587–2616, 2004.
60. K.M. Youssef, R.O. Scattergood, K. L. Murty, J. A. Horton, C.C. Koch,Ultrahigh strength and high ductility of bulk nanocrystalline copper, Appl. Phys. Letters,87, 091904, 1–3, 2005.
61. X. Zhang, H. Wang, R.O. Scattergood, J. Narayan, C.C. Koch, Mechanicalproperties of cyromilled nanocrystalline Zn studied by the miniaturized disk bend test,Acta Materialia, 50, 3527–3533, 2002.
62. Y.T. Zhu, J. Y. Huang, T. Ungar, Y.M. Wang, E. Ma, R. Z. Valiev, Nanostruc-tures in the Ti processed by severe plastic deformation, J. Mater. Res., 18, 1908–1917,2003.
Received June 28, 2010; revised version December 8, 2010.


![The Identfication Procedure for The Constitutive Model of ... · thermodynamical theory of elasto-viscoplasticity for description of nanocrystalline metals pre-sented by Perzyna[21]](https://img.pdfslide.net/doc/110x75/5eaf95ac356fe301d2695e66/the-identication-procedure-for-the-constitutive-model-of-thermodynamical-theory.jpg)