Embed Size (px)
Citation preview
Copyright 2018, Lockheed Martin Corporation. All rights reserved.
Analysis and Quality in Measurement Reporting
Salvatore R. BrunoData Analytics and Process Engineer LeadAeronautics – Labs and Technical Services
Date: September 13th, 2018
2Copyright 2018, Lockheed Martin Corporation. All rights reserved.
Analysis and Quality in Measurement Reporting
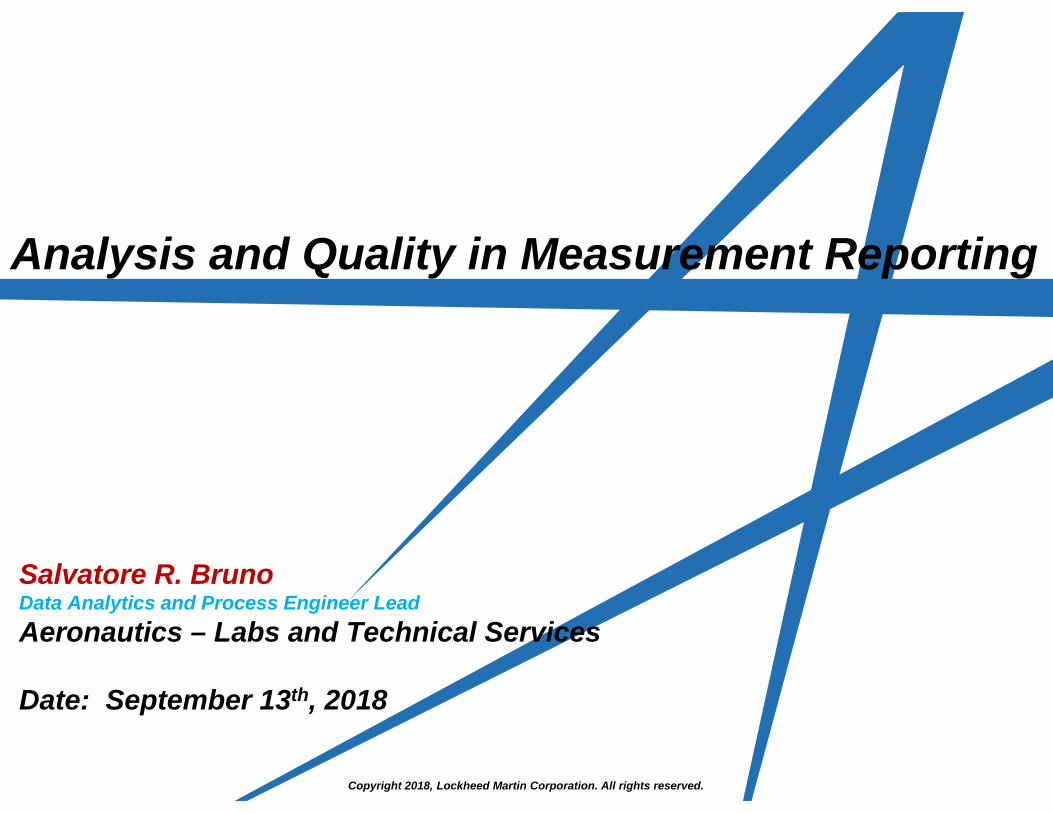
• Presentation Overview• Analytics
– Description– Definition– Pictorial View– The Measurement Subspace
• Measurements– The Implications– The Project Measurements Coordinator
• Role and Responsibilities
• Quality Performance Index– What is QPI?– Creating QPI– Implementing QPI
• Supplemental Information– The Indicator– About the Presenter– Artifacts and References
3Copyright 2018, Lockheed Martin Corporation. All rights reserved.
Analysis and Quality in Measurement Reporting
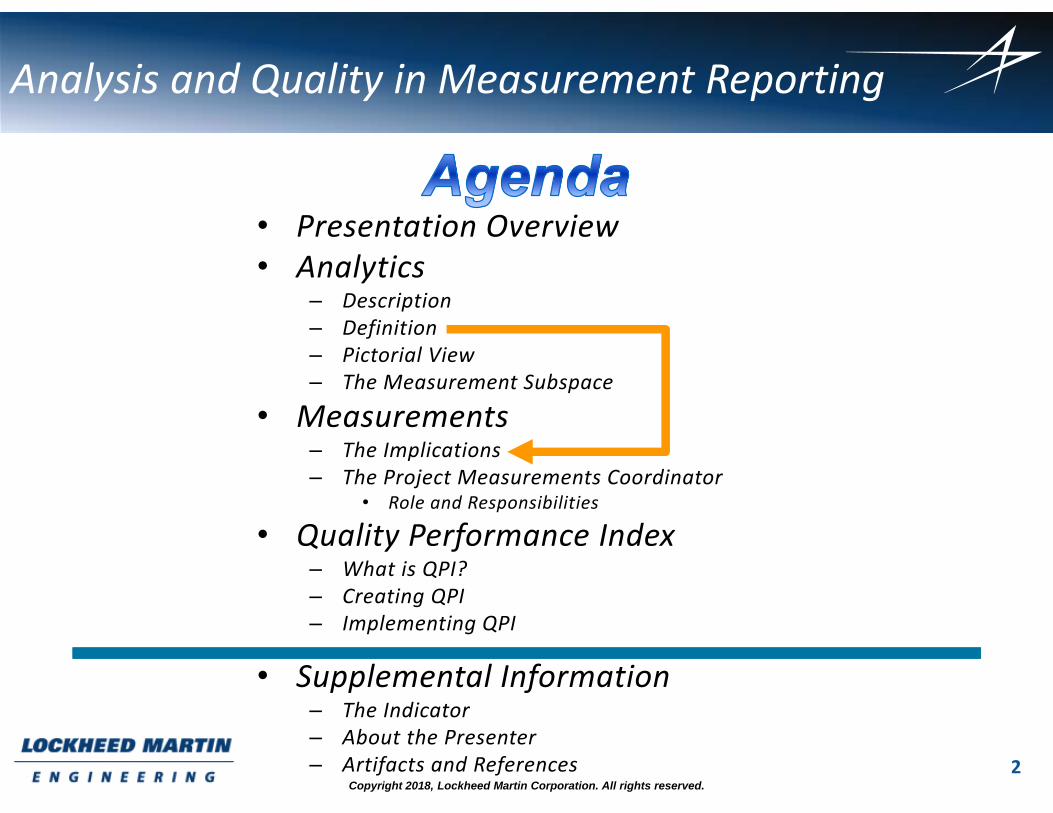
The program measurement coordinator has a critical and serious role in performingactivities and tasks within the world of analytics that can greatly benefit the programmanagement team with their ability to manage the development and delivery of theircontractual obligation. The program measurement coordinator can effectively understandthis if they understand their subspace of Measurements within the world of Analytics andwith the inclusion of QPI (Quality Performance Index).
This presentation will1) Define the elements and components of Measurements and
the role of the program measurement coordinator -- and --2) Introduce a new indicator known as QPI (Quality Performance
Index) to demonstrate and illustrate how the theoretical conceptsof effectively measuring the quality component of the deliverywork product is critical for this success.
NOTE: Audience participation is encouraged and expected withquestions and lively discussions to edify the overall experience ofthe presentation to pursue new studies and for future presentations.
4Copyright 2018, Lockheed Martin Corporation. All rights reserved.
4
Analysis and Quality in Measurement Reporting
5Copyright 2018, Lockheed Martin Corporation. All rights reserved.
5
Analysis and Quality in Measurement Reporting
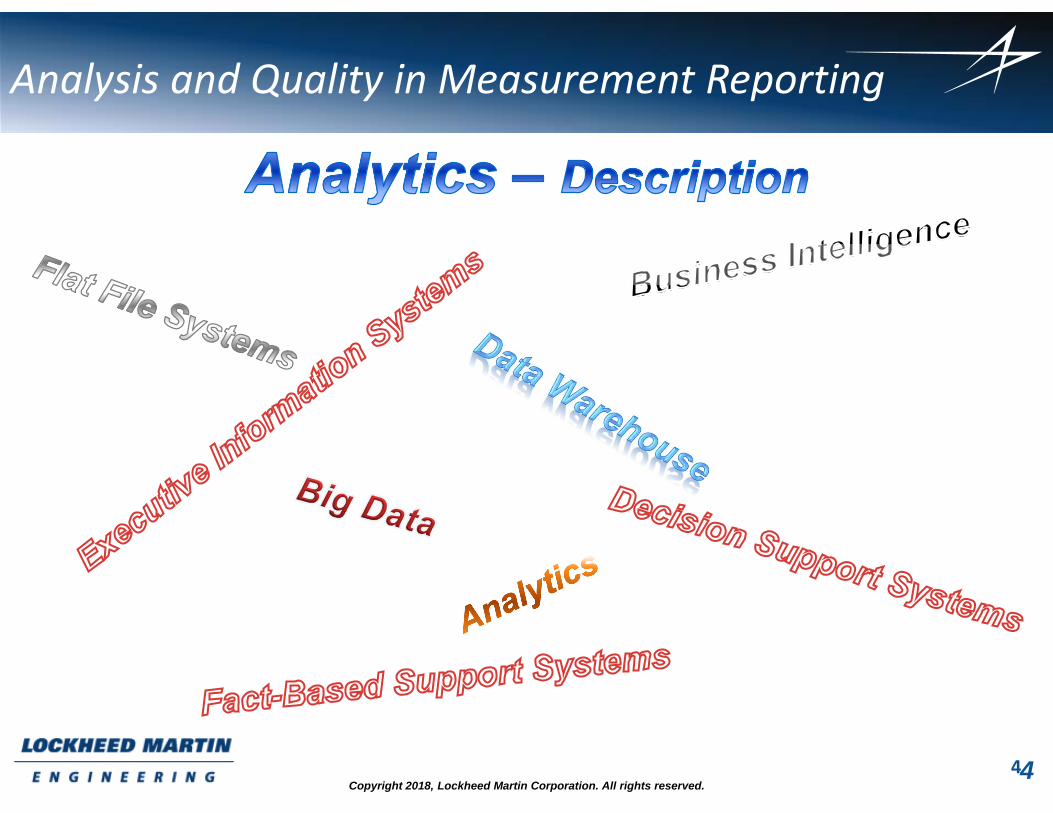
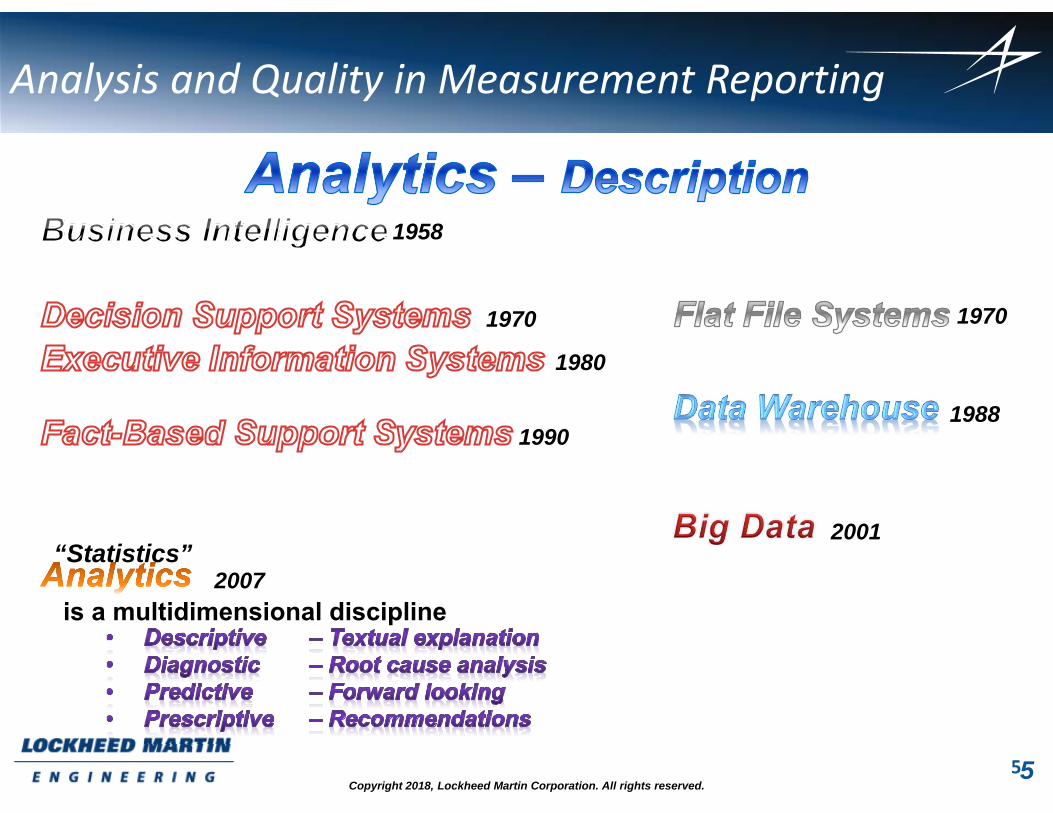
1958
2001
1988
1970
1980
1990
2007“Statistics”
is a multidimensional discipline
1970
6Copyright 2018, Lockheed Martin Corporation. All rights reserved.
6
Analysis and Quality in Measurement Reporting
• Full Name: Big Data Analytics• An evolving, maturing science that focuses on the studying and
understanding the relationship of collected data and information• “Big data” refers to datasets whose size is beyond the ability of typical
database software tools to capture, store, manage, and analyze.• “Analytics” refers to the use of software-based algorithms and statistics
to derive meaning from data.• “Big Data Analytics” implies to the process of collecting, organizing and
analyzing large sets of data to discover patterns and other useful information.
7Copyright 2018, Lockheed Martin Corporation. All rights reserved.
7
Analysis and Quality in Measurement Reporting
• Big data analytics helps companies, departments, teams, and programs to better understand their collected data and identify the most important elements for the current and future business decisions.
• Has many implications, applications, and markets/segments– Business: Finance, Supply Chain, Workforce, Risk, Customer, etc.– Fraud Detection: Banking, Credit Cards, Internet Security/Firewalls, etc.– Military, Secret Service, Police, etc.: Profiling, Deterrence, Prevention– Medical: Medicine, Remedies, Cures, Diets, Avoidance, etc.
• Words commonly used in its definition include– Analysis– Patterns– Insight– Recommendations
– Future– Decisions– Performance– Improve
– Collection– Sources– Data– Information
8Copyright 2018, Lockheed Martin Corporation. All rights reserved.
Analysis and Quality in Measurement Reporting
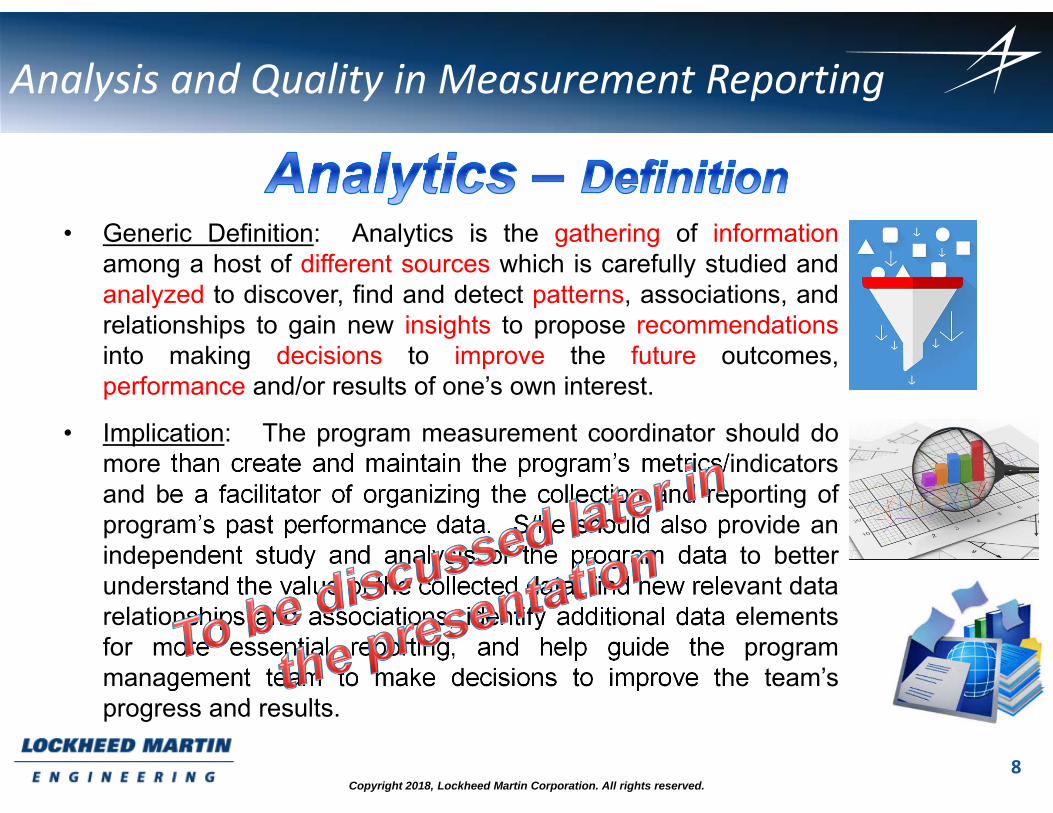
• Generic Definition: Analytics is the gathering of informationamong a host of different sources which is carefully studied andanalyzed to discover, find and detect patterns, associations, andrelationships to gain new insights to propose recommendationsinto making decisions to improve the future outcomes,performance and/or results of one’s own interest.
• Implication: The program measurement coordinator should domore than create and maintain the program’s metrics/indicatorsand be a facilitator of organizing the collection and reporting ofprogram’s past performance data. S/he should also provide anindependent study and analysis of the program data to betterunderstand the value of the collected data, find new relevant datarelationships and associations, identify additional data elementsfor more essential reporting, and help guide the programmanagement team to make decisions to improve the team’sprogress and results.
9Copyright 2018, Lockheed Martin Corporation. All rights reserved.
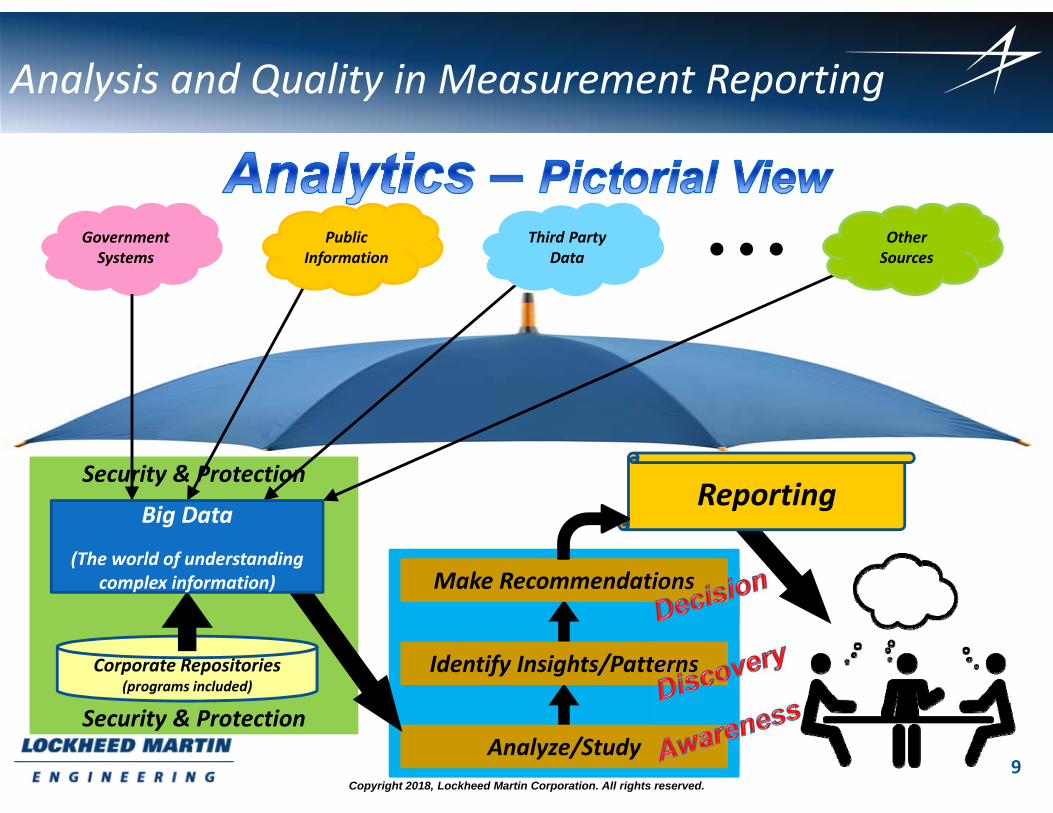
Security & Protection
Security & Protection
Government Systems
Corporate Repositories(programs included)
Reporting
Analyze/Study
Identify Insights/Patterns
Make Recommendations
Big Data
(The world of understanding complex information)
Third Party Data
Other Sources
Public Information
Analysis and Quality in Measurement Reporting
10Copyright 2018, Lockheed Martin Corporation. All rights reserved.
Analyze/Study
Identify Insights/Patterns
Make Recommendations
Reporting
Corporate Repositories(programs included)
Big Data
(The world of understanding complex information)
Analysis and Quality in Measurement Reporting
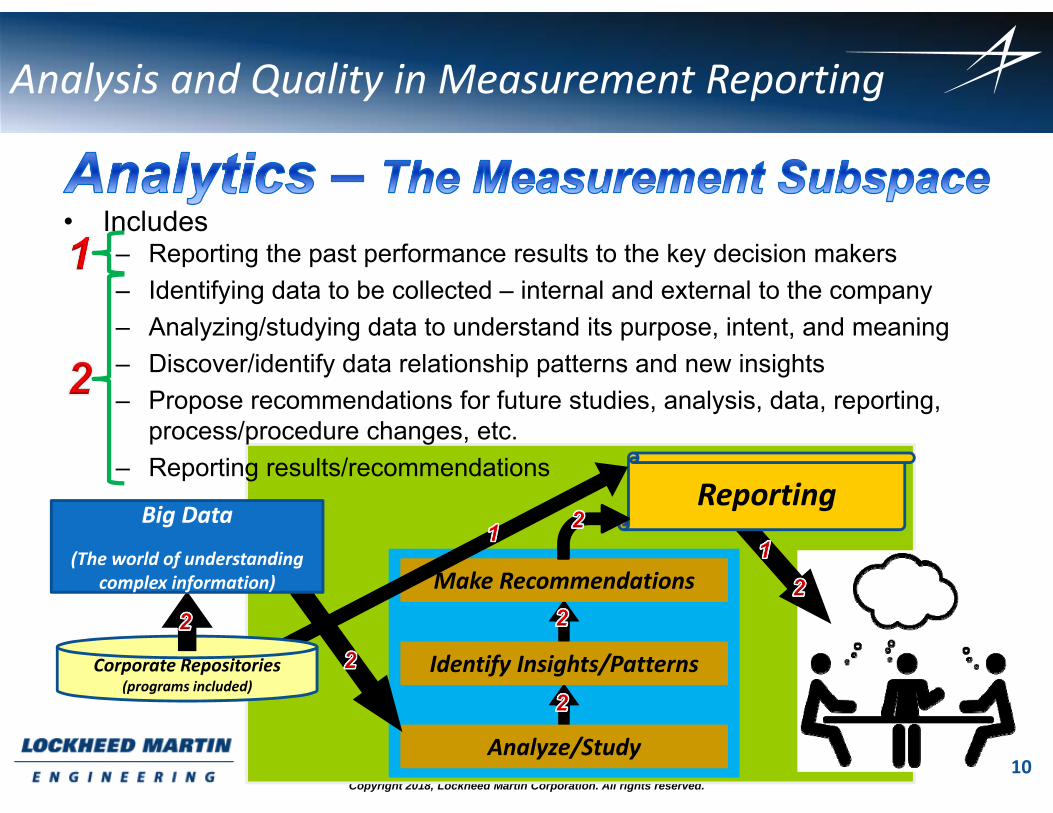
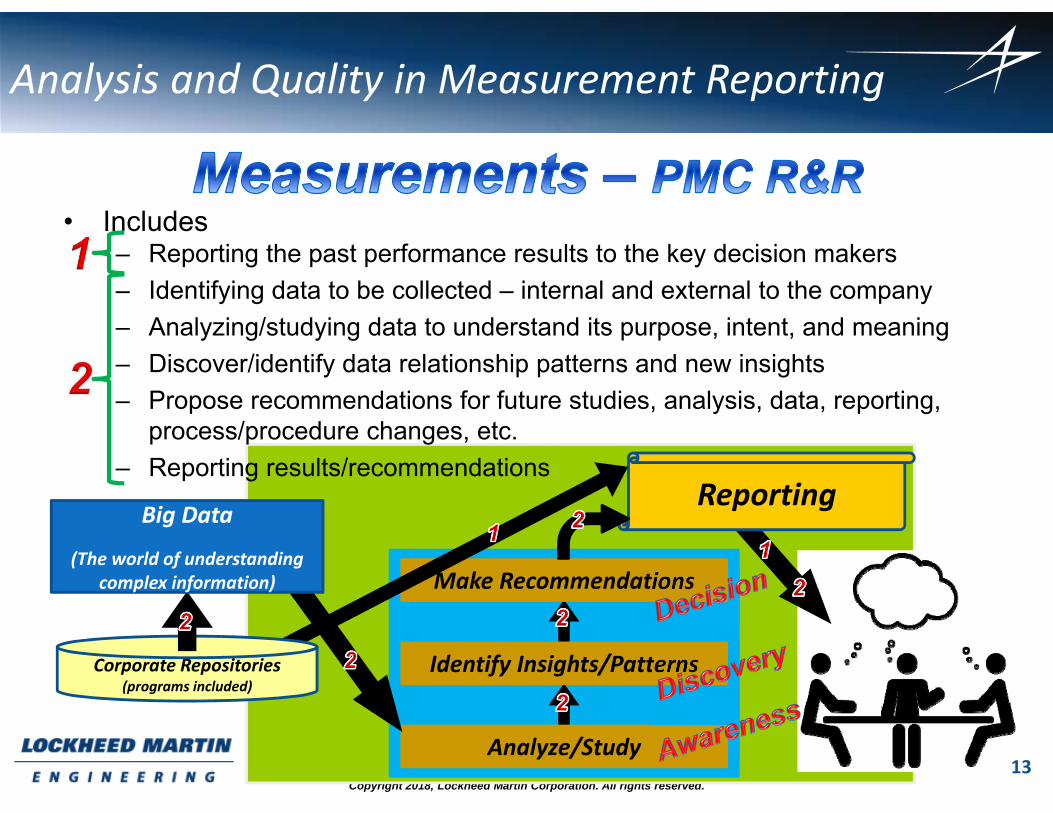
• Includes– Reporting the past performance results to the key decision makers– Identifying data to be collected – internal and external to the company– Analyzing/studying data to understand its purpose, intent, and meaning– Discover/identify data relationship patterns and new insights– Propose recommendations for future studies, analysis, data, reporting,
process/procedure changes, etc.– Reporting results/recommendations

11Copyright 2018, Lockheed Martin Corporation. All rights reserved.
Analysis and Quality in Measurement Reporting
12Copyright 2018, Lockheed Martin Corporation. All rights reserved.
Analysis and Quality in Measurement Reporting
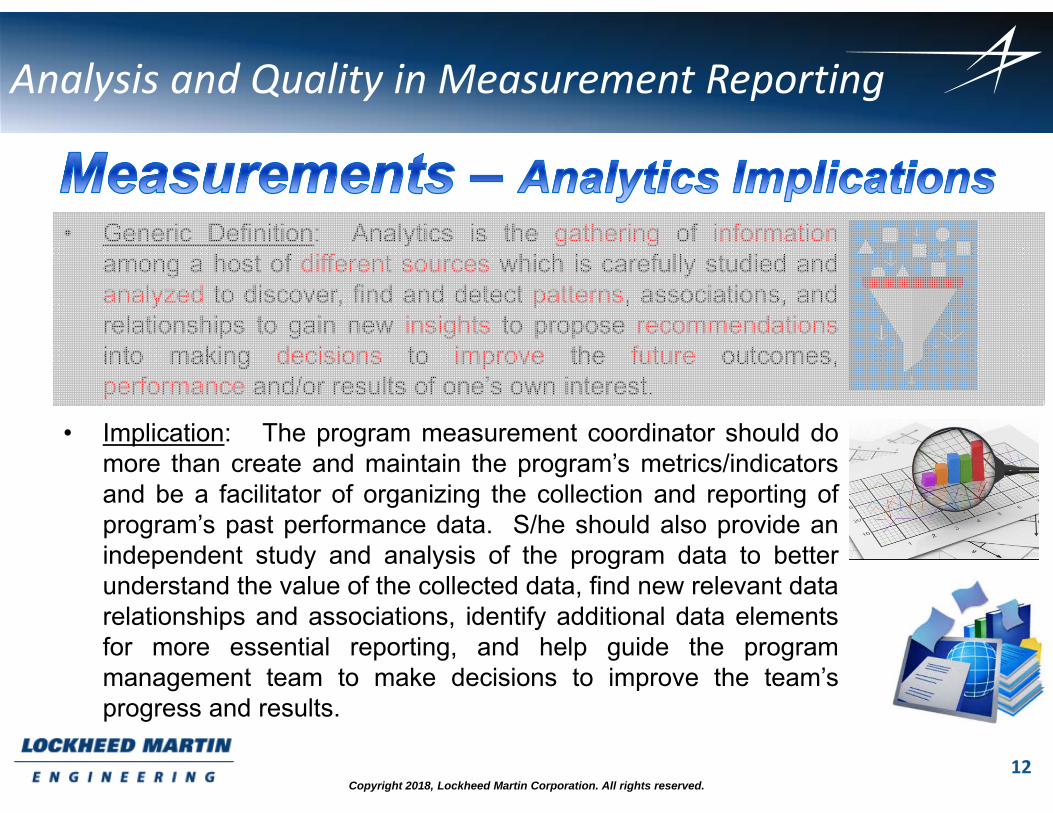
• Generic Definition: Analytics is the gathering of informationamong a host of different sources which is carefully studied andanalyzed to discover, find and detect patterns, associations, andrelationships to gain new insights to propose recommendationsinto making decisions to improve the future outcomes,performance and/or results of one’s own interest.
• Implication: The program measurement coordinator should domore than create and maintain the program’s metrics/indicatorsand be a facilitator of organizing the collection and reporting ofprogram’s past performance data. S/he should also provide anindependent study and analysis of the program data to betterunderstand the value of the collected data, find new relevant datarelationships and associations, identify additional data elementsfor more essential reporting, and help guide the programmanagement team to make decisions to improve the team’sprogress and results.
13Copyright 2018, Lockheed Martin Corporation. All rights reserved.
Analyze/Study
Identify Insights/Patterns
Make Recommendations
Reporting
Corporate Repositories(programs included)
Big Data
(The world of understanding complex information)
Analysis and Quality in Measurement Reporting
• Includes– Reporting the past performance results to the key decision makers– Identifying data to be collected – internal and external to the company– Analyzing/studying data to understand its purpose, intent, and meaning– Discover/identify data relationship patterns and new insights– Propose recommendations for future studies, analysis, data, reporting,
process/procedure changes, etc.– Reporting results/recommendations
14Copyright 2018, Lockheed Martin Corporation. All rights reserved.
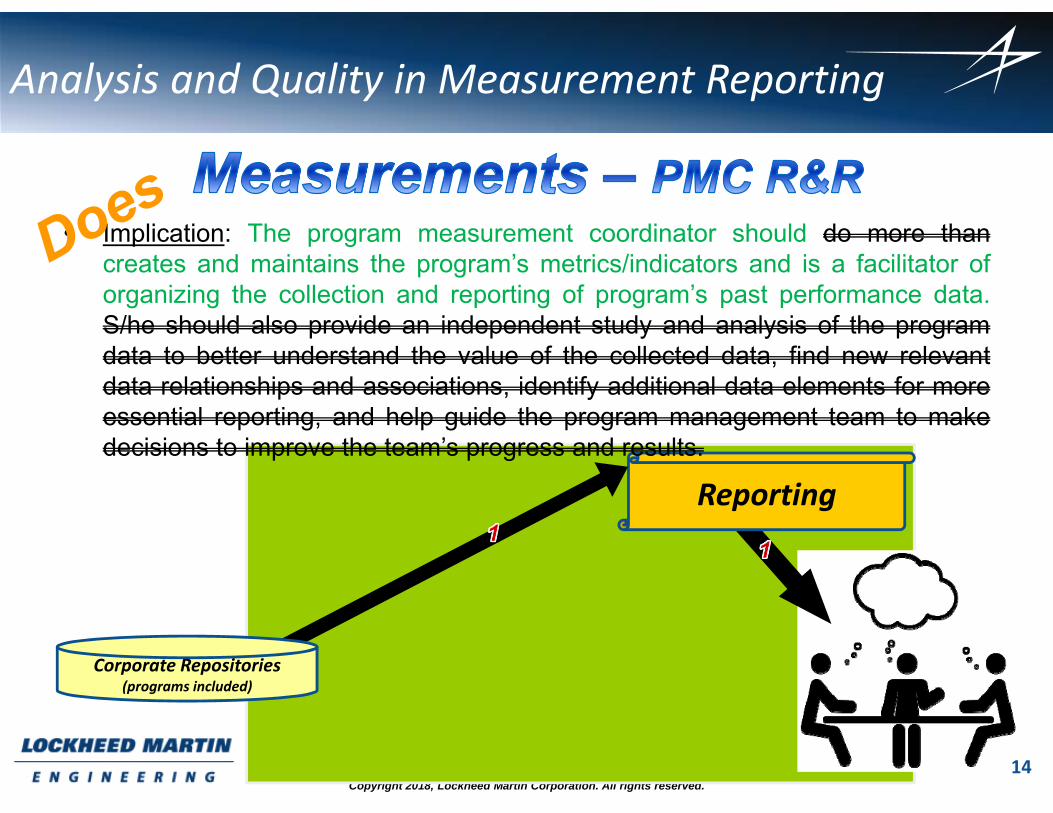
Reporting
• Implication: The program measurement coordinator should do more thancreates and maintains the program’s metrics/indicators and is a facilitator oforganizing the collection and reporting of program’s past performance data.S/he should also provide an independent study and analysis of the programdata to better understand the value of the collected data, find new relevantdata relationships and associations, identify additional data elements for moreessential reporting, and help guide the program management team to makedecisions to improve the team’s progress and results.
Corporate Repositories(programs included)
Analysis and Quality in Measurement Reporting
15Copyright 2018, Lockheed Martin Corporation. All rights reserved.
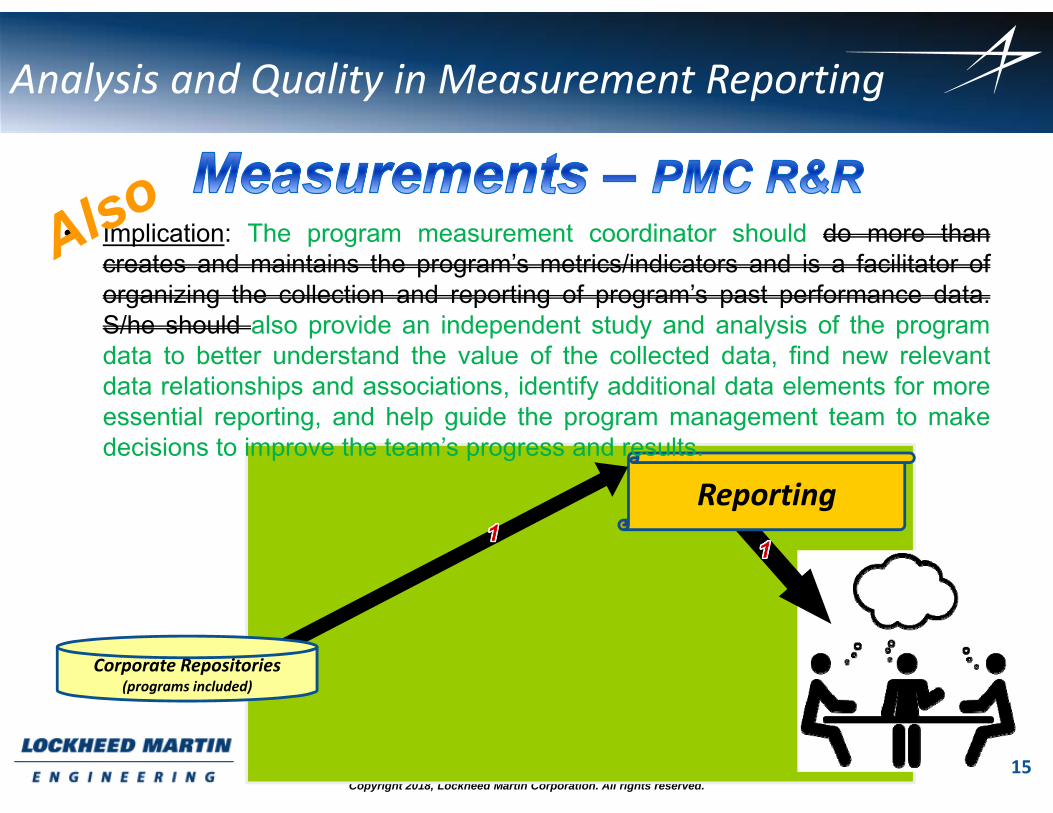
Reporting
• Implication: The program measurement coordinator should do more thancreates and maintains the program’s metrics/indicators and is a facilitator oforganizing the collection and reporting of program’s past performance data.S/he should also provide an independent study and analysis of the programdata to better understand the value of the collected data, find new relevantdata relationships and associations, identify additional data elements for moreessential reporting, and help guide the program management team to makedecisions to improve the team’s progress and results.
Corporate Repositories(programs included)
Analysis and Quality in Measurement Reporting
16Copyright 2018, Lockheed Martin Corporation. All rights reserved.
Analyze/Study
Identify Insights/Patterns
Make Recommendations
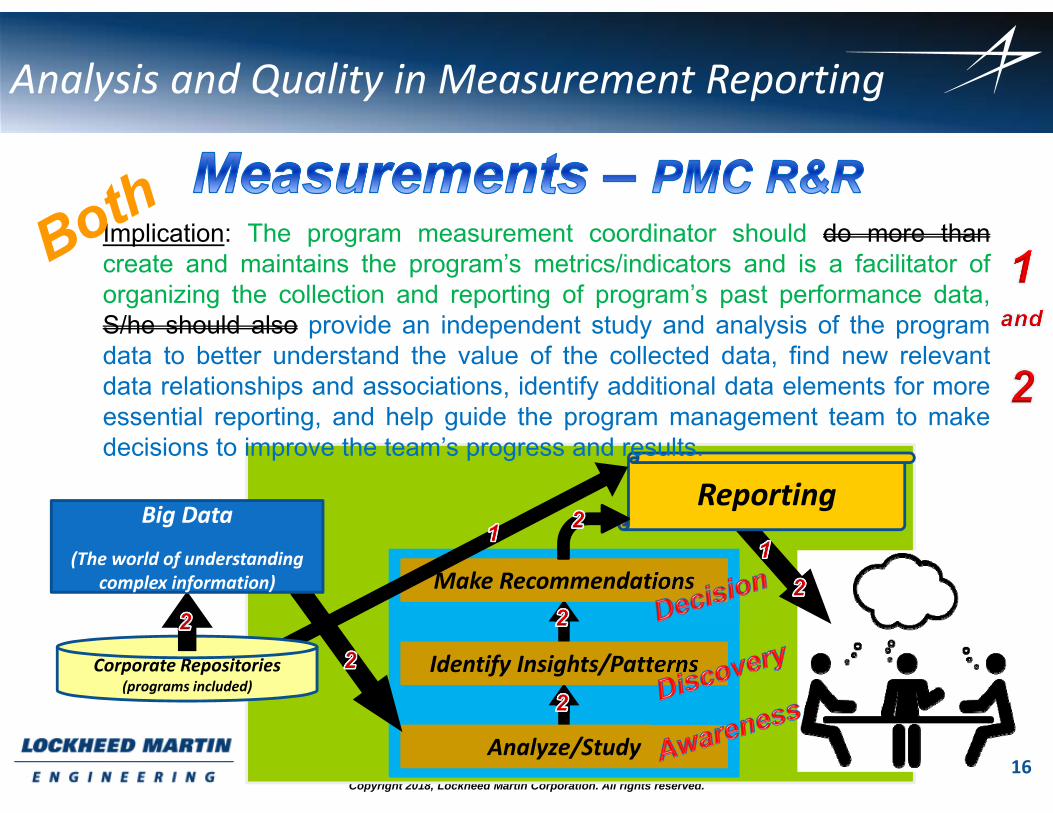
Reporting
• Implication: The program measurement coordinator should do more thancreate and maintains the program’s metrics/indicators and is a facilitator oforganizing the collection and reporting of program’s past performance data,S/he should also provide an independent study and analysis of the programdata to better understand the value of the collected data, find new relevantdata relationships and associations, identify additional data elements for moreessential reporting, and help guide the program management team to makedecisions to improve the team’s progress and results.
Corporate Repositories(programs included)
Big Data
(The world of understanding complex information)
Analysis and Quality in Measurement Reporting
17Copyright 2018, Lockheed Martin Corporation. All rights reserved.
Analysis and Quality in Measurement Reporting
18Copyright 2018, Lockheed Martin Corporation. All rights reserved.
Analysis and Quality in Measurement Reporting
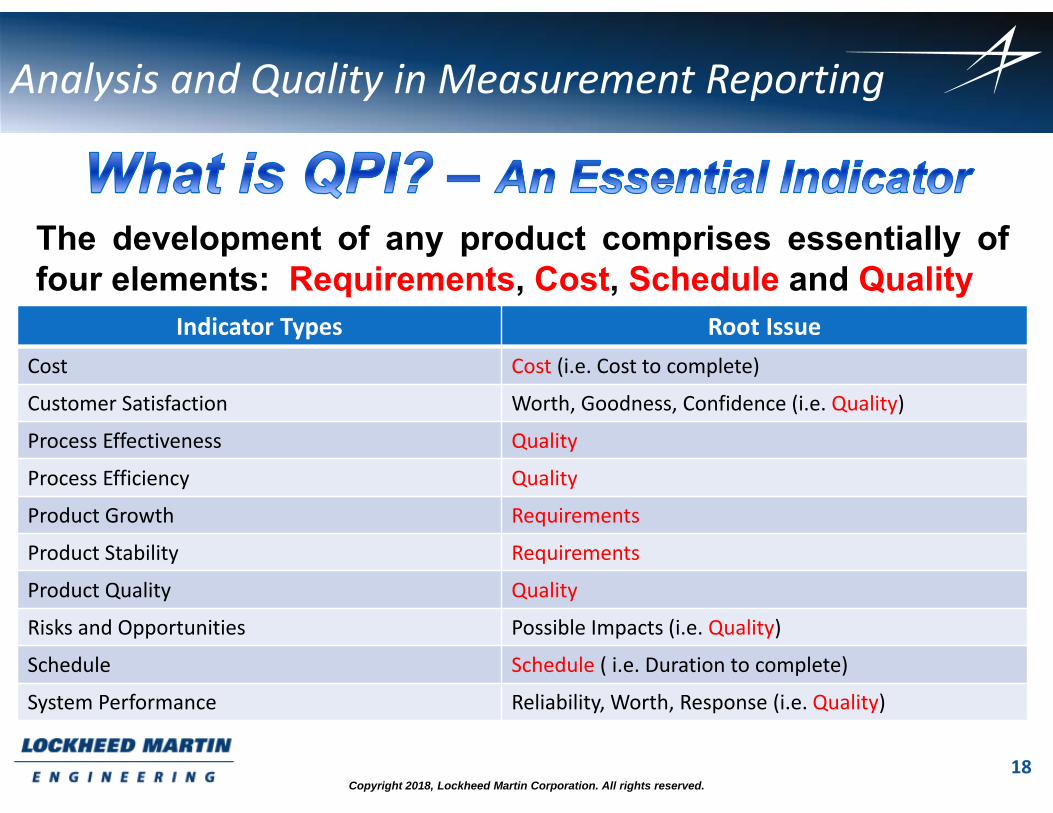
Indicator Types Root IssueCost Cost (i.e. Cost to complete)
Customer Satisfaction Worth, Goodness, Confidence (i.e. Quality)
Process Effectiveness Quality
Process Efficiency Quality
Product Growth Requirements
Product Stability Requirements
Product Quality Quality
Risks and Opportunities Possible Impacts (i.e. Quality)
Schedule Schedule ( i.e. Duration to complete)
System Performance Reliability, Worth, Response (i.e. Quality)
The development of any product comprises essentially offour elements: Requirements, Cost, Schedule and Quality
19Copyright 2018, Lockheed Martin Corporation. All rights reserved.
Analysis and Quality in Measurement Reporting
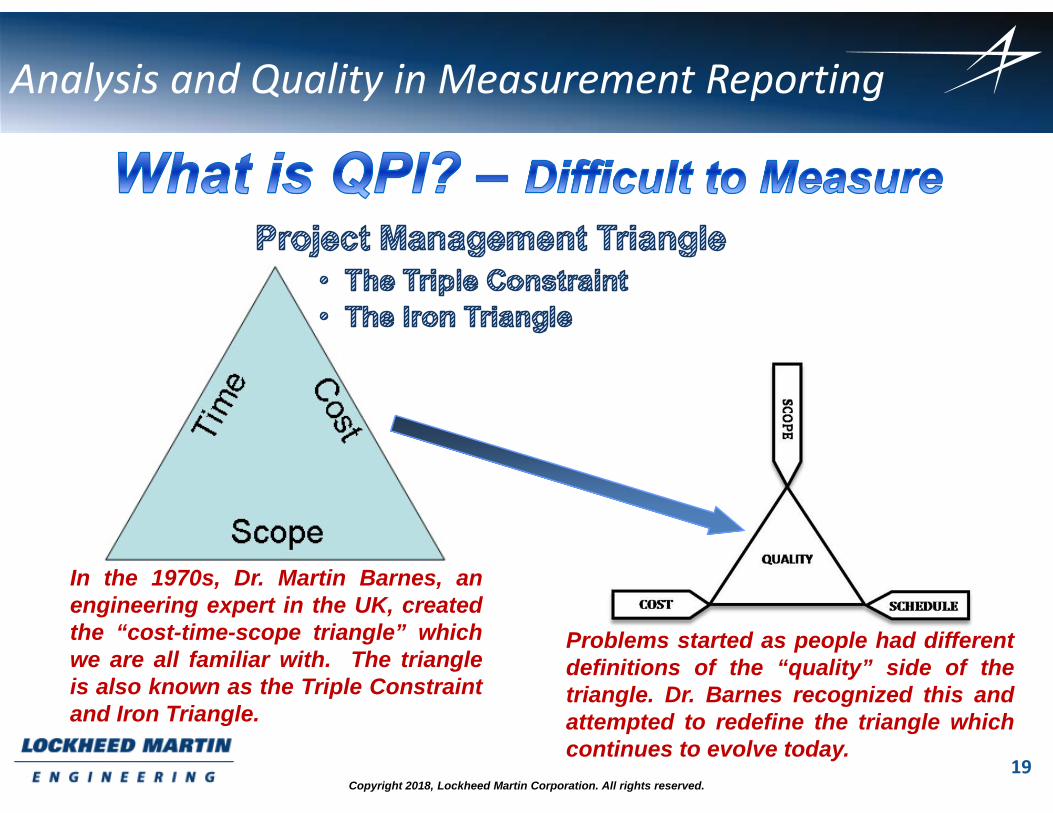
In the 1970s, Dr. Martin Barnes, anengineering expert in the UK, createdthe “cost-time-scope triangle” whichwe are all familiar with. The triangleis also known as the Triple Constraintand Iron Triangle.
Problems started as people had differentdefinitions of the “quality” side of thetriangle. Dr. Barnes recognized this andattempted to redefine the triangle whichcontinues to evolve today.
20Copyright 2018, Lockheed Martin Corporation. All rights reserved.
Analysis and Quality in Measurement Reporting
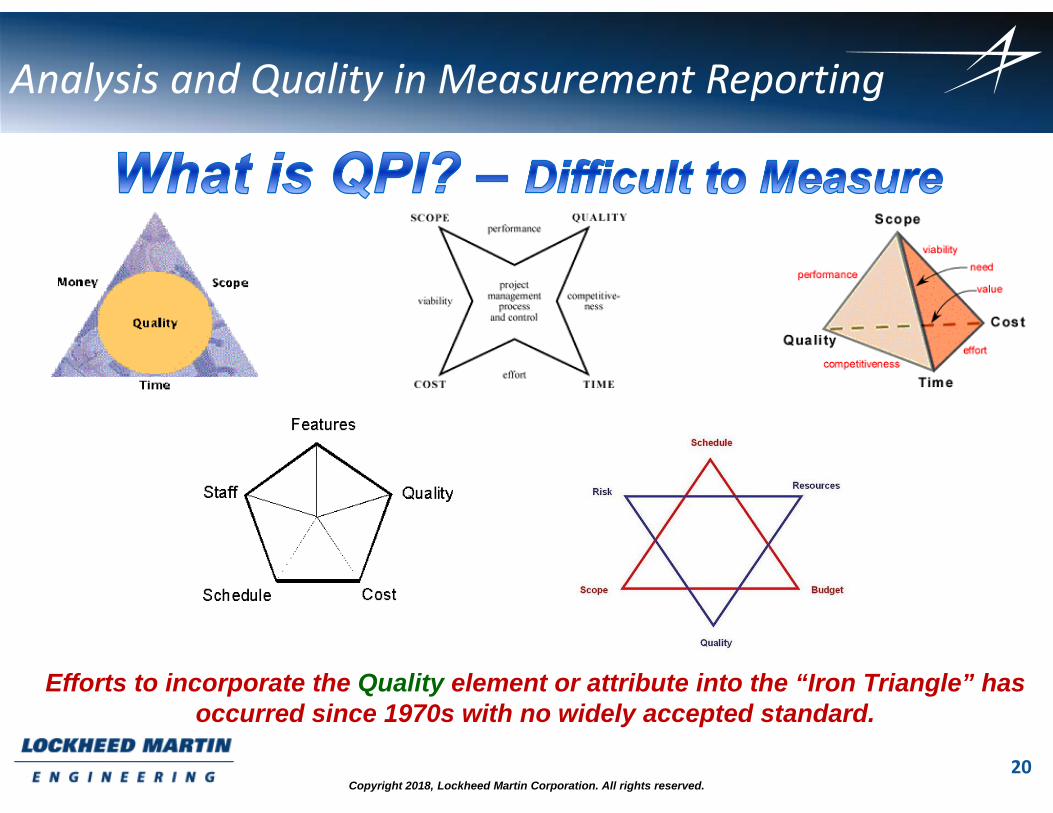
Efforts to incorporate the Quality element or attribute into the “Iron Triangle” has occurred since 1970s with no widely accepted standard.
21Copyright 2018, Lockheed Martin Corporation. All rights reserved.
Analysis and Quality in Measurement Reporting
Applies to software and hardware development programs
Quantitatively measures the efficiency of Quality (goodness, worth,reliability, value, safety, usefulness, etc.) infused/integrated into program’ssolution
Enables programs to manage the progress of the level of their Quality
Examples: Certified level of performance, reliability, capability, etc. Warrantee of error free operations for a period of time 100% Guarantee of satisfaction
22Copyright 2018, Lockheed Martin Corporation. All rights reserved.
Analysis and Quality in Measurement Reporting
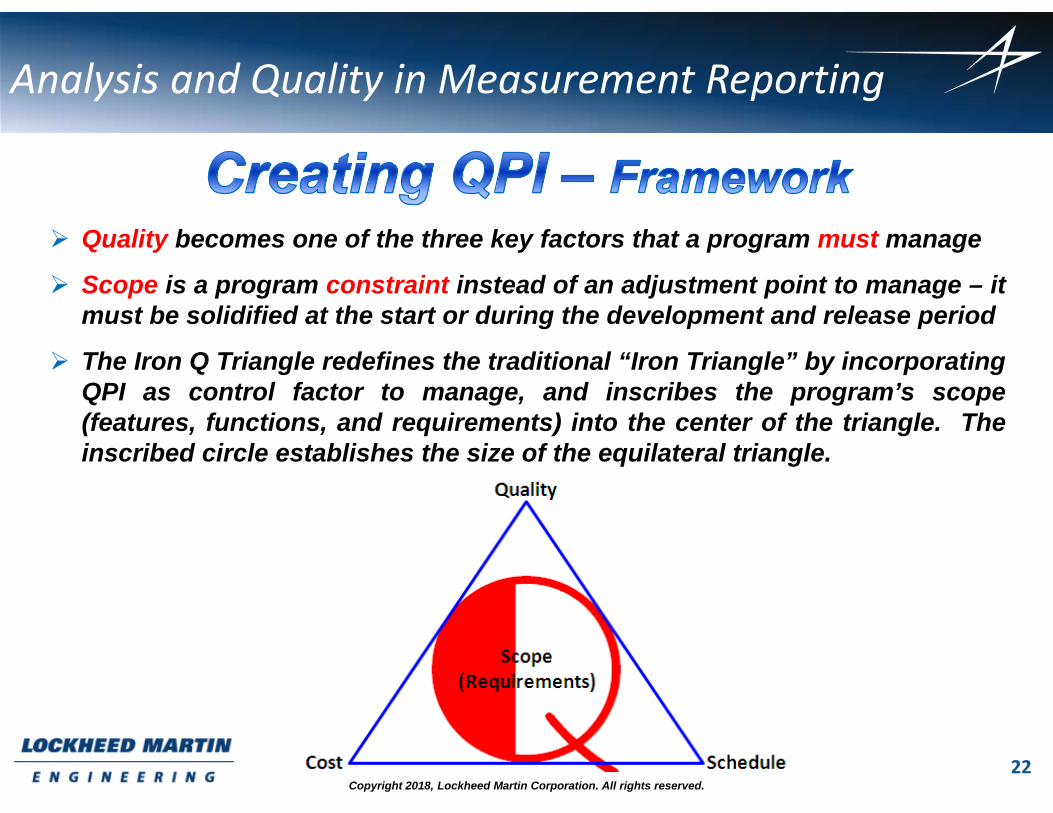
Quality becomes one of the three key factors that a program must manage
Scope is a program constraint instead of an adjustment point to manage – itmust be solidified at the start or during the development and release period
The Iron Q Triangle redefines the traditional “Iron Triangle” by incorporatingQPI as control factor to manage, and inscribes the program’s scope(features, functions, and requirements) into the center of the triangle. Theinscribed circle establishes the size of the equilateral triangle.
23Copyright 2018, Lockheed Martin Corporation. All rights reserved.
Analysis and Quality in Measurement Reporting
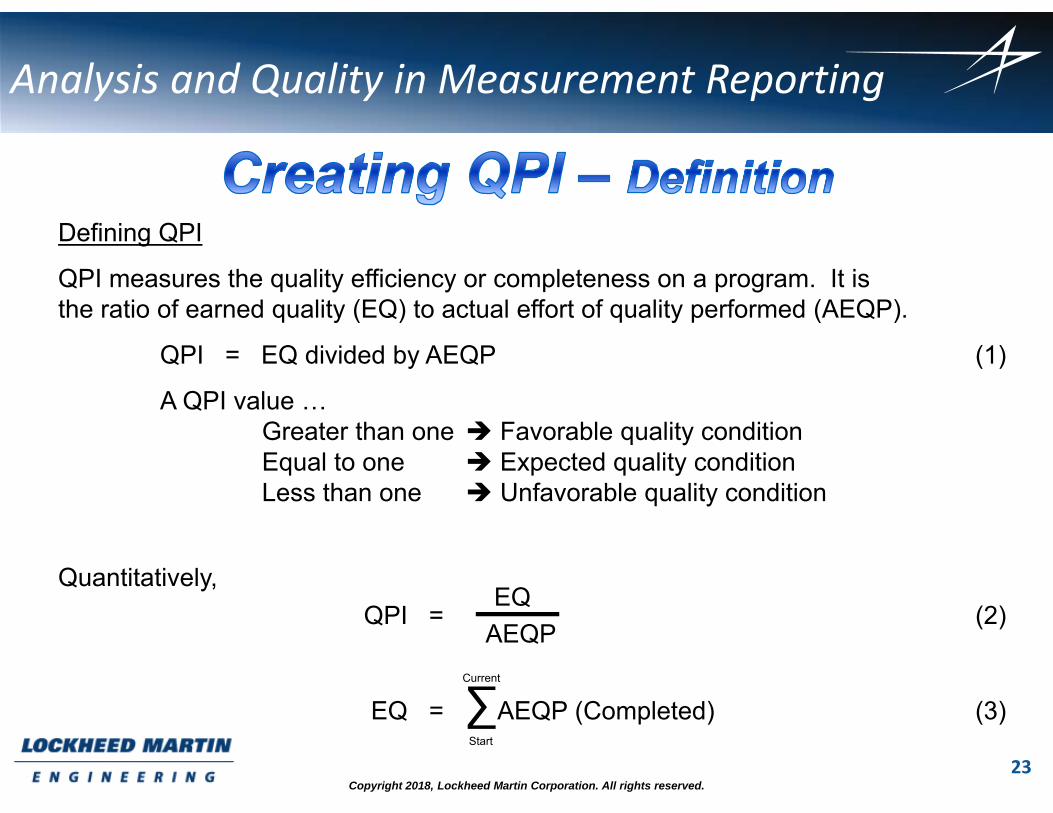
Defining QPI
QPI measures the quality efficiency or completeness on a program. It isthe ratio of earned quality (EQ) to actual effort of quality performed (AEQP).
QPI = EQ divided by AEQP (1)
A QPI value …Greater than one Favorable quality conditionEqual to one Expected quality conditionLess than one Unfavorable quality condition
Quantitatively,EQ
QPI = (2)AEQP
Current
EQ = ∑AEQP (Completed) (3)Start
24Copyright 2018, Lockheed Martin Corporation. All rights reserved.
Analysis and Quality in Measurement Reporting
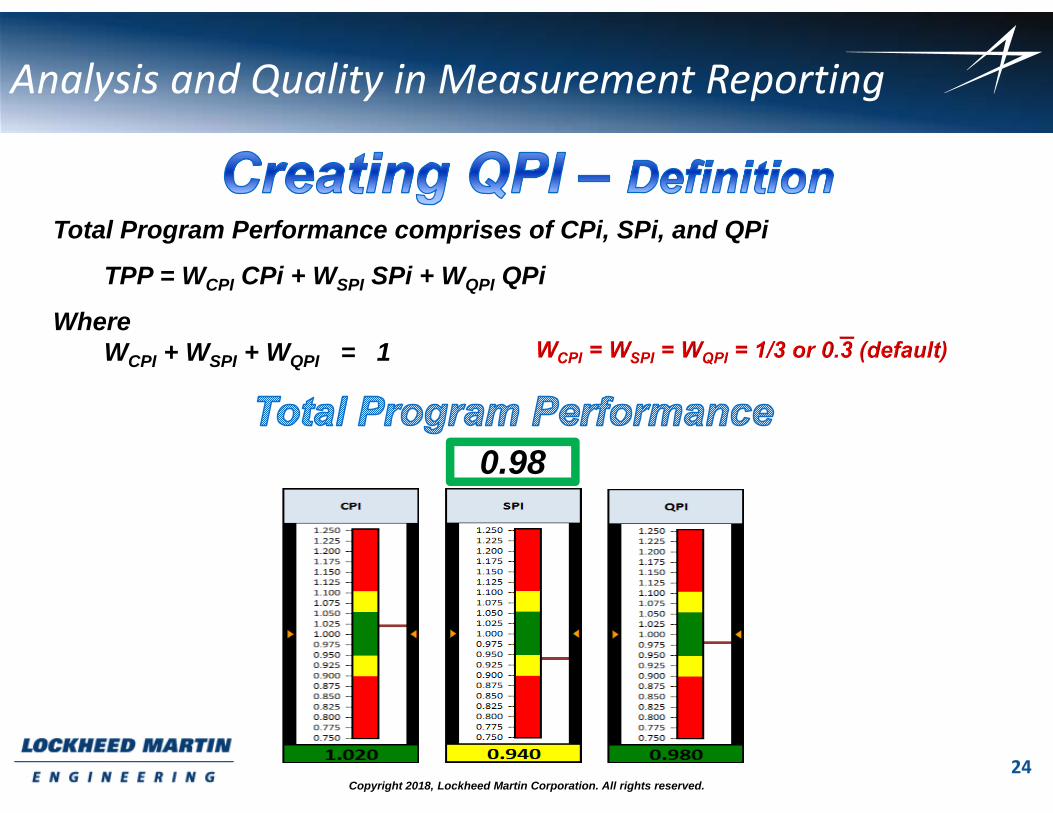
0.98
Total Program Performance comprises of CPi, SPi, and QPi
TPP = WCPI CPi + WSPI SPi + WQPI QPi
WhereWCPI + WSPI + WQPI = 1
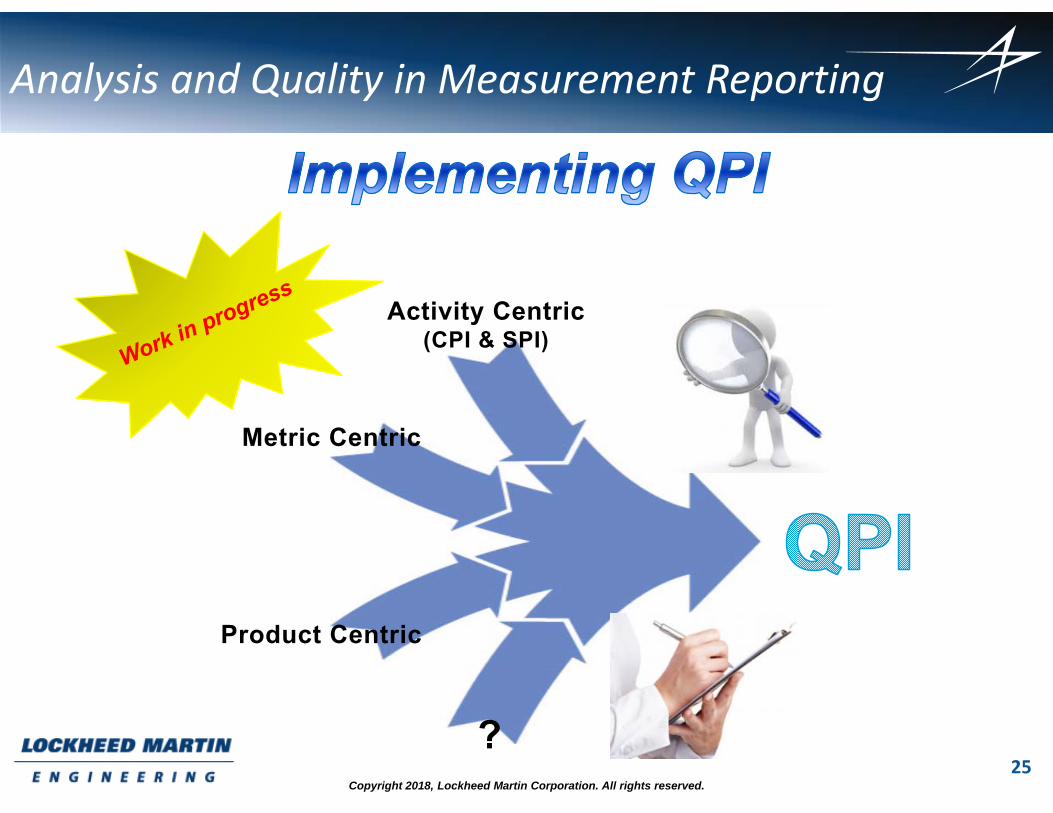
25Copyright 2018, Lockheed Martin Corporation. All rights reserved.
Analysis and Quality in Measurement Reporting
Activity Centric(CPI & SPI)
Metric Centric
Product Centric
?
26Copyright 2018, Lockheed Martin Corporation. All rights reserved.
Analysis and Quality in Measurement Reporting
27Copyright 2018, Lockheed Martin Corporation. All rights reserved.
Analysis and Quality in Measurement Reporting
28Copyright 2018, Lockheed Martin Corporation. All rights reserved.
Analysis and Quality in Measurement Reporting
29Copyright 2018, Lockheed Martin Corporation. All rights reserved.
Analysis and Quality in Measurement Reporting
30Copyright 2018, Lockheed Martin Corporation. All rights reserved.
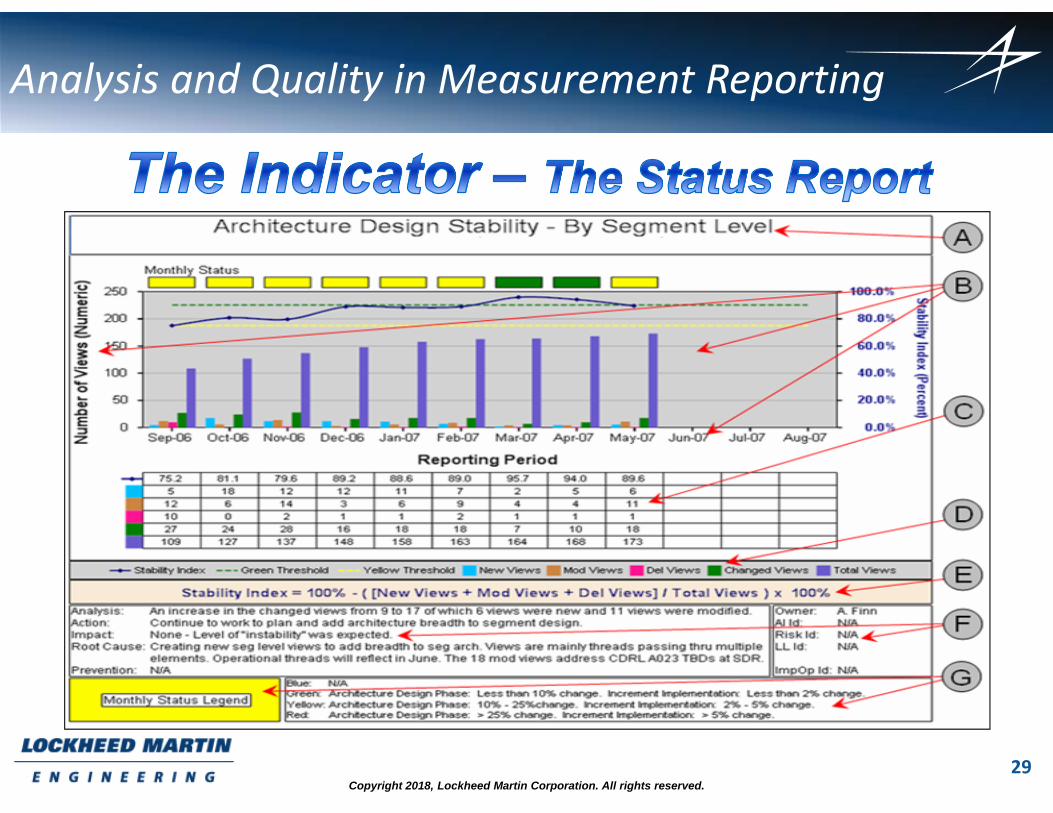
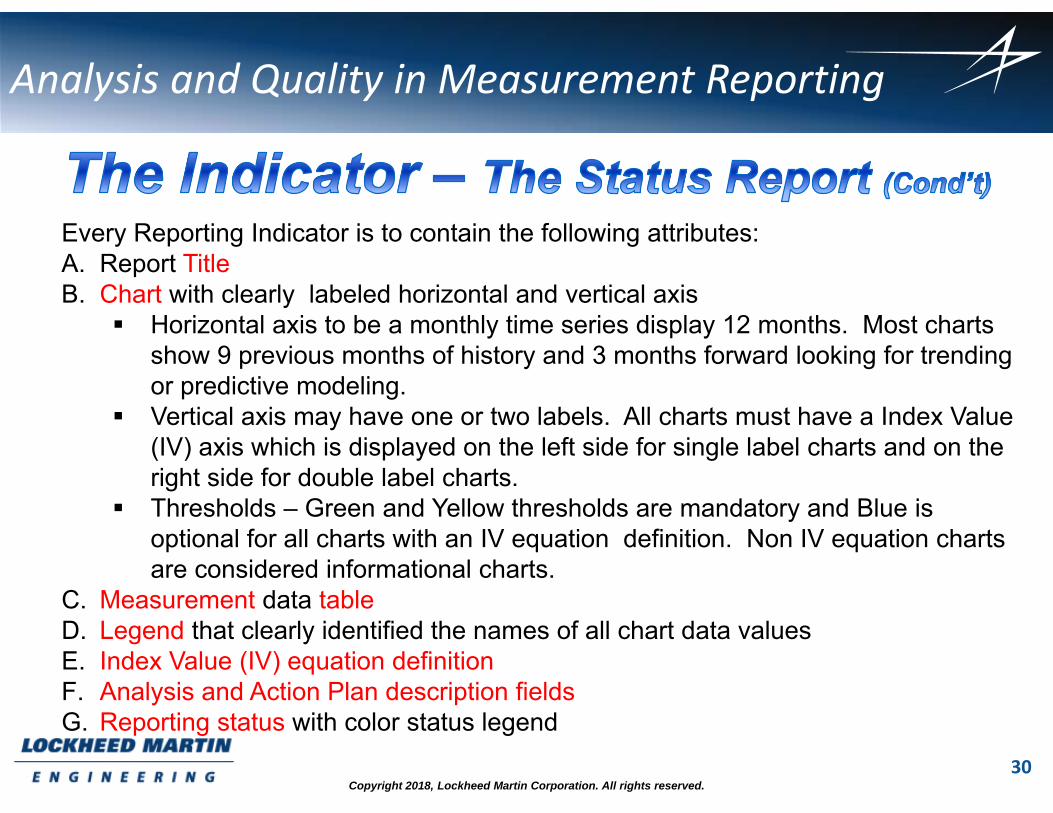
Every Reporting Indicator is to contain the following attributes:A. Report TitleB. Chart with clearly labeled horizontal and vertical axis
Horizontal axis to be a monthly time series display 12 months. Most charts show 9 previous months of history and 3 months forward looking for trending or predictive modeling.
Vertical axis may have one or two labels. All charts must have a Index Value (IV) axis which is displayed on the left side for single label charts and on the right side for double label charts.
Thresholds – Green and Yellow thresholds are mandatory and Blue is optional for all charts with an IV equation definition. Non IV equation charts are considered informational charts.
C. Measurement data tableD. Legend that clearly identified the names of all chart data valuesE. Index Value (IV) equation definitionF. Analysis and Action Plan description fieldsG. Reporting status with color status legend
Analysis and Quality in Measurement Reporting
31Copyright 2018, Lockheed Martin Corporation. All rights reserved.
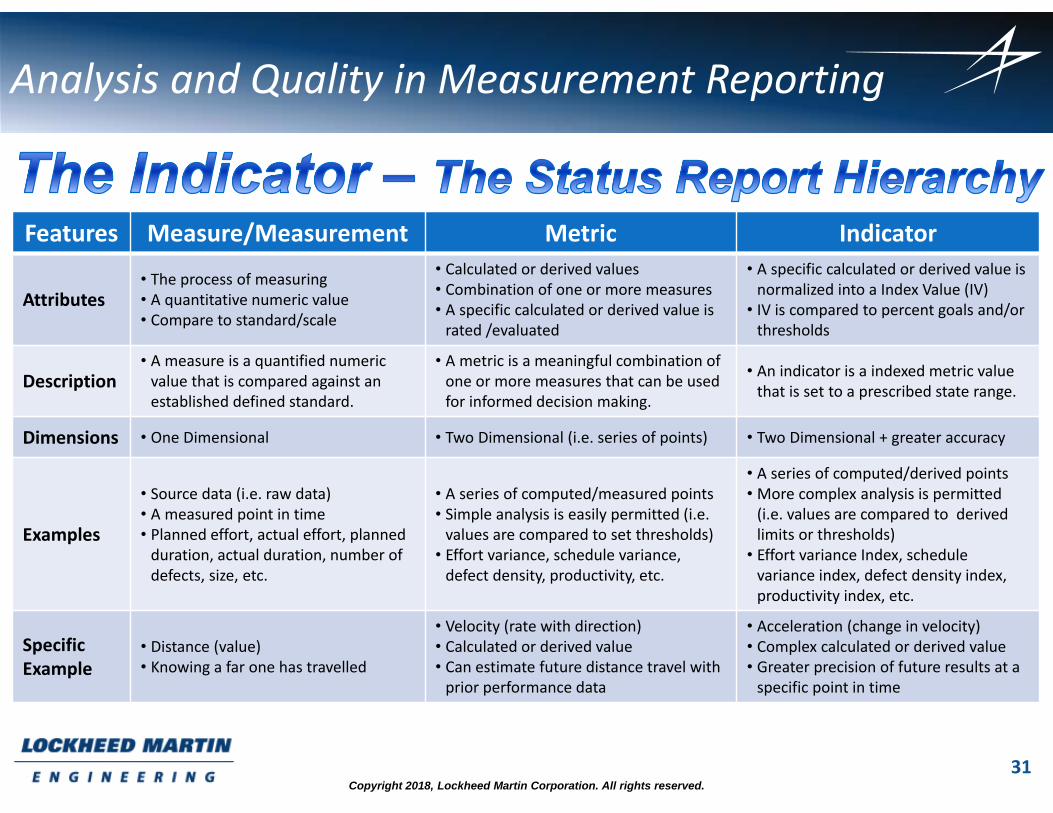
Features Measure/Measurement Metric Indicator
Attributes• The process of measuring• A quantitative numeric value• Compare to standard/scale
• Calculated or derived values• Combination of one or more measures• A specific calculated or derived value is rated /evaluated
• A specific calculated or derived value is normalized into a Index Value (IV)
• IV is compared to percent goals and/or thresholds
Description• A measure is a quantified numericvalue that is compared against an established defined standard.
• A metric is a meaningful combination of one or more measures that can be used for informed decision making.
• An indicator is a indexed metric value that is set to a prescribed state range.
Dimensions • One Dimensional • Two Dimensional (i.e. series of points) • Two Dimensional + greater accuracy
Examples
• Source data (i.e. raw data)• A measured point in time• Planned effort, actual effort, planned duration, actual duration, number of defects, size, etc.
• A series of computed/measured points• Simple analysis is easily permitted (i.e. values are compared to set thresholds)
• Effort variance, schedule variance, defect density, productivity, etc.
• A series of computed/derived points• More complex analysis is permitted (i.e. values are compared to derivedlimits or thresholds)
• Effort variance Index, schedule variance index, defect density index, productivity index, etc.
Specific Example
• Distance (value)• Knowing a far one has travelled
• Velocity (rate with direction)• Calculated or derived value• Can estimate future distance travel withprior performance data
• Acceleration (change in velocity)• Complex calculated or derived value• Greater precision of future results at a specific point in time
Analysis and Quality in Measurement Reporting
32Copyright 2018, Lockheed Martin Corporation. All rights reserved.
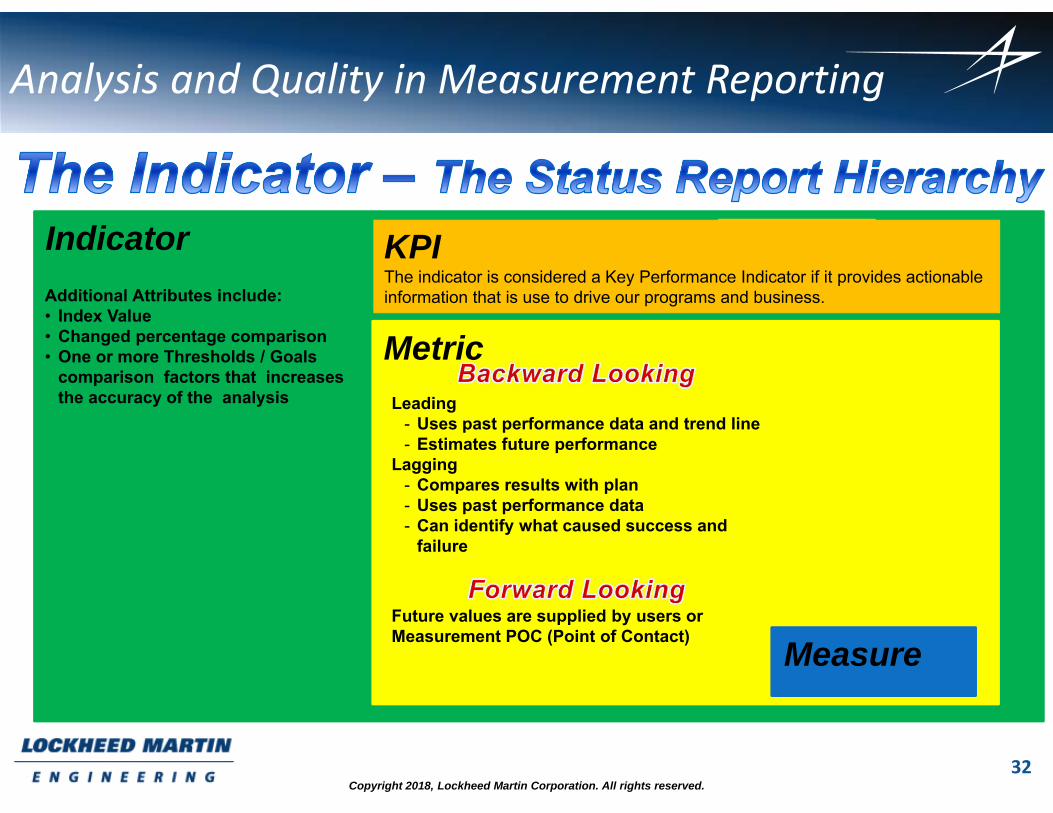
Indicator
Metric
Future values are supplied by users or Measurement POC (Point of Contact)
Leading- Uses past performance data and trend line- Estimates future performance
Lagging- Compares results with plan- Uses past performance data- Can identify what caused success and
failure
Measure
KPIThe indicator is considered a Key Performance Indicator if it provides actionable information that is use to drive our programs and business.Additional Attributes include:
• Index Value• Changed percentage comparison• One or more Thresholds / Goals
comparison factors that increasesthe accuracy of the analysis
Analysis and Quality in Measurement Reporting
33Copyright 2018, Lockheed Martin Corporation. All rights reserved.
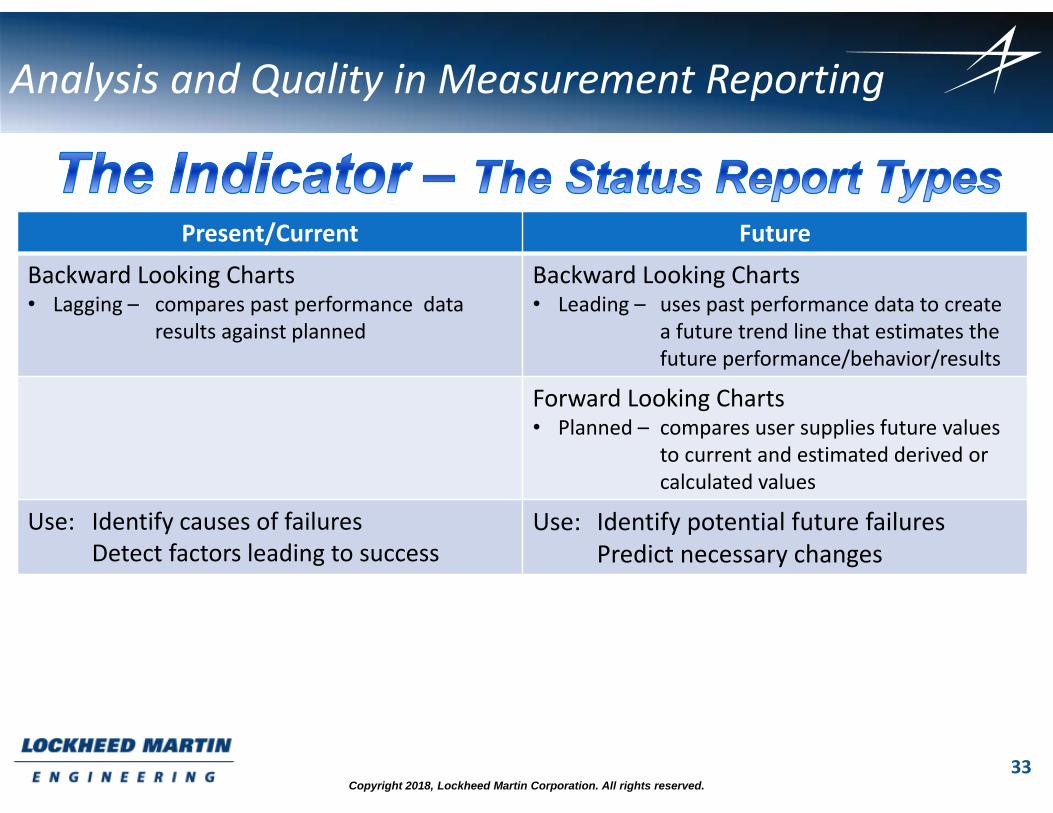
Present/Current Future
Backward Looking Charts• Lagging – compares past performance data
results against planned
Backward Looking Charts• Leading – uses past performance data to create
a future trend line that estimates thefuture performance/behavior/results
Forward Looking Charts• Planned – compares user supplies future values
to current and estimated derived or calculated values
Use: Identify causes of failuresDetect factors leading to success
Use: Identify potential future failuresPredict necessary changes
Analysis and Quality in Measurement Reporting
34Copyright 2018, Lockheed Martin Corporation. All rights reserved.
http://www.socialresearchmethods.net/kb/measlevl.phpLevels of Measurements
Measure, Metric, Indicatorhttp://it.toolbox.com/blogs/dw-cents/measures-metrics-and-indicators-23543
Analysis and Quality in Measurement Reporting
35Copyright 2018, Lockheed Martin Corporation. All rights reserved.
About the Presenter – Salvatore R Bruno
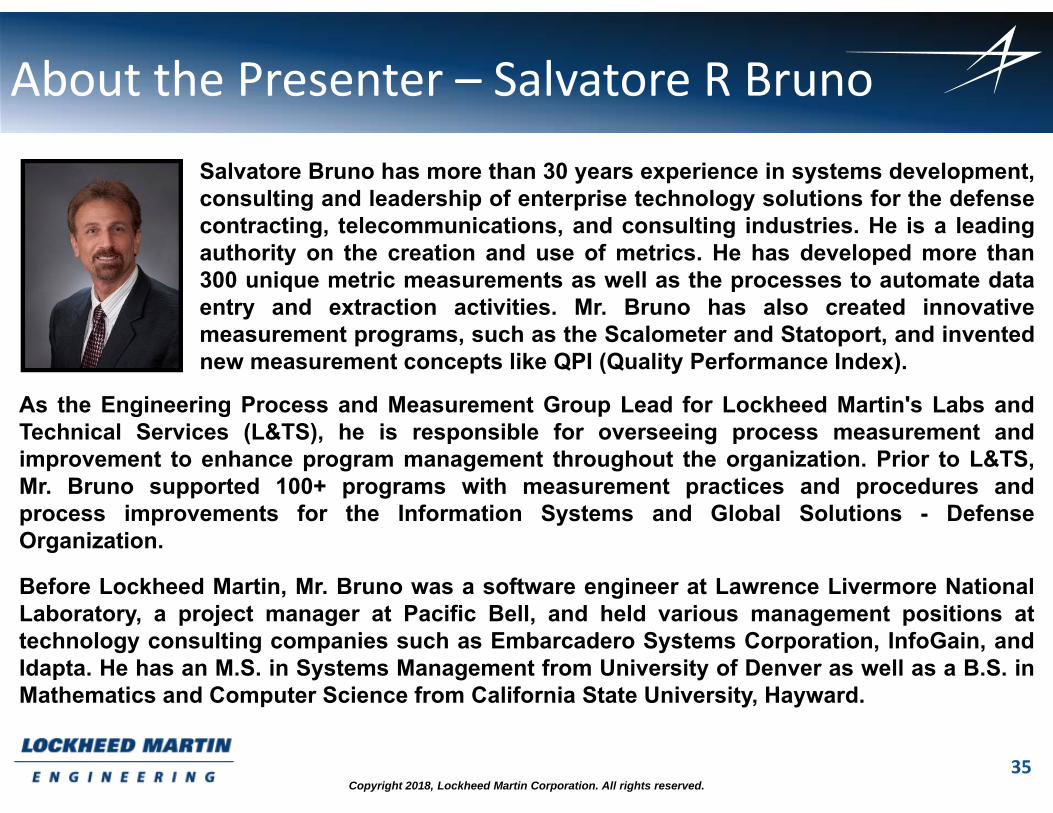
As the Engineering Process and Measurement Group Lead for Lockheed Martin's Labs andTechnical Services (L&TS), he is responsible for overseeing process measurement andimprovement to enhance program management throughout the organization. Prior to L&TS,Mr. Bruno supported 100+ programs with measurement practices and procedures andprocess improvements for the Information Systems and Global Solutions - DefenseOrganization.
Before Lockheed Martin, Mr. Bruno was a software engineer at Lawrence Livermore NationalLaboratory, a project manager at Pacific Bell, and held various management positions attechnology consulting companies such as Embarcadero Systems Corporation, InfoGain, andIdapta. He has an M.S. in Systems Management from University of Denver as well as a B.S. inMathematics and Computer Science from California State University, Hayward.
Salvatore Bruno has more than 30 years experience in systems development,consulting and leadership of enterprise technology solutions for the defensecontracting, telecommunications, and consulting industries. He is a leadingauthority on the creation and use of metrics. He has developed more than300 unique metric measurements as well as the processes to automate dataentry and extraction activities. Mr. Bruno has also created innovativemeasurement programs, such as the Scalometer and Statoport, and inventednew measurement concepts like QPI (Quality Performance Index).
36Copyright 2018, Lockheed Martin Corporation. All rights reserved.
About the Presenter – Salvatore R Bruno
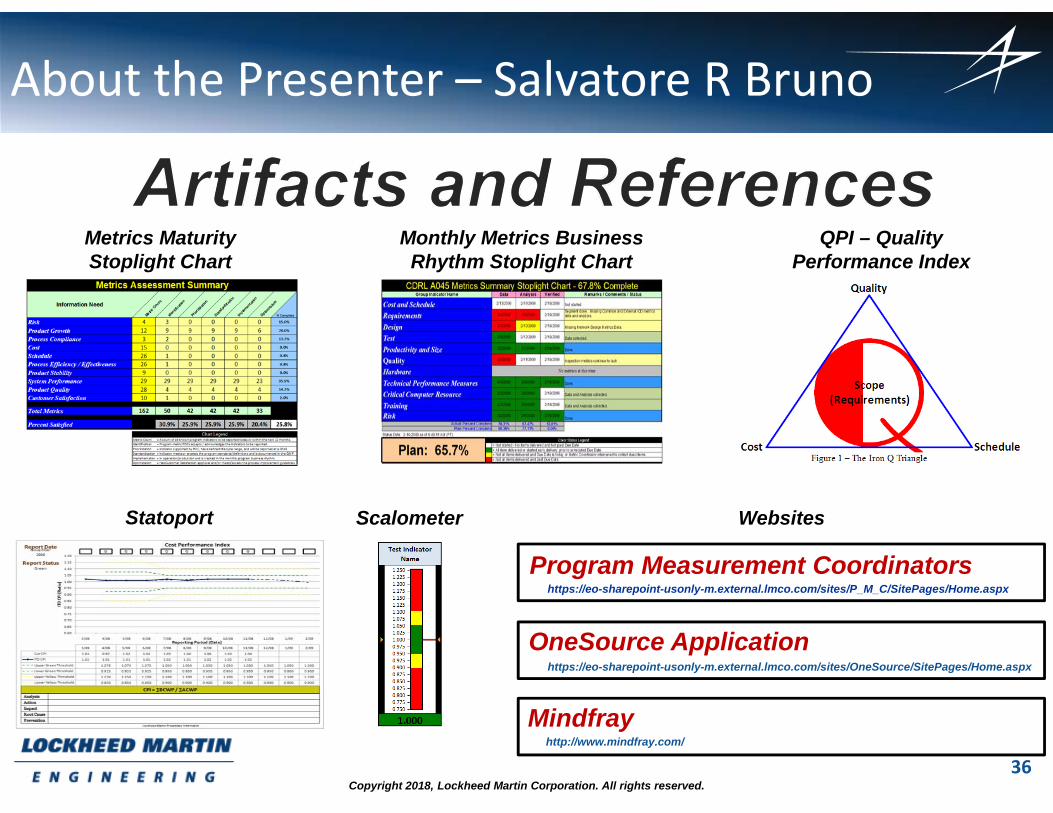
Metrics MaturityStoplight Chart
QPI – QualityPerformance Index
Monthly Metrics BusinessRhythm Stoplight Chart
Statoport Scalometer Websites
https://eo-sharepoint-usonly-m.external.lmco.com/sites/P_M_C/SitePages/Home.aspxProgram Measurement Coordinators
https://eo-sharepoint-usonly-m.external.lmco.com/sites/OneSource/SitePages/Home.aspx
OneSource Application
Mindfrayhttp://www.mindfray.com/