Embed Size (px)
Citation preview

Preliminary Draft Not For quotation
PAKISTAN INSTITUTE OF DEVELOPMENT ECONOMICS
No. 28
November 1977
AN ECONOMETRIC ANALYSIS OF RESIDENTIAL
DEMAND'FOR NATURAL GAS.
Anees Javed
An Econometric Analysis of Residential . Demand for Natural Gas.
£
. 1NTR0DU CI" 13N
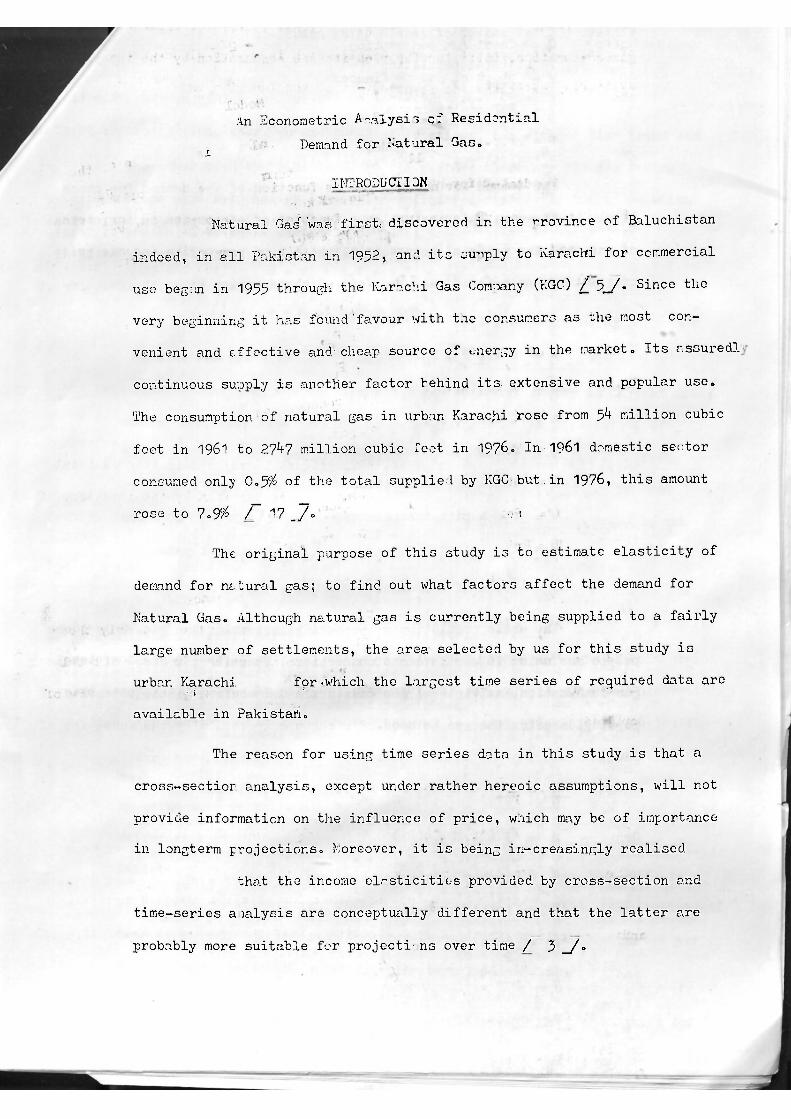
Natural Gad: was first* discovered in the province of Baluchistan
-indeed, in all Paid;stan in 1952, and its supply to Karachi for commercial
use began in 1955 through the Karachi Gas Com jany (KGC) /_ 5_/. Since the
very beginning it has found'favour with the consumers as the most con-
venient and effective and cheap source of energy in the market. Its assured!
continuous supply is another factor behind its extensive and popular use.
The consumption of natural gas in urban Karachi .rose from 5*f million cubic
feet in 1961 to 27^7 million cubic feet in 1976. In 1961 domestic sector
consumed only 0.5$ of the total supplied by KGC but.in 1976, this amount
rose to 7.9% /" 17 J 7. - 1
The original purpose of this study is to estimate elasticity of
demand for natural gas; to find out what factors affect the demand for
Natural Gas. Although natural gas is currently being supplied to a fairly
large number of settlements, the area selected by us for this study is
urban Karachi for-which the largest time series of required data are • S ' * ' 1
available in Pakistan.
The reason for using time series data in this study is that a
cross-sectior analysis, except under rather hereoic assumptions, will not
provide information on the influence of price, which may be of importance
in longterm projections. Moreover, it is being in-creasingly realised
that the income elasticities provided by cross-section and
time-series a lalysis are conceptually different and that the latter are
probably more suitable for project! ns over time / 3 _/•

- 2 -
Model
The demand for natural gas is function of the' demand for stock -
of gas appliances. Thi s in turn is a function of per Capita incomc, price
of gas, and the price of kerosene oil which is a very close and easily
available.substitute of gas. The forr. of the function is
G = G ( M )
W = W (Y, P , P ) g k Hence G = G (W (Y, P , P ) )
g k = F ( Y, P , P )
g k y.'here G = Total gas consumption
•W = Stock of gas appliances
Y = Per capita income P = Price of gas,. . g
P, = Price of Kerosene, k
The whole' population of Karachi .is not using the gas. Only those
people- are using it who have gas connections. Therefore, instead of total
gas'consumption, multiple of per capita gas consumption by the intensity of
population using the gas is used.
Thus .
G . U = F (Y, P ; P, ). — ~ S k
Or g = F '( Y, Pg, F k )
Vihere U = number of people using gas.
P = total population
and g = _G_ . P

- 3 -
We estimate two types of functions, one without time trend and
the other with the time tend, to see whether there are changes taking
place with the passage of time. The linear forms of the functions which
are to be estimated are as follows ;
(1) G = aQ + &1Y + a2Pg + a3Pk
(2) G = b + b P + b, T o i> K
DATA SOURCES
The data for the consumption of deme .tic sector in Karachi area,
during different time periods, were- obtained from the Directorate of
Natural Gas, "iovernment of Pakistan. The figures for population during
different years were calculated with the help of the Censuses of 1961
and 1972 £ 10 _/. The growth rate of the populations was found by the
following forrnula 2 __/.
P = Po ( 1 + r )n n
Where P^ = Population in the final year,
Pq = Population in the base year,
r = rate of growth of population,
n = number of years.
The figures of population for various years were them generated
by using this growth rate. The figures for the prices of natural gas during
different time periods were taken from the Gazette of the Government of
Pakistan /~11, 12, 13, 15, 16 __/ and for kerosene from the 25 Years
of Pakistan in Statestics, 19^7-1972, Statistical Year Book 197^,Statistical
Year Book 1975, and Pakistan Economic Survey 1976-77= The figures for per
capita income v/ere also taken from the same publications.

_ —if -
All these figures were ir. current prices. Therefore, thete
had to be converted into constant prices in order to avoid the effect
of money illusion. The problem w:,s to find a consumer price index to
convert these current figures into constant figures. But, for the whole
series a single. Price index was not available. Different consumer price
indices were available for different years and with the help of all
these a single price index was generated with the base year 1959-60
( see Appendix ).
The prices of natural gas and kerosene were converted into a
single unit, viz 1000 CFT of gas, giving equal quantities of heat in
terras of BTUSc Table 1 was used for this purpose £ 4 _/.
Table No. 1
Average calorific value Full equivalent to in terms of ETUS 1000 CFT of gas
Gas 975 / CFT 1000 CFT
Kerosene 154517 / Gallon 6.31 Gallons
Results
The results for both the functions come out to be statistically
insignificant. The first function gives positive sign for all the variables,
viz, per capita income (Y), price of gas (P ) and price of kerosene (P ). i rC 2
The R for this function is 0.71, F-ratio is 7»6 and DW is 1.019. With the
addition of the time trend as a variable.changes take place in the results.
The signs of Y and P become negative and-that of P remains the same i.e. K g 2 positive. The R increases to 0.966, F-ratio to 57.49 and DW to 1.023.
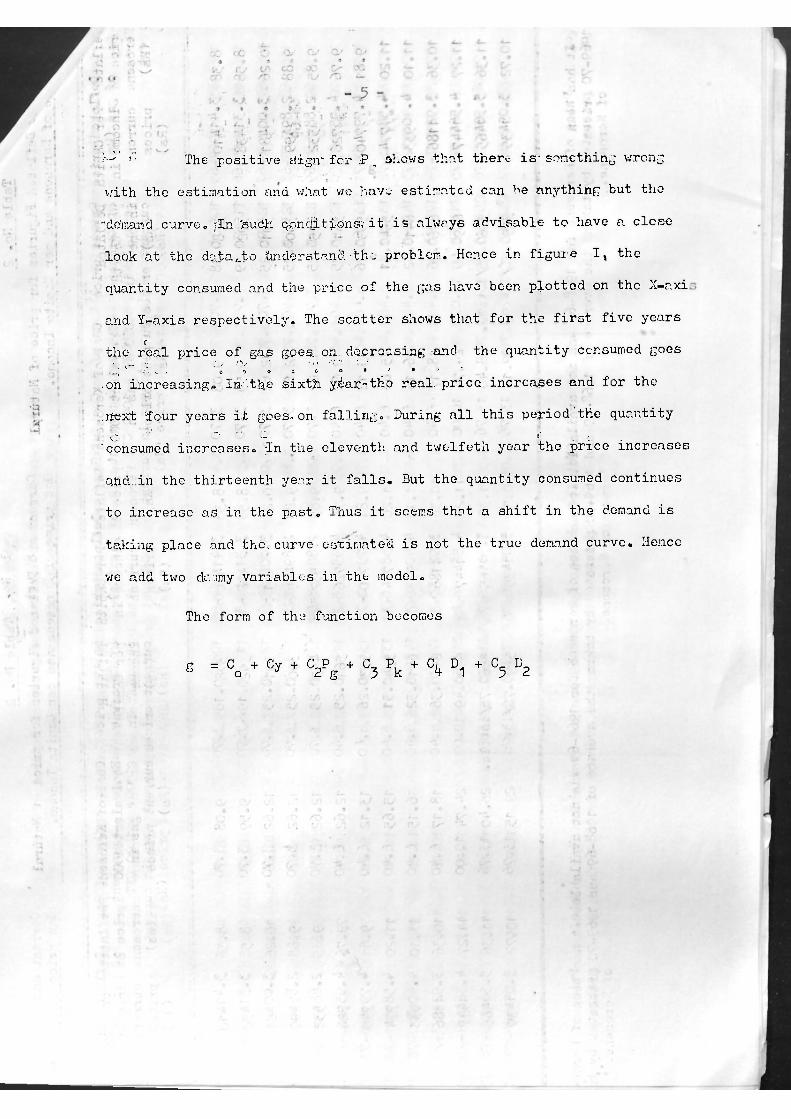
V? f> The positive rfign" for P. shows that there is- something wrong
v.'ith the estimation and what' we have estimated can be anything but tho
"demand curve, fin !'sudh qonoLitions; it .is-, alwrye advisable to have a close
look'at the dg^ajio tmderstanS, Wr. problem. Hence in figure I, the
quantity consumed and the price of the gas have been plotted on the X-axi
and Y-axis respectively. The scatter shows that for tho first five years
the r W l price of gas goes., on. decreasing-and the quantity consumed goes r .••• ' Q/ Oy ' "' ''''..'" ' ' , ; * o ^ o s t o * - - * - 1 -.on increasing. .In- the sixth yi'ar thl.o real."price increases and for the
:rte:x± four years it goes- on falling. • During all this period'the quantity c '' " I, « 6 . 'consumed increases. ;In the eleventh and twolfeth year the price increases
ahd in the thirteenth ye r it falls. But the quantity consumed continues
to increase as in the past. Thus it seems that a shift in the demand is
taking place and the, curve estimated is not the true demand curve. Hence
we add two duvimy variables in the model.
The form of the function becomes
g = C o + C y + C 2 P g + G 3 P k + C^D 1 + C 5 D 2


- : 9 : -
Where
D = 1 for the first five observation,
= o for other and
D^ = 1 for sixth tc 11th observations,
= 0 for rest.
The results which we get for this function are quite significant* _2 All the variables have appropriate.signs. The R is -976,- F-ratic is 59»22
and EW is 2.^92. The T-ratio for ineorr.e is 2.52, for P -1.96 and for P. -1.82. t K
These significant levels for these v-riable are 96^, 91$ and 88.9 %
respectively. The income elasticity is 0.93, price elasticity is -O.78
and cross elasticity is 0.68. It seems to be a good demand curve as all
the coefficients are significant and all the v-riahles have appropriate
signs. But there is no available evidence of any factors which cause a
demand curve to shift. Hence our analysis is not correct and we are
misinterpreting the regression analysis. This forces us to study the
market conditi ,ns in the gas sector.
The market conditi.ns are such that both price and supply of
gas, are administered one. The , overnment fi.es the price and the gas
companies have their own policy of providing new conmctions to a specific
number of consumers. The supply is constrained by the amount available.
This analysis shows something which can bo bettor explained by Figure II.
The equilibrium points represent the supply and price equilibrium points.
At price F^, the quantity consumed in q^. In fact this is the amount which
is being supplied by the gas company. The actual amount demanded is a

beyond this point and it lies cn a hypothetical demand curve represented
by DD . Thus h q is the excess demand or, in other words this is the • ' amount which has been curtailed due to rationing. The same is true abcut
all the points representing the equilibria- r-oints of price and the
quantity consumed,, The dotted lines which shrv the distance between the
observed points and the hypothetical demand, curve represent.-the amount
which should be consumed wheirall those who have applied for gas connection
get it.
.Conclusion J"
.'The demand curve which has been estimated with the given data
is not.the tru demand curve, i'-y taking it as a denand curve for gas one
is -ignoring ,th» true market. If we take into account the number of those
people, who have applied for gas connection alpn with thosp who have already
got i^, our estimates would reflect the true demand curve.
The price; of. gas is below .the price of the other fuels Which
could be used as a substitute for it. Therefore, the people's preference T - -
is for gas. If the Government wants to curtail the consumpti-n of gas,
it should either increase the price of jas or decrease the price of other
substitutes so that the two are brought to the same level, thus making it
less attractive for those who are creating new demand for it.

- : 11: -
The price index for this study has ben generated on the basis
of four different types of indices -s follows.
I. Consumer price index for industrial worker with the base year
19b1 for ye- r 1959-60 to 1970-71 (Table A-I ) /" 7 _7.
II. Consumer price index for Gcverr.mfnt and commercial employees
(clerical) in Karachi with the base year 195-1 for years 1956-57
to 1970-71 (Table A-II ) 7 J .
III. , Consumer price index for clerical wage earner with the bese
year 1961 fe- 1959-6.' to 1970-71 (Table A-III) 7 _7=
IV. Consumer price index for the monthly income group Rs. 501-1000
with the base year 1969-70 for years 1969-70 to 197^-75
( Table A-IV ) /'" 8, 9 J . In 1975-76, a 13.9 % increase took
placo on the previous year's consumer price index and in 1976-77
a further increase r.f ".8 % tc-ok place / 6 /. With the help
of this information figures for 1975-76 and 1976-77 were'
generated. These wer. on the base y. r 1969-70.
Tho first three indices were converted to the base Year 195r-60
and their average was calculated. Thus we got a series of figures
with the base year 1959-60 for the y ars 1959-60 to 1969-70. The
fourth index was on the base 1969-70, This was to K- converted to
the base 1959-60; for this purpose the figures for 1969-70 at
the base 1959-60 from the average of the first three indices v/as
used and then the figures "or 196G-70 onward were calculated.

-:12s-
Table No. A-I
Consumer's Price index for industrial workers by expenditure group* Base 1961== 1000
Y e a r Price in ,x
1959-60 98.49
1960-61 100.00
1961-62 9 S o 8 ?
1962-63 ' 98.92
1963-64 . 99„30
1964-65. 1 0 ^ 5 g
1965-66 108.83
1966-67 120.03
1967-68 • 124.81
1968-69 124,87
1969-70 125.20
1970-71 129.46
Price in'.ex i1960-6i=joq2 (19^9-60=100)
100.00
101.53
101.40
100.44
101.02
106.18
110.50
121.87
126.72
S[ ~
U o.. v
127.12
131.44

Table A- II
Consumers' price index for government and commercial employes
(clerical ) in Karachi by expenditure groups : House-hold
operations.
( Base : 195* = 100 )
Year Price index rice index 1996 =100 1959-60 =100
1956-57 101.49
1957-58 102.13
1958-59 98.14
1959-60. 99.65 100.00
1960-61 101.17 101.53
1961-62 101.10 101.46
1962-63 101.56 101.92
1963-64 102.12 102.48
1964-65 109.19 109.58
1965-66 112.06 112.45
1966-67 123.39 123.82
1967-68 128.20 128.65
1968-69 128.57 129.02
1969»70 130.29 130.75
1970-71 130.63 131.09

Tnble A-III
Consumers Price index for eloricel v/^e earners : Housing and Household o] eration
Year Price index _1 61=1C0 Price index 1959-60=100
1959-60 98.49 100.00
1960-61 100.00 101.53 196'--62 100.20 101.74
1962-63 100.24 101.78
1963-64 100.94 102.49
1964-65 107.7? 109.38
1965-66 110.50 112.19 1966-67 121.44 123.30
1967-68 126.10 127.93
1968-69 126.46 ' 128.40
1969-70 128.15 130.11
1970-71 128.46 130.43

Table No. A-IV
Combined consumer Price index fer inoooe group Rs.501 1000.*
Year Price index 1969-70 Price index 1959-60=100
1969-71 100 129.33
70-71 103.34 137.65
71-72 108.03 139.71
72-73 112.50 145.49
73-74 135.61 175.38 V : I 74-75 169.74 219.52
75-76 193.33 250.03
76.77 210.34 272.03
16:-
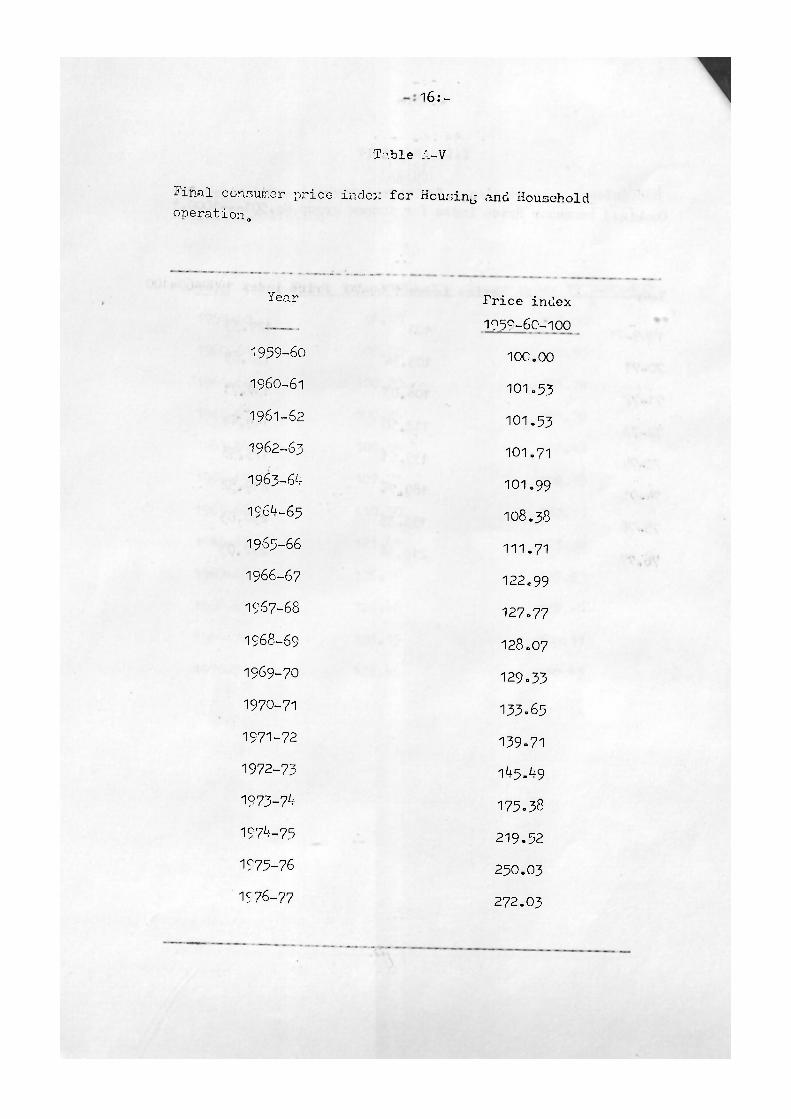
Table A-V
Fiiial consumer price index for Housing and Household operation.
Year
1959-60
1960-61
1961-62
1962-63
1963-64
1964-65
1965-66
1966-67
1967-68
1968-69
1969-70
1970-71
1971-72
1972-73
1973.74
1974-75
1975-76
1976-77
Price index 1959-60-100
100.00
101.53
101.53
101.71
101.99
108.38
111.71
122.99
127.77
128.07
129.33
133.65
139.71
145.49
175.38
219.52
250.03
272.03

Refer i aces
Balestra, P. and M. Norlov "Pooling Cross Section and Tire oeries
Data in Estimation of a Dynamic Model: The Demand for Natural
Gas". Econometrica. Vol. 3L, Nr.3 July 1966, pp. 585*612.
Guthrie, TIarold W. statistical 1 ethocfo in iSconoou.es> i one sod(llli):
Richard D. Irwin, Inc. 1-?66. p. S. .
Houthakker, H»3» and Taylor, Letter D. Consumer^Demand in 0 inited
States: Analyses and Projections, (second and Enlarged Edition)*
Cambridge (Mass.): Harvard University Press. 1970.
Karachi Gas Company. Yearly Diar;/_ V;Karachi
Kazi, A.'n.N. ''Utilization cf Katurnl Gas and LPG in Pakistan Pro ross
and r-ispects" Investment and Marketing. Vol.1 (7) Nov. 1975-
Pakistan. Finance Division. Eeonoaic Advisor's Vfin,-;. Pakistan Economic
cu_rvej_.1976.-77° Islamabad.
Pakistan.ministry of Finance, Economic Iffair Division, Central
Statistical Office. Yesrsjof Pakistan In Statistics.
Karachi. April, 1972.
Pakistan. Ministry of Finance, Planning and Economic Affairs.
Statistical Division. Statistical year book 1974. Karachi 1S'75«
Pakistan. Ministry of Finance, Planning and Economic Affairs.
Statistical Division, Statistical Year book 1975. Karachi 1976.
Pakistan. Ministry of Finance, Planning and Economic Affairs.
Statistics Division. Sxatistic:nl P< )cket-Book of Pakistan 1975»
Karachi. 1976.

11) Pakistan, iinistry of Fuel, Fewer find Natural Eos< urces (Directorstc
of Oil Operation ). "S. 134(1)/'.' . . e uaza:/ of Pakistan
( extraordinary ). Juno 2 , 19C . p. 547
12) Pakistan. Ministry of Fuel, Power and Natural Resources. "S.K.0 1198
. ;;r (1 )/73". The Gazette of Pakistan (Extraordinary ). Au-.15,1973p.1739. % %
13) Pakistan. Ministry of Fuel, Power and Natural Kcsaurc es(Diroetorate
of Oil Operation). i;o.h.O. 700(i;/74'.' Th£ Gazette of Ma-istan
(Extraordinary ). June , 1974. p. 943
14) Pakistan. Ministry of Fuel, Power and Natural Rescurces(Directorats
of Oil Operation ). llS. .0. l46(I)/75 '. The Gazette of Pakistan
(Extraordinary ). Feb. 1, 1975- . 158.
15) Pakistan. Ministry of Fuel, i .,wcr and National Kes urces (Directorate
.. of Oil operation ). "S.R.O. 277(1 )/76i?. The Gazetl of Pakistan
(Extraordinary ). March 25, 1976. p. 645
16) Pakistan. Ministry of Industries and Natural i-esources ( National
Resource Division). "S. .0. 1700/67"° The Gazette of Pakistan
(Extraordinary ). Feb. 8, 1967.
17. Pakistan. Ministry of Petroleum and l atural Resources.Directorate
of G-s Operation. "Sale of Karachi Gas Company".(Unpublished data).

This work is licensed under a Creative Commons Attribution - Noncommercial - NoDerivs 3.0 Licence.
To view a copy of the licence please see: http://creativecommons.Org/licenses/by-nc-nd/3.0/


![[karachi] - Goethe-Institut · #jugaad [prototyping] #guilds&markets [catalog] [humannetwork] #inteligencias colectivas #jewels #pakistan chowk #inteligencias colectivas [karachi]](https://img.pdfslide.net/doc/110x75/5f4ace5c0a8abe097c6cfd2e/karachi-goethe-institut-jugaad-prototyping-guildsmarkets-catalog.jpg)