Embed Size (px)
Citation preview

121
International Journal of Accounting & Business Management
www.ftms.edu.my/journals/index.php/journals/ijabm
Vol. 1 (No.1), April, 2013 Page: 121-137
ISSN: 2289-4519
This work is licensed under a Creative Commons Attribution 4.0 International License.
Pakistan-Sri Lanka Free Trade Agreement (PSFTA): A Comparison with SAARC and SAFTA
A.A.M.Nufile a, S.Santhirasegaram b, S.M.M.Ismail c
aPhD Student, FGS, University of Jaffna, Jaffna, Sri Lanka
b Senior Lecturer, University of Jaffna, Jaffna,,Sri Lanka [email protected]
c Senior Lecturer, South Eastern University of Sri Lanka, Oluvil, Sri Lanka,
[email protected] Abstract This paper attempts to estimate Pakistan-Sri Lanka Free Trade Agreement using the gravity model of trade. Panel data for the period 1980-2010 across two countries is employed in the analysis. The coefficients obtained from the model are used to predict the trade potential of both countries worldwide as well as within specific SAARC region. The results expose that Sri Lanka’s existing trade potential with Pakistan is high. Therefore, Sri Lanka should explore ways and means to further improve its trade relations with Pakistan and also concentrate more on new products to increase its market share as far as possible. However, the volume of trade of Sri Lanka with Pakistan is lower than that of India, despite the existing significant potentials. The main obstacles to this end are the political, ethnic and social tensions with
India, which is the key player of SAARC. Moreover, Sri Lanka and Pakistan face several major challenges such as diminishing marginal returns to economic integration, importance of non-tariff barriers to trade, homogeneous products and lack of leadership in Pakistan. It is pointed out that Sri Lankan entrepreneurs and exporters need to diversify from traditional export markets to industrial markets in Pakistan. In addition to that, post-PSFTA scenario explained that Sri Lanka’s trade dependency ratios have increased compared with pre-PSFTA scenario. This is evidenced from continuously increased post-PSFTA trade deficit. Hence, Sri Lanka should encourage investors from Pakistan to invest in Sri Lanka. Finally, the bilateral agreement is compared with SAARC and SAFTA and it is found that due to bilateral agreement there is a potential market for new products. In addition, a few important

122
measures that should be taken in order to sustain the trade with Pakistan are pointed out. Keywords: SAARC, SAPTA/SAFTA, PSFTA and Gravity model I. Introduction It has been a long felt need of both the less developed and developing countries in South Asia Region to expand their domestic markets for sustaining economic growth based on Gross Domestic Product (GDP)to ensure per capita income to balance the expenditure and capital accumulation based on their international resources from Agriculture, Industries, Commerce, Technologies and etc. forming the major sector of the economy for improving the quality of human life and focusing on social, cultural and political development until the 1980s to have signed the South Asian Association for Regional Co-operation (SAARC) and expanding the facilities of the local market by means of trade of goods and services with other countries of South Asia. After that the regional integration of intra-regional trade had been mooted since middle 1990s. The South Asian Preferential Trade Arrangement (SAPTA) was started on8th December1995 and South Asian Free Trade Area (SAFTA) was signed by the Heads of the regional countries on 12th January 2004. The leaders of the SAARC nations’ expected that SAFTA would work well and fulfilled its goals since 2006 at the 12th conference of SAARC in Pakistan. However, the SAPTA and SAFTA had covered very small and limited products
lines of trade among the member countries. Meanwhile, two major countries of SAARC have come to dominate other members on intra-regional trade activities. India and Pakistan were not in a position to favour other smaller countries of the SAARC region. At the same time, a big competition was started among them due to the military and political situation of the region. Therefore, Sri Lanka looked at bilateralism with greater benefits are concerned in both joint trade and economic cooperation that have emerged within the region. The Department of Commerce, Sri Lanka also functions as the important point in Sri Lanka for joint commissions on trade and economic cooperation which have been established under trade agreements. The Sri Lankan government representative is like Department of Commerce (DOC) responsible for co-ordination and conduct of the following Joint Commission/Committees held at Ministerial level. The bilateral agreements Sri Lanka has opened to the door signed agreement with Bangladesh, China, Egypt, Iran, Iraq, Maldives, Pakistan, Romania, Thailand, and India. However, the Indo-Lanka bilateral agreement and Pakistan-Lanka bilateral agreement are very effective and influence with line of intra-regional trade activities among the partner countries. The first was signed with India in December 1998 and implemented in March 2000.The second agreement was signed with Pakistan and came onto effect in June 2005.These three nations

123
are main and SAARC. Even as both free trade agreements have provided Sri Lanka with important market access to its main trading partners in the region, the reason that is three member countries of SAARC have entered into bilateral trade agreements and highlight the significance of SAFTA. Twenty seven years have been completed since the commencement of the SAARC, seven years have passed since the beginning of the Pakistan-Sri Lanka Free Trade Agreement (PSFTA), and six years have been completed since the start of the South Asian Free Trade Area (SAFTA) and it is now possible to have a better idea of the insinuations of all agreements. Meanwhile, total values show the strong benefits for Sri Lanka in terms of export growth and reduce of negative imbalances of net trade as well. However, it is pointed out that a few of the studies carried out by the experts and researchers show that the actual picture is less encouraging (Deshal de Mel, 2008). He further pointed out that the PSFTA has had limited impacts on trade. Thus so far and the efficacy of the agreement and lessons for other countries can be considered on this point of view. II. Significance of the study Today it has become necessary to evaluate the importance and the magnitude of the changes brought about in the Sri Lankan economy by the trade-creation of regional trade and to make the developing countries know of the usefulness in advantages of the
international trade to the 3rd world countries and compared the benefits.
Trade- creation trade-expansion and trade-diversion resulted by the regional trade have considerably changed the size and quantity of Sri Lankan economy in international trade as well as bilateral trade. Consequently these changes have influenced the Sri Lankan economic growth necessary for economic development, energy development and social development. From point of view this research becomes necessary, because economics and politics are interlinked. III. Research Problem As the international trade has become prominent in the activities of trade liberalization it has opened the windows of arrangement as it became inevitable for all countries to prosper. Almost all countries have engaged themselves in international trade with one face and with other face in intra-regional trade as well as bilateral.
In this context, despite several international crisis and issues, Sri Lanka also has opened her economy with the objective of building up its economy with the system of regional integration, mutual co-operation and expanding market activities with the goods and services in order to commercialize the country for the poor and rich community to live with social and ethnic cohesion. However, Sri Lanka has not gained net trade benefits after the trade liberalization except 1978. Of the problems faced by Sri Lanka from the

124
point of such trade liberalization most important question posted is as to how long these free trade is going to last.
Based on the above main research question, this study seeks to find out the answer for the two research questions regarding Sri Lanka’s current bilateral trade with Pakistan. First, whether within the approach of bilateralism which takes at given level of trade barriers or negative list between two countries are the good or bad for Sri Lanka? Second, whether after taking into account the possible effects of trade agreement the trend is good or bad for Sri Lanka? To access these two questions three objectives and four hypotheses framed. IV. Objectives of the research In this context, this paper would examine the structure of bilateral agreement and evaluate that agreement impact on trade between Sri Lanka and Pakistan and postmortem of progress of the SAARC and SAFTA. It also attempts to make a formal analysis of research questions by using a regression model of bilateral trade to examine whether Sri Lanka’s bilateral trade is lower or higher than what is predicted by the economic model. On this background this research has three objectives aiming to find out mainly the trade relationship of Sri Lanka with Pakistan after the trade agreement and the achievement of net trade advantages by Sri Lanka.
The following are the specific objectives of the study after having observed the
benefits of SAARC, SAPTA/SAFTA, and PSFTA.
1. To identify the changes taken place
with the result of Sri Lanka trade relationship with Pakistan since the inception of trade liberalization to 2010.
2. To analyse the outcome of the trade-expansion based on the implementation of trade agreement.
3. To compare the over role performance of SAARC with SAPTA/SAFTA after the liberalization.
V. Hypotheses The following hypotheses have been framed as test-parameters to assess and analysis the benefits derived through the Sri Lankan bilateral trade with Pakistan after the trade liberalization.
1. If the GDP is bigger; there will be
more opportunity for more trade between the two countries; so it is expected a positive sign for the coefficient of GDP.
2. Per capita GDP provides a good proxy for the level of development and infrastructures essential to conduct trade. So it is expected a positive sign for the coefficient of PCGDP variable.
3. TR/GDP variable indicates the level of openness and dependency ratio of the country. The more open the country is the more would be the trade activities. So it is expected a positive sign for this variable.

125
4. Bilateral trade agreement has created trade expansion and reduced trade deficit in Sri Lanka.
VI. Scope of the study The evolution of the existing trade pattern and trade system will provide a valuable insight, which will greatly facilitate trade and economic development in Sri Lanka. This investigation will help planners and policy makers to understand the system clearly in a better way and to utilize the different possible and profitable of international trade and market more efficiently for successful practices and profits. This study mainly focuses on the intraregional trade and bilateral trade pattern in Sri Lanka which is founded on the idealism of trade liberalization after 1977 and investigates the level of trade creation and horizon of the trade expansion of Sri Lankan’ foreign trade and factors required policy wise attention to improve the trade extension and quality. This investigation based on quantitative research carried out in the area of SAARC and SAFTA which has narrowed down the scope of the broader of concepts of liberalization and regionalization in the Indian Ocean. VII. Study Design and Methods In order to estimate of the study methodology is handled under the following sub section and gravity analysis model is applied with variables such as GDP, Per capita GDP, Openness
ratio/ trade dependency ratio, bilateral dependency ratio, and Exchange rate. Sampling design
The research results were obtained through Minitab software using gravity model. The gravity model research is a pioneer research carried out on Bangladesh, by Rahman (2003). He has analysed the bilateral trade of the Bangladesh’s trade with its major trading partners and also, Hirantha (2003) has used gravity model for his research on intra-regional trade of SAARC countries. They have explained the trade-diversion and trade-creation effect by their researches.
Our research model has based on gravity
model as follows;
Log (Xijt) = 0+1 log (PCGDP it * PCGDP jt) + 2 log (Xit/GDP it) +3log (Xijt/GDP jt) + 4 log (ER ijt ) + u ijt
Where: Xijt = Total trade (US $ in millions) between Sri LankaandPakistanat t time,so-called ‘bilateral trade’. PCGDPit (PCGDPjt) = per capita GDP (US $ in Current Market Price) of Sri Lankaand Pakistanat t time. Xit/GDPit =Trade-GDP ratio (US $ in millions) of Sri Lankaat t time. So-called ‘openness ratio’ as well as ‘trade dependency ratio’ Xijt/GDPjt = Trade-GDP ratio (US $ in millions) of Sri Lanka and Pakistanat t time. So- called ‘bilateral-trade to GDP ratio’ as well as ‘bilateral dependency ratio’ ERijt = Nominal Exchange Rate of Sri Lankaand Pakistanat t U ij is error term. 0,1, 2, 3, 4 = parameters; t = time period.

126
VIII. Literature Review Many studies have been attempted to find out the economic integration such as SAARC, SAFTA and Free Trade Agreements. The survey of literature aims to establish certain significant winding up regarding the free trade and bilateral trade. There is a huge amount of literature survey on the subject of trade or international trade and a few significant works have been built-in the current study. This study is an attempt to bring out some empirical works on intra-regional trade among the member countries. Especially, it has tried to estimate Sri Lanka’s trade relationship with her partner nations which are members of SAARC and SAFTA.
Mehta and Kumar (2004) argued that starting of SAFTA was a land mark in the evolution of SAARC which was formed in 1995. SAARC would benefit if its cooperation would expand beyond formal trade. That means SAARC should convert from political regionalism into intra-regional trade bloc. Rahman (2003) gave evidence on their gravity model, elimination of trade barriers and structural rigidities originating from adverse political relationship could lead to substantial increase in intra-SAARC trade.
Hassan, Mehanna and Basher (2001) have done their researches using gravity model. They declare through the arrangement of regional trades among the SAARC members neither the trade-creation nor the trade-diversion effects has occurred in the SAARC countries. They found that liberalization of trade in
SAARC countries offers significant benefits for all the countries in the region. The results show that the variables of GDP, GDP Per capita and distance to be highly significant at the 1% level but BORDER not similar.
Hirantha (2003) has done a gravity base model analysis regarding to SAPTA and SAFTA. He used the gravity model analysis to examine the progress of SAPTA using panel data cross sectional data for the period of 1996-2002. His gravity model results explained that there is a significant trade creation effects under SAPTA and finds no facts of trade diversion effect with the respect of the world. Suresh Moktan (2008) employed the gravity equation to examine of intra-regional trade exports and trade-creation and trade-diversion effects of trade agreements in SAARC nations. His investigation of gravity model has included a pooled panel data for the period of 1980-2005. The regressions are designed to evaluate economic effects as follows, pre-SAARC/pre-SAPTA and post-SAARC /post-SAPTA. According to the study, the sign of the coefficients for the member countries’ GDPs, Populations, Distance, Common border, Common currency, Island and Port are as expected, and are statically significant. The impact of Devaluation of Real Exchange is found to be positive, however largely insignificant. And the variable of landlocked has a significant positive impact to the intra-trade.
IX. Pakistan-Sri Lanka Free trade
127
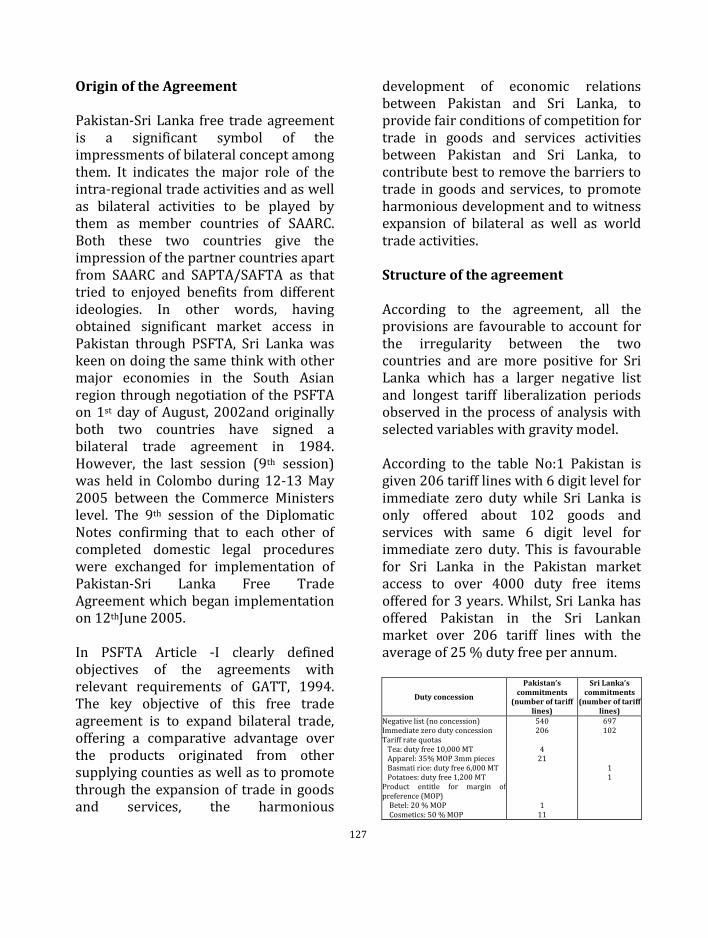
Origin of the Agreement Pakistan-Sri Lanka free trade agreement is a significant symbol of the impressments of bilateral concept among them. It indicates the major role of the intra-regional trade activities and as well as bilateral activities to be played by them as member countries of SAARC. Both these two countries give the impression of the partner countries apart from SAARC and SAPTA/SAFTA as that tried to enjoyed benefits from different ideologies. In other words, having obtained significant market access in Pakistan through PSFTA, Sri Lanka was keen on doing the same think with other major economies in the South Asian region through negotiation of the PSFTA on 1st day of August, 2002and originally both two countries have signed a bilateral trade agreement in 1984. However, the last session (9th session) was held in Colombo during 12-13 May 2005 between the Commerce Ministers level. The 9th session of the Diplomatic Notes confirming that to each other of completed domestic legal procedures were exchanged for implementation of Pakistan-Sri Lanka Free Trade Agreement which began implementation on 12thJune 2005. In PSFTA Article -I clearly defined objectives of the agreements with relevant requirements of GATT, 1994. The key objective of this free trade agreement is to expand bilateral trade, offering a comparative advantage over the products originated from other supplying counties as well as to promote through the expansion of trade in goods and services, the harmonious
development of economic relations between Pakistan and Sri Lanka, to provide fair conditions of competition for trade in goods and services activities between Pakistan and Sri Lanka, to contribute best to remove the barriers to trade in goods and services, to promote harmonious development and to witness expansion of bilateral as well as world trade activities. Structure of the agreement According to the agreement, all the provisions are favourable to account for the irregularity between the two countries and are more positive for Sri Lanka which has a larger negative list and longest tariff liberalization periods observed in the process of analysis with selected variables with gravity model. According to the table No:1 Pakistan is given 206 tariff lines with 6 digit level for immediate zero duty while Sri Lanka is only offered about 102 goods and services with same 6 digit level for immediate zero duty. This is favourable for Sri Lanka in the Pakistan market access to over 4000 duty free items offered for 3 years. Whilst, Sri Lanka has offered Pakistan in the Sri Lankan market over 206 tariff lines with the average of 25 % duty free per annum.
Duty concession
Pakistan’s commitments
(number of tariff lines)
Sri Lanka’s commitments
(number of tariff lines)
Negative list (no concession) Immediate zero duty concession Tariff rate quotas Tea: duty free 10,000 MT Apparel: 35% MOP 3mm pieces Basmati rice: duty free 6,000 MT Potatoes: duty free 1,200 MT Product entitle for margin of preference (MOP) Betel: 20 % MOP Cosmetics: 50 % MOP
540 206
4
21
1 11
697 102
1 1

128
Tariff Liberalization Programme 34 %,67 %,100 % reduction over 3
years (ended in June 2008)
20 %, 30 %,40 %, 60 %, 80 % 100 % reduction over 5 years (ended in
2010)
Source: Deshal de Mel (2008)
Table No: 1 Duty concessions of PSFTA
The negative lists have indicated that facts that same goods and services were produced and exported by both countries. The Table no: 1 clearly shows that total number (1237) of items are listed by the contracting parties with lines of negative list which never finished without duty free or non-barriers into the both country’s markets. The negative items listed by Pakistan are such as tea, textiles and garment items, rubber products, paper products dairy products, plastic products, footwear, and ceramics items. In case of Sri Lanka it has listed as a negative list of items such as agricultural products, rubber products, paper products, footwear, ceramic items, metals products, motor vehicles, and parts for revenue purposes. It seems to be same and favourable for Sri Lanka 56 % and balance 44 % for Pakistan. The Table no: 1 explained that duty concessions of tariff quotas are also favourable to Sri Lanka. For example, Sri Lanka can export 10,000 MT of tea to Pakistan annually without restrictions. Otherwise the exit of export over 10,000 MT will be faced by the Most Favourable Nation’s (MFN) tariff rate. The Table-1 further explained that Betel leaves could be exported by Sri Lanka under a margin of preference (MOP) of 20 %. Before it is revised it could be exported by Sri Lanka under a tariff rate quota of 1200 MT betel annually. According to the garment items, 3 million pieces of garment were
exported from Sri Lanka within 21tariff ranks providing a 35% MOP, only for maximum of 200,000 pieces per tariff line (see also Deshal de Mel 2008: 12). At the same time, Pakistan has provided five lines of ceramic items under MOP to Sri Lanka as 20 % of the MFN applied rates. Sri Lanka will export to Pakistan betel leaves under a MOP of 20 % of the MFN applied rate. And eleven tariff lines of herbal cosmetic items exported by Sri Lanka will receive a 50 % MOP on the applied MFN rate deserving the expression of gratitude. Whilst, Sri Lanka provided tariff rate quota to Pakistan for Basmati rice (6,000 MT) will get zero tariff per year. While, in case of potatoes, 1,000 MT of potatoes can be exported to Sri Lanka without duty. But these system of export should be followed by the schedules like 2/3rd potatoes between June-July and balance 1/3rd October-November of every year (see also Deshal de Mel 2008: 13). Economic relationship between Pakistan and Sri Lanka The study of intra-regional trade indicates that every contracting party gets benefits equally. Meanwhile, any two countries tried to make joint efforts towards the line of intra-regional trade or bilateral activities with the hope to gets mutual benefit. Before the bilateral agreement is brought into practice one country has been experiencing deficit or negative balance of payment even that trade deficit for long. Reason for that is that those two countries will join and try to share benefits among them through integration or mutual agreement. Under

129
this situation, it is examined that Sri Lanka’s trade relationship with Pakistan will never touch in favour of Sri Lanka even for single year after 1985. The Appendix No: 1 clearly shows that the balance of trade was zero only in 1997.
Values in US $ Million
Ye
ar
Ex
po
rts
(fro
m S
ri
La
nk
a)
Av
e. g
row
th r
ate
%
Imp
ort
s (f
rom
P
ak
ista
n)
Av
e. g
row
th r
ate
%
Ba
lan
ce o
f T
rad
e
(BO
T)
Sri
La
nk
a’s
To
tal
Tra
de
% o
f b
ila
tera
l in
Sri
L
an
ka
’s t
ota
l tr
ad
e
1980 34.2 7.42* 29.9 11.99* 4.3 3067.8 2.09
1990 32 -2.07* 51 14.46* -19 4530 1.83 2000 29.7 7.58* 72.17 9.34* -42.47 12146.8 0.84
2006 58 33.18 147 27.13 -89 17135.7 1.19
2007 55 -5.17 178 21.09 -123 18936.5 1.07
2008 71 29.09 192 7.87 -121 22201.8 1.19
2009 55 -22.54 197 2.60 -142 17291.1 1.46 2010 60 9.1 282 43.15 -222 21818.7 1.57
Sources: IMF (1987-2003), ‘Direction of Trade Statistics Year Book’. Central Bank of Sri Lanka (2006-2010), ‘Annual Report’.* 1980s, 1990s and
2000s
Table No: 2 Sri Lanka- Pakistan bilateral trades (1980-
2010)
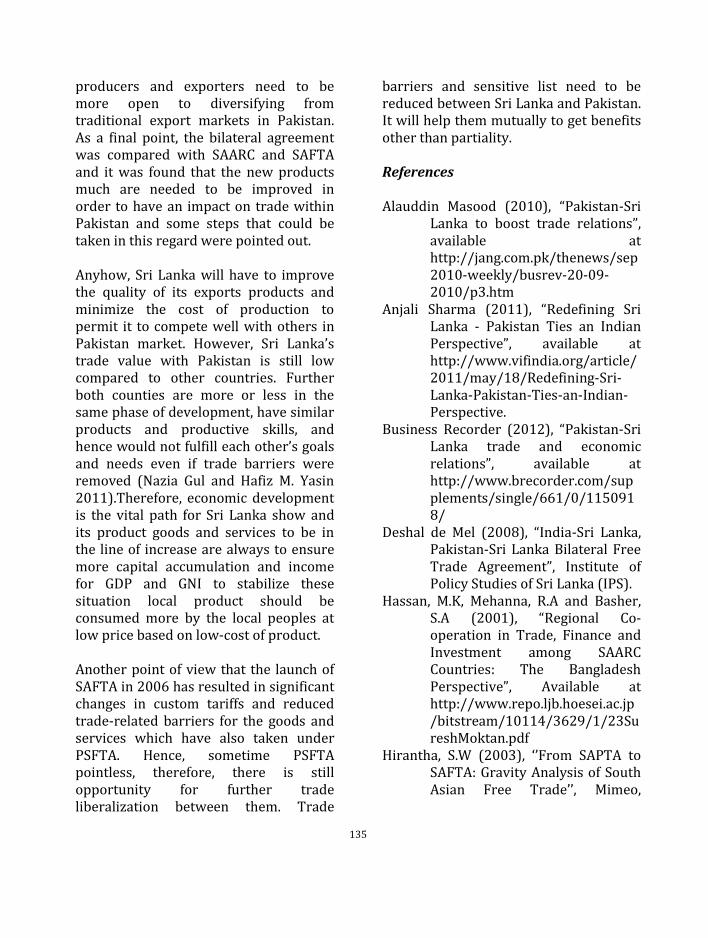
Based on table no: 2
Graph No: 1 Sri Lanka- Pakistan bilateral trade (1980-
2010)
Based on table no: 2
Graph No: 2 Sri Lanka- Pakistan bilateral trade Growth
rate (1980-2010)
The period of study (1980-2010) has explicated that the bilateral trade was relatively more positive to Pakistan other than to Sri Lanka. The above table and graphs express clearly bilateral trade was how much favourable to Pakistan. First decade of 1980shas indicated the positive trade balance to Sri Lanka but in case of other three decades (1990s-2010s) it shows that the balance of trade was favourable only to Pakistan. The situation of average exports of Sri Lanka to Pakistan was 38.23 $ M in 1980s (1980-1989), 30.8 $ M in 1990s (1990-1999), 44.2 $ M in 2000s (2000-2009), and 47.24 $ M in 2010. However, in the case of average growth rate of exports it was favourable to Sri Lanka for the first decade of 1980s and in the meanwhile it did not support the situation in 1990s. For example, the table no: 2 shows that the average growth rate was 7.42percent in 1980s and -2.07percent in 1990s. But after that it had to change in 2000s as 7.58 percent and it has further changed by 33.2 percent, -5.2 percent, 29.1percent, -22.54 percent and 9.1 percent per year from 2006 to 2010.Hence, the change of average exports was as 8.73 percent annually. Another justification is that Sri Lanka’s

130
average exports of total trade of Sri Lanka have only 0.65 percent annually since 1980 to 2010 to Pakistan. This is the evidences of the mixed impact of bilateral agreement in case of Sri Lanka.
According to the table no:2 Sri Lanka’s imports never have positive attitudes to the country. For example, the position of average imports of Sri Lanka from Pakistan have been 34.35 $ M in 1980s (1980-1989), 65.234 $ M in 1990s (1990-1999), 122 $ M in 2000s (2000-2009), and 282 $ M in 2010. The average growth rate of imports has been favourable to Pakistan for all decades of 1980s, 1990s and 2000s. For example, the average growth rate of imports was 34.35 percent in 1980s 65.234 percent in 1990s and 122 percent in 2000s and it has further changed to27.13 percent, 21.1 percent, 7.87percent, 2.6 percent and 43.15 percent per year from 2006 to 2010. Hence, the change in average rate of imports has as 20.4 percent annually. Another way to express it is that Sri Lanka’s average import in total trade was 0.9 percent annually since 1980 to 2010 from Pakistan. Further, average bilateral trade of Sri Lanka’s was 1.56 percent annually in total trade of Sri Lanka since 1980 to 2010. It has proved that the positive impact of bilateral agreement was on Pakistan rather than on Sri Lanka. X. Results of gravity model Economic impact by trade-liberalization
In the Table No: 3 Sri Lanka-Pakistan bilateral trade activities are explained
with the analytical indicators of variables through per capita income, gross domestic product (GDP), trade to GDP ratios or openness intra-trade to GDP ratios and exchange rate for the periods of 1980-2010 (P=0.01). Hence, per capita income and intra-regional trade are meaningful influences into the bilateral trade but openness ratio in the GDP and Exchange rate negatively influence into the bilateral trade. Clearly explained that the table no: 3, when per capita income of both counties increased by 1 US $ the bilateral trade had been increased by 0.036303 M US $. However, the trade ratio of the GDP is changed by 1 unit the Sri Lanka’s bilateral trade with Pakistan it is declined by 5577 US $.It means that, there is no trade expansion among them if Sri Lanka removed the trade barriers partiality. Besides, the reason of 1 unit of changed in the intra-regional trade ratio in the GDP the bilateral trade between Sri Lanka and Pakistan has increased by 9976 US $. Therefore, both countries have necessarily removed barriers simultaneously. That is a good example for mutual free trade of these two countries that has led to trade-expansion among the partner countries. However, the exchange rate has negatively impacted on Sri Lanka’s bilateral trade. This is other evidence that Sri Lanka’s partiality devaluation of currency did not support the trade-expansion. Regression result shows that the exchange rate depreciation was by 1 percent the bilateral trade was decreased by 1730 US $. Economic impact by SAARC

131
Other necessary test was to see whether the SAARC could be able to change Sri Lanka’s bilateral trade activities with Pakistan after the formation of SAARC. According to the Table No: 3 Sri Lanka-Pakistan bilateral trade is explained through per capita income, gross domestic product (GDP), trade to GDP ratios or openness intra-trade to GDP ratios, and exchange rate for the periods of 1985-2010 (P=0.01). Hence, per capita income, openness ratio in the GDP and intra-regional trade are meaningful influences on the bilateral trade at 1 percentage of confidence level but Exchange rate is negatively influencing on the bilateral trade. It is clearly explained that the table no: 3, when per capita income of both countries are increased by 1 US $ the bilateral trade are also increased by 0.035584 M US $. Relatively per capita income slightly less (-0.000719) influencing on bilateral activity of post-SAARC scenario. However, the trade ratio of the GDP is changed by 1 unit the Sri Lanka’s bilateral trade with Pakistan is increased by 1482 US $. It means that, there is trade -expansion that occurred among them if both countries removed the trade barriers mutually by 1 percent. Although, the reason for 1 unit of changed in the intra-regional trade ratio in the GDP the bilateral trade between Sri Lanka and Pakistan also has increased by 12439 US $. This evidence explained that intra-regional trade had been increased after the formation of SAARC by 2463 US $. Therefore, both countries have carefully removed barriers simultaneously under the regional trading bloc. However, the exchange rate has negatively impacted
on Sri Lanka’s bilateral trade. This is other evidence that Sri Lanka and Pakistan are competitive devaluation of their currency did not support the trade-expansion for both countries. Regression result shows that the exchange rate depreciation by 1 percent the bilateral trade is decreased by 4721 US $. Economic impact by SAPTA/SAFTA Further necessary test done was that the free trade could be changed Sri Lanka’s bilateral trade activities with Pakistan after the formation of South Asian Preferential Trade Agreement or establishment of South Asian Free Trade Area. According to the Table No: 3 Sri Lanka-Pakistan bilateral trade is explained through the selected variables namely per capita income, gross domestic product (GDP), trade to GDP ratios or openness intra-trade to GDP ratios, and exchange rate for the periods of 1995-2010 (P=0.01). Hence, per capita income, openness ratio in the GDP and intra-regional trade are found having meaningful influences in the bilateral trade at 1 percentage of confidence level but exchange rate is negatively found having influences in the bilateral trade. It shows that clearly explained in the table no: 3, when per capita incomes of both countries are increased by 1 US $ the bilateral trade is increased by 36597 US $. Relatively per capita income has highly (36596.96442) influenced the bilateral activity of post-SAPTA/SAFTA scenario. Meanwhile, the trade ratio of the GDP was changed by 1 unit the Sri Lanka’s bilateral trade with Pakistan was increased by 6271 US $. It means that, there is a trade-expansion occurred

132
among them if both countries removed furthermore trade and non-trade barriers mutually by 1 percent. Although, the reason for 1 unit of changed in the intra-regional trade ratio in the GDP the bilateral trade between Sri Lanka and Pakistan has increased by 15620 US $. This evidence explained that intra-regional trade had been increased after the formation of SAPTA/SAFTA by 3181 US $. Therefore, both countries have carefully removed all unnecessary barriers simultaneously under the regional trading bloc. However, the exchange rate negatively is impacted on Sri Lanka’s bilateral trade. This is other evidence that Sri Lanka and Pakistan are observed in competitive devaluation of their currency not supported to promote trade-expansion for both countries. Regression result shows that when the exchange rate is declined by 1 percent then the bilateral trade has been decrease by 62161 US $. Economic impact by the PSFTA The PSFTA which came into effect in June 13, 2005 is found satisfactory with the increasing in the volume of bilateral trade between two countries. Further, there is massive untapped potential in this area and with collective effort the trade volume could go over US $ 1 billion. An institutional infrastructure in shape of the Free Trade Agreement (FTA) on goods, bilateral investment, and mutual of understanding on customs could be benefited after the negotiation and finishing services and investment chapters of the FTA.
Pakistani agricultural products provide a cheaper and higher quality alternative to Sri Lankan imports from such countries as Australia and even South and Latin America. This in no way would struggle with local farm products and add to the diversity to the advantage of consumers of the country. In this line, Sri Lanka and Pakistan benefit from a strong and long standing bilateral multi-faceted relationship including economic co-operation. Further, there is unused, vast potential for enhancing trade for both countries to explore using the tariff concession available under the FTA. Despite the concessions available under PSFTA, Sri Lanka’s exports to Pakistan accounted for less than 1 (0.65 % of total trade) percent of total exports of the country. The Export Development Board (EDB) of Sri Lanka has taken efforts to promote value added products such as packet tea, confectionery products, herbal healthcare products, ayurveda products, wood based modular furniture, rubber products, gems and jewelry, porcelain tableware, paint and varnishes, pre-fabricated steel products, electrical wiring accessories, LV panel boards, MCBs, switch boards and power panels, spiral duct work and accessories, and etc to the Pakistan market through this agreement.
Pakistan is the second largest trading partner of Sri Lanka in the SAARC/SAFTA region. According to the Central Bank Annual Report- 2010, it was found that Pakistan was the 26th export intention for Sri Lanka in 2010 accounting for nearly 0.7 percent of total

133
exports in value terms while it has been the 10th largest import origin contributing to over 2 percent of total imports in Sri Lanka in 2010. Trade between the two countries had grown during the recent past except 2009. According to the Sri Lanka’s Central Bank Repot (2011) and http://elibrang.data.imf.org/ data, the value of total trade between Pakistan and Sri Lanka which stood at US $ 160 million in 2005, and has increased up to US $ 406 million in 2011 recording a 15 percent average growth during this period. On other hand, average increasein bilateral trade among them is about US $ 35.2 per year after 2005. Influence factors on Sri Lanka -Pakistan Bilateral Trade:
A comparisonwith SAARC, SAFTA and SFTA
Estimated
Table No: 3 Regression Results (1980-2010)
Sri Lanka has exported mainly the basic goods including sheet rubber, betel leaves, other natural rubber, coconut fresh nuts, desiccated coconut, crepe rubber, pepper, woven fabrics, lentils and tea in mass to Pakistan market. The average exports of Sri Lanka was US $ 59.3 million annually after PSFTA while average imports of Sri Lanka was US $ 206.4 million annually. The total impact of PSFTA accounted as an average rate of exports has a record of 9 percent per year but average rate of imports was 17 percent annually. Therefore, Sri Lanka still waits for good opportunity to enter into the Pakistan market. Additional test shows that the free trade system could be able to change Sri Lanka’s bilateral trade activities with Pakistan after Pakistan-Sri Lanka Free Trade Agreement. According to the Table No: 3 Sri Lanka-Pakistan bilateral trade could be explained with the aids of variables through per capita income, gross domestic product (GDP), trade to GDP ratios or openness intra-trade to GDP ratios, and exchange rate for the periods of 2005-2010 (P=0.01). Hence, per capita income and intra-regional trade are showing meaningful influences in the bilateral trade at 1 percentage of confidence level but openness ratio in the GDP and exchange rate is negatively influencing the bilateral trade. The table no: 3 clearly explains that, when the per capita income of both countries increased by 1 US $ the bilateral trade could be increased by 0.57010 M US $. Relatively per capita income highly (20413 US $) influences the bilateral activity of post-PSFTA scenario.

134
However, the bilateral trade ratio of the GDP is changed by 1 unit the Sri Lanka’s bilateral trade with Pakistan is declined by 0.05280M US $. It means that, there is no trade-expansion occurred among them if both countries have added more goods and services in the negative list. Although, the reason for 1 unit of change in the intra-regional trade ratio in the GDP the bilateral trade between Sri Lanka and Pakistan has increased by 1.04533 M US $. This figure explained that intra-regional trade has increased after the free trade agreement by 88913 US $. Therefore, both countries carefully have reduced their negative list simultaneously under the trade negotiation. It would more useful to both countries and Sri Lanka particularly. However, the exchange rate has negatively impacted on Sri Lanka’s bilateral trade. This is other evidence that Sri Lanka and Pakistan are competitive devaluation of their currency did not support to trade-expansion for both countries. Regression result shows that the exchange rate decline by 1 percent the bilateral trade also decreases by 0.2768 US $. XI. Discussion and conclusions
In this paper, the bilateral trade agreement that Sri Lanka has entered with Pakistan, is analysed as to the structure of the respective agreement and the trade impact of this. It was found that whilst the agreement has provided significant market entrance to Sri Lanka full advantage has not been taken to this market right to utilize due to certain reasons. However, Sri Lanka enjoys duty free market access on 206 products in
the Pakistani market, while Pakistan, gained duty free access on 102 products in the Sri Lankan market. The aim of a free trade agreement is to reduce barriers, to facilitate exchange so that trade can grow as a result of specialization, division of labor, and most importantly via comparative advantage (Masood 2010).
Sri Lanka's main exports to Pakistan include natural rubber, copra, tea, coconut, spices, betel leaves. A range of new products have also been penetrated into the Pakistan market after the implementation of the PSFTA, including fresh pineapple, sports goods, tamarind with seeds, edible oil, porcelain tableware & kitchenware, ceramic tiles, furniture, electrical switches and sockets, herbal cosmetic products and plastic articles, paints, glass paintings, leather products, frozen fish, prawns, lobsters, crabs, cut flowers and foliage, gems & Jewelers and aquarium fish. Pakistan has implemented its final phasing out commitment in March 2009 and Sri Lanka has now duty free market access for more than 4500 products. Sri Lanka has also completed its 4th phasing without commitment.
Furthermore, regression result has shown that trade -expansion has occurred significantly for both countries but Sri Lanka’s trade deficits were found highly with Pakistan. The negative list has shown big restrictions for Sri Lanka and has remained certain barriers to trade despite the existence of the free trade agreements and these barriers are indicated this paper. In addition to this, it was pointed out that Sri Lankan
135
producers and exporters need to be more open to diversifying from traditional export markets in Pakistan. As a final point, the bilateral agreement was compared with SAARC and SAFTA and it was found that the new products much are needed to be improved in order to have an impact on trade within Pakistan and some steps that could be taken in this regard were pointed out.
Anyhow, Sri Lanka will have to improve the quality of its exports products and minimize the cost of production to permit it to compete well with others in Pakistan market. However, Sri Lanka’s trade value with Pakistan is still low compared to other countries. Further both counties are more or less in the same phase of development, have similar products and productive skills, and hence would not fulfill each other’s goals and needs even if trade barriers were removed (Nazia Gul and Hafiz M. Yasin 2011).Therefore, economic development is the vital path for Sri Lanka show and its product goods and services to be in the line of increase are always to ensure more capital accumulation and income for GDP and GNI to stabilize these situation local product should be consumed more by the local peoples at low price based on low-cost of product.
Another point of view that the launch of SAFTA in 2006 has resulted in significant changes in custom tariffs and reduced trade-related barriers for the goods and services which have also taken under PSFTA. Hence, sometime PSFTA pointless, therefore, there is still opportunity for further trade liberalization between them. Trade
barriers and sensitive list need to be reduced between Sri Lanka and Pakistan. It will help them mutually to get benefits other than partiality. References Alauddin Masood (2010), “Pakistan-Sri
Lanka to boost trade relations”, available at http://jang.com.pk/thenews/sep2010-weekly/busrev-20-09-2010/p3.htm
Anjali Sharma (2011), “Redefining Sri Lanka - Pakistan Ties an Indian Perspective”, available at http://www.vifindia.org/article/2011/may/18/Redefining-Sri-Lanka-Pakistan-Ties-an-Indian-Perspective.
Business Recorder (2012), “Pakistan-Sri Lanka trade and economic relations”, available at http://www.brecorder.com/supplements/single/661/0/1150918/
Deshal de Mel (2008), “India-Sri Lanka, Pakistan-Sri Lanka Bilateral Free Trade Agreement”, Institute of Policy Studies of Sri Lanka (IPS).
Hassan, M.K, Mehanna, R.A and Basher, S.A (2001), “Regional Co-operation in Trade, Finance and Investment among SAARC Countries: The Bangladesh Perspective”, Available at http://www.repo.ljb.hoesei.ac.jp/bitstream/10114/3629/1/23SureshMoktan.pdf
Hirantha, S.W (2003), ‘’From SAPTA to SAFTA: Gravity Analysis of South Asian Free Trade’’, Mimeo,

136
Department of Economics, Japan, Nagoya University.
Mehta, S. P. and P. Kumar (2004), “RTAs and South Asia: Option in the Wake of Cancun Fiasco”, ASARC working paper, 2004-II, Canberra, the Australian National University.
Mudith Gamage (2012), “Pakistan and Sri Lanka signs Memorandum of Understanding for promotion of bilateral trade” available at http://www.asiantribune.com/news/2012/05/01/pakistan-and-sri-lanka-signs-memorandum-understanding-promotion-bilateral-trade.
Nazia Gul and Hafiz M. Yasin (2011), “The Trade Potential of Pakistan: An Application of the Gravity Model”, ‘The Lahore Journal of Economics’, Volume: 16, 1 (Summer 2011).
Rahman, M.M. (2003), “A Panel Data Analysis of Bangladesh’s Trade: The Gravity Model Approach”, Available at http://www.etsg.org/ET
Suresh Moktan and Miriyagalla (2008), “Assessing the economic effects and welfare implications of SAFTA and SAFTA+5: the South Asian experience”, Japan, GSID, Nagoya University.
Internet-based Sources http://en.wikipedia.org/wiki/Pakistan%
E2%80%93Sri_Lanka_relations http://www.doc.gov.lk/web/index.php?
option=com_content&view=article&id=62&Itemid=75&lang=ta
http://www.doc.gov.lk/web/index.php?option=com_content&view=article&id=51&Itemid=77&lang=en
http://www.ft.lk/2012/01/28/pakistani-fruit-and-veggie-industry-in-sri-lanka-to-enhance-bilateral-trade/
http://www.nation.com.pk/pakistan-news-newspaper-daily-english-online/business/02-May-2012/rcci-ccc-sign-mou-for-bilateral-trade
http://www.onlinenews.com.pk/details.php?id=192065
http://www.srilankaembassy.fr/index.php?option=com_content&view=article&id=1342%3Arcci-and-lankas-ccc-signs-mou-on-bilateral-trade&catid-Aheadlines&lang=en
http://www.wto.org/english/tratop_e/tpr_e/g128_e.doc
Appendix: I
Values in US $ Million Year Exports
(from Sri Lanka)
Imports (from
Pakistan)
Balance of Trade
(BOT)
Sri Lanka’s Total Trade
% of bilateral
in Sri Lanka’s
total trade
1980 34.2 29.9 4.3 3067.8 2.09
1981 55.5 17.8 37.7 2929.5 2.50
1982 38.2 17.6 20.6 2769.4 2.01
1983 29.7 13.5 16.2 2848.6 1.52
1984 34.2 17.1 17.1 3281.2 1.56 1985 27.3 33.8 -6.5 3096.7 1.97
1986 33.8 46.1 -12.3 2992.1 2.67
1987 31.4 46.7 -15.3 3390.7 2.30
1988 53 70 -17 3740 3.29 1989 45 51 -6 3627 2.65
1990 32 51 -19 4530 1.83
1991 32 74 -42 5048 2.10
1992 29 67 -38 5961 1.61
1993 35 55 -20 6864 1.31 1994 43 61 -18 7431 1.40
1995 43 52 -9 8282 1.15
1996 37 69 -32 8829 1.20
1997 38 38 0 9911 0.77
1998 26.94 90.63 -63.69 11083.3 1.06 1999 30.82 94.71 -63.89 10877 1.15
2000 29.7 72.17 -42.47 12146.8 0.84
2001 24.87 73.82 -48.95 10453.2 0.94
2002 28.84 65.69 -36.85 10702.7 0.88 2003 36.73 70.98 -34.25 11805.2 0.91
2004 39.45 107.92 -68.47 13757 1.07

137
2005 43.55 115.63 -72.08 15209.9 1.05 2006 58 147 -89 17135.7 1.19
2007 55 178 -123 18936.5 1.07
2008 71 192 -121 22201.8 1.19
2009 55 197 -142 17291.1 1.46
2010 60 282 -222 21818.7 1.57
Sources: IMF (1987-2003), ‘Direction of Trade Statistics Year Book’.
Central Bank of Sri Lanka (2006-2010), ‘Annual Report’. And http://elibrang.data.imf.org/
Table : Sri Lanka- Pakistan Bilateral Trades (1980-2010)