Embed Size (px)
Citation preview
Palm Valley 13
Well Completion Report (Basic) – Revision 3
21 August 2018 – 13 October 2018
OL3
Amadeus Basin
Northern Territory
Submission Date
21 May 2019
Central Petroleum Limited | Palm Valley 13 Page 2 | 22
CONTENTS
LIST OF ABBREVIATIONS ........................................................................................ 4
1 INTRODUCTION AND SUMMARY ...................................................................... 5
1.1 GENERAL DATA .................................................................................................. 9
2 DRILLING .......................................................................................................... 10
2.1 EQUIPMENT INSTALLED ON THE WELL HEAD ............................................... 10
2.2 CASING DETAILS .............................................................................................. 10
2.3 PALM VALLEY 13 TIME DEPTH CURVE ........................................................... 11
2.4 DEVIATION SURVEYS ....................................................................................... 12
2.5 CEMENTING OPERATIONS .............................................................................. 12
2.6 BIT RECORD ...................................................................................................... 16
2.7 DRILLING FLUIDS .............................................................................................. 17
3 FORMATION EVALUATION .............................................................................. 17
3.1 WELL EVALUATION LOGS ................................................................................ 17
3.2 CORES AND SAMPLE DETAILS ........................................................................ 18
3.3 PRODUCTION TEST DETAILS .......................................................................... 18
3.4 HYDROCARBON INDICATIORS ........................................................................ 19
4 GEOLOGY ......................................................................................................... 20
4.1 ALONG HOLE AND TRUE VERTICAL DEPTH OF SEISMIC MARKERS ........... 20
4.2 PRELIMINARY ASSESMENT OF RESERVOIR AND PROSPECTIVE HORIZONS ............................................................................................................................ 20
Central Petroleum Limited | Palm Valley 13 Page 3 | 22
List of Figures
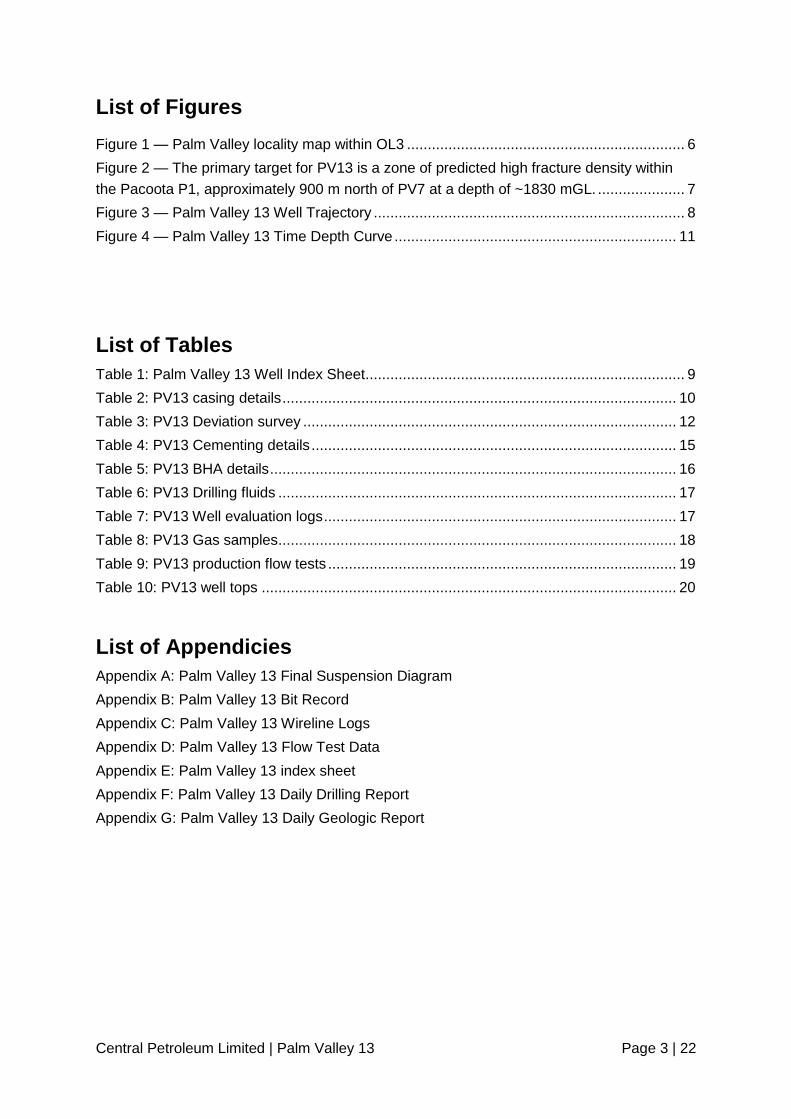
Figure 1 — Palm Valley locality map within OL3 ................................................................... 6
Figure 2 — The primary target for PV13 is a zone of predicted high fracture density within
the Pacoota P1, approximately 900 m north of PV7 at a depth of ~1830 mGL. ..................... 7
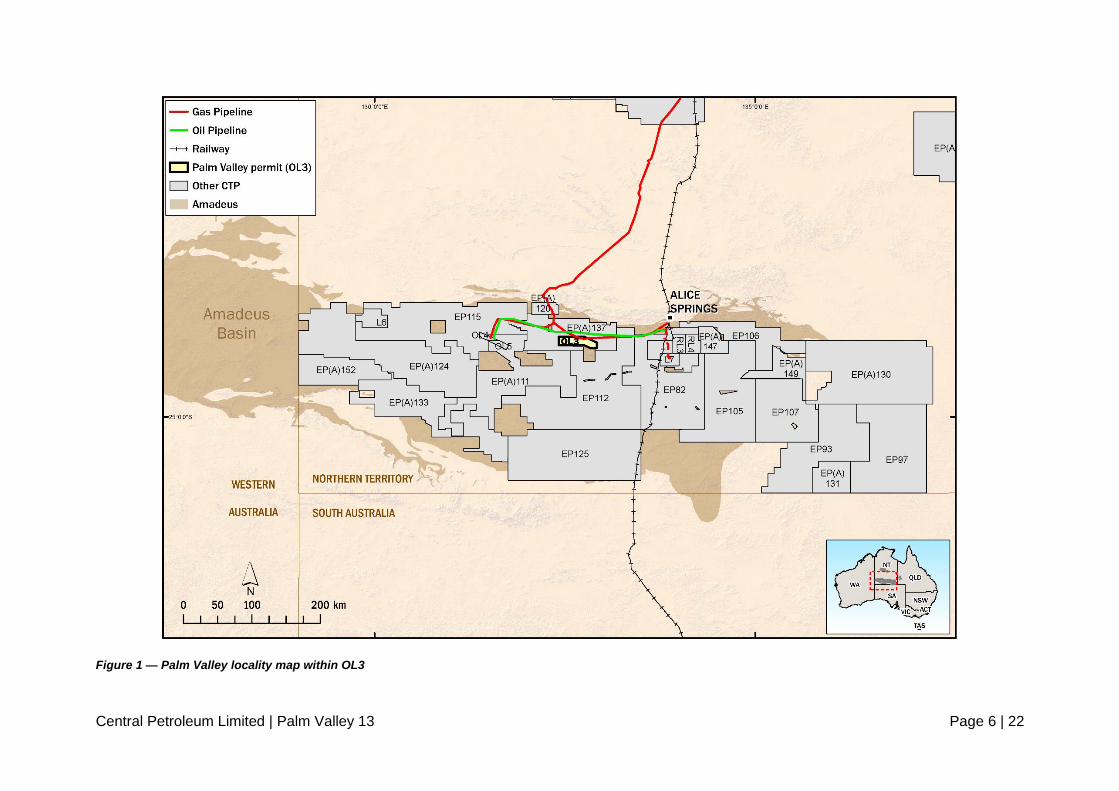
Figure 3 — Palm Valley 13 Well Trajectory ........................................................................... 8
Figure 4 — Palm Valley 13 Time Depth Curve .................................................................... 11
List of Tables
Table 1: Palm Valley 13 Well Index Sheet ............................................................................. 9
Table 2: PV13 casing details ............................................................................................... 10
Table 3: PV13 Deviation survey .......................................................................................... 12
Table 4: PV13 Cementing details ........................................................................................ 15
Table 5: PV13 BHA details .................................................................................................. 16
Table 6: PV13 Drilling fluids ................................................................................................ 17
Table 7: PV13 Well evaluation logs ..................................................................................... 17
Table 8: PV13 Gas samples ................................................................................................ 18
Table 9: PV13 production flow tests .................................................................................... 19
Table 10: PV13 well tops .................................................................................................... 20
List of Appendicies
Appendix A: Palm Valley 13 Final Suspension Diagram
Appendix B: Palm Valley 13 Bit Record
Appendix C: Palm Valley 13 Wireline Logs
Appendix D: Palm Valley 13 Flow Test Data
Appendix E: Palm Valley 13 index sheet
Appendix F: Palm Valley 13 Daily Drilling Report
Appendix G: Palm Valley 13 Daily Geologic Report

Central Petroleum Limited | Palm Valley 13 Page 4 | 22
LIST OF ABBREVIATIONS
Abbreviation Full Text Abbreviation Full Text
AHD Australian Height Datum MMscf/d Million standard cubic feet per day
API American Petroleum Institute mRT Metres Rotary Table
Az Azimuth mSS Metres Sub Sea
bbls/hr Barrels per hour mV Millivolts
bbls Barrels MWD Measurements while drilling
BTC Buttress connection m BRT Metres Below Rotary Table
CBL Cement Bond Log NPT Non-Productive Time
DP Drill Pipe NA Not Applicable
EMW Estimated Mud Weight OL Operating Lease
FIT Formation Integrity Test o Degrees
Fm Formation ppf Pounds per foot
ft3/sk Cubic feet per sack ppg Pounds per gallon
GOC Gas-Oil Contact psi Pounds per square inch
HKW Highest Known Water PV1 Palm Valley 1
Hrs Hours PV2 Palm Valley 2
In Inches PV6b Palm Valley 6b
Inc Inclination PV7 Palm Valley 7
KCL Potassium Chlorite PV13 Palm Valley 13
kg Kilogram QTY Quantity
km Kilometres Slts Siltstone
lb/ft Pounds per foot Sst Sandstone
LCM Loss control materials TD Total Depth
LS2 Lower Stairway 2 Sandstone TVD True Vertical Depth
m Metres TVT True Vertical Thickness
MD Measured Depth WBM Water Based Mud
mGL Metres ground level

Central Petroleum Limited | Palm Valley 13 Page 5 | 22
1 INTRODUCTION AND SUMMARY
The Palm Valley Gas Field is situated within the Amadeus Basin approximately 130 km
west-southwest of Alice Springs (Figure 1). It is a doubly plunging anticline with surface
expression of approximately 350m and an anticlinal structural axis that can be traced for
over 30 km. The discovery well, Palm Valley 1, was drilled in 1965, and since then 10
additional wells have been drilled. The gas field is classified as a Type 2 fractured reservoir,
meaning that a natural fracture network provides permeability both laterally and vertically to
a low porosity and low permeability rock matrix. The field produces dry gas with a highest
known water (HKW) of 1250 mSS.
The Palm Valley Field is currently on production with ~10MMscf/d production capacity from
high permeability natural fractures and very low permeability matrix of the Lower Stairway
and Pacoota Sandstones. The Palm Valley 13 (PV13) well targeted areas of high natural
fracture density within the Lower Stairway Sandstone, Horn Valley Siltstone and Pacoota
Sandstone. The well was drilled highly deviated to intersect the target horizons and as many
natural fractures as possible.
PV13 targeted an area of predicted high natural fracture density within the Pacoota
Sandstone and TD’d after encountering encouraging gas flows within the Pacoota
Sandstone to the northeast of PV13 (Figure 2 and Figure 3). Fractures at Palm Valley are
fold and fault related, and their orientation, distribution and intensity can be predicted using
the structural geometry of the fold and faults. The orientation of fold related fractures is
related to bedding orientation in that the fractures are predominantly oriented at a high angle
to bedding.
PV13 was spudded on August 21st, 2018 and was completed with tubing and packer and
awaiting tie in to the Palm Valley facilities on October 18th, 2018 after intersecting gas flows
of 12MMscf/d within the Pacoota P1 Sandstone.
Central Petroleum Limited | Palm Valley 13 Page 6 | 22
Figure 1 — Palm Valley locality map within OL3

Central Petroleum Limited | Palm Valley 13 Page 7 | 22
Figure 2 — The primary target for PV13 is a zone of predicted high fracture density within the Pacoota P1, approximately 900 m north of PV7 at a depth of
~1830 mGL.
Central Petroleum Limited | Palm Valley 13 Page 8 | 22
Figure 3 — Palm Valley 13 Well Trajectory

Central Petroleum Limited | Palm Valley 13 Page 9 | 22
1.1 GENERAL DATA
Table 1: Palm Valley 13 Well Index Sheet
Well Name Palm Valley 13
Petroleum Title OL3
Basin Amadeus
Well Purpose Appraisal
Status Suspended Parent Well
Name, if any
Spud Date 21/08/2018
TD Date 13/10/2018 Rig Release
Date 18/10/2018
Primary Objective Pacoota P1 Sandstone Rig(s) Name Ensign 932
Secondary Objective NA 100K Map Sheet Hermannsburg 5450
Total Depth
MD TVD Side-Track Kick-off
Depth, if applicable NA
Driller 2242.00 1988.70
Logger NA NA Drill Datum
◼ DF
❑ RT
❑ KB
Elevation Datum: AHD
GL Elevation: 843.04m
Drill Datum Elevation:
848.89m
Location
(GDA94 Datum with
GRS80 Ellipsoid using
MGA94 Grid)
Coordinates Surface Bottom Hole
Latitude
Longitude
Easting
Northing
23°59’35.2819” S
132°43’33.4332” E
268 651.098
7 344 666.120
23°59’20.6240” S
132°43’41.5524” E
268 873.350
7 345 120.852
Seismic
Station, if
applicable
Survey
Inline
Xline
Zone M94 PV-05
53 Shot point 36
Well Summary
The Palm Valley 13 well was spudded on 21 August 2018 targeting gas in the Lower Stairway and Pacoota P1 Sandstone
in an area of predicted high natural fracture density. The well was drilled directionally into the Horn Valley Siltstone with
water-based and air/foam mud, where a 7” intermediate liner was cemented. Gas shows were observed in the Lower
Stairway Sandstone and Horn Valley Siltstone while drilling with air/foam with a flow test (0.02MMscf/d) performed before
the 7" intermediate liner was run. The well was then drilled out with air/foam into the Pacoota P1 Sandstone with the aim
to maximize connection with any natural fractures. An increase in gas shows at 1946m MD necessitated a production
test which recorded 0.56MMscf/d. Subsequent drilling observed other increases in gas shows with production tests
ranging between 10.7MMscf/d and 13.6MMscf/d until TD of 2242.00m MD. 3-1/2' tubing and a packer were run and the
well suspended for future facilities tie-in. The rig was released on 18 November 2018.
Hole and Casing Design (Drillers Depths) Drilling Fluid
Type Hole
Size
Depth
(mMD)
Casing
Size
Shoe
mMD
Shoe
mTVD
Hole Size
Type
Conductor 1 24 inch 23.5 20 inch 23.5 23.5 24 inch WBM – Gel
Conductor 2
17.5 inch 249.0 23.375 inch 248.9
248.9 17.5 inch WBM – KCL/Gel
Surface 12.25 inch 1119.0 9.625 inch 1116.5 1116.43 12.25 inch WBM – KCL/Gel
Intermediate Liner 8.5 inch 1845.0 7 inch 1842.0 1779.6 8.5 inch WBM – KCL/Gel Air/Foam
6.125 inch Air/Foam
Stratigraphy – Formation Tops (Loggers
Depths)
Formation Evaluation
Formation
Depth
Run
Measurement
Depth Interval
mMD
mTVD
mTVDGL
From (mMD)
To (mMD)
Hermannsburg Sandstone 5.85 5.58 0.0 1 CBL - 9.625” casing
0.00 1124.31
Park Siltstone 389.0 389.0 383.15 2 CBL – 7” liner 542.96 1856.03
Mereenie Sandstone 423.0 423.0 417.15 3 MWD – Gamma Ray 1842.00 2242.00
Carmichael Sandstone 998.0 998.0 992.15 MWD - Temperature 1842.00 2242.00
Central Petroleum Limited | Palm Valley 13 Page 10 | 22
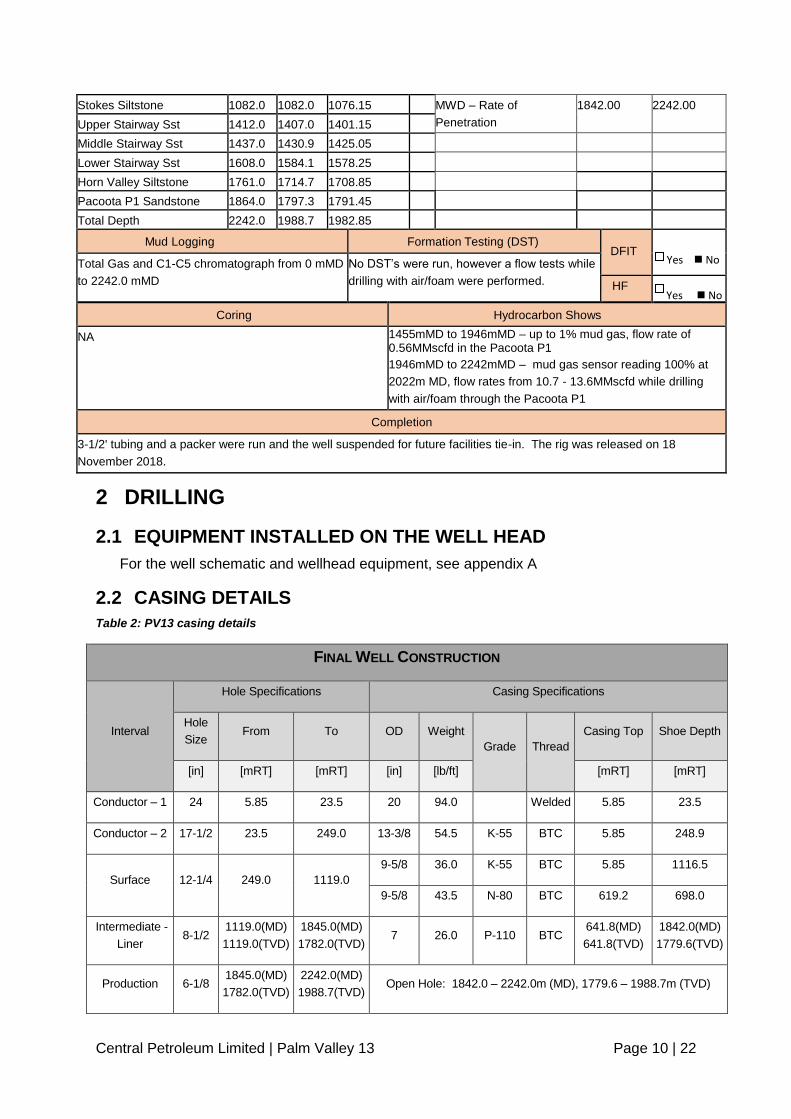
Stokes Siltstone 1082.0 1082.0 1076.15 MWD – Rate of
Penetration
1842.00 2242.00
Upper Stairway Sst 1412.0 1407.0 1401.15
Middle Stairway Sst 1437.0 1430.9 1425.05
Lower Stairway Sst 1608.0 1584.1 1578.25
Horn Valley Siltstone 1761.0 1714.7 1708.85
Pacoota P1 Sandstone 1864.0 1797.3 1791.45
Total Depth 2242.0 1988.7 1982.85
Mud Logging Formation Testing (DST)
DFIT
Yes ◼ No Total Gas and C1-C5 chromatograph from 0 mMD
to 2242.0 mMD
No DST’s were run, however a flow tests while
drilling with air/foam were performed. HF
Yes ◼ No
Coring Hydrocarbon Shows
NA 1455mMD to 1946mMD – up to 1% mud gas, flow rate of 0.56MMscfd in the Pacoota P1
1946mMD to 2242mMD – mud gas sensor reading 100% at
2022m MD, flow rates from 10.7 - 13.6MMscfd while drilling
with air/foam through the Pacoota P1
Completion
3-1/2' tubing and a packer were run and the well suspended for future facilities tie-in. The rig was released on 18
November 2018.
2 DRILLING
2.1 EQUIPMENT INSTALLED ON THE WELL HEAD
For the well schematic and wellhead equipment, see appendix A
2.2 CASING DETAILS
Table 2: PV13 casing details
FINAL WELL CONSTRUCTION
Interval
Hole Specifications Casing Specifications
Hole
Size From To OD Weight
Grade Thread
Casing Top Shoe Depth
[in] [mRT] [mRT] [in] [lb/ft] [mRT] [mRT]
Conductor – 1 24 5.85 23.5 20 94.0 Welded 5.85 23.5
Conductor – 2 17-1/2 23.5 249.0 13-3/8 54.5 K-55 BTC 5.85 248.9
Surface 12-1/4 249.0 1119.0
9-5/8 36.0 K-55 BTC 5.85 1116.5
9-5/8 43.5 N-80 BTC 619.2 698.0
Intermediate -
Liner 8-1/2
1119.0(MD)
1119.0(TVD)
1845.0(MD)
1782.0(TVD) 7 26.0 P-110 BTC
641.8(MD)
641.8(TVD)
1842.0(MD)
1779.6(TVD)
Production 6-1/8 1845.0(MD)
1782.0(TVD)
2242.0(MD)
1988.7(TVD) Open Hole: 1842.0 – 2242.0m (MD), 1779.6 – 1988.7m (TVD)

Central Petroleum Limited | Palm Valley 13 Page 11 | 22
2.3 PALM VALLEY 13 TIME DEPTH CURVE
Figure 4 — Palm Valley 13 Time Depth Curve

Central Petroleum Limited | Palm Valley 13 Page 12 | 22
2.4 DEVIATION SURVEYS
Table 3: PV13 Deviation survey
2.5 CEMENTING OPERATIONS
CONDUCTOR-1
A 20” conductor pipe was cemented in place using Halliburton as a 3rd party cementer to
a depth of 23.5mRT by spotting 3.5bbls of 15.8ppg cement slurry inside the 20”
conductor from 23.5m – 20.0m and pumping 17bbls of 15.8ppg SwiftCem cement down
the annulus through a cement stinger welded to the outside of the conductor pipe. All
surface samples of cement cured as per program and Central Petroleum was satisfied
with the integrity of the cement and conductor.
MD TVD INC. AZ. MD TVD INC. AZ.
(m) (m) (o) (o) (m) (m) (o) (o)
0.00 0.00 0.00 0.00 1555.76 1538.06 28.42 69.84
188.00 188.00 0.25 0.00 1575.08 1555.08 28.03 65.30
409.00 409.00 1.00 0.00 1596.74 1574.18 28.31 60.13
603.00 603.00 0.50 0.00 1615.96 1591.02 29.34 54.51
795.00 795.00 1.00 0.00 1635.35 1607.82 30.61 48.36
998.00 998.00 0.25 0.00 1654.79 1624.46 31.67 42.46
1114.00 1114.00 0.75 0.00 1673.96 1640.74 32.17 38.85
1125.26 1125.21 0.96 179.86 1693.26 1657.04 32.59 35.57
1131.35 1131.30 0.98 183.15 1712.56 1673.40 31.48 39.44
1150.64 1150.58 1.14 99.29 1730.68 1688.75 32.73 36.50
1169.87 1169.81 2.46 65.94 1750.48 1705.23 34.54 33.94
1189.15 1189.05 4.56 67.49 1769.74 1721.03 35.33 29.94
1208.46 1208.27 6.22 84.21 1788.98 1736.70 35.57 25.45
1227.78 1227.46 7.18 89.57 1808.36 1752.42 36.08 21.46
1246.13 1245.64 8.43 86.73 1827.72 1768.06 36.15 15.39
1266.33 1265.61 9.08 75.21 1878.03 1808.84 35.65 7.45
1285.64 1284.65 10.09 62.20 1906.82 1831.59 39.95 2.77
1304.77 1303.45 11.04 60.74 1935.75 1853.73 40.19 0.54
1324.09 1322.39 11.85 62.84 1966.15 1876.26 44.13 0.92
1343.40 1341.23 13.56 68.21 1997.00 1897.66 48.00 1.89
1362.93 1360.14 15.34 72.37 2022.13 1913.77 52.25 2.68
1382.06 1378.52 16.79 72.83 2051.08 1930.41 57.51 3.42
1401.37 1396.93 18.35 72.57 2080.06 1945.04 61.86 5.22
1420.79 1415.26 20.27 75.72 2108.75 1957.44 66.89 5.56
1440.14 1433.40 20.40 76.89 2139.41 1968.23 71.90 5.73
1459.42 1451.38 21.98 79.06 2168.38 1975.87 77.51 5.20
1478.55 1469.01 23.73 81.56 2179.82 1978.27 78.29 5.04
1497.84 1486.56 25.26 80.88 2198.09 1981.73 79.85 5.03
1517.13 1503.90 26.74 77.82 2217.38 1984.97 80.79 4.77
1536.44 1521.04 28.10 74.23 2242.00 1988.66 82.00 4.50
DIRECTIONAL SURVEY DIRECTIONAL SURVEY
Central Petroleum Limited | Palm Valley 13 Page 13 | 22
CONDUCTOR-2
The API 5CT, 13-3/8” 54.5ppf K-55 conductor #2 string was run to 249 mRT and
cemented to surface by pumping 122.1bbls of 12.5ppg Lead cement slurry and 41.8bbls
of 15.8ppg Tail cement slurry. The cementing operations were performed by Halliburton
as a 3rd party. The cement was displaced with 120.5bbls of displacement fluid with full
cement returns to surface with no top up cement job required. The cement plug was
bumped at 330psi and the casing was pressure tested to 1,500psi with floats holding
post bleed down of pressure.
SURFACE CASING
The API 5CT, 9-5/8” 36/43.5ppf K-55/N-80 surface casing string was run to 1116.5 mRT
and cemented to surface by pumping 238bbls of 12.5ppg Lead cement slurry and 58bbls
of 16ppg Tail cement slurry. The cement was displaced with 284bbls displacement fluid
with full cement returns to surface. The cement plug was bumped at 1300psi and the
casing was pressure tested to 2,700psi with floats holding post bleed down of pressure.
The integrity of the surface casing and cement was verified utilising various techniques
and interpretations as follows: The review of the Halliburton post job report on the
cementing/pumping operations demonstrated that the surface cement samples cured,
and the cement was pumped per program, the casing cement plugs were bumped, and
the casing pressure tested to 2,700 psi, verifying the integrity of the casing. A radial
cement bond log (CBL) was run on 25 September 2018 and reviewed by independent
experts. The findings for this section were that typically with cement bond logs, free pipe
is in the order of 50mV (3-foot amplitude) while fully bonded casing would be +/ 1.5mV.
The CBL for the Surface casing in PV13 shows that the majority of the well is below
20mV with the average (blue) trace in the 10mV range. The areas across porous sands
show close to a perfect bond. It is common for the cement to set faster over porous
intervals in the well due to water losses into these zones. There may be some free pipe
over a 40m interval between 250m MD and 290m MD, however there is good cement
bond above and below this interval.
Finally, after drilling out the shoe track, and conditioning the drilling fluid, a Formation
Integrity Test (FIT) was performed to an equivalent mud weight of 14.2 ppg Estimated
Mud Weight (EMW).
PRODUCTION LINER
The API 5CT,7” Liner 26ppf P-110 Liner was run to a depth of 1842 mRT and cemented
back to the top of the Versaflex Liner Hanger Assembly located at 641.8 mRT. The Liner
was cemented in place by pumping 92.8bbls of 13.5ppg Lead cement slurry followed by
37.6bbls of 15.8ppg Tail cement slurry. The cement was displaced with 167bbls
displacement fluid. The cement plug was bumped and the Liner was pressure tested to
2,000psi with the floats holding post bleed down of casing pressure.
Central Petroleum Limited | Palm Valley 13 Page 14 | 22
After releasing from the liner hanger, 30 bbls of excess cement was circulated out of the
well ensuring full cement coverage from the shoe back to the liner hanger. The integrity
of the Production Liner and cement was verified utilising various techniques and
interpretations as follows: The review of the Halliburton post job report on the
cementing/pumping operations demonstrated that the surface cement samples cured,
and the cement was pumped as per program, the casing cement plugs were bumped as
per program and the casing pressure tested to 1,820 psi on the Halliburton recorder
(2,000 psi at the standpipe), verifying the integrity of the casing. The 7” liner hanger was
run, set and pressure tested to 3,500 psi. Verifying the integrity of the liner hanger and
the overlap from the 9 5/8” casing to the 7” liner. The cement bond log was run on 28
September 2018 and reviewed by independent experts and the findings for this section
were: for the 7” casing, free pipe is in the order of 50mV (E1) while fully bonded casing
would be +/- 1.5mV. Very good cement bond was seen over the Tail cement section from
the casing shoe to the cement top of the tail located at 1500m which is distinctly seen on
the CBL. When cementing the liner with a Versaflex Hanger Assembly it is a requirement
and standard procedure to pump a Lead Cement heavily retarded to slow down the
setting time of the cement in case of any issues with setting the Versaflex Hanger
Assembly to provide a contingency. Having a heavily retarded cement requires a much
longer curing/setting time. The CBL was performed approximately 70hrs after the cement
job was completed, which was sufficient time for the tail cement to reach maximum
strength. Though the CBL shows sporadic cement placement from 1,500m (Tail Top) –
641m (Hanger Assembly) within the Lead cement section; it is expected that further
curing and strengthening time would have improved the CBL results within this section.
Finally, after drilling out the shoe track and 2m of new formation, a FIT was performed
with 9.1ppg mud in the hole and a pressure of 871psi applied returning a 12.0 ppg EMW.
Central Petroleum Limited | Palm Valley 13 Page 15 | 22
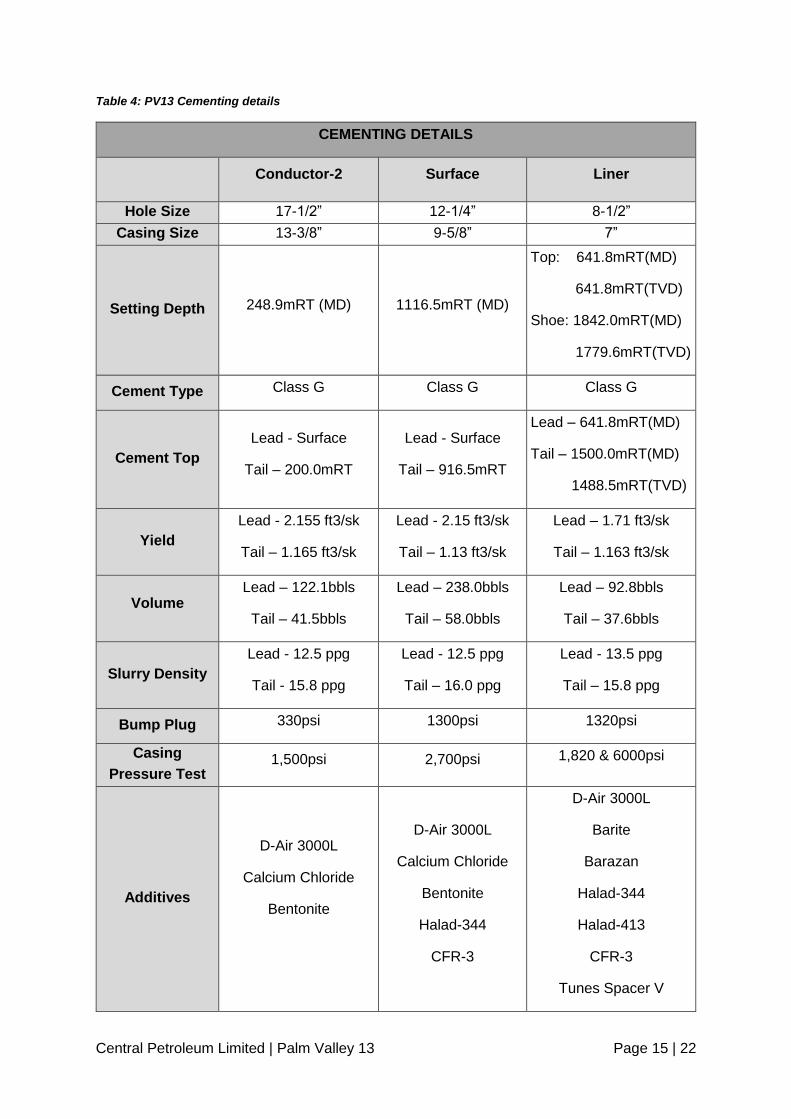
Table 4: PV13 Cementing details
CEMENTING DETAILS
Conductor-2 Surface Liner
Hole Size 17-1/2” 12-1/4” 8-1/2”
Casing Size 13-3/8” 9-5/8” 7”
Setting Depth 248.9mRT (MD) 1116.5mRT (MD)
Top: 641.8mRT(MD)
641.8mRT(TVD)
Shoe: 1842.0mRT(MD)
1779.6mRT(TVD)
Cement Type Class G Class G Class G
Cement Top
Lead - Surface
Tail – 200.0mRT
Lead - Surface
Tail – 916.5mRT
Lead – 641.8mRT(MD)
Tail – 1500.0mRT(MD)
1488.5mRT(TVD)
Yield
Lead - 2.155 ft3/sk
Tail – 1.165 ft3/sk
Lead - 2.15 ft3/sk
Tail – 1.13 ft3/sk
Lead – 1.71 ft3/sk
Tail – 1.163 ft3/sk
Volume Lead – 122.1bbls
Tail – 41.5bbls
Lead – 238.0bbls
Tail – 58.0bbls
Lead – 92.8bbls
Tail – 37.6bbls
Slurry Density
Lead - 12.5 ppg
Tail - 15.8 ppg
Lead - 12.5 ppg
Tail – 16.0 ppg
Lead - 13.5 ppg
Tail – 15.8 ppg
Bump Plug 330psi 1300psi 1320psi
Casing
Pressure Test 1,500psi 2,700psi 1,820 & 6000psi
Additives
D-Air 3000L
Calcium Chloride
Bentonite
D-Air 3000L
Calcium Chloride
Bentonite
Halad-344
CFR-3
D-Air 3000L
Barite
Barazan
Halad-344
Halad-413
CFR-3
Tunes Spacer V
Central Petroleum Limited | Palm Valley 13 Page 16 | 22
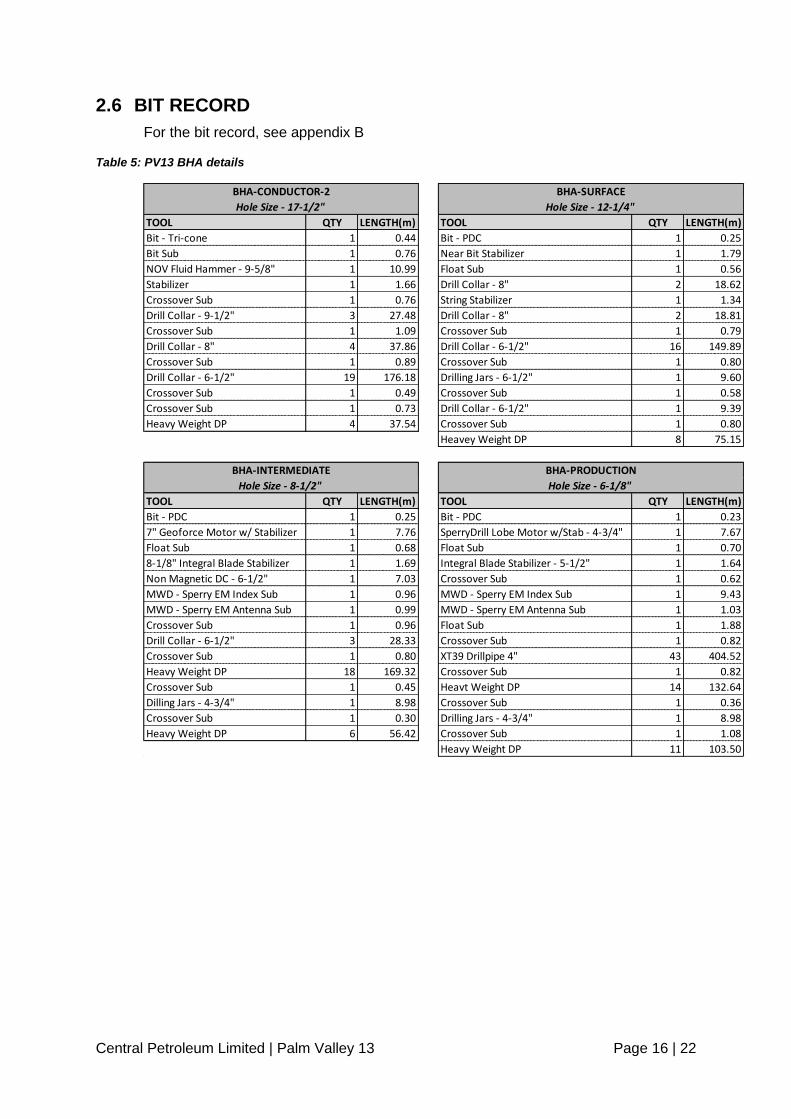
2.6 BIT RECORD
For the bit record, see appendix B
Table 5: PV13 BHA details
TOOL QTY LENGTH(m) TOOL QTY LENGTH(m)
Bit - Tri-cone 1 0.44 Bit - PDC 1 0.25
Bit Sub 1 0.76 Near Bit Stabilizer 1 1.79
NOV Fluid Hammer - 9-5/8" 1 10.99 Float Sub 1 0.56
Stabilizer 1 1.66 Drill Collar - 8" 2 18.62
Crossover Sub 1 0.76 String Stabilizer 1 1.34
Drill Collar - 9-1/2" 3 27.48 Drill Collar - 8" 2 18.81
Crossover Sub 1 1.09 Crossover Sub 1 0.79
Drill Collar - 8" 4 37.86 Drill Collar - 6-1/2" 16 149.89
Crossover Sub 1 0.89 Crossover Sub 1 0.80
Drill Collar - 6-1/2" 19 176.18 Drilling Jars - 6-1/2" 1 9.60
Crossover Sub 1 0.49 Crossover Sub 1 0.58
Crossover Sub 1 0.73 Drill Collar - 6-1/2" 1 9.39
Heavy Weight DP 4 37.54 Crossover Sub 1 0.80
Heavey Weight DP 8 75.15
TOOL QTY LENGTH(m) TOOL QTY LENGTH(m)
Bit - PDC 1 0.25 Bit - PDC 1 0.23
7" Geoforce Motor w/ Stabilizer 1 7.76 SperryDrill Lobe Motor w/Stab - 4-3/4" 1 7.67
Float Sub 1 0.68 Float Sub 1 0.70
8-1/8" Integral Blade Stabilizer 1 1.69 Integral Blade Stabilizer - 5-1/2" 1 1.64
Non Magnetic DC - 6-1/2" 1 7.03 Crossover Sub 1 0.62
MWD - Sperry EM Index Sub 1 0.96 MWD - Sperry EM Index Sub 1 9.43
MWD - Sperry EM Antenna Sub 1 0.99 MWD - Sperry EM Antenna Sub 1 1.03
Crossover Sub 1 0.96 Float Sub 1 1.88
Drill Collar - 6-1/2" 3 28.33 Crossover Sub 1 0.82
Crossover Sub 1 0.80 XT39 Drillpipe 4" 43 404.52
Heavy Weight DP 18 169.32 Crossover Sub 1 0.82
Crossover Sub 1 0.45 Heavt Weight DP 14 132.64
Dilling Jars - 4-3/4" 1 8.98 Crossover Sub 1 0.36
Crossover Sub 1 0.30 Drilling Jars - 4-3/4" 1 8.98
Heavy Weight DP 6 56.42 Crossover Sub 1 1.08
Heavy Weight DP 11 103.50
BHA-PRODUCTION
Hole Size - 6-1/8"
BHA-CONDUCTOR-2
Hole Size - 17-1/2"
BHA-SURFACE
Hole Size - 12-1/4"
BHA-INTERMEDIATE
Hole Size - 8-1/2"
Central Petroleum Limited | Palm Valley 13 Page 17 | 22
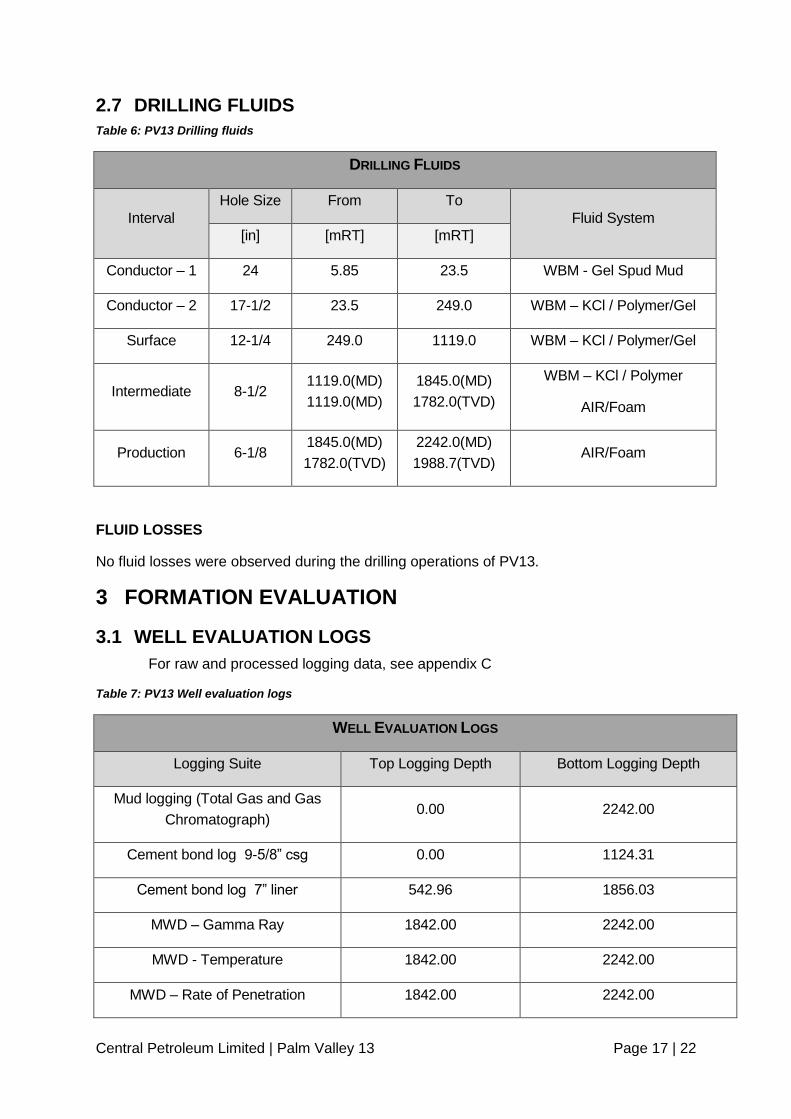
2.7 DRILLING FLUIDS
Table 6: PV13 Drilling fluids
DRILLING FLUIDS
Interval
Hole Size From To
Fluid System
[in] [mRT] [mRT]
Conductor – 1 24 5.85 23.5 WBM - Gel Spud Mud
Conductor – 2 17-1/2 23.5 249.0 WBM – KCl / Polymer/Gel
Surface 12-1/4 249.0 1119.0 WBM – KCl / Polymer/Gel
Intermediate 8-1/2 1119.0(MD)
1119.0(MD)
1845.0(MD)
1782.0(TVD)
WBM – KCl / Polymer
AIR/Foam
Production 6-1/8 1845.0(MD)
1782.0(TVD)
2242.0(MD)
1988.7(TVD) AIR/Foam
FLUID LOSSES
No fluid losses were observed during the drilling operations of PV13.
3 FORMATION EVALUATION
3.1 WELL EVALUATION LOGS
For raw and processed logging data, see appendix C
Table 7: PV13 Well evaluation logs
WELL EVALUATION LOGS
Logging Suite Top Logging Depth Bottom Logging Depth
Mud logging (Total Gas and Gas
Chromatograph) 0.00 2242.00
Cement bond log 9-5/8” csg 0.00 1124.31
Cement bond log 7” liner 542.96 1856.03
MWD – Gamma Ray 1842.00 2242.00
MWD - Temperature 1842.00 2242.00
MWD – Rate of Penetration 1842.00 2242.00

Central Petroleum Limited | Palm Valley 13 Page 18 | 22
3.2 CORES AND SAMPLE DETAILS
No cores were cut in PV13. Cuttings samples were collected as follows:
Surface to 1120m MD 15m interval
1120m to 2242m MD 5m interval
12 gas samples were retrieved in Isotubes from the mud gas line while drilling with
air/foam in the Lower Stairway Sandstone to Pacoota P1 Sandstone. Gas samples
have not been analysed, but a subset is planned to be analysed in the future.
Table 8: PV13 Gas samples
GAS SAMPLES
Depth (m MD) Formation
1739 Lower Stairway Sandstone
1742 Lower Stairway Sandstone
1814 Horn Valley Siltstone
1820 Horn Valley Siltstone
1823 Horn Valley Siltstone
1899 Pacoota P1 Sandstone
1900 Pacoota P1 Sandstone
1903 Pacoota P1 Sandstone
1919 Pacoota P1 Sandstone
1961 Pacoota P1 Sandstone
2011 Pacoota P1 Sandstone
2022 Pacoota P1 Sandstone
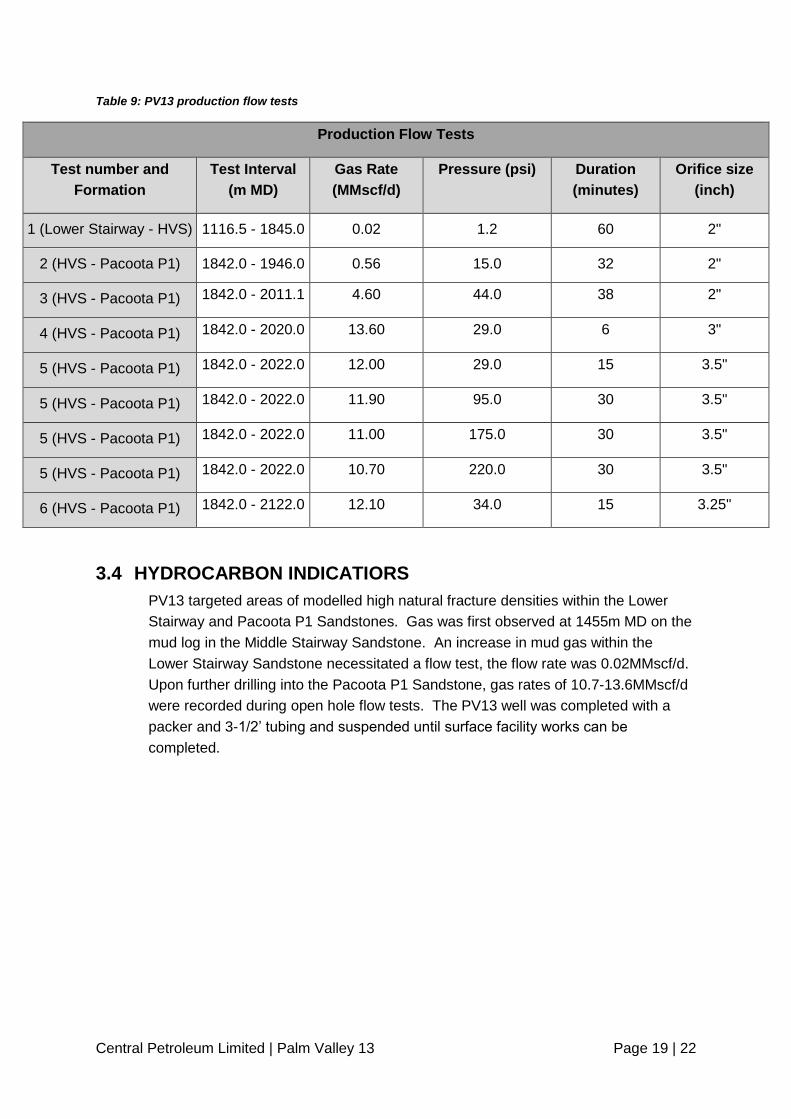
3.3 PRODUCTION TEST DETAILS
Six production tests were carried out on PV13 while drilling with air/mist, see Table
9. The first flow test was carried out at the 8-1/2” TD section before the 7” liner was
run. The flow test was from an open hole interval of 1116.5m to 1845.0m MD and
the stabilized rate was 0.017MMscf/d for 60 minutes through a 2” choke. A second
flow test was conducted from 1842.0 to 1946.0m MD with a stabilized rate of
0.56MMscf/d for 32 minutes through a 2” choke. Due to an increase in mud gas, a
third flow test was conducted from 1845.0 to 2011m MD with a stabilized rate of
13.6MMscf/d for 14 minutes through a 3-1/2” choke. During a bit trip, a flow and
build-up at different back pressures was undertaken from 1842.0 to 2022.0m MD. A
final flow test was conducted at 1842.0m to 2122m MD with a stabilized rate of
12.1MMscf/d for 15 minutes on a 3-1/4” choke. See appendix D for the flow and
pressure build-up data.
Central Petroleum Limited | Palm Valley 13 Page 19 | 22
Table 9: PV13 production flow tests
Production Flow Tests
Test number and
Formation
Test Interval
(m MD)
Gas Rate
(MMscf/d)
Pressure (psi) Duration
(minutes)
Orifice size
(inch)
1 (Lower Stairway - HVS) 1116.5 - 1845.0 0.02 1.2 60 2"
2 (HVS - Pacoota P1) 1842.0 - 1946.0 0.56 15.0 32 2"
3 (HVS - Pacoota P1) 1842.0 - 2011.1 4.60 44.0 38 2"
4 (HVS - Pacoota P1) 1842.0 - 2020.0 13.60 29.0 6 3"
5 (HVS - Pacoota P1) 1842.0 - 2022.0 12.00 29.0 15 3.5"
5 (HVS - Pacoota P1) 1842.0 - 2022.0 11.90 95.0 30 3.5"
5 (HVS - Pacoota P1) 1842.0 - 2022.0 11.00 175.0 30 3.5"
5 (HVS - Pacoota P1) 1842.0 - 2022.0 10.70 220.0 30 3.5"
6 (HVS - Pacoota P1) 1842.0 - 2122.0 12.10 34.0 15 3.25"
3.4 HYDROCARBON INDICATIORS
PV13 targeted areas of modelled high natural fracture densities within the Lower
Stairway and Pacoota P1 Sandstones. Gas was first observed at 1455m MD on the
mud log in the Middle Stairway Sandstone. An increase in mud gas within the
Lower Stairway Sandstone necessitated a flow test, the flow rate was 0.02MMscf/d.
Upon further drilling into the Pacoota P1 Sandstone, gas rates of 10.7-13.6MMscf/d
were recorded during open hole flow tests. The PV13 well was completed with a
packer and 3-1/2’ tubing and suspended until surface facility works can be
completed.

Central Petroleum Limited | Palm Valley 13 Page 20 | 22
4 GEOLOGY
4.1 ALONG HOLE AND TRUE VERTICAL DEPTH OF SEISMIC
MARKERS
Table 10: PV13 well tops
Well tops
Formation Name Actual Depth
MD (m)
Actual Depth
TVD (m)
Actual Thickness
TVT (m)
High/Low to
Prognosis
Hermannsburg Sst 5.8 5.8 398.2 GL
Parke Siltstone 389 389 34 10m H
Mereenie Sandstone 423 423 575 12m H
Carmichael Sst 998 998 84 19m H
Stokes Siltstone 1082 1082 330 21m H
Upper Stairway Sst 1412 1407 25 2m H
Middle Stairway Sst 1437 1430.9 153.2 18.1m H
Lower Stairway Sst 1608 1584.1 134 17m H
Horn Valley Siltstone 1761 1714.7 82.6 24.5m H
Pacoota P1 Sst 1864 1797.3 191.3 21.7m H
TOTAL DEPTH 2242 1988.7
4.2 PRELIMINARY ASSESMENT OF RESERVOIR AND
PROSPECTIVE HORIZONS
Lower Stairway Sandstone
Latitude (GDA 94) Longitude (GDA 94) Easting
(Zone 53)
Northing
(Zone 53)
Lower Stairway
Reservoir
intersection in
PV13
23° 59' 34.2514" S 132° 43' 38.1879" 268785 m 7344700 m
Central Petroleum Limited | Palm Valley 13 Page 21 | 22
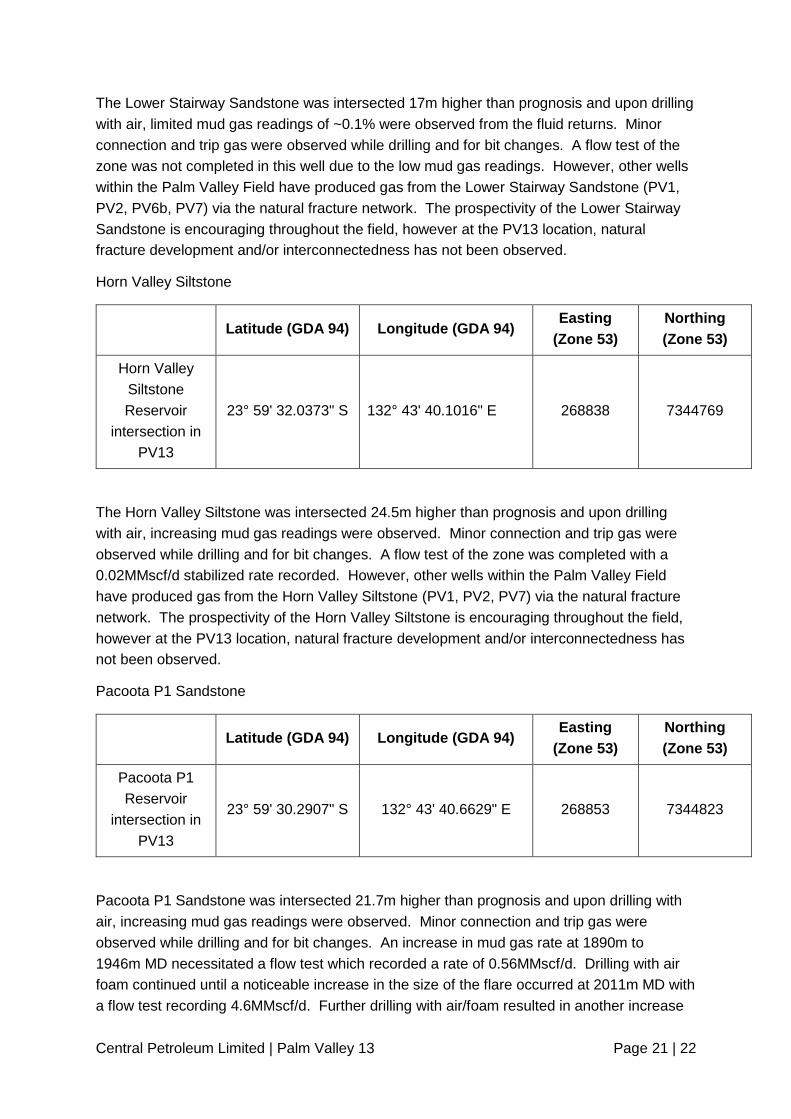
The Lower Stairway Sandstone was intersected 17m higher than prognosis and upon drilling
with air, limited mud gas readings of ~0.1% were observed from the fluid returns. Minor
connection and trip gas were observed while drilling and for bit changes. A flow test of the
zone was not completed in this well due to the low mud gas readings. However, other wells
within the Palm Valley Field have produced gas from the Lower Stairway Sandstone (PV1,
PV2, PV6b, PV7) via the natural fracture network. The prospectivity of the Lower Stairway
Sandstone is encouraging throughout the field, however at the PV13 location, natural
fracture development and/or interconnectedness has not been observed.
Horn Valley Siltstone
Latitude (GDA 94) Longitude (GDA 94) Easting
(Zone 53)
Northing
(Zone 53)
Horn Valley
Siltstone
Reservoir
intersection in
PV13
23° 59' 32.0373" S 132° 43' 40.1016" E 268838 7344769
The Horn Valley Siltstone was intersected 24.5m higher than prognosis and upon drilling
with air, increasing mud gas readings were observed. Minor connection and trip gas were
observed while drilling and for bit changes. A flow test of the zone was completed with a
0.02MMscf/d stabilized rate recorded. However, other wells within the Palm Valley Field
have produced gas from the Horn Valley Siltstone (PV1, PV2, PV7) via the natural fracture
network. The prospectivity of the Horn Valley Siltstone is encouraging throughout the field,
however at the PV13 location, natural fracture development and/or interconnectedness has
not been observed.
Pacoota P1 Sandstone
Latitude (GDA 94) Longitude (GDA 94) Easting
(Zone 53)
Northing
(Zone 53)
Pacoota P1
Reservoir
intersection in
PV13
23° 59' 30.2907" S 132° 43' 40.6629" E 268853 7344823
Pacoota P1 Sandstone was intersected 21.7m higher than prognosis and upon drilling with
air, increasing mud gas readings were observed. Minor connection and trip gas were
observed while drilling and for bit changes. An increase in mud gas rate at 1890m to
1946m MD necessitated a flow test which recorded a rate of 0.56MMscf/d. Drilling with air
foam continued until a noticeable increase in the size of the flare occurred at 2011m MD with
a flow test recording 4.6MMscf/d. Further drilling with air/foam resulted in another increase
Central Petroleum Limited | Palm Valley 13 Page 22 | 22
in visual size of the flare at 2022m MD with multiple flow tests over this interval confirming a
rate between 10.7 and 13.6MMscf/d. Drilling progressed to TD of 2242m MD without much
change in flowing rates. The completion was run and the well suspended as a future
producer from the Lower Stairway, Horn Valley and Pacoota P1 formations.
Please see the following appendices:
Appendix E for the PV13 Index Sheet
Appendix F for the PV13 Daily Drilling Reports
Appendix G for the PV13 Daily Geological Reports