Embed Size (px)
Citation preview
PARAMETERS AFFECTING THE PERFORMANCE OF THE C-CLASS WINGSAIL
S. R. Turnock, Ship Science, University of Southampton, UK
I. M. Cambell, Wolfson Unit Marine Technology and Industrial Aerodynamics, University of Southampton. UK
M. Magherini, Ship Science, University of Southampton, UK
SUMMARY
Wing sails offer a different design challenge to those of more conventional soft sail rigs. This study was undertaken in
order to assess which parameters influence wingsail performance of C-Class catamarans, and to what extent, the results
from the wind tunnel can be applied in the design developments of future wingsails. A combined wing sail and C- class
catamaran was tested in the low-speed section of the 7’ x 5’ wind tunnel at the University of Southampton. Testing
assessed the appropriate settings for the movable element of the multiple-element wing sail as well as heeling angle,
trampoline porosity, spanwise camber distribution and gap at the foot of the wingsail. Both upwind and downwind
conditions were considered through measurement of driving force, heeling force, lift and drag coefficients. The results
demonstrate that low heel angles improve overall performance and that the gap underneath the wingsail foot adversely
affects the generation of lift by the sail. An airfoil shaped trampoline is suggested in order to benefit both a reduced gap
and a better control over the heel. For heavy wind condition, negative twist at the tip of the wingsail allows higher boat
speeds.
NOMENCLATURE
α Angle of attack of wingsail [deg]
AC America’s Cup
AoA Angle of Attack
AR Aspect Ratio
βA Apparent wind angle [deg]
βT True wind angle [deg]
ν Kinematic viscosity of air [m2/s]
ϕ Heel angle [deg]
CB Centre of buoyancy
CD Drag coefficient [-]
CDI Induced drag coefficient [-]
CEh Centre of effort height [m]
CE Centre of effort
CFD Computational Fluid Dynamics
CG Centre of gravity
CL Lift coefficient [-]
CLR Centre of lateral resistance
DF Driving force [N]
DWL Design water line
G Acceleration due to gravity [9,81 m/s2]
HF Heeling force [N]
HM Heeling moment [Nm]
L Length [m]
LWL Length water line [m]
L/B Length to breadth ratio [-]
L/D Lift to drag ratio [-]
q Dynamic pressure [Pa]
Re Reynolds number [-]
RH Total hull resistance [N]
RM Righting moment[Nm]
TWA True Wind Angle
TWS True Wind Speed
VA Apparent wind speed [knots]
VS Boat speed [knots]
VT True wind speed [knots]
VMG Velocity Made Good
VPP Velocity Prediction Programme
YM Yawl moment [Nm]
1. INTRODUCTION
The C-Class catamarans are a sailing class competing in
the Little America’s Cup (LAC), an international match
racing event with the winner of the eliminations series
competing in the final race with the defender of the cup.
From a research perspective the most interesting element
characterizing a C-Class catamaran is their sail
propulsion system: a symmetrical rigid wingsail that
allows the catamarans to reach velocities 50% higher
than the true wind velocity in upwind sailing, and more
than double downwind.
The interest in the class, after several years of relative
obscurity, has rapidly grown again in recent times due to
the new format of the America’s Cup: the trophy
wascompeted for in the AC72, 22m long catamarans
powered by 40m high wingsails. In order to allow teams
to develop experience of wingsails, the AC45
(L=13,45m) has been designed as an essential step
toward the AC72. The AC45 regattas are held in
different venues around the world: both fleet and match
racing are part of each event, full live coverage of the
events are guaranteed by cameras on board bringing the
audience inside the sailing action.
It is worth noting that there is revived interest in wind
assisted ship propulsion [1] [2]. Alternative types of sail
assistance devices were compared and it was concluded
that kites were particularly attractive. However, the
operational issues associated with their safe operation
may favour fixed structures which with suitable control
for optimum drive force generation can provide potential

energy savings. The technologies developed originally as
part of the LAC may aid the future design of such
systems.
The aim of the study is to consider how various design
parameters influence the performance of a scaled C-Class
catamaran wind tunnel model and thus examine possible
design options for future catamarans powered by
wingsails.
2. SOFT SAILS vs. WINGSAILS
As the sail area of a C-Class catamaran is fixed, from a
designer point of view the key factor is to maximize the
power achievable from the 300 square feet (27.87m2) of
wing sail area allowed across a range of possible wind
speeds. Figure 1 shows a typical C class catamaran in the
upwind sailing condition.
Figure 1: C-Class Catamaran flying windward hull.
A wingsail has some features in common with aircraft
wing design with its use of multiple elements such as
flaps and slots. As a result of this it can develop higher
lift coefficients than conventional sail rigs [3]. The use of
stiff components will increase the predictability of the
achieved sail shape under given wind conditions,
although it can be argued that a fixed geometry reduces
the ability of the sailor to more precisely tune their sail
for given wind conditions. High-lift devices typically use
either slots or flaps to modify the flow regime around the
sail section. The slot channelling flow from the high
pressure to the low pressure side of the sail and the flap
altering the effective camber. The multi-element wingsail
adopted in C-Class combines the slot and a shaped rear
flap. The flow through the slot ensures the flow over the
leading edge of the flap remains attached as well as
generating higher sideforce. The effects are:
• increase in maximum achieveable CL ,
• delay in stall angle,
• benefits in performance in terms of better
boundary layer control, and
• increased control of the camber in order to
adjust the angle of attach (AoA) at different
mast’s heights for the local apparent wind
angle (βA).
In order to generate the maximum achievable CL, the
entire sail should be uniformly loaded to obtain the semi-
elliptic load distribution: soft sails’ tip tends to be
overloaded whereas the bottom can never be fully
loaded. The physical reason for such behaviour is the
nature of the wind driving a yacht: a twisted flow. As a
consequence, the top is stalling before the bottom of the
sail preventing the achievement of high average lift
coefficients. Differentially, the control system of a
wingsail allows twisting the sections at different heights,
in order to offer always the optimum α to the twisted βA.
3. C-CLASS WINGSAIL DESIGN
CONDITION
The WinDesign [4] Velocity Prediction Program (VPP)
was used to estimate the general sailing parameters
related to boat speed VS, apparent wind speed VA, and
apparent wind angle βA, for a range of wind speeds of a
C class catamaran. Due to the lack of specific CL and CD
values for a wingsail, for starting the design process
using the VPP it has been assumed that a wingsail
typically generates twiced the lift coefficient of a normal
soft sail [5] and hence the sail area was doubled in the
input for the VPP:
. (1)
The demihull of a typical C –Class “Team Invictus” is
used for the hydrodynamic modelling. Catamarans
assume two equilibrium states: flying and non-flying
condition. The VPP is operating in three different
“configurations”: the boundaries between these set up are
defined by the user, defining:
1. the break angle = heel angle at which the
windward hull is clear of the water,
2. the fly-angle = mean heel angle at which the
catamaran will sail while flying the weather
hull.
The maximum heel angle considered for the predictions
is the fly-angle at which the crew is at their maximum
righting moment. For a C-Class catamaran, a crew of
180kg in total and a fly-angle of 10 degrees were
considered to be realistic. The multidimensional Newton-
Raphson iterative method is used by the solution
algorithm to generate the results shown as a velocity
polar diagram in Figure 2. The angles plotted in the
diagrams are true wind angles [degrees]; the polar curves
represent estimated boat speeds [knots] at different true
wind speeds. In addition to that, the dots in the polar
diagram specify at which heading the best VMG for
upwind and downwind sailing is achieved.
The global range of βA(Table 1) at which the wingsail
will operate is estimated by the VPP to be between 20
and 60 degrees from theβT . In other words, these
catamarans are able to sail so fast that they can keep the
apparent wind always to the front.
MAIN ELEMENT
SLOT GAP
ELEMENT
REAR
FLAP

Figure 2: Invictus VPP using double soft sail area.
Table 1:Best βA, βT and VMG for Invictus VPP.
VT
[knots]
βA [deg] βT [deg] VMG [knots]
Up Dw Up Dw Up Dw
4 18,6 51,7 46,2 127,3 3,81 2,9
6 18,8 49 47 126,1 5,69 4,43
8 18,7 40,1 43,7 124,3 7,19 6,71
10 19,5 37,7 42,4 125,1 8,18 9,04
12 - 40 - 128,6 8,93 11,19
14 21,4 43,9 42,2 132,1 9,57 13,03
16 22,2 47,7 42,2 134,8 10,13 14,67
20 23,7 54,7 42,2 138,5 11,08 17,63
Interestingly, the βA presents a non-monotonic behaviour
with increasing VT: instead it follows the trend of the βT,
which at 10 knots of VT, the βT starts increasing with
increases in true wind speed. This result is also
confirmed by proven technique used to sail downwind a
C-Class catamaran [3].
3.1 UPWIND REQUIREMENTS
The upwind requirement for a yacht is that the ratio
DF/HM is maximised. Driving force and heeling forces
are given respectively as:
, (2)
( ) , (3)
The heeling moment of a catamaran is:
, (4)
where a is the distance between the CLRand the CE of
the sailplan. In a steady sailing condition, the heeling
moment generated by the sailplan has to be balanced by
the righting moment produced by the hull and its crew:
; (5)
where, WCAT and l1 cos(ϕ) are respectively the weight of
the catamaran and the distance between CB and CG in
which the total weight is applied. Identical meaning has
WCREW and l2 cos(ϕ), for the crew’s weight. Last equation
relates ϕ with the HM: being a cosine function, an
increase in the heel angle will decrease the righting
moment. Therefore, the maximum righting moment is
achieved when the heel angle is at a minimum. A
decrease in drag will cause a decrease in the HF and an
increase in the DF. Lift and drag for a sail of area A are
defined as:
; (6)
. (7)
The drag coefficient is defined as:
, (8)
where, CD0 is the formdrag due to the skin friction and
turbulence of the air following over the sail and its
supporting structure with its associated flow separations;
CDI, the induced drag, is a function of the vertical
distribution of aerodynamic loading and it is defined:
. (9)
Recent studies [6] implemented an additional pressure
drag coefficient due to separation, likely to occur in high
lift situation. Nevertheless, this study employs the
classical potential flow model (eq. 8). The induced drag
is the largest drag component. For reducing CDI, a high
aspect ratio airfoil is required; nevertheless, a tall rig will
have a higher vertical centre of effort CEh increasing the
heeling moment and ending in penalizing the DF. To
reduce the CEh, a negative lift distribution can be used at
the tip of the wingsail which has been proved to obtain
the best DF/HM for strong winds condition [7].
3.2 DOWNWIND REQUIREMENTS
High speed sailing catamaran never sail straight
downwind in order to achieve the maximum VMG, for the
following reason:
when VS is increasing (accelerating),
consequently VA will inevitably decrease
(course in the direction of the wind),
INVICTUS VPP DOUBLE SAIL AREA_SOFT SAIL
09/23/11 12:41:16 Wind values at 10 m. height.E:\C-Class Thesis\VPP\INVICTUS VPP DOUBLE SAIL AREA_SOFT SAIL.VPP
10 20 30 40 5060
70
80
90
100
110
120
130
140
150
160
170
2
4
6
8
10
12
14
16
18
20
22
24
26
28
30
32
4 6 8 10 12 14 16 18 20 22 24 26 28 30
2
4
6
8
10
12
14
4 6 8
10
12
14
16
20

since ( ) and (
), it becomes
difficult to obtain any significant gains in sailing
straight to the wind.
C-Class catamarans tack downwind jibing through
approximately 90 degrees jibe to jibe (so called
technique “iceboating” after the similar technique used
when sailing on ice) [3]. At these angles and with the
speeds these catamarans can reach, the VA is moved well
forward of the beam and they manage to fly a hull while
close reaching in the accelerated VA. The higher VS is,
the higher VA becomes, and the more power is obtained.
Sail drag is of secondary importance, whereas the lift
force generating the thrust in the direction of the course
is of prime importance. Therefore, the downwind
requirement is to design a wingsail than can generate a
CL MAX over the entire span of the wing. A high level of
camber is requested in order to adjust the wing’s AoA to
the twisted flow acting on it; with flap angle of about 30-
35 degrees, wingsails can produce their best
performances.
4. WIND TUNNEL TESTING
In order to assess the complex interaction of the
differential twisting of a wingsail with its trampoline, a
scaled model (Table 2) was tested in the large cross-
section straight flow low speed section of the University
of Southampton 7’x5’ closed return wind tunnel.
4.1 WIND TUNNEL MODEL-DESIGN
The model’s requirements considered crucial were:
possibility of changing the heeling angle in the
tests,
possibility of controlling the AoA of the
wingsail,
possibility of changing type of trampoline.
Due to time constraints, a wingsail designed in a
previous research project was used [5]; therefore, the
model also required being able to accommodate the
wingsail previously tested. The scaling procedure started
from the area of the model wingsail: of GDP 34:
.
The area of a C-Class wingsail is:
.
Therefore, the scaling factor is:
√
. (10)
Next, all the dimensions of the full scale catamaran has
been scaled according to λ:
Table 2: Main wind tunnel model dimensions
Parameters Full Scale Model Scale
Sail Area [m2] 27.87 0.72
LOA [m] 7.62 1.225
Beam [m] 4.267 0.686
The catamaran structure is composed of aluminium box
sections of 31x31x3mm (see Figure 3). The demihulls
are connected together by two aluminium cylinders with
a diameter of 30mm and 3mm of thickness bolted to the
square bars. To enable model testing at different heeling
angle, a semi-circular aluminium bar is designed to be
connected to the dynamometer fittings with holes at
every 5 degrees of heel. The axis of rotation of the whole
model is the one given by the rotation of the bow fitting
around the aluminium bar connected in the forward
fitting of the dynamometer.
Figure 3: Wind tunnel model internal structure.
To represent the windage resistance, demihulls made by
foam scaled from Invictus hull are designed to cover
entirely the aluminium structural bars, in order to provide
a realistic aerodynamic shape (see figure 4).
A benefit of this model design is its flexibility, it can be
reused for different types of boat by redesigning the foam
shape covering the aluminium bars. The beams can be
removed or changed in dimensions either to test
monohulls or catamarans with different width.

Figure 4-: Wind tunnel model during tests. Flow is left to
right.
4.2 METHODOLOGY OF TESTING
During the tests, the angle of attack of the foreelement
was controlled with an electrical winch (see Figure 5),
whereas the second element was manually fixed at a
certain angle relatively to the first. In other words, the
“global” angle of attack of the wingsail was controlled.
For upwind sailing, a flap angle of 10 degrees (angle
between the longitudinal axis of the wingsail’s fore
element and the flap) was estimated to be realistic. For
the downwind case, a flap angle of 20 degrees was
adopted as constant cambered configurations. For the
twisted configurations, the first step was to set the wing
at a constant flap angle (respectively 10 or 20 degrees for
upwind/downwind βAs). This ensured a correct opening
of the slot gap between the two elements. For achieving
twist on the flap element, an hinge and track system was
adopted [8]: shrink wrapping was used around wooden
sections of the element to cover the wing.
Figure 5: Wind tunnel model control system.
For the sealed gap configuration tested, the mast was
shortened by about 100mm at the base, and a plastic
sheet was applied to seal the wing foot with the solid
platform (see Figure 17).
The following testing procedure for the different
configurations was adopted:
Setup of the model: the turntable was fixed at a
certain AWA, the model was fixed at given heel
angle, the camber distribution was adjusted,
Dynamometer re-zeroed (function of the
acquisition software): due to the drift in the
experimental instruments after long runs, the
zero has to be reset. The strain gauges are
measuring an unsteady signal; therefore, the
data are sampled for a period of 10 seconds and
then the mean force block values are recorded.
In order to recreate the oscillation of the
measurements, before re-zeroing a small “kick”
was given to the model [9],
Wind ON: constant dynamic pressure mode
operated by the wind tunnel technician,
Wingsail trimming: due to the friction applied
by the lateral shrouds, the wind pressure was not
powerful enough to completely sheet out the
wing; hence, the wing was left at zero angle of
attack and started to be pulled from the zero lift
condition; with such a method it was possible to
record more data points,
Data acquisition: using Lasso software, each set
of sailing points (DF, HF, HM, YM) were
acquired for different trims. In order to obtain a
complete distribution of points in the CD/CL2
plot, the wingsail was trimmed in order to
acquire at least eight data points for each run
before stall is reached,
Wind OFF: the technician was shutting off the
tunnel’s fan when the set of data for a particular
run was completed (i.e. 8 data points acquired,
maximum driving force achieved and stall
appeared by looking at the tell tales),
End zero value: measured forces with the wind
completely stopped were acquired in order to
apply the end zero corrections (discussed in the
next chapter); the same “kick procedure”
explained for re-zeroing the dynamometer was
employed.
For completing a run, the average time requested is of
about 20 minutes. Longer run times should be avoided
due to the increase in the internal temperature of tunnel
which affects the measurements [10] [11] [12].
Tests without wing for the different configurations have
been conducted separately to acquire values for the
windage.
4.3 WIND TUNNEL CORRECTIONS
From the acquisition software Lasso the values for
driving force, heeling force and consequently heeling
moment and yawing moment were acquired. These raw
values need to be corrected. Firstly, the end zero
MAIN SHEET
CONTROL
FLAP ANGLE
FIXED

correction was employed, using the formula (for
instance, for the driving force):
.(11)
This correction is due to the drift in the dynamometer
load cells during a set of runs proved by the presence of
residual stresses after every run even after the wind in the
tunnel is off. Secondly, the forces need to be transformed
from the boat axisset at zero leeway angle on the
balance, to tunnel axis. The βA for the heeled condition
can be estimated as follows [13]:
( ). (12)
Reversing the above equation and (2) (3), lift and drag
coefficients are then calculated as (6) (7) by the forces
normalized by the sail area and the dynamic pressure:
this procedure is simplifying the analysis because the
algorithms adopted by the VPP are working with
coefficients in the plane normal to the mast.
Wall boundary and wake blockage corrections were
employed [6]:
, (13)
. (14)
δ is the downwash correction for the specific wind tunnel
(=0.09), AW is the wingsail area, and C is the tunnel cross
section area (=14,6m). The same correction routine
presented above has been adopted for the “wing only”
case (without windage), the only difference consisted in
subtracting the windage values (for DF, HF, HM, YM)
from the totalsbefore transforming the forces to
tunnelaxis.
4.4 EXPERIMENTAL UNCERTAINTY
In order to obtain the same characteristics in terms of
flow pattern between full scale and model scale, the
Reynolds number has to be the same:
, (15)
ν is function of the temperature of the air; therefore it
will change as the tunnel temperature increases (for
instance, after a long run). For this reason, the tests were
conducted at constant dynamic pressure mode. Knowing
that q is:
; (16)
the analysis with lift and drag coefficients can be
conducted without issues about air temperature changes.
Nevertheless, with the wind speeds used for sailing
yachts tests, the same Re as the full scale case can never
be achieved.. Screens are fitted to improve flow
uniformity which however remains uneven [14].
Four different dynamic heads at different wind speeds
have been tested measuring the forces generated at
βA=0deg. The result shows a dependency of the
measured forces with Re: on the x axis, the Re is
calculated using the maximum chord length of the
model; on the y axis, the driving force (Cx) and heeling
force (Cy) coefficients are obtained by normalizing the
forces by the wingsail area and q. The runs were
conducted in a short time and an average temperature of
310 was used for the kinematic viscosity of the air.
Figure 6: Reynolds number dependency study for driving
and heeling forces.
Due to the variety of configurations tested, the main
issue encountered was the control of the slot gap between
the two elements while the wingsail was cambered.
Moreover, due to the curved trailing edge of the second
element, a change in the camber results in an increase in
the slot gap. After several attempts, a solution for fixing
the flap angle was found: depending by which particular
twist was requested, little aluminium bars were applied
along the span fixing the hinges relatively to the first
element. Consequently, templates made out of cardboard
were taken for each different setting at different section
heights, in order to control any amount of variation in the
camber distribution during a run. The templates
guaranteed the possibility of repeating a particular
camber distribution after any number of runs with
different configurations.
5. RESULTS AND DISCUSSION
5.1 EFFECT OF HEEL
Tests were conducted for 3 different heel angles: 10, 20,
30 degrees. In Figure 7, DF versusHM ratio is reported in
the upwind case for the net configuration.

The optimum heel angle was found to be at ϕ=10 degrees
driving forces achieved at same heeling moments are
always higher at 10 degrees than for the higher angles.
The reason for that is mainly due to the reduction in the
βAwith heel,(eq. 12)::
being a cosine function, with an increase in heel (ϕ), the
AWA in the heeled condition decreases, reducing the
driving force generated by the wingsail.
Figure 7: βA=20deg, net platform, with windage
Other considerations might be undertaken concerning the
heel parameter by plotting CD vs.CL2 (Figure 8).
Figure 8: βA=20deg, no trampoline, with windage
The base drag is lower for ϕ=10deg (CD0=0.131). It
increases with higher heeling (CD0=0.137 at ϕ=20deg):
that is due to the smaller projected area of the bare hull in
the direction of the wind. After subtracting the windage
values, the base drags at different heel are similar, giving
consistency in the results [8].
The induce drag increases with the heel angle (CDI=0.048
at ϕ=10deg, to a value of 0.061 at ϕ=30deg): the
increased gap underneath the wing foot due to heel is
influencing the induced drag of the wingsail.
Tests conducted with an βA=25deg demonstrated that the
negative effect of heeling on the DF/HM ratio is less
sensible. In other words, during a downwind leg in which
the maximum thrust requirement will not be limited by
the HM, heeling at more than 10 degrees will not affect
negatively the performance as during an upwind leg.
5.2 EFFECT OF TRAMPOLINE POROSITY
Three different configurations were tested for the upwind
case: a solid platform made by an MDF panel, a net
trampoline made out of fabric with a 2mm spacing and
finally a configuration with neither net or platform. A
comparison is made, for a consistent βAof 20 deg, the
influence of these root geometries on the wing sail drive
force with windage for ϕ=30deg (Fig. 9) and the
optimum ϕ=10deg (Fig. 10). Figure 11 presents their
effect on induced drag and Fig 12 removes the effect of
windage on drive force.
At the optimum heel angle ϕ=10deg, the trampoline
without net is the best performer. At ϕ=30deg (Figure 9),
the solid trampoline generates higher DF than the “no-
net” platform. Moreover, the platform’s differences in
driving forces are more marked for the higher heel angle.
Figure 9: AWA=20deg, Φ=30deg, with windage
From the CD/CL2 plots a better understanding of what is
presentedabove it is achieved. At ϕ=10deg (Figure 10),
the induced drag of the “no-net” trampoline is smaller
(CDI=0.051); it is higher for the solid platform
(CDI=0.059) and the net configuration (CDI=0.054). The
small angle of heel allows the wingsail to operate close
to the wind tunnel floor; therefore, the effect of the solid
platform is not resulting in any advantage in terms of
reducing the gap underneath the wingsail foot. Instead,
the solid platform is disturbing the incoming flow at the
lower sections of the wing.

Figure 10: AWA=20deg, ϕ=10deg, with windage
The base drag of the “no-net” trampoline is smaller than
the other configurations for every heel angle: this trend is
more marked at ϕ=30deg (Figure 11) at which angle the
‘no-net’ base drag is CD0=0.13, whereas for the solid
platform it is CD0=0.16. The net platform is generating
the highest base drag (CD0=0.204). For all heel angles,
the net platform is the worst performer: the fabric net
deforms like a sail between the demihulls generating
parasitic drag without enhancing the lift of the sail.
Interestingly, at ϕ=30deg, the solid platform is presenting
the smaller CDI (=0.043) compared with the other
platforms. This result demonstrates that the solid
platform is generating an effective shield effect on the
wing foot decreasing the gap underneath it.
Figure 11: AWA=20deg, ϕ=30deg, with windage
Moreover, by plotting the DF vs.HM ratio without
windage at 30 degrees of heel, another consideration
about the solid platform emerges: the catamaran without
net is the best option (Figure 12). That implies that the
solid platform for high heeling angle is acting as a
longitudinal airfoil capable of generating a certain
amount of lift and consequently driving force.
Figure 12: AWA=20deg, ϕ=30deg, without windage
5.3 EFFECT OF CAMBER DISTRIBUTION
Different twist profiles have been tested simulating
upwind and downwind requirements. The results have
been compared with the “constant cambered”
configurations: 10 and 20 degrees respectively for
upwind and downwind sailing condition. Only the solid
platform at ϕ=10deg has been used for this batch of tests.
The wingsail constantly cambered at 20 degrees
performed better than the other twisted configurations
due to the untwisted flow of the wind tunnel; therefore,
results will not be discussed in this paper. However, it is
worth noting what influences the sail performance is the
relative twist to the on-set wind which is captured in this
work.
Table 3 shows the flap angle of two significant twist
profiles at different heights: the flap angle is intended
asthe angle between the longitudinal axis of the aft
element (cambered at 10 degress relatively to the fore
one) and the twist imposed with the hinge and track
system (Figure13)..
Table 3: Twisted profile settings
SECTIONS TWIST A [deg] TWIST B [deg]
tip -10 0
-5 0
middle 0 5
5 10
root 10 15
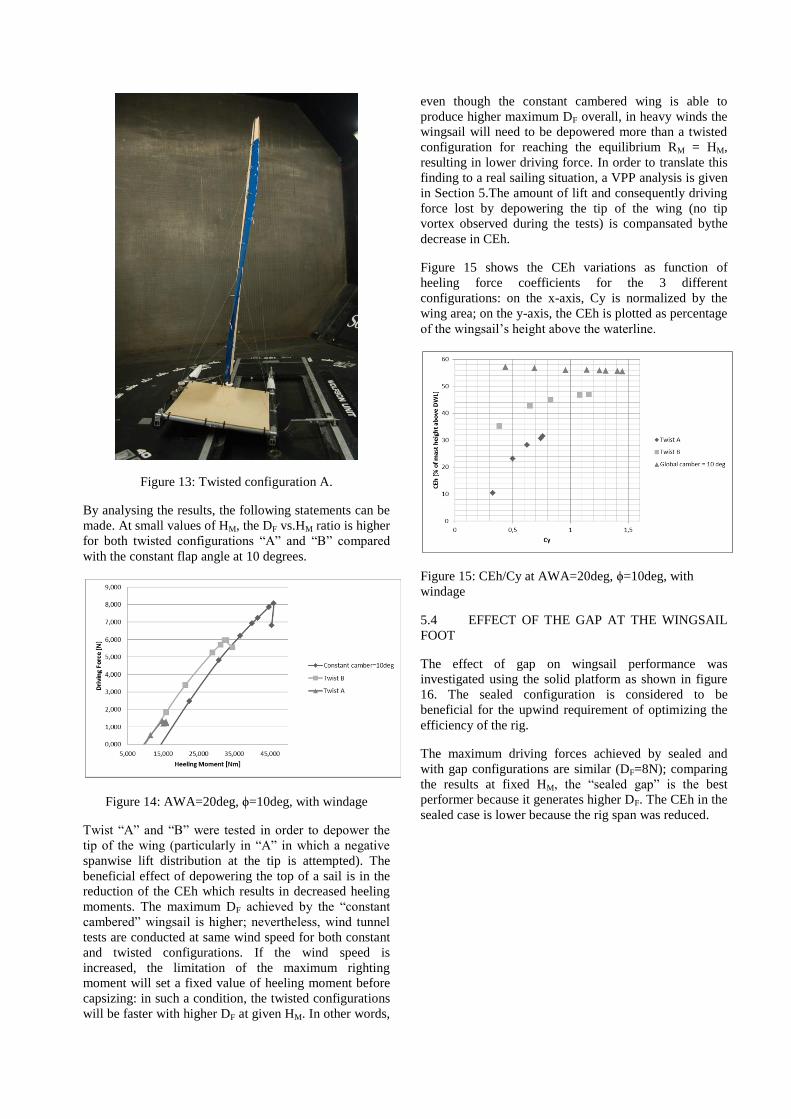
Figure 13: Twisted configuration A.
By analysing the results, the following statements can be
made. At small values of HM, the DF vs.HM ratio is higher
for both twisted configurations “A” and “B” compared
with the constant flap angle at 10 degrees.
Figure 14: AWA=20deg, ϕ=10deg, with windage
Twist “A” and “B” were tested in order to depower the
tip of the wing (particularly in “A” in which a negative
spanwise lift distribution at the tip is attempted). The
beneficial effect of depowering the top of a sail is in the
reduction of the CEh which results in decreased heeling
moments. The maximum DF achieved by the “constant
cambered” wingsail is higher; nevertheless, wind tunnel
tests are conducted at same wind speed for both constant
and twisted configurations. If the wind speed is
increased, the limitation of the maximum righting
moment will set a fixed value of heeling moment before
capsizing: in such a condition, the twisted configurations
will be faster with higher DF at given HM. In other words,
even though the constant cambered wing is able to
produce higher maximum DF overall, in heavy winds the
wingsail will need to be depowered more than a twisted
configuration for reaching the equilibrium RM = HM,
resulting in lower driving force. In order to translate this
finding to a real sailing situation, a VPP analysis is given
in Section 5.The amount of lift and consequently driving
force lost by depowering the tip of the wing (no tip
vortex observed during the tests) is compansated bythe
decrease in CEh.
Figure 15 shows the CEh variations as function of
heeling force coefficients for the 3 different
configurations: on the x-axis, Cy is normalized by the
wing area; on the y-axis, the CEh is plotted as percentage
of the wingsail’s height above the waterline.
Figure 15: CEh/Cy at AWA=20deg, ϕ=10deg, with
windage
5.4 EFFECT OF THE GAP AT THE WINGSAIL
FOOT
The effect of gap on wingsail performance was
investigated using the solid platform as shown in figure
16. The sealed configuration is considered to be
beneficial for the upwind requirement of optimizing the
efficiency of the rig.
The maximum driving forces achieved by sealed and
with gap configurations are similar (DF=8N); comparing
the results at fixed HM, the “sealed gap” is the best
performer because it generates higher DF. The CEh in the
sealed case is lower because the rig span was reduced.

Figure 16: AWA=20deg, ϕ=10deg, with windage
In Figure.17, the induced drag tested in the sealed
configuration is higher (CDI=0.065) than the wing with
the gap (CDI=0.057). In contrast with the classic lifting
line theory, where an elliptical spanwise lift distribution
and a sealed gap represents the best windward
performances [4], the wind tunnel tests demonstrate that
some practical implications have also to be taken into
account (sealing platform shape has to be studied in
combination with wingsail foot).
Figure 17: AWA=20deg, ϕ=10deg, with windage
The disturbed flow generated by the solid platform
affects the performance of the wingsail’s lower sections
causing early separation as observed by the tell tales
during the tests in Figure 18.
Figure 18: Wingsail foot depowered in sealed
configuration
Moreover, the “sealed gap” wingsail presents a smaller
base drag (CD0=0.13), probably due to the shorter rig: the
lower part of the wing is covered by the windward
demihull resulting in less total windage drag.
6 VPP WITH EXPERIMENTAL RESULTS
6.1 SCHERER VPP
A VPP based on results from wind tunnel tests requires
four values as a function of the AWA: CLMAX (Clx), CD
(Cdt), CEh (Zce), and effective span (Span Eff).
The CL/α plot from Scherer [10] shows that the wingsail
is stalling at an AoA above 30-35 degrees. Nevertheless,
wingsails can rotate on their base relative to the boat
frame of reference, changing the overall angle of attack.
The only limitation to this rotation is the position of the
lateral shrouds. Therefore, the AWA at which the stall
starts to occur does not coincide with the maximum AoA
before stall. The apparent wind angle can be increased by
easing the wingsail. In other words, by sheeting out the
wingsail, the angle of attack is kept at the optimum value
even if the AWA is increasing until the wingsail hit the
lateral shrouds. An increase of 30 degrees (βA=60
degrees) is estimated to be reasonable.

In the following table, the results for the double slotted
wingsail from Scherer are tabulated. The internal values
of Zce and Span Eff. used by the VPP for the initial run
have been adopted. In reality, both centre of effort and
effective heights will be different for the wingsail: the
assumption is made in absence of this data from Scherer.
As explained above, between 30 and 60 degrees, CL and
CD are kept approximately constant because the wing
will be eased in order to prevent stall.
Table 4: Scherer VPP experimental data
βA Clx Cdt Zce Span Eff
5 1 0.1 0.4866 1
20 2.1 0.38 0.4866 1
25 2.3 0.42 0.4866 1
30 2.4 0.42 0.4866 1
40 2.45 0.43 0.4866 1
60 2.35 0.5 0.4866 1
80 1.6 1 0.4866 1
120 0.8 2 0.4866 1
180 0 2.4 0.4866 1
The VPP fits a polynomial curve across the data points as
presented in Figure 19: the solution algorithm starts to
use the values of CLMAX; once the sail is generating too
high heel force (i.e. HM>RM), a smaller CL of the
polynomial fitting is used until the boat reach a steady
state sailing condition (i.e. HM=RM).
In order to do that, the VPP needs values in the range of
βA=0–180deg: the underlined values of Table 4 are
considered reasonable values to cover the range of
AWAs requested for the interpolation.
Figure 19: Scherer VPP polynomial fit
Figure 20: Scherer VPP
Windage components are associated with internal “shape
function” in the VPP, which resolve the aerodynamic
drag force into resistance and side force in yacht
coordinate. Comparing “Scherer VPP” with the initial
VPP setup (Figure 2), the former identifies faster
performance for heavy winds (above 12 knots) when
sailing off the wind. Considering that same values of
flotation, CEh and Eff. Span. heights have been used, the
reason for this behaviour is that the wingsail maximum
CL is maintained constant for higher AWAs as was
explained previously. For the double sail area VPP,
above βA=25deg, the sail starts to generate less lift
whereas the drag keeps increasing. The mast, which is
effectively the leading edge of the main, for higher
AWAs produces more turbulence on the leeward side of
the sail decreasing the lift generated [15].
6.2 WIND TUNNEL VPP
The results from the wind tunnel indicate that the
wingsail used for the tests [5] does not achieve the high
lift expected for a wing with a slotted flap. This is
probably due to a poor manufactory over the slot opening
between the elements. It was therefore necessary to
“manipulate” the results in a sensible way in order to
compare the velocity predictions with Scherer VPP.
Two different VPPs were run from the experimental
results of the present research: a VPP with the wing at
constant camber of 10-20 (respectively for upwind and

for downwind) and the twisted configuration “B” in
order to predict which value of VT marks the trade-off in
performances between the constant cambered wingsail
and the wing depowered at the tip.
For the constant cambered wing VPP, the following
assumption was made: the CLMAX found by Scherer was
used to calculate the values of CD by knowing the
equation of the CD/CL2 straight line from the tunnel
experiments.
With values of CL and CD “scaled up” while maintaining
the same CDI and CDO for the AWAs of 20, 25, 30
degrees, the assumption used for “Scherer VPP”
(retarding the stall value of additional 30 degrees) is
repeated. For the remaining AWAs the same typical
values” for Scherer VPP are employed. The centre of
effort heights and the effective span are the ones obtained
in the tests. The following table represents the
experimental data used in the VPP:
Table 5: Experimental data for wind tunnel VPP
βA Clx Cdt Zce Span Eff
5 1 0.100 0.61 0.93
20 2.1 0.396 0.54 0.93
25 2.3 0.499 0.53 0.89
30 2.4 0.540 0.51 0.88
40 2.45 0.540 0.51 0.88
60 2.35 0.580 0.51 0.88
80 1.6 1.000 0.51 0.88
120 0.8 2.000 0.51 0.88
180 0 2.400 0.51 0.88
The VPP results are presented in Figure 21 as a polar
diagram. The overall predictions are not affected because
the AWAs that result in best VMG downwind are all
below βA=60deg. Comparing the results with the
“Scherer VPP the two different VPP configurations reach
similar boat speeds VS.
Figure 21: Wind tunnel VPP
It is considered that the“Scherer VPP” results are faster
than the “constant cambered” wingsail for the following
reasons. Firstly, the former CEh, taken from the internal
VPP values for a soft sail with same dimensions, is lower
than the latter case; in terms of performances this results
in the possibility of using a bigger percentage of the
maximum thrust achievable without the need of
flattening or twisting the wingsail. This is confirmed by
comparing the tables of best flattening function for the
optimum VMG of the two VPPs.
Table 6: Upwind best flattening for "wind tunnel VPP"
and "Scherer VPP"
VT [knots] Constant camber Scherer
4 1 1
6 0,993 1
8 0,877 0,936
10 0,667 0,718
12 0,535 0,577
14 0,442 0,486
16 0,374 0,413
20 0,293 0,327
“Scherer VPP” flattening function is higher for every
wind speed: the CLMAX is exploited better than the VPP
using the tunnel data. Secondly, the induced drag
measured in the tests is higher than the Scherer’s
wingsail, resulting in higher total drag generated by the

wing which clarifies the reason for the bigger differences
in VS in the upwind case.
For the twisted configuration “B”, a different VPP has
been set: the values of CLMAX, CD using the equation of
the straight line of CD/CL2 are used. CEh and effective
span have been calculated in the experimental tests.
The experimental values used in the VPP’s run are:
Table 7: Experimental data used for "Twist B" VPP
βA Clx Cdt Zce Span Eff
5 1 0.10 0.61 0.88
20 2.1 0.43 0.46 0.88
25 2.3 0.52 0.46 0.82
30 2.4 0.58 0.43 0.85
40 2.45 0.58 0.43 0.85
60 2.35 0.61 0.43 0.85
80 1.6 1.00 0.43 0.85
120 0.8 2.00 0.43 0.85
180 0 2.40 0.43 0.85
By estimating the race course of the LAC 2013 [3], it is
possible to define at which VT the constant cambered
wing has to be adjusted into the twisted configuration
“B” to achieve better performances.
Figure 22: Sample Race track LAC 2013
The “constant cambered wingsail” and the twisted
configuration “B” were sailed by the VPP along the new
course of the LAC; the times in decimal minutes
requested to finish the race for different VT are reported
in Table 8.
Table 8: Minutes to complete one lap for "Constant
Cambered" and "Twist B" wingsail
VT
[knots] Constant camber [min
of race] Twist B [min of
race]
4 137.3 142,0
6 88.6 91,7
8 66.6 67,9
10 55.2 54,7
12 44.9 44,6
14 41.1 39,0
20 35.7 32,4
From VT=10knots (medium wind speed) the twisted
configuration starts to prevail against the constant
cambered wingsail. Moreover, as the breeze increases,
the advantage around the track of the twisted
configuration is higher.
7. CONCLUSIONS
The flexible catamaran rig with adjustable twist wingsail
proved a viable method of answering specific design
questions relevant to wing sail based high performance
yachts. Specific conculsions are as follows
(i) The heel angle reduces the performances of the
catamaran, the optimum heel angle was found to be the
flying angle (10 degrees) at which the windward
demihull just sails clear of the water. Nevertheless,
experiments have shown that downwind sailing is not
affected by the heel angle to such a great extent as
upwind.
(ii) The upwind experiments showed a decreased
induced drag for lower heel angles. The gap underneath
the wingsail influencing performance. The importance of
the gap is more marked in the tests conducted at 30
degrees of heel: the trampoline with the solid platform
resulted in smaller induced drag. In other words, by using
a solid trampoline to maintain constant the gap
underneath the wing foot, the performances at high heel
angle increases.
(iii) The platform without the net was demonstrated
to be the best option in terms of maximising drive force
generated. The reason for this is the reduced drag of the
trampoline. It is author’s opinion that having a solid
trampoline, able to generate a certain amount of lift in the
direction of water, will produce righting moment useful
in strong winds conditions. By adjusting the camber of
the trampoline for light winds, lift can be generated to fly
the windward hull. Nevertheless, the possibility of using
a solid trampoline designed with an airfoil shape can be
investigated in future research.
(iv) As found in the experiments and confirmed in
the VPP analysis, a negative spanwise lift distribution at
the tip of the wing is beneficial for upwind strong wind
conditions.
(v) Sealing the gap underneath the wing foot did not
improve the performances mainly due to the disturbed
flow towards the wingsail’s lower sections generated by

the flying demihull. A visualization of the flow in wind
tunnel (or CFD simulations) could have been beneficial
to the understanding of the interaction and it should be
motivation for future work in this area.
REFERENCES
1. Wellicome J. F., Some Comments on the
Relative Merits of Various Wind Propulsion Devices.
Journal of Wind Engineering and Industrial
Aerodynamics, 20(1985) 11-142, Amsterdam.
2. Traut, T. et all, Propulsive power contribution of
a kite and a Flettner rotor on selected shipping routes.
Applied Energy 113, pp362-372, 2014
3. MacLane D.T., The Cogito project: design and
development of an International C-Class Catamaran and
her successful challenge to regain the Little America’s
Cup. The 13th Chesapeake Sailing Yacht Symposium,
Annapolis, 2000.
4. Claughton, A. Wellicome, J., Shenoi, A., Sailing
Yacht Design: Theory. Henry Ling Ltd, Dorset, 2006.
5. Scherer, J. Otto, Aerodynamics of high
performance wing sails, SNAME CSYS, Annapolis,
1974.
6. Viola, I.M., et all, Upwind sail aerodynamics: A
Rans numerical investigation validated with wind tunnel
pressure measuraments. International Journal of Heat and
Fluid Flow (2012).
7. Wood, C.J., Tan, S. H., Towards an optimum
yacht sail. Journal of Fluid Mechanics, vol. 85, part 3,
pp. 459-477, 1978.
8. Andrews, T. et all, Multihull America’s Cup.
Group Design Project: University of Southampton,
Southampton, 2011.
9. YET Lecture Notes, MSc in “Yacht and Small
Craft”: University of Southampton, 2011.
10. Campbell, I.M.C., Optimization of a sailing rig
using wind tunnel data. SNAME 13th Chesapeake
Sailing Yacht Symposium, Annapolis, 1997.
11. Campbell, I.M.C., The performances of off-
wind sails obtained from wind tunnel tests. R.I.N.A.
International Conference on modern Yacht, London,
1998.
12. Campbell, I.M.C., Claughton A.R., Wind tunnel
testing of sailing yacht rigs. 13th HISVA symposium,
Amsterdam, 1994.
13. Jackson, P.S., Modelling the aerodynamics of
upwind sails. Journal of Wind Engineering and Industrial
Aerodynamics 63, 1996.
14. Campbell, I.M.C., A comparison of downwind
sail coefficients from tests in different wind tunnels.
Innov’Sail, Lorient, 2013.
15. Gentry, A., Studies of Mast Section
Aerodynamics. In: Proceedings of the 7th AIAA
Symposium on the Aero/Hydronautics of Sailing, Long
Beach, California, 1976.


![INDEX [ ] · PDF filerudder-design calculations ... bearing carrier, photo.....527 ... fractional sailplan, drawing....497 keel casing, photos](https://img.pdfslide.net/doc/110x75/5aa194617f8b9ac67a8bf8f5/index-calculations-bearing-carrier-photo527-fractional-sailplan.jpg)