Embed Size (px)
Citation preview

Vol. 66: 213-280. 1991 ~ MARINE ECOLOGY PROGRESS SERIES Mar. Ecol. h o g . Ser.
1 Published January 24
Particle aggregation during a diatom bloom. I. Physical aspects
Ulf Riebesell
Alfred Wegener Institute for Polar and Marine Research, Columbusstr., D-2850 Bremerhaven, Germany
ABSTRACT. Aggregate size and abundance were monitored in situ at a fixed station in the southern North Sea d u r ~ n g a 6 wk investigation which covered the phytoplankton spring bloom and the pre- and post-bloom periods. Particle aggregates were abundant dunng the entire period of study. Biologically derived material, such a s algal cells, played a central role in aggregate formation. Maximum total aggregate volume coincided with the peak of the bloom. Maximum aggregate size did not correlate with either phytoplankton biomass or total suspended matter Despite a distinct increase in the amount of aggregated material during the development of the bloom, maximum aggregate size remained at about 1 mm diameter during most of the investigation. The formation of large, marine-snow-sized aggregates up to 5 cm in longest dimension, which was restricted to a short period following the decline of the phytoplankton bloom, coincided with comparatively low shear rates. Results are consistent with physical coagulation models. Aggregate formation can be described by a 2-state system in which the amount of aggregated matter is low dunng the development and following the decline of a bloom, and high during the peak of a bloom.
INTRODUCTION
A significant portion of the suspended matter In the ocean exists in the form of aggregates which are com- prised of organic detritus, inorganic particles, and microorganisms (Riley 1963). Although large particles are far less abundant than fine suspended particulates (McCave 1984), their importance for the vertical trans- port of material is wldely recognized (McCave 1975, Honjo et al. 1984, Fowler & Knauer 1986, Asper 1987, Alldredge & Gotschalk 1988). The existence of large, marine-snow-sized particles has been demonstrated for both open ocean areas (e.g. Trent et al. 1978, All- dredge 1979, Silver & Alldredge 1981), and coastal and estuarine environments of high turbidity (Eisma et al. 1983, Wells & Shanks 1987). Recent investigations have emphasized the importance of biological processes for the formation of marine snow. As hypothesized by Smetacek (1985), mass aggregation of diatoms was observed during phytoplankton blooms (Kranck & Mil- ligan 1988, Alldredge & Gotschalk 1989, Riebesell 1989).
The rate of formation of algal flocs depends on parti- cle size, concentration, and stickiness, as well as the mechanisms responsible for particle collision, such as Brownian motion, differential settlement and shear
O Inter-Research/Printed in Germany
(Jackson 1990). As the effect of Brownian motion is small for particles much larger than 1 vm (McCave 1984), differential settlement and shear are the most important mechanisms determining the particle colli- sion rate during a phytoplankton bloom. While differ- ential settlement is a function of particle size and sink- ing rate, shear depends on the tubulent energy pres- ent in the water column. In the absence of detectable turbulence, differential settlement was observed to induce a rapid mass flocculation of a diatom bloom (Alldredge & Gotschalk 1989). In highly energetic environments such as the southern North Sea, where turbulent energy in the water column is repeatedly generated by tidal currents and wind stress, shear can become the dominant mechanism controlling both particle aggregation and break-up. It is hypothesized herein that under such conditions, aggregate forma- tion can be a continuous process rather than a short- term event.
In this study, aggregate size and abundance were monitored over the course of a phytoplankton spring bloom at a fixed station in the German Bight, North Sea. The state of particle aggregation was related to both physical conditions in the water column, and to the development and decline of the phytoplankton bloom.
274 Mar. Ecol. Prog. SE
MATERIAL AND METHODS
Study location and sampling procedure. From 18 April to 1 June 1989, a station 2.5 nautical miles west of Helgoland Island (German Bight, North Sea; 54" 11.49' N, 7" 48.73' E) was sampled 8 times at intervals ranging between 3 and 11 d. The sampling pattern was deter- mined by both the availability of a boat and divers, and the weather conditions. The station, which is located outside the area directly influenced by tidal currents surrounding Helgoland, has a water depth of 36 m. During each sampling procedure, seawater was col- lected with 10 1 Nislun bottles from 1, 10, 20 and 30 m depth to determine chlorophyll a concentration and total supended matter (TSM). Temperature and salinity profiles of the water column were taken with a WTW LF 191 conductometer. Wind speed data, measured at a weather station on Helgoland 15 m above sea level at 10 min intervals, were provided by the 'Deutscher Wetterdienst'.
In situ determination of aggregate size and abun- dance was achieved by using a NIKONOS-V under- water camera system equipped with a 1:2.5/35 mm Nikkor lens, a Sea & Sea 1 : l extension tube (35 M- l ) , and a Marlin IH flash strobe. Similar to a camera system developed by Landmann (1988), a dark PVC tubing (one side closed by a pane of glass) was mounted on the objective and filled with distilled water to avoid interference from particles located between the camera lens and the volume in focus. Using a very fine-grained, high contrast film (Agfaortho 25, Agfa- Gevaert), 36 exposures were taken randomly at 10 m water depth during each dive. Care was taken not to disturb the water in front of the lens by either the diver or the camera system.
Laboratory analyses. For the determination of chlorophyll a, 500 m1 of sample water were filtered onto 25 mm Whatman GF/C glass fiber filters. After extrac- tion in 90 % acetone (filters were homogenized with glass beads), the chlorophyll a concentration was measured using standard fluorometric methods (Par- sons et al. 1984). TSM was determined by filtering 2 1 of sample water onto prewashed and preweighed 0.45 ym cellulose acetate membrane filters. The filters were rinsed with distilled water, dried for 12 h at 40 'C, cooled in a desiccator and weighed on a Sartorius 1602 MP microbalance to the nearest 0.1 mg. For the deter- mination of phytoplankton cell numbers, 50 m1 water samples preserved with Lugol's iodine solution were analysed using the inverted microscope method of Utermohl (1958).
For the determination of aggregate size and abun- dance, 6 randomly selected in situ photographs from each sampling day were analysed. Each photograph represented a volume of ca 34 cm3 (27.4 mm height X
41.1 mm width X 30.0 mm depth of focus). The number and size of particles > 100 ym were determined by analysing the negatives under a dissecting microscope. For the calculation of the particle volume (as the equi- valent spherical diameter, ESD), an oval to round shape was assumed for the aggregates, with the third dimen- sion (particle depth) being equivalent to the shorter of the 2 dimensions depicted in the photographs. For large, irregularly-shaped aggregates, the volume was determined by estimating and summing the volumes of evenly-shaped subunits. On the basis of their equiva- lent spherical diameter, aggregates were assigned to size classes in steps of 100 pm wldth. The aggregate volume of each size class is the product of the average volume ( V , ) and the number of aggregates (Ni) in size class i. The total aggregate volume (TAV) is the sum of volumes in each size class:
jmar
TAV = Ni V, i = l
Using the particle size (d, diameter) to density (p) relationship formulated by McCave (1984), where logp = 1.487 - 1.299 log d, the aggregate volume of the different size classes was converted to suspended mat- ter dry weight. Summing over all size classes yielded a total aggregate mass (g dry weight m-3) of all particu- late material > 100 him ESD.
RESULTS
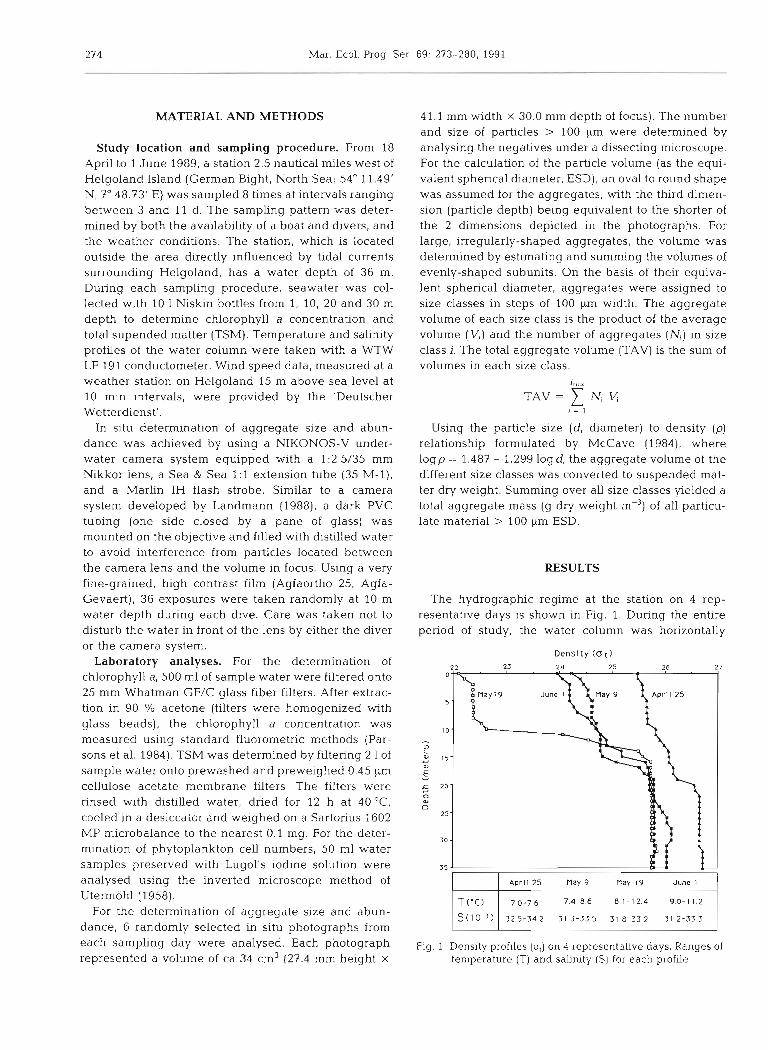
The hydrographic regime at the station on 4 rep- resentative days is shown in Fig. 1. During the entire period of study, the water column was horizontally
D e n s i t y (ot) 22 23 2 4 25 26 27
0
5
10
m L
5 15 m E U
5 20 a m 0
25
30
35
Aprll 25 Play 9 nay 19 June I
Fig. 1. Density profiles (U,) on 4 representative days. Ranges of temperature (T) and salinity (S) for each profile
Riebesell: Aggregation during a diatom bloom. I. 275
stratified. The salinity of the upper layer varied between 28.5 and 32.6 %o, and was consistently 1.5 to 2 %O lower than that of the bottom layer. Temperature stratification started during the last week of April and persisted until the end of the study. The upper mixed layer temperature gradually increased from 6.9 "C in mid-April to 13.8 "C at the end of May. Two distinct events of horizontal advection were encountered, one during the last week of April, the second at the end of May. In both cases, consistent northwesterly winds resulted in an inflow of surface water from the outer North Sea. The average daily wind speed fluctuated between about 2 and 9 m S-' (Fig. 2). Two 1 wk
0 15 20 25 3 0 5 10 15 20 25 10 4
Apr l I may June
Fig. 2. Average daily wind speeds measured at a station on Helgoland 15 m above sea level. Bar represents period when
large marine-snow-sized aggregates were found
intervals of comparatively low wind speeds occurred during the first and third weeks of May.
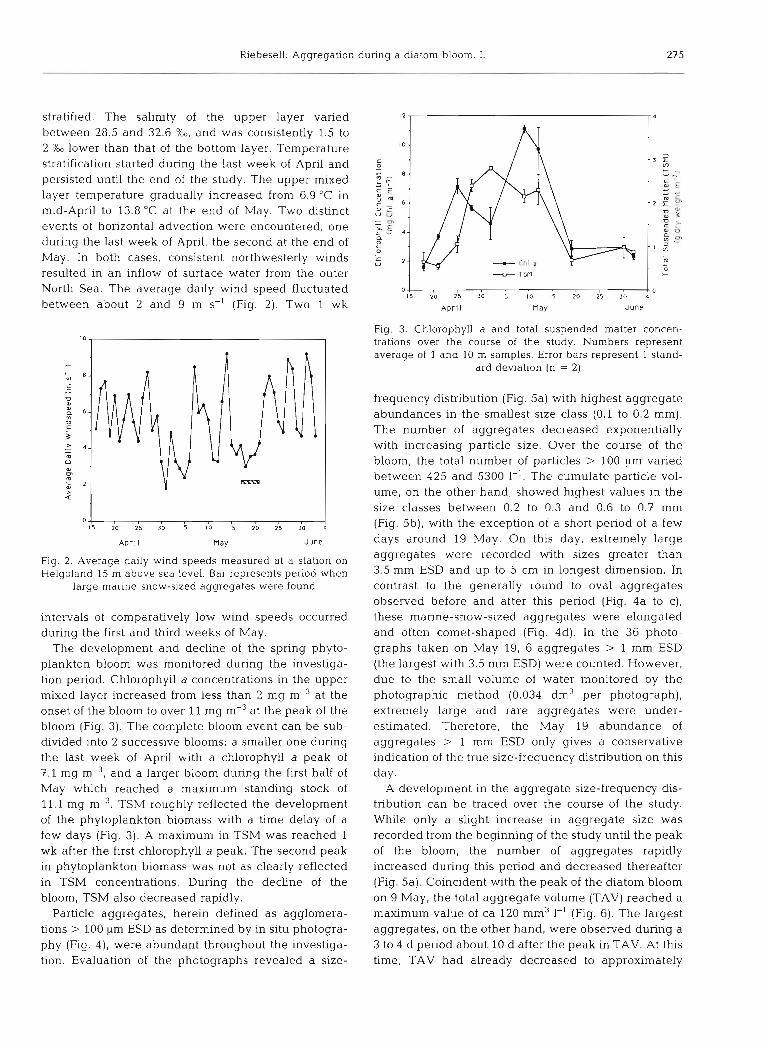
The development and decline of the spring phyto- plankton bloom was monitored during the investiga- tion period. Chlorophyll a concentrations in the upper mixed layer increased from less than 2 mg m-%t the onset of the bloom to over 11 mg m-3 at the peak of the bloom (Fig. 3). The complete bloom event can be sub- divided into 2 successive blooms: a smaller one during the last week of April with a chlorophyll a peak of 7.1 mg m-3, and a larger bloom during the first half of May which reached a maximum standing stock of 11.1 mg m". TSM roughly reflected the development of the phytoplankton biomass with a time delay of a few days (Fig. 3). A maximum in TSM was reached 1 wk after the first chlorophyll a peak. The second peak in phytoplankton biomass was not as clearly reflected in TSM concentrations. During the decline of the bloom, TSM also decreased rapidly.
Particle aggregates, herein defined as agglomera- tions > 100 pm ESD as determined by in situ photogra- phy (Fig. 4), were abundant throughout the investiga- tion. Evaluation of the photographs revealed a size-
0 L 0 l 5 20 25 30 5 10 15 20 25 JO 4
ADrf I nay June
Fig. 3. Chlorophyll a and total suspended matter concen- trations over the course of the study. Numbers represent average of 1 and 10 m samples. Error bars represent 1 stand-
ard deviation (n = 2)
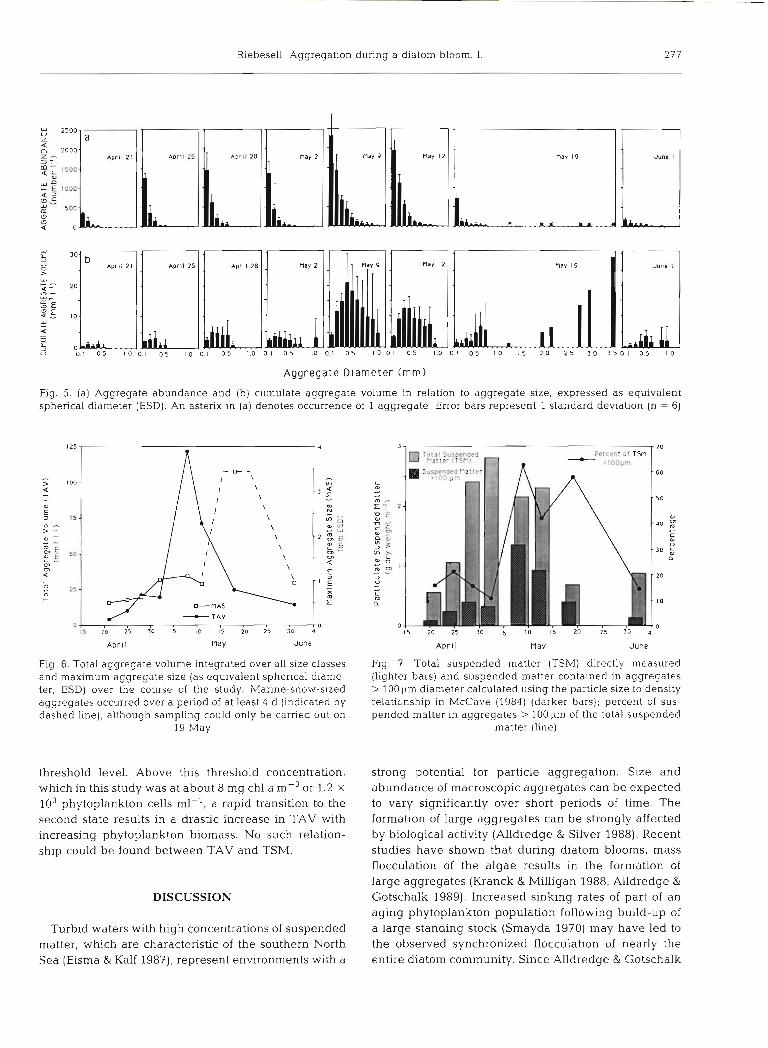
frequency distribution (Fig. 5a) with highest aggregate abundances in the smallest size class (0.1 to 0.2 mm). The number of aggregates decreased exponentially with increasing particle size. Over the course of the bloom, the total number of particles > 100 pm varied between 425 and 5300 I-'. The cumulate particle vol- ume, on the other hand, showed highest values in the size classes between 0.2 to 0.3 and 0.6 to 0.7 mm (Fig. 5b), with the exception of a short period of a few days around 19 May. On this day, extremely large aggregates were recorded with sizes greater than 3.5 mm ESD and up to 5 cm in longest dimension. In contrast to the generally round to oval aggregates observed before and after this period (Fig. 4a to c), these marine-snow-sized aggregates were elongated and often comet-shaped (Fig. 4d). In the 36 photo- graphs taken on May 19, 6 aggregates > 1 mm ESD (the largest with 3.5 mm ESD) were counted. However, due to the small volume of water monitored by the photographic method (0.034 dm3 per photograph), extremely large and rare aggregates were under- estimated. Therefore, the May 19 abundance of aggregates > 1 mm ESD only gives a conservative indication of the true size-frequency distribution on this day.
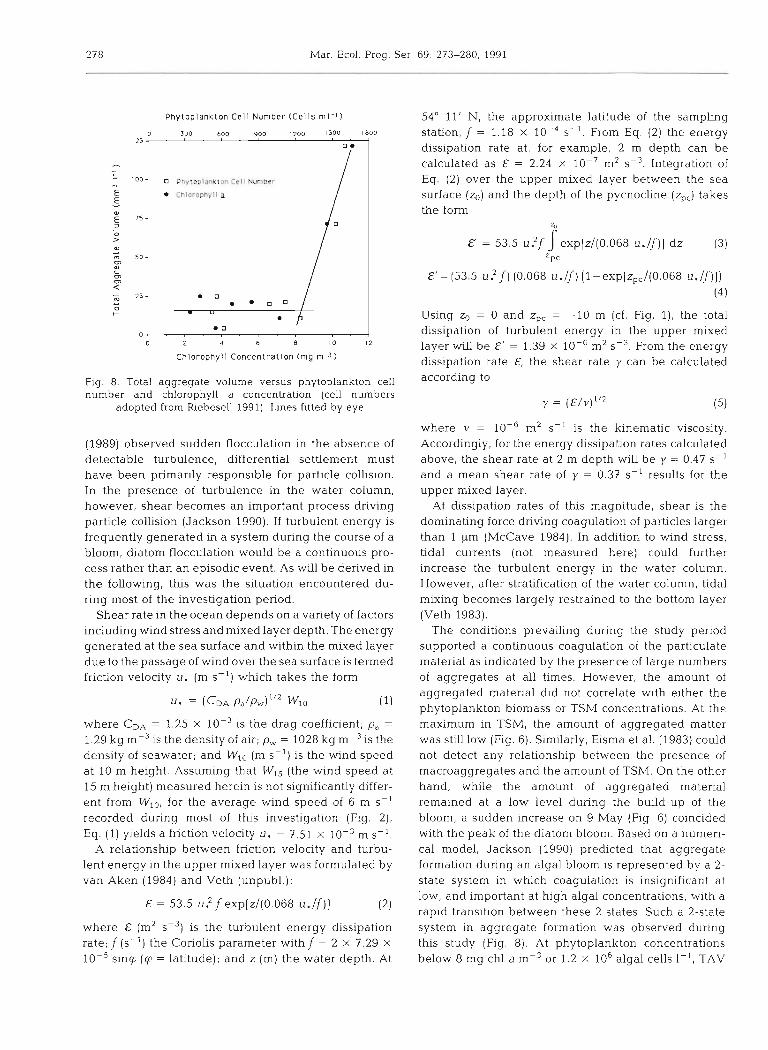
A development in the aggregate size-frequency dis- tribution can be traced over the course of the study. While only a slight increase in aggregate size was recorded from the beginning of the study until the peak of the bloom, the number of aggregates rapidly increased during this period and decreased thereafter (Fig. 5a). Coincident with the peak of the diatom bloom on 9 May, the total aggregate volume (TAV) reached a maximum value of ca 120 mm3 1-I (Fig. 6). The largest aggregates, on the other hand, were observed during a 3 to 4 d period about 10 d after the peak in TAV. At this time, TAV had already decreased to approximately

Mar. Ewl. Prog. Ser. 69: 273-280, 1991
Fig. 4. In situ photographs taken in 10 m depth depicting LypLcal stages in the development of the aggregate size-frequency distribution. (a) 28 April, pre-bloom situation; (b) 9 Mav, peak of the phytoplankton bloom; (c] 1 June, post-bloom situation; (d) 19
May, marine-snow-sized aggregate. All photographs are on the same scale. Bar = 10 mm
one-fifth of its peak value (Fig. 6; 19 May). Prior to and d ~ m n g this period, weather condit~ons were exception- ally calm with wind speeds of ca 3.5 m s-' (Fig 3).
Using the particle size to denslty re1ationshi.p formu- lated by McCave (1984), the aggregate volume was converted into suspended matter dry weight and com- pared to the directly measured TSM. As shown in Fig 7 , TSM and aggregated matter did not vary pro- portionately Whereas aggregated matter comprised less than 20 YO of TSM before and after the phytoplank-
ton bloom, up to 63 YO of the TSM was concentrated in particles > 100 LLm durlng the peak of the bloom. The high percentages of aggregated matter coincided with the decline of TSM, indicating that the enhanced aggregation of suspended matter may have increased the downward flux of TSM.
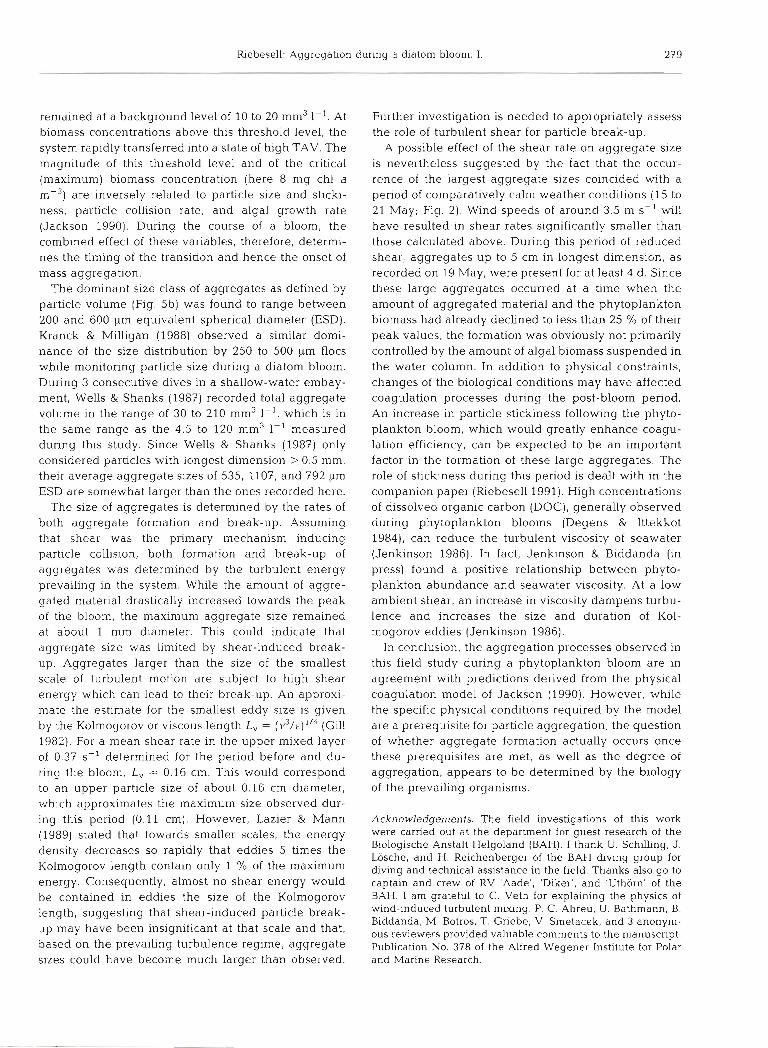
TAV as a function of chlorophyll a concentration and phytoplankton cell number (Fig. 8) displays a 2-state system in which aggregate volume is small at phyto- plankton biomass concentrations below a certain
Riebesell: Aggregation during a diatom bloom. 1.
Aggregate Diameter (mm)
Fig. 5. (a) Aggregate abundance and (b) cumulate aggregate volume in relation to aggregate size, expressed as equivalent spherical diameter (ESD). An asterix in (a) denotes occurrence of 1 aggregate. Error bars represent 1 standard deviation (n = 6)
125-
- > 100- 4 t. 0,
5 73- W
0 - > - 2 z
50- L
0) 0)
4 - m 2 5 - 0 k-
A n A S - T A V D., , , , , , , , , , r O
l $ 20 25 30 5 l 0 15 20 25 30
Fig. 6. Total aggregate volume integrated over all size classes and maximum aggregate size (as equivalent spherical diame- ter, ESD) over the course of the study. Manne-snow-sized aggregates occurred over a period of at least 4 d (indicated by dashed line), although sampling could only be carried out on
19 May
threshold level. Above this threshold concentration, which in this study was at about 8 mg chl a mP3 or 1.2 X
lo3 phytoplankton cells ml-', a rapid transition to the second state results in a drastic increase in TAV with increasing phytoplankton biomass. No such relation- ship could be found between TAV and TSM.
DISCUSSION
Turbid waters with h g h concentrations of suspended matter, which are characteristic of the southern North Sea (Eisma & Kalf 1987), represent environments with a
,v
Percent o t TSM - rlooum - 60
- 50
0,
- 4 0 g U
C U U
-30 P
- 20
- l0
D
Aprl l n a y June
Fig. 3 . Total suspended matter (TSM) directly measured (lighter bars) and suspended matter contained in aggregates > 100 diameter calculated using the particle size to density relationship in AlIcCave (1984) (darker bars); percent of sus- pended matter in aggregates > 100 pm of the total suspended
matter (line)
strong potential for particle aggregation. Size and abundance of macroscopic aggregates can be expected to vary significantly over short periods of time. The formation of large aggregates can be strongly affected by biological activity (Alldredge & Silver 1988). Recent studies have shown that during diatom blooms, mass flocculation of the algae results in the formation of large aggregates (Kranck & Milligan 1988, Alldredge & Gotschalk 1989). Increased sinking rates of part of an aging phytoplankton population following build-up of a large standing stock (Smayda 1970) may have led to the observed synchronized flocculation of nearly the entire diatom community. Since Alldredge & Gotschalk
278 Mar. Ecol. Prog. Ser
P h y t o p l a n k t o n Cel l Number (Cells m l - l )
C h l o r o p h y l l C o n c e n t r a t i o n ( m g m-3 )
Fig. 8. Total aggregate volume versus phytoplankton cell number and chlorophyll a concentration (cell numbers
adopted from Riebesell 1991). Lines fitted by eye
(1989) observed sudden flocculation in the absence of detectable turbulence, differential settlement must have been primarily responsible for particle collision. In the presence of turbulence in the water column, however, shear becomes an important process driving particle collision (Jackson 1990). If turbulent energy is frequently generated in a system during the course of a bloom, diatom flocculation would be a continuous pro- cess rather than an episodic event. As will be derived in the following, t h s was the situation encountered du- ring most of the investigation period.
Shear rate in the ocean depends on a variety of factors including wind stress and mixed layer depth. The energy generated at the sea surface and within the mixed layer due to the passage of wind over the sea surface is termed friction velocity U. (m S - ' ) which takes the form
where CD, = 1.25 X I O - ~ is the drag coefficient; p, =
1.29 kg m-3 is the density of air; p , = 1028 kg m-3 is the density of seawater; and W,, (m S- ' ) is the wind speed at 10 m height. Assuming that WI5 (the wind speed at 15 m height) measured herein is not significantly differ- ent from Wlo, for the average wind speed of 6 m s-' recorded during most of this investigation (Fig. 2), Eq. (1) ylelds a friction velocity U . - 7.51 X 1 0 - ~ m S- ' .
A relationship between friction velocity and turbu- lent energy in the upper mixed layer was formulated by van Aken (1984) and Veth (unpubl.) :
where E (m2 sC3) is the turbulent energy dissipation rate; f (S l ) the Coriolis parameter with f = 2 X 7.29 X
I O - ~ slnq (q = latitude); and z (m) the water depth. At
54" 11' N, the approximate latitude of the sampling station, f = 1.18 X I O - ~ S- ' . From Eq. (2) the energy dissipation rate at , for example, 2 m depth can be calculated as E = 2.24 X I O - ~ m2 s - ~ . Integration of
Eq. (2) over the upper mixed layer between the sea surface (zo) and the depth of the pycnocline (z,,) takes the form
7,)
E = 53.5 df explz/(0.068 u./f)] dz (3) "pc
Using zo = 0 and z,, = -10 m (cf. Fig. l ) , the total d~ss ipa t~on of turbulent energy in the upper mixed layer will be E' = 1.39 X 10-' m2 sC3. From the energy dissipation rate E, the shear rate y can be calculated according to
where v = 1 0 - ~ m2 S-' is the kinematic viscosity. Accordingly, for the energy dissipation rates calculated above, the shear rate at 2 m depth will be y = 0.47 S- '
and a mean shear rate of y = 0.37 S-' results for the upper mixed layer.
At dissipation rates of this magnitude, shear is the dominating force dnving coagulation of particles larger than 1 ym (McCave 1984). In addition to wind stress, tidal currents (not measured here) could further increase the turbulent energy in the water column. However, after stratification of the water column, tidal mixing becomes largely restrained to the bottom layer (Veth 1983).
The conditions prevailing during the study period supported a continuous coagulation of the particulate material as indicated by the presence of large numbers of aggregates at all times. However, the amount of aggregated material did not correlate w t h either the phytoplankton biomass or TSM concentrations. At the maximum in TSM, the amount of aggregated matter was still low (Fig. 6). Similarly, Eisma et al. (1983) could not detect any relationship between the presence of macroaggregates and the amount of TSM. On the other hand, while the amount of aggregated material remained at a low level during the bulld-up of the bloom, a sudden increase on 9 May (Fig. 6) coincided with the peak of the diatom bloom. Based on a numeri- cal model, Jackson (1990) predicted that aggregate formation during an algal bloom is represented by a 2- state system in w h c h coagulation is insignificant at low, and important at high algal concentrations, with a rapid transition between these 2 states. Such a 2-state system in aggregate formation was observed during this study (Fig. 8). At phytoplankton concentrations below 8 mg chl a m-3 or 1.2 X 10⁶ algal cells I - ' , TAV
Rlebesell: Aggregation during a diatom bloom. I.
remained at a background level of 10 to 20 mm3 1-l. At biomass concentrations above this threshold level, the system rapidly transferred into a state of high TAV. The magnitude of this threshold level and of the critical (maximum) biomass concentration (here 8 mg chl a m-3) are inversely related to particle size and sticki- ness, particle collision rate, and algal growth rate (Jackson 1990). During the course of a bloom, the combined effect of these variables, therefore, determi- nes the timing of the transition and hence the onset of mass aggregation.
The dominant size class of aggregates as defined by particle volume (Fig. 5b) was found to range between 200 and 600 pm equivalent spherical diameter (ESD). Kranck & Milligan (1988) observed a similar domi- nance of the size distribution by 250 to 500 pm flocs while monitoring particle size during a diatom bloom. During 3 consecutive dives in a shallow-water embay- ment, Wells & Shanks (1987) recorded total aggregate volume in the range of 30 to 210 mm3 1-l, which is in the same range as the 4.5 to 120 mm3 1-' measured during this study. Since Wells & Shanks (1987) only considered particles with longest dimension > 0.5 mm, their average aggregate sizes of 535, 1107, and 792 pm ESD are somewhat larger than the ones recorded here.
The size of aggregates is determined by the rates of both aggregate formation and break-up. Assuming that shear was the primary mechanism inducing particle collision, both formation and break-up of aggregates was determined by the turbulent energy prevailing in the system. While the amount of aggre- gated material drastically increased towards the peak of the bloom, the maximum aggregate size remained at about 1 mm diameter. This could indicate that aggregate size was limited by shear-induced break- up. Aggregates larger than the size of the smallest scale of turbulent motion are subject to high shear energy which can lead to their break-up. An approxi- mate the estimate for the smallest eddy size is given by the Kolmogorov or viscous length L, = (v3/&)' I4 (Gill 1982). For a mean shear rate in the upper mixed layer of 0.37 S-' determined for the period before and du- ring the bloom, L, = 0.16 cm. This would correspond to an upper particle size of about 0.16 cm diameter, which approximates the maximum size observed dur- ing this period (0.11 cm). However, Lazier & Mann (1989) stated that towards smaller scales, the energy density decreases so rapidly that eddies 5 times the Kolmogorov length contain only 1 % of the maximum energy. Consequently, almost no shear energy would be contained in eddies the size of the Kolmogorov length, suggeshng that shear-induced particle break- up may have been insignificant at that scale and that, based on the prevailing turbulence regime, aggregate sizes could have become much larger than observed.
Further investigation is needed to appropriately assess the role of turbulent shear for particle break-up.
A possible effect of the shear rate on aggregate size is nevertheless suggested by the fact that the occur- rence of the largest aggregate sizes coincided with a period of comparatively calm weather conditions (15 to 21 May; Fig. 2). Wind speeds of around 3.5 m S-' wlll have resulted in shear rates significantly smaller than those calculated above. During this period of reduced shear, aggregates up to 5 cm in longest dimension, as recorded on 19 May, were present for at least 4 d. Since these large aggregates occurred at a time when the amount of aggregated material and the phytoplankton biomass had already declined to less than 25 % of their peak values, the formation was obviously not primarily controlled by the amount of algal biomass suspended in the water column. In addition to physical constraints, changes of the biological conditions may have affected coagulation processes during the post-bloom period. An increase in particle stickiness following the phyto- plankton bloom, which would greatly enhance coagu- lation efficiency, can be expected to b e an important factor in the formation of these large aggregates. The role of stickiness during this period is dealt with in the companion paper (Riebesell 1991). High concentrations of dissolved organic carbon (DOC), generally observed during phytoplankton blooms (Degens & Ittekkot 1984), can reduce the turbulent viscosity of seawater (Jenkinson 1986). In fact, Jenlunson & Biddanda (in press) found a positive relationship between phyto- plankton abundance and seawater viscosity. At a low ambient shear, a n increase in viscosity dampens turbu- lence and increases the size and duration of Kol- mogorov eddies (Jenkinson 1986).
In conclusion, the aggregation processes observed in this field study during a phytoplankton bloom are in agreement with predictions derived from the physical coagulation model of Jackson (1990). However, while the specific physical conditions required by the model are a prerequisite for particle aggregation, the question of whether aggregate formation actually occurs once these prerequisites are met, as well as the degree of aggregation, appears to be determined by the biology of the prevailing organisms.
Acknowledgements. The field investigations of this work were carried out at the department for guest research of the Biologische Anstalt Helgoland (BAH). I thank U. Schill~ng. J. Losche, and H. Reichenberger of the BAH l v i n g group for l v i n g and technical assistance in the field. Thanks also go to captain and crew of RV 'Aade', 'Diker', and 'Uthorn' of the BAH. I am grateful to C. Veth for explaining the physics of wind-induced turbulent mixing. P. C. Abreu, U. Bathmann, B. Biddanda, M. Botros, T. Griebe, V Srnetacek, and 3 anonym- ous reviewers provided valuable comments to the n~anuscript. Publication No. 378 of the Alfred Wegener Institute for Polar and Marine Research.

280 Mar. Ecol. Prog. Ser. 69: 273-280, 1991
LITERATURE CITED
Aken, van H. M (1984) A one-dimensional mixed-layer model for stratified shelf seas with tide- and wind-induced m~uing. Dt. hydrogr Z. 37: 3-27
Alldredge, A. L. (1979). The chemical composition of macro- scopic aggregates in two neritic seas. Limnol. Oceanogr. 24 (5): 855-866
Alldredge, A. L., Gotschalk, C. (1988). In situ settling behavior of marine snow. Limnol. Oceanogr. 33 (3): 339-351
Alldredge, A. L., Gotschalk, C. C. (1989). Direct observations of the mass flocculation of &atom blooms: charactenstics, settling velocities and formation of diatom aggregates. Deep Sea Res. 36 (2): 159-171
Alldredge, A. L.. Silver, M. W. (1988). Characteristics, dynamics and significance of marine snow. Prog. Oceanogr. 20: 41-82
Asper, V. L. (1987). Measuring the flux and sinking speed of marine snow aggregates. Deep Sea Res. 34 (1): 1-17
Degens, E. T., Ittekkot, V. (1984). A new look at clay-organic interactions. Mitt. Geo1.-Palaont. Inst. Univ. Hamburg 56: 229-248
Eisma, D., Boon. J . , Groenewegen, R.. Ittekkot, V., Kalf. J.. Mook, W G. (1983). Observations on macro-aggregates, particle size and organic composition of suspended matter in the Ems estuary. Mitt. Geo1.-Palaont. Inst. Univ. Ham- burg 55: 295-314
Eisma, D., Kalf, J. (1987). Dispersal, concentration and deposi- tion of suspended matter in the North Sea. J. Geol. Soc. 144: 161-178
Fowler. S. W., Knauer. G. A. (1986). Role of large particles in the transport of elements and organic compounds through the oceanic water column. Prog. Oceanogr. 16: 147-194
Gill, A. E. (1.982). Atmosphere-ocean dynamics. Academic Press, New York
Honjo, S., Doherty, K. W., Agrawal, Y C., Asper, V. L. (1984). Direct optical assessment of large amorphous aggregates (marine snow) in the deep ocean. Deep Sea Res. 31: 67-76
Jackson, G. A. (1990) A model of the formation of marine algal flocs by physical coagulation processes. Deep Sea Res. 37 (8): 1197-1211
Jenkinson, I. R. (1986). Oceanographic implications of non- newtonian properties in phytoplankton cultures. Nature, Lond. 323: 435437
Jenlanson, I. R.. Biddanda. B. A. (in press). Microbial plankton and viscosity of bulk seawater in the German Bight. 0cean.ologica Acta
Kranck, K . , Mill~gan, T (1988). Macroflocs from diatoms: in
This article was submitted to the editor
situ photography of particles in Bedford Basin. Nova Scotia. Mar. Ecol. Prog. Ser. 44: 183-189
Landmann, G. (1988). An in situ camera system, developed and tested for the character~zation of suspended matter in the ocean. Mitt. Geo1.-Palaont. Inst. Univ. Hamburg 65: 207-228
Lazier. J. R. N.. Mann, K. H. (1989). Turbulence and the diffusive layers around small organisms. Deep Sea Res. 36: 1721-1733
McCave, I. N. (1975). Vertical flux of particles in the ocean. Deep Sea Res. 22: 491-502
McCave, I . N (1984). Size spectra and aggregation of sus- pended particles in the deep ocean. Deep Sea Res. 31 329-352
Parsons, T R., Malta, Y., Lalli, C. M. (1984). A manual of chemical and biological methods for seawater analysis. Pergamon Press, New York
Riebesell, U (1989). Comparison of sinking and sedimentation rate measurements in a diatom wintedspring bloom. Mar. Ecol. Prog. Ser. 54: 109-119
Riebesell. U. (1991). Particle aggregation during a diatom bloom. 11. Biological aspects. hfar. Ecol. Prog. Ser 69: 281-291
Riley, G. A. (1963). Organic aggregates in seawater and the dynamics of their formation and utilization. Limnol. Oceanogr. 8: 372-381
Silver, M. W , Alldredge, A. L. (1981). Bathypelagic marine snow: deep-sea algal and detrital community. J mar. Res. 39: 501-530
Smayda, T J . (1970). The suspension and sinking of phyto- plankton in the sea. Oceanogr. mar. Biol. A. Rev. 8: 3 5 3 4 14
Smetacek, V. S. (1985). Role of sinking in diatom life-history cycles ecological, evolutionary and geological signifi- cance. Mar Biol. 84: 239-251
Trent, J. D.,Shanks, A. L., Sliver, M. W. (1978). Insituandlabora- tory measurements on macroscopic aggregates in Monterey Bay, California. Limnol. Oceanogr 23 (4): 626-635
Utermohl, H. (1958). Zur Vervollkommnung der quantitativen Phytoplankton-Methodik. Mitt. int. Verein theor angew. Limnol. 9 1-38
Veth, C (1983). Turbulence measurements in the stratified central North Sea with a laser-doppler velocimeter system. In: Siindermann, J., Lenz. W (eds.) North Sea dynamics. Springer Verlag, Berlin, p. 412-428
Wells, J. T., Shanks, A. L. (1987). Observations and geologic significance of marine snow in a shallow-water. partially enclosed marine embayment. J . geophys Res. 92 (C12): 13185-13190
Manuscript first received: August 24, 1990 Revised version accepted: ~Vovember 26, 1990