Embed Size (px)
Citation preview

Past, Present, & Future
Public School Enrollment in Wisconsin
Presentation to theApplied Demography Convention
January 9, 2014

OutlineExamine current public school enrollment trends in the State of
Wisconsin.
Explore the broader demographic trends which influence public school enrollment.
Generate public school enrollment projections statewide and by grade grouping, locale, and race/ethnicity.
Wisconsin’s Public School Enrollment
Applied Population Laboratory

999,921
767,542
881,720
700,000
750,000
800,000
850,000
900,000
950,000
1,000,000
1,050,000
1,100,000
Num
ber
of S
tude
nts
Public School Enrollment HistoryWisconsin 1965/66 - 2012/13
Baby Boom
Boomlet
Baby Bust
Statewide enrollment declined by 0.1% in a five year period.
59% of districts declined. 90 districts (21%) declined by
10% or more.
40% of districts increased. 53 districts (12%) increased by
10% or more.

800,000
810,000
820,000
830,000
840,000
850,000
860,000
870,000
05-06 06-07 07-08 08-09 09-10 10-11 11-12 12-13
Stud
ents
K-12 and 4K-12 Public School Enrollment
4K-12 K-12
Wisconsin, 2005/06-2012/13

0.0%
2.0%
4.0%
6.0%
8.0%
10.0%
12.0%
05-06 06-07 07-08 08-09 09-10 10-11 11-12 12-13
Stud
ents
Asian Black Hispanic American Indian 2 or More
Students by Race/Ethnicity, 2005/06-2012/1371.0%
72.0%
73.0%
74.0%
75.0%
76.0%
77.0%
78.0%
79.0%
05-06 06-07 07-08 08-09 09-10 10-11 11-12 12-13
Stud
ents
Non-hispanic White
Non-Hispanic White Students, 2005/06-2012/13

5%
34%
61%
Number of Districts
Urban
Suburban
Rural
35%
38%
27%District Enrollment
Urban
Suburban
Rural
School Districts by Locale

210,000
230,000
250,000
270,000
290,000
310,000
330,000
05-06 06-07 07-08 08-09 09-10 10-11 11-12 12-13
Stud
ents
Students by Location, 2005/06-2012/13
Urban Suburban Rural
Place ChangeUrban -1.6%Suburban 9.9%Rural -5.7%

2012-13 Enrollment by Race/Ethnicity
◦Urban – Greatest diversity. African American and Hispanic students are 22%.
◦ Suburban – Largest minority is Hispanic (5.8%). Other minority students range from 2.2 to 3.7%.
◦Rural – Largest minority is Hispanic (6.1%). Second largest is Native American (2.5%).
Urban
Suburban
Rural
Asian
Black
Hispanic
American Indian
White
2 or More

Births
Age Structure
Migration
What can we learn from broader demographics in Wisconsin?

50,000
52,500
55,000
57,500
60,000
62,500
65,000
67,500
70,000
72,500
75,000
1990 1991 1992 1993 1994 1995 1996 1997 1998 1999 2000 2001 2002 2003 2004 2005 2006 2007 2008 2009 2010
Wisconsin Births, 1990-2010
Non-Hispanic White Births Total Births

12% 10% 8% 6% 4% 2% 0% 2% 4% 6% 8% 10% 12%
under 5
5-9
10-14
15-19
20-24
25-29
30-34
35-39
40-44
45-49
50-54
55-59
60-64
65-69
70-74
75-79
80-84
85+
Percent of Population
Age
Age Structure by Race/Ethnicity, 2010
Persons of Color Non-Hispanic White Persons
Male Female
Prime childbearing years

-20
-10
0
10
20
30
40
50
60
700-
4
5-9
10-1
4
15-1
9
20-2
4
25-2
9
30-3
4
35-3
9
40-4
4
45-4
9
50-5
4
55-5
9
60-6
4
65-6
9
70-7
4
75+
Net
Mig
ratio
n Ra
te
Age
Net Migration Rates by Race/Ethnicity, 2000s
Non-Hispanic White Non-Hispanic Black Hispanic Total

Since the late 1990s births increased, but in 2007 total births began to decline.◦ Births of non-Hispanic whites have been declining , while minority
births leveled off and only just decreased in 2010.
The state’s age structure and recession contributed to low births over the last few years.◦ Women of prime child-bearing years delayed having children.
Net in-migration of all ages except young adults in the 2000s.◦ Out-migration of young adults (age 25-29) occurred during the 1990s
and 2000s except in the Hispanic population.
Summary of State Demographics

Cohort component (survival) method
Grade progression ratios for Grades 1st to 12th ◦ Average ratio of previous year 1st graders to current year 2nd graders
Birth to Kindergarten◦ 5 Year Trend model, 3 Year Trend model, & Fertility Rate model
Projections statewide and by grade grouping
Projections by race/ethnicity
Projections by urban/suburban/rural locale
School Enrollment Projections

0.850
0.900
0.950
1.000
1.050
1.100
B:K K:1 1:2 2:3 3:4 4:5 5:6 6:7 7:8 8:9 9:10 10:11 11:12
Gra
de P
rogr
essi
on R
atio
5 Year Trend 3 Year Trend Fertility Rate
Grade Progression Ratios, by Model
Models B:K K:1 1:2 2:3 3:4 4:5 5:6 6:7 7:8 8:9 9:10 10:11 11:12
5 Year Trend 0.861 1.000 0.998 1.003 1.005 1.002 1.008 1.009 1.005 1.113 0.953 1.010 0.9893 Year Trend 0.854 1.000 0.998 1.004 1.005 1.001 1.008 1.009 1.007 1.109 0.957 1.010 0.990Fertility Rate 0.861 1.001 0.999 1.004 1.006 1.002 1.010 1.011 1.005 1.116 0.950 1.008 0.987

60,000
62,000
64,000
66,000
68,000
70,000
72,000
74,000
1993 1994 1995 1996 1997 1998 1999 2000 2001 2002 2003 2004 2005 2006 2007 2008 2009 2010 2011 2012 2013 2014 2015 2016 2017
Long Term Trend Recent Trend Fertility Rate Actual
Actual and Projected Births, 1993-2017
Projected
ASFR

850,000
852,000
854,000
856,000
858,000
860,000
862,000
864,000
866,000
868,000
870,000
872,000
5 Year Trend 3 Year Trend Fertility Rate Actual
4K-12 Enrollment History and Projections
500,000
520,000
540,000
560,000
580,000
600,000
620,000
640,000
660,000
680,000
700,000
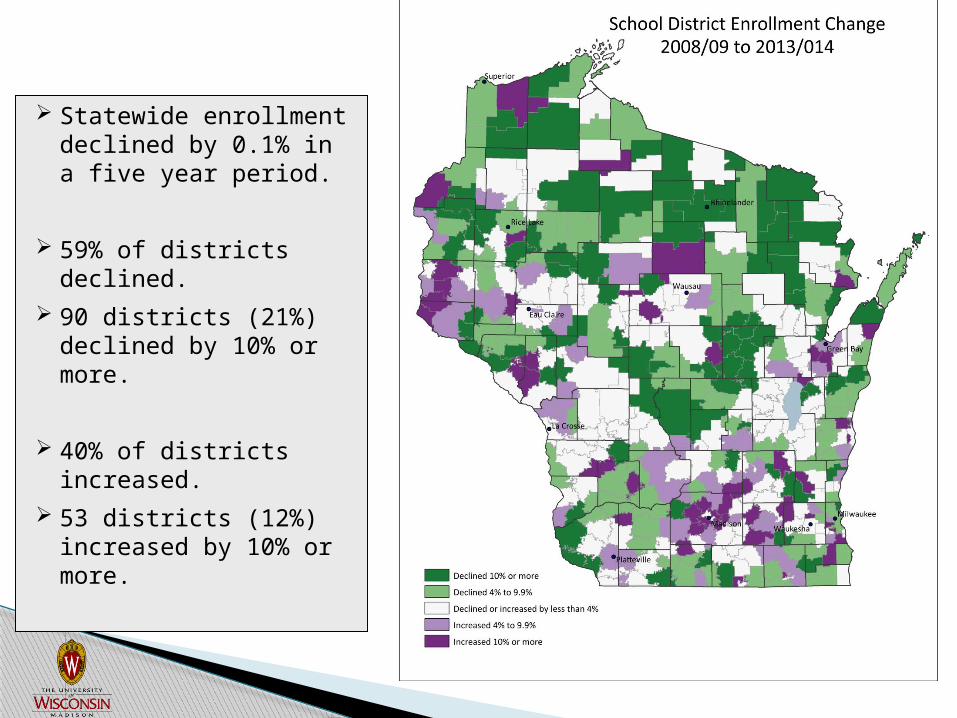
Non-Hispanic White Students
5 Year Trend 3 Year Trend Fertility Rate Actual
4K-12 Enrollment History and Projections

40,000
50,000
60,000
70,000
80,000
90,000
100,000
110,000
120,000
130,000
140,000
Minority Students
5 Year Trend 3 Year Trend Fertility Rate Actual 5 Year 3 Year Fertility
4K-12 Enrollment History and Projections
Hispanic
African American

5,000
10,000
15,000
20,000
25,000
30,000
35,000
40,000
Minority Students
5 Year Trend 3 Year Trend Fertility Rate Actual 5 Year 3 Year Fertility
4K-12 Enrollment History and Projections
Asian
Native American
210,000
230,000
250,000
270,000
290,000
310,000
330,000
350,000
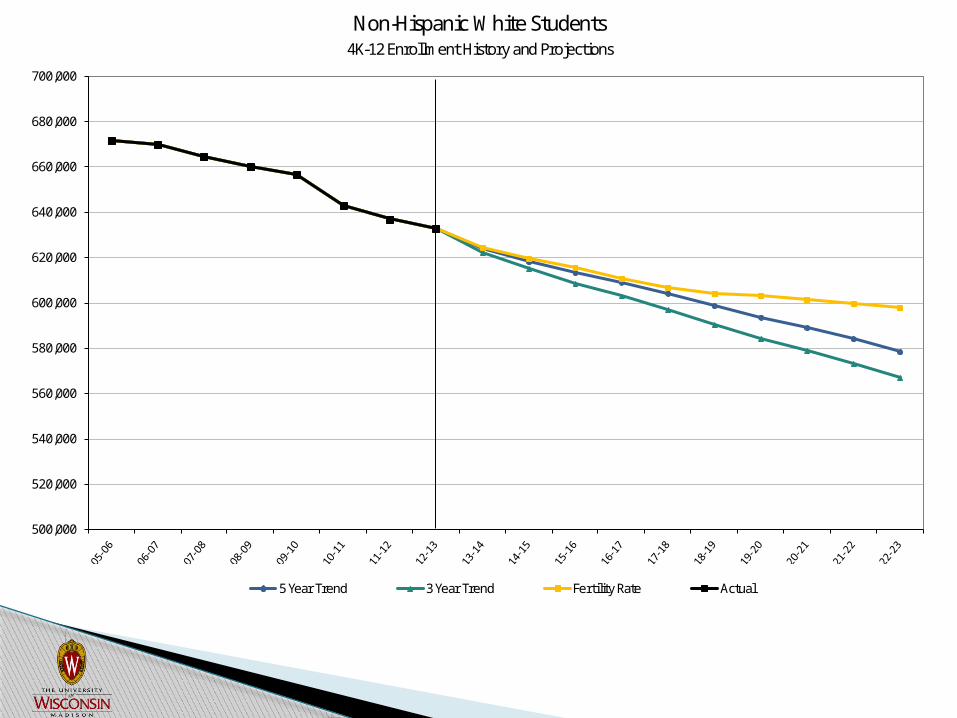
Urban Suburban and Rural School Districts
5 Year Trend 3 Year Trend Fertility Rate Actual 5 Year Trend 3 Year TrendFertility Rate Actual 5 Year 3 Year Fertility Actual
4K-12 Enrollment History and Projections
Suburban
Urban
Rural

Total statewide public school enrollment will increase over time.
Elementary schools will increase for 2 years then decline over time. Middle and high schools projected to decline for 1-2 years then
increase for the foreseeable future.
Non-Hispanic white population projected to continue to decline.
Hispanic and Asian population projected to increase while African and Native American population projected to remain steady.
Suburban districts projected to increase, urban districts projected to increase slightly after a year of decline, and rural districts projected to continue to decline.
Enrollment Projections for Wisconsin

Comparison of actual & projected
number percent number percentActual (2013/14) 868,182 Actual (2013/14) 319,8195 Year Trend 857,181 -1.3% 5 Year Trend 315,938 -1.2%3 Year Trend 856,886 -1.3% 3 Year Trend 315,666 -1.3%Fertility Rate 857,373 -1.2% Fertility Rate 316,180 -1.1%
number percent number percentActual (2013/14) 299,482 Actual (2013/14) 248,8815 Year Trend 292,204 -2.4% 5 Year Trend 243,535 -2.1%3 Year Trend 292,430 -2.4% 3 Year Trend 243,243 -2.3%Fertility Rate 292,100 -2.5% Fertility Rate 243,579 -2.1%
Urban Rural
Enrollment Projections Error (2013-14)State of Wisconsin
Statewide Suburban

Public School Enrollment in WisconsinPast, Present, & Future
Sarah KempAssociate Researcher
Applied Population LaboratoryUniversity of Wisconsin-Madison
(608) [email protected]

340,000
345,000
350,000
355,000
360,000
365,000
370,000
5 Year Trend 3 Year Trend Fertility Rate Actual
K-5 Enrollment History and Projections
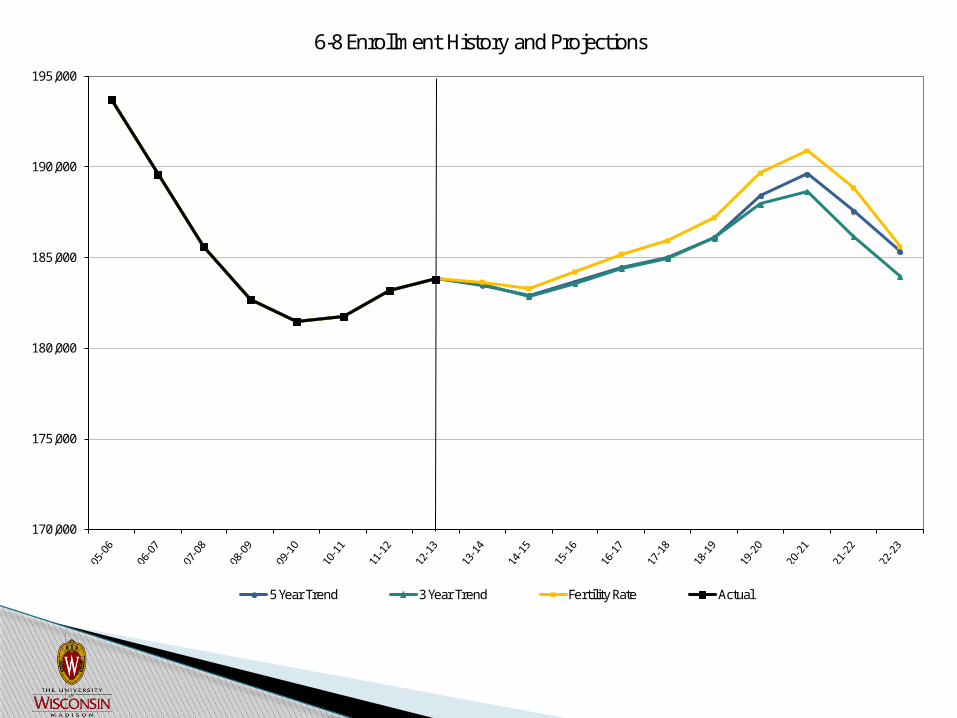
170,000
175,000
180,000
185,000
190,000
195,000
5 Year Trend 3 Year Trend Fertility Rate Actual
6-8 Enrollment History and Projections

260,000
265,000
270,000
275,000
280,000
285,000
290,000
295,000
5 Year Trend 3 Year Trend Fertility Rate Actual
9-12 Enrollment History and Projections