Embed Size (px)
Citation preview

Procedia - Social and Behavioral Sciences 62 ( 2012 ) 896 – 900
1877-0428 © 2012 Published by Elsevier Ltd. Selection and/or peer review under responsibility of Prof. Dr. Hüseyin Araslidoi: 10.1016/j.sbspro.2012.09.151
WC-BEM 2012
countries. A comparative analysis Andreea- a *
aUniversiy Health Policy and Ethics, 16th University Street, Iasi, 700115, Romania bAlexandru Ioan Cuza University, Faculty of Economics and Business Administration, 22nd Carol I Bvd., Iasi, 700505, Romania
Abstract
This article aims at providing an assessment of access and quality of healthcare in EU countries from a bottom up perspective and to investigate the relationship between several macroeconomic indicators related to public expenditure on health and institutional
healthcare quality among EU citizens. Citizens of developed countries have a positive opinion about quality of healthcare in their a
Keywords:
1. Introduction
The deepening of health inequities around the world calls for more patient-centred healthcare systems and for getting higher value for invested money. In this context, access and quality of healthcare are a priority on international agenda and central goals of healthcare reforms for any health system. They are considered as key elements for improved health outcomes and efficiency in healthcare service delivery worldwide. Assessing and monitoring access and quality of care in health systems should mostly relevaluation about their experiences in healthcare.
This research aims at providing an overview on access and quality of healthcare in EU countries from a bottom up perspective and to investigate to what extent several macroeconomic indicators related to public expenditure on
The first part of the paper is a comparison
methodological limitations that should be taken into consideration ( ), we believe that the comparison can provide useful insights into the quality of healthcare in different European systems since the
the main target of any health policy.
* Andreea- . Tel.: +4-726-129-580 E-mail address: [email protected]
© 2012 Published by Elsevier Ltd. Selection and/or peer review under responsibility of Prof. Dr. Huseyin Arasli
Available online at www.sciencedirect.com
© 2012 Published by Elsevier Ltd. Selection and/or peer review under responsibility of Prof. Dr. Hüseyin Arasli
897 Andreea-Oana Iacobuta / Procedia - Social and Behavioral Sciences 62 ( 2012 ) 896 – 900
The second part provides a more objective image by correlating several macroeconomic and institutional indicators with people perception of healthcare quality.
The results display significant differences in perception of access and healthcare quality among EU citizens. They also confirm the existence of a relationship between several macroeconomic and institutional factors and
2. Data and methods
We used cross-country analysis in order to compare sfaction with quality of healthcare systems in EU countries. The quality of healthcare system is analysed using two indicators, the percent of positive evaluation for the overall quality of healthcare retrieved from Special Eurobarometer 327 - Patient safety and quality of healthcare and Euro Health Consumer Index released by Health Consumer Powerhouse.
The relationship between the variables was analysed using correlation analysis. The identification of the significant correlations was made using Pearson correlation coefficient.
We used three indicators of financial expenditures on health namely, GDP per capita, Total health expenditure as share of GDP and General Government Expenditure on Health as share of General government expenditure and one indicator of institutional context respectively, Corruption Perceptions Index. Health expenditure data were obtained from the WebPages of World Bank (for GDP per capita) and World Health Organization National Health Accounts Database (Total health expenditure as share of GDP and General Government Expenditure on Health as share of General government expenditure). Corruption Perceptions Index is released by Transparency International.
The data are available all EU member states and they are registered for 2009. Statistical data processing was conducted using SPSS software.
3. Results
3.1. Evaluation of healthcare quality and access across EU countries
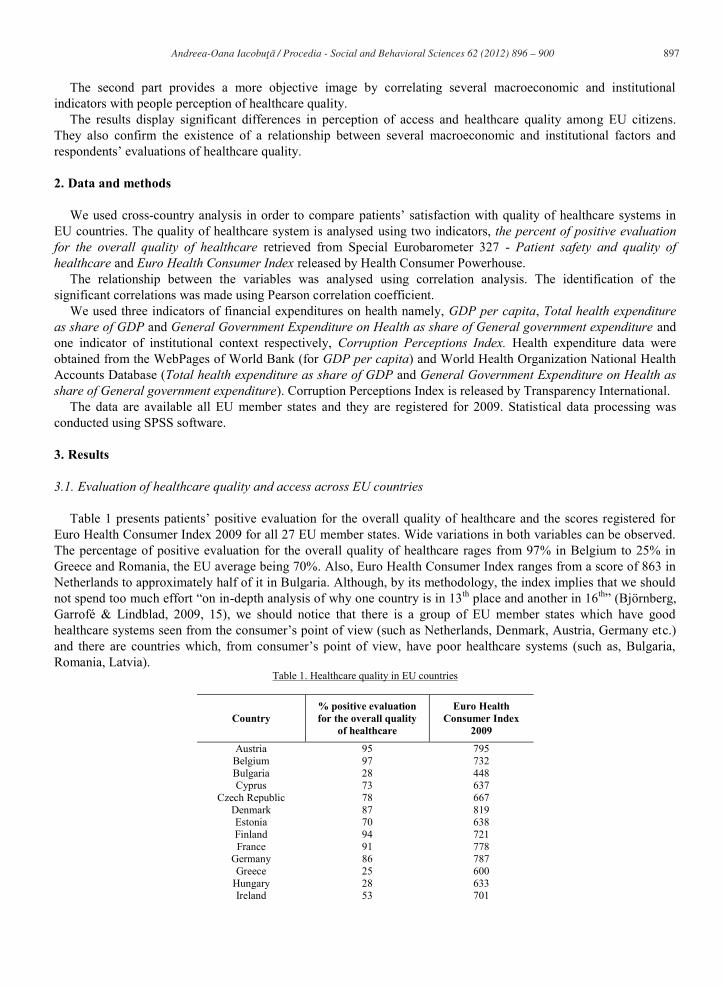
Euro Health Consumer Index 2009 for all 27 EU member states. Wide variations in both variables can be observed. The percentage of positive evaluation for the overall quality of healthcare rages from 97% in Belgium to 25% in Greece and Romania, the EU average being 70%. Also, Euro Health Consumer Index ranges from a score of 863 in Netherlands to approximately half of it in Bulgaria. Although, by its methodology, the index implies that we should
-depth analysis of why one country is in 13th place and another in 16th
c.)
Romania, Latvia). Table 1. Healthcare quality in EU countries
Country % positive evaluation for the overall quality
of healthcare
Euro Health Consumer Index
2009
Austria 95 795 Belgium 97 732 Bulgaria 28 448 Cyprus 73 637
Czech Republic 78 667 Denmark 87 819 Estonia 70 638 Finland 94 721 France 91 778
Germany 86 787 Greece 25 600
Hungary 28 633 Ireland 53 701

898 Andreea-Oana Iacobuta / Procedia - Social and Behavioral Sciences 62 ( 2012 ) 896 – 900
Italy 54 671 Latvia 37 512
Lithuania 40 546 Luxembourg 88 777
Malta 81 565 Netherlands 91 863
Poland 30 565 Portugal 42 632 Romania 25 489 Slovakia 53 560 Slovenia 69 668
Spain 81 630 Sweden 90 762
United Kingdom 86 682 Data sources: European Commission (2009), Special Eurobarometer-327: Patient safety and quality of healthcare; Euro Health Consumer Index 2009 Report, Health Consumer Powerhouse.
From the presented data there can be noticed that those countries which have more consumer-oriented healthcare
systems (high values for Euro Health Consumer Index) display higher percentage of positive evaluation for the overall quality of healthcare. This relationship is also proven by the strong correlation (Pearson correlation coefficient equals 0.790) between the two variables presented in Figure 1 below.
3.2. Statiscal analysis of the relationships between macroeconomic and institutional indicators and perceived healthcare quality in EU countries in 2009
3.2.1. Correlation between variables For the sample of 27 EU countries, we studied the bivariate correlations between the variables, using Pearson
correlation coefficient. Figure 1 presents, for each analysed correlation, the estimated value of Pearson correlation coefficient and Sig
probability.
Figure 1. Correlations Matrix
Pearson correlation coefficients show a positive strong correlation between Euro Health Consumer Index and the
following health expenditure indicators: GDP per capita, Total health expenditure as share of GDP and General Government Expenditure on Health as share of General government expenditure. Also, there is a strong positive correlation between Euro Health Consumer Index and Corruption Perceptions Index. The results highlight the same
Correlations
1 .771** .460* .521** .730** .640**.000 .016 .005 .000 .000
27 27 27 27 27 27.771** 1 .734** .711** .864** .790**.000 .000 .000 .000 .000
27 27 27 27 27 27.460* .734** 1 .823** .538** .534**.016 .000 .000 .004 .004
27 27 27 27 27 27
.521** .711** .823** 1 .536** .576**
.005 .000 .000 .004 .00227 27 27 27 27 27
.730** .864** .538** .536** 1 .795**
.000 .000 .004 .004 .00027 27 27 27 27 27
.640** .790** .534** .576** .795** 1
.000 .000 .004 .002 .00027 27 27 27 27 27
Pearson CorrelationSig. (2-tailed)NPearson CorrelationSig. (2-tailed)NPearson CorrelationSig. (2-tailed)N
Pearson CorrelationSig. (2-tailed)NPearson CorrelationSig. (2-tailed)NPearson CorrelationSig. (2-tailed)N
GDP per capita (currentUS$)
Euro Health ConsumerIndex 2009
Total health expenditure% GDP
General Gov ernmentExpenditure on Healthas % of Generalgovernment expenditureCorruption PerceptionIndex 2009
% positive ev aluation f orthe ov erall quality ofhealthcare
GDP percapita (current
US$)
Euro HealthConsumerIndex 2009
Total healthexpenditure
% GDP
GeneralGovernmentExpenditureon Health as% of Generalgovernmentexpenditure
CorruptionPerceptionIndex 2009
% positiveevaluation for
the ov erallquality ofhealthcare
Correlation is signif icant at the 0.01 level (2-tailed).**.
Correlation is signif icant at the 0.05 level (2-tailed).*.

899 Andreea-Oana Iacobuta / Procedia - Social and Behavioral Sciences 62 ( 2012 ) 896 – 900
strong relationship between People positive evaluation for the overall quality of healthcare and Corruption Perceptions Index.
3.2.2. Distribution of EU countries by several selected variables
For two of the strongest corelations, namely those between Euro Health Consumer Index and GDP per capita (with Pearson correlation coefficient of 0.771) and Euro Health Consumer Index and Corruption Perceptions Index (with Pearson correlation coefficient of 0.864) scatter diagrams developed in SPSS were used in order to position the EU countries in relation with the analysed variables.
Figure 2 displays the distribution of EU countries according to Euro Health Consumer Index and GDP per capita (current US $). As can be noticed, most of the EU countries can be divided in two main categories: one includes countries with low scores for Euro Health Consumer Index and low GDP per capita, below the average; the other includes countries with both Euro Health Consumer Index and GDP per capita above the average.
Figure 2. The positioning of EU countries in relation with Euro Health Consumer Index and GDP per capita Figure 3 displays the positioning of EU countries according to Euro Health Consumer Index and the indicator of
institutional context, Corruption Perception Index. EU countries with high values for Corruption Perceptions Index (perceived as less corrupt) register high scores for Euro Health Consumer Index. On the contrary, the countries which are perceveid as more corrupt have less consumer-oriented healthcare systems.
Figure 3. The positioning of EU countries in relation with Euro Health Consumer Index and Corruption Perceptions Index
120000100000800006000040000200000
GDP per capita (current US$)
900
800
700
600
500
400
Euro
Hea
lth C
onsu
mer
Inde
x 20
09
United Kingdom
Sweden
Spain
Slovenia
Slovakia
Romania
Portugal
Poland
Netherlands
Malta
Luxembourg
Lithuania
Latvia
Ireland
Greece
Germany
France
Estonia
Denmark
Czech Republic
Cyprus
Bulgaria
Belgium
Austria
10.08.06.04.02.0
Corruption Perception Index 2009
900
800
700
600
500
400
Euro
Hea
lth C
onsu
mer
Inde
x 20
09
United Kingdom
Sweden
Spain
Slovenia
Slovakia
Romania
Portugal
Poland
Netherlands
Malta
Luxembourg
Lithuania
Latvia
Italy
Ireland
Hungary
Greece
GermanyFrance
Finland
Estonia
Denmark
Czech Republic
Cyprus
Bulgaria
Belgium
Austria

900 Andreea-Oana Iacobuta / Procedia - Social and Behavioral Sciences 62 ( 2012 ) 896 – 900
4. Discussions and conclusions
EU member states and at investigating the relationships existing between indicators of public spending on health and institutional context and indicators of healthcare quality.
The results show significant differences in perception of access and healthcare quality among EU citizens. Citizens of developed countries have from developing countries evaluate it rather negatively.
Also, the findings confirm that, in general, GDP per capita and government spending on health have a positive impact on the perceived quality of healthcare system. EU countries positioning in relation with analysed variables prove the fact that countries with low GDP per capita have also less consumer-oriented healthcare systems.
The analysis also shows that institutional factors, assessed in this paper with the Corruption Perceptions Index, are strongly and positively correlated with people evaluations of healthcare quality and the extent to which healthcare systems are consumer-oriented. EU countries positioning in relation with the above mentioned variables shows that the less corrupt EU countries have high consumer-oriented healthcare systems.
The obtained results are in line with the ones in previous published studies in this area, especially the ones dealing with the macroeconomics of health financing. They provide an image of the significant role the level of development and the level of health financing in a country plays for healthcare quality.
Still, issues like quality, access, equity in healthcare are much more complex and subjective to be assessed only with financial data. A substantive analysis should also take into consideration the influence of other possible explanatory variables such as, socio-cultural, political and institutional factors.
Acknowledgements
This work was co-financed from the European Social Fund through Sectoral Operational Programme for Human Resources Development 2007-2013, Priority Axis 1 Education and training in support for growth and development of a knowledge based society, Area of intervention: Doctoral and postdoctoral programmes in support of research, project number University
References
Euro Health Consumer Index 2009 Report. Health Consumer Powerhouse. Available from http://www.healthpowerhouse.com/files/Report-EHCI-2009-090925-final-with-cover.pdf
European Commission (2009), Special Eurobarometer-327: Patient safety and quality of healthcare. Available from http://ec.europa.eu/public_opinion/archives/ebs/ebs_327_en.pdf
Hopkins, S. (2010). Health Expenditure Comparisons: Low, Middle and High Income Countries. The Open Health Services and Policy Journal, 3, 111 - 117.
Management in health, XV (3), 31-39.
Schoen, C., Osborn, R., Huynh, P.T., Doty, M., Zapert, K., Peugh, J., & Davis, K. (2005). Taking The Pulse Of Health Care Systems: Experiences Of Patients With Health Problems In Six Countries. Health Affairs, doi: 10.1377/hlthaff.w5.509, 509-525.
Transparency International (2009). Corruption Perceptions Index 2009. Available from http://www.transparency.org/policy_research/surveys_indices/cpi/2009/cpi_2009_table
World Bank (2009). World Bank Indicators. GDP per capita (current US$). Available from http://data.worldbank.org/indicator/NY.GDP.PCAP.CD
World Health Organization (2009), Global Health Expenditure Database, National Health Accounts Indicators. Available from http://apps.who.int/nha/database