Embed Size (px)
Citation preview
c’ I e
PATTERN RECOGNITION OF SATELLITE CLOUD IMAGERY FOR IMPROVED WEATHER PREDICTION
CHASE CONSULTING, INC. 3543 CIlminito Carmel Landing
San Diego, California 92130
by Catherine Gautier
Earth Space Research, Inc.
Richard C.J. Somerville Oomaw Corporation
Leonid B.Volfson Chase Consulting, Inc.
September 1986 1
(NASA-CR-180720) PATTERN a E C O G N I T I O N OF NU-29987 SATELLITE C L O U D I P i R G E H Y FOR I H P R O V E D Yi3ATHEh P R E D I C T I O N F i n a l Report ;Chase C o n s u l tinq) 1 8 p A v a i l : N T I S IIC A02 /EF A 0 1 CSCL d4a U n c l a s
~ 3 1 4 7 0054419
https://ntrs.nasa.gov/search.jsp?R=19870020554 2019-12-31T15:31:39+00:00Z
ABSTRACT
The major accomplishment of this contract has been the successful development of a method for extracting time derivative information from geostationary meteorological satel- lite imagery. This research is a proof-of-concept study which demonstrates the feasibility of using pattern recognition techniques and a statistical cloud classification method to esti- mate time rate of change of large-scale meteorological fields from remote sensing data. The cloud classification methodology is based on Typical Shape Function analysis of parameter sets characterizing the cloud fields.
follows: The three specific technical objectives, all of which were successfully achieved, are as
1. Develop and test a cloud classification technique based on pattern recognition meth- ods, suitable for the analysis of visible and infrared geostationary satellite VISSR imagery.
2. Develop and test a methodology for intercomparing successive images using the cloud classification technique, so w to obtain estimates of the time rate of change of meteorological fields.
3. Implement this technique in a testbed system incorporating an interactive graph- ics terminal to determine the feasibility of extracting time derivative information suitable for comparison with numerical weather prediction products.
This work should be carried forward in Phase I1 to produce a fully operational stand- alone work station to enable the benefits of this research to be realized in a real-time numerical weather prediction environment. Forecast verification studies, in conjunction with predictability theories, show that the early hours of numerical weather predictions are typically characterized by a rapid decay of skill. If observational estimates of time derivative, can be compared with numerical computations during this critical period, a PO- tentially valuable new tool will have been made available for improving numerical weather prediction model.
- 2 -
Introduction
The basic concept incorporated in our Phase I proposal was to increase the value and utility of meteorological satellite data for numerical weather prediction by extracting time derivative information from geostationary imagery. In Phase I, we have undertaken a proof- of-concept study to demonstrate the feasibility of using a statistical cloud classification method and pattern recognition techniques to estimate time rates of change of large-scale meteorological fields from remote sensing data.
In Phase I, we have exploited the fact that VISSR images from GOES are typically available at half-hour intervals, but that conventional meteorological analysis techniques produce only two analyses per day, so that much of the information content of these images is not utilized. We proposed to analyze sequences of such images by pattern recognition methods to produce observational estimates of time derivatives of meteorological param-
eters during the first few hours of the large-scale forecast period, when the skill of the numerical forecast typically decays most rapidly. Such observational time derivative infor- mation has great potential for increasing the forecast skill, both by statistical corrections to dynamical forecasts and by physical model improvements.
Our Phase I project had three specific technical objectives: 1. Develop and test a cloud classification technique based on pattern recognition meth-
ods, suitable for the analysis of visible and infrared geostationary satellite VISSR imagery.
2. Develop and test a methodology for intercomparing successive images using the cloud classification technique, so as to obtain estimates of the time rate of change of meteorological fields.
3. Implement this technique in a testbed system incorporating an interactive graph- ics terminal to determine the feasibility of extracting time derivative information suitable for comparison with numerical weather prediction products.
We have successfully completed all of these objectives.
Major Results
We have worked on these objectives using a series of GOES VISSR images, but we illustrate our results with a case study which is presented in detail below.
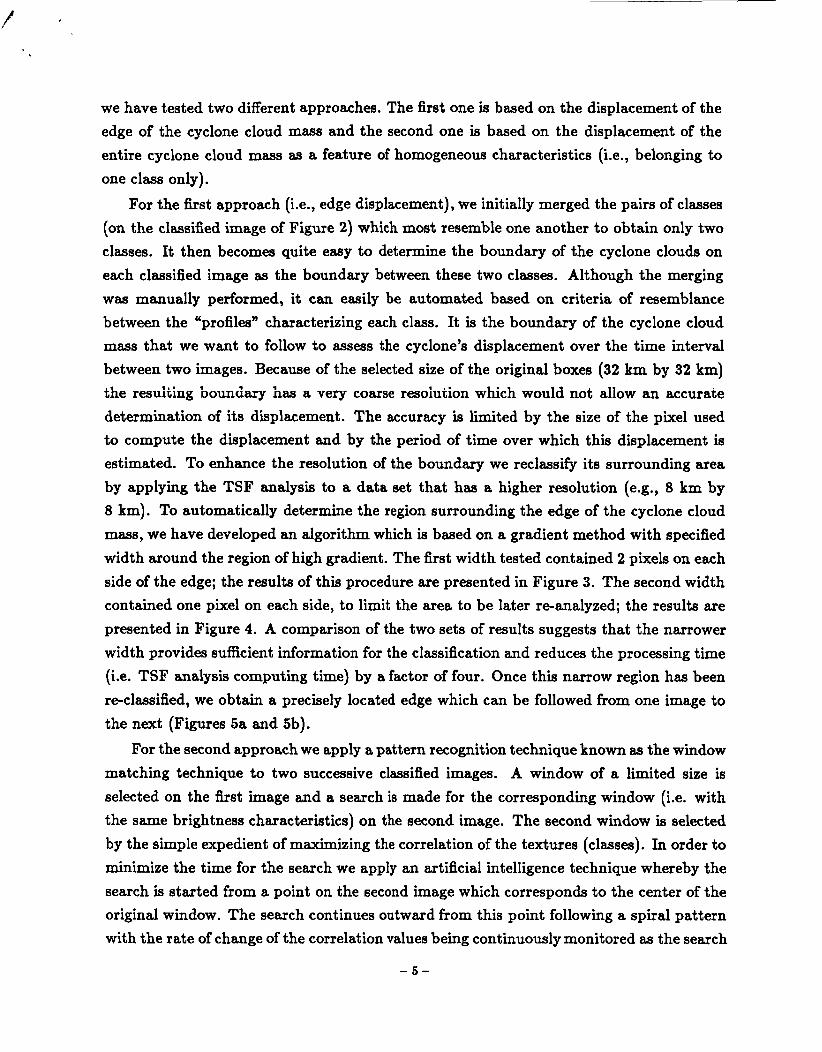
We first selected four infrared GOES-6 images for test puposes. Each image consisted of an array of 500 by 500 pixels. Each pixel nominally covers an area of 4 km by 4 km; the size of the area varies with latitude. The images were from November, 1983 and cover an
- 3 -
area in the eastern North Pacific Ocean off the west coast of the United States extending from 30° to 50”N. The selected images include a number of interesting meteorological features of synoptic scale. We chose to focus on a mature extratropical cyclone as an example of a baroclinic development which would be an important element of a numerical forecast. A cyclone is typically associated with different air masses separated by a front which can be visualized on satellite images as a curved cloud mass. It is this cloud mass that we will be using to determine the location and displacement of the cyclone from the analysis of satellite images.
In keeping with the procedure outlined in our Phase I proposal, we applied the Typical Shape Function (TSF) analysis to a subset of each original image, comprising approxi- mately one third of the original image domain. The TSF analysis is used to classify the set of parameters describing the cloud fields on the image. We found that for the parameters cf greatest interest, -:;hi& ine!ude ststistics siich M contrast aid maximum ana minimum brightness, we needed to coarsen the original resolution. We finally settled on a new pixel size of 8 km by 8 km, aad we computed the parameters in non-overlapping boxes of 4 by 4 new pixels. The domain which we analyzed on each image consists of an array of 32 by 32
of such boxes. For test purposes, we elected to treat a time sequence of four such arrays, at one hour intervals, e.g., at 0, 1, 2, and 3 hours, to investigate the feasibility of extracting time derivative information (the selected images are presented in Figures la and lb).
Each box is characterized in our procedure by a “texture” defined by the values of seven parameters (here we chose not to include visible information because of its lack of availability at night). These parameters are the mean brightness value, minimum and maximum values, mean of the distribution, contrast, entropy and first moment. The ap- propriateness of this choice of parameters for describing a cloud field has been previously tested by us. This texture is the basis for the classification of each box; each parameter can be viewed as a different measurement of the cloud horizontal properties similar to multispectral measurements. Thus, a “profile” is generated for each box with 7 different “levels” and these profiles are then classified according to their shape, in this case the relationship between the parameters. Each class represents an idealized type of cloud cov- erage (e.g., clear, partly cloudy, uniform cloud). We have found that the use of texture as a classification variable facilitates the analysis, primarily because it gives more information than would a threshhold technique based on a single binary parameter such as brightness. A first application of the TSF analysis to our series of images provided four statistically significant classes (Figure 2). From this figure it is clear that typically two of these classes occur within the cyclone, and two others occur outside it.
To determine the displacement of the cyclone cloud mass over the sequence of images
* . .
- 4 -
we have tested two different approaches. The first one is based on the displacement of the edge of the cyclone cloud mass and the second one is based on the displacement of the entire cyclone cloud mass as a feature of homogeneous characteristics (i.e., belonging to one class only).
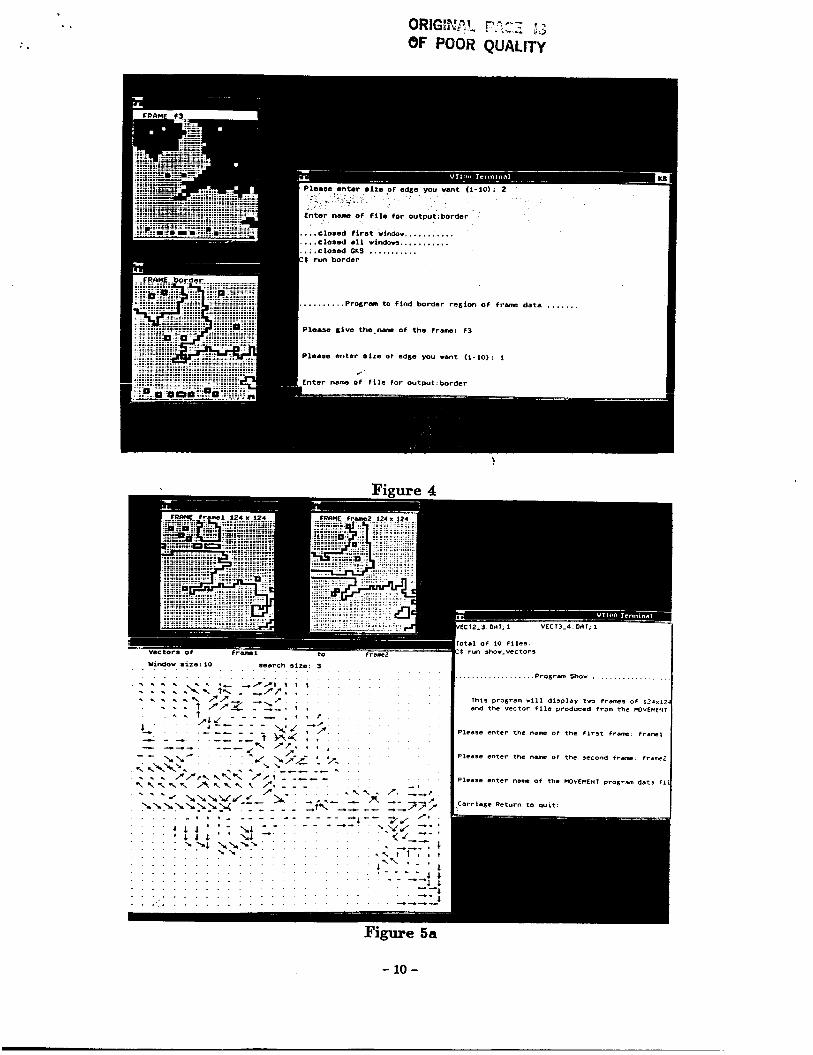
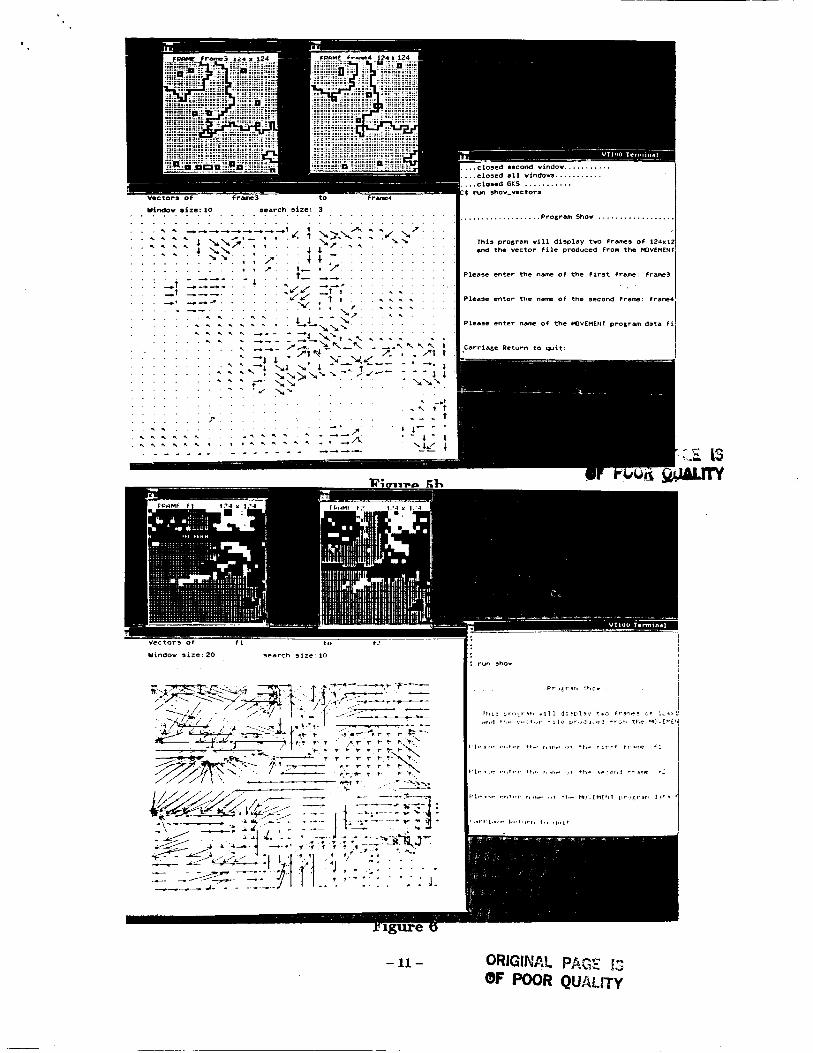
For the first approach (i.e., edge displacement), we initially merged the pairs of classes (on the classified image of Figure 2) which most resemble one another to obtain only two classes. It then becomes quite easy to determine the boundary of the cyclone clouds on each classified image as the boundary between these two classes. Although the merging was manually performed, it can easily be automated based on criteria of resemblance between the “profiles” characterizing each class. It is the boundary of the cyclone cloud mass that we want to follow to assess the cyclone’s displacement over the time interval between two images. Because of the selected size of the original boxes (32 km by 32 km) tire resuiting boundary has a very coarse resoiution which wouid not aiiow an accurate determination of its displacement. The accuracy is limited by the size of the pixel used to compute the displacement and by the period of time over which this displacement is estimated. To enhance the resolution of the boundary we reclassify its surrounding area by applying the TSF analysis to a data set that has a higher resolution (e.g., 8 km by 8 km). To automatically determine the region surrounding the edge of the cyclone cloud mass, we have developed an algorithm which is based on a gradient method with specified width around the region of high gradient. The first width tested contained 2 pixels on each side of the edge; the results of this procedure are presented in Figure 3. The second width contained one pixel on each side, to limit the area to be later reanalyzed; the results are presented in Figure 4. A comparison of the two sets of results suggests that the narrower width provides sufficient information for the classification and reduces the processing time (i.e. TSF analysis computing time) by a factor of four. Once this narrow region has been reclassified, we obtain a precisely located edge which can be followed from one image to the next (Figures 5a and 5b).
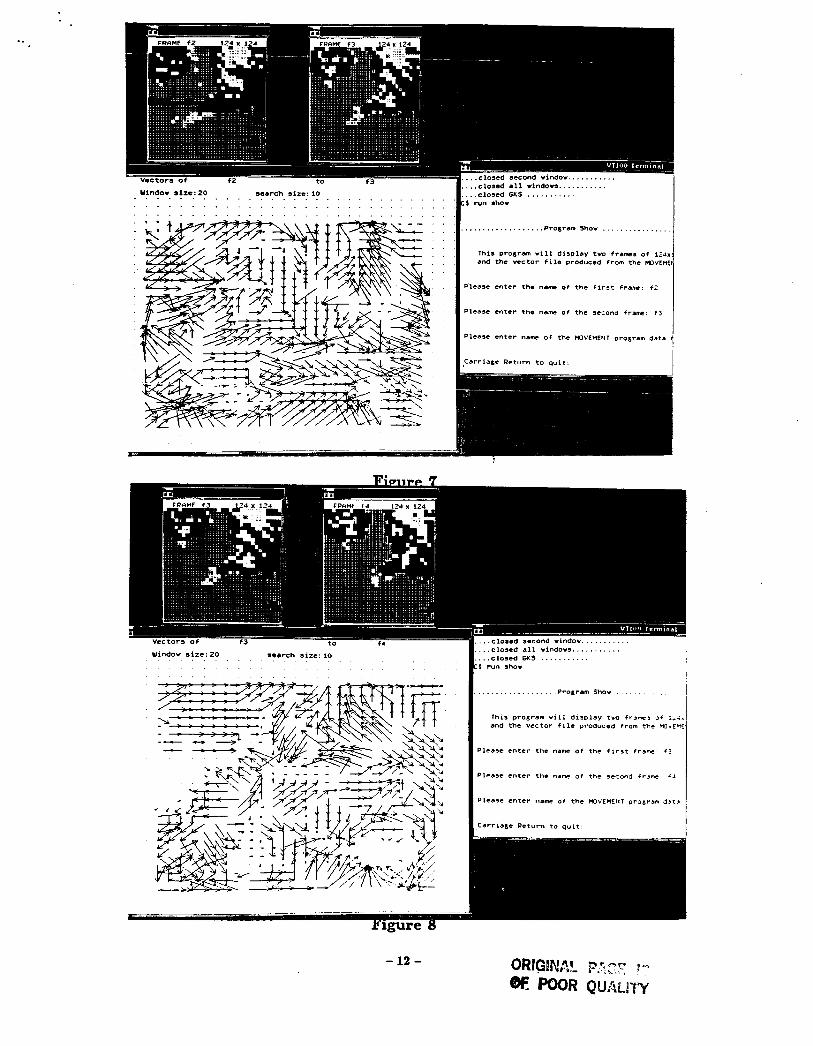
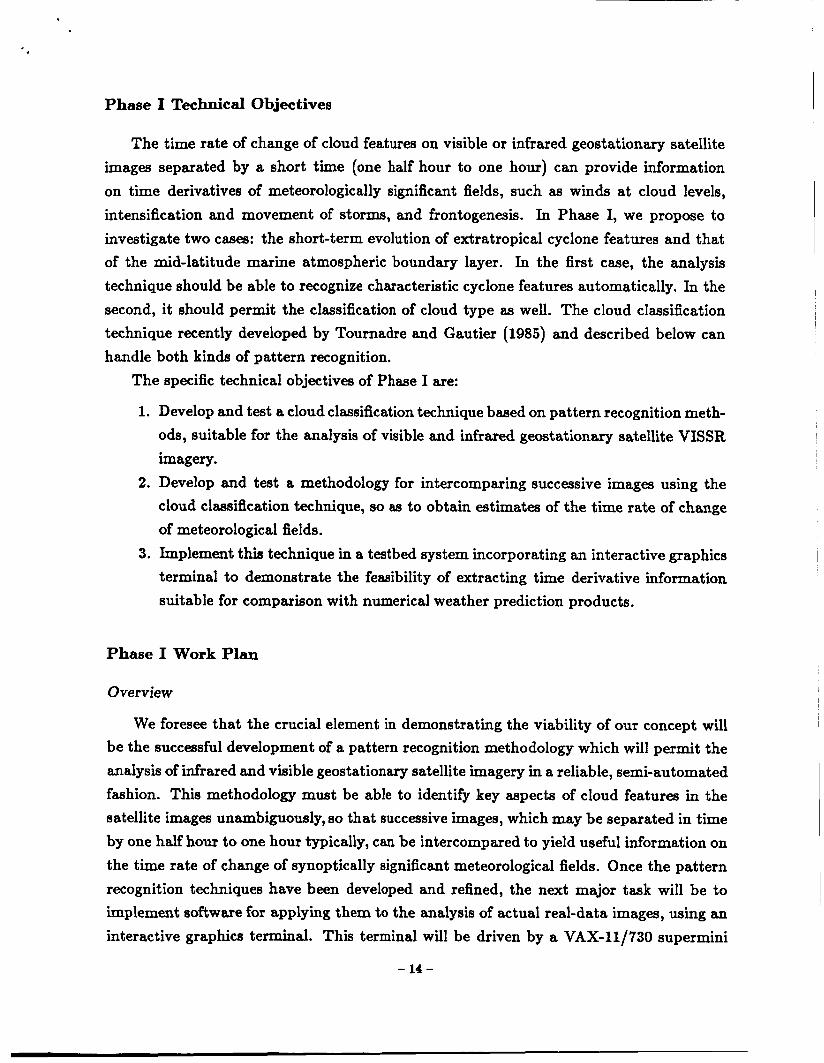
For the second approach we apply a pattern recognition technique known as the window matching technique to two successive classified images. A window of a limited size is selected on the first image and a search is made for the corresponding window (i.e. with the same brightness characteristics) on the second image. The second window is selected by the simple expedient of maximizing the correlation of the textures (classes). In order to minimize the time for the search we apply an artificial intelligence technique whereby the search is started from a point on the second image which corresponds to the center of the original window. The search continues outward from this point following a spiral pattern with the rate of change of the correlation values being continuously monitored as the search
- 5 -

extends outward. The search is terminated when a near perfect (3 .97 correlation value) match has been found. As soon as the rate of change of the correlation values becomes negative the search is terminated. Furthermore, the search is also terminated when the displacement becomes non-physical (this limit is provided a priori from meteorological knowledge). The region of maximum correlation value is thus selected as the matching region and the displacement is computed as the difference in location on the two successive images. Obviously, the accuracy of the time rate of change estimates depends on the alignment of the two images. Here we use the navigation parameters provided by NOAA to accurately register each individual image and verify this registration using landmarks and coastal information. This is achieved in a standard manner whereby the location of some coastal points is computed from the given navigation parameters and a coastline graphic is generated from an accurate data base (e.g., CIA orographic data base). This coastline graphic is then =.;er!aid CEtS the i m q e &Td the I.Izy.igatisn pg=a&ers &"e r e z o q u t e d
until the coastline graphic exactly matches the coastline detectable on the satellite images (i.e., the coastline characterized by a change in visible brightness or surface temperature on the satellite image). This procedure is performed only when a sufficiently large part of the coastline is detectable on the satellite image. Results obtained by applying this method to three pairs of successive classified images are presented in Figures 6, 7 and 8.
Future Work
The computed displacement vectors appear physically reasonable in both direction and magnitude, but the accuracy of the displacement estimations has not yet been validated. We propose to do that during Phase 11.
Several refinements of these two approaches are possible. One which seems especially attractive is to improve the definition of the edge (the frontier or border between the cyclone cloud mass and its environment) by performing the TSF analysis using overlapping boxes in the narrow strip or sub-domain which includes the edge.
These results appear to be extremely promising with respect both to the feasibility of the proposed technique and to its potential value for improving large-scale numerical weather predictions. By extracting time derivative information from sequences of geo- stationary images, we are recovering valuable observational information which has not previously been available to the analysis-forecast procedure. We conclude, on the basis of the Phase I results, that the original concept is indeed viable, and that proceeding to develop it to a practical technology in Phase I1 is justified. The Phase I results have also pointed the way to a number of improvements and extensions which we plan to carry out
- 6 -

during Phase 11.
- 7 -
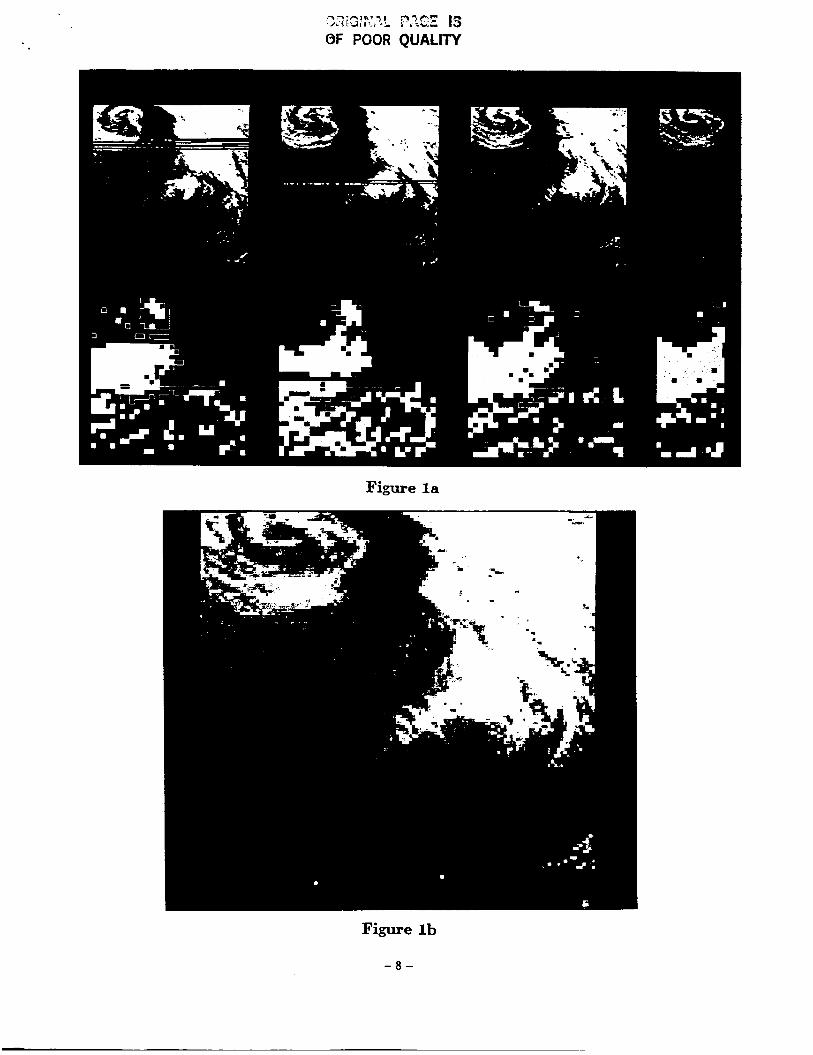
Figure la
Figure l b
- 8 -
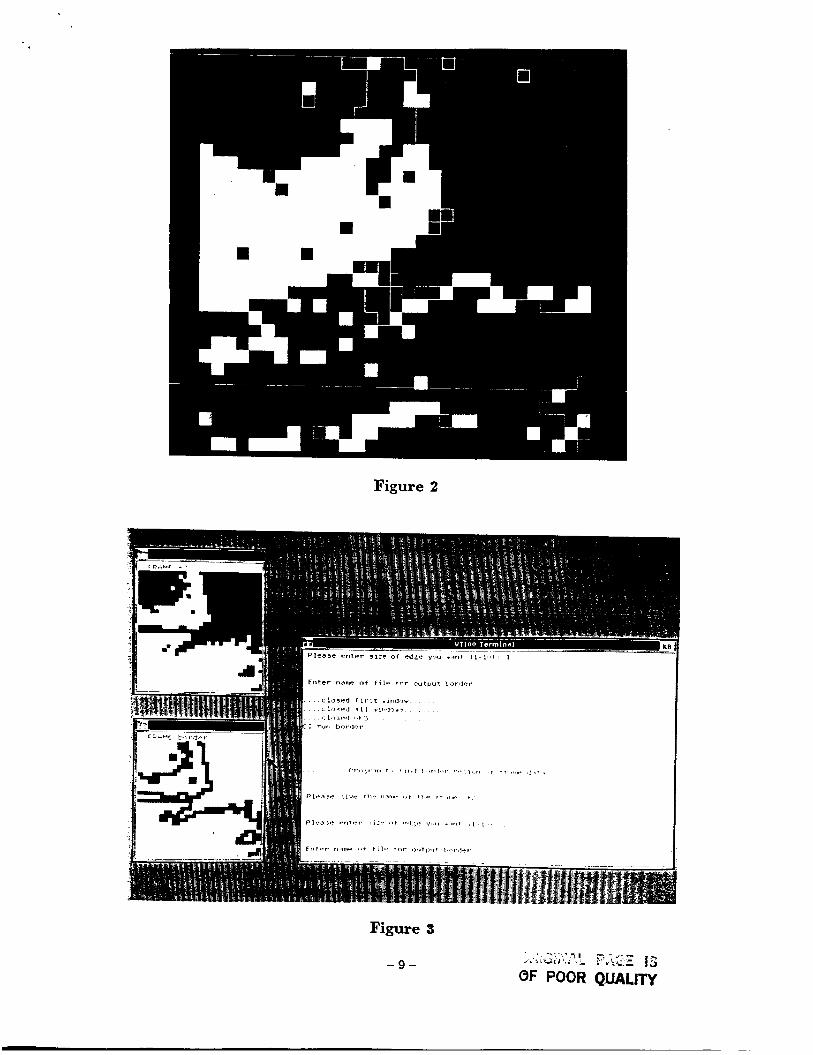
Figure 2
Figure 3
- 9 -
?
tal o f 10 f i l e s f run ~hOw.veCtor~
. . . . . . . . . . . . . . . . . . . . P r o g r ~ Show
Yindor aize: 10 search sirs: 3 . . . . . . . . . . . . . . . . . . . . . . . . . . . . . . . . . . . . . . . . . . . . . . . . . . . . . . . . .... -/PI 1 I t . . . . .... .<; k - , f P , , . . . . .... .=. 77-
. ... T - - - - . I . ?
L . - - - - - YL .-5 - - + . . _ - _ _ i h 4 , . - --- ---/7 7 7 . . * , . . .
/'PA ,<< 'r, I ::=zz
lhis prosran r i l l display t- fra-9 o f 124~12 ... . T r/'d ?>f. I and the vector file produced from the mvLMCtd1
- . . P i < - - - - . . . Plea¶e enter the nam of the fir-t fram: framl
Plea== enter the name of the second f rom. tram2 . ... . . . .
. . . . . . . . . . . . . . . . . .
. . . . _ . . . . . . . . . . . . . . .
. . . . . . . . . . . . . . . . . . . . .
Figure 5a
- 10 -
,
Vectors of t o f r-4
Uindor size: 10 search she: 3 . . . . . . . . . . . . . . . . . . . . . .
. . . : -t . ,?
. . . 4.
. . . .
. . . . , . . . .
. . . . . . . . . . . . . .
. . . . . . . . . . < 7;
. . . . . . . . . . . . . - - _ t
........ -. . . . . - ,-f 1 - 1 1 - 1 ...... , . , 1 . . .... - * -7. 'J.L I
7 . . . . . . . . . . . -. . . . - _ I
... closed second rindov ..........
... closed a l l r indow ...........
... closed GK5 ........... $ run shor-vectors
.................. Pro6ram Shov ..................
mis prorram ril l display tw f r m s of 124x12 m d the vector f i l e produced from the COVLMEHr
Please enter the nam o f the f i r s t f r m : fr-3
Please enter the name o f the second frbm: f ram4
Please enter nam O f the tQVEMEll I program data f i ,
Carriage Return to qu i t :
- 11 -
..
Window size: 20 search s ize : io . . . . . . . . . . . . . . . . . . . . . . . . . . . . . . . . . . . . . . . . . . . . . . . . . . . . . . . . . . . . . . . . . . . . . . . . . . . . . . . . .
... c losed a l l w i n d o n ........... . . . c losed GKS ........... :$ run shov
.................. . . . . . . . . . . . . . . . . I Prosram Shor
This program rill disDlay t V o f r a m s o f 124x and t h e vec to r f i l e produced from t h e M V L M E h
Please e n t e r t h e name of t h e f i r s t f r a m : f Z
Please e n t e r t h e n a m o f t h e second frame: f 3
Please e n t e r name of t h e M V E M E H T prosram data +
Carriage Return t o q u i t :
. . . . clo5ed a l l r i n d o n . . . . . . . . . . .
.... c losed GKS ........... L $ run s h o r
. . . . . . . . . . . . . . . . . . Prosram Shov . . . . . . . . .
This program rill d i s p l a y t w c Cram, of i.ir
I and t h e Vector f i l e PrOduCed from t h e n 3 ’ v E ” E
- 12 -

APPENDIX (FROM THE PHASE I PROPOSAL)
Identification and Sigdcance of the Innovation
The overall objective of this proposal is to develop a method for extracting time deriva- tive information from geostationary meteorological satellite imagery for the purpose of improving numerical weather prediction. In Phase I, we shall undertake to carry out a proof-of-concept study to demonstrate the feasibility of using pattern recognition tech- niques and a statistical cloud classification method to estimate time rates of change of large-scale meteorological fields from remote sensing data. Our intention in Phase I1 is to develop practical algorithms suitable for operational use and to implement these algorithms in an integrated stand-alone work station.
% % Great progress nas D e n made in ashi ld i i ig iiieteoio!ogid &te!!ite data tc aid in determining initial conditions for large-scale numerical weather prediction. Much of the recent increase in skill of operational forecasts is due to improvements in the initial state, brought about by modern objective analysis and initialization schemes which extract sta- tistically optimal estimates of the initial condition from a heterogeneous data set. In this process, asynoptic satellite data are employed to augment the conventional surface-based network of synoptic observations. The result is two analyses per day, at noon and midnight Greenwich time, from which operational weather forecasts are produced numerically.
Geostationary Visible Infrared Spin-Scan Radiometer (VISSR) and VISSR Atmo- spheric Sounder (VAS) satellite images, however, are available at half-hour intervals and could be used to verify the evolution of the meteorological fields during the first time steps of the numerical forecast integration. Much of the information content of these images is not used in constructing initial states. If analyzed by pattern recognition techniques to extract their full information content, sequences of such images provide the potential for de- termining observational estimates of the time derivatives of meteorological fields during the first few hours of the large-scale forecast period. Forecast verification studies, in conjunc- tion with predictablity theories, show that these early hours of the prediction are typically characterized by a rapid decay of skill. If observational estimates of time derivatives can be compared with numerical computations during this critical period, a potentially valuable new tool will have been made available for improving numerical weather prediction models. Such improvements may take several forms. For example, it may prove practical to correct dynamical models statistically using this new type of observational information, as well as to investigate the physical causes for dynamical model errors and thus to improve the realism of the models themselves.
- 13 -
Phase I Technical Objectives
The time rate of change of cloud features on visible or infrared geostationary satellite images separated by a short time (one half hour to one hour) can provide information on time derivatives of meteorologically significant fields, such as winds at cloud levels, intensification and movement of storms, and frontogenesis. In Phase I, we propose to investigate two cases: the short-term evolution of extratropical cyclone features and that of the mid-latitude marine atmospheric boundary layer. In the first case, the analysis technique should be able to recognize characteristic cyclone features automatically. In the second, it should permit the classification of cloud type as well. The cloud classification technique recently developed by Tournadre and Gautier (1985) and described below can handle both kinds of pattern recognition.
The specific technical objectives of Phase I are:
1. Develop and test a cloud classification technique based on pattern recognition meth- ods, suitable for the analysis of visible and infrared geostationary satellite VISSR imagery.
2. Develop and test a methodology for intercomparing successive images using the cloud classification technique, so as to obtain estimates of the time rate of change of meteorological fields.
3. Implement this technique in a testbed system incorporating an interactive graphics terminal to demonstrate the feasibility of extracting time derivative information suitable for comparison with numerical weather prediction products.
Phase I Work Plan
Overview
We foresee that the crucial element in demonstrating the viability of our concept will be the successful development of a pattern recognition methodology which will permit the analysis of infrared and visible geostationary satellite imagery in a reliable, semi-automated fashion. This methodology must be able to identify key aspects of cloud features in the satellite images unambiguously, so that successive images, which may be separated in time by one half hour to one hour typically, can be intercompared to yield useful information on the time rate of change of synoptically significant meteorological fields. Once the pattern recognition techniques have been developed and refined, the next major task will be to implement software for applying them to the analysis of actual real-data images, using an interactive graphics terminal. This terminal will be driven by a VAX-11/730 supermini
- 14 -
computer system during the proposed research, but this configuration may be regarded as a testbed for the integrated work station to be developed in Phase 11, which we envision will be based on a microcomputer system. Within Phase I, however, we shall conduct extensive numerical experimentation on the more versatile computer system (VAX-11/730) to determine the dependence of the results on parameters such as image size and resolution, as well as on the variable parameters of our pattern recognition scheme. This scheme itself is centered on a newly developed and versatile cloud classification scheme, and so we next devote the major part of this section to a brief description of that scheme.
Statistical Cloud Classification Method
Before clouds can be classified, they must be characterized by a convenient number of parameters, the choice of which depends on the particular application. Following Parikh (IO??), Weinman at al. (1985): and others, we use both spectral (visible, infrared and perhaps eventually microwave) and textural (mean of distribution, contrast, second angular momentum and entropy) parameters.
Once the set of parameters describing cloud field characteristics has been selected, satellite images can be analyzed to produce sets of these parameters for n x n pixel boxes from an initial image, in a way similar to the production of sets of profiles from radiosonde measurements. The set of box parameters can then be classified using the Typical Shape Function (TSF) analysis technique (Jalickee and Ropolewski, 1979; McMillinJ985).
Typical Shape Function Analysis
The TSF analysis is used to classify, in a restrictive and distinguishable form, the set of parameters describing the cloud fields. The first step in this classification is to remove the mean value of each parameter in order to analyze only fluctuations. Then the matrix A of parameter sets for an entire image is decomposed into singular values:
A = XAYT
X is the left singular vector matrix, Y is a right singular vector matrix and A is the diagonal matrix of the singular values. Only the eigenvalues required to explain 95% of the variance are retained. The associated eigenvectors, however, are in themselves insufficient to determine uniquely an exclusive classification. Such an exclusive classification can be obtained by computing a rotation matrix a such that:
PT = cvyT and
a = XAPT, with PT = a-l,
- 15 -
a is calculated iteratively by minimizing the rows of the right singular vector matrix Y, using Lagrange multipliers. The columns of ;k then become the Typical Shape Functions (TSF). Once obtained, these TSF can be employed to divide the data set into classes by computing the scalar product of the parameter sets and the TSF.
Feature Recognition
Cloud features and morphology can readily be recognized and outlined using this clas- sification scheme. In the case of extratropical cyclones, the characteristics to be extracted and quantified include the frontal cloud mass extension, the precise cold front location, and possibly the cloud structure in the cold air mass. This is expected to be achievable with the technique outlined above, and the feasibility of recognizing these features will be investigated thoroughly during the Phase I period. The next step will be to develop meth- ods for reliably tracking features from one image to the succeeding image, in a manner similar to that of Bouthemy and Benveniste (1984) or to methods used for deriving winds from cloud motions. Preliminary tests show that it is indeed possible to retrieve similar classes on two consecutive images separated by about one hour. Further tests are needed to establish the precision which can be achieved in the determination of the location and extension of the cloud mass, for example. In the case of the marine boundary layer, the advection of different air masses is characterized by different cloud types and morpholo- gies. Because our proposed analysis technique is capable of distinguishing among several kinds of cloud cover, we expect to be able to compare cloud model predictions with cloud observations partitioned into classes.
Intercomparison with Numerical Weather Prediction
Once we are able to estimate time rates of change (TROC) of meteorological variables from satellite imagery, we intend to carry out an illustrative comparison between a sample of our observation-based TROCs and a corresponding set of TROCs from an idealized numerical weather prediction model. For this purpose, we plan to use a quasi-geostrophic low-order spectral model (Roads and Somerville, 1984) initialized with conventional me- teorological data. Such a model is economical to integrate but produces creditably skillful short-range predictions of the large-scale features of the evolving atmospheric circulation. Such a model contains a limited number of adjustable parameters representing the effects of subgrid physical processes, such as friction. To illustrate the potential utility of obser- vational TROCs in improving dynamical forecast models, we plan to "tune" one or more such model parameters in regions of extratropical cyclone activity where model and ob- served fields of TROC differ systematically. Such a simple tuning in an idealized model is
- 16 -
.
a surrogate for the development of realistic parametric representations. If, as we expect, it ~
proves possible to improve forecast skill significantly by such a simple approach, we antic- ipate testing more ambitious applications of our concept, using physically comprehensive state-of-the-art forecast models, in Phase 11.
I
I
,
Bibliography
The following are cited in the text of the proposal:
Bouthemy, P. and A. Benveniste, 1983: Atmospheric Disturbances Tracking in Satellite Images, Image Sequence Processing and Dynamic Scene Analysis, T.S. Huang, eds., Springer-Verlag, Berlin.
Jalickee, J.B. and C.F. Ropolewski, 1979: An Objective Analysis of the Boundary- Layer Thermodynamic Structure during GATE, Monthly Weather Review, 107, 68-
76.
McMillin, L.M., 1985: Use of Typical Shape Functions of Radiance Vectors in Satellite Retrievals, to appear in Advances in Remote Sensing Retrieval Methods, published by IFAORS, A.Deepak, Editor.
Parikh, J., 1977: A Comparative Study of Cloud Classification Techniques, Remote Sensing of Environment, 6, 67-81.
Roads, J.O., and R.C.J. Somerville, 1984: Linear predictability: Effects of stationary forcing. Predictability of Fluid Motions, G. Holloway and B.J. West (eds.), American Institute of Physics, 106 New York, 557-570.
Tournadre J. and C. Gautier, 1985: Satellite Cloud Morphology Analysis using Typical Shape Functions, to be submitted to Journal of Climate and Applied Meteorology.
Weinman, J.A., B.R. Markstrom and R. Wu, 1985: Applications of Computer Pattern Analysis Techniques to Meteorological Satellite Images-Rainfall Estimation and Pat- tern Analysis of Extra-Tropical Cyclones, to appear in Advances in Remote Sensing Retrieval Methods, published by IFAORS, A. Deepak, Editor.
Additional References: ,
The following general references describe techniques on which we shall draw:
Image Sequence Processing and Dynamic Scene Analysis, edited by T.S.Huang, NATO AS1 Series, Springer-Verlag, 1983.
- 17 -
Parameter Estimation, H.W.Sorenson, Marcel Dekker, 1980.
Discrete Techniques of Parameter Estimation, J.M.Mende1, Marcel Dekker, 1973.
Stat is t ical Estimation, Asymptotic Theory, I. A.Ibragimov, R. 2 .Has'minskii, Springer- Verlag, 1981.
Estimation of Dependences Based on Empirical Data, V1.Vapnik (specific chapters on "Methods and Algorithms of Parametric Statistics for the Pattern Recognition Problem"), Springer-Verlag, 1982
Applied Time Series Analysis, R.K.Otnes, L.Enochson, John Wiley and Sons, 1978.
I /
Image Pattern Recognition, V . A. Kovalevs k y, S pr inger-Ver lag, 1980.
R.elationship with Future Research and R&D
Phase I of this proposal, as described above, is a proof-of-concept study to demonstrate the feasibility of using pattern recognition techniques and a statistical cloud classification method to estimate time rates of change of large-scale meteorological fields from remote sensing data. The anticipated results are the successful achievement of the technical ob- jectives listed above: development of the cloud classification technique, development of the intercomparison methodology for estimating time rates of change, and implementation in a testbed system incorporating an interactive graphics terminal. We also anticipate the successful testing of the concept of using these data to improve a numerical weather prediction model, as outlined above.
Phase I1 will build on the foundation of these results to produce a fully operational stand-alone work station to enable the benefits of this research to be realized in a real- time numerical weather prediction environment. We anticipate that this work station will include an interactive graphics terminal driven by a microprocessor. Software included with this work station will embody the features outlined above and will be implemented using artificial intelligence concepts to facilitate use in an operational forecasting center.
k.
- 18 -


![Satellite Imagery Product Specificationslps16.esa.int/posterfiles/paper1213/[RD16]_RE_Product... · 2016-04-22 · Satellite Imagery Product Specifications 6 2 RAPIDEYE SATELLITE](https://img.pdfslide.net/doc/110x75/5eba16697328255ddd5746a8/satellite-imagery-product-rd16reproduct-2016-04-22-satellite-imagery-product.jpg)