Embed Size (px)
Citation preview
Introduction
Lepr Rev ( 1 99 1 ) 62, 1 58- 1 70
Patterns of erythropoeisis and anaemia in
leprosy
R S E N , S S Y A D A V , U M A S I N G H , P S E H G A L & V B D I X I T Departments of Pathology, Dermatology and Venereology, Medical
College, Rohtak 124001 (Haryana) , India
Accepted for publication 1 9 November 1 990
Summary A total of 1 28 leprosy patients were investigated for the morphological type of anaemia, the underlying disturbances in iron metabolism and patterns of erythropoiesis and other cytomorphological changes in the bone marrow. The anaemia was a mild to moderate degree in paucibacillary (PB) leprosy, while in multi bacillary (MB) leprosy it was of a severe degree. Iron deficiency was observed in only a few patients. Impaired iron utilization as observed in anaemia of a chronic disorder was a common finding in M B leprosy (4 1 , 7 % ) and more so in new cases (50%) . Megaloblastic erythropoiesis was also more frequent in M B leprosy (45 ,2%) a s compared t o P B leprosy ( 1 6%) , accounting for the severe degree of anaemia in the former type. In 1 7 ·2% of the total patients (MB, 2 1 ·4%;
PB, 9 % ) both megaloblastic erythropoiesis and features of impaired iron utilization were observed in bone marow. Disturbances in iron metabolism and erythropoiesis were also observed but to a lesser degree in patients receiving specific antileprosy treatment. Irrespective of the type of disease and duration of treatment, increasing frequency of acid-fast baci ll ia (AFB) postivity and granulomas was observed in the bone marrow with an increasing severity of anaemia.
Anaemia of mild to moderate severity, and at times refractory to treatment has been observed frequently in leprosy patients. 1 -4 The anaemia may be normocytic normochromic. Hypochromic RBCs . in almost all the patients of lepromatous leprosy and megaloblastic erythropoiesis in a significant proportion of cases have also been reported. 2,5 Disturbances in iron metabolism and haemolysis ind uced by dapsone or lepra reaction may be the other mechanisms contributing to the development of anaemia.6- l o
So far, efforts have not been made to elucidate the various patterns of erythropoiesis in relation to the development of anaemia in leprosy patients. In the present study, we are presenting a comparative analysis of different morphological types of anaemia and the underlying patterns of erythropoiesis in bone marrow in multi bacillary (M B) and paucibacillary (PB) leprosy.
1 58 0305-75 1 8/9 1 /062 1 58 + 1 3 $0 1 .00 © Lepra
Materials and methods
Patterns of erythropoeisis and anaemia in leprosy 1 59
A total of 1 28 leprosy patients, proved on slit and scrape smears and histopathological examination of skin, were randomly selected from the outpatient departments and wards of the Medical College and Hospital, Rohtak. Patients reporting for the first time and those receiving specific multidrug therapy for 6 months to 3 years were included in the study. However, patients in whom investigative protocol could not be completed and those receiving anti leprosy treatment for less than 6 months' duration were excluded . These patients were classified according to Ridley-Jopling's classification. 3 In all the patients, slit and scrap smears and histologic examination of skin biopsy were routinely performed to establish the bacillary index. They were grouped into two groups (WHO 1 982, Technical Series Report No. 675) : group A, multibacillary (MB); and group B, paucibacillary (PB) types as shown in Table I . The MB group included lepromatous (LL), borderline lepromatous (BL) and mid borderline (BB) patients. The PB group included tuberculoid (TT), borderline tuberculoid (BT) and indeterminate (I) patients.
All the patients were subjected to the following investigations:
Routine investigations including, Hb, M CV, MCH, M CHC, PCV, ESR, peripheral blood film (PBF) and urine examination.
Bone marrow examination-Bone marrow was aspirated from the anterior superior iliac spine or sternum taking precautions to avoid contamination by bacteria present in the overlying skin . The smears were stained with: (a) May-Grunwald Giemsa stain to study the cytomorphological changes with particular emphasis on erythropoiesis and presence or absence of granulomas; (b) Prussian blue stain to record iron stores present in bone marrow. Bone marrow iron stores were graded semiquantitatively according to Wintrobe. J J The percentage of sideroblasts was recorded; and (c) Ziehl-Neelsen staining to detect the presence of lepra bacilli .
Iron studies-serum iron, total iron binding capacity (TIBC) and percentage saturation of transferrin were performed in all cases .
In addition, urine urobilinogen; direct, indirect and total serum bilirubin; direct Coomb's test;G-6PD estimation and reticulocyte counts were performed to investigate haemolysis wherever necessary .
Table I . Distribution of patients
Group A (MB) Group B (PB)
New Cases on New Cases on Type cases treatment Type cases treatment
Lepromatous (LL) 5 2 1 Borderline tuberculoid (BT) 1 5 1 4 Borderline lepromatous (BL) 28 1 0 Tuberculoid (TT) 6 5 Midborderline (BB) I I 9 Indeterminate (I) I 3
Total 44 40 22 22
1 60 R Sen et al .
Observations
The patients were divided in two groups (Table I ) . Group A comprised of 84 patients with MB leprosy, amongst which 44 had reported for the first time and 40 had been receiving multidrug therapy.
Group B comprised of 44 patients with PB leprosy. Half of these were new and the other half were on multidrug therapy.
While none of the patients with PB leprosy had a Hb value of less than 9 gm/dl, a greater severity of anaemia was observed in patients with M B leprosy (Table 2) .
Table 3 shows morphological patterns of anaemia. Morphological patterns of anaemia were determined on visual impression of blood films as well as red cell indices . In normocytic normochromic picture, the MCV, MCH and MCHC were in ranges of 83-96 fl, 27-3 1 pg and 32-36 gm/dl respectively . In microcytic hypochromic anaemia, the indices were : MCV, 55-80 fl; MCH, 1 5-27 pg; and MCHC, 20-30 gm/dl . Cases with macrocytic anaemia had MCV in the range of 98- 1 30 fl; MCH, 34-42 pg; and MCHC, 32-36 gm/dl . In a normocytic hypochromic blood picture the visual impression was substantiated by finding MCV in the normal range (83-97 fl) and MCHC ranging between 24 and 32 gm/dl . A dimorphic picture was determined chiefly on assessment of RBC's in PBF because the red cell indices were inconclusive due to marked variation in the size of RBCs. A blood picture was considered haemolytic on finding many normoblasts and increased reticulocyte count with alterations in RBC morphology.
In group A, hypochromasia indicative of deficient haemoglobin synthesis (types 2 , 3 and 5) was observed in approximately 60% of the new patients whereas 40% revealed macrocytosis (types 4 and 5). More than 50% of the patients receiving treatment had normocytic normochromic RBCs and macrocytosis was again a feature in 27· 5 % of patients on treatment. In group B , most of the patients (82% ) had normocytic normochromic picture and the percentage of such patients increased in those receiving treatment (93 % ) . A haemolytic picture was seen in three patients of group A, one new and two on treatment . One of these two cases on treatment had features of erythema nodosum leprosum (ENL) . Direct antiglobulin Coomb test with broad spectrum antisera was positive on one patient only (ENL on treatment), while none showed G-6PD deficiency.
Table 2. Severity of anaemia
Group A (MB) Group B (PB)
New Cases on New Cases on Haemoglobin cases treatment cases treatment (gm(dl) (%) (%) (%) (%)
> 1 3 0 1 0 1 8 ·2 22 ·7 1 1 - 1 3 45 ·5 40 36-4 45 ·5 9- 1 1 1 5 ·9 25 45 ·4 3 1 · 8 7-9 3 1 · 8 25 0 0
< 7 6 · 8 0 0 0
Total 1 00 (44) 1 00 (40) 1 00 (22) 1 00 (22)
Note: Figures in parentheses denote number of patients in each group.
Patterns of erythropoeisis and anaemia in leprosy 1 6 1
Table 3. Anaemia-morphological types according to severity
Group A (MB) Group B (PB)
New Cases on New Cases on Hb cases treatment cases treatment
Type (gmjdl) (%) (%) (%) (%)
I Normocytic normochromic < 7 0 0 0 0 7- 1 3 1 8 · 2 45 68 ·2 68 ·2
> 1 3 0 1 0 1 3 · 6 22 ·7
2 Normocytic hypochromic < 7 0 0 0 0 7- 1 3 1 3 · 6 10 4 ·55 9 · 1
> 1 3 0 0 4 ·55 0
3 Microcytic hypochromic < 7 2 · 3 0 0 0 7- 1 3 22 ·7 2 · 5 9 · 1 0
> 1 3 0 0 0 0
4 Macrocytic < 7 2 · 3 0 0 0 7- 1 3 1 5 ·9 1 5 0 0
> 1 3 0 0 0 0
5 Dimorphic < 7 2 · 3 0 0 0 7- 1 3 20-4 1 2 · 5 0 0
> 1 3 0 0 0 0
6 Haemolytic < 7 0 0 0 0 7- 1 3 2 · 3 5 0 0
> 1 3 0 0 0 0
Total 1 00 (44) 1 00 (40) 1 00 (22) 1 00 (22)
Note: Figures in parentheses indicate total number of patients in each group.
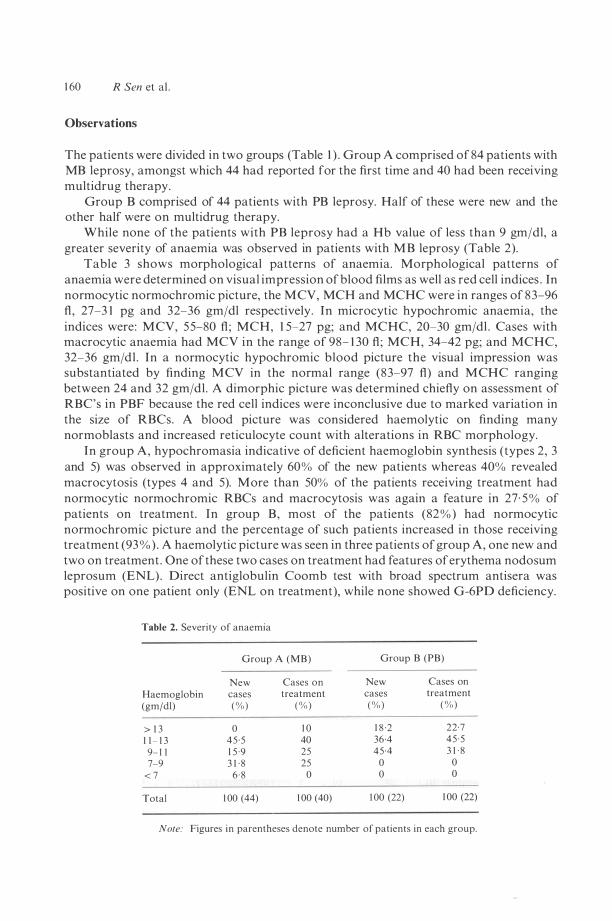
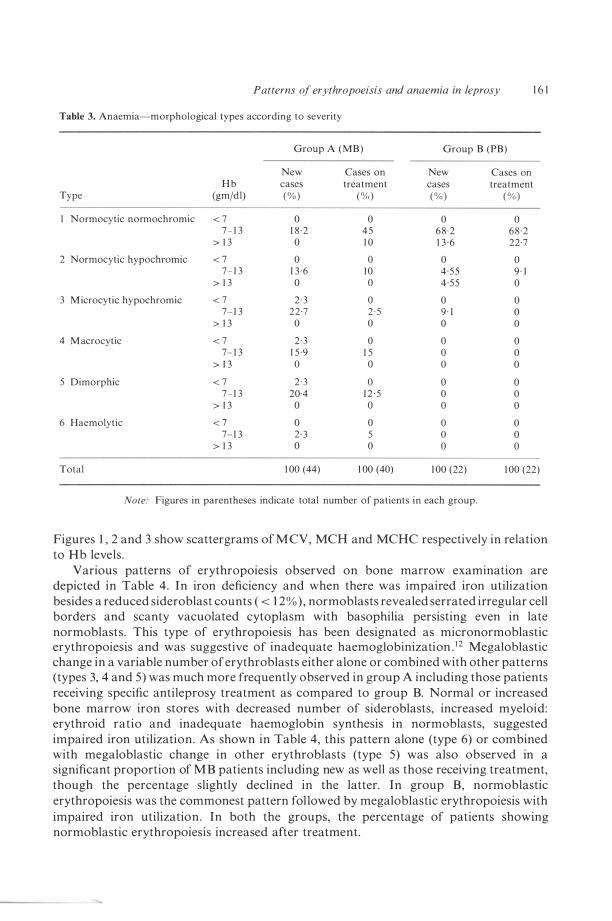
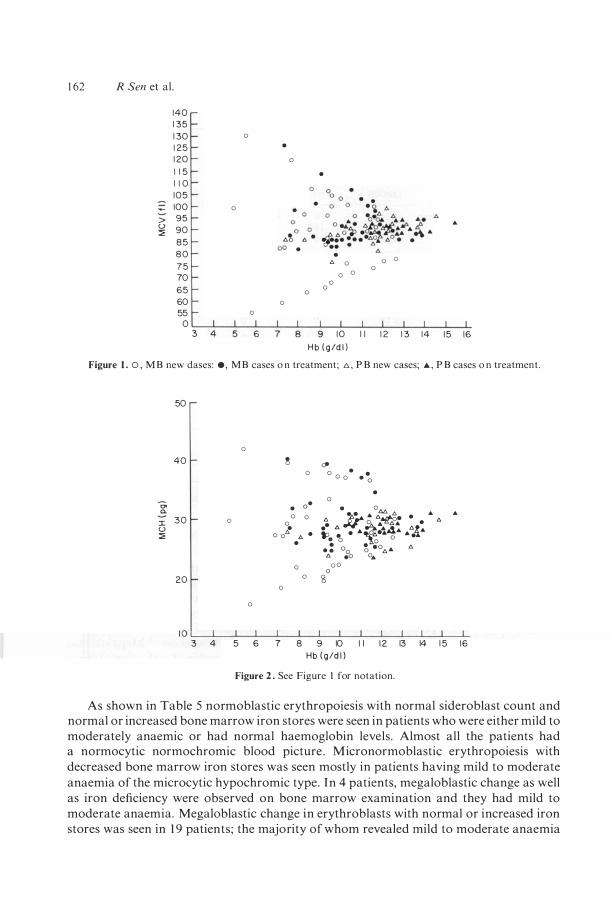
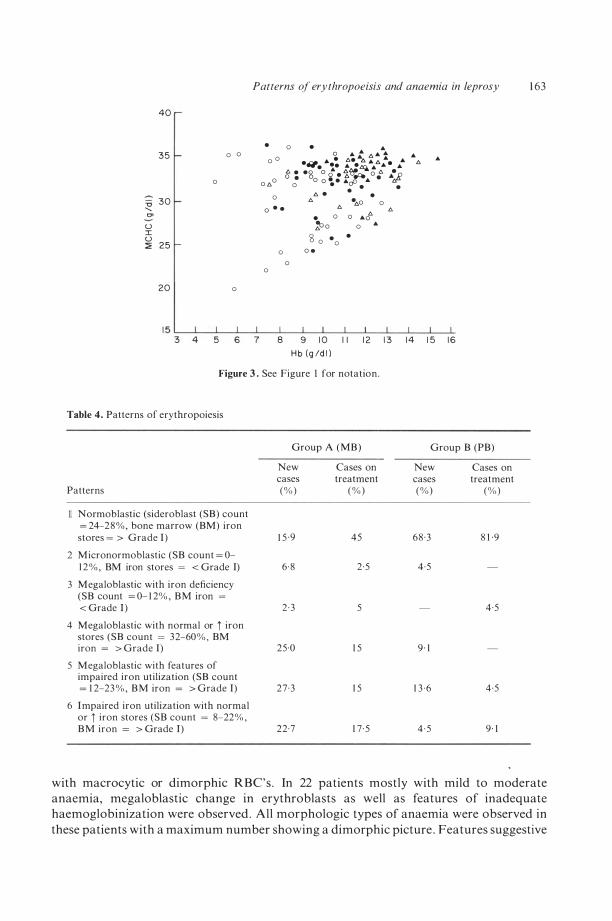
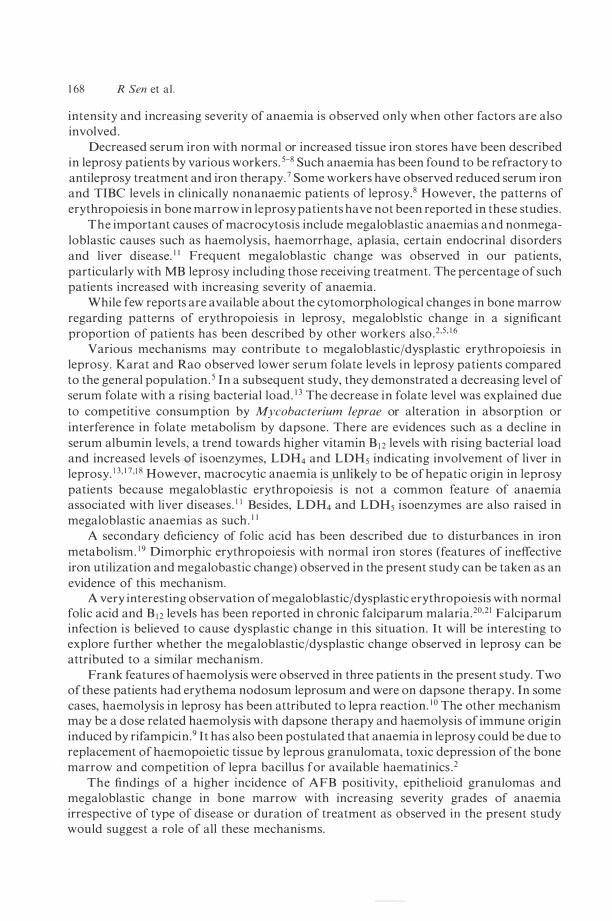
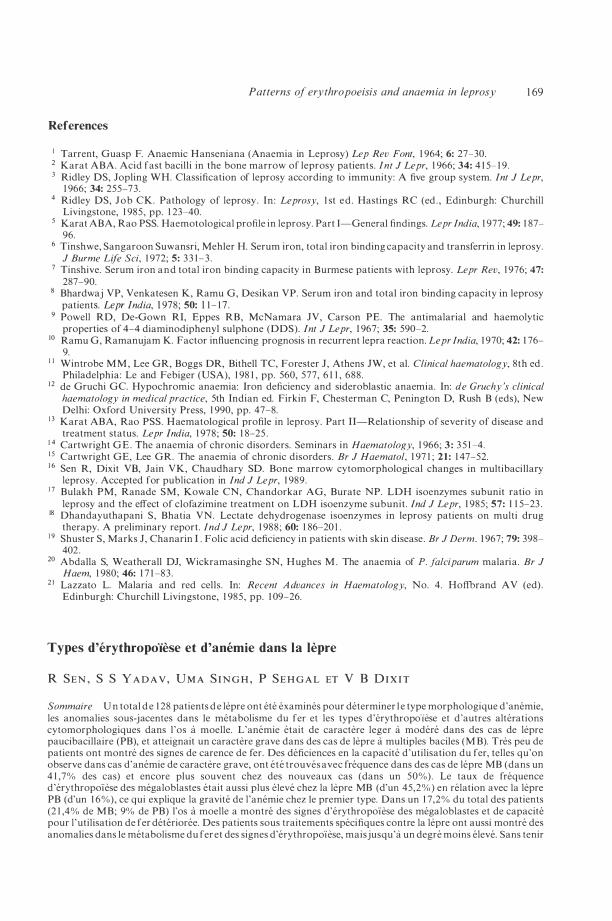
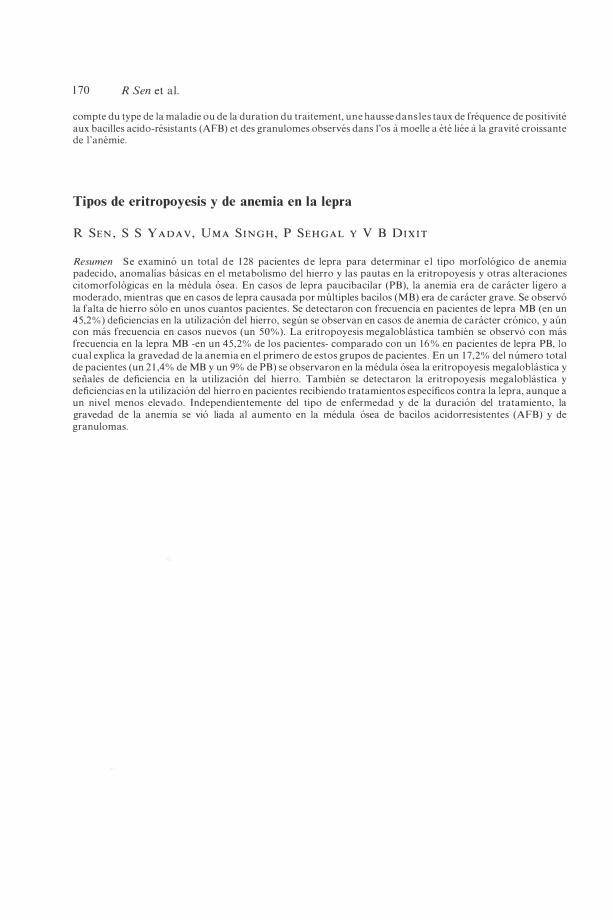
Figures 1 , 2 and 3 show scattergrams of M CV, MCR and MCRC respectively in relation to Hb levels .
Various patterns of erythropoiesis observed on bone marrow examination are depicted in Table 4 . In iron deficiency and when there was impaired iron utilization besides a reduced sideroblast counts ( < 1 2%) , normoblasts revealed serrated irregular cell borders and scanty vacuolated cytoplasm with basophilia persisting even in late normoblasts . This type of erythropoiesis has been designated as micronormoblastic erythropoiesis and was suggestive of inadequate haemoglobinization . 1 2 Megaloblastic change in a variable number of erythroblasts either alone or combined with other patterns (types 3, 4 and 5) was much more frequently observed in group A including those patients receiving specific anti leprosy treatment as compared to group B. Normal or increased bone marrow iron stores with decreased number of sideroblasts, increased myeloid: erythroid ratio and inadequate haemoglobin synthesis in normoblasts, suggested impaired iron utilization. As shown in Table 4, this pattern alone (type 6) or combined with megaloblastic change in other erythroblasts (type 5) was also observed in a significant proportion of M B patients including new as well as those receiving treatment, though the percentage slightly declined in the latter. In group B, normoblastic erythropoiesis was the commonest pattern fol lowed by megaloblastic erythropoiesis with impaired iron utilization. In both the groups, the percentage of patients showing normoblastic erythropoiesis increased after treatment.
1 62 R Sen et al .
1 40 1 35 1 30 0 1 25 • 1 20 o 1 1 5 • 1 1 0 105 100 0
> 95 u 90 :::;;; ..
8 5 8 0 7 5
• 0 " 0 0 0 70 0 0 0 65 0 0 60 0 55 0
0 3 1 0 I I 1 2 1 3 14 1 5 16
H b ( g /d l )
Figure 1 . 0 , M B new dases: e , M B cases o n treatment; 1:> , P B new cases; A , P B cases o n treatment .
0. a. J: U :::;;;
50
0 40 �
0
• o· 30 0 0 0 0
� 0 0 " . •
0 20 0
0 o
� 0 0 0 • • · 0 • 0
• oM t:. )j.a '" t::.�. . ... t:. • � ... .o. ... . • l::. ... d. t:.� .. � • • "'�.6.." ... ... . • 0 0 0 . : 00 � .0.6,'" t:. 6. .0 0 ... 00 0
'3
..
1 0 L--L __ �� __ -L __ L--L __ L--L __ �� __ �� __ -L 3 4 5 6 7 8 9 10 I I 1 2 13 14 1 5 16
Hb ( g /d l )
Figure 2 . See Figure t for notation.
As shown in Table 5 normoblastic erythropoiesis with normal sideroblast count and normal or increased bone marrow iron stores were seen in patients who were either mild to moderately anaemic or had normal haemoglobin levels. Almost all the patients had a normocytic normochromic blood picture . Micronormoblastic erythropoiesis with decreased bone marrow iron stores was seen mostly in patients having mild to moderate anaemia of the microcytic hypochromic type . In 4 patients, megaloblastic change as well as iron deficiency were observed on bone marrow examination and they had mild to moderate anaemia. Megaloblastic change in erythroblasts with normal or increased iron stores was seen in 1 9 patients; the majority of whom revealed mild to moderate anaemia
40
35 o 0
0
-c 30 "-'" u I u :::;: 25
20 0
Patterns of erythropoeisis and anaemia in leprosy 1 63
• 0 0
0 ",0 0
0 · ·
0 0
8
0 • o ... t 1::. 11.. ...... • eI. ... . 6. ;6. ... 1::. .... ... . .. ... . .l:Q.. ... ... ...
g • • S o � .. . 'Xf't'A 0 "' :£ ; 0 0 . - .cP . .. • 6:.
0
'" '" . . '"
• ·",0 • 0 0 '" "0 � o 0 ..
S o • • 0 o .
0 '"
.. .. '"
9 1 0 I I 1 2 1 3 1 4 1 5 1 6 H b (g /d l l
Figure 3 . See Figure I for notation .
Table 4 . Patterns of erythropoiesis
Group A (MB) Group B (PB)
New Cases on New Cases on cases treatment cases treatment
Patterns (%) (% ) (% ) (% )
Normoblastic (sideroblast (SB) count = 24-2 8 % , bone marrow (BM) iron stores = > Grade I ) 1 5 ·9 45 68 ·3 8 1 ·9
2 M icronormoblastic (SB count = 0-1 2 % , BM iron stores = < Grade I) 6 ·8 2 ·5 4 ·5
3 Megaloblastic with iron deficiency (SB count = 0- 1 2% , BM iron = < Grade I ) 2 · 3 5 4 ·5
4 Megaloblastic with normal or i iron stores (SB count = 32-60 % , BM iron = > Grade I) 25 ·0 1 5 9 · 1
5 Megaloblastic with features of impaired iron utilization (SB count = 1 2-23 % , B M iron = > Grade J) 27 ·3 1 5 1 3 0 6 4 ·5
6 Impaired iron utilization with normal or i iron stores (SB count = 8-22% , B M iron = > Grade J) 22·7 1 7 · 5 4 · 5 9 · 1
with macrocytic or dimorphic RBC's . In 22 patients mostly with mild to moderate anaemia, megaloblastic change in erythroblasts as well as features of inadequate haemoglobinization were observed . All morphologic types of anaemia were observed in these patients with a maximum number showing a dimorphic picture . Features suggestive
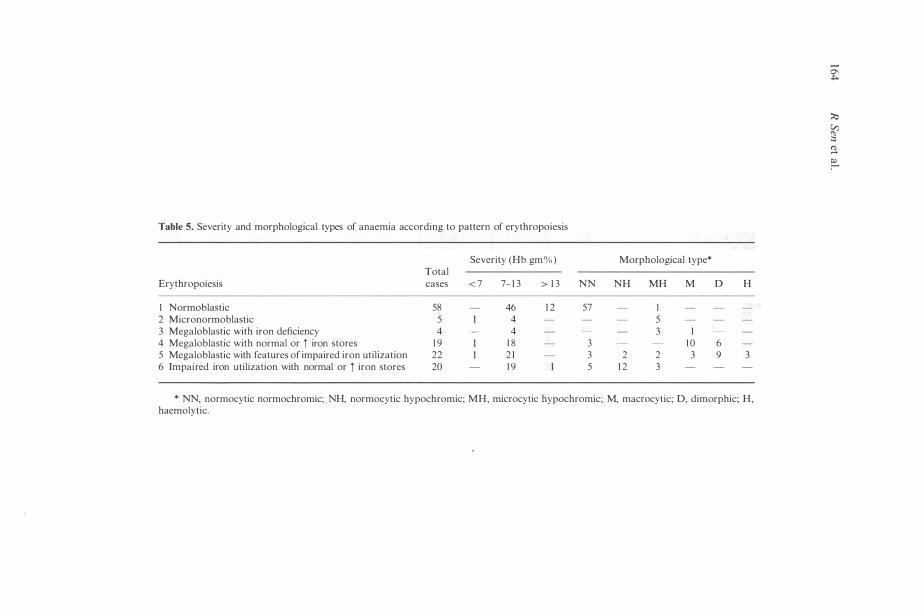
Table 5. Severity and morphological types of anaemia according to pattern of erythropoiesis
Severity (Hb gm%) Morphological type* Total
Erythropoiesis cases < 7 7- 1 3 > 1 3 NN NH MH M D H
I Normoblastic 58 46 1 2 57 I 2 Micronormoblastic 5 4 5 3 Megaloblastic with iron deficiency 4 4 3 I 4 Megaloblastic with normal or i iron stores 1 9 1 8 3 1 0 6 5 Megaloblastic with features of impaired iron utilization 22 2 1 3 2 2 3 9 3 6 Impaired iron utilization with normal or i iron stores 20 1 9 5 1 2 3
* NN, normocytic normochromic; NH, normocytic hypochromic; MH, microcytic hypochromic; M, macrocytic; D, dimorphic; H, haemolytic.
�
� � ;:, � e:..
Patterns of erythropoeisis and anaemia in leprosy 1 65
Table 6. Iron studies
Group A (MB) Group B (PB)
New Cases on New Cases on cases treatment cases treatment (%) (%) ( % ) (%)
A M arrow iron Normal marrow iron (Grade II-III) 54 ·5 50·0 68·2 59· 1 Iron deficiency (Grade 0-1) 9 · 1 7 · 5 4 · 5 4 ·5 Increased marrow iron (Grade IV&VI) 36-4 42·5 27 · 3 36 -4
B Serum iron Reduced ( < 65 /lg/dl) 65 ·9 37 · 5 22 ·7 1 8 · 1 Normal (65- 1 75 /lg/dl) 34· 1 62 ·5 77 -3 8 1 ·9
C TIBC Reduced ( < 250 /lg/dl) 6 1 04 32 ·5 27 ·3 1 3 · 6 Normal (250-420 /lg/dl) 34· 1 62 ·5 72 ·7 8 1 ·9 Increased ( > 420 /lg/dl) 4 · 5 5 ·0 4 · 5
o TSI < 1 0 % 6 · 8 2 · 5 4 · 5
1 1 - 1 5 % 2 ·27 5 ·0 4 ·5 1 6-20% 2% 1 5 ·0 9 · 1 9 · 1 2 1 -25% 20· 5 1 7 · 5 9 · 1 4 ·5
> 25 % 40·83 60·0 77 -3 8 1 ·9
E Impaired iron: utilization (Serum iron = 50-70 /lgm/dl, TIBC = 200-280 /lgm/dl, TSI = 1 5-25 % , SB count = 8-
2 3 % , B M iron stores = Grade I I-VI) 50·0 32 · 5 1 8 · 2 1 3 · 6
• o
..
Figure 4. See Figure I for notation .
1 66 R Sen et al .
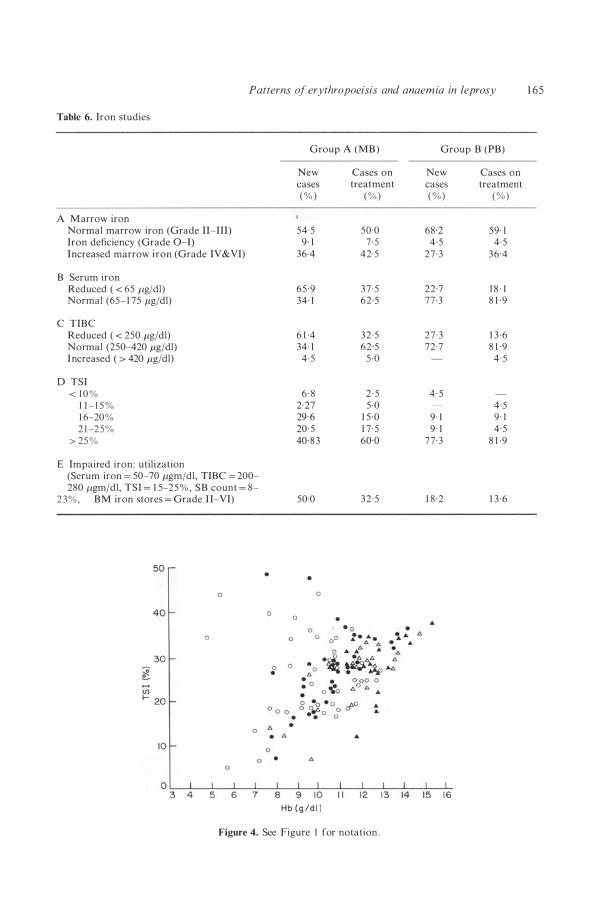
Figure 5. Tuberculoid leprosy. Bone marrow aspirate-May-Grunwald Giemsa's stain, 200 x , the macrophage in the centre shows a large number of siderotic granules. The erythroblasts surrounding the macrophage show serrated cell borders and a scant amount of cytoplasm around the nuclei indicating inadequate haemoglobinization.
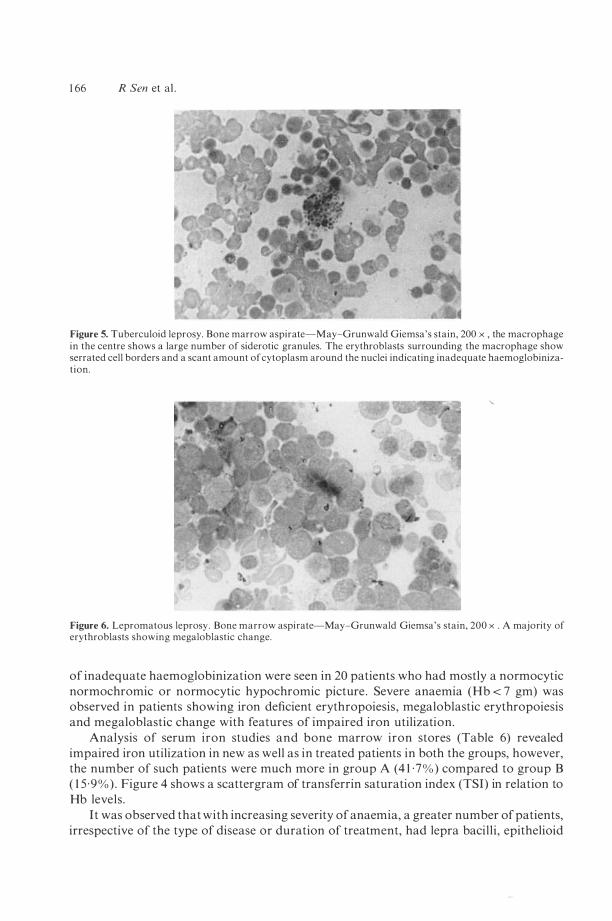
Figure 6. Lepromatous leprosy . Bone marrow aspirate-May-Grunwald Giemsa's stain, 200 x . A majority of erythroblasts showing megaloblastic change.
of inadequate haemoglobinization were seen in 20 patients who had mostly a normocytic normochromic or normocytic hypochromic picture . Severe anaemia (Hb < 7 gm) was observed in patients showing iron deficient erythropoiesis , megaloblastic erythropoiesis and megaloblastic change with features of impaired iron utilization.
Analysis of serum iron studies and bone marrow iron stores (Table 6) revealed impaired iron utilization in new as well as in treated patients in both the groups, however, the number of such patients were much more in group A (4 1 ' 7 % ) compared to group B ( 1 5 · 9%) . Figure 4 shows a scattergram of transferrin saturation index (TSI) in relation to Hb levels .
It was observed that with increasing severity of anaemia, a greater number of patients, irrespective of the type of disease or duration of treatment, had lepra bacilli , epithelioid
Patterns of erythropoeisis and anaemia in leprosy 1 67
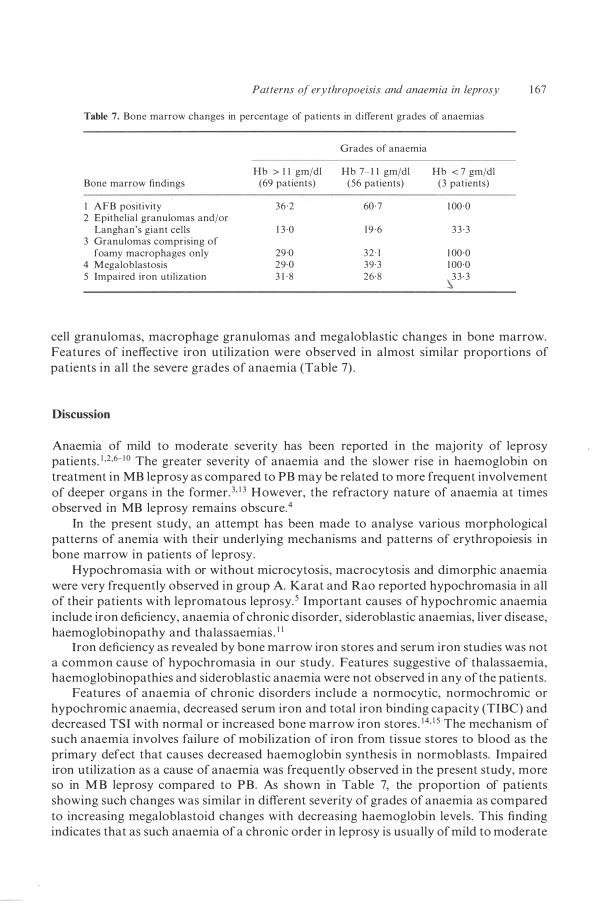
Table 7. Bone marrow changes in percentage of patients in different grades of anaemias
Grades of anaemia
Hb > I I gm/dl Hb 7- 1 1 gm/dl Hb < 7 gm/dl Bone marrow findings (69 pa lien ls) (56 patients) (3 pa tien ts)
I AFB positivity 36 ·2 60 · 7 1 00 ·0 2 Epithelial granulomas and/or
Langhan's giant cells 1 3 ·0 1 9 · 6 3 3 · 3 3 Granulomas comprising of
foamy macro phages only 29·0 32 · 1 1 00 ·0 4 Megaloblastosis 29 ·0 39 ·3 1 00·0 5 Impaired iron utilization 3 1 · 8 26 ·8 3 3 · 3
.\
cell granulomas, macrophage granulomas and megaloblastic changes in bone marrow. Features of ineffective iron utilization were observed in almost similar proportions of patients in all the severe grades of anaemia (Table 7) .
Discussion
Anaemia of mild to moderate severity has been reported in the majority of leprosy patients . 1 ,2,6- 1 0 The greater severity of anaemia and the slower rise in haemoglobin on treatment in MB leprosy as compared to PB may be related to more frequent involvement of deeper organs in the former. 3, 1 3 However, the refractory nature of anaemia at times observed in MB leprosy remains obscure.4
In the present study, an attempt has been made to analyse various morphological patterns of anemia with their underlying mechanisms and patterns of erythropoiesis in bone marrow in patients of leprosy .
Hypochromasia with or without microcytosis, macrocytosis and dimorphic anaemia were very frequently observed in group A. Karat and Rao reported hypochromasia in all of their patients with lepromatous leprosy. 5 Important causes of hypochromic anaemia include iron deficiency, anaemia of chronic disorder, sideroblastic anaemias, liver disease, haemoglobinopathy and thalassaemias . 1 1
Iron deficiency as revealed by bone marrow iron stores and serum iron studies was not a common cause of hypochromasia in our study. Features suggestive of thalassaemia, haemoglobinopathies and sideroblastic anaemia were not observed in any of the patients.
Features of anaemia of chronic disorders include a normocytic, normochromic or hypochromic anaemia, decreased serum iron and total iron binding capacity (TIBC) and decreased TSI with normal or increased bone marrow iron stores . 1 4, 1 5 The mechanism of such anaemia involves failure of mobilization of iron from tissue stores to blood as the primary defect that causes decreased haemoglobin synthesis in normoblasts. Impaired iron utilization as a cause of anaemia was frequently observed in the present study, more so in M B leprosy compared to PB. As shown in Table 7, the proportion of patients showing such changes was similar in different severity of grades of anaemia as compared to increasing megaloblastoid changes with decreasing haemoglobin levels. This finding indicates that as such anaemia of a chronic order in leprosy is usually of mild to moderate
1 68 R Sen et al .
intensity and increasing severity of anaemia is observed only when other factors are also involved .
Decreased serum iron with normal or increased tissue iron stores have been described in leprosy patients by various workers . s-& Such anaemia has been found to be refractory to antileprosy treatment and iron therapy. ? Some workers have observed reduced serum iron and TIBC levels in clinically nonanaemic patients of leprosy.& However, the patterns of erythropoiesis in bone marrow in leprosy patients have not been reported in these studies .
The important causes of macrocytosis include megaloblastic anaemias and nonmegaloblastic causes such as haemolysis, haemorrhage, aplasia, certain endocrinal disorders and liver disease. I I Frequent megaloblastic change was observed in our patients, particularly with MB leprosy including those receiving treatment. The percentage of such patients increased with increasing severity of anaemia.
While few reports are available about the cytomorphological changes in bone marrow regarding patterns of erythropoiesis in leprosy, megaloblstic change in a significant proportion of patients has been described by other workers also .2,s, 1 6
Various mechanisms may contribute t o megaloblastic/dysplastic erythropoiesis in leprosy. Karat and Rao observed lower serum folate levels in leprosy patients compared to the general population . s In a subsequent study, they demonstrated a decreasing level of serum folate with a rising bacterial load . 1 3 The decrease in folate level was explained due to competitive consumption by Mycobacterium leprae or alteration in absorption or interference in folate metabolism by dapsone. There are evidences such as a decline in serum albumin levels, a trend towards higher vitamin B I 2 leveis with rising bacterial load and increased levels of isoenzymes, LDH4 and LDHs indicating involvement of liver in leprosy. I 3, I ? , I & However, macrocytic anaemia is ,unlikely to be of hepatic origin in leprosy patients because megaloblastic erythropoiesis is not a common feature of anaemia associated with liver diseases . I I Besides, LDH4 and LDHs isoenzymes are also raised in megaloblastic anaemias as such . I I
A secondary deficiency of folic acid has been described due to disturbances in iron metabolism. 1 9 Dimorphic erythropoiesis with normal iron stores (features of ineffective iron utilization and megalobastic change) observed in the present study can be taken as an evidence of this mechanism.
A very interesting observation of megaloblastic/dysplastic erythropoiesis with normal folic acid and B I 2 leveis has been reported in chronic falciparum malaria.20,2 1 Falciparum infection is believed to cause dysplastic change in this situation. I t will be interesting to explore further whether the megaloblastic/dysplastic change observed in leprosy can be attributed to a similar mechanism.
Frank features ofhaemolysis were observed in three patients in the present study. Two of these patients had erythema nodosum leprosum and were on dapsone therapy. In some cases, haemolysis in leprosy has been attributed to lepra reaction. 1 0 The other mechanism may be a dose related haemolysis with dapsone therapy and haemolysis of immune origin induced by rifampicin .9 It has also been postulated that anaemia in leprosy could be due to replacement of haemopoietic tissue by leprous granulomata, toxic depression of the bone
. marrow and competition of lepra bacillus for available haematinics .2 The findings of a higher incidence of AFB positivity, epithelioid granulomas and
megaloblastic change in bone marrow with increasing severity grades of anaemia irrespective of type of disease or duration of treatment as observed in the present study would suggest a role of all these mechanisms.
References
Patterns of erythropoeisis and anaemia in leprosy 1 69
1 Tarrent, Guasp F. Anaemic Hanseniana (Anaemia in Leprosy) Lep Rev Font, 1 964; 6: 27-30. 2 Karat ABA. Acid fast bacill i in the bone marrow of leprosy patients . Int J Lepr, 1 966; 34: 4 1 5- 1 9 . J Ridley OS, Jopling WHo Classification of leprosy according to immunity: A five group system. In! J Lepr,
1 966; 34: 255-73 . 4 Ridley OS, Job CK. Pathology of leprosy . In : Leprosy, 1 st ed . Hastings RC (ed . , Edinburgh: Churchill
Livingstone, 1 985 , pp. 1 23-40. 5 Karat ABA, Rao PSS. Haemotological profile in leprosy. Part I-General findings. Lepr india, 1 977; 49: 1 87-
96. 6 Tinshwe, Sangaroon Suwansri, Mehler H. Serum iron, total iron binding capacity and transferrin in leprosy.
J Burme Life Sci, 1 972; 5: 3 3 1-3 . 7 Tinshive. Serum iron and total iron binding capacity in Burmese patients with leprosy. Lepr Rev, 1 976; 47:
287-90. 8 Bhardwaj VP, Venkatesen K, Ramu G, Desikan VP. Serum iron and total iron binding capacity in leprosy
patients. Lepr India, 1 978; 50: 1 1 - 1 7 . 9 Powell RD, De-Gown RI, Eppes RB, McNamara JV, Carson PE. The antimalarial and haemolytic
properties of 4-4 diaminodiphenyl sulphone (DDS). In! J Lepr, 1 967; 35: 590-2. 10 Ramu G, Ramanujam K. Factor influencing prognosis in recurrent lepra reaction. Lepr India, 1 970; 42: 1 76-
9. 1 1 Wintrobe M M , Lee GR, Boggs DR, Bithell TC, Forester J , Athens JW, et al. Clinical haema!ology, 8th ed .
Philadelphia: Le and Febiger (USA), 1 98 1 , pp. 560, 577, 6 1 1 , 688 . 1 2 de Gruchi Gc. Hypochromic anaemia: Iron deficiency and sideroblastic anaemia. In: de Gruchy 's clinical
haema!ology in medical practice, 5th Indian ed. Firkin F, Chesterman C, Penington 0, Rush B (eds), New Delhi: Oxford University Press, 1 990, pp. 47-8.
1 3 Karat ABA, Rao PSS. Haematological profile in leprosy. Part I I-Relationship of severity of disease and treatment status. Lepr India, 1 978 ; 50: 1 8-25 .
1 4 Cartwright G E . The anaemia of chronic disorders. Seminars in Haema!ology, 1 966; 3 : 3 5 1 -4. 1 5 Cartwright GE, Lee GR. The anaemia of chronic disorders . Br J Haema!ol, 1 97 1 ; 2 1 : 1 47-52. 16 Sen R, Dixit VB, Jain VK, Chaudhary SO. Bone marrow cytomorphological changes in multibacillary
leprosy. Accepted for publication in Ind J Lepr, 1 989 . 1 7 Bulakh PM, Ranade SM, Kowale CN, Chandorkar AG, Burate NP. LDH isoenzymes subunit ratio in
leprosy and the effect of clofazimine treatment on LDH isoenzyme subunit . Ind J Lepr, 1 985 ; 57: 1 1 5-23 . 18 Dhandayuthapani S , Bhatia VN. Lectate dehydrogenase isoenzymes in leprosy patients on multi drug
therapy. A preliminary report. Ind J Lepr, 1 988 ; 60: 1 86-20 I . 1 9 Shuster S , Marks J , Chanarin I . Folic acid deficiency in patients with skin disease . Br J Derm. 1 967; 79: 398-
402 . 20 Abdalla S, Weatherall OJ, Wickramasinghe SN, Hughes M . The anaemia of P. Jalciparum malaria . Br J
Haem, 1 980; 46: 1 7 1 -83 . 2 1 Lazzato L. Malaria and red cells . In: Recent A dvances in Haema!o!ogy, No. 4. Hotfbrand A V (ed) .
Edinburgh: Churchill Livingstone, 1 985 , pp. 1 09-26.
Types d'erythropo'iese et d'anemie dans la lepre
R S E N , S S Y A D A V , U M A S I N G H , P S E H G A L ET V B D I X I T
Sommaire U n total d e 1 28 patients d e lepre ont ete examines pour determiner I e type morphologique d'anemie, les anomalies sous-jacentes dans Ie metabolisme du fer et les types d'erythropo'iese et d'autres alterations cytomorphologiques dans l 'os it moelle. L'anemie etait de caractere leger it modere dans des cas de lepre paucibacillaire (PB), et atteignait un caractere grave dans des cas de lepre it multiples baciles (M B). Tres peu de patients ont montre des signes de carence de fer. Des deficiences en la capacite d'utilisation du fer, telles qu'on observe dans cas d'anemie de caractere grave, ont ete trouves avec frequence dans des cas de lepre MB (dans un 4 1 ,7% des cas) et encore plus souvent chez des nouveaux cas (dans un 50%) . Le taux de frequence d'erythropolese des megaloblastes etait aussi plus deve chez la lepre MB (d'un 45,2% ) en relation avec la lepre PB (d'un 1 6%) , ce qui explique la gravite de l 'anemie chez Ie premier type. Dans un 1 7,2% du total des patients (2 1 ,4% de M B; 9% de PB) l'os it moelle a montre des signes d'erythropolese des megaloblastes et de capacite pour l 'utilisation de fer det6rioree. Des patients sous traitements specifiques contre la lepre ont aussi montre des anomalies dans Ie metabolisme du fer et des signes d'erythropolese, maisjusqu'it un degre moins eleve. Sans tenir
1 70 R Sen et a l .
compte du type de la maladie ou de la duration du traitement, une hausse dans les taux de frequence de positivite aux bacilles acido-resistants (AFB) et des granulomes observes dans I'os a moelle a ete liee a la gravite croissante de l 'anemie.
Tipos de eritropoyesis y de anemia en la lepra
R S E N , S S Y A D A V , U M A S I N G H , P S E H G A L Y V B D I X I T
Resumen S e examino u n total d e 1 28 pacientes d e lepra para determinar e l tipo morfologico d e anemia padecido, anomalias basicas en el metabolismo del hierro y las pautas en la eritropoyesis y otras alteraciones citomorfologicas en la medula osea . En casos de lepra paucibacilar (PB), la anemia era de canicter ligero a moderado, mientras que en casos de lepra causada por multiples bacilos (MB) era de canicter grave. Se observo la falta de hierro solo en unos cuantos pacientes . Se detectaron con frecuencia en pacientes de lepra MB (en un 45,2% ) deficiencias en la utilizacion del hierro, segun se observan en casos de anemia de caracter cronico, y aun con mas frecuencia en casos nuevos (un 50%) . La eritropoyesis megaloblastica tambien se observo con mas frecuencia en la lepra MB -en un 45,2% de los pacientes- comparado con un 1 6 % en pacientes de lepra PB, 10 cual explica la gravedad de la anemia en el primero de estos grupos de pacientes . En un 1 7,2% del numero total de pacientes (un 2 1 ,4% de MB y un 9% de PB) se observaron en la medula osea la eritropoyesis megaloblastica y seiiales de deficiencia en la uti lizacion del hierro. Tambien se detectaron la eritropoyesis megaloblastica y deficiencias en la utilizacion del hierro en pacientes recibiendo tratamientos especificos contra la lepra, aunque a un nivel menos elevado. independientemente del tipo de enfermedad y de la duracion del tratamiento, la gravedad de la anemia se vio liada al aumento en la medula osea de bacilos acidorresistentes (AFB) y de granulomas.