Embed Size (px)
Citation preview
Life Sciences Learning Center Copyright © 2011 University of Rochester May be copied for classroom use
1
Activity 8:
Nano Ecology
____________________________________________________ Core Concept:
Nanoparticles may disrupt food chains.
Class time required:
Approximately 40-60 minutes of class time Teacher Provides:
• A copy of student handout “Nano Ecology” for each student.
• Paper or plastic plate as work area to prevent loss of beads.
• One sheet of “Organism Cards”
• 100 ml graduated cylinder for each team of students.
• 10 ml graduated cylinder for each team of students.
• 1 ml graduated dropper for each team of students.
• Access to water
• 1 set of labeled cups for each team of students. o Clear 1.5 ml cup labeled “1 Human”. Purchase 1.5 mL sample cups from Globe
Scientific: www.globescientific.com/15ml-sample-cups-multipurpose-110610-p-52.html Catalog # 110610. Approximately $26.90 for 1,000. Hint: These make great disposable “mini test tubes” for use in other lab activities.
o Clear 1 ounce plastic shot glass labeled “10 Fish”. You can purchase these at a party or restaurant supply store. Purchase online at: www.instawares.com/clear-ware-1-oz.emi-ycwsg1c.0.7.htm
o Clear 5 ounce plastic cup labeled “100 Grass Shrimp”. You can purchase these at a party or restaurant supply store. Purchase online at: www.instawares.com/cups-plastic-5-oz.5cdart.0.7.htm
o Clear 10 ounce plastic cup labeled “1,000 Zooplankton”. You can purchase these at a party or restaurant supply store. Purchase online at: www.instawares.com/10-oz-ultra-clear.scctp10.0.7.htm
o Clear 20 ounce plastic cup labeled “10,000 Phytoplankton”. You can purchase these at a party or restaurant supply store. Purchase online at www.instawares.com/plastic-cup-clr-20oz.slotn20.0.7.htm?gclid=CKGmrviX%5faECFVbE3AodDU2sDQ&
Life Sciences Learning Center Copyright © 2011 University of Rochester May be copied for classroom use
2
o 1 small plastic bag labeled “Gold Nanoparticles” containing gold or yellow seed beads. Use the smallest cup (labeled “1 Human”) to measure the beads to put into each bag. Place one heaping small cupful of gold beads in each bag. Purchase 2 packages of 10/0 gold rocaille glass beads ($2.40 per 100 gram package) online at www.consumercrafts.com/Store/Products.aspx?clg=jewelry&cat=glass%28jewelry%29
Suggested Class Procedure:
• Distribute copies of the student handout entitled “Nano Ecology” and one sheet of “Organism Cards” to each student.
• Read the article in the box on the first page aloud to the class.
• Ask students to reread the article and underline or highlight the names of organisms in the experimental enclosure.
• Ask students to work in pairs to read and complete the activity.
• As students begin work, distribute one plate, graduated cylinders, graduated droppers, one set of cups and one small bag of seed beads to each pair of student. Explain that they should use the plate as a work area to prevent the beads from rolling off their desk.
This project was generously funded by Science Education Partnership Award R25RR023285 from the National Center for Research Resources. The content is solely the responsibility of the authors and does not necessarily represent the official views of the National Center for Research Resources or the National Institutes of Health.
Life Sciences Learning Center Copyright © 2011 University of Rochester May be copied for classroom use
3
Organism Cards
Organism Cards
Organism Cards
Organism Cards
Phytoplankton
Zooplankton
Young Fish
Adult Fish
Grass Shrimp
Shellfish
Marsh Grass
Human
Phytoplankton
Zooplankton
Young Fish
Adult Fish
Grass Shrimp
Shellfish
Marsh Grass
Human
Phytoplankton
Zooplankton
Young Fish
Adult Fish
Grass Shrimp
Shellfish
Marsh Grass
Human
Life Sciences Learning Center Copyright © 2011 University of Rochester May be copied for classroom use
4
Nano Ecology ____________________________________________________ Part 1: Nanoparticles in a Food Web
1. Read the article above. As you read, underline the names of living organisms in this
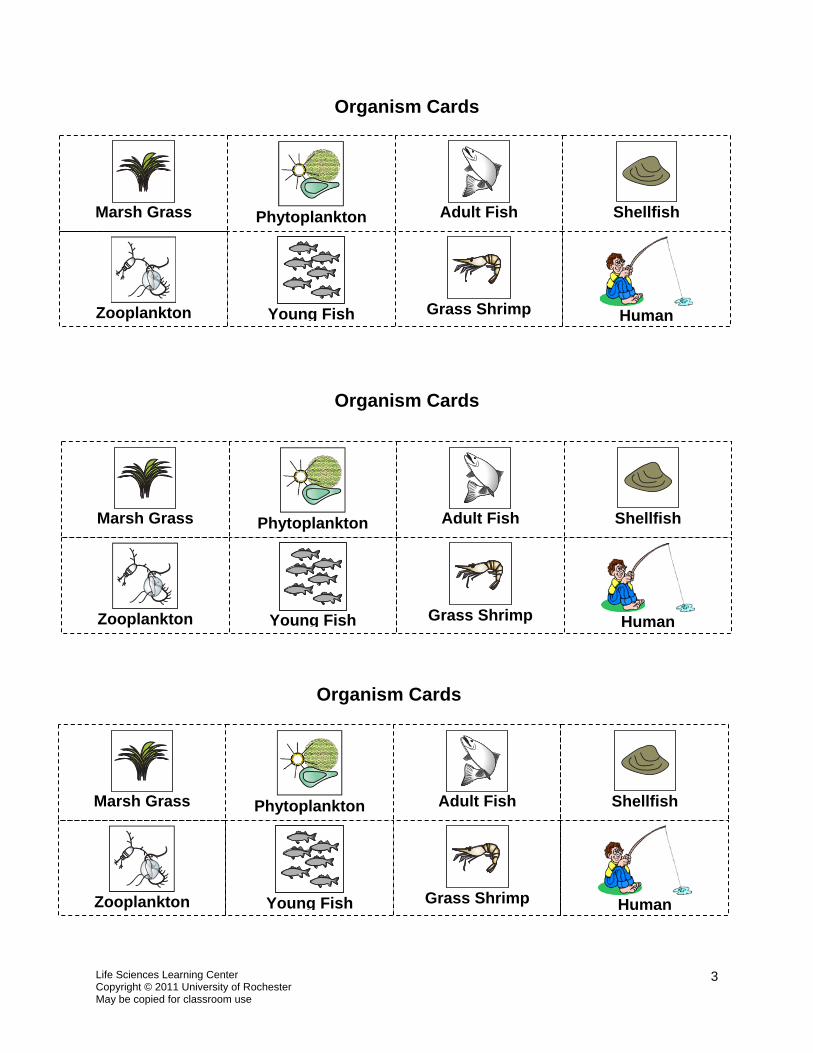
ecosystem that might be affected by nanoparticles. 2. The sheet of “Organism Cards” represents the organisms in the ecosystem that the
scientists studied. Cut along the dotted lines to create a set of “Organisms Cards.”
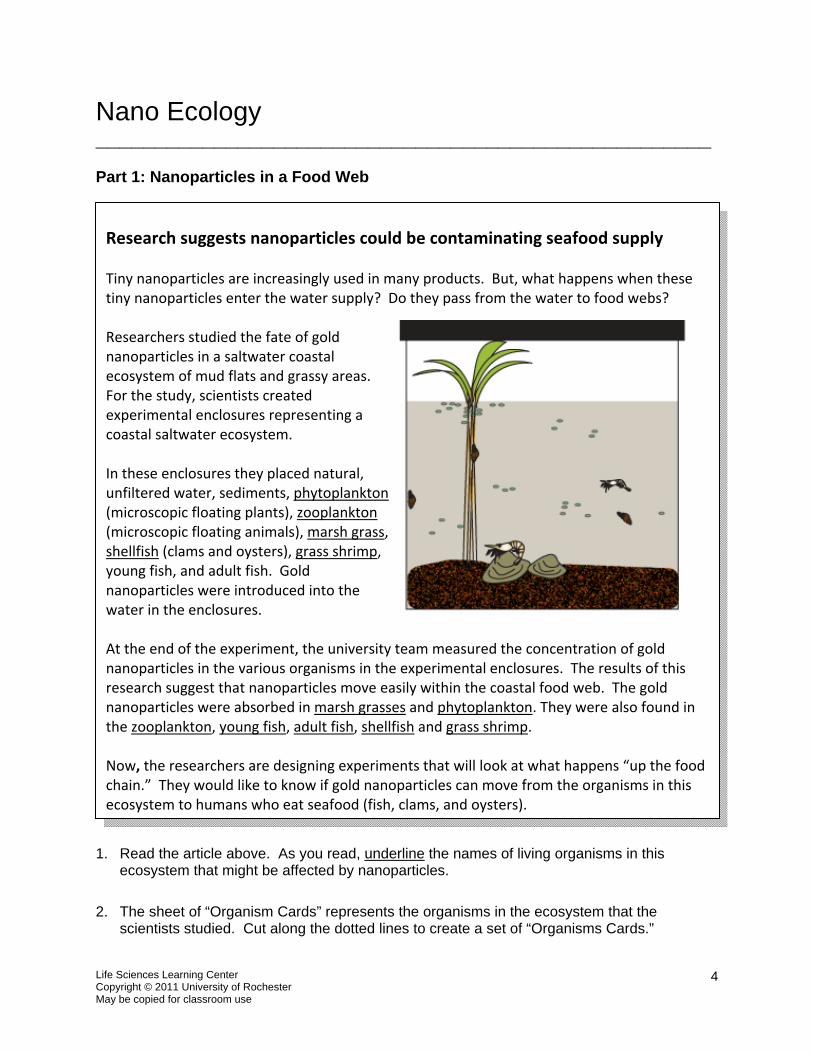
Research suggests nanoparticles could be contaminating seafood supply Tiny nanoparticles are increasingly used in many products. But, what happens when these tiny nanoparticles enter the water supply? Do they pass from the water to food webs? Researchers studied the fate of gold nanoparticles in a saltwater coastal ecosystem of mud flats and grassy areas. For the study, scientists created experimental enclosures representing a coastal saltwater ecosystem. In these enclosures they placed natural, unfiltered water, sediments, phytoplankton (microscopic floating plants), zooplankton (microscopic floating animals), marsh grass, shellfish (clams and oysters), grass shrimp, young fish, and adult fish. Gold nanoparticles were introduced into the water in the enclosures. At the end of the experiment, the university team measured the concentration of gold nanoparticles in the various organisms in the experimental enclosures. The results of this research suggest that nanoparticles move easily within the coastal food web. The gold nanoparticles were absorbed in marsh grasses and phytoplankton. They were also found in the zooplankton, young fish, adult fish, shellfish and grass shrimp. Now, the researchers are designing experiments that will look at what happens “up the food chain.” They would like to know if gold nanoparticles can move from the organisms in this ecosystem to humans who eat seafood (fish, clams, and oysters).
Life Sciences Learning Center Copyright © 2011 University of Rochester May be copied for classroom use
5
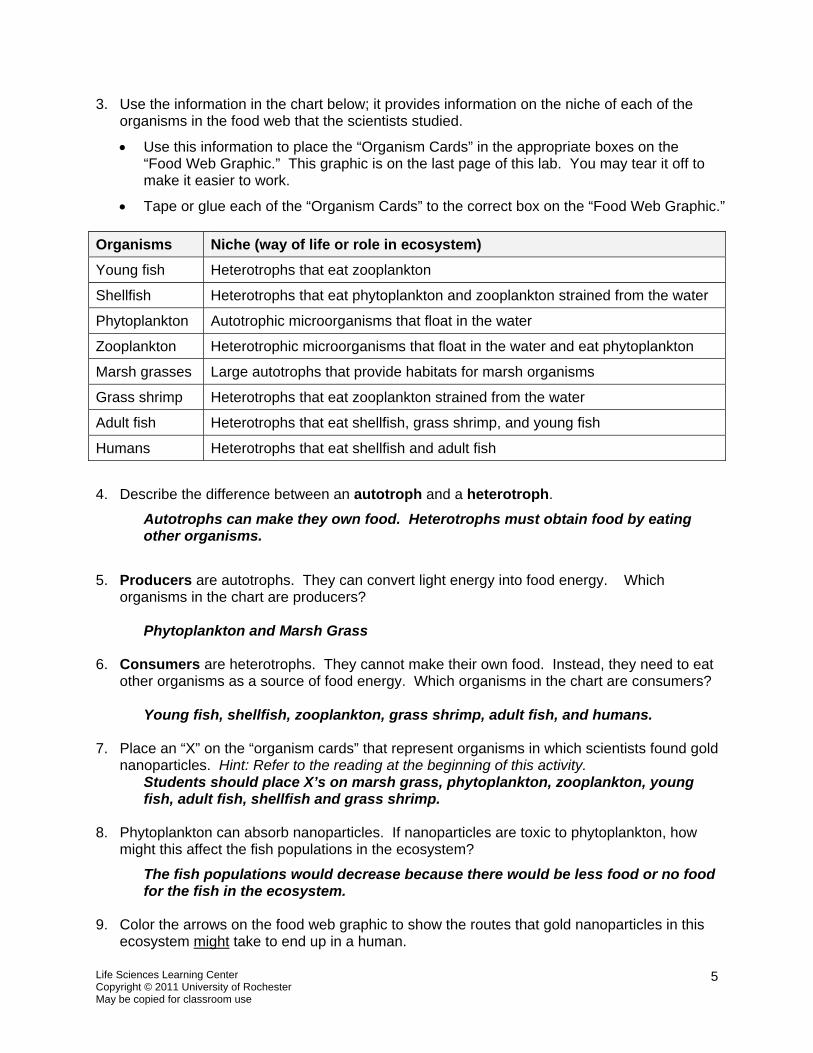
3. Use the information in the chart below; it provides information on the niche of each of the organisms in the food web that the scientists studied.
• Use this information to place the “Organism Cards” in the appropriate boxes on the “Food Web Graphic.” This graphic is on the last page of this lab. You may tear it off to make it easier to work.
• Tape or glue each of the “Organism Cards” to the correct box on the “Food Web Graphic.” Organisms Niche (way of life or role in ecosystem)
Young fish Heterotrophs that eat zooplankton
Shellfish Heterotrophs that eat phytoplankton and zooplankton strained from the water
Phytoplankton Autotrophic microorganisms that float in the water
Zooplankton Heterotrophic microorganisms that float in the water and eat phytoplankton
Marsh grasses Large autotrophs that provide habitats for marsh organisms
Grass shrimp Heterotrophs that eat zooplankton strained from the water
Adult fish Heterotrophs that eat shellfish, grass shrimp, and young fish
Humans Heterotrophs that eat shellfish and adult fish
4. Describe the difference between an autotroph and a heterotroph.
Autotrophs can make they own food. Heterotrophs must obtain food by eating other organisms.
5. Producers are autotrophs. They can convert light energy into food energy. Which
organisms in the chart are producers?
Phytoplankton and Marsh Grass
6. Consumers are heterotrophs. They cannot make their own food. Instead, they need to eat other organisms as a source of food energy. Which organisms in the chart are consumers?
Young fish, shellfish, zooplankton, grass shrimp, adult fish, and humans.
7. Place an “X” on the “organism cards” that represent organisms in which scientists found gold nanoparticles. Hint: Refer to the reading at the beginning of this activity.
Students should place X’s on marsh grass, phytoplankton, zooplankton, young fish, adult fish, shellfish and grass shrimp.
8. Phytoplankton can absorb nanoparticles. If nanoparticles are toxic to phytoplankton, how
might this affect the fish populations in the ecosystem?
The fish populations would decrease because there would be less food or no food for the fish in the ecosystem.
9. Color the arrows on the food web graphic to show the routes that gold nanoparticles in this
ecosystem might take to end up in a human.

Life Sciences Learning Center Copyright © 2011 University of Rochester May be copied for classroom use
6
Part 2: Transfer of Energy in an Ecosystem The pyramid graphic shown below represents organisms in the salt marsh ecosystem. Notice that, as food is passed from producers to higher level consumers, each feeding level has fewer organisms. When energy is transferred (through eating), only 10% of the energy is transferred from one feeding level to the next. The remaining 90% of the energy is lost as heat.
Modeling Energy Transfer in the Salt Marsh
To make a model that shows the transfer of energy through a food chain, you will use water to represent the energy passed from one organism to another.
1. Set up up your energy flow model by putting 500 ml of water into the green phytoplankton cup. This represents the energy in 10,000 phytoplankton. Record the amount of water in the phytoplankton cup in the phytoplankton box of pyramid graphic above.
2. The phytoplankton are eaten by zooplankton. Transfer 10% of the water (50 ml) into the 1,000 zooplankton cup. Discard the remainder of the water that represents the energy lost as heat. Record the amount of water in the zooplankton cup in the appropriate box on the pyramid graphic.
3. The zooplankton are eaten by the grass shrimp. Transfer 10% of the water (5 ml) into the 100 grass shrimp cup. Discard the remainder of the water that represents the energy lost as heat. Record the amount of water in the grass shrimp cup in the appropriate box on the pyramid graphic.
4. The grass shrimp are eaten by the fish. Transfer 10% of the water (0.5 ml) into the 10 fish cup. Discard the remainder of the water that represents the energy lost as heat. Record the amount of water in this cup in the fish box on the pyramid graphic.
5. The fish are eaten by humans. Transfer 10% of the water (0.05 ml = approximately 3 drops) into the 1 human cup. Discard the remainder of the water that represents the energy lost as heat. Record the amount of water in the human cup in the appropriate box on the pyramid graphic.
1 Human _0.05_ml
10 Fish _0.5_ml
100 Grass Shrimp __5__ml
1,000 Zooplankton _50_ml
10,000 Phytoplankton _500_ml
Life Sciences Learning Center Copyright © 2011 University of Rochester May be copied for classroom use
7
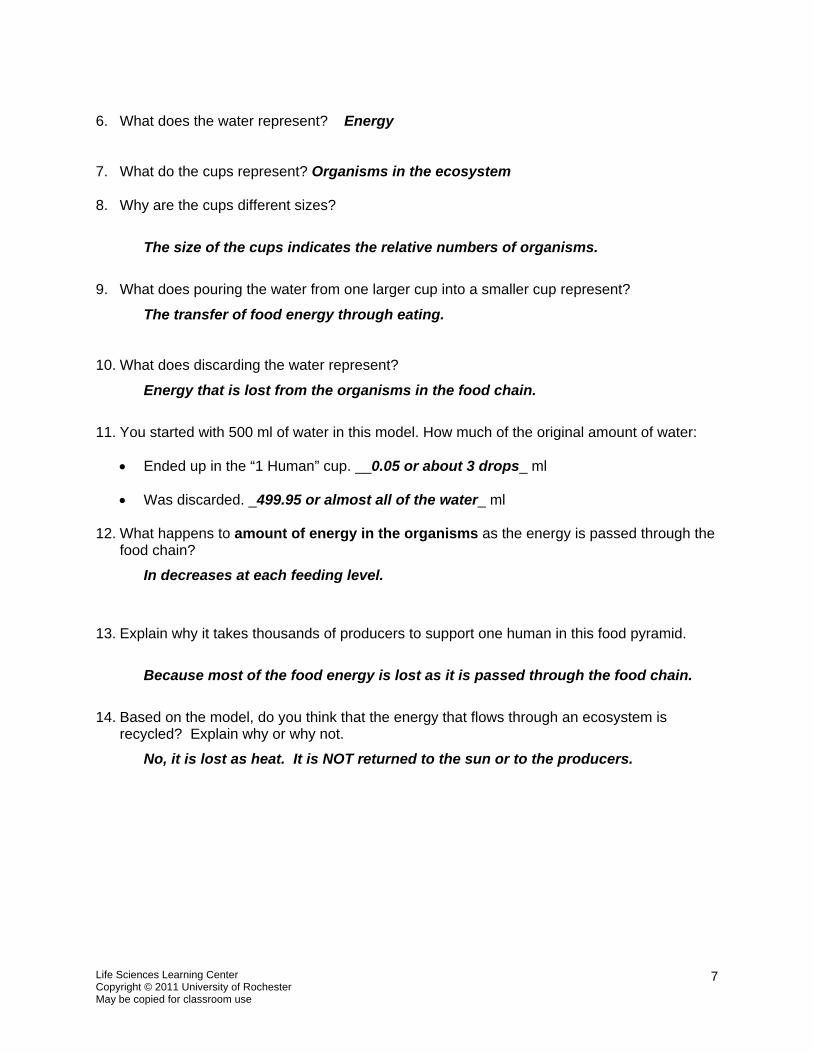
6. What does the water represent? Energy 7. What do the cups represent? Organisms in the ecosystem 8. Why are the cups different sizes?
The size of the cups indicates the relative numbers of organisms. 9. What does pouring the water from one larger cup into a smaller cup represent?
The transfer of food energy through eating.
10. What does discarding the water represent?
Energy that is lost from the organisms in the food chain. 11. You started with 500 ml of water in this model. How much of the original amount of water:
• Ended up in the “1 Human” cup. __0.05 or about 3 drops_ ml
• Was discarded. _499.95 or almost all of the water_ ml 12. What happens to amount of energy in the organisms as the energy is passed through the
food chain?
In decreases at each feeding level.
13. Explain why it takes thousands of producers to support one human in this food pyramid.
Because most of the food energy is lost as it is passed through the food chain. 14. Based on the model, do you think that the energy that flows through an ecosystem is
recycled? Explain why or why not.
No, it is lost as heat. It is NOT returned to the sun or to the producers.
Life Sciences Learning Center Copyright © 2011 University of Rochester May be copied for classroom use
8
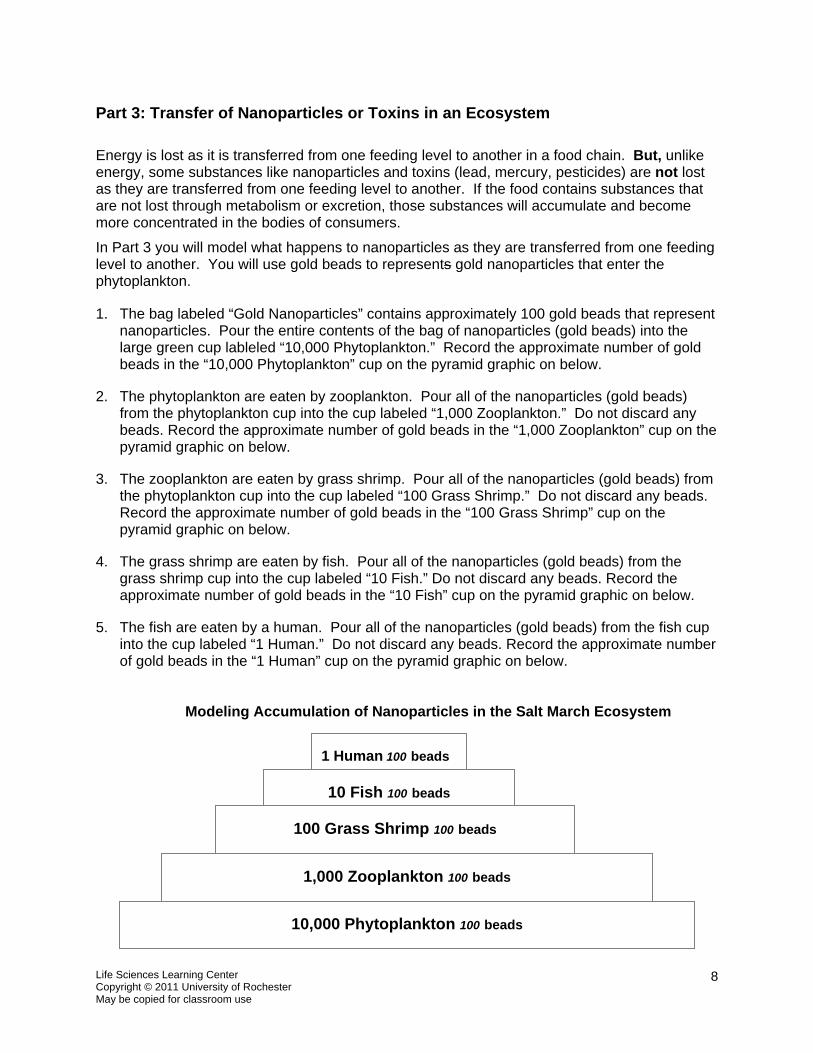
Part 3: Transfer of Nanoparticles or Toxins in an Ecosystem Energy is lost as it is transferred from one feeding level to another in a food chain. But, unlike energy, some substances like nanoparticles and toxins (lead, mercury, pesticides) are not lost as they are transferred from one feeding level to another. If the food contains substances that are not lost through metabolism or excretion, those substances will accumulate and become more concentrated in the bodies of consumers.
In Part 3 you will model what happens to nanoparticles as they are transferred from one feeding level to another. You will use gold beads to represents gold nanoparticles that enter the phytoplankton.
1. The bag labeled “Gold Nanoparticles” contains approximately 100 gold beads that represent nanoparticles. Pour the entire contents of the bag of nanoparticles (gold beads) into the large green cup lableled “10,000 Phytoplankton.” Record the approximate number of gold beads in the “10,000 Phytoplankton” cup on the pyramid graphic on below.
2. The phytoplankton are eaten by zooplankton. Pour all of the nanoparticles (gold beads)
from the phytoplankton cup into the cup labeled “1,000 Zooplankton.” Do not discard any beads. Record the approximate number of gold beads in the “1,000 Zooplankton” cup on the pyramid graphic on below.
3. The zooplankton are eaten by grass shrimp. Pour all of the nanoparticles (gold beads) from
the phytoplankton cup into the cup labeled “100 Grass Shrimp.” Do not discard any beads. Record the approximate number of gold beads in the “100 Grass Shrimp” cup on the pyramid graphic on below.
4. The grass shrimp are eaten by fish. Pour all of the nanoparticles (gold beads) from the grass shrimp cup into the cup labeled “10 Fish.” Do not discard any beads. Record the approximate number of gold beads in the “10 Fish” cup on the pyramid graphic on below.
5. The fish are eaten by a human. Pour all of the nanoparticles (gold beads) from the fish cup into the cup labeled “1 Human.” Do not discard any beads. Record the approximate number of gold beads in the “1 Human” cup on the pyramid graphic on below.
Modeling Accumulation of Nanoparticles in the Salt March Ecosystem
1 Human 100 beads
10 Fish 100 beads
100 Grass Shrimp 100 beads
1,000 Zooplankton 100 beads
10,000 Phytoplankton 100 beads
Life Sciences Learning Center Copyright © 2011 University of Rochester May be copied for classroom use
9
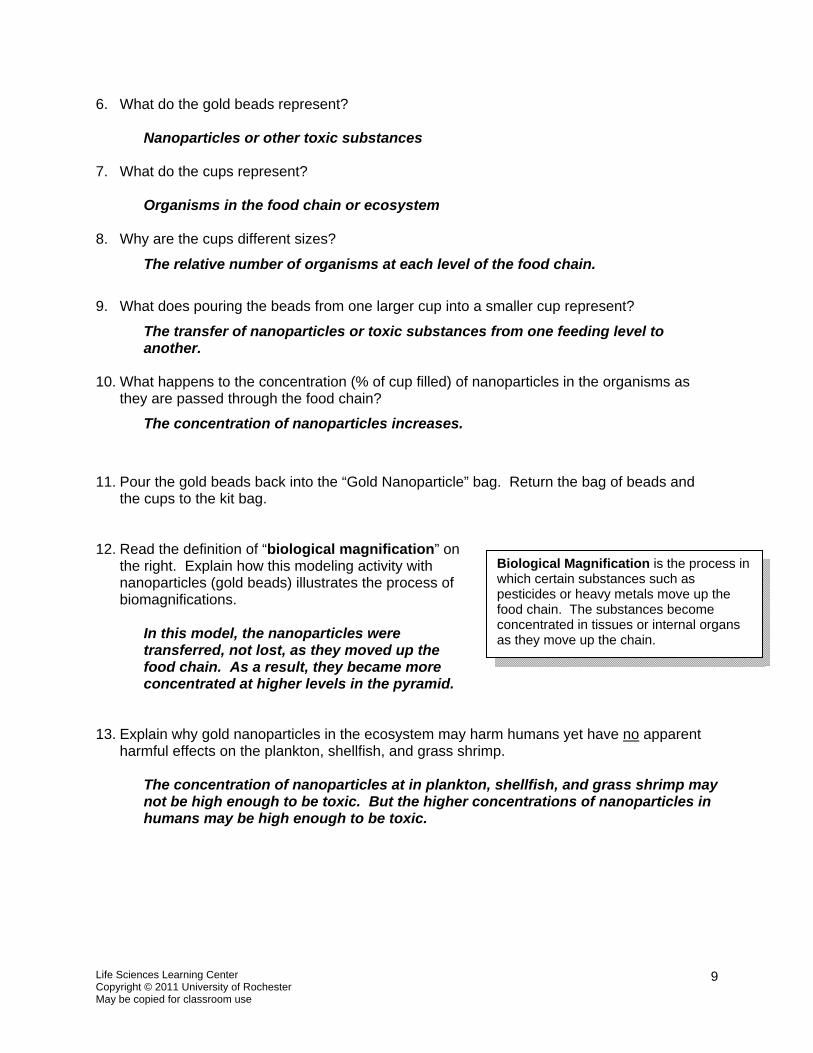
6. What do the gold beads represent?
Nanoparticles or other toxic substances
7. What do the cups represent?
Organisms in the food chain or ecosystem
8. Why are the cups different sizes?
The relative number of organisms at each level of the food chain.
9. What does pouring the beads from one larger cup into a smaller cup represent?
The transfer of nanoparticles or toxic substances from one feeding level to another.
10. What happens to the concentration (% of cup filled) of nanoparticles in the organisms as
they are passed through the food chain?
The concentration of nanoparticles increases.
11. Pour the gold beads back into the “Gold Nanoparticle” bag. Return the bag of beads and the cups to the kit bag.
12. Read the definition of “biological magnification” on
the right. Explain how this modeling activity with nanoparticles (gold beads) illustrates the process of biomagnifications.
In this model, the nanoparticles were transferred, not lost, as they moved up the food chain. As a result, they became more concentrated at higher levels in the pyramid.
13. Explain why gold nanoparticles in the ecosystem may harm humans yet have no apparent
harmful effects on the plankton, shellfish, and grass shrimp.
The concentration of nanoparticles at in plankton, shellfish, and grass shrimp may not be high enough to be toxic. But the higher concentrations of nanoparticles in humans may be high enough to be toxic.
Biological Magnification is the process in which certain substances such as pesticides or heavy metals move up the food chain. The substances become concentrated in tissues or internal organs as they move up the chain.
Life Sciences Learning Center Copyright © 2011 University of Rochester May be copied for classroom use
10
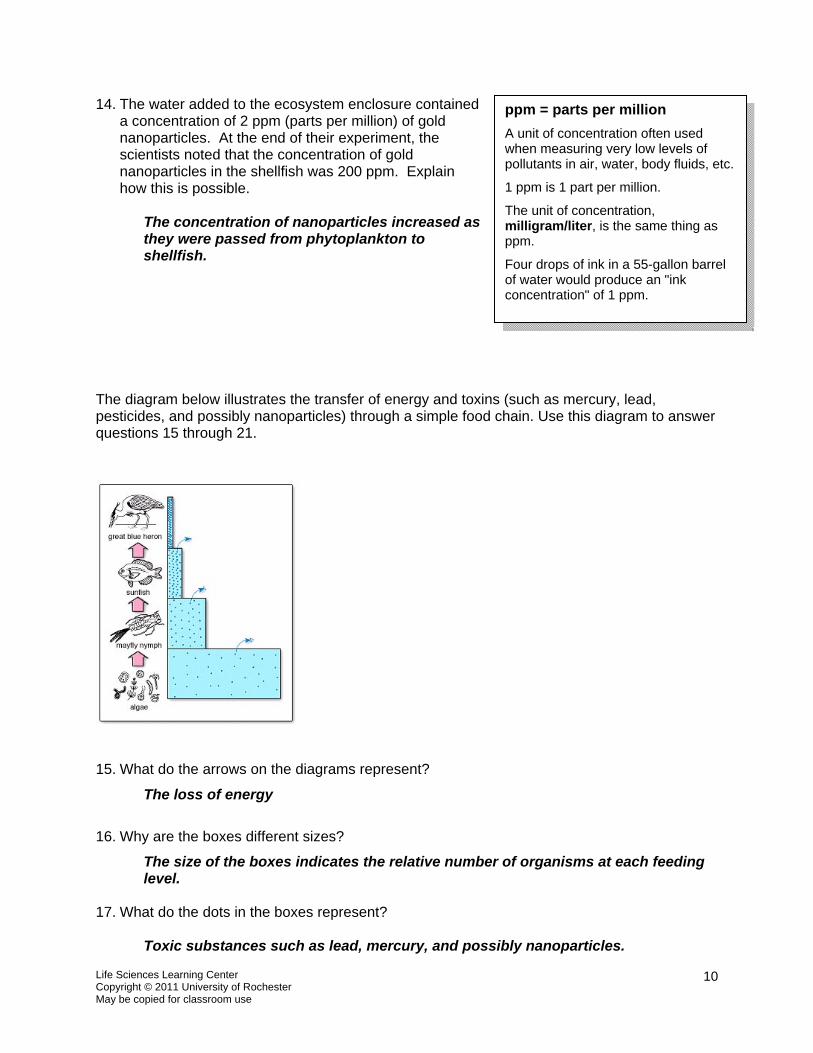
14. The water added to the ecosystem enclosure contained a concentration of 2 ppm (parts per million) of gold nanoparticles. At the end of their experiment, the scientists noted that the concentration of gold nanoparticles in the shellfish was 200 ppm. Explain how this is possible.
The concentration of nanoparticles increased as they were passed from phytoplankton to shellfish.
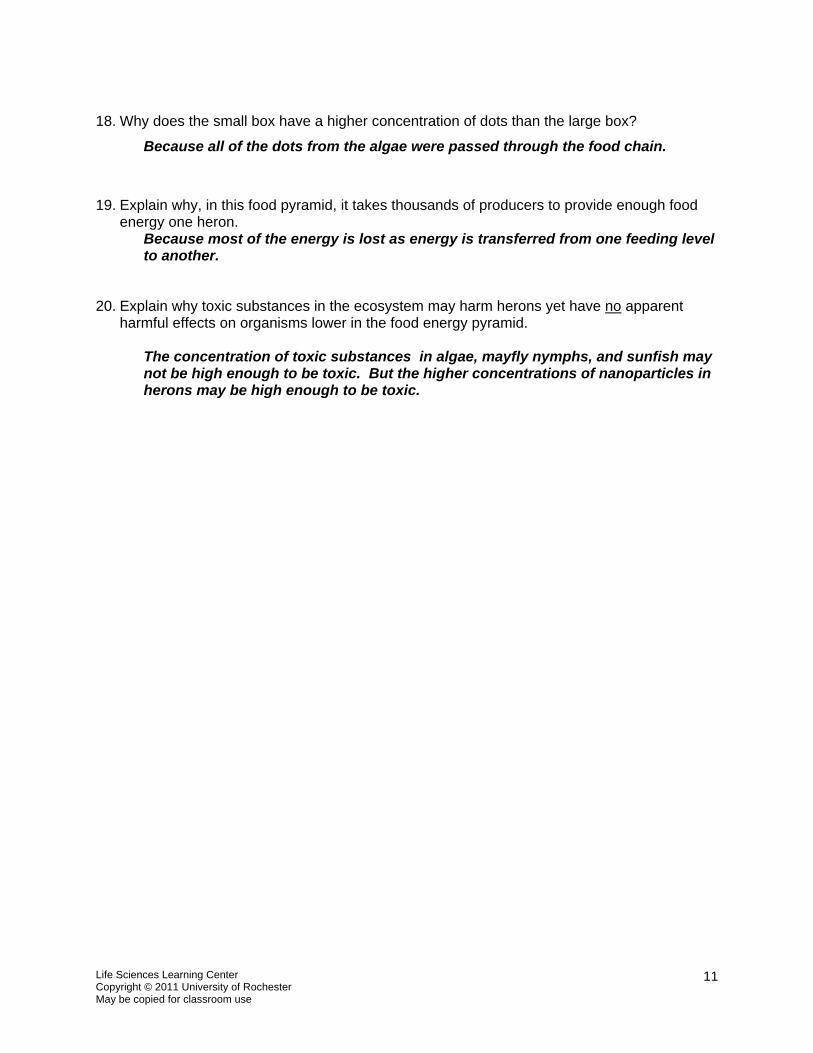
The diagram below illustrates the transfer of energy and toxins (such as mercury, lead, pesticides, and possibly nanoparticles) through a simple food chain. Use this diagram to answer questions 15 through 21.
15. What do the arrows on the diagrams represent?
The loss of energy
16. Why are the boxes different sizes?
The size of the boxes indicates the relative number of organisms at each feeding level.
17. What do the dots in the boxes represent?
Toxic substances such as lead, mercury, and possibly nanoparticles.
ppm = parts per million A unit of concentration often used when measuring very low levels of pollutants in air, water, body fluids, etc.
1 ppm is 1 part per million.
The unit of concentration, milligram/liter, is the same thing as ppm.
Four drops of ink in a 55-gallon barrel of water would produce an "ink concentration" of 1 ppm.
Life Sciences Learning Center Copyright © 2011 University of Rochester May be copied for classroom use
11
18. Why does the small box have a higher concentration of dots than the large box?
Because all of the dots from the algae were passed through the food chain.
19. Explain why, in this food pyramid, it takes thousands of producers to provide enough food energy one heron.
Because most of the energy is lost as energy is transferred from one feeding level to another.
20. Explain why toxic substances in the ecosystem may harm herons yet have no apparent harmful effects on organisms lower in the food energy pyramid.
The concentration of toxic substances in algae, mayfly nymphs, and sunfish may not be high enough to be toxic. But the higher concentrations of nanoparticles in herons may be high enough to be toxic.

Life Sciences Learning Center Copyright © 2011 University of Rochester May be copied for classroom use
12

Life Sciences Learning Center Copyright © 2011 University of Rochester May be copied for classroom use
13
Marsh grasses
Phytoplankton
Adult fish
Humans
Grass shrimp
Shellfish
Young fish
Zooplankton
Food Web Graphic