Embed Size (px)
Citation preview
Central London Office Market ReportMixed economic signals, but take-up resilient post-referendumQ3 2016
2 | Central London Office Market Report Q3 2016
Central London overview
Ben Burston Head of UK Office Research
Mixed economic signalsEconomic signals have largely been positive in Q3. Business and consumer sentiment indicators have substantially recovered after an immediate dip post referendum, and point to continued economic expansion. The Markit/CIPS services sector Purchasing Managers’ Index (PMI) reading of 55 is an encouraging sign for London, and robust retail sales growth of 5.5% year on year suggests that households continue to benefit from low inflation and a strong labour market.
However, the pound has fallen sharply, and this signifies concern on the part of investors as to whether this economic momentum can be sustained. Reflecting concerns around the outlook for business investment, GDP growth is expected to slow to 1.4% in 2017. Economic growth in London has long outstripped the national average, and this is forecast to continue, notwithstanding Brexit, with growth forecast to slow to 1.7% and 2.1% in 2018.
The outlook is partly dependent on the progress of negotiations with the EU, but with these not likely to conclude before 2019, the outlook for 2017 is more dependent on confidence in a favourable direction of travel.
WEST END
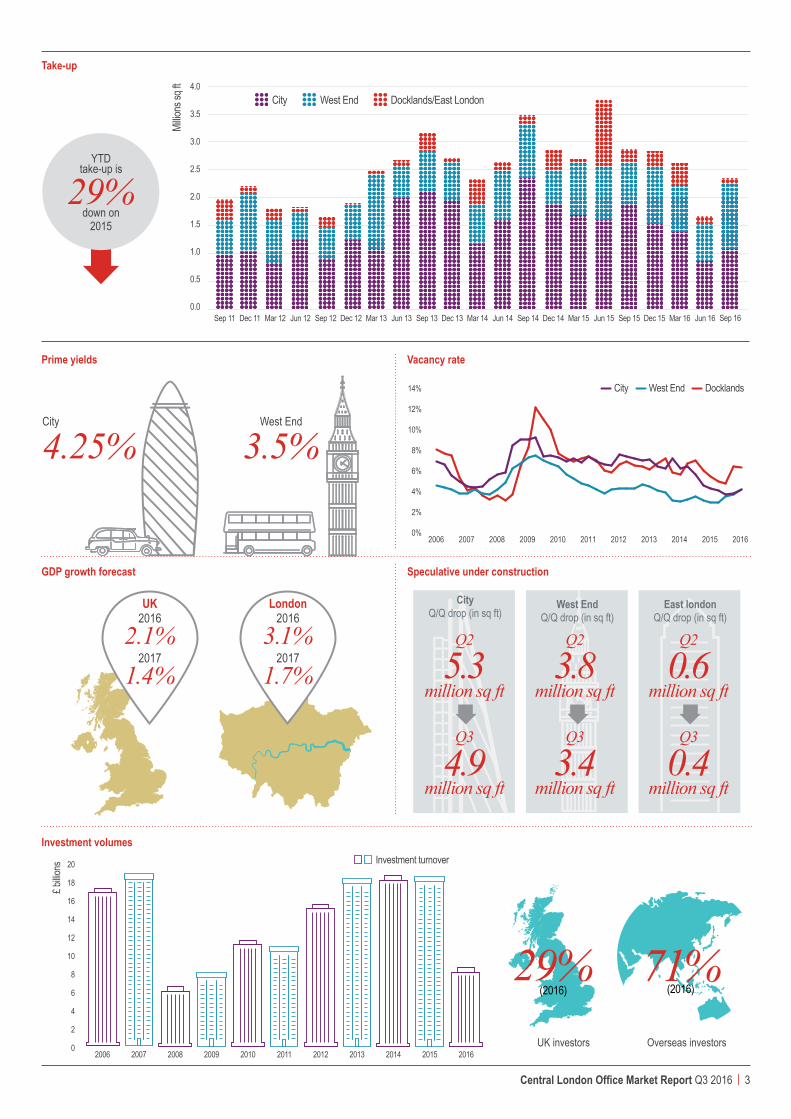
Solid take-up, driven by the West EndAfter a subdued Q2, take-up across Central London rebounded to 2.3 million sq ft. In the year to date, take-up totals 6.6 million sq ft, 14% below the long term average level. Take-up has been stronger in the West End market, headlined in Q3 by Apple’s acquisition of 500,000 sq ft at Battersea Power Station, the largest deal of the year to date. West End take-up in the year to date is slightly ahead of the equivalent period last year.
City take-up also jumped in Q3, supported by Wells Fargo’s purchase of 33 Central, EC4. However, City take-up in 2016 is 36% down on last year, having been impacted to a greater extent by the uncertainty surrounding Brexit.
Supply rises in Q3After a prolonged period of low vacancy, Q3 saw a rise in the level of supply, with vacancy across Central London edging up to 4.2% from 3.7% in Q2. The rise was in line with expectations that vacancy would rise in the second half of the year, owing to a series of speculative development completions, with a further rise expected in Q4. Reflecting recent completions, the level of speculative space under construction dropped sharply in Q3, from 9.6 million sq ft back to 8.7 million sq ft.
Rents at the top end of the market under pressureNotwithstanding strong West End take-up in Q3, prime rents in the Mayfair and St James’ market dropped to £115 per sq ft in Q3. This premium end of the market has been impacted by more subdued demand in the aftermath of the referendum. Rents in the wider West End have held firm, along with prime rents in the City which remain at £70 per sq ft, albeit there is pressure on incentives, which have risen to 21 months.
Subdued investment activity in Q3, but underlying demand remains strong
Central London investment market turnover totalled £2.3 billion in Q3, with year to date volumes of £8.6 billion, 26% down on the equivalent period last year. Institutional investors have been more cautious this year given the referendum, and there have been fewer large lot sizes on offer. Activity is expected to pick up in Q4, however, and there are signs that sentiment is improving. Reflecting this, prime yields were stable in Q3, remaining at 4.25% in the City and 3.5% in the West End.
Central London Office Market Report Q3 2016 | 3
29% 71%UK investors Overseas investors
(2016)(2016)
0
2
4
6
8
10
12
14
16
18
20
£ billio
ns
2006 2007 2008 2009 2010 2011 2012 2013 2014 2016
Investment turnover
2015
Take-up
Vacancy ratePrime yields
14%
12%
10%
8%
6%
4%
2%
0%2006 2007 2008 2009 2010 2011 2012 2013 2014 2015 2016
City West End Docklands
Investment volumes
GDP growth forecast
East londonQ/Q drop (in sq ft)
CityQ/Q drop (in sq ft)
West EndQ/Q drop (in sq ft)
Q2
5.3million sq ft
Q3
4.9million sq ft
Q2
3.8million sq ft
Q3
3.4million sq ft
Q2
0.6million sq ft
Q3
0.4million sq ft
Speculative under construction
Millio
ns sq
ft 4.0
3.5
3.0
2.5
2.0
1.5
1.0
0.5
0.0Sep 11 Dec 11 Mar 12 Jun 12 Sep 12 Dec 12 Mar 13 Jun 13 Sep 13 Dec 13 Mar 14 Jun 14 Sep 14 Dec 14 Mar 15 Mar 16
City West End Docklands/East London
Jun 15 Sep 15 Dec 15 Jun 16 Sep 16
YTD take-up is
29%down on
2015
City
4.25%West End
3.5%
London 2016
3.1%2017
1.7%
UK 2016
2.1%2017
1.4%
4 | Central London Office Market Report Q3 2016
Key transactions
Verde, SW1Tenant: PA Consulting GroupSize: 58,600 sq ftRent: ConfidentialLillian ChandlerDirectorLondon Agency
The Leadenhall Building, EC3Tenant: MS Amlin,Rothesay Life &Kames Capital Size: 13,000 sq ft, 11,000 sq ft & 7,000 sq ft Rent: ConfidentialDan BurnDirectorLondon Agency
One Southampton Street, WC2Price: £53.5 millionPurchaser: Private investorYield: 3.80%Tim GrahamDirector London Capital Markets
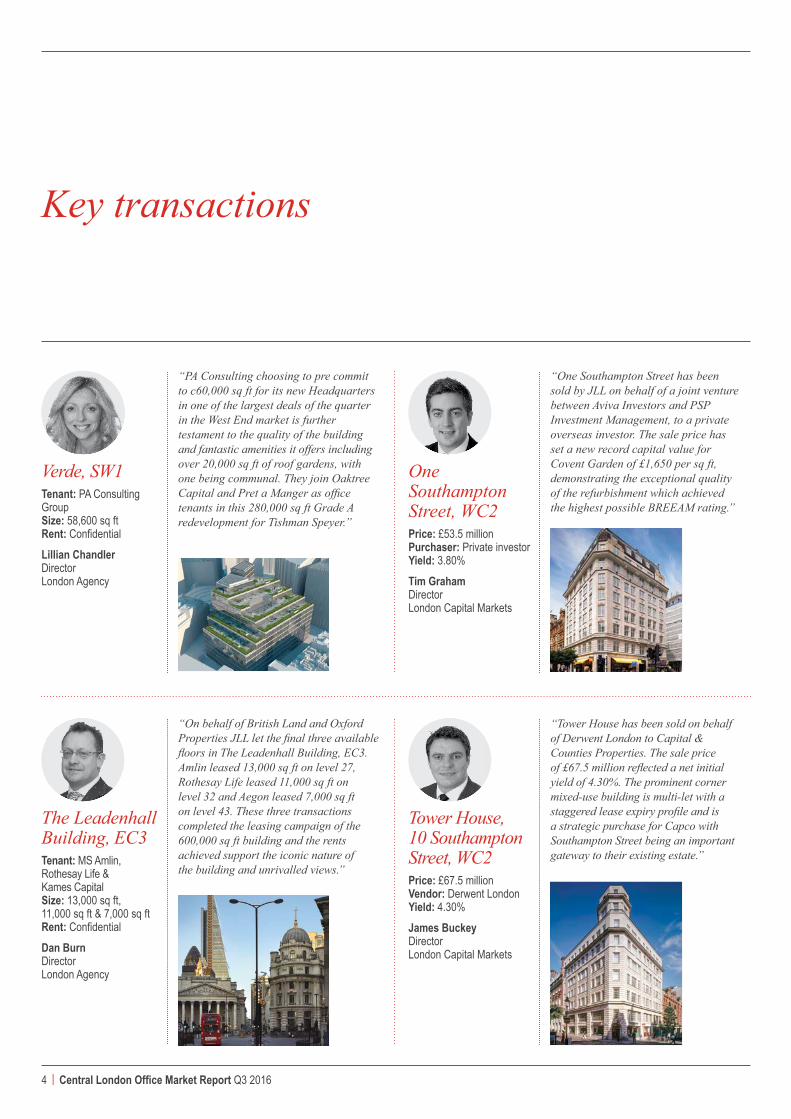
Tower House, 10 Southampton Street, WC2 Price: £67.5 million Vendor: Derwent LondonYield: 4.30%James BuckeyDirectorLondon Capital Markets
“PA Consulting choosing to pre commit to c60,000 sq ft for its new Headquarters in one of the largest deals of the quarter in the West End market is further testament to the quality of the building and fantastic amenities it offers including over 20,000 sq ft of roof gardens, with one being communal. They join Oaktree Capital and Pret a Manger as office tenants in this 280,000 sq ft Grade A redevelopment for Tishman Speyer.”
“On behalf of British Land and Oxford Properties JLL let the final three available floors in The Leadenhall Building, EC3. Amlin leased 13,000 sq ft on level 27, Rothesay Life leased 11,000 sq ft on level 32 and Aegon leased 7,000 sq ft on level 43. These three transactions completed the leasing campaign of the 600,000 sq ft building and the rents achieved support the iconic nature of the building and unrivalled views.”
“One Southampton Street has been sold by JLL on behalf of a joint venture between Aviva Investors and PSP Investment Management, to a private overseas investor. The sale price has set a new record capital value for Covent Garden of £1,650 per sq ft, demonstrating the exceptional quality of the refurbishment which achieved the highest possible BREEAM rating.”
“Tower House has been sold on behalf of Derwent London to Capital & Counties Properties. The sale price of £67.5 million reflected a net initial yield of 4.30%. The prominent corner mixed-use building is multi-let with a staggered lease expiry profile and is a strategic purchase for Capco with Southampton Street being an important gateway to their existing estate.”
Central London Office Market Report Q3 2016 | 5
The recent EU referendum result has created a more uncertain economic environment which in turn has led to more subdued levels of occupier demand. This is likely to impact developer confidence in the short term, and may result in a marked decrease in the level of speculative development starts.
While there is a high level of development completions scheduled for the next 12 months, the decisions made by developers over the coming months will be crucial in determining the level of supply delivered in 2019 and 2020.
Supply recovering from record lowCentral London vacancy reached a 15 year low of 3.4% in 2015, driven by a sustained period of strong take-up, which saw development completions quickly absorbed. This trend was particularly prevalent in the City market where 86% of 2015 development completions were pre-leased, leaving the market starved of newly developed supply, and pushing the vacancy rate to a record low of 3.4%. The West End market has been starved of supply for longer with vacancy rates below 4% since late 2013.
Supply has now started recovering in both the City and West End markets and vacancy rates are likely to see a strong uptick in Q4 due to higher levels of development completions. Vacancy rates are expected to continue to steadily rise in 2017 with above average levels of speculative supply under construction in both the City and West End.
Supply outlook uncertain beyond 2018However, beyond 2018 the supply outlook is far more uncertain. Of a total of 5.9 million sq ft which could be potentially delivered speculatively in 2019, only 1.2 million sq ft is under construction, less than half the 10 year average. Within this, the City market has only 200,000 sq ft under construction speculatively for completion in 2019.
Issue to watch:Speculative development starts
The level of development starts over the coming months will therefore be crucial to ensuring adequate levels of supply being delivered in 2019 and beyond. Previous periods of uncertainty have led to sharp falls in speculative construction starts as developers become far more risk averse. This has been evident in 2009 and 2010, following the global financial crisis, when just 2.4 million sq ft started speculatively across London, compared to 6.2 million sq ft in a typical two year period. A similar picture was evident in 2004 when speculative construction starts totalled just 800,000 sq ft. On both of these occasions the low level of starts set the scene for rental growth in subsequent years.
Speculative development startsWhile there is a high level of uncertainty surrounding the Brexit process, by 2019 there should be more clarity for occupiers who may have delayed decision making. This could potentially lead to an uptick in take-up, led by pent-up demand, placed on hold during the preceding years. Of course, should employment expectations be revised down, we could see lower demand, as well as a release of grey space, reducing the need for newly developed stock.
One way or another, the level of speculative development starts over the next 6-12 months will be crucial in determining the level of supply delivered in 2019-20, and hence shaping market conditions over the medium term.
-
Vacancy rateWest EndCity
Millio
ns sq
ft
East London
012345678
2001 2006 20152007 2008 2009 2010 2011 2012 2013 2014 20162002 2003 2004 20050%
2%
4%
6%
8%
10%
12%
Speculative development starts
James Norton Associate Director
6 | Central London Office Market Report Q3 2016
West End overview
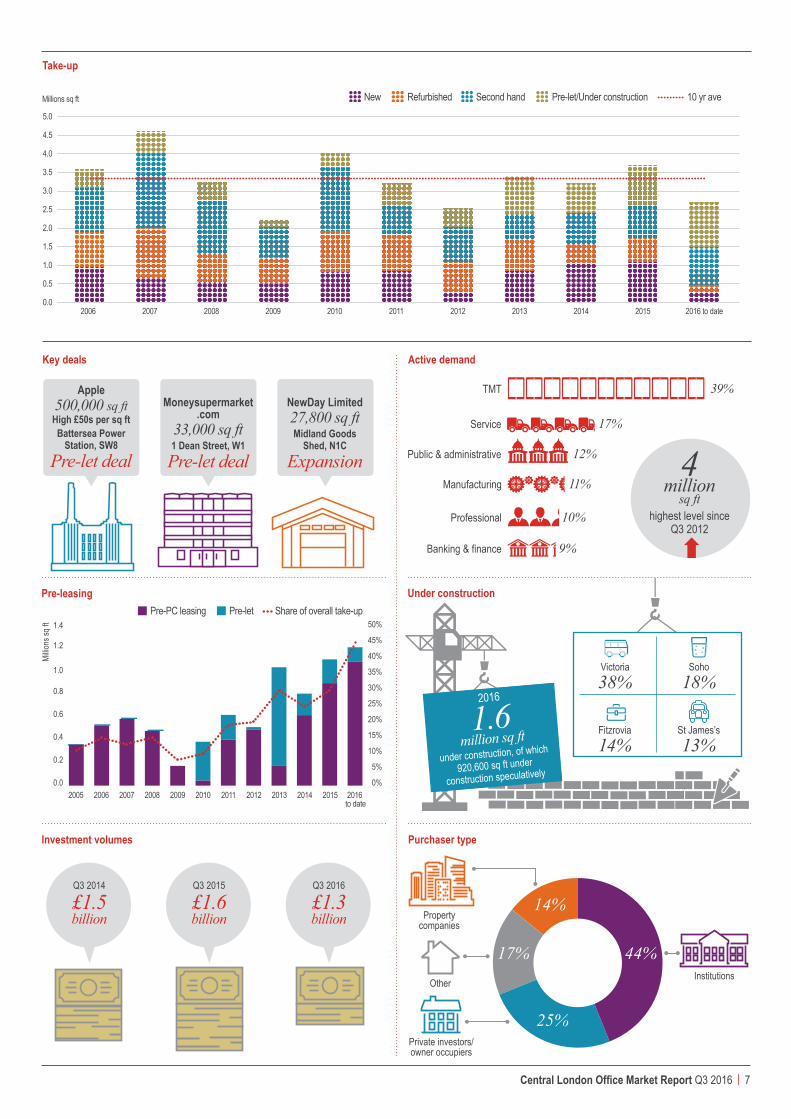
Take-up and demand Take-up reached 1.2 million sq ft across 53 transactions in Q3. This is a 77% increase on the Q2 total and also above the 10 year average of 822,000 sq ft. Take-up was dominated by Apple who acquired 500,000 sq ft over six floors at Battersea Power Station, SW8 in a pre-let deal. Apple will occupy 40% of the development when they move in in 2021 and it’s believed that they will pay a rent in the high £50s per sq ft. The Apple deal demonstrates the fact that some West End occupiers have not been deterred by Brexit and further evidence of this can be seen at 30 Broadwick Street, W1 where EQT pre-let 14,600 sq ft after initially pulling out of a similar deal following the Brexit result.
Pre-completion letting was quite a prominent feature in Q3 and accounted for 60% of total take-up. Apart from the Apple deal, the largest pre-letting deal in the third quarter took place at Verde, SW1 where PA Consulting acquired 58,600 sq ft on the 6th and part 7th floors. Victoria also saw pre-letting activity at Nova South, SW1 where a government agency acquired 45,800 sq ft. Both Verde and Nova South are due to complete next quarter and the developments have been 54% and 45% pre-let respectively.
The Apple deal resulted in the TMT sector having the largest share of take-up in Q3, amounting to 55%. This was followed by the public administration sector (16%) and banking and finance (12%).
Overall demand stands at 6 million sq ft, which is above the Q2 total of 5.1 million sq ft and also above the 10 year average of 5.2 million sq ft. The increase was largely driven by potential demand which ended Q3 at 2 million sq ft. Active demand stands at 4 million sq ft and is above the 10 year average of 3.1 million sq ft. The TMT sector represents 39% of all active requirements, followed by the wider services sector (17%) and the public administration sector (12%).
Key active requirements in Q3 include Nike, Inc (60,000 sq ft – 80,000 sq ft), Playtech (50,000 sq ft - 80,000 sq ft) and Framestore (60,000 sq ft – 70,000 sq ft).
Existing and future supply Overall supply increased 17% in Q3 to 3.7 million sq ft, equating to an overall vacancy rate of 4% which remains below the 10 year average of 4.4%. Grade A vacancy increased from 2.9% to 3.4%.
The volume of space under construction speculatively decreased in Q3 to 3.4 million sq ft compared to 3.8 million sq ft in Q2. Speculative development is 59% ahead of the 10 year average of 2.2 million sq ft although there are several large completions expected in the next quarter. It is too early to say whether developments which have not yet started construction will still go ahead as planned following the referendum, but the strong run of pre-leasing seen in this quarter should be encouraging news for developers.
Rents Prime rents in the core were reduced in Q3 to £115 per sq ft from £120 per sq ft in Q2 (assuming a 10,000 sq ft floor plate and a 10 year term), due to more subdued demand at the premium end of the market.
Investment volumes and yields Investment volumes reached £1.3 billion in Q3 which was above the Q2 figure of £0.8 billion and in line with the 10 year average of £1.4 billion. Key deals include: the acquisition of 440 Strand, WC2 by RBS from TH Real Estate for £198 million, a net initial yield of 4% and a capital value of £1,100 per sq ft; 50 New Bond Street, W1 which was acquired in a joint venture between Oxford Properties and Richemont from Aberdeen Asset Management for £198 million, a net initial yield of 2.9% and a capital value of £4,100 per sq ft; and 355 - 361 Oxford Street, W1 which was purchased by Norges Bank Investment Management from Aberdeen Asset Management for £124 million.
Prime yields remained unchanged in Q3 at 3.5% for sub £10 million, 3.75% for £10 to £80 million lot sizes and 4% for lot sizes over £80 million.
“ Pre-completion letting accounted for 60% of total take-up in Q3.” Amy Birdee
Associate Director
Central London Office Market Report Q3 2016 | 7
14%
17% 44%
25%
Victoria 38%
Fitzrovia 14%
Take-up
Purchaser type
Share of overall take-upPre-PC leasing
Millio
ns sq
ft
0.0
0.2
0.4
0.6
0.8
1.0
1.2
1.4
2006 20152007 2008 2009 2010 2011 2012 2013 2014 2016 to date
Pre-let
20050%
5%
10%
15%
20%
25%
30%
35%
40%
45%
50%
Pre-leasing
Investment volumes
Key deals
Banking & finance 9%
Professional 10%
Service 17%
Manufacturing 11%
TMT 39%
Public & administrative 12% 4million
sq fthighest level since
Q3 2012
Active demand
Under construction
Millions sq ft New 10 yr aveRefurbished
2006 20152007 2008 2009 2010 2011 2012 2013 2014
Second hand Pre-let/Under construction
0.0
0.5
1.0
1.5
2.0
2.5
3.0
3.5
4.0
4.5
5.0
2016 to date
2016
1.6 million sq ft
under construction, of which
920,600 sq ft under
construction speculatively
Soho18%
St James’s13%
Apple500,000 sq ft
High £50s per sq ft Battersea Power
Station, SW8
Pre-let deal
Private investors/owner occupiers
Institutions
NewDay Limited27,800 sq ft Midland Goods
Shed, N1C
Expansion
Moneysupermarket .com
33,000 sq ft 1 Dean Street, W1
Pre-let deal
Q3 2014
£1.5 billion
Q3 2015
£1.6 billion
Q3 2016
£1.3 billion Property
companies
Other
8 | Central London Office Market Report Q3 2016
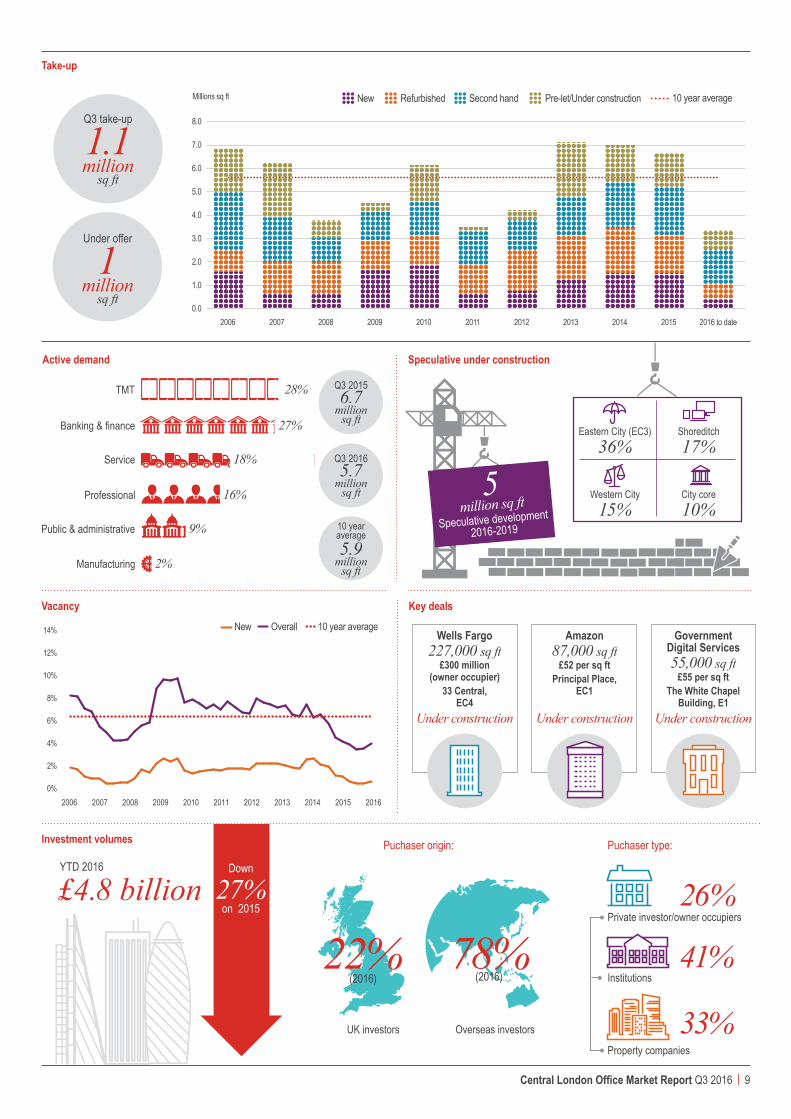
Take-up and demandCity take-up recovered from a pre-Brexit low point recorded in Q2 but continues to trend below both 2015 levels and the long term average, reaching 1.1 million sq ft in Q3. This brings year to date take-up to 3.3 million sq ft, compared to 5.1 million sq ft transacted during the equivalent period in 2015 and 18% down on the 10 year average. The largest transaction of the quarter was US bank Wells Fargo’s purchase of 33 Central, EC4 for their own occupation, a deal which was under offer pre-referendum, and widely seen as bellwether for the strength of the City market.
There was a further 833,000 sq ft transacted across 48 deals, including: 87,000 sq ft of option space acquired by Amazon at Principal Place, EC1; 55,000 sq ft leased by Government Digital Service at the White Chapel Building, E1, one of four deals completed at the building in Q3; and 33,000 sq ft leased to DNV GL in the maiden transaction at South Bank Central, SE1. The banking and finance sector accounted for the largest share of quarterly take-up with 30% of leasing volumes, boosted by the large size of the Wells Fargo transaction. The TMT sector was most active in terms of number of transactions, with 10 deals completed in Q3, a 20% share of take-up.
Overall demand decreased 7% in Q3 to 10.3 million sq ft, but remains ahead of the equivalent period in 2015 and the 10 year average. However, there has been a marked shift in the composition of demand over the past 12 months with active demand dipping below the 10 year average for the first time since 2013, and now at 5.7 million sq ft. Potential demand has also recorded a quarterly decline, falling 4% to 4.6 million sq ft, but remains higher than the 10 year average of 4.1millon sq ft. The shift in balance of demand between active and potential is indicative of occupiers delaying potential office requirements in the face of increased uncertainty following Brexit.
Existing and future supply
Overall supply increased for the second consecutive quarter, rising 13% to 4.4 million sq ft, compared to 3.9 million sq ft at the end of Q2. The quarterly increase in supply was boosted by two speculative development completions in Q3; 225,000 sq ft at South Bank Central, SE1 and 39,000 sq ft at 108 Cannon Street, EC4, which contributed to a 23% increase in new build supply. Supply of second-hand and refurbished space also increased, rising 11% to 3.7 million sq ft. Despite the quarterly increase supply remains constrained, with the overall vacancy rate of 3.9% significantly lower than the average of 6.4%.
City overview
James Norton Associate Director
Supply is expected to increase markedly in Q4 with a further 1.1 million sq ft of speculative space scheduled to complete before the end of the year, including: 296,000 sq ft at One Angel Court, EC2; 273,000 sq ft at One Creechurch Place, EC3; and the remaining 88,000 sq ft at the White Collar Factory, EC1.
RentsCity prime rents remained unchanged at £70 per sq ft, while incentive periods increased by a month to 21 months rent free, on an assumed 10 year term. As a result of the continued uncertainty following the EU referendum, net effective rents remain under pressure, with occupiers seeking extended rent free periods and greater lease flexibility, although the impact is mitigated somewhat by the low vacancy rate.
Investment volumes and yieldsInvestment volumes have slowed considerably in Q3 with just under £930 million transacted across 23 deals, around a third of the Q2 total and the lowest quarterly total since Q1 2010. The largest deal in Q3 and the only transaction of in excess of £100 million was Wells Fargo’s acquisition of 33 Central, EC4 for their own occupation. Other notable transactions completing in Q3 include: 5 King William Street, EC4 purchased by a private middle eastern for £88 million, reflecting a net initial yield of 3.72%; 41 Tower Hill, EC3, a short term sale and lease back of Société Générale’s City HQ for £84.5 million by China Minsheng Investment, a net initial yield of 6.61%; and 12 Moorgate, EC2 purchased by a joint venture between China Mincheng Investment and LS Estates for £32 million, reflecting a net initial yield of 4.39% and a capital value of £943 per sq ft.
Overseas buyers were most active in Q3, accounting for 81% of investment turnover. UK buyers were more active for smaller lot sizes, accounting for 11 transactions and an average deal size of circa £16 million.
Following a 25 basis points adjustment in Q2, prime yields remained unchanged in Q3 at 4.25% across all lot sizes.
Central London Office Market Report Q3 2016 | 9
22% 78%UK investors Overseas investors
(2016)(2016)
YTD 2016
£4.8 billionDown
27%on 2015
Private investor/owner occupiers26%
Institutions41%
Property companies
33%
Puchaser origin: Puchaser type:
Take-up
Q3 take-up
1.1million
sq ft
Under offer
1million
sq ft
Vacancy Key deals
Active demand
TMT 28%
Banking & finance 27%
Professional 16%
Public & administrative 9%
Manufacturing 2%
Service 18%
Q3 20156.7
million sq ft
Q3 20165.7
million sq ft
10 year average5.9
million sq ft
Speculative under construction
14%
12%
10%
8%
6%
4%
2%
0%2006 2007 2008 2009 2010 2011 2012 2013 2014 2015 2016
New Overall 10 year average
5million sq ft
Speculative development 2016-2019
Eastern City (EC3) 36%
Western City 15%
Shoreditch 17%
City core 10%
Investment volumes
Wells Fargo227,000 sq ft
£300 million (owner occupier)
33 Central, EC4
Under construction
Amazon87,000 sq ft
£52 per sq ft Principal Place,
EC1
Under construction
Government Digital Services 55,000 sq ft
£55 per sq ft The White Chapel
Building, E1
Under construction
0.0
1.0
2.0
3.0
4.0
5.0
6.0
7.0
8.0
2006 2007 2008 2009 2010 2011 2012 2013 2014 2015 2016 to date
Millions sq ft New 10 year averageRefurbished Second hand Pre-let/Under construction
10 | Central London Office Market Report Q3 2016
2006 2007 2008 2009 2010 2011 2012 2013 2014 2015 2016
Prime rentOverall vacancy rate
£30
£35
£40
£45
£50
£55
0%
2%
4%
6%
8%
10%
12%
14%
Docklands & East London overview
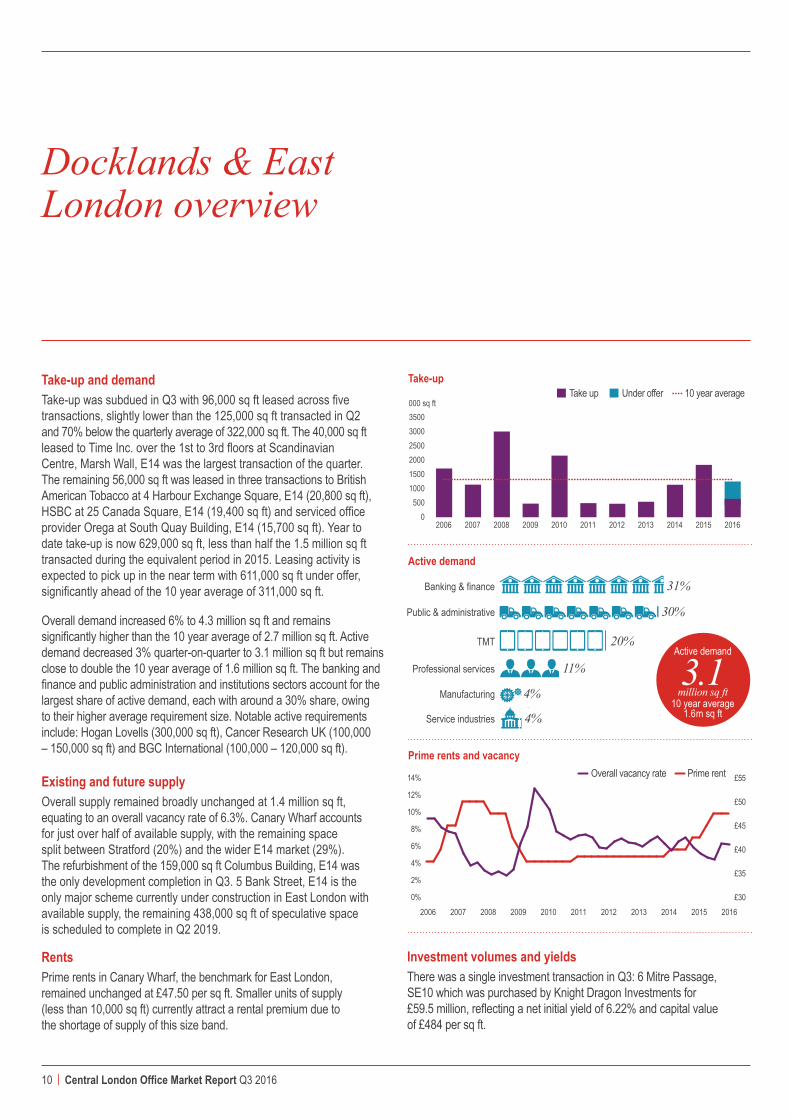
Take-up and demandTake-up was subdued in Q3 with 96,000 sq ft leased across five transactions, slightly lower than the 125,000 sq ft transacted in Q2 and 70% below the quarterly average of 322,000 sq ft. The 40,000 sq ft leased to Time Inc. over the 1st to 3rd floors at Scandinavian Centre, Marsh Wall, E14 was the largest transaction of the quarter. The remaining 56,000 sq ft was leased in three transactions to British American Tobacco at 4 Harbour Exchange Square, E14 (20,800 sq ft), HSBC at 25 Canada Square, E14 (19,400 sq ft) and serviced office provider Orega at South Quay Building, E14 (15,700 sq ft). Year to date take-up is now 629,000 sq ft, less than half the 1.5 million sq ft transacted during the equivalent period in 2015. Leasing activity is expected to pick up in the near term with 611,000 sq ft under offer, significantly ahead of the 10 year average of 311,000 sq ft.
Overall demand increased 6% to 4.3 million sq ft and remains significantly higher than the 10 year average of 2.7 million sq ft. Active demand decreased 3% quarter-on-quarter to 3.1 million sq ft but remains close to double the 10 year average of 1.6 million sq ft. The banking and finance and public administration and institutions sectors account for the largest share of active demand, each with around a 30% share, owing to their higher average requirement size. Notable active requirements include: Hogan Lovells (300,000 sq ft), Cancer Research UK (100,000 – 150,000 sq ft) and BGC International (100,000 – 120,000 sq ft).
Existing and future supply Overall supply remained broadly unchanged at 1.4 million sq ft, equating to an overall vacancy rate of 6.3%. Canary Wharf accounts for just over half of available supply, with the remaining space split between Stratford (20%) and the wider E14 market (29%). The refurbishment of the 159,000 sq ft Columbus Building, E14 was the only development completion in Q3. 5 Bank Street, E14 is the only major scheme currently under construction in East London with available supply, the remaining 438,000 sq ft of speculative space is scheduled to complete in Q2 2019.
Rents Prime rents in Canary Wharf, the benchmark for East London, remained unchanged at £47.50 per sq ft. Smaller units of supply (less than 10,000 sq ft) currently attract a rental premium due to the shortage of supply of this size band.
Take-up
Active demand
Banking & finance 31%
Public & administrative 30%
Professional services 11%
TMT 20%
Manufacturing 4%
Service industries 4%
Active demand
3.1 million sq ft
10 year average 1.6m sq ft
Prime rents and vacancy
000 sq ft
0500
100015002000250030003500
10 year averageUnder offerTake up
2006 2007 2008 2009 2010 2011 2012 2013 2014 2015 2016
Investment volumes and yieldsThere was a single investment transaction in Q3: 6 Mitre Passage, SE10 which was purchased by Knight Dragon Investments for £59.5 million, reflecting a net initial yield of 6.22% and capital value of £484 per sq ft.
Central London Office Market Report Q3 2016 | 11
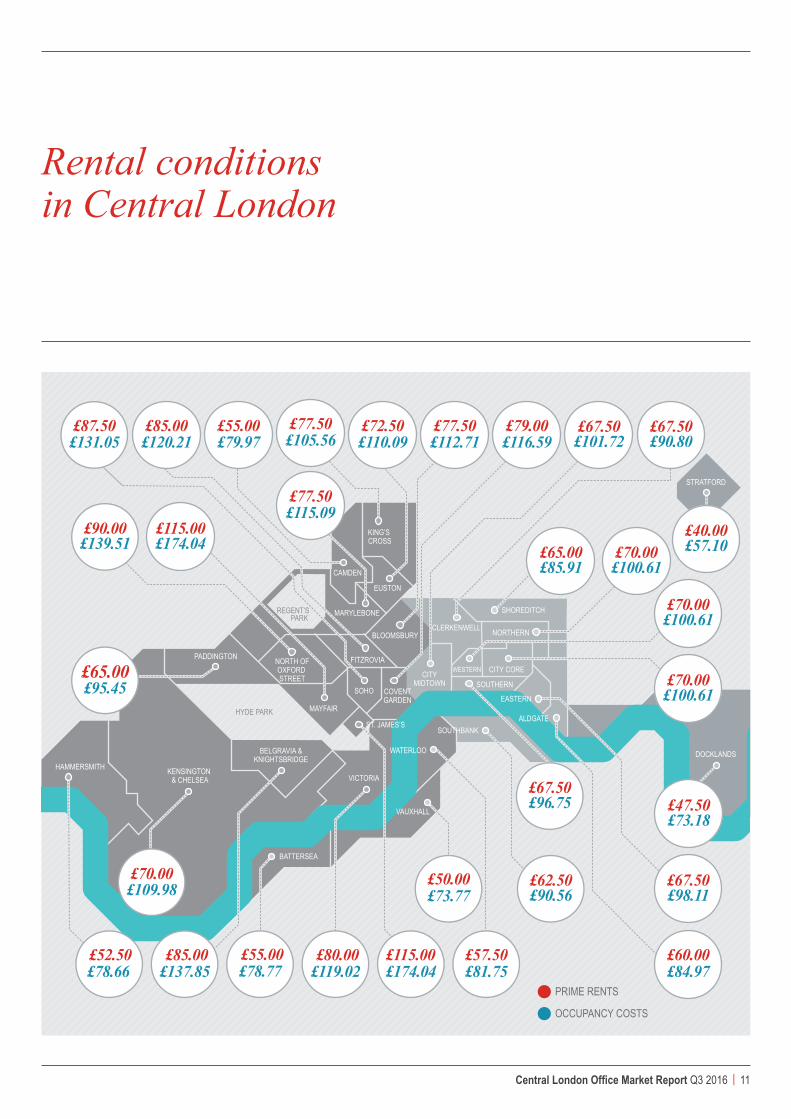
Rental conditions in Central London
£109.98£70.00
FITZROVIA
MAYFAIR
VICTORIA
BELGRAVIA &KNIGHTSBRIDGE
KENSINGTON & CHELSEA
HAMMERSMITH
PADDINGTON
KING’S CROSS
SOHO
BLOOMSBURY
CAMDEN
CLERKENWELL
SHOREDITCH
DOCKLANDS
STRATFORD
NORTHERN
CITY CORE
EASTERN
ALDGATE
BATTERSEA
VAUXHALL
WATERLOO
SOUTHBANK
SOUTHERN
WESTERNCITYMIDTOWN
NORTH OFOXFORD STREET
ST. JAMES’S
COVENTGARDEN
£73.77£50.00
£101.72£67.50
£100.61£70.00
£100.61£70.00
£90.80£67.50
£90.56£62.50
£96.75£67.50
£84.97£60.00
£81.75£57.50
£174.04£115.00
£119.02£80.00
£78.77£55.00
£137.85£85.00
£78.66£52.50
£95.45£65.00
£174.04£115.00
£139.51£90.00
£112.71£77.50
£131.05£87.50
£120.21£85.00
£110.09£72.50
£79.97£55.00
£116.59£79.00
HYDE PARK
REGENT’SPARK
£98.11£67.50
£85.91£65.00
£100.61£70.00
PRIME RENTS
OCCUPANCY COSTS
£57.10£40.00
£73.18£47.50
£105.56£77.50
£115.09£77.50
MARYLEBONE
EUSTON

Leasing
Neil Prime Director Head of Central London Markets +44(0)20 7399 5190 [email protected]
Adrian Crooks Director Central London Agency +44 (0)20 7399 5135 [email protected]
Dan Burn Director Central London Agency +44 (0)20 7399 5966 [email protected]
Capital Markets
Julian Sandbach Director Head of Central London Capital Markets +44 (0)020 7399 5973 [email protected]
Andrew Hawkins Director Central London Capital Markets +44(0)20 7399 5840 [email protected]
Research
Jon Neale Head of UK Research UK Research +44(0)20 7852 4685 [email protected]
Ben Burston Head of UK Office Research UK Research +44 (0)20 7399 5289 [email protected]
Alex Hodge Director UK Marketing +44(0)20 7399 5735 [email protected]
Contacts
jll.co.uk
© 2016 Jones Lang LaSalle IP Inc. All rights reserved. The information contained in this document is proprietary to Jones Lang LaSalle and shall be used solely for the purposes of evaluating this proposal. All such documentation and information remains the property of Jones Lang LaSalle and shall be kept confidential. Reproduction of any part of this document is authorized only to the extent necessary for its evaluation. It is not to be shown to any third party without the prior written authorization of Jones Lang LaSalle. All information contained herein is from sources deemed reliable; however no representation or warranty is made as to the accuracy thereof.