Embed Size (px)
Citation preview

Interim Management Report
to 31 March 2017
1
INTERIM MANAGEMENT
REPORT
TO 31 MARCH 2017 ______________________
First Quarter 2017
Board of Directors
Milan, 10 May 2017

Interim Management Report
to 31 March 2017
2
DeA Capital S.p.A.
Corporate information DeA Capital S.p.A. is subject to the management and
coordination of De Agostini S.p.A.
Registered office: Via Brera 21, Milan 20121, Italy
Share capital: EUR 306,612,100 (fully paid up),
comprising 306,612,100 shares with a nominal value of
EUR 1 each (including 46,929,395 treasury shares at 31
March 2017)
Tax code, VAT code and recorded in the Milan Register of
Companies under no. 07918170015
Board of Directors (*)
Chairman Lorenzo Pellicioli
Chief Executive Officer Paolo Ceretti
Directors Lino Benassi
Marco Boroli
Donatella Busso (1/5)
Marco Drago
Carlo Enrico Ferrari Ardicini
Francesca Golfetto (3/5)
Severino Salvemini (2/3/5)
Daniela Toscani (1/5)
Elena Vasco (4/5)
Board of Statutory Auditors (*)
Chairman Cesare Andrea Grifoni
Permanent Auditors Annalisa Raffaella Donesana
Fabio Facchini
Deputy auditors Andrea Augusto Bonafè
Michele Maranò
Marco Sguazzini Viscontini
Secretary to the Board of
Directors
Diana Allegretti
Manager responsible for
preparing the Company’s
accounts
Manolo Santilli
Independent Auditors
PricewaterhouseCoopers S.p.A.
(*) In office until the approval of the Financial Statements for the Year Ending 31 December 2018 (1) Member of the Control and Risks Committee (2) Member and Chairman of the Control and Risks Committee (3) Member of the Remuneration and Appointments Committee (4) Member and Chairman of the Remuneration and Appointments Committee (5) Independent Director
Interim Management Report
to 31 March 2017
3
Contents
Report on Operations
1. Profile of DeA Capital S.p.A.
2. Information for shareholders
3. The DeA Capital Group’s key Statement of Financial Position and Income
Statement figures
4. Significant events in the first quarter of 2017
5. Results of the DeA Capital Group
6. Other information
Consolidated Financial Statements and Notes to the
Accounts for the period 1 January to 31 March 2017
Statement of Responsibilities for the Interim Management Report to 31 March 2017

Interim Management Report
to 31 March 2017
4
Interim Report on Operations

Interim Management Report
to 31 March 2017
5

Interim Management Report
to 31 March 2017
6
1. Profile of DeA Capital S.p.A.
With assets under management of more than EUR 11,000 million and an investment
portfolio of approximately EUR 470 million, DeA Capital S.p.A. is one of Italy's largest
alternative investment operators.
The Company, which operates in both the Private Equity Investment and Alternative
Asset Management businesses, is listed on the FTSE Italia STAR section of the Milan
stock exchange and heads the De Agostini Group in the area of financial investments.
In the Private Equity Investment business, DeA Capital S.p.A. has "permanent" capital,
and therefore has the advantage – compared with traditional private equity funds, which
are normally restricted to a pre-determined duration – of greater flexibility in optimising
the timing of entry to and exit from investments. In terms of investment policy, this
flexibility allows it to adopt an approach based on value creation, including over the
medium to long term.
With regard to Alternative Asset Management activities, DeA Capital S.p.A. – through its
subsidiaries IDeA FIMIT SGR and IDeA Capital Funds SGR – is Italy’s leading operator in
real estate fund management and private equity funds of funds programmes,
respectively. The two asset management companies are active in the promotion,
management and value enhancement of investment funds, using approaches based on
sector experience and the ability to identify opportunities for achieving the best returns.
The Company's ability to carry out investment initiatives (including those that are
structurally very complex), on the one hand, and raise funds through its asset
management subsidiary companies on the other, is proof of the effectiveness of its
business model, which combines private investment and asset management activities to
create value in a unique way in Italy's alternative asset management sector. It does this
thanks to:
the excellent quality, built up over time, of the management team, which has over
180 professionals dedicated to managing funds in the most attractive alternative
investment asset classes (real estate, private equity and NPL);
its solid financial position, which enables it to support the launch of new initiatives
with its own capital, and hence substantially align its interests with those of the
investors in our funds;
an extensive network of international relationships, which makes DeA Capital the
preferred Gate-to-Italy for alternative investment decisions in our country;
its membership of one of Italy's leading business Groups, whose structure is built on
a long-term approach that best supports the Company's growth path.

Interim Management Report
to 31 March 2017
7
At 31 March 2017, DeA Capital S.p.A. reported Group shareholders’ equity of EUR 540.4
million, corresponding to a net asset value (NAV) of EUR 2.08 per share (compared with
EUR 2.03 per share at 31 December 2016), with an investment portfolio of EUR 472.8 million.
More specifically, the investment portfolio consists of Private Equity Investment shareholdings
of EUR 94.7 million, Private Equity Investment funds of EUR 208.7 million and net assets
relating to the Alternative Asset Management business of EUR 169.4 million.
At 31 March 2017, the corporate structure of the Group headed by DeA Capital S.p.A. (the DeA
Capital Group, or the Group) was as summarised below:
DeA CapitalS.p.A.
Funds and other
Investments
Shareholding
KenanInvestments
Shareholding
Sigla Luxembourg
Shareholding
Migros
IRE /
IRE Advisory
100%
IDeA
Capital Funds
SGR
100%
45%
Shareholding
Sigla
61.3%
IDeA FIMIT
SGR
Direct Private EquityInvestment
Indirect Private Equity Investment
DeA Capital
Real Estate
Alternative Asset Management
3.0%
IDeA RE
100%
ICF II
units
IDeA I
FoFunits
ICF III
units
IDeA
OF Iunits
EESS
units
Venere
units
ToI
units
IDeA
CCR Iunits
68.7%
Santa
Palombaunits
SPC
Private Equity Investment
Alternative Asset Management
Holding companies
Interim Management Report
to 31 March 2017
8
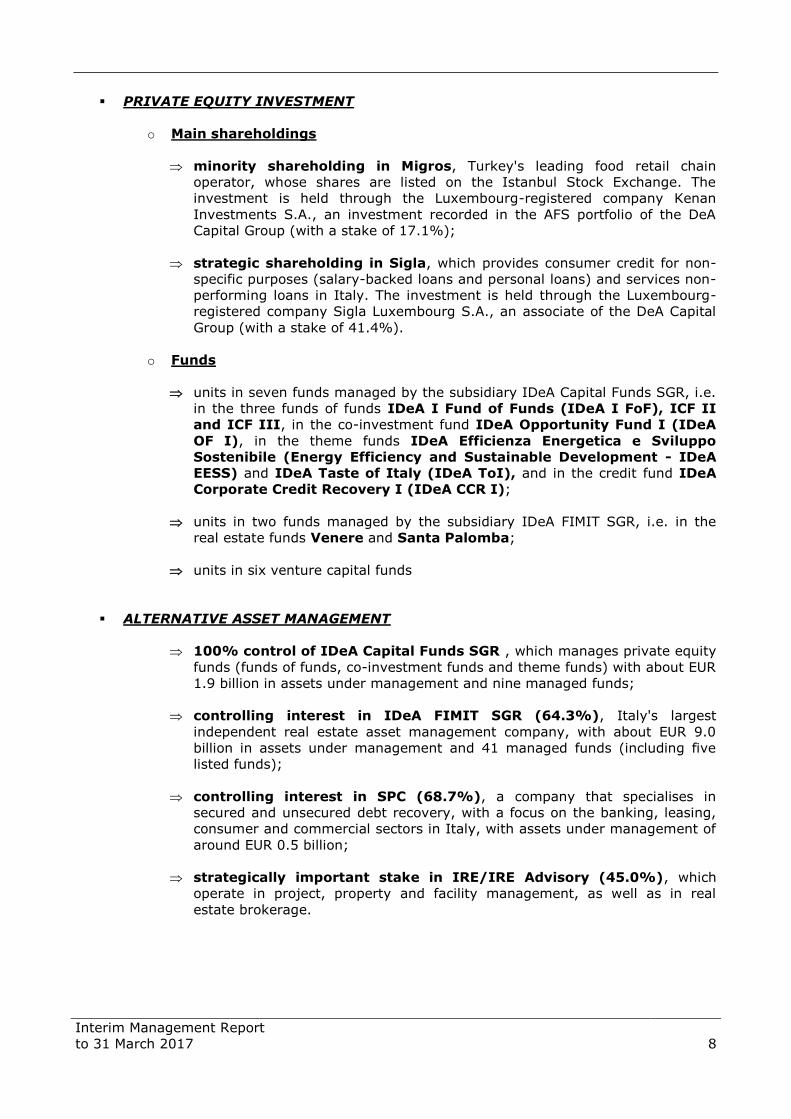
PRIVATE EQUITY INVESTMENT
o Main shareholdings
minority shareholding in Migros, Turkey's leading food retail chain
operator, whose shares are listed on the Istanbul Stock Exchange. The
investment is held through the Luxembourg-registered company Kenan
Investments S.A., an investment recorded in the AFS portfolio of the DeA
Capital Group (with a stake of 17.1%);
strategic shareholding in Sigla, which provides consumer credit for non-
specific purposes (salary-backed loans and personal loans) and services non-
performing loans in Italy. The investment is held through the Luxembourg-
registered company Sigla Luxembourg S.A., an associate of the DeA Capital
Group (with a stake of 41.4%).
o Funds
units in seven funds managed by the subsidiary IDeA Capital Funds SGR, i.e.
in the three funds of funds IDeA I Fund of Funds (IDeA I FoF), ICF II
and ICF III, in the co-investment fund IDeA Opportunity Fund I (IDeA
OF I), in the theme funds IDeA Efficienza Energetica e Sviluppo
Sostenibile (Energy Efficiency and Sustainable Development - IDeA
EESS) and IDeA Taste of Italy (IDeA ToI), and in the credit fund IDeA
Corporate Credit Recovery I (IDeA CCR I);
units in two funds managed by the subsidiary IDeA FIMIT SGR, i.e. in the
real estate funds Venere and Santa Palomba;
units in six venture capital funds
ALTERNATIVE ASSET MANAGEMENT
100% control of IDeA Capital Funds SGR , which manages private equity
funds (funds of funds, co-investment funds and theme funds) with about EUR
1.9 billion in assets under management and nine managed funds;
controlling interest in IDeA FIMIT SGR (64.3%), Italy's largest
independent real estate asset management company, with about EUR 9.0
billion in assets under management and 41 managed funds (including five
listed funds);
controlling interest in SPC (68.7%), a company that specialises in
secured and unsecured debt recovery, with a focus on the banking, leasing,
consumer and commercial sectors in Italy, with assets under management of
around EUR 0.5 billion;
strategically important stake in IRE/IRE Advisory (45.0%), which
operate in project, property and facility management, as well as in real
estate brokerage.

Interim Management Report
to 31 March 2017
9
2. Information for shareholders
Shareholder structure - DeA Capital S.p.A. (#)
(#) Figures at 31 March 2017
Note: At the date of this document, there were 47,244,082 treasury shares representing 15.41% of share capital.
De Agostini
S.p.A.58.3%
Treasury
Stock15.3%
Free Float
26.4%

Interim Management Report
to 31 March 2017
10
Share performance (°)
- From 11 January 2007, when DeA Capital S.p.A. began operations, to 31 March 2017
- From 1 January 2016 to 31 March 2017
(°) Source: Bloomberg
0,30
0,80
1,30
1,80
2,30
2,80
3,30
DeA Capital LPX 50 FTSE All
1,10
1,20
1,30
1,40
1,50
1,60
1,70
DeA Capital FTSE All LPX 50
Interim Management Report
to 31 March 2017
11
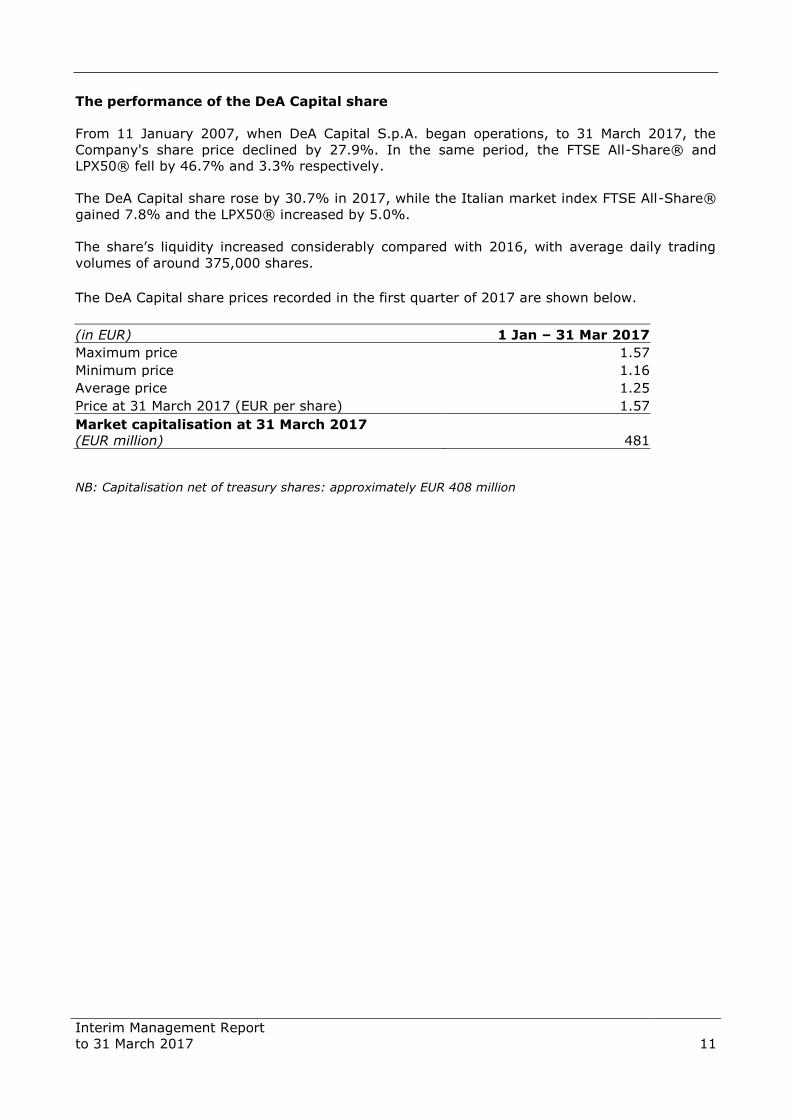
The performance of the DeA Capital share
From 11 January 2007, when DeA Capital S.p.A. began operations, to 31 March 2017, the
Company's share price declined by 27.9%. In the same period, the FTSE All-Share® and
LPX50® fell by 46.7% and 3.3% respectively.
The DeA Capital share rose by 30.7% in 2017, while the Italian market index FTSE All-Share®
gained 7.8% and the LPX50® increased by 5.0%.
The share’s liquidity increased considerably compared with 2016, with average daily trading
volumes of around 375,000 shares.
The DeA Capital share prices recorded in the first quarter of 2017 are shown below.
(in EUR) 1 Jan – 31 Mar 2017
Maximum price 1.57
Minimum price 1.16
Average price 1.25
Price at 31 March 2017 (EUR per share) 1.57
Market capitalisation at 31 March 2017
(EUR million) 481
NB: Capitalisation net of treasury shares: approximately EUR 408 million
Interim Management Report
to 31 March 2017
12
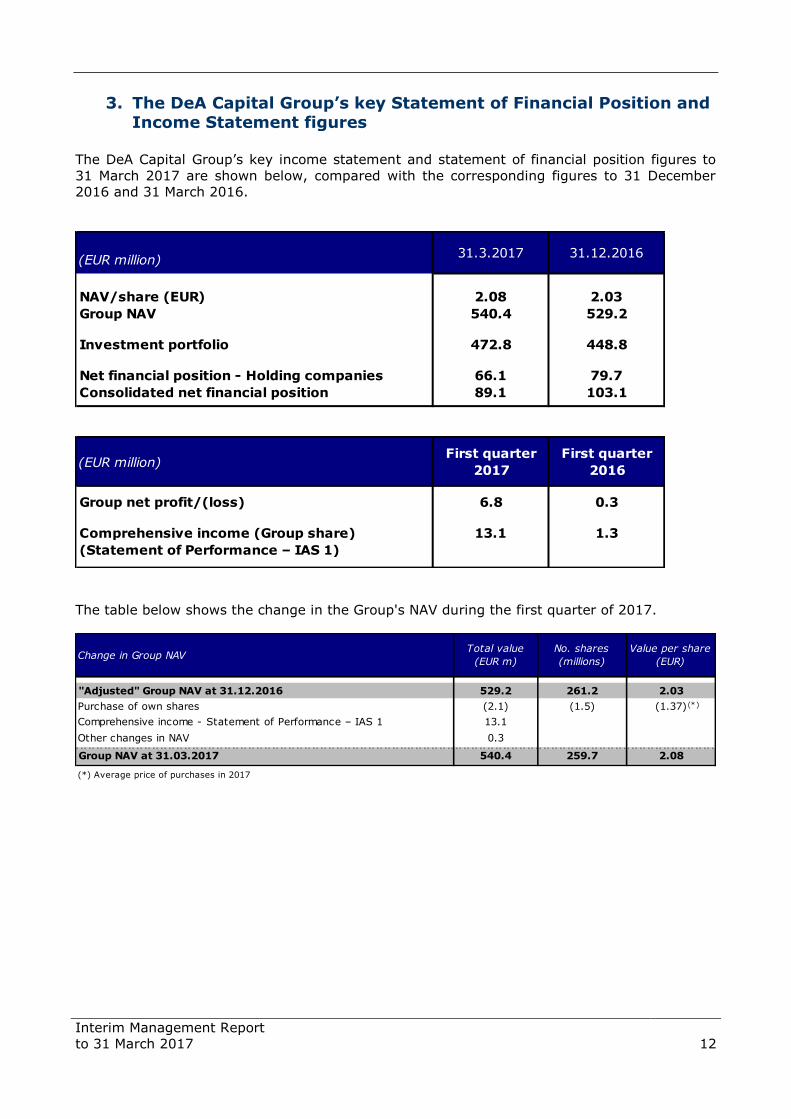
3. The DeA Capital Group’s key Statement of Financial Position and Income Statement figures
The DeA Capital Group’s key income statement and statement of financial position figures to
31 March 2017 are shown below, compared with the corresponding figures to 31 December
2016 and 31 March 2016.
The table below shows the change in the Group's NAV during the first quarter of 2017.
(EUR million)
NAV/share (EUR) 2.08 2.03
Group NAV 540.4 529.2
Investment portfolio 472.8 448.8
Net financial position - Holding companies 66.1 79.7
Consolidated net financial position 89.1 103.1
(EUR million)
Group net profit/(loss) 6.8 0.3
Comprehensive income (Group share) 13.1 1.3
(Statement of Performance – IAS 1)
First quarter
2017
First quarter
2016
31.3.2017 31.12.2016
"Adjusted" Group NAV at 31.12.2016 529.2 261.2 2.03
Purchase of own shares (2.1) (1.5) (1.37)
Comprehensive income - Statement of Performance – IAS 1 13.1
Other changes in NAV 0.3
Group NAV at 31.03.2017 540.4 259.7 2.08
(*) Average price of purchases in 2017
No. shares
(millions)
Value per share
(EUR)Change in Group NAV
Total value
(EUR m)
(*)

Interim Management Report
to 31 March 2017
13
The table below provides details of the Group’s Statement of Financial Position at 31 March
2017 (compared with the position at 31 December 2016).
M€ €/Sh. M€ €/Sh.
Private Equity Investment
- Kenan Inv. / Migros 74.9 0.29 66.9 0.26
- Funds - Private Equity / Real Estate 208.7 0.80 202.9 0.78
- Other (Sigla, Crescita,...) 19.8 0.08 11.7 0.04
Total PEI (A) 303.4 1.17 281.5 1.08
Alternative Asset Management
- IDeA FIMIT SGR 124.0 0.48 122.7 0.47
- IDeA Capital Funds SGR 38.4 0.15 37.7 0.14
- Other (IRE / SPC) 7.0 0.03 6.9 0.03
Total AAM (B) 169.4 0.66 167.3 0.64
Investment Portfolio (A+B) 472.8 1.83 448.8 1.72
Other net assets (liabilities) 1.5 0.00 0.7 0.00
Net Financial Position Holdings 66.1 0.25 79.7 0.31
NAV 540.4 2.08 529.2 2.03
March 31, 2017 December 31, 2016
Interim Management Report
to 31 March 2017
14
4. Significant events in the first quarter of 2017
The significant events that occurred in the first quarter of 2017 are reported below.
Funds – paid calls/distributions
In the first quarter of 2017, the DeA Capital Group increased its investments in the ICF III,
IDeA ToI and IDeA CCR I funds with payments totalling EUR 2.2 million.
At the same time, the DeA Capital Group received capital reimbursements of EUR 0.1 million
from the Atlantic Value Added fund.
Thus, in the first quarter of 2017, the funds in which DeA Capital S.p.A. has invested produced
a net negative cash balance totalling EUR 2.1 million for the portion relating to the Group.
Investment in the "Crescita" ("Growth") special purpose acquisition company
(SPAC)
During the first quarter of 2017, the DeA Capital Group completed its investment in the
"Crescita" ("Growth") special purpose acquisition company (SPAC), whose shares commenced
trading on the Italian stock exchange on 15 March 2017, for a total outlay of EUR 7.8 million
for DeA Capital. The stake acquired equates to 5.8% of the ordinary shares (totalling EUR 130
million) and 9.2% of the preference shares (totalling EUR 3 million); the latter can be
converted into a maximum of six ordinary shares each, subject to the achievement of certain
objectives.
The SPAC's objective is to complete a business combination with an Italian target company
within 24 months of its listing date.
Liquidation of the Atlantic Value Added fund (involving the distribution in kind
of the units in the Venere fund)
In March 2017, the Group completed the early liquidation of the Atlantic Value Added fund,
managed by IDeA FIMIT SGR, which involved the distribution in kind of the units held in the
Venere fund (as well as the distribution of the remaining liquidity).
Thus, at the date of this document, the DeA Capital Group directly owns 9.1% of the Venere
fund and has no residual commitments.
Interim Management Report
to 31 March 2017
15
5. Results of the DeA Capital Group
The consolidated results for the period relate to the operations of the DeA Capital Group in the
following businesses:
Private Equity Investment, which includes the reporting units involved in private equity
investment, broken down into shareholdings (direct investments) and investments in
funds (indirect investments);
Alternative Asset Management, which includes the reporting units dedicated to asset
management activities and related services, with a focus on the management of private
equity and real estate funds.
Private Equity Investment
At 31 March 2017 the DeA Capital Group was a shareholder of:
Kenan Investments, the indirect parent company of Migros (valued at EUR 74.9
million);
Sigla Luxembourg, the parent company of Sigla (valued at EUR 11.5 million);
Crescita, a special purpose acquisition company (valued at EUR 8.1 million);
Harvip, which manages funds and investment vehicles used to purchase distressed real
estate and other investments (valued at EUR 0.2 million).
The DeA Capital Group is also a shareholder in other smaller companies which are not included
in the investment portfolio as they are either dormant or in liquidation and have a zero
carrying value.
At 31 March 2017, the DeA Capital Group held units in the following funds (net carrying value
from the funds' consolidated financial statements shown in brackets):
IDeA I FoF (valued at EUR 68.5 million);
ICF II (valued at EUR 46.5 million);
ICF III (valued at EUR 6.9 million);
IDeA OF I (valued at EUR 43.8 million);
IDeA EESS (valued at EUR 22.1 million);
IDeA ToI (valued at EUR 7.2 million);
IDeA CCR I (valued at EUR 0.1 million);
Venere (valued at EUR 3.6 million);
Santa Palomba (valued at EUR 0.4 million);
six venture capital funds (with a total value of approximately EUR 9.6 million).
Valuations of shareholdings and funds in the portfolio reflect estimates made using the
information available on the date this document was prepared.

Interim Management Report
to 31 March 2017
16
Investments in associates
- Sigla Luxembourg (Parent Company of Sigla)
Registered office: Italy
Sector: Consumer credit
Website: www.siglacredit.it
Investment details:
On 5 October 2007, the DeA Capital Group finalised the acquisition of a stake (currently
41.4%) in Sigla Luxembourg, the holding company that fully controls Sigla, which operates in
Italy and provides consumer credit for non-specific purposes.
Brief description:
Sigla specialises in "salary-backed loans". It is a benchmark operator in the provision of
financial services to households throughout Italy, chiefly through a network of agents.
It activities also include servicing unsecured non-performing loans (personal loans and credit
cards).
The investment in Sigla Luxembourg, amounting to EUR 11.5 million, which was unchanged
compared with 31 December 2016, was classified under ”Held-for-sale assets” in light of the
process to sell the shareholding, which is still under way.
With the consumer credit market continuing to experience solid growth in 2017 (+9.7% in
salary-backed loans in February 2017, compared with +7.3% in 2016), Sigla has continued to
raise new funding (around EUR 400 million raised in the first part of 2017) to meet the
significant growth in salary-backed loans disbursed (+24%).
At the same time, Sigla's risk profile has continued to improve significantly, given the gradual
recovery of the portfolio of outstanding personal loans (down to EUR 27.7 million at 31 March
2017) and the pronounced reduction in financial debt (from EUR 32 million at 31 December
2014 to EUR 2.9 million at 31 March 2017, an improvement of around EUR 30 million in the
last two years).
Sigla (mln €)First Quarter 2017 First Quarter 2016 Change
CQS granted 50.5 40.6 24.4%
Revenues from CQS 3.2 2.9 9.0%
Group net profit 0.5 0.5 0.0%
* Receivables for personal loans net of impairment provisions

Interim Management Report
to 31 March 2017
17
Investments in other companies
- Kenan Investments (holder of a shareholding in Migros)
Registered office: Turkey
Sector: Food retail
Website: www.migros.com.tr
Investment details:
In 2008, the DeA Capital Group acquired about 17% of the capital of Kenan Investments, the
company heading the structure to acquire an interest in Migros.
This interest currently stands at 40.25%, after the sale of a similar stake in Anadolu Endüstri
Holding, a leading Turkish conglomerate, which was completed in 2015.
Brief description:
Migros was established in 1954 and is the leading company in the food retail sector in Turkey.
The company has 1,794 sales outlets (at 31 March 2017), with a total net area of 1,412
thousand square metres.
Migros is present in all seven regions of Turkey, and has marginal presences in Kazakhstan
and Macedonia.
The company operates under the following names: Migros and Macrocenter (supermarkets),
5M (hypermarkets), Ramstore (supermarkets abroad) and Kangurum (online store).
Growth in the retail sector in Turkey is a relatively recent phenomenon, brought about by the
transition from traditional systems such as bakkals (small stores typically run by families) to
an increasingly widespread organised distribution model.
On 3 March 2017, Migros completed the acquisition of 95.5% of Tesco-Kipa, a large
supermarket chain with a turnover of over TRY 2 billion and 168 sales outlets.
The stake in Kenan Investments is recorded in the Consolidated Financial Statements to 31
March 2017 at EUR 74.9 million (compared with EUR 66.9 million at 31 December 2016). This
amount (indirectly corresponding to approximately 6.9% of Migros' capital, i.e. 40.25% of
Migros' capital via the Group's investment in Kenan Investments) reflects a price per share of
Migros of:
- TRY 26.00 (plus interest of 7.5% per annum from 30 April 2015) for the stake subject
to put/call options agreed with Anadolu on 9.75% of Migros and exercisable from 30
April 2017;
- TRY 22.16, being the market price on 31 March 2017 for the remaining stake (30.5% of
Migros' capital).

Interim Management Report
to 31 March 2017
18
The increase in the value of the stake in Kenan Investments at 31 March 2017 compared with
31 December 2016 is attributable to the combined effect of the rise in the share price (TRY
22.16 per share at 31 March 2017 compared with TRY 17.58 per share at 31 December 2016)
and the depreciation of the Turkish lira against the euro (3.89 TRY/EUR at 31 March 2017
versus 3.72 TRY/EUR at 31 December 2016).
Funds
At 31 March 2017, the DeA Capital Group's Private Equity Investment business included
investments in:
- the IDeA OF I fund (fully consolidated in accordance with IFRS 10);
- the IDeA EESS fund and the Venere real estate fund (classified under "Investments in
associates", based on the units held);
- in three funds of funds (IDeA I FoF, ICF II and ICF III), two theme funds (IDeA ToI and
IDeA CCR I), six venture capital funds and the Santa Palomba real estate fund,
worth a net total of approximately EUR 208.7 million (corresponding to the estimated fair
value calculated using the information available on the date this document was prepared) in
the Consolidated Financial Statements at 31 March 2017.
Residual commitments for all the funds in the portfolio were approximately EUR 105.3 million.
Migros (mln YTL) First Quarter 2017 First Quarter 2016 Change
Revenues 3,114 2,411 29.1%
EBITDA 156 148 5.6%
Net financial debt (2,450) (1.805) (#) -645 mln YTL
(#) December, 31 2016

Interim Management Report
to 31 March 2017
19
- IDeA I FoF
IDeA I Fund of Funds
Registered office: Italy
Sector: Private equity
Website: www.ideasgr.com
Investment details:
IDeA I FoF is a closed-end fund under Italian law, for qualified investors, which began operations
on 30 January 2007 and is managed by IDeA Capital Funds SGR.
The DeA Capital Group has a total commitment of up to EUR 173.5 million in the fund.
Brief description:
IDeA I FoF, which has total assets of approximately EUR 681 million, invests its assets in units of
unlisted closed-end funds that are mainly active in the private equity sector in various countries. It
optimises the risk-return profile through careful diversification of assets among managers with a
proven track record of returns and solidity, different investment approaches, geographical areas
and maturities.
According to the latest report available, the IDeA I FoF portfolio was invested in 41 funds with
different investment strategies; these funds in turn hold positions, with varying maturities, in 330
companies active in geographical regions with different growth rates.
The funds are diversified in the buy-out (control) and expansion (minorities) categories, with
overweighting towards medium- and small-scale transactions and special situations (distressed
debt/equity and turnaround).
At 31 March 2017, IDeA I FoF had called up 85.4% of its total commitment and had made
distributions totalling 74.6% of that commitment.
Interim Management Report
to 31 March 2017
20
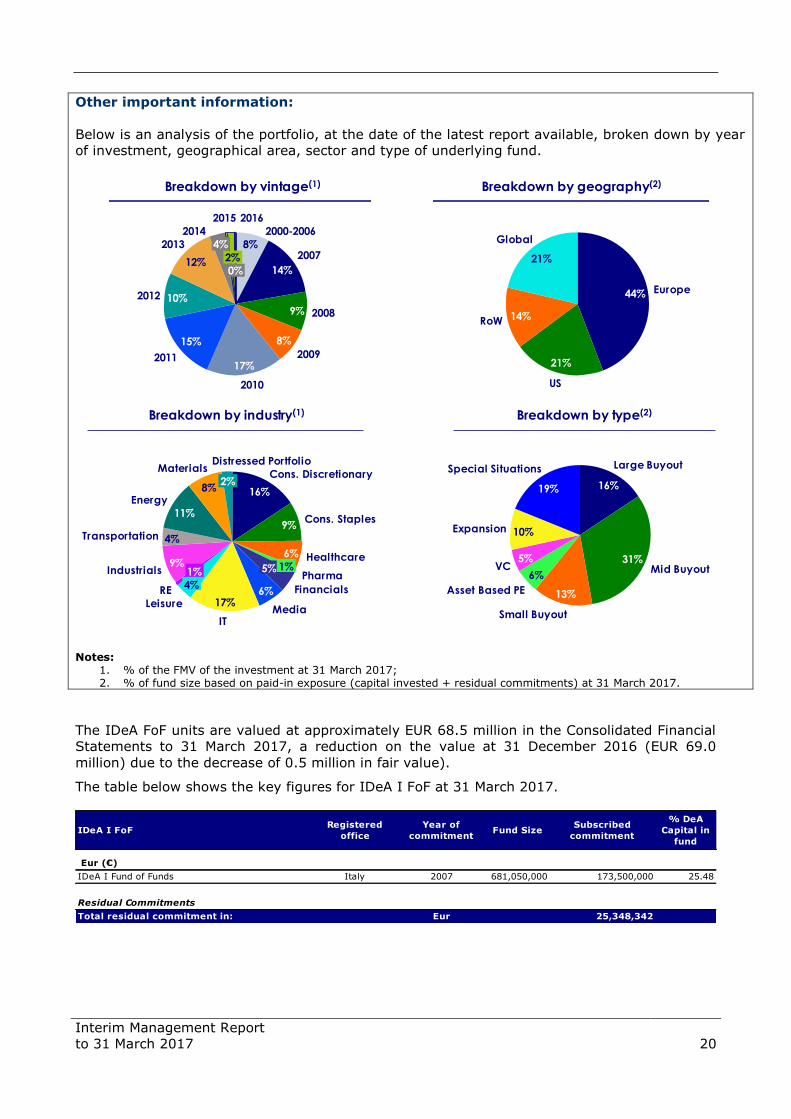
Other important information:
Below is an analysis of the portfolio, at the date of the latest report available, broken down by year
of investment, geographical area, sector and type of underlying fund.
Notes:
1. % of the FMV of the investment at 31 March 2017; 2. % of fund size based on paid-in exposure (capital invested + residual commitments) at 31 March 2017.
The IDeA FoF units are valued at approximately EUR 68.5 million in the Consolidated Financial
Statements to 31 March 2017, a reduction on the value at 31 December 2016 (EUR 69.0
million) due to the decrease of 0.5 million in fair value).
The table below shows the key figures for IDeA I FoF at 31 March 2017.
Breakdown by industry(1) Breakdown by type(2)
Breakdown by vintage(1) Breakdown by geography(2)
Global
21%
RoW 14%
US
21%
Europe44%
19%
Expansion 10%
VC5%
Asset Based PE
6%
Small Buyout
13%
Mid Buyout31%
Large Buyout
16%
Special SituationsDistressed Portfolio
2%
Materials
8%Energy
11%
Transportation 4%
Industrials9%
RE
1%
Leisure
4%
IT
17%Media
6% Financials
5%Pharma
1%Healthcare6%
Cons. Staples9%
Cons. Discretionary
16%
2016
0%
2015
2%
2014
4%2013
12%
2012 10%
2011
15%
2010
17%2009
8%
20089%
2007
14%
2000-2006
8%
IDeA I FoFRegistered
office
Year of
commitmentFund Size
Subscribed
commitment
% DeA
Capital in
fund
Eur (€)
IDeA I Fund of Funds Italy 2007 681,050,000 173,500,000 25.48
Residual Commitments
Total residual commitment in: Eur 25,348,342
Interim Management Report
to 31 March 2017
21
- ICF II
ICF II
Registered office: Italy
Sector: Private equity
Website: www.ideasgr.com
Investment details:
ICF II is a closed-end fund under Italian law, for qualified investors, which began operations on 24
February 2009 and is managed by IDeA Capital Funds SGR.
The DeA Capital Group has a total commitment of up to EUR 51 million in the fund.
Brief description:
ICF II, with total assets of EUR 281 million, invests in units of unlisted closed-end funds that are
mainly active in the private equity sector of various countries. It optimises the risk-return profile
through careful diversification of assets among managers with a proven track record of returns and
solidity, different investment approaches, geographical areas and maturities.
The fund started building its portfolio by focusing on funds in the area of mid-market buy-outs,
distressed and special situations, loans, turnarounds and funds with a specific sector slant,
targeting, in particular, opportunities offered in the secondary market.
Based on the latest report available, the ICF II portfolio was invested in 27 funds with different
investment strategies; these funds in turn hold positions, with varying maturities, in around 382
companies active in various geographical areas.
At 31 March 2017, ICF II had called up around 71.7% of its total commitment and had made
distributions totalling 28.5% of that commitment.
Interim Management Report
to 31 March 2017
22
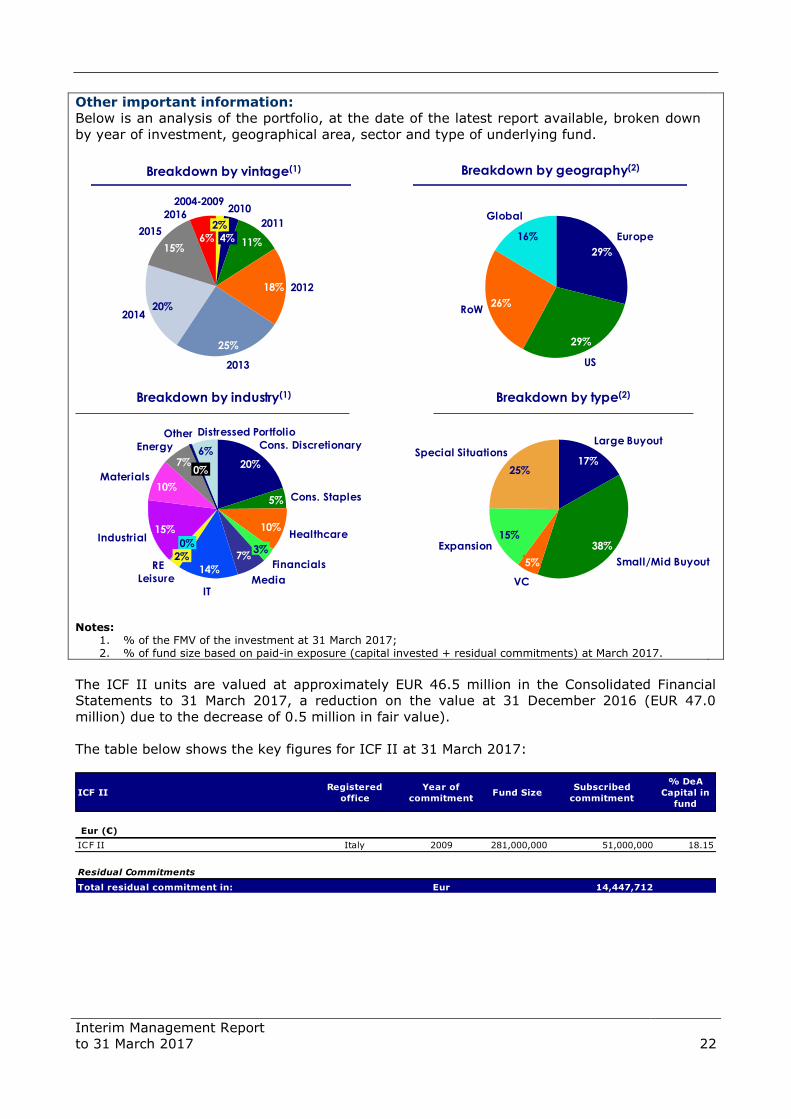
Other important information:
Below is an analysis of the portfolio, at the date of the latest report available, broken down
by year of investment, geographical area, sector and type of underlying fund.
Notes: 1. % of the FMV of the investment at 31 March 2017; 2. % of fund size based on paid-in exposure (capital invested + residual commitments) at March 2017.
The ICF II units are valued at approximately EUR 46.5 million in the Consolidated Financial
Statements to 31 March 2017, a reduction on the value at 31 December 2016 (EUR 47.0
million) due to the decrease of 0.5 million in fair value).
The table below shows the key figures for ICF II at 31 March 2017:
Global
16%
RoW26%
US
29%
Europe
29%
Small/Mid Buyout
38%
Large Buyout
17%Special Situations
25%
Expansion15%
VC
5%
6%
2016
2015
15%
201420%
2013
25%
201218%
2011
11%
2010
4%
2004-2009
2%
0%7%
Distressed Portfolio
6%Energy
Other
Materials10%
Industrial15%
RE
0%
Leisure
2%
IT
14%Media
7%Financials
3%
Healthcare10%
Cons. Staples5%
Cons. Discretionary
20%
Breakdown by vintage(1) Breakdown by geography(2)
Breakdown by type(2)Breakdown by industry(1)
ICF IIRegistered
office
Year of
commitmentFund Size
Subscribed
commitment
% DeA
Capital in
fund
Eur (€)
ICF II Italy 2009 281,000,000 51,000,000 18.15
Residual Commitments
Total residual commitment in: Eur 14,447,712

Interim Management Report
to 31 March 2017
23
- ICF III
ICF III
Registered office: Italy
Sector: Private equity
Website: www.ideasgr.com
Investment details:
ICF III is a closed-end fund under Italian law, for qualified investors, which began operations on 10
April 2014 and is managed by IDeA Capital Funds SGR.
The DeA Capital Group has a total commitment of up to EUR 12.5 million in the fund.
Brief description:
ICF III, with total assets of approximately EUR 67 million, intends to invest its assets in units of
closed-end private equity funds or in schemes that replicate that financial model, either as the lead
investor or with other co-investors.
The fund is divided into three parts:
Core, with a focus on buy-outs, expansion capital and special situations;
Credit & Distressed, which invests in special credit operations (preferred equity,
mezzanine, senior loans), turnarounds and other credit strategies;
- Emerging Markets, which focuses on expansion capital, buy-outs, distressed assets and
venture capital operations in emerging markets.
At 31 March 2017, ICF III had called up 48.1%, 59.0% and 42.5% in the Core, Credit & Distressed
and Emerging Markets segments respectively.
The units in ICF III were valued at a total of EUR 6.9 million in the Consolidated Financial
Statements to 31 March 2017, in line with the figure for 31 December 2016. This was due to
the combination of net capital calls totalling EUR 0.1 million and a decrease in fair value of EUR
0.1 million.
The table below shows the key figures for ICF III at 31 March 2017.
ICF IIIRegistered
office
Year of
commitmentFund Size
Subscribed
commitment
% DeA
Capital in
fund
Eur (€)
ICF III Italy 2014 66,950,000 12,500,000 18.67
of which:
Segment Core 34,600,000 1,000,000 2.89
Segment Credit & Distressed 17,300,000 4,000,000 23.12
Segment Emerging Markets 15,050,000 7,500,000 49.83
Residual Commitments
Total residual commitment in: Eur 6,472,998
Interim Management Report
to 31 March 2017
24
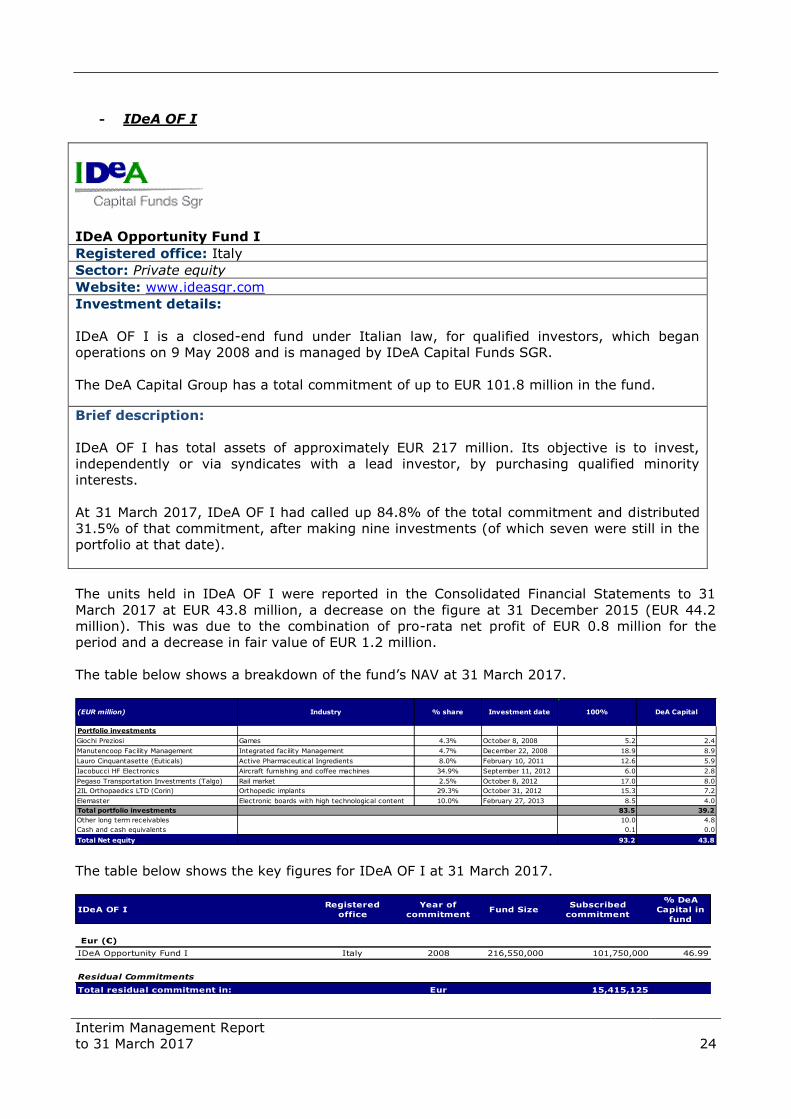
- IDeA OF I
IDeA Opportunity Fund I
Registered office: Italy
Sector: Private equity
Website: www.ideasgr.com
Investment details:
IDeA OF I is a closed-end fund under Italian law, for qualified investors, which began
operations on 9 May 2008 and is managed by IDeA Capital Funds SGR.
The DeA Capital Group has a total commitment of up to EUR 101.8 million in the fund.
Brief description:
IDeA OF I has total assets of approximately EUR 217 million. Its objective is to invest,
independently or via syndicates with a lead investor, by purchasing qualified minority
interests.
At 31 March 2017, IDeA OF I had called up 84.8% of the total commitment and distributed
31.5% of that commitment, after making nine investments (of which seven were still in the
portfolio at that date).
The units held in IDeA OF I were reported in the Consolidated Financial Statements to 31
March 2017 at EUR 43.8 million, a decrease on the figure at 31 December 2015 (EUR 44.2
million). This was due to the combination of pro-rata net profit of EUR 0.8 million for the
period and a decrease in fair value of EUR 1.2 million.
The table below shows a breakdown of the fund’s NAV at 31 March 2017.
The table below shows the key figures for IDeA OF I at 31 March 2017.
(EUR million) Industry % share Investment date 100% DeA Capital
Portfolio investments
Giochi Preziosi Games 4.3% October 8, 2008 5.2 2.4
Manutencoop Facility Management Integrated facility Management 4.7% December 22, 2008 18.9 8.9
Lauro Cinquantasette (Euticals) Active Pharmaceutical Ingredients 8.0% February 10, 2011 12.6 5.9
Iacobucci HF Electronics Aircraft furnishing and coffee machines 34.9% September 11, 2012 6.0 2.8
Pegaso Transportation Investments (Talgo) Rail market 2.5% October 8, 2012 17.0 8.0
2IL Orthopaedics LTD (Corin) Orthopedic implants 29.3% October 31, 2012 15.3 7.2
Elemaster Electronic boards with high technological content 10.0% February 27, 2013 8.5 4.0
Total portfolio investments 83.5 39.2
Other long term receivables 10.0 4.8
Cash and cash equivalents 0.1 0.0
Total Net equity 93.2 43.8
IDeA OF IRegistered
office
Year of
commitmentFund Size
Subscribed
commitment
% DeA
Capital in
fund
Eur (€)
IDeA Opportunity Fund I Italy 2008 216,550,000 101,750,000 46.99
Residual Commitments
Total residual commitment in: Eur 15,415,125

Interim Management Report
to 31 March 2017
25
- IDeA EESS
IDeA Efficienza Energetica e Sviluppo Sostenibile (IDeA Energy Efficiency and
Sustainable Development)
Registered office: Italy
Sector: Private equity
Website: www.ideasgr.com
Investment details:
IDeA EESS is a closed-end fund under Italian law, for qualified investors, which began
operating on 1 August 2011 and is managed by IDeA Capital Funds SGR.
The DeA Capital Group has a total commitment of up to EUR 30.4 million in the fund.
Brief description:
IDeA EESS, which has total assets of EUR 100 million, is a closed-end mutual fund under
Italian law, for qualified investors, which seeks to acquire minority and controlling
shareholdings in unlisted companies in Italy and abroad, by investing jointly with local
partners.
The fund is dedicated to investing in small and medium-sized manufacturing and service
companies operating in the field of energy saving and the efficient use of natural resources.
It focuses on the development of solutions that make faster and cheaper use of renewable
energy sources without compromising effectiveness in reducing CO2 emissions.
At 31 March 2017, IDeA EESS had called up 76.3% of the total commitment and distributed
33.6% of that commitment, after making nine investments (of which eight were still in the
portfolio at that date).
The units held in IDeA EESS were reported in the Consolidated Financial Statements to 31
March 2017 at approximately EUR 22.1 million, an increase on the figure at 31 December 2016
(EUR 16.9 million). This was due to the pro-rata net profit of EUR 5.2 million for the period
(mainly associated with the marking to market of the SMR stock in the portfolio).
The table below shows a breakdown of the fund’s NAV at 31 March 2017.
(EUR million) Industry % share Investment date 100% DeA Capital
Portfolio investments
Domotecnica(*) Heat engineering products 48.0% May 8, 2012 0 0
Elemaster Electronic boards 10.0% February 27, 2013 8.5 2.6
SMRE Industrial machinery textile sector 26.6% April 23, 2013 29.8 9.1
Zephyro Energy services for complex structures 8.1% December 11, 2013 6.3 1.9
Meta Fin Electronics components for safety systems 21.5% February 13, 2014 7.0 2.1
Baglioni Design / production of compressed air tanks 41.2% February 5, 2015 10.0 3.0
Tecnomeccanica Production for lights industry 96.8% October 27, 2016 4.6 1.4
Stalam
Production of radiofrequency machinery for
textile sector 90.0% November 30, 2016 4.1 1.3
Total portfolio investments 70.3 21.4
Other assets (liabilities) (0.2) (0.1)
Cash and cash equivalents 2.5 0.8
Total Net equity 72.6 22.1
(*) On the date hereof, the bankruptcy proceedings were not yet completed
Interim Management Report
to 31 March 2017
26
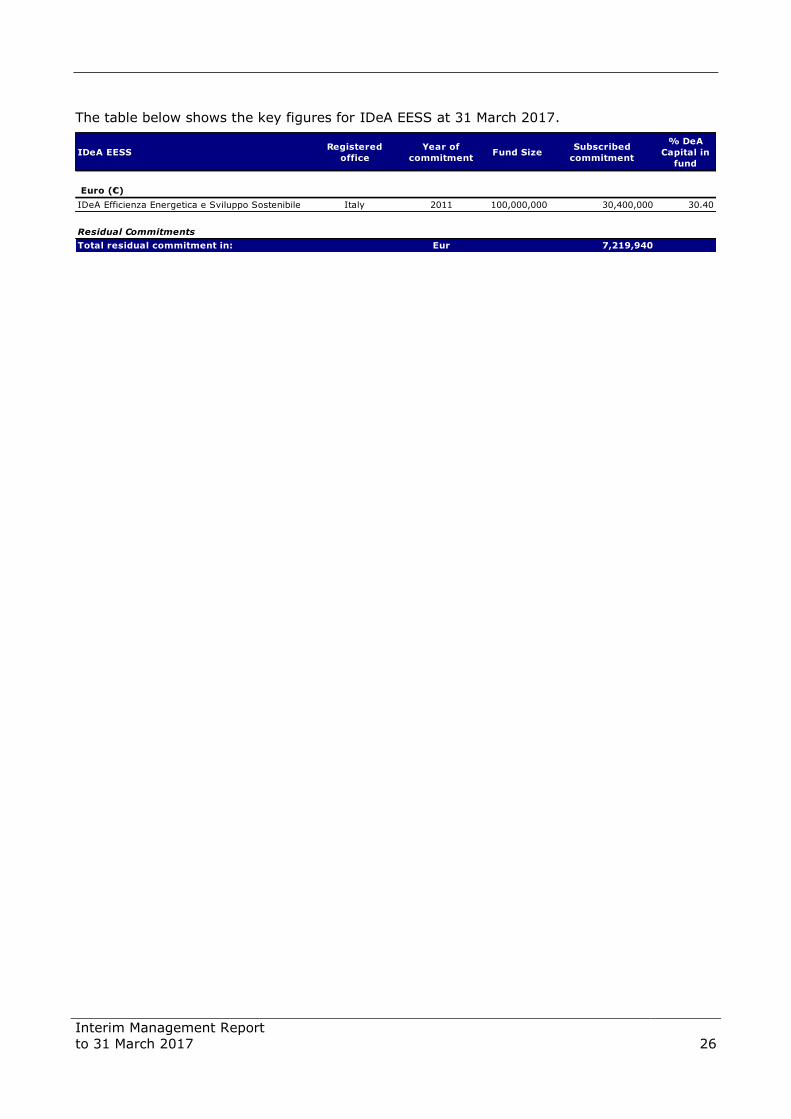
The table below shows the key figures for IDeA EESS at 31 March 2017.
IDeA EESS Registered
office
Year of
commitmentFund Size
Subscribed
commitment
% DeA
Capital in
fund
Euro (€)
IDeA Efficienza Energetica e Sviluppo Sostenibile Italy 2011 100,000,000 30,400,000 30.40
Residual Commitments
Total residual commitment in: Eur 7,219,940
Interim Management Report
to 31 March 2017
27
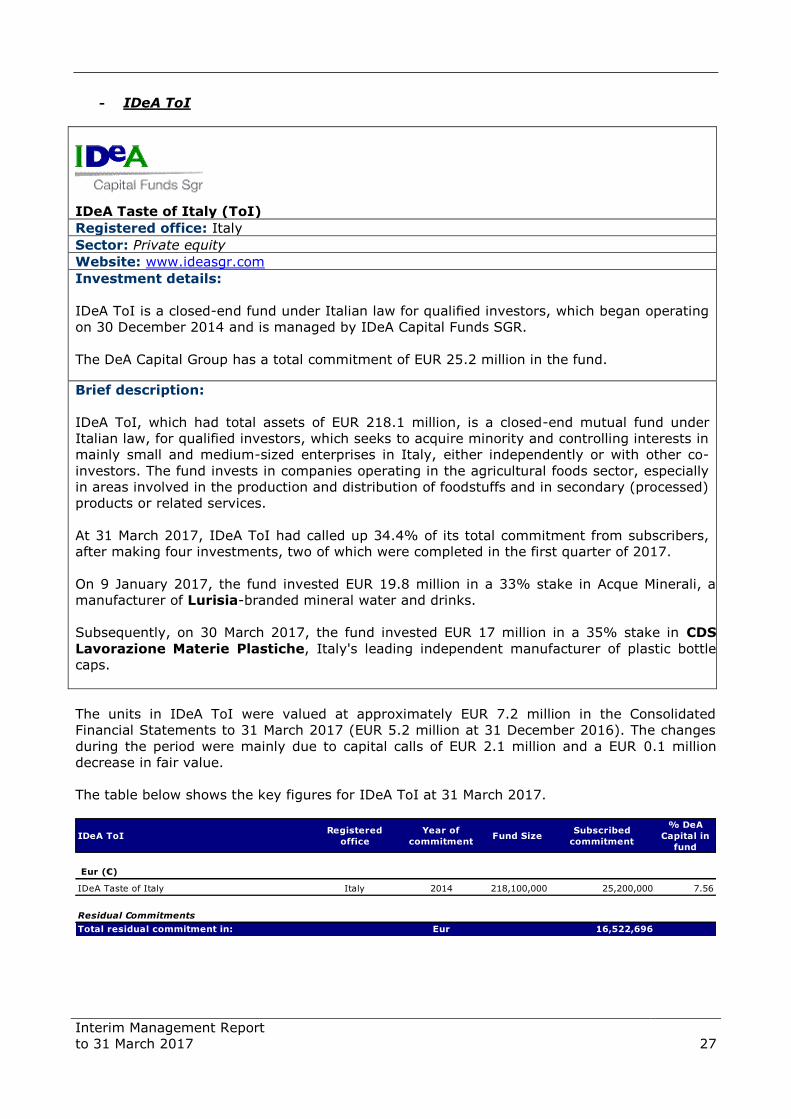
- IDeA ToI
IDeA Taste of Italy (ToI)
Registered office: Italy
Sector: Private equity
Website: www.ideasgr.com
Investment details:
IDeA ToI is a closed-end fund under Italian law for qualified investors, which began operating
on 30 December 2014 and is managed by IDeA Capital Funds SGR.
The DeA Capital Group has a total commitment of EUR 25.2 million in the fund.
Brief description:
IDeA ToI, which had total assets of EUR 218.1 million, is a closed-end mutual fund under
Italian law, for qualified investors, which seeks to acquire minority and controlling interests in
mainly small and medium-sized enterprises in Italy, either independently or with other co-
investors. The fund invests in companies operating in the agricultural foods sector, especially
in areas involved in the production and distribution of foodstuffs and in secondary (processed)
products or related services.
At 31 March 2017, IDeA ToI had called up 34.4% of its total commitment from subscribers,
after making four investments, two of which were completed in the first quarter of 2017.
On 9 January 2017, the fund invested EUR 19.8 million in a 33% stake in Acque Minerali, a
manufacturer of Lurisia-branded mineral water and drinks.
Subsequently, on 30 March 2017, the fund invested EUR 17 million in a 35% stake in CDS
Lavorazione Materie Plastiche, Italy's leading independent manufacturer of plastic bottle
caps.
The units in IDeA ToI were valued at approximately EUR 7.2 million in the Consolidated
Financial Statements to 31 March 2017 (EUR 5.2 million at 31 December 2016). The changes
during the period were mainly due to capital calls of EUR 2.1 million and a EUR 0.1 million
decrease in fair value.
The table below shows the key figures for IDeA ToI at 31 March 2017.
IDeA ToIRegistered
office
Year of
commitmentFund Size
Subscribed
commitment
% DeA
Capital in
fund
Eur (€)
IDeA Taste of Italy Italy 2014 218,100,000 25,200,000 7.56
Residual Commitments
Total residual commitment in: Eur 16,522,696

Interim Management Report
to 31 March 2017
28
- IDeA CCR I
IDeA Corporate Credit Recovery I (IDEA CCR I)
Registered office: Italy
Sector: Private equity
Website: www.ideasgr.com
Investment details:
IDeA CCR I is a closed-end fund under Italian law, for qualified investors, which began
operations on 23 June 2016 and is managed by IDeA Capital Funds SGR.
The DeA Capital Group has a total commitment of EUR 15.2 million in the fund.
Brief description:
IDeA CCR I, which has total assets of EUR 262.8 million, is a closed-end mutual fund under
Italian law, for qualified investors, which aims to help relaunch medium-sized Italian
companies that are facing financial difficulties but have solid business fundamentals (Target
Companies), sharing the profits between creditors and new investors, by
- proactive management of loans to the Target Companies;
- potential investments to be carried out via debtor-in-possession financing transactions,
which means that the new investments have greater seniority than existing financial
debt;
- "equity-style" involvement in the management of debtor companies.
The fund is divided into two parts:
Loans segment, which has acquired loans and financial equity instruments relating to
financing operations for the Target Companies from eight banks for a consideration of
approximately EUR 177 million, in exchange for the allocation of units in the fund's
loans segment;
New finance segment, which has obtained commitments for new financial resources
of up to around EUR 85 million, which could be used for the Target Companies or
companies with similar characteristics.
By its very nature, as it was created by means of contributions, the loans segment is fully
invested; as at 31 March 2017, the new finance segment had called up 1.3% of the total
commitment.
The units in IDeA CCR I are valued at approximately EUR 0.1 million in the Consolidated
Financial Statements to 31 March 2017 (unchanged on the figure at 31 December 2016). The
table below shows the key figures for the IDeA CCR I fund at 31 March 2017.
IDeA CCR IRegistered
office
Year of
commitmentFund Size
Subscribed
commitment
% DeA
Capital in
fund
Euro (€)
IDeA CCR I Italy 2016 262,809,252 15,150,000 5.76
of which:
Segment New Financing 85,250,000 15,075,000 17.68
Segment Credit 177,559,252 75,000 0.04
Residual Commitments
Total residual commitment in: Eur 14,002,310

Interim Management Report
to 31 March 2017
29
- Venere
Registered office: Italy
Sector: Private Equity – Real Estate
Website: www.ideafimit.it
Investment details:
In March 2017, the Group completed the early liquidation of the Atlantic Value Added fund via
the distribution in kind of the units held in the Venere fund and of the remaining liquidity.
Thus, at the date of this document, the DeA Capital Group directly owns 9.1% of the Venere
fund and has no residual commitments.
Brief description:
The fund, which is managed by the subsidiary IDeA FIMIT SGR and has a commitment of
around EUR 77 million, comprises real estate of 15 buildings for predominantly residential
use, comprising five free-standing buildings and ten property units that were sold in portions.
The real estate portfolio is located in northern Italy, mainly in Milan, where there are seven
buildings representing approximately 76% of the assets by market value.
The units in the Venere fund were valued at approximately EUR 3.6 million in the Consolidated
Financial Statements to 31 March 2017 (EUR 3.7 million at 31 December 2016). The changes
were mainly due to distributions of EUR 0.1 million in the period.
The table below shows the key figures for the Venere fund at 31 March 2017.
VenereRegistered
office
Year of
commitmentFund Size
Subscribed
commitment
% DeA
Capital in
fund
Eur (€)
Venere Italy 2011 77,000,000 7,000,000 9.09
Residual Commitments
Total residual commitment in: Eur 0

Interim Management Report
to 31 March 2017
30
Santa Palomba
DeA Capital S.p.A. has subscribed to a total commitment of EUR 1.0 million. The fund, which is
managed by the subsidiary IDeA FIMIT SGR, builds social housing in the metropolitan area of
Rome.
The units in Santa Palomba are valued at approximately EUR 0.4 million in the Consolidated
Financial Statements to 31 March 2017 (unchanged on the figure at 31 December 2016).
The table below shows the key figures for the Santa Palomba fund at 31 March 2017.
- Venture capital funds
The units in venture capital funds had a total value of approximately EUR 9.6 million in the
Financial Statements to 31 March 2017 (EUR 9.5 million at 31 December 2016). The increase
compared with the end of last year was due to a EUR 0.1 million rise in fair value.
The table below shows the key figures for venture capital funds in the portfolio at 31 March
2017.
Santa PalombaRegistered
office
Year of
commitmentFund Size
Subscribed
commitment
% DeA
Capital in
fund
Eur (€)
Santa Palomba Italy 2016 82,500,000 1,000,000 1.21
Residual Commitments
Total residual commitment in: Eur 600,000
Venture Capital Funds Registered officeYear of
commitmentFund Size
Subscribed
commitment
% DeA Capital
in fund
Dollars (USD)
Doughty Hanson & Co Technology UK EU 2004 271,534,000 1,925,000 0.71
GIZA GE Venture Fund III Delaware U.S.A. 2003 211,680,000 10,000,000 4.72
Israel Seed IV Cayman Islands 2003 200,000,000 5,000,000 2.50
Pitango Venture Capital III Delaware U.S.A. 2003 417,172,000 5,000,000 1.20
Totale Dollars 21,925,000
Eur (€)
Nexit Infocom 2000 Guernsey 2000 66,325,790 3,819,167 5.76
Sterlings (GBP)
Amadeus Capital II UK EU 2000 235,000,000 13,500,000 5.74
Residual Commitments
Total residual commitment in: Eur 4,342,776
Interim Management Report
to 31 March 2017
31
Alternative Asset Management
At 31 March 2017, DeA Capital S.p.A. was the owner of:
100% of IDeA Capital Funds SGR;
64.3% of IDeA FIMIT SGR;
68.7% of SPC (which operates in debt recovery in Italy);
45.0% of IRE/IRE Advisory (which operates in project, property and facility
management, and real estate brokerage).
- IDeA Capital Funds SGR
Registered office: Italy
Sector: Alternative Asset Management - Private Equity
Website: www.ideasgr.com
Investment details:
IDeA Capital Funds SGR operates in the management of private equity funds (funds of funds, co-
investment funds and theme funds). At 31 March 2017, the asset management company
managed nine closed-end private equity funds, including four funds of funds (IDeA I FoF, ICF II,
ICF III and IDeA Crescita Globale, which serves the retail segment), a "direct" co-investment fund
(IDeA OF I), three theme funds (IDeA EESS, which operates in energy efficiency, IDeA ToI, in the
agricultural foods sector, and IDeA CCR I, Italy's leading debtor-in-possession financing fund)
and, since April 2015, Investitori Associati IV (in liquidation).
The investment programmes of IDeA Capital Funds SGR, which are regulated by the Bank of Italy
and Consob, capitalise on the management teams' wealth of experience.
The investment strategies of the funds of funds focus on building diversified portfolios in private
equity funds that are in the top quartile or that are next-generation leaders with balanced asset
allocation through diversification by:
industrial sector;
investment strategy and stage (buy-outs, venture capital, special situations, etc.);
geographical area (Europe, US and the Rest of the World);
maturity (commitments with investment periods diluted over time).
The investment strategies of the "direct" co-investment fund focus on minority interests in
businesses that primarily concentrate on Europe, and on diversification based on the appeal of
individual sectors.
The investment philosophy of the IDeA EESS sector fund focuses on growth capital and buy-out
private equity to support the growth of small and medium-sized enterprises with products/services
of excellence in energy efficiency and sustainable development.
The investment target of the IDeA ToI fund is small and medium-sized enterprises operating in
the agricultural foods industry, through operations in development capital and early-stage buy-
outs.
The IDeA CCR I fund's objective is to relaunch medium-sized Italian companies that are in
financial difficulties but have solid business fundamentals.

Interim Management Report
to 31 March 2017
32
The table below summarises the value of assets under management and management fees for
IDeA Capital Funds SGR at 31 March 2017.
With regard to operating performance, the company posted a year-on-year increase of EUR
300 million in assets under management at the end of the first quarter of 2017; this is mainly
due to the third and fourth closings of the IDeA ToI fund (EUR 78 million) and the closing of
the IDeA CCR I fund (EUR 263 million), which were completed in 2016.
(EUR million)
Asset Under
Management at
31 march 2017
Management
fees at 31
march 2017
IDeA Capital Funds SGR
IDeA I FoF 681 0.8
IDeA OF I 217 0.5
ICF II 281 0.4
IDeA EESS 100 0.3
Idea Crescita Globale 55 0.3
ICF III 67 0.1
Taste of Italy 218 1.1
Investitori Associati IV 55 0.2
IDeA CCR I 263 0.5
Total IDeA Capital Funds SGR 1,937 4.2
IDeA Capital Funds SGR (EUR million) First Quarter 2017 First Quarter 2016
AUM 1,937 1,627
Management fees 4.2 4.2
EBITDA 1.0 1.1
Net profit 0.7 0.7

Interim Management Report
to 31 March 2017
33
- IDeA FIMIT SGR
Registered office: Italy
Sector: Alternative Asset Management – Real Estate
Website: www.ideafimit.it
Investment details:
IDeA FIMIT SGR is the largest independent real estate asset management company in Italy,
with around EUR 9.0 billion in assets under management and 41 managed funds (including
five listed funds). This makes it a benchmark operator, on behalf of Italian and international
institutional investors, in the promotion, creation and management of mutual real estate
investment funds.
IDeA FIMIT SGR undertakes three main lines of business:
the development of mutual real estate investment funds designed for institutional
clients and private investors;
the promotion of innovative real estate financial instruments to satisfy investors’
increasing demands;
the professional management (technical, administrative and financial) of real estate
funds with the assistance of in-house experts and independent technical, legal and tax
advisors.
The company has concentrated investments in transactions with low risk, stable returns, low
volatility, simple financial structures and, most importantly, an emphasis on property value.
In particular, the asset management company specialises in "core" and "core plus" properties,
although its major investments also include "value added" transactions.
Due in part to successful transactions concluded in recent years, the asset management
company is able to rely on a panel of prominent unit-holders consisting of Italian and
international investors of high standing, such as pension funds, banking and insurance
groups, companies and sovereign funds.
The table below summarises the value of assets under management and management fees for
IDeA FIMIT SGR at 31 March 2017:
Some of the key financials of the listed funds in the asset management portfolio are provided
below, with an analysis of the real estate portfolio at the date of the latest report available,
(EUR million)
Asset Under
Management at
31 march 2017
Management
fees at 31
march 2017
Breakdown of funds
Atlantic 1 535 0.4
Atlantic 2 Berenice 155 0.2
Alpha 338 1.0
Beta 67 0.1
Delta 203 0.6
Listed funds 1,298 2.3
Reserved funds 7,685 7.8
Total IDeA FIMIT SGR 8,983 10.1
Interim Management Report
to 31 March 2017
34
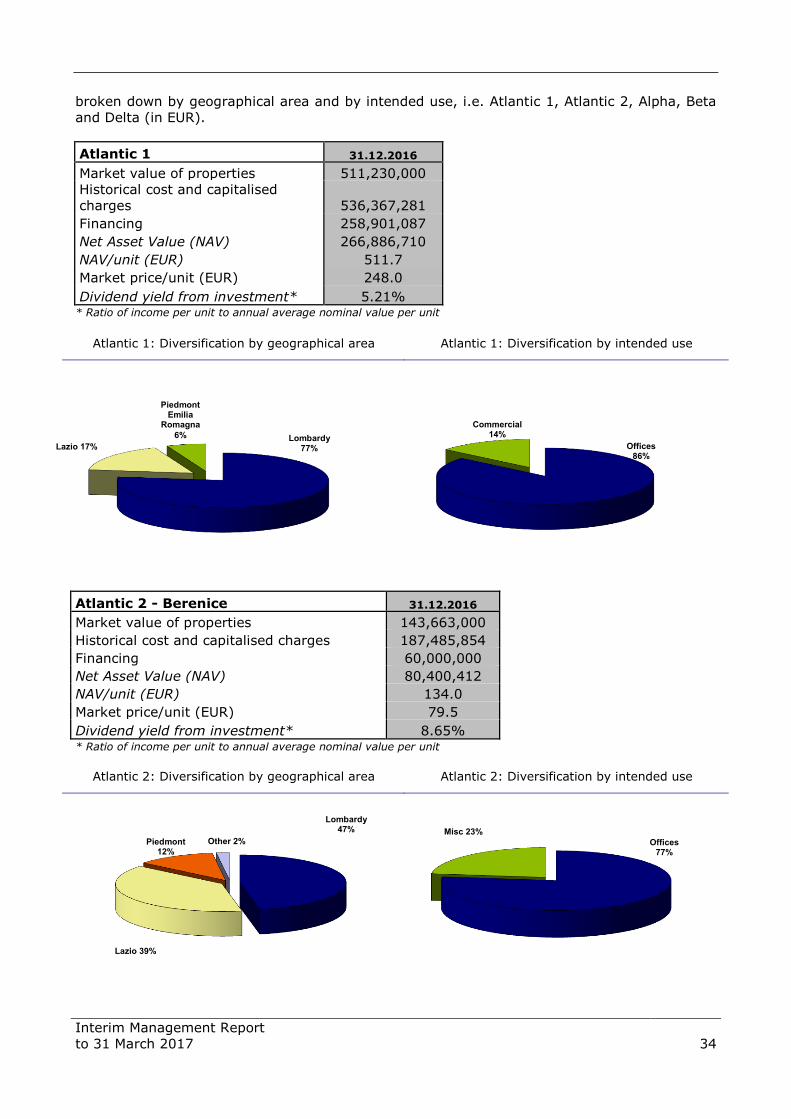
broken down by geographical area and by intended use, i.e. Atlantic 1, Atlantic 2, Alpha, Beta
and Delta (in EUR).
Atlantic 1 31.12.2016
Market value of properties 511,230,000
Historical cost and capitalised
charges 536,367,281
Financing 258,901,087
Net Asset Value (NAV) 266,886,710
NAV/unit (EUR) 511.7
Market price/unit (EUR) 248.0
Dividend yield from investment* 5.21% * Ratio of income per unit to annual average nominal value per unit
Atlantic 1: Diversification by geographical area Atlantic 1: Diversification by intended use
Atlantic 2 - Berenice 31.12.2016
Market value of properties 143,663,000
Historical cost and capitalised charges 187,485,854
Financing 60,000,000
Net Asset Value (NAV) 80,400,412
NAV/unit (EUR) 134.0
Market price/unit (EUR) 79.5
Dividend yield from investment* 8.65% * Ratio of income per unit to annual average nominal value per unit
Atlantic 2: Diversification by geographical area Atlantic 2: Diversification by intended use
Lombardy 77% Offices
86%
Commercial 14%
Lazio 17%
Piedmont Emilia
Romagna
6%
Lazio 39%
Piedmont 12%
Other 2% Misc 23%
Lombardy 47%
Offices 77%
Interim Management Report
to 31 March 2017
35
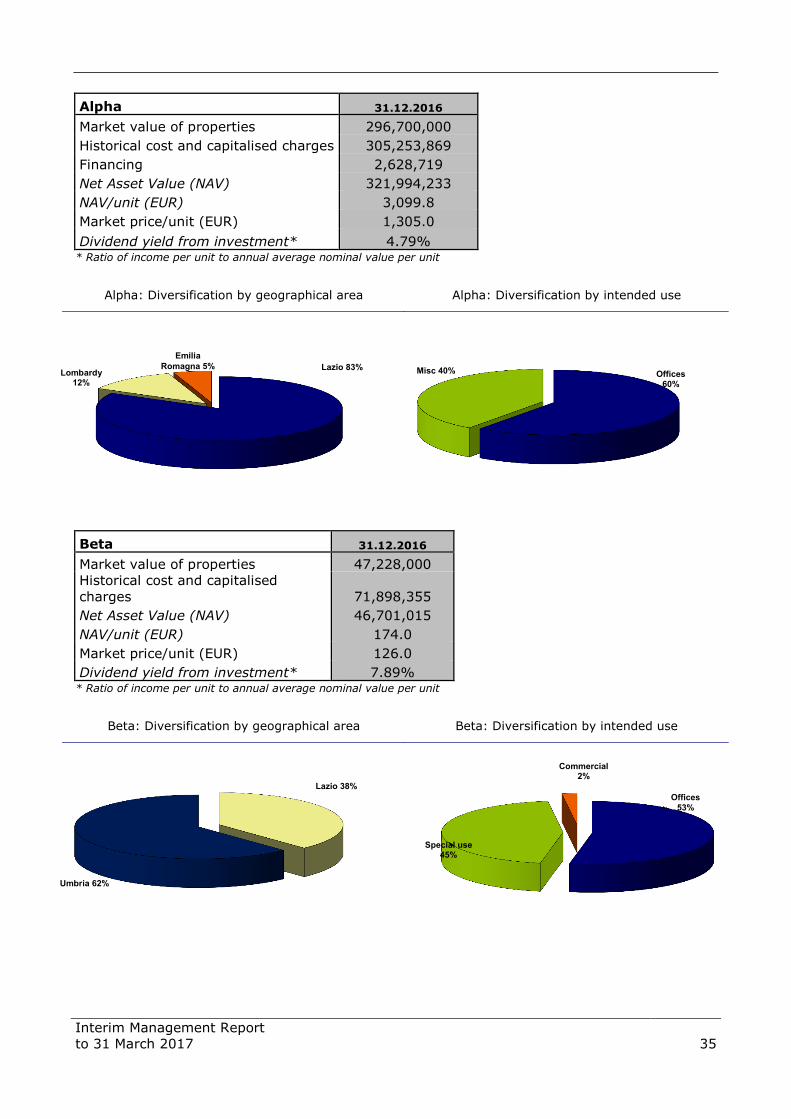
Alpha 31.12.2016
Market value of properties 296,700,000
Historical cost and capitalised charges 305,253,869
Financing 2,628,719
Net Asset Value (NAV) 321,994,233
NAV/unit (EUR) 3,099.8
Market price/unit (EUR) 1,305.0
Dividend yield from investment* 4.79% * Ratio of income per unit to annual average nominal value per unit
Alpha: Diversification by geographical area Alpha: Diversification by intended use
Beta 31.12.2016
Market value of properties 47,228,000
Historical cost and capitalised
charges 71,898,355
Net Asset Value (NAV) 46,701,015
NAV/unit (EUR) 174.0
Market price/unit (EUR) 126.0
Dividend yield from investment* 7.89% * Ratio of income per unit to annual average nominal value per unit
Beta: Diversification by geographical area Beta: Diversification by intended use
Offices 60%
Misc 40% Lazio 83%
Emilia
Romagna 5% Lombardy
12%
Umbria 62%
Lazio 38%
Special use 45%
Commercial 2%
Offices
53%

Interim Management Report
to 31 March 2017
36
Delta 31.12.2016
Market value of properties 193,092,000
Historical cost and capitalised charges 256,494,624
Net Asset Value (NAV) 195,551,846
NAV/unit (EUR) 92.9
Market price/unit (EUR) 64.3
Dividend yield from investment* n.a. * No distribution from investment
Delta: Diversification by geographical area Delta: Diversification by intended use
* * *
With regard to operating performance, the company posted a year-on-year increase of more
than EUR 1,000 million in assets under management at the end of the first quarter of 2017.
This was due in particular to the launch of the following funds: (i) Yielding (EUR 0.5 billion) and
Alveare (EUR 0.2 billion), which were completed in 2016, and (iii) Broggi (EUR 0.4 billion),
completed in 2017.
As regards management fees, the year-earlier period benefited from a one-off structuring fee
of EUR 0.4 million for the purchase of a building for BVK.
IDeA FIMIT SGR (EUR million) First Quarter 2017 First Quarter 2016
AUM 8,983 7,872
Management fees 10.1 10.5
EBITDA 3.5 4.2
Net profit 1.8 1.8
-of which:
- Shareolders 1.9 1.6
- Owner of financial equity instruments (0.1) 0.2
Lombardy 7%
Campania 6%
Piedmont 3%
Tuscany
3% Sardinia 14%
Veneto 21%
Calabria 16% Abruzzo 15%
Emilia Romagna 14%
Other 34%
Offices 4% Hotels
62%

Interim Management Report
to 31 March 2017
37
- SPC
Registered office: Italy
Sector: Debt recovery Website: www.spc-spa.com
Investment details:
SPC Credit Management has been operating for over 15 years in the restructuring, outsourced
management and enhancement of non-performing loans.
Over the years, the company has developed specific expertise, namely:
debt recovery actions in and out of court (with a strong performance in out-of-court
resolutions of non-performing loans);
advisory services via the valuation and clustering of credit portfolios and the
identification of strategic solutions to value these;
due diligence and asset quality reviews of NPL portfolio acquisitions.
With specific regard to debt recovery, the company has acquired the expertise to monitor the
entire range of non-performing loans, namely:
banking (current accounts; mortgages, personal loans);
leasing (terminated or active agreements; remaining leased properties post-sale of non-
performing portfolio);
consumer (consumer credit, salary-backed loans, credit cards);
commercial (outstanding invoices);
with a focus on secured loans.
The holding in SPC, which was fully consolidated by the DeA Capital Group from July 2016,
increased the Group's net profit by EUR 0.1 million in the first quarter of 2017.
SPC (EUR million) First Quarter 2017
Revenues 471
EBITDA 0.2
Net profit 0.1
Interim Management Report
to 31 March 2017
38
- Innovation Real Estate
Registered office: Italy
Sector: Property Services Website: www.innovationre.it
Investment details:
Innovation Real Estate (IRE) operates in property valuation and is structured along the
following strategic lines:
project & construction management (property planning, development and
refurbishment);
property management (administrative and legal management of properties);
facility & building management (services connected with buildings and related
maintenance);
due diligence (technical and environmental due diligence, town-planning
regularisation procedures);
asset management (strategic support for improving the rental condition of buildings
and optimising associated management costs, in order to maximise the return on
property investment).
IRE currently manages a property portfolio comprising 50% offices, with the remainder split
between commercial, tourist, logistics & industrial, and residential property.
The investment in IRE (45%), which is classified under "Investments in associates", was
recorded at a value of EUR 5.4 million in the Consolidated Financial Statements to 31 March
2017.
Turning to management performance, the company was affected in the first quarter of 2017 by
the completion of some project management tasks during 2016 (revenue was EUR 1.4 million
lower, EUR -0.9 million of which was due to one-off income reflected in the 2016 figure.
Innovation Real Estate (EUR million) First Quarter 2017 First Quarter 2016
Revenues 2.5 4.2
EBITDA 0.1 1.6
Net profit 0.0 1.1

Interim Management Report
to 31 March 2017
39
Consolidated Income Statement
In the first quarter of 2017, consolidated net profit was around EUR 8.3 million (of which EUR
6.8 million related to the Group), compared with a loss of around EUR 1.0 million (of which
EUR +0.3 million related to the Group) in the same period in 2016.
Revenues and other income break down as follows:
- Alternative Asset Management fees of EUR 13.9 million (EUR 14.1 million in the same
period of 2016);
- income from investments valued at equity of EUR 5.2 million, linked to the performance
of the EESS fund;
- other investment income, net of expenses, totalling EUR 2.0 million (net investment
expenses of EUR 2.6 million in the same period of 2016);
- service revenues of EUR 0.3 million (EUR 4.4 million recorded in 2016), lower due to
the deconsolidation of IRE from June 2016.
In the first quarter of 2017, costs totalled EUR 12.8 million, compared with EUR 15.7 million in
the same period of 2016.
The quarter's costs break down into EUR 11.0 million relating to Alternative Asset
Management, EUR 0.5 million to Private Equity Investment and EUR 1.3 million to holding
company activities. Alternative Asset Management costs include the effects of the amortisation
of intangible assets, totalling EUR 0.3 million, recorded when a portion of the purchase price of
the investments was allocated.
Net financial income, which totalled EUR 0.2 million at 31 March 2017 (EUR -0.8 million in the
year-earlier period), mainly comprised interest income.
The total tax impact for the first quarter of 2017 (EUR -0.5 million, in line with the figure for
the year-earlier period) is the result of taxes of EUR 1.0 million due in respect of Alternative
Asset Management activities (EUR 1.9 million due in the first quarter of 2016) and tax credits
of EUR +0.5 million relating to holding company activities (EUR +1.3 million in the first quarter
of 2016).
Of the consolidated net profit of EUR 8.3 million, EUR +6.9 million was attributable to Private
Equity Investment, EUR +2.6 million to Alternative Asset Management and EUR -1.2 million to
holding company operations/eliminations.
Of the Group’s net profit of EUR 6.8 million, EUR +6.0 million was attributable to Private Equity
Investment, EUR +2.0 million to Alternative Asset Management and EUR -1.2 million to holding
company operations/eliminations.

Interim Management Report
to 31 March 2017
40
Summary Consolidated Income Statement
Performance by business in 2017
Performance by business in 2016
(EUR thousand)
First
Quarter
2017
First
Quarter
2016
Alternative Asset Management fees 13,856 14,132
Income (loss) from equity investments 5,187 0
Other investment income/expense 2,049 (2,584)
Income from services 321 4,446
Other income 54 53
Other expenses (*) (12,824) (15,713)
Financial income and expenses 193 (811)
PROFIT/(LOSS) BEFORE TAX 8,836 (477)
Income tax (505) (529)
PROFIT/(LOSS) FOR THE PERIOD FROM CONTINUING OPERATIONS 8,331 (1,006)
Profit (Loss) from discontinued operations/held-for-sale assets 0 0
PROFIT/(LOSS) FOR THE PERIOD 8,331 (1,006)
- Group share 6,754 260
- Non controlling interests 1,577 (1,266)
Earnings per share, basic (€) 0.026 0.001
Earnings per share, diluted (€) 0.026 0.001
(*) Includes items "personnel costs", "service costs", "depreciation, amortization and impairment" and "other expenses"
(EUR thousand)
Private Equity
Investment
Alternative
Asset
Management
Holdings/
Eliminations Consolidated
Alternative Asset Management fees 0 14,319 (463) 13,856
Income (loss) from equity investments 5,134 53 0 5,187
Other investment income/expense 2,090 (41) 0 2,049
Income from services 0 228 147 375
Other expenses (479) (10,997) (1,348) (12,824)
Financial income and expenses 156 0 37 193
PROFIT/(LOSS) BEFORE TAXES 6,901 3,562 (1,627) 8,836
Income tax 0 (968) 463 (505)
PROFIT/(LOSS) FOR THE PERIOD FROM CONTINUING OPERATIONS 6,901 2,594 (1,164) 8,331
Profit (Loss) from discontinued operations/held-for-sale assets 0 0 0 0
PROFIT/(LOSS) FOR THE PERIOD 6,901 2,594 (1,164) 8,331
- Group share 5,955 1,963 (1,164) 6,754
- Non controlling interests 946 631 0 1,577
(EUR thousand)
Private Equity
Investment
Alternative
Asset
Management
Holdings/
Eliminations Consolidated
Alternative Asset Management fees 0 14,629 (497) 14,132
Income (loss) from equity investments 0 0 0 0
Other investment income/expense (2,402) (182) 0 (2,584)
Income from services 0 4,394 105 4,499
Other expenses (556) (13,758) (1,399) (15,713)
Financial income and expenses (863) 37 15 (811)
PROFIT/(LOSS) BEFORE TAXES (3,821) 5,120 (1,776) (477)
Income tax 0 (1,852) 1,323 (529)
PROFIT/(LOSS) FOR THE PERIOD FROM CONTINUING OPERATIONS (3,821) 3,268 (453) (1,006)
Profit (Loss) from discontinued operations/held-for-sale assets 0 0 0 0
PROFIT/(LOSS) FOR THE PERIOD (3,821) 3,268 (453) (1,006)
- Group share (1,854) 2,567 (453) 260
- Non controlling interests (1,967) 701 0 (1,266)
Interim Management Report
to 31 March 2017
41
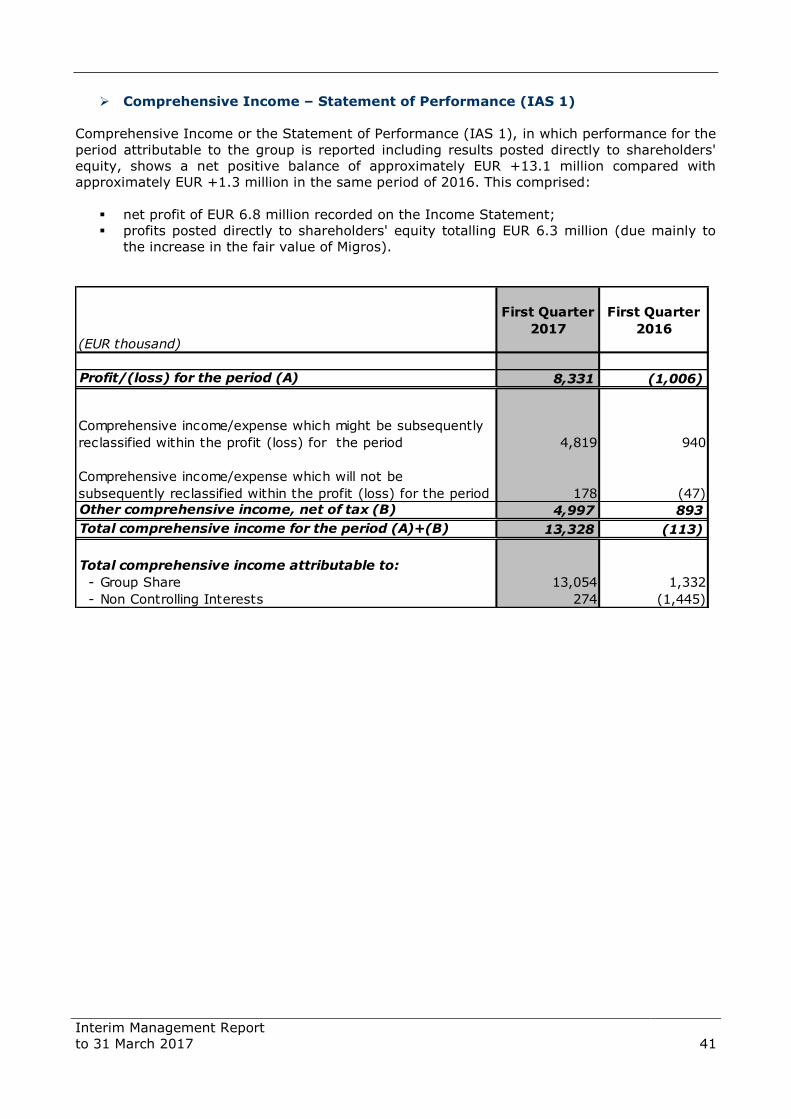
Comprehensive Income – Statement of Performance (IAS 1)
Comprehensive Income or the Statement of Performance (IAS 1), in which performance for the
period attributable to the group is reported including results posted directly to shareholders'
equity, shows a net positive balance of approximately EUR +13.1 million compared with
approximately EUR +1.3 million in the same period of 2016. This comprised:
net profit of EUR 6.8 million recorded on the Income Statement;
profits posted directly to shareholders' equity totalling EUR 6.3 million (due mainly to
the increase in the fair value of Migros).
(EUR thousand)
First Quarter
2017
First Quarter
2016
Profit/(loss) for the period (A) 8,331 (1,006)
Comprehensive income/expense which might be subsequently
reclassified within the profit (loss) for the period 4,819 940
Comprehensive income/expense which will not be
subsequently reclassified within the profit (loss) for the period 178 (47)
Other comprehensive income, net of tax (B) 4,997 893
Total comprehensive income for the period (A)+(B) 13,328 (113)
Total comprehensive income attributable to:
- Group Share 13,054 1,332
- Non Controlling Interests 274 (1,445)
Interim Management Report
to 31 March 2017
42
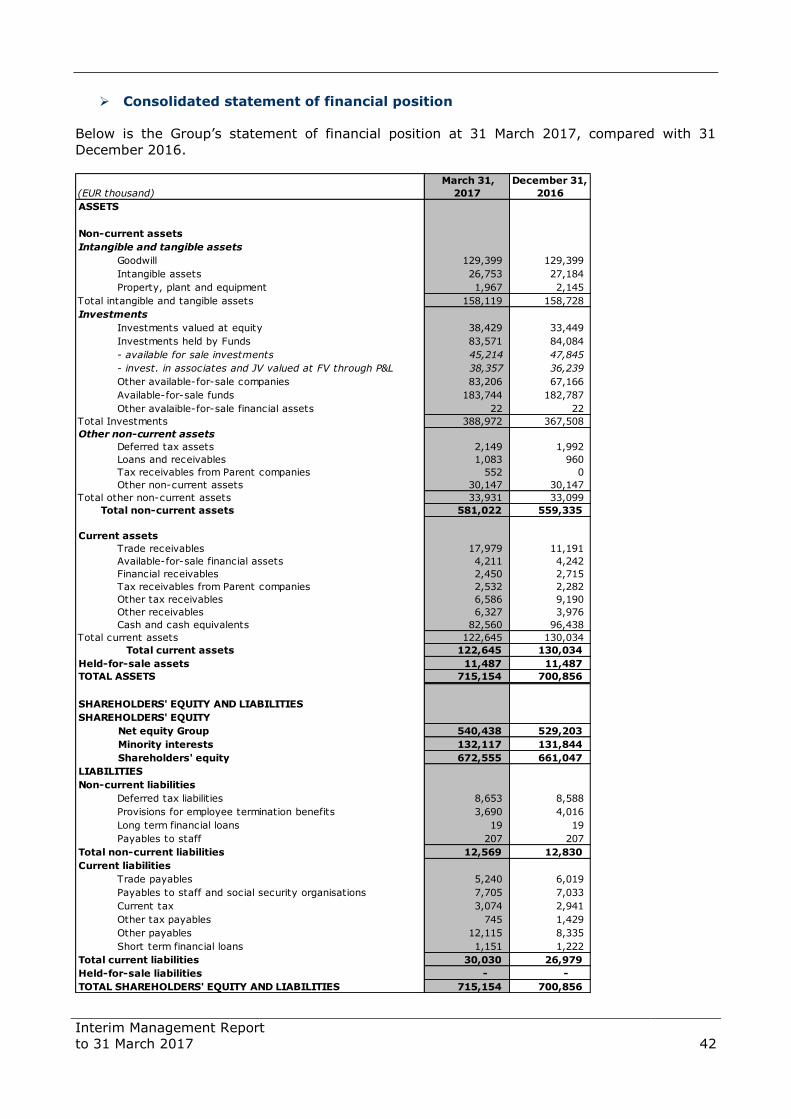
Consolidated statement of financial position
Below is the Group’s statement of financial position at 31 March 2017, compared with 31
December 2016.
(EUR thousand)
March 31,
2017
December 31,
2016
ASSETS
Non-current assets
Intangible and tangible assets
Goodwill 129,399 129,399
Intangible assets 26,753 27,184
Property, plant and equipment 1,967 2,145
Total intangible and tangible assets 158,119 158,728
Investments
Investments valued at equity 38,429 33,449
Investments held by Funds 83,571 84,084
- available for sale investments 45,214 47,845
- invest. in associates and JV valued at FV through P&L 38,357 36,239
Other available-for-sale companies 83,206 67,166
Available-for-sale funds 183,744 182,787
Other avalaible-for-sale financial assets 22 22
Total Investments 388,972 367,508
Other non-current assets
Deferred tax assets 2,149 1,992
Loans and receivables 1,083 960
Tax receivables from Parent companies 552 0
Other non-current assets 30,147 30,147
Total other non-current assets 33,931 33,099
Total non-current assets 581,022 559,335
Current assets
Trade receivables 17,979 11,191
Available-for-sale financial assets 4,211 4,242
Financial receivables 2,450 2,715
Tax receivables from Parent companies 2,532 2,282
Other tax receivables 6,586 9,190
Other receivables 6,327 3,976
Cash and cash equivalents 82,560 96,438
Total current assets 122,645 130,034
Total current assets 122,645 130,034
Held-for-sale assets 11,487 11,487
TOTAL ASSETS 715,154 700,856
SHAREHOLDERS' EQUITY AND LIABILITIES
SHAREHOLDERS' EQUITY
Net equity Group 540,438 529,203
Minority interests 132,117 131,844
Shareholders' equity 672,555 661,047
LIABILITIES
Non-current liabilities
Deferred tax liabilities 8,653 8,588
Provisions for employee termination benefits 3,690 4,016
Long term financial loans 19 19
Payables to staff 207 207
Total non-current liabilities 12,569 12,830
Current liabilities
Trade payables 5,240 6,019
Payables to staff and social security organisations 7,705 7,033
Current tax 3,074 2,941
Other tax payables 745 1,429
Other payables 12,115 8,335
Short term financial loans 1,151 1,222
Total current liabilities 30,030 26,979
Held-for-sale liabilities - -
TOTAL SHAREHOLDERS' EQUITY AND LIABILITIES 715,154 700,856

Interim Management Report
to 31 March 2017
43
At 31 March 2017, Group shareholders’ equity was EUR 540.4 million, compared with EUR
529.2 million at 31 December 2016. The increase of around EUR 11.2 million in this item in the
first quarter of 2017 was due to the reasons set out in the Statement of Performance – IAS 1
(EUR 13.1 million).
Consolidated net financial position
At 31 March 2017, the consolidated net financial position was EUR 89.1 million, as shown in
the table below, which provides a comparison with 31 December 2016:
The change in the consolidated net financial position in the first quarter of 2017 (EUR -14.0
million) was mainly due to net investments made in private equity (EUR -9.9 million).
The Company believes that the cash and cash equivalents and the other financial resources
available are sufficient to meet the requirement relating to payment commitments already
subscribed to in funds, also taking into account the amounts expected to be called
up/distributed by these funds. With regard to these residual commitments, the Company
believes that the resources currently available, as well as those that will be generated by its
operating and financing activities, will enable the DeA Capital Group to meet the financing
required for its investment activity and to manage working capital.
Net financial position (EUR million)
Cash and cash equivalents 82.6 96.4 (13.8)
Available-for-sale financial assets 4.2 4.2 0.0
Financial receivables 3.5 3.7 (0.2)
Non-current financial liabilities 0.0 0.0 0.0
Current financial liabilities (1.2) (1.2) 0.0
TOTAL 89.1 103.1 (14.0)
of which:
- Alternative Asset Management 22.9 23.3 (0.4)
- Private Equity Investment 0.1 0.1 0.0
- Holdings 66.1 79.7 (13.6)
31.3.2017 31.12.2016 Change

Interim Management Report
to 31 March 2017
44
6. Other information
Transactions with parent companies, subsidiaries and related parties
Transactions with related parties, including intercompany transactions, are typical, usual
transactions that are part of the normal business activities of Group companies. Such
transactions are concluded at standard market terms for the nature of the goods and/or
services offered.
Other information
At 31 March 2017, the Group had 193 employees (186 at the end of 2016), including 34 senior
managers, 60 middle managers and 99 clerical staff. Of these, 178 worked in Alternative Asset
Management and 15 in Private Equity Investment/the Holding Company. These staff levels do
not include personnel on secondment from the Parent Company De Agostini S.p.A.
With regard to the regulatory requirements set out in art. 36 of the Market Regulation on
conditions for the listing of parent companies of companies formed or regulated by laws of
non-EU countries and of major importance in the consolidated financial statements, it is hereby
noted that no Group company falls within the scope of the above-mentioned provision.
Furthermore, conditions prohibiting listing pursuant to art. 37 of the Market Regulation relating
to companies subject to the management and coordination of other parties do not apply.
Interim Management Report
to 31 March 2017
45
Consolidated Financial Statements and Notes to the Accounts for the period 1 January – 31 March 2017

Interim Management Report
to 31 March 2017
46
Consolidated Statement of Financial Position
Pursuant to Consob Resolution 15519 of 27 July 2006, the impact of dealings with related parties on the Statement of Financial Position, Income Statement and Cash Flow Statement is explained in the Notes to the Financial Statements.
(EUR thousand)
March 31,
2017
December 31,
2016
ASSETS
Non-current assets
Intangible and tangible assets
Goodwill 129,399 129,399
Intangible assets 26,753 27,184
Property, plant and equipment 1,967 2,145
Total intangible and tangible assets 158,119 158,728
Investments
Investments valued at equity 38,429 33,449
Investments held by Funds 83,571 84,084
- available for sale investments 45,214 47,845
- invest. in associates and JV valued at FV through P&L 38,357 36,239
Other available-for-sale companies 83,206 67,166
Available-for-sale funds 183,744 182,787
Other avalaible-for-sale financial assets 22 22
Total Investments 388,972 367,508
Other non-current assets
Deferred tax assets 2,149 1,992
Loans and receivables 1,083 960
Tax receivables from Parent companies 552 0
Other non-current assets 30,147 30,147
Total other non-current assets 33,931 33,099
Total non-current assets 581,022 559,335
Current assets
Trade receivables 17,979 11,191
Available-for-sale financial assets 4,211 4,242
Financial receivables 2,450 2,715
Tax receivables from Parent companies 2,532 2,282
Other tax receivables 6,586 9,190
Other receivables 6,327 3,976
Cash and cash equivalents 82,560 96,438
Total current assets 122,645 130,034
Total current assets 122,645 130,034
Held-for-sale assets 11,487 11,487
TOTAL ASSETS 715,154 700,856
SHAREHOLDERS' EQUITY AND LIABILITIES
SHAREHOLDERS' EQUITY
Net equity Group 540,438 529,203
Minority interests 132,117 131,844
Shareholders' equity 672,555 661,047
LIABILITIES
Non-current liabilities
Deferred tax liabilities 8,653 8,588
Provisions for employee termination benefits 3,690 4,016
Long term financial loans 19 19
Payables to staff 207 207
Total non-current liabilities 12,569 12,830
Current liabilities
Trade payables 5,240 6,019
Payables to staff and social security organisations 7,705 7,033
Current tax 3,074 2,941
Other tax payables 745 1,429
Other payables 12,115 8,335
Short term financial loans 1,151 1,222
Total current liabilities 30,030 26,979
Held-for-sale liabilities - -
TOTAL SHAREHOLDERS' EQUITY AND LIABILITIES 715,154 700,856

Interim Management Report
to 31 March 2017
47
Consolidated Income Statement
Pursuant to Consob Resolution 15519 of 27 July 2006, the impact of dealings with related parties on the Statement of
Financial Position, Income Statement and Cash Flow Statement is explained in the Notes to the Financial Statements.
(EUR thousand)
First
Quarter
2017
First
Quarter
2016
Alternative Asset Management fees 13,856 14,132
Income from equity investments 5,187 0
Other investment income/expense 2,049 (2,584)
Income from services 321 4,446
Other income 54 53
Personnel costs (7,419) (7,702)
Service costs (4,145) (5,815)
Depreciation, amortization and impairment (653) (1,557)
Other expenses (607) (639)
Financial income 211 242
Financial expenses (18) (1,053)
PROFIT/(LOSS) BEFORE TAX 8,836 (477)
Income tax (505) (529)
PROFIT/(LOSS) FOR THE PERIOD FROM CONTINUING OPERATIONS 8,331 (1,006)
Profit (Loss) from discontinued operations/held-for-sale assets 0 0
PROFIT/(LOSS) FOR THE PERIOD 8,331 (1,006)
- Group share 6,754 260
- Non controlling interests 1,577 (1,266)
Earnings per share, basic (€) 0.026 0.001
Earnings per share, diluted (€) 0.026 0.001

Interim Management Report
to 31 March 2017
48
Consolidated Statement of Comprehensive Income (Statement of Performance -
IAS 1)
(Euro thousands)
First Quarter
2017
First Quarter
2016
Profit/(loss) for the period (A) 8,331 (1,006)
Comprehensive income/expense which might be subsequently
reclassified within the profit (loss) for the period 4,819 940
Gains/(Losses) on fair value of available-for-sale financial
assets 4,819 940
Share of other comprehensive income of associates 0 0
Comprehensive income/expense which will not be
subsequently reclassified within the profit (loss) for the period 178 (47)
Gains/(losses) on remeasurement of defined benefit plans 178 (47)
Other comprehensive income, net of tax (B) 4,997 893
Total comprehensive income for the period (A)+(B) 13,328 (113)
Total comprehensive income attributable to:
- Group Share 13,054 1,332
- Non Controlling Interests 274 (1,445)

Interim Management Report
to 31 March 2017
49
Consolidated Cash Flow Statement - Direct Method
Pursuant to Consob Resolution 15519 of 27 July 2006, the impact of dealings with related parties on the Statement of Financial Position, Income Statement and Cash Flow Statement is explained in the Notes to the Financial Statements.
(EUR thousand) First Quarter 2017 First Quarter 2016
CASH FLOW from operating activities
Investments in funds and shareholdings (10,014) (2,235)
Capital reimbursements from funds 292 4,722
Proceeds from the sale of investments 88 3,438
Interest received 45 130
Interest paid (9) (4)
Cash distribution from investments 142 49
Realized gains (losses) on exchange rate derivatives 0 (1)
Taxes paid (63) (25)
Dividends received 0 0
Management and performance fees received 8,325 12,767
Revenues for services 292 3,029
Operating expenses (10,942) (14,728)
Net cash flow from operating activities (11,844) 7,142
CASH FLOW from investment activities
Acquisition of property, plant and equipment (12) (23)
Sale of property, plant and equipment 1 0
Purchase of licenses (6) (208)
Net cash flow from investing activities (17) (231)
CASH FLOW from investing activities
Acquisition of financial assets 0 0
Sale of financial assets 0 1
Share capital issued 0 1,550
Own shares acquired (2,092) (1,031)
Dividends paid 0 (4,592)
Loan 75 134
Quasi-equity loan 0 0
Bank loan paid back 0 0
Net cash flow from financing activities (2,017) (3,938)
CHANGE IN CASH AND CASH EQUIVALENTS (13,878) 2,973
CASH AND CASH EQUIVALENTS AT BEGINNING OF PERIOD 96,438 123,468
Cash and cash equivalents relating to held-for-sale assets 0 0
Cash and cash equivalents at beginning of period 96,438 123,468
Effect of change in basis of consolidation: cash and cash equivalents 0 (97)
CASH AND CASH EQUIVALENTS AT END OF PERIOD 82,560 126,441
Held-for-sale assets and minority interests 0 0
CASH AND CASH EQUIVALENTS AT END OF PERIOD 82,560 126,441

Interim Management Report
to 31 March 2017
50
Consolidated Statement of Changes in Shareholders’ Equity
Pursuant to Consob Resolution 15519 of 27 July 2006, the impact of dealings with related parties on the Statement of Financial Position, Income Statement and Cash Flow Statement is explained in the Notes to the Financial Statements.
(EUR thousand)Share
Capital
Treasury share
reserve, capital
reserve,
retained
earnings
Fair value
ReserveTotal Group
Non controlling
interests
Consolidated net
equity
Total at 31 December 2015 263,923 220,887 62,178 546,988 138,172 685,160
Cost of stock options 0 104 0 104 0 104
Purchase of own shares (799) (232) 0 (1,031) 0 (1,031)
Other changes 0 16 0 16 (3,107) (3,091)
Total comprehensive income 0 260 1,072 1,332 (1,445) (113)
Total at 31 March 2016 263,124 221,035 63,250 547,409 133,620 681,029
(EUR thousand)Share
Capital
Treasury share
reserve, capital
reserve,
retained
earnings
Fair value
ReserveTotal Group
Non controlling
interests
Consolidated net
equity
Total at 31 December 2016 261,207 200,154 67,842 529,203 131,844 661,047
Cost of stock options 0 224 0 224 0 224
Purchase of own shares (1,524) (567) 0 (2,091) 0 (2,091)
Other changes 0 48 0 48 (1) 47
Total comprehensive income 0 6,754 6,300 13,054 274 13,328
Total at 31 March 2017 259,683 206,613 74,142 540,438 132,117 672,555
Interim Management Report
to 31 March 2017
51
Structure and content of the Consolidated Interim Financial Statements to 31 March
2017
The Consolidated Interim Financial Statements to 31 March 2017 (hereinafter the
“Consolidated Financial Statements”) comprise the document stipulated by art. 2.2.3 of the
Stock Market Regulations (FTSE Italia STAR segment). Information regarding the Company’s
operating performance and financial position is prepared in accordance with the valuation and
measurement criteria set out by the International Financial Reporting Standards (IFRS), issued
by the International Accounting Standards Board (IASB) and adopted by the European
Commission pursuant to the procedures set out at art. 6 of Regulation (EC) no. 1606/2002 of
the European Parliament and Council of 19 July 2002. The accounting standards used in the
Consolidated Financial Statements do not differ significantly from those used in the Financial
Statements for the Year Ending 31 December 2016.
The Consolidated Financial Statements comprise the following: the Statement of Financial
Position, the Income Statement, the Cash Flow Statement, the Statement of Changes in
Shareholders' Equity and the Statement of Comprehensive Income (IAS 1) – and these Notes
to the Accounts; they are also accompanied by the Interim Report on Operations and the
Statement of Responsibilities for the Interim Management Report.
The Consolidated Financial Statement have not been audited by the Independent Auditors.
Financial information is discussed with reference to the first quarter of 2017 and the same
period of 2016; information on the Statement of Financial Position relates to 31 March 2017
and 31 December 2016. The consolidated statements are provided in the same format as
those relating to 31 December 2016.
As allowed by IAS/IFRS, the preparation of the Consolidated Financial Statements required the
use of significant estimates by the Company's management, especially with regard to the
valuations of the investment portfolio (equity investments and funds). These valuations were
calculated by directors based on their best judgement and estimation using the knowledge and
evidence available at the time the Consolidated Financial Statements were prepared. However,
due to objective difficulties in making assessments and the lack of a liquid market, the values
assigned to such assets could differ, perhaps and in some cases significantly, from those that
could be obtained when the assets are sold.
In accordance with the provisions of IAS/IFRS and current laws, the Company authorised the
publication of the Interim Management Report by the legal deadline.
Scope of consolidation
At 31 March 2017, the following companies formed part of the DeA Capital Group's scope of
consolidation:
Company Registered office Currency Share capital % holding Consolidation method
DeA Capital S.p.A. Milan, Italy Euro 306,612,100 Holding
IDeA Capital Funds SGR S.p.A. Milan, Italy Euro 1,200,000 100.00% Full consolidation
IDeA OF I Milan, Italy Euro - 46.99% Full consolidation
DeA Capital Real Estate S.p.A. Milan, Italy Euro 600,000 100.00% Full consolidation
IDeA FIMIT SGR S.p.A. Rome, Italy Euro 16,757,557 64.30% Full consolidation
Idea Real Estate S.p.A. Milan, Italy Euro 50,000 100.00% Full consolidation
SPC S.p.A. Milan, Italy Euro 104,147 68.69% Full consolidation
Innovation Real Estate S.p.A. Milan, Italy Euro 597,725 45.00% Equity accounted
(Associate)Innovation Real Estate Advisory S.r.l. Milan, Italy Euro 105,000 45.00% Equity accounted
(Associate)IDeA Efficienza Energetica e Sviluppo
Sostenibile
Milan, Italy Euro - 30.40% Equity accounted
(Associate)Venere Rome, Italy Euro - 27.27% Equity accounted
(Associate)
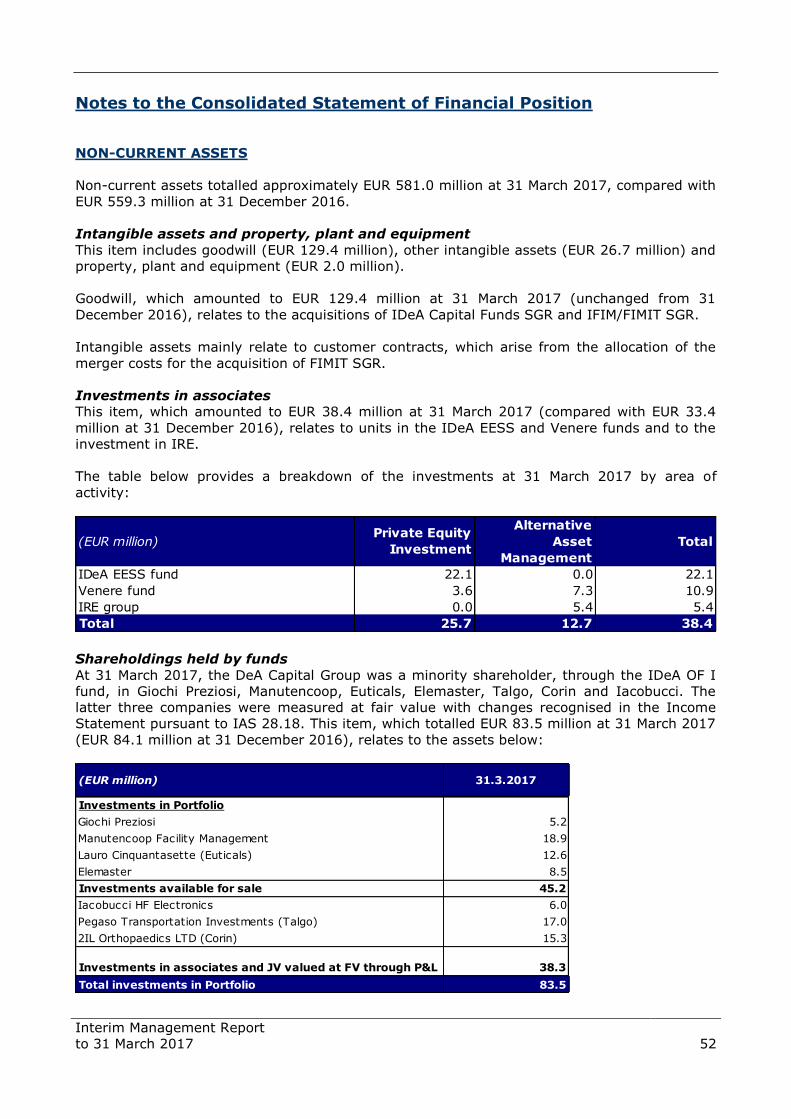
Interim Management Report
to 31 March 2017
52
Notes to the Consolidated Statement of Financial Position
NON-CURRENT ASSETS
Non-current assets totalled approximately EUR 581.0 million at 31 March 2017, compared with
EUR 559.3 million at 31 December 2016.
Intangible assets and property, plant and equipment
This item includes goodwill (EUR 129.4 million), other intangible assets (EUR 26.7 million) and
property, plant and equipment (EUR 2.0 million).
Goodwill, which amounted to EUR 129.4 million at 31 March 2017 (unchanged from 31
December 2016), relates to the acquisitions of IDeA Capital Funds SGR and IFIM/FIMIT SGR.
Intangible assets mainly relate to customer contracts, which arise from the allocation of the
merger costs for the acquisition of FIMIT SGR.
Investments in associates
This item, which amounted to EUR 38.4 million at 31 March 2017 (compared with EUR 33.4
million at 31 December 2016), relates to units in the IDeA EESS and Venere funds and to the
investment in IRE.
The table below provides a breakdown of the investments at 31 March 2017 by area of
activity:
Shareholdings held by funds
At 31 March 2017, the DeA Capital Group was a minority shareholder, through the IDeA OF I
fund, in Giochi Preziosi, Manutencoop, Euticals, Elemaster, Talgo, Corin and Iacobucci. The
latter three companies were measured at fair value with changes recognised in the Income
Statement pursuant to IAS 28.18. This item, which totalled EUR 83.5 million at 31 March 2017
(EUR 84.1 million at 31 December 2016), relates to the assets below:
(EUR million)Private Equity
Investment
Alternative
Asset
Management
Total
IDeA EESS fund 22.1 0.0 22.1
Venere fund 3.6 7.3 10.9
IRE group 0.0 5.4 5.4
Total 25.7 12.7 38.4
(EUR million) 31.3.2017
Investments in Portfolio
Giochi Preziosi 5.2
Manutencoop Facility Management 18.9
Lauro Cinquantasette (Euticals) 12.6
Elemaster 8.5
Investments available for sale 45.2
Iacobucci HF Electronics 6.0
Pegaso Transportation Investments (Talgo) 17.0
2IL Orthopaedics LTD (Corin) 15.3
Investments in associates and JV valued at FV through P&L 38.3
Total investments in Portfolio 83.5

Interim Management Report
to 31 March 2017
53
Available-for-sale investments in other companies
At 31 March 2017, the DeA Capital Group was a shareholder in Kenan Investments (indirect
parent company of Migros), Crescita and Harvip.
The stake in Kenan Investments is recorded in the Consolidated Financial Statements to 31
March 2017 at EUR 74.9 million (compared with EUR 66.9 million at 31 December 2016). This
amount (indirectly corresponding to approximately 6.9% of Migros' capital, i.e. 40.25% of
Migros' capital via the Group's investment in Kenan Investments) reflects a price per share of
Migros of:
- TRY 26.00 (plus interest of 7.5% per annum from 30 April 2015) for the stake subject
to put/call options agreed with Anadolu on 9.75% of Migros and exercisable from 30
April 2017;
- TRY 22.16, being the market price on 31 March 2017 for the remaining stake (30.5% of
Migros' capital).
The increase in the value of the stake in Kenan Investments at 31 March 2017 compared with
31 December 2016 is attributable to the combined effect of the rise in the share price (TRY
22.16 per share at 31 March 2017 compared with TRY 17.58 per share at 31 December 2016)
and the depreciation of the Turkish lira against the euro (3.89 TRY/EUR at 31 March 2017
versus 3.72 TRY/EUR at 31 December 2016).
The table below provides details of equity investments in other companies at 31 March 2017
by area of activity.
Available-for-sale funds
This item relates to investments in units of three funds of funds (IDeA I FoF, ICF II and ICF
III), two theme funds (IDeA ToI and IDeA CCR I), six venture capital funds and 12 real estate
funds, totalling approximately EUR 183.7 million in the consolidated accounts to 31 March
2017, compared with EUR 182.8 million at the end of 2016.
The table below provides a breakdown of the funds in the portfolio at 31 March 2017 by area
of activity.
(EUR million)Private Equity
Investment
Alternative
Asset
Management
Total
Kenan Investments 74.9 0.0 74.9
Crescita 8.1 0.0 8.1
Minority interests 0.2 0.0 0.2
Total 83.2 0.0 83.2
(EUR thousand)Balance at
1.1.2017
Increases
(Capital call)
Decreases
(Capital
distribution)
Impairment Fair value
adjustment
Translation
effect
Change in
consolidation
area
ReclassBalance at
31.3.2017
Venture capital funds 9,488 0 0 (30) 191 (24) 0 0 9,625
IDeA I FoF 69,015 0 0 0 (485) 0 0 0 68,530
ICF II 47,000 0 0 0 (529) 0 0 0 46,471
ICF III Core 520 56 0 0 (13) 0 0 0 563
ICF III Credit & Distressed 2,897 0 0 0 (51) 0 0 0 2,846
ICF III Emerging Markets 3,489 0 0 0 (33) 0 0 0 3,456
IDeA ToI 5,196 2,149 0 0 (130) 0 0 0 7,215
IDeA CCR I CD 75 0 0 0 0 0 0 0 75
IDeA CCR I NF 0 31 0 0 0 0 0 0 31
Santa Palomba 402 0 0 0 0 0 0 0 402
IDeA FIMIT SGR Funds 44,705 0 (34) (184) 43 0 0 0 44,530
Total funds 182,787 2,236 (34) (214) (1,007) (24) 0 0 183,744

Interim Management Report
to 31 March 2017
54
Deferred tax assets
The balance on the item “deferred tax assets” comprises the value of deferred tax assets
minus deferred tax liabilities, where they may be offset. At 31 March 2017, deferred tax assets
totalled EUR 2.1 million, compared with EUR 2.0 million at 31 December 2016.
Other non-current assets
This item, valued at EUR 30.1 million at 31 March 2017 (unchanged from 31 December 2016),
relates mainly to the receivable from the IDeA OF I fund for the sale of 1% of Manutencoop
and the receivable from the Beta property fund corresponding to the portion of the
overperformance fee that has accrued since the fund was launched and which IDeA FIMIT SGR
expects to receive when the fund is liquidated.
(EUR million)Private Equity
Investment
Alternative
Asset
Management
Total
Venture capital funds 9.6 0.0 9.6
IDeA I FoF 68.5 0.0 68.5
ICF II 46.5 0.0 46.5
ICF III 6.9 0.0 6.9
IDeA ToI 7.2 0.0 7.2
IDeA CCR I 0.1 0.0 0.1
Santa Palomba 0.4 0.0 0.4
IDeA FIMIT SGR Funds 0.0 44.5 44.5
Total funds 139.2 44.5 183.7

Interim Management Report
to 31 March 2017
55
CURRENT ASSETS
At 31 March 2017, current assets totalled EUR 122.6 million, versus EUR 130.0 million at 31
December 2016. The item mainly comprised:
- EUR 82.6 million relating to cash and cash equivalents (EUR 96.4 million at 31
December 2016);
- EUR 18.0 million relating to commercial loans (EUR 11.2 million at 31 December
2016);
- EUR 4.2 million relating to investments to be considered as a temporary use of cash
(unchanged compared with 31 December 2016);
- EUR 2.5 million relating to financial receivables in connection with the loan
agreement for Sigla (EUR 2.7 million at 31 December 2016).
SHAREHOLDERS' EQUITY
At 31 March 2017, Group shareholders’ equity was EUR 540.4 million, compared with EUR
529.2 million at 31 December 2016. The increase of around EUR 11.2 million in this item in the
first quarter of 2017 was due to the reasons set out in the Statement of Performance – IAS 1
(EUR 13.1 million).
NON-CURRENT LIABILITIES
At 31 March 2017, non-current liabilities totalled EUR 12.6 million, compared with EUR 12.8
million at 31 December 2016.
Deferred tax liabilities
This item totalled EUR 8.7 million at 31 March 2017, compared with EUR 8.6 million at 31
December 2016. It mainly included deferred tax liabilities related to the tax effects of
allocating part of the acquisition cost of the subsidiaries in the purchase price allocation (PPA)
phase.
End-of-service payment fund
At 31 March 2017, this item totalled EUR 3.7 million (EUR 4.0 million at 31 December 2016),
and includes end-of-service payments that are part of defined benefit plans, which were
therefore valued using actuarial assessments.
CURRENT LIABILITIES
At 31 March 2017, current liabilities totalled EUR 30.0 million (EUR 27.0 million at 31
December 2016) and mainly consisted of trade payables (EUR 5.2 million), payables to staff
and social security institutions (EUR 7.7 million) and other payables (EUR 12.1 million).

Interim Management Report
to 31 March 2017
56
Notes to the Consolidated Income Statement
Alternative Asset Management fees
In the first quarter of 2017, Alternative Asset Management fees totalled EUR 13.9 million,
compared with EUR 14.1 million in the same period of 2016; these related mainly to
management fees paid to IDeA FIMIT SGR and to IDeA Capital Funds SGR for the funds they
manage.
Income from investments valued at equity
This item, which was EUR 5.2 million in the first quarter of 2017, includes income from the
associates valued at equity for the period.
Other investment income/expenses
Other net income from investments in shareholdings and funds totalled EUR 2.0 million in the
first quarter of 2017, compared with net expenses of EUR 2.6 million in the same period of
2016.
Service revenues
This item, which was EUR 0.3 million in the first quarter of 2017 (EUR 4.4 million as at 31
March 2016), was lower year on year due to the deconsolidation of IRE from June 2016. Personnel costs
In the first quarter of 2017, personnel costs totalled EUR 7.4 million, compared with EUR 7.7
million in the same period of 2016.
Service costs
Service costs totalled EUR 4.1 million in the first quarter of 2017, compared with EUR 5.8
million in the same period of 2016.
Amortisation/depreciation
This item was EUR 0.7 million in the first quarter of 2017 (EUR 1.6 million in the same period
of 2016) and included amortisation relating to purchase price allocation.
Financial income (charges)
Financial income totalled EUR 0.2 million in the first quarter of 2017 (EUR 0.2 million in the
same period of 2016) and financial charges were minimal (EUR 1.1 million in the same period
of 2016).
Income tax
Income tax due totalled EUR 0.5 million in the first quarter of 2017, in line with the figure for
the same period of 2016.
Interim Management Report
to 31 March 2017
57
Significant events after the end of the period and outlook
SIGNIFICANT EVENTS AFTER THE END OF THE PERIOD
Funds – paid calls/distributions After the end of the first quarter of 2017, the DeA Capital Group increased its investments in
the IDeA I FoF, ICF II and IDeA CCR funds with payments totalling EUR 1.5 million.
At the same time, the DeA Capital Group received capital reimbursements from the IDeA I FoF,
ICF II and Venere funds (EUR 5.4 million, EUR 1.8 million and EUR 0.4 million respectively) to
be used in full to reduce the carrying value of the units.
Dividends from Alternative Asset Management
On 12 April 2017, IDeA Capital Funds SGR approved dividends totalling EUR 1.5 million,
attributable entirely to DeA Capital S.p.A.
On 28 April 2017, IRE paid dividends totalling EUR 1.4 million, of which approximately EUR 0.6
million was attributable to the DeA Capital Group.
On 28 April 2017, IDeA FIMIT SGR paid dividends totalling EUR 5.1 million, of which
approximately EUR 3.3 million was attributable to the DeA Capital Group.
In summary, dividends approved/paid during 2017 by the Alternative Asset Management
business to the DeA Capital Group's holding companies totalled EUR 5.4 million (EUR 9.7
million in 2016).
Share buyback plan
On 20 April 2017, the Shareholders’ Meeting of DeA Capital S.p.A. authorised the Board of
Directors to buy and sell, on one or more occasions and on a revolving basis, a maximum
number of treasury shares representing a stake of up to 20% of the share capital.
The new plan replaces the previous plan approved by the shareholders’ meeting on 21 April
2016 (which was scheduled to expire with the approval of the 2016 Annual Financial
Statements), and will pursue the same objectives, including purchasing treasury shares to be
used for extraordinary transactions and share incentive schemes, offering shareholders a
means of monetising their investment, stabilising the share price and regulating trading within
the limits of current legislation.
The authorisation specifies that purchases may be made until the date of the shareholders’
meeting to approve the Financial Statements for the Year Ending 31 December 2017, and in
any case not beyond the maximum duration of 18 months allowed by law, and that DeA
Capital S.p.A. may also sell the shares purchased for the purposes of trading, without time
limits. The unit price for the purchase of the shares will be set on a case-by-case basis by the
Board of Directors, but must not be more than 20% above or below the share’s reference price
on the trading day prior to each purchase.
The authorisation to sell treasury shares already held in the Company’s portfolio and any
shares bought in the future was granted for an unlimited period; sales may be carried out

Interim Management Report
to 31 March 2017
58
using the methods deemed most appropriate and at a price to be determined on a case-by-
case basis by the Board of Directors, which must not, however, be more than 20% below the
share’s reference price on the trading day prior to the sale (apart from certain exceptions
specified in the Plan), although this limit may not apply in certain cases.
On the same date, the Board of Directors voted to implement the plan to buy and sell treasury
shares authorised by the shareholders’ meeting, vesting the Chairman of the Board of
Directors and the Chief Executive Officer with all the necessary powers, to be exercised
severally and with full power of delegation, and set the maximum unit price above which
purchases of treasury shares may not be made, at the NAV per share indicated in the most
recent statement of financial position approved and disclosed to the market.
At the same meeting, the Company's Board of Directors also voted to adopt market practice
regarding the acquisition of treasury shares by setting up a "securities warehouse", as
permitted by Consob Resolution 16839 of 19 March 2009.
Performance share plans
On 20 April 2017, the DeA Capital S.p.A. Shareholders' Meeting approved the DeA Capital
Performance Share Plan 2017-2019, under which a maximum of 1,200,000 units may be
allocated. On the same date, in implementation of the shareholders’ resolution, the Board of
Directors of DeA Capital S.p.A. voted: (i) to launch the DeA Capital Performance Share Plan
2017-2019 approved by the shareholders’ meeting, vesting the Chairman of the Board of
Directors and the Chief Executive Officer with all the necessary powers, to be exercised
severally and with full power of delegation; and (ii) to allocate a total of 975,000 units
(representing the right to receive ordinary shares in the Company free of charge, under the
terms and conditions of the plan) to certain employees and/or directors performing particular
roles at the Company, its subsidiaries and the Parent Company De Agostini S.p.A. The shares
allocated due to the vesting of units will be drawn from the treasury shares already held by the
Company so that the allocation will not have a dilutive effect.
In May 2017, 209,863 own shares (approx. 0.1% of the share capital) were allocated as a
result of the vesting of the 2014-2016 performance share plan.
Receipt of the penultimate tranche of the proceeds of the sale of IRE
On 28 April 2017, the DeA Capital Group received, via its subsidiary DeA Capital Real Estate,
EUR 0.6 million, being the penultimate tranche of the proceeds of the sale of the majority
stake in IRE, which was completed in 2016. The last tranche of the price – a further EUR 0.6
million – is scheduled to be paid by 30 April 2018.
Interim Management Report
to 31 March 2017
59
OUTLOOK
With regard to the Private Equity Investment area, the Company will continue its efforts to
increase the value of the investments in its portfolio, and will evaluate opportunities for new
co-investment/club deal initiatives – including with funds managed by the platform – of a
smaller unit size than in the past. The Group will also continue to sponsor new initiatives
promoted by the asset management platform, and will use its available capital, partly arising
from the sale of assets currently held in the portfolio, to invest in funds launched by this
platform.
Turning to Alternative Asset Management, the Group will continue to develop platforms for
both private equity (through IDeA Capital Funds SGR) and real estate (through IDeA FIMIT
SGR); its aims are to consolidate its leadership in Italy and expand its investor base and
product range, with a greater focus on the NPL segment in its broadest sense. Within this
framework, in order to best capitalise on its internal know-how, the Group will strengthen
coordination of its development/investor coverage functions, with the additional aim of raising
awareness of DeA Capital as an integrated platform comprising private equity, real estate and
NPL.
The Company will also continue to maintain a solid financial structure, optimised by returning
profits to shareholders (including through buy-back operations), based on the available
liquidity.
Interim Management Report
to 31 March 2017
60
Statement of Responsibilities for the Interim Management Report to 31 March 2017
Interim Management Report
to 31 March 2017
61
STATEMENT OF RESPONSIBILITIES FOR THE INTERIM MANAGEMENT REPORT
TO 31 MARCH 2017 (PURSUANT TO ART. 154-BIS OF LEGISLATIVE DECREE
58/98)
Manolo Santilli, Chief Financial Officer of DeA Capital S.p.A., the manager responsible for
preparing the company’s accounting statements, hereby declares, pursuant to art. 154-bis,
para. 2 of the Testo Unico della Finanza law, that the information contained in this document
accurately represents the figures in the company’s accounting records.
Milan, 10 May 2017
Manolo Santilli
Manager responsible for preparing the
Company’s accounting statements