Embed Size (px)
Citation preview
1
Land distribution and economic development: small-scale
agriculture in developing countries
Harriet Mugera□
Panagiotis Karfakis
Abstract
Small scale farmers constitute about half of world’s hungry people and include three quarters
of Africa’s malnourished children. The appropriate identification and characterization of this
population and the constraints it faces, is essential for the design and the successful
implementation of safety nets and to properly target their needs and effectively include them
in agricultural development strategies.
We calculate four land cultivated thresholds which we then use as a measure to classify
households that were surveyed in four developing countries. We empirically estimate the
magnitudes of the small-holders, their characteristics as well as their poverty status using the
four thresholds. Our analysis provides empirical evidence that small scale farmers still prevail
in terms of population distribution in rural area settings in developing countries. Small scale
farmers heavily rely on farm income as their form of livelihood and heavily contribute to the
rural income. We also find that land is unequally distributed among small and large scale
farmers in the rural households. Small scale farmers are also have the highest poverty rates in
these rural settings.
Department of Economics and Management, University of Trento, Via Inama 5, 38122 Trento, Italy. Email:
□ College of Agriculture and Life Sciences, Charles H. Dyson School of Applied Economics and Management,
Cornell University, United States.
Agricultural Development Economics division, Food and Agricultural Organization of the United Nations,
Vialle delle Terme di Caracalla 1, Rome, Italy 00153.
2
I. Introduction
It has been estimated that about 70 percent of world’s poor are concentrated in rural areas
where two out of three billion rural people reside in about 450 million small farms. Over the
last decade, changes in the patters of agricultural production and trade have affected the
traditional agricultural paradigm in terms of economic, social or even political power
(Byerlee et. al. 2008, WDR 2008, Hazell et. al. 2007).
The role of the smallholders has not been fully addressed in association with recent
challenges in the global economy and with respect to the changing role of agriculture along
development transition. There is need for appropriate characterisation of small holders and
the identification of the constraints that they face. This is a crucial step for the design and the
successful implementation of safety nets. While the estimates regarding the magnitude of
small land holders and their poverty status are impressive, the roughness and lack of further
information on the characteristics and the constraints they face, makes necessary more
thorough research to be able to better target their needs and effectively include them in
agricultural development strategies.
The success of the Green Revolution has influenced the evolution of policies with policy
makers advocating for a more active role for agriculture in the overall economic
development. In Asia, adoption of technological advances even among the smallholders
implied that agriculture could play a leading role in economic growth. The role of small-scale
agriculture has different economic and policy implications.
Smallholders can have significant advantages especially in terms of efficiency in the
production of staple foods. There is a rich literature providing evidence on how use of family
labour in the small farms increases efficiency (Fan and Chang-Kang, 2005). This results from
greater intensity in the use of inputs, especially of family labour, and has positive
consequences for food security. In general, the use of family labour at times when it is
required offers flexibility less possible in larger farm settings as these depend on waged
workers. Smallholder production is also more suitable for labour-intensive products, such as
vegetables, that require transplanting, multiple harvests by hand and for other products that
require attention to detail Moreover, small holders may positively contribute to the rural

3
economy as a whole by encouraging the expenditure patterns in these locals settings.
Consequently, small-scale agriculture provides a livelihood foundation to the rural economy.
The recent food price spikes have strengthened the emphasis on smallholders as food
producers and how small-holders could easily become vulnerable to price shocks. In 2009, at
both the l‟Aquila G8 Meeting and the FAO World Summit on Food Security, world leaders
underlined the importance of small farmers in achieving global food security and called for a
new global partnership towards improving their productivity and incomes. This is particularly
relevant in Africa where poor infrastructure and rain-fed agriculture renders the situation of
small scale farmers more challenging. This issue has therefore posed the question whether
small-scale farming should persist. Evidence from Brazil advocates for policies that facilitate
the transition of small scale to large scale farming as it managed to commercialize its
agricultural sector by implementing new technologies, finance and integration into the
international supply chains (World Bank, 2007). On the other hand, we have success
experiences such as Thailand where small holders did manage to commercialize the
agricultural sector. This mixed evidence suggests that both small and large scale agriculture
can lead to agricultural and economic development. It however poses the challenge on the
persistence of small scale agriculture.
The objective of this paper is to explore the characteristics, limitations and the potential for
agricultural development of small scale farmers in the developing countries. It will develop
indicators based on the RIGA household survey data.
The paper is structured as follows: II. Agricultural economic theory; III. Defining small-
holder farmers; IV. Challenges facing small-scale agriculture; V. Methodology and Data; VI.
Results; VII. Concluding Remarks.
4
II. Agricultural economic theory
The standard economic theory, defined development as the economic growth process which
occurs due to an appropriate reallocation of production factors from the low productivity
rural (agricultural) sector to the urban (industrialised) sector. In this setting the agricultural
sector supplied the urban areas with food thus releasing savings and labour which then
enhanced industrialisation. This theory has faced criticisms due to distortions stemming from
the impact of high food demand and prices as wages in the urban sector along with the living
standards improve (Ricardian trap).
The success of Green Revolution modified classical theory and policy guidelines, assuming a
more active role for agriculture in overall development. The new models known as the
innovation models, included new ways of thinking. In particular, technological advances
indicated that agriculture could contribute to overall growth, through productivity increases,
thus overcoming resource constraints. Technological innovations are often dependent on
natural endowments and market forces for inputs and outputs being endogenous to the
country’s agricultural transformation process. Forward and backward linkages in demand and
supply not only in agriculture, highlight the crucial role of agriculture in development.
These linkage effects are identified by investing to the industrial sector and the potential
impact this sector has to the rural economy. Subsequently, rural production and consumption
linkages can be determined as a result of the utilization of agricultural output as input to the
industrial sector as well as from the demand for inputs generated from agriculture,
respectively. In this process, effects from trade depend on the elasticity of substitution
between domestic and foreign commodities as well as the existence of non-tradable
commodities. Nevertheless, serious constraints in rural areas, in terms of imperfect or missing
markets, high transaction costs and poor infrastructure, limit the exploitation of these
linkages, hindering agricultural transformation and development transition. Setting-up of
development policy objectives that aim at overcoming these constraints in association with
promoting industrialization is necessary.
Within the context emerging in the aftermath of the Green Revolution success, small scale
agriculture is seen as the backbone of agricultural transformation. Its role is
multidimensional, starting primarily from its efficiency advantage, relative to large scale
farming, its contribution to the rural economy and national food security through favorable

5
expenditure patterns in the local economy as well as through the concentration of agricultural
produce to staple food items, respectively. As a result of these functions, small scale
agriculture consists for itself and provides to the rural economy a livelihood platform which
is able to accommodate poverty reduction and food security along with welfare improvement
objectives.
Beyond the advantages offered by small scale farmers, stabilization of social and economic
structures is added as agriculture and small scale farming are able to overcome the impact of
food crises. Moreover, the decision process and the management of small scale farms within
its most frequent organizational form, the family farm, are supposed to promote learning and
innovation. On the other hand, urban biased development processes, are frequently claimed
as distorting economic incentives, yielding highly dualistic outcomes, slowing sectorial and
aggregate growth rates and promoting non-equitable distribution of resources and returns to
development.
III. Defining small-holder farmers
There is no unique and unambiguous definition of smallholder farmers. Different indicators
have been identified in order to define small-scale farmers. Land ownership is one of them.
Limited access to land is the common identification feature, when the term smallholder is
mentioned in the literature or elsewhere. The limit, most frequently takes the form of a
threshold that is usually selected in an ad hoc basis (2 hectares, mean or median land size).
For example, households with less than a threshold land size of two hectares may be
characterized as smallholders. However, across countries, the distribution of farm sizes
depends on many other factors such as agro-ecological and demographic conditions and
economic and technological factors. For instance Chamberlin (2008), using survey data from
Ghana, employs farm size as the classification variable, and defines small holders as farmers
with operated farm size smaller than 10 hectares and greater than 0.1 hectares (“virtually
landless”).
A range of other dimensions are important attributes of scale in defining small holder
farmers. Among these attributes, geographical attributes, access, use and ownership of
capital, livestock and inputs (including credit) are crucial Jayne et. al. (2003), define small
holders in a similar way in six Sub- Saharan countries. Eastwood at al. (2007) and Anriquez
and Bonomi (2007), provide useful reviews on the evolution of farm size. Moreover, other

6
attributes such as land fragmentation or differentiation between land ownership and use are
important characteristics that affect scale in agriculture. Another form of farm typologies
reflects on agro-ecological characteristics such as climate, farmland related factors (soil,
slope, altitude) and the crop and livestock systems used along with other economic factors.
Finally, a set of farm typologies employed by FAO (McConnell and Dillon, 1997), addresses
attributes reflecting on the operational objective of the farm and its degree of independence
along with its size. The operational objectives of the farm, stemming from the principal
purpose of welfare maximization, are achieved through self-sufficiency and/or the generation
of some amount of cash income, while the number and the types of crops cultivated are also
considered.
IV. Challenges facing small-scale agriculture
Numerous experts have suggested that modern economic reality and the new ways of doing
business in agriculture (and other sectors) implies deteriorating prospects for small scale
farmers. Small scale farmers will thus face a new range of conditions and challenges have
emerged, that go beyond the paradigm of the peasant farm, which dominated the Green
revolution. These hurdles include globalization, technological advances, institutional changes
and environmental concerns (Byerlee at. al 2008; Hazell et. al. 2006; McCullough et. al.
2008).
Changes in methods of production stemming from technological advances affect scale
economies. During the Green Revolution technological progress based primarily on improved
seeds was easily adapted from farmers irrespective of operational size. Nowadays,
technological advances require investments both in human and physical capital, as well as
advanced relationships with a wide network of suppliers and traders of inputs (including
credit) and services. In this environment small scale farmers face a difficult issue on how to
locate the required financial resources and integrate.
Several authors consider efficiency of small farms an outcome originating from agro-
ecological conditions and the local environment. Nevertheless further evidence indicates that
along transition other factors come into play that reverse the efficiency advantage of small
farms. In particular, labor to capital ratios increase along with the importance of managerial
quality attributes seems to favor large scale farming. In general there exist a range of factors
that promote large scale efficiency (lumpy inputs, labor specialization, processing and

7
marketing, capital related transaction costs), and another set that does the opposite (risk
considerations and labor related transaction costs). The relative importance of these factors in
specific environments may lead to different outcomes.
Globalization has led to changes in marketing and trading modes as well as affected domestic
and international marketing chains. In developing countries oligopsonistic structures
characterize more and more the marketing of agricultural commodities, as chains concentrate
increasing market shares. In these structures quality, quantity and timing constraints favor
large scale in operations which are able to accommodate for these requirements and adjust if
needed more easily. Especially when farming operations are distributed unequally (e.g.
bimodal), large farmers are favored.
Opportunities arise for small farmers if production of staples can be integrated into the values
chains, with their integration into the production of high value commodities or if biofuels are
proven a viable and profitable solution. Necessary conditions and key challenges in order to
exploit these opportunities however, are the effective collective action of small scale farmers
and the enabling environment in terms of undistorted incentives and sufficient infrastructure.
Post war prices of agricultural commodities along with increasing globalization are showing
declining trends for the most part. The recent decade has also been characterized by an
increase in volatility especially in agricultural food commodities. As argued by Aizenman
and Pinto (2005), though some may benefit from higher volatility, this results in an overall
welfare loss. In agriculture, volatile commodity prices are of particular importance in
agriculture and particularly in developing countries. This is so for different reasons. Firstly,
most of the poor households in developing countries spend large proportions of their incomes
on food. Secondly, most farm households in developing countries are small-scale farmers
who sell their produce onto the market but also happen to be net buyers. Thirdly and lastly,
most small-scale farm households full rely on the sale of food commodities in order to cover
their basic needs and expenditures like health and education expenses. Food price volatility
thus feeds directly into poverty. This is so since high food prices can play a major role in
moving many vulnerable non-poor households into poverty and low food prices can move
non-poor farm households into poverty. Since these households devote a large proportion of
their budgets to food price shocks can easily pre-empt their income moving them from
sustainability into poverty (Anderson and Roumaset, 1996).
8
As far as it concerns agricultural research, the past decades is observed a shift from yield
creation which was the norm during the Green revolution, to yield protection. Moreover,
fewer innovations, declining rates of funding and shifts from public to private spending seem
to favor large scale in farming systems. Increasing environmental concerns along with
changes in climate create another challenge for agricultural systems. With respect to this
challenge, scale of operations may have significant implications regarding the viability of
different types of farmers. The literature suggests that small holders may be unable to account
and adjust to these environmental threats due to the lack of sufficient human, social, financial
capital and information. On the other hand some degree of optimism is allowed as long as
small scale is able to provide greater flexibility and adaptability.
Finally, a major shift is observed the last decades in the policy environment, which no longer
accommodates for extensive public intervention and support unlike the Green revolution state
of affairs. Costs for this type of policies were proven very high, and not easy to sustain.
Moreover, promoting private sector intervention and support may adversely affect small scale
farming business as long the latter fail to comply with the quantity, quality and timing
constraints that private business require or as long as the enabling environment is still
missing.
V. Methodology and Data
Even though farm size is unable to capture the different dimensions regarding scale in
farming systems, it is a convenient and easily implemented measure of size. Size of cultivated
will be used as the key dimension in identifying the different categories of farmers in a
database that consists of survey data from several countries. In household survey data,
operated or owned land size is reported at the household level. Empirical research employs
thresholds at the level of family farm, which, while are able to accommodate for the
organizational form of the farm (family in most of the cases), they miss information with
respect to production. Because most farms are small but most production occurs on large
farms, the typical measure of representative farm size – the average and median- will tend to
mask large changes in the concentration of production. Average and median measures of
farm size focus on the typical farm, which is small, rather than the typical hectare of
farmland, which is associated with a larger operation.
9
Country's land median, suggested by Key and Roberts (2007a and b), may better reflect the
size of operations where most production occurs. The land median is calculated by first
ordering farms from smallest to largest and picking the farm size at the middle hectare (the
standard median focuses on the middle farm). By use of the measure, half of all land (rather
than farms), is on farms smaller than the land median, and half of land is on bigger farms,
thus capturing the typical acre of farmland. Conditional on the land distribution and the
typical size of the farms within a country, the land median maybe higher or lower than the 2
hectares threshold, but always equal or higher with respect to the other thresholds used.
Doran (1985), suggests a methodology which accounts for the multi-dimensional character of
scale, avoiding shortcomings that ad-hoc measures impose. With this methodology, a
function Φ(Z), replaces any ad hoc threshold and estimates the cut-off point from the data.
Denoting this cut-off point by μ, and assuming a cumulative normal distribution for the scale
variable then:
Φ(μ,σ ) = Φ[(Z −μ ) /σ ] ,
where Z refers to a vector of exogenous characteristics and μ and σ to the mean and the
standard deviation of Φ. At 95 percent confidence interval, small and large farms are those
for which holds:
Z < μ −1.96σ and Z > μ +1.96σ , respectively.
If σ is not statistically significant, then two types of farms can be recognized; small and large,
with the cut-off point determined by the data. If σ is significantly different from zero, then
there is a third type of farms, in between small and large farms, which maybe thought as
farms being in the process of changing technology. This methodology will be implemented in
the current dataset in next steps of the research.
We obtain our data from the Rural Income Generating Activities (RIGA), database developed
in FAO-ESA. The database consists of a large number of about 25 surveys conducted in more
than 15 developing countries in different continents. A major advantage of the database is the
detailed and consistent methodology employed to construct the income sources and the
associated aggregates (Davis et. al. 2007).

10
We use the survey data for the following countries: Guatemala (2000), Nicaragua (2001);
Malawi (2004); Kenya (2005). Using the multiple survey datasets, we first constructed a
series of variables necessary for this analysis. We then conduct the analysis country by
country and then do a comparative study of the different measures of land distribution. This
analysis differs from the others as we look at the amount of land cultivated and by each
household in the surveys conducted and not the amount of land owned1.
We estimate four threshold variables on the land cultivated by households and these are:
40th
percentile (p40)
Mean
Median
Hectare-weighted median
For each of the above surveys and given the thresholds, households are categorized into:
Households that do not cultivate any land
Households that are classified as small-scale farmers:
Households that are classified as large scale farmers
We construct the variables for the analysis by using the multiple household survey datasets.
1 This question is particularly relevant in the African context where many of the households and small scale
farmers do not have ownership rights over the land or communally cultivate the land.
11
VI. Results
The results of the above estimates are recorded in the tables located in the appendix of this
paper. Tables 1 shows the distribution in population for each of the four country surveys
using the different threshold measures. It is interesting to see how the proportions change
when we implement different threshold measures. The p40 and median threshold highlight
similar results while mean and hectare-weighted median provide evidence of similar
population distributions across all countries. What emerges in the cross country comparison
is the consistently high proportion of small-scale farmers in these contexts. In particular, with
the hectare-weighted median threshold, small scale farmers in all four countries represent
more than 60 percent of the population in the rural areas.
Tables 2 highlight some of the key household and demographic characteristics using each of
the thresholds across the four surveys. Some of these characteristics include; the average
number of members in each household, female headed households, years of education of the
head of household, access to infrastructure and poverty headcount. In particular, the
infrastructure index tries to capture a range of associated services such as, education, health
and other public facilities), and whether households can access them or not2.
Tables 2 present these characteristics at country level and implementing the four different
thresholds. In all the four countries landless, the small holders and large-scale farmers over
50 percent of their total expenditure went to food. The poverty headcount indices show that
small-scale farmers are among the poorest in these contexts with indices that are over 0.5.
In Tables 3 the average farm size in hectares cultivated is calculated for each of the categories
(no land, small-scale and large-scale) and for each of the thresholds. Tables 3 show the
results for each country survey. In all four country studies, and for all the thresholds, there is
evidence of inequality in the average farm sizes cultivated by small farmers compared to
those cultivated by large-scale farmers. For example, in the case of Nicaragua, reported on
Tables 4, we find that with the p40 threshold, small scale farmers on average cultivate as low
as 1.03 hectares compared to the large-scale farmers who cultivate 18 hectares of land. This
result is consistent across all the thresholds used where we observe the highest values when
the hectare-weighted median is implemented. In this case, small holder farmers cultivate 6
hectares while large scale farmers cultivate 63 hectares of land. The average farm size
2 The index was computed from the survey data collected by the RIGA (Zezza et. al., 2007).

12
cultivated by small holders in all four countries is significantly smaller compared to hectares
cultivated by their large-scale counterparts.
Tables 5 document the average contribution of income sources to the household’s income.
We focus on the hectare weighted median threshold, similar analysis has been replicated for
the other three thresholds across the country surveys. Looking at on-farming (crop and
livestock) income contributions, we observe that this share is highest for large-scale farmer.
However it is interesting to observe that on-farming income accounts for over 40 percent of
the small-scale household’s income source across all the countries surveyed. These results are
confirmed by the disaggregate measures of the average share of crop and livestock income.
The share of crop income prevails over the contribution from livestock income with shares as
high as 56 percent in Malawi. Another set of results highlight the average share of on-farm
income. Large scale households have a higher share of on-farm income sales compared to
small scale farmers. Limited access to markets and various other constraints significantly
limit the benefits that may arise from commercialization for small scale farmers. These
constraints vary from one region to another.
The last table highlights the share of off-farm income on the household’s average income
sales. In all four survey countries, households that do not cultivate land have the highest share
of off-farm income. This share is as high as 90% in Guatemala and Nicaragua and above 60%
in Kenya and Malawi. Small-scale households follow with over 30% of their income coming
from off-farm activities. Large scale farmers have the smallest share.
Tables 6 show the distribution of income in the general economy. Looking at the general
income distribution in the rural economies of the case studies, we find that small holder
farmers contribute heavily to the rural income. Most of this income comes from on-farming
income activities with a majority of this income coming from crop sales. These results are
consistent across all the countries.
Tables 7 confirm the important role of the farm and crop income from small-holder farmers
in their contribution to the rural aggregate income. The shares are above 20 percent and 15
percent respectively. Though at smaller magnitudes, small scale farmer’s farm and crop
income contribution to the national aggregate income dominates over the other two
categories. In some cases for example Malawi, it exceeds 30% (see tables 8 for details).

13
VII. Concluding Remarks
The recent agricultural food commodity price spikes have raised the attention on small
holders and on their position as food producers and consumers. In particular academics,
policy makers and leaders around the world have underlined the importance of small farmers
in achieving global food security and have called for a new global partnership towards
improving their productivity and incomes. Small holder farmers are mainly concentrated in
developing countries and account for two thirds of the developing world’s three billion rural
population.
We empirically and directly identify and characterize small scale farmers in developing
countries. Using the attribute of land cultivated in hectares, we estimate four main thresholds.
Using survey data that was collected and compiled by the Rural Income Generating Activities
database (RIGA-FAO), we implement the above thresholds to four developing country
household surveys in order to first categorize rural households as households that do not
cultivate land, small holders and large holders. We then address multi dimensionality that
characterizes small scale farmers, by trying to take into account a series of characteristics
which will provide more reliable classification outcomes. We conduct this analysis for each
country given the four thresholds. We further conduct a cross-country survey comparison
analysis based on one of the thresholds i.e., the hectare-weighted-median.
One of the key findings is that small holder farmers are still the majority in terms of
population in rural areas. This result is consistent across thresholds as well in all the four
country surveys. Moreover, small-scale farmers heavily depend on farming activities as their
main source of livelihood. This result is confirmed by the high share of crop and livestock
income on the average household income in all the surveyed countries. Small scale farmers
also contribute heavily to both rural and national income in these developing countries. On
average, the smallholder farmers income contributed by over 20 percent and 10 percent
respectively.
Though these results highlight the important role played by small-scale agriculture in the
rural economy and its potential in driving economic growth and guaranteeing food security,
we also find evidence of land inequality in the surveyed countries i.e., the amount of land
households cultivate. The inequality varies across countries mainly due to differences in
property rights, the existence of other forms of land tenure such as share cropping and

14
communal usage of land. In addition, even though small holders are important to the
communities, they are the poorest. We find the highest levels of poverty rates in small scale
households.
Agriculture in developing countries remains dominated by small scale farms. Yet
productivity remains low and poverty, vulnerability as well as food insecurity remain
rampant. The question on whether or not smallholder farmers will persist and remain
competitive is hard to tell. On the one hand, the Green revolution in Asia shaped small scale
farmers while increasingly commercialized farms. On the other hand, the experience of Brazil
suggests that policies that facilitate transition from small to large scale farming led to
successful commercialization of the Brazilian agricultural sector. This all trickles down to the
crucial and important role of policies. There is need for appropriate policy measures which
would address the issues and challenges smallholder farmers face. Pro-poor policies and
strategies that integrate smallholders into markets or strengthen rural off-farm employment
are essential to include small-scale farmers in the development process.
15
References Anriquez G and G. Bonomi (2007), “Long-term farming trends: an inquiry using agricultural
censuses”, ESA FAO working paper 07-20
Davis, B., Winters, P., Carletto, G., Covarrubias, K., Quinones, E., Zezza, A., Stamoulis, K., Bonomi,
G. and DiGiuseppe, S. 2007. “Rural Income-Generating Activities: A Cross Country Comparison”,
Background Paper for the World Development Report 2008, FAO Rome.
Diao X., P. Hazell, D. Resnick, and J. Thurlow. (2006), “The role of agriculture in development:
Implications for Sub-Saharan Africa” IFPRI Research Report No. 153
Doran, H.E. (1985), “"Small" or "large" farm: some methodological considerations”, American
Journal of Agricultural Economics, v. 67(1) p. 130-132
Eastwood, R., M. Lipton, and A. Newell. 2007. Farm size. Chapter prepared for R. Evenson and P.
Pingali (eds.) Handbook of agricultural economics. Vol. 3, Agricultural development: farmers, farm
production and farm markets.
Fan S. and C. Chan-Kang, (2005). "Is small beautiful? Farm size, productivity, and poverty in Asian
agriculture," Agricultural Economics, International Association of Agricultural Economists, vol.
32(s1), pages 135-146
Jayne, T.S., T. Yamano, M. Weber, D. Tschirley, R. Benfica, A. Chapoto, and B. Zulu. (2003).
“Smallholder income and land distribution in Africa: Implications for poverty reduction strategies”.
Food Policy 28: 253–275.
Hazell P., C Poulton, S Wiggins, and A Dorward, (2007), “The Future of Small Farms for Poverty
Reduction and Growth”, IFPRI, 2020 Discussion Paper 42.
Key N. and M. Roberts (2007a), “Commodity Payments, Farm Business Survival, and Farm Size
Growth”, Economic Research Report No. (ERR-51) 47 pp,
Key N. and M. Roberts (2007b), “Measures of Trends in Farm Size Tell Differing Stories”,
AmberWaves November 2007
Lipton, M. (2005). The family farm in a globalizing world: The role of crop science in alleviating
poverty. 2020 Vision for Food, Agriculture, and the Environment Initiative Discussion Paper No. 40.
Washington, DC.: International Food Policy Research Institute.
McConnell, D. J., Dillon, J. L (1997), “Farm management for Asia: a systems approach”, FAO Rome.
McCullough E, P L. Pingali, and K G. Stamoulis, eds, “The transformation of agri-food systems:
globalization, supply chains and smallholder farmers”, FAO and EarthScan (2008)
Ravallion, M., and G. Datt, (1999), “When is growth pro-poor? Evidence from the diverse
experiences of India’s States”. Policy Research Working Paper No. 2263 World Development Report
2008: Agriculture for Development (2008), World Bank.
Zezza A., P. Winters, B. Davis, G. Carletto, K. Covarrubias, E. Quinones, K. Stamoulis, T. Karfakis,
L. Tasciotti, S. DiGiuseppe and G. Bonomi (2007), “Rural Household Access to Assets and Agrarian
Institutions: A Cross Country Comparison” Background Paper for the World Development Report
2008, FAO, Rome

0
Appendix:
Tables 1: population distribution
Threshold no landcult small-scale large-scale
p40 32,00% 25,00% 43,00%
Mean 32,00% 53,00% 15,00%
Median 32,00% 32,00% 36,00%
Hectare-weighted Median 32,00% 62,00% 6,00%
Nicaragua Guatemala
Threshold no landcult small-scale large-scale
p40 Threshold 4,00% 36,00% 60,00%
Mean 4,00% 58,00% 38,00%
Median 4,00% 46,00% 50,00%
Hectare-weighted Median 4,00% 73,00% 23,00%
Malawi Kenya
Tables 2: Household characteristics 2a. Nicaragua:
p40 mean median hectare weighted median
Characteristics no land small-scale large-scale no land small-scale large-scale no land small-scale large-scale no land small-scale large-scale
number of people in the hh 4,93 5,6 6,4 4,93 5,75 6,39 4,93 6 6,34 4,93 6,06 6,24
female headed hh 0,29 0,16 0,11 0,29 0,15 0,11 0,29 0,14 0,11 0,29 0,13 0,12
years of education head of hh 3,31 2,14 2,01 3,31 2,15 1,97 3,31 2,05 2,09 3,31 2,02 2,5
Tropical Livestock Units: total 0,04 0,96 5,13 0,04 1,09 5,74 0,04 2,06 8,41 0,04 2,61 12,11
mechan 0,01 0,31 0,53 0,01 0,34 0,54 0,01 0,39 0,61 0,01 0,42 0,72
fertil1 0,05 0,42 0,4 0,05 0,43 0,39 0,05 0,42 0,38 0,05 0,41 0,41
fertil2 0,03 0,06 0,06 0,03 0,07 0,06 0,03 0,06 0,08 0,03 0,06 0,1
fertil3 0,02 0,45 0,5 0,02 0,45 0,5 0,02 0,46 0,56 0,02 0,47 0,61
RURAL: access to infrastructure 0,27 -0,07 -0,22 0,27 -0,07 -0,25 0,27 -0,1 -0,35 0,27 -0,13 -0,4
Poverty headcount 0,48 0,71 0,62 0,48 0,7 0,61 0,48 0,68 0,56 0,48 0,67 0,45
Cropincome/Total income 0,04 0,22 0,35 0,04 0,24 0,36 0,04 0,28 0,36 0,04 0,3 0,34
Livestock income/Total Income 0,04 0,16 0,33 0,04 0,16 0,35 0,04 0,21 0,43 0,04 0,24 0,42
On-farm income/Total income 0,08 0,38 0,68 0,08 0,41 0,71 0,08 0,5 0,78 0,08 0,54 0,76
Off-farm income/Total income 0,92 0,62 0,31 0,92 0,59 0,28 0,92 0,5 0,2 0,92 0,46 0,23
Threshold no landcult small-scale large-scale
p40 Threshold 25,00% 28,00% 47,00%
Mean 25,00% 68,00% 7,00%
Median 25,00% 34,00% 41,00%
Hectare-weighted Median 25,00% 74,00% 1,00%
Threshold no landcult small-scale large-scale
p40 Threshold 16,00% 31,00% 53,00%
Mean 16,00% 53,00% 31,00%
Median 16,00% 36,00% 48,00%
Hectare-weighted Median 16,00% 62,00% 22,00%

1
2b. Guatemala
p40 mean median hectare-weighted median
Characteristics no_land small-scale large-scale no_land small-scale large-scale no_land small-scale large-scale no_land small-scale large-scale
female headed hh 0,23 0,17 0,07 0,23 0,12 0,06 0,23 0,15 0,07 0,23 0,11 0,12
years of education head of hh 3,39 1,92 1,72 3,39 1,81 1,72 3,39 1,9 1,71 3,39 1,81 1,05
number of people in the hh 4,82 5,54 6,18 4,82 5,91 6,11 4,82 5,64 6,19 4,82 5,95 4,54
Tropical Livestock Units: total 0,22 0,46 1,72 0,22 0,7 6,25 0,22 0,5 1,85 0,22 0,82 27,71
fertil1 0,01 0,84 0,8 0,01 0,83 0,65 0,01 0,85 0,78 0,01 0,82 0,91
fertil2 0,01 0,77 0,74 0,01 0,77 0,6 0,01 0,78 0,73 0,01 0,75 0,82
fertil3 0,01 0,27 0,53 0,01 0,4 0,67 0,01 0,29 0,55 0,01 0,43 0,69
mechan 0 0,11 0,13 0 0,11 0,19 0 0,11 0,13 0 0,11 0,47
RURAL: index of access to infrastructure 0,17 0,12 -0,2 0,17 -0,04 -0,38 0,17 0,08 -0,22 0,17 -0,08 0,1
Poverty headcount 0,47 0,72 0,74 0,47 0,75 0,61 0,47 0,73 0,73 0,47 0,74 0,25
Cropincome/Total income 0,07 0,25 0,43 0,07 0,34 0,5 0,07 0,27 0,44 0,07 0,36 0,37
Livestock income/Total Income 0,01 0,03 0,07 0,01 0,04 0,21 0,01 0,04 0,08 0,01 0,05 0,57
On-farm income/Total income 0,09 0,29 0,5 0,09 0,38 0,7 0,09 0,31 0,51 0,09 0,41 0,95
Off-farm income/Total income 0,9 0,71 0,5 0,9 0,61 0,3 0,9 0,69 0,48 0,9 0,59 0,05
sh_foodexp 0,51 0,53 0,56 0,51 0,54 0,58 0,51 0,53 0,56 0,51 0,55 0,51
2c. Malawi
p40 Mean Median hectare-weighted median
Characteristics no-land small-scale large-scale no-land small-scale large-scale no-land small-scale large-scale no-land small-scale large-scale
female headed hh 0,22 0,29 0,2 0,22 0,27 0,19 0,22 0,28 0,2 0,22 0,26 0,18
number of people in the hh 3,32 4 5 3,32 4,22 5,24 3,32 4,11 5,1 3,32 4,36 5,36
years of education head of hh 6,06 3,88 4,31 6,06 3,88 4,59 6,06 3,86 4,43 6,06 3,96 4,75
Tropical Livestock Units: total 0,06 0,14 0,48 0,06 0,19 0,61 0,06 0,16 0,54 0,06 0,25 0,67
fertil1 0,03 0,6 0,72 0,03 0,63 0,74 0,03 0,62 0,73 0,03 0,64 0,77
fertil2 0,02 0,53 0,65 0,02 0,56 0,67 0,02 0,55 0,66 0,02 0,57 0,71
fertil3 0 0,01 0,05 0 0,02 0,06 0 0,02 0,05 0 0,03 0,06
mechan 0,02 0,01 0,04 0,02 0,02 0,06 0,02 0,02 0,05 0,02 0,02 0,07
RURAL: index of access to infrastructure 0,85 -0,02 -0,07 0,85 -0,04 -0,05 0,85 -0,03 -0,06 0,85 -0,05 -0,01
Poverty headcount 0,27 0,51 0,46 0,27 0,5 0,44 0,27 0,51 0,45 0,27 0,5 0,41
Cropincome/Total income 0,19 0,53 0,61 0,19 0,55 0,62 0,19 0,54 0,62 0,19 0,56 0,63
Livestock income/Total Income -1,01 -0,37 -0,55 -1,01 -0,35 -0,72 -1,01 -0,3 -0,68 -1,01 -0,4 -0,75
On-farm income/Total income -0,82 0,16 0,06 -0,82 0,21 -0,1 -0,82 0,24 -0,06 -0,82 0,16 -0,12
Off-farm income/Total income 1,79 0,84 0,94 1,79 0,79 1,1 1,79 0,75 1,06 1,79 0,84 1,11
Foodexp percapita/Totalexp percapita 0,59 0,62 0,61 0,59 0,62 0,61 0,59 0,62 0,61 0,59 0,62 0,6

2
Tables 3: Land distribution by threshold ( %)
Threshold no landcult small-scale large-scale
p40 Threshold 0,00% 3,00% 97,00%
Mean 0,00% 18,00% 82,00%
Median 0,00% 5,00% 95,00%
Hectare-weighted Median 0,00% 59,00% 41,00%
Nicaragua Guatemala
Threshold no landcult small-scale large-scale
p40 Threshold 0,00% 15,00% 85,00%
Mean 0,00% 32,00% 68,00%
Median 0,00% 22,00% 78,00%
Hectare-weighted Median 0,00% 52,00% 48,00%
Malawi Kenya
Tables 4: Average farm size of the land cultivated – in hectares
Nicaragua Guatemala
Threshold no landcult small-scale large-scale
p40 Threshold 0,00000 1,03112 17,59311
Mean 0,00000 2,82487 40,03744
Median 0,00000 1,23462 20,34439
Hectare-weighted median 0,00000 5,93483 62,67598
Threshold no landcult small-scale large-scale
Threshold 0,00000 0,25316 1,03592
Mean 0,00000 0,35271 1,36342
Median 0,00000 0,29647 1,16263
Hectare-weighted Median 0,00000 0,44176 1,68039
Malawi Kenya
Threshold no landcult small-scale large-scale
p40 Threshold 0,00% 1,00% 99,00%
Mean 0,00% 11,00% 89,00%
Median 0,00% 2,00% 98,00%
Hectare-weighted Median 0,00% 44,00% 56,00%
Threshold no landcult small-scale large-scale
p40 Threshold 0,00% 11,00% 89,00%
Mean 0,00% 30,00% 70,00%
Median 0,00% 14,00% 86,00%
Hectare-weighted Median 0,00% 64,00% 36,00%
Threshold no landcult small-scale large-scale
p40 Threshold 0,00000 0,26644 8,42721
Mean 0,00000 0,98911 46,34349
Median 0,00000 0,32498 9,52282
Hectare-weighted Median 0,00000 2,59878 179,05530
Threshold no landcult small-scale large-scale
p40 Threshold 0,00000 0,27241 1,45035
Mean 0,00000 0,43378 2,07379
Median 0,00000 0,30103 1,54768
Hectare-weighted Median 0,00000 0,23580 1,13659

Tables 5: Contribution of income sources (average)- at hh level (HWM)
5a. Share of On-farm Income (average)
Country no land Small scale Large scale
Guatemala 0,09 0,42 0,75
Nicaragua 0,08 0,55 0,85
Kenya 0,24 0,58 0,65
Malawi 0,24 0,66 0,78
5b. Share of Crop Income (average)
Country no land Small scale Large scale
Guatemala 0,07 0,36 0,46
Nicaragua 0,04 0,3 0,35
Kenya 0,13 0,4 0,45
Malawi 0,2 0,56 0,64
5c. Share of Livestock Income (average)
Country no land Small scale Large scale
Guatemala 0,02 0,06 0,3
Nicaragua 0,04 0,25 0,5
Kenya 0,11 0,18 0,2
Malawi 0,04 0,09 0,14
5d. Share of On-farm Income sales (average)
Country no land Small scale Large scale
Guatemala 0,01 0,3 0,53
Nicaragua 0,04 0,35 1
Kenya 0,18 0,29 0,42
Malawi 0,01 0,12 0,22
5e. Share of Crop Income Sales (average)
Country no land Small scale Large scale
Guatemala 0 0,26 0,25
Nicaragua 0,03 0,21 0,36
Kenya 0 0,21 0,33
Malawi 0 0,1 0,18
5f Share of Livestock Income Sales (average)
Country no land Small scale Large scale
Guatemala 0,01 0,04 0,28
Nicaragua 0,01 0,13 0,64
Kenya 0,18 0,08 0,1
Malawi 0 0,02 0,03

5g. Share of Off-farm Income (average)
Country no land Small scale Large scale
Guatemala 0,9 0,58 0,25
Nicaragua 0,91 0,44 0,11
Kenya 0,62 0,34 0,26
Malawi 0,72 0,33 0,21
Tables 6: Distribution of Income Sources in the Rural Economy
6a. Rural Income Distribution
Country no land Small scale Large scale
Guatemala 33,00% 64,00% 3,00%
Nicaragua 35,00% 60,00% 5,00%
Kenya 20,00% 65,00% 16,00%
Malawi 5,00% 69,00% 26,00%
6b. Share of On-farm Income (average)
Country no land Small scale Large scale
Guatemala 7,00% 88,00% 5,00%
Nicaragua 6,00% 83,00% 11,00%
Kenya 10,00% 73,00% 17,00%
Malawi 2,00% 67,00% 31,00%
6c. Share of Crop Income (average)
Country no land Small scale Large scale
Guatemala 6,00% 90,00% 4,00%
Nicaragua 6,00% 86,00% 8,00%
Kenya 7,00% 75,00% 18,00%
Malawi 1,00% 68,00% 31,00%
6d. Share of Livestock Income (average)
Country no land Small scale Large scale
Guatemala 11,00% 79,00% 10,00%
Nicaragua 6,00% 80,00% 15,00%
Kenya 14,00% 70,00% 16,00%
Malawi 2,00% 63,00% 35,00%
6e. Share of Off-farm Income (average)
Country no land Small scale Large scale
Guatemala 42,00% 56,00% 2,00%
Nicaragua 53,00% 46,00% 1,00%
Kenya 26,00% 60,00% 15,00%
Malawi 10,00% 73,00% 17,00%

Tables 7: Contribution of Income to the Rural Income (aggregate)
7a. Proportion of Farm Income
Country no land Small scale Large scale
Guatemala 2,00% 23,00% 1,00%
Nicaragua 2,00% 32,00% 4,00%
Kenya 4,00% 28,00% 6,00%
Malawi 1,00% 44,00% 20,00%
7b. Proportion of Crop Income
Country no land Small scale Large scale
Guatemala 1,00% 20,00% 1,00%
Nicaragua 1,00% 17,00% 2,00%
Kenya 2,00% 17,00% 4,00%
Malawi 1,00% 36,00% 16,00%
Tables 8: Contribution of Income to the National Income (aggregate)
8a. Proportion of on-Farm Income
Country no land Small scale Large scale
Guatemala 0,75% 9,29% 0,54%
Nicaragua 0,73% 10,50% 1,46%
Kenya 2,00% 12,00% 3,00%
Malawi 1,00% 36,00% 17,00%
8b. Proportion of Crop Income
Country no land Small scale Large scale
Guatemala 0,56% 7,95% 0,37%
Nicaragua 0,38% 5,49% 0,54%
Kenya 1,00% 7,00% 2,00%
Malawi 1,00% 30,00% 13,00%
8c. Proportion of Off-farm Income
Country no land Small scale Large scale
Guatemala 12,78% 16,83% 0,53%
Nicaragua 10,88% 9,22% 0,25%
Kenya 7,00% 16,00% 4,00%
Malawi 3,00% 21,00% 5,00%
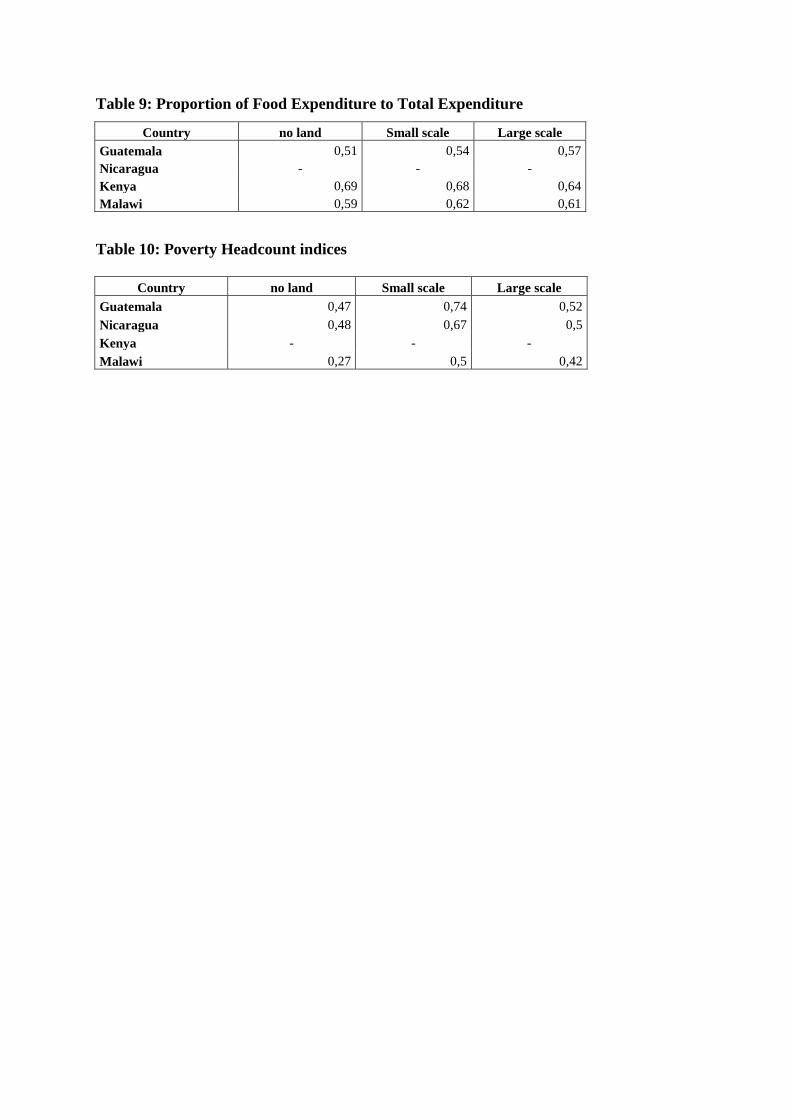
Table 9: Proportion of Food Expenditure to Total Expenditure
Country no land Small scale Large scale
Guatemala 0,51 0,54 0,57
Nicaragua - - -
Kenya 0,69 0,68 0,64
Malawi 0,59 0,62 0,61
Table 10: Poverty Headcount indices
Country no land Small scale Large scale
Guatemala 0,47 0,74 0,52
Nicaragua 0,48 0,67 0,5
Kenya - - -
Malawi 0,27 0,5 0,42


![Classes of Ordinary Differential Equations Obtained for ... · distribution [51], beta distribution [52], raised cosine distribution [53], Lomax distribution [54], beta prime distribution](https://img.pdfslide.net/doc/110x75/5f0b793c7e708231d430b170/classes-of-ordinary-differential-equations-obtained-for-distribution-51-beta.jpg)