Embed Size (px)
Citation preview
CHAPTER-IV
Upper Ocean Response to Cyclones in
Arabian Sea
4.1 Introduction
Arabian Sea (AS) is unique with many characteristics, including a complex air-sea
interaction system, often driven by local as well as remote forcing mechanisms. The
seasonal reversal of winds and the associated response(s) in ocean currents is just one
among the interesting features observed in AS. The warm pool in the South Eastern AS
displays the long lasting warmest water in the world which collapses by the onset of
southwest monsoon (Sanilkumar et al. 2004). The onset of southwest monsoon in AS is
mostly accompanied by a cyclone passage, which brings out intriguing responses in the
upper ocean.
AS experiences two cyclone seasons – one before and another after the southwest
monsoon – with nearly equal chance of occurrence. This chapter deals with the
characteristics of selected cyclones in AS during the period 1997 to 2006 and specifically
addressed with emphasis on the upper ocean response(s) consequent to cyclone passage.
Chapter IV – Upper Ocean Response to Cyclones in Arabian Sea
41
4.2 Data and Method
The cyclone track data from Unisys website during the period 1997 to 2006 has been
utilized to identify the characteristics of the cyclone. The time series buoy data for a
period of two or more weeks starting with 3 to 5 days before the passage of cyclones and
till the end of visible response are utilized in this study. TMI-SST at the location of
maximum intensity (Fig. 4.1) is retrieved for a period of 30 days starting from 10 days
before the day of maximum intensity. The Hovmoller diagrams of TMI-SST and
normalized wave spectra were utilized to identify the variability in ocean response.
The upper ocean response to passage of a cyclone is immediately visible as a change in
wave, surface current and temperature pattern which is studied in detail using various
methods such as progressive vector diagram, rotary spectral analysis and power spectral
analysis. Progressive vector diagram shows the extent of oscillations and mean flow
whereas rotary spectrum exhibits the frequency of oscillations in current observation.
Power spectrum analysis of temperature profile is used to find out the depth up to which
the oceanic response has penetrated.
4.3 Cyclones in AS during 1997 to 2006
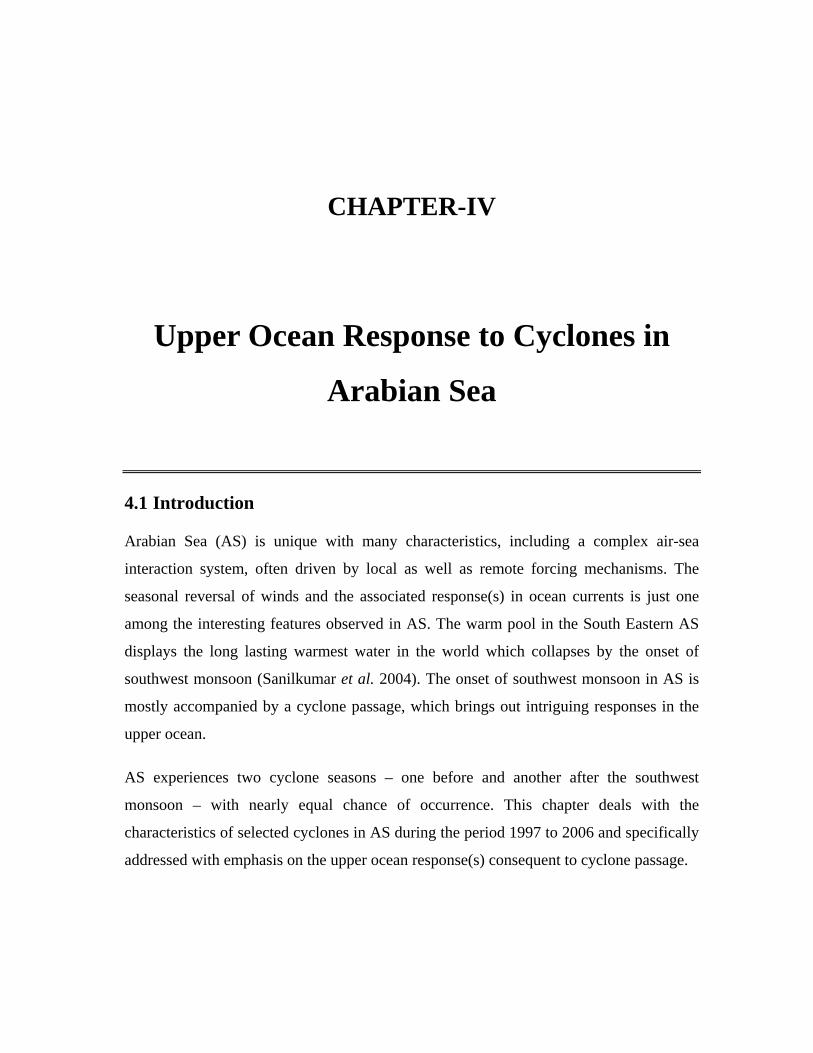
The details of cyclone passage during the study period are analyzed and five of them are
selected based on the availability of buoy data (Table 4.1). One cyclone under the
category cy-1 during post monsoon, one tropical storm and three cy-3 cyclones during
pre-monsoon are studied in detail to understand the variable oceanic response.
55 60 65 70 75 80
55 60 65 70 75 80
5
10
15
20
25
65 70 75 80
65 70 75 80
65 70 75 80
65 70 75 80
65 70 75 80
65 70 75 80
5
10
15
20
25
1-9 Jun 98
DS1 TMI-Data Data Buoy TD TS Cy-1 Cy-2 Cy-3
Lat
itude
(o N)
15-21 May 99
11-17 Dec 98 DS1
Longitude(oE)
05-10 Jun 04
DS1
21-29 May 01
DS1
Fig.4.1: Cyclone tracks, data buoy location and TMI-SST extraction point during various
AS Cyclones
Chapter IV – Upper Ocean Response to Cyclones in Arabian Sea
42
All these cyclones are formed in the area between 10o-13oN, 67o-75oE, in which two
cyclones of the pre-monsoon period (June 1998 and May 1999) were noticed to follow
nearly the same track (Fig. 4.1). The cyclones during the pre-monsoon period made net
movement towards north and made landfall on the northwest coast of India (except the
tropical storm), whereas the one in post monsoon period moved towards northwest and
made landfall on the coast of Oman. The tropical storm observed in June 2004 dissipated
before land fall.
Table 4.1: Details of cyclones utilized in this study
Sl. No. Basin Type Duration Data Availability
1. AS Cy-3 1-9 June1998 DS1& TMI
2. AS Cy-1 11-17 December 1998 DS1& TMI
3. AS Cy-3 15-21 May1999 DS1& TMI
4. AS Cy-3 21-29 May 2001 DS1& TMI
5. AS TS 05-10 June 2004 DS1& TMI
Noticeable, the buoy location is on the right side of the track except during May 2001 and
June 2004. The track was closer to the buoy location (nearly under the track) during May
1999 and far away during December 1998. The cyclone remained near to the buoy
location for a longer duration during May 2001. The cyclone approached the buoy as
category 1 cyclone (cy-1) during June 1998 and May 1999 whereas the cyclone
intensified further into category 2 (cy-2) during May 2001 near the buoy location. The
cyclone category was tropical storm near the buoy location during December 1998 and in
June 2004.
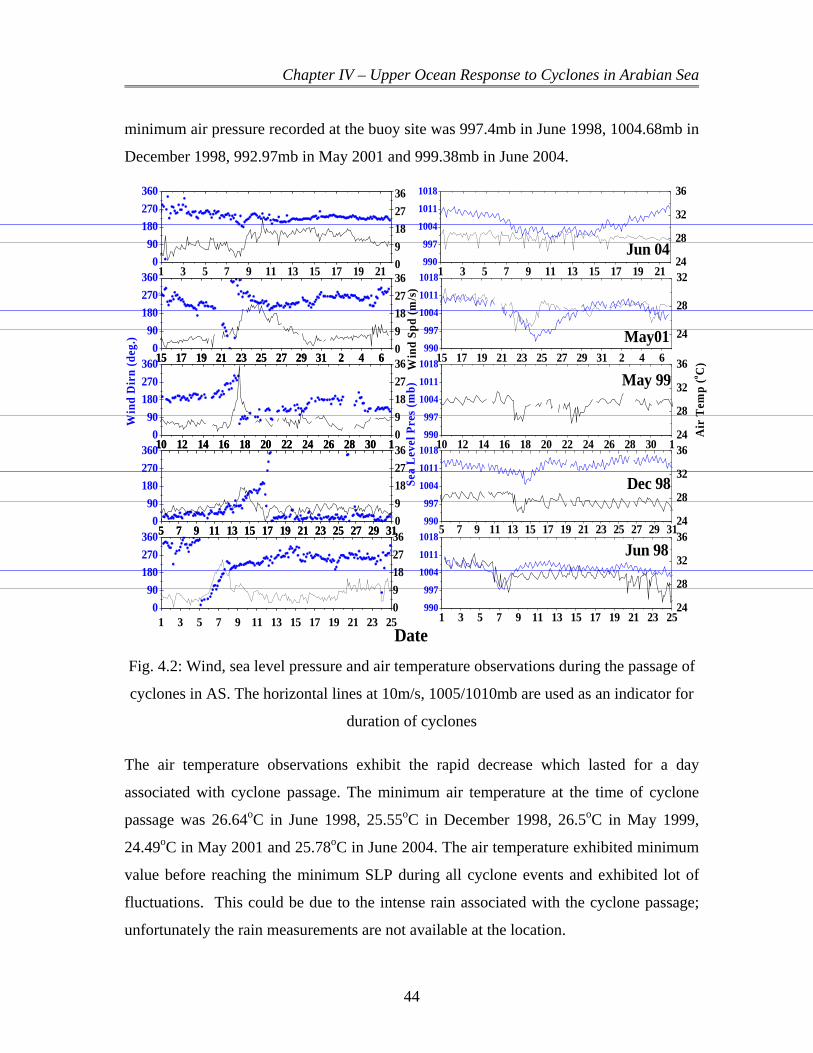
4.4 Observations of Wind, Sea Level Pressure and Air Temperature
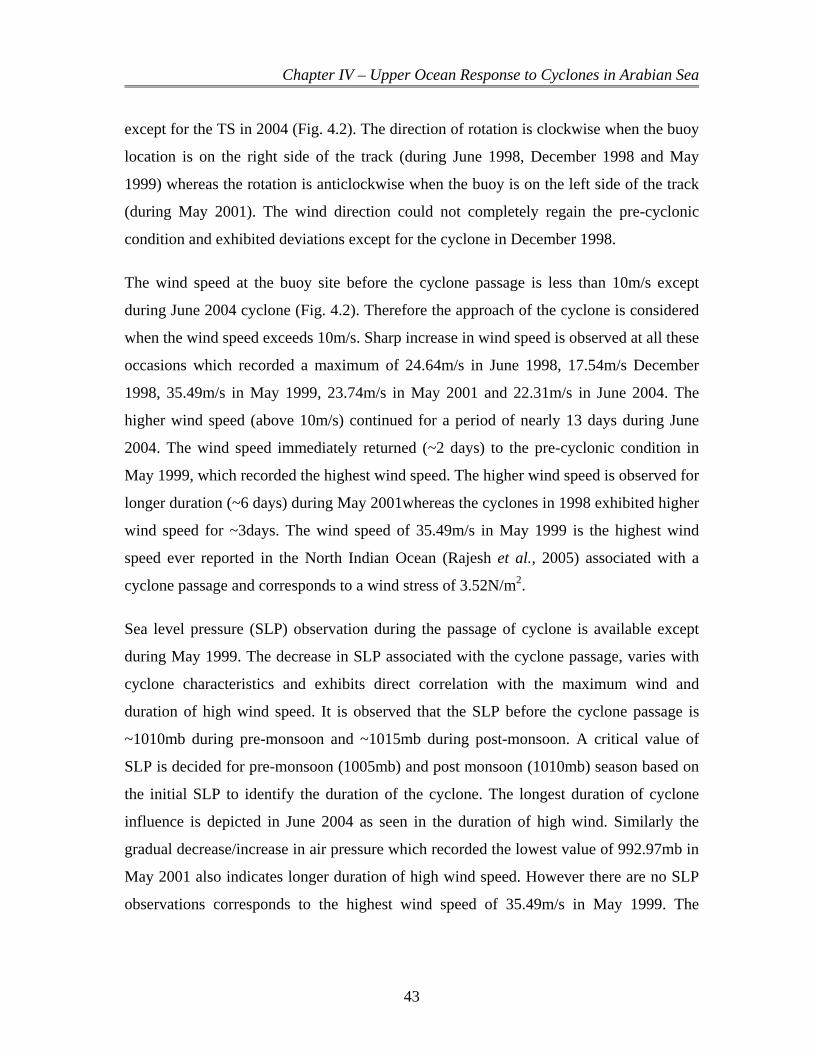
The met-ocean observations from the data buoy during the passage of various cyclones
provided crucial information regarding the cyclone characteristics and its response in the
upper ocean. The wind and air pressure are the major pre-cursors of the approaching
cyclone. The wind direction exhibited slow rotation during the passage of cyclones
Chapter IV – Upper Ocean Response to Cyclones in Arabian Sea
43
except for the TS in 2004 (Fig. 4.2). The direction of rotation is clockwise when the buoy
location is on the right side of the track (during June 1998, December 1998 and May
1999) whereas the rotation is anticlockwise when the buoy is on the left side of the track
(during May 2001). The wind direction could not completely regain the pre-cyclonic
condition and exhibited deviations except for the cyclone in December 1998.
The wind speed at the buoy site before the cyclone passage is less than 10m/s except
during June 2004 cyclone (Fig. 4.2). Therefore the approach of the cyclone is considered
when the wind speed exceeds 10m/s. Sharp increase in wind speed is observed at all these
occasions which recorded a maximum of 24.64m/s in June 1998, 17.54m/s December
1998, 35.49m/s in May 1999, 23.74m/s in May 2001 and 22.31m/s in June 2004. The
higher wind speed (above 10m/s) continued for a period of nearly 13 days during June
2004. The wind speed immediately returned (~2 days) to the pre-cyclonic condition in
May 1999, which recorded the highest wind speed. The higher wind speed is observed for
longer duration (~6 days) during May 2001whereas the cyclones in 1998 exhibited higher
wind speed for ~3days. The wind speed of 35.49m/s in May 1999 is the highest wind
speed ever reported in the North Indian Ocean (Rajesh et al., 2005) associated with a
cyclone passage and corresponds to a wind stress of 3.52N/m2.
Sea level pressure (SLP) observation during the passage of cyclone is available except
during May 1999. The decrease in SLP associated with the cyclone passage, varies with
cyclone characteristics and exhibits direct correlation with the maximum wind and
duration of high wind speed. It is observed that the SLP before the cyclone passage is
~1010mb during pre-monsoon and ~1015mb during post-monsoon. A critical value of
SLP is decided for pre-monsoon (1005mb) and post monsoon (1010mb) season based on
the initial SLP to identify the duration of the cyclone. The longest duration of cyclone
influence is depicted in June 2004 as seen in the duration of high wind. Similarly the
gradual decrease/increase in air pressure which recorded the lowest value of 992.97mb in
May 2001 also indicates longer duration of high wind speed. However there are no SLP
observations corresponds to the highest wind speed of 35.49m/s in May 1999. The
Chapter IV – Upper Ocean Response to Cyclones in Arabian Sea
44
minimum air pressure recorded at the buoy site was 997.4mb in June 1998, 1004.68mb in
December 1998, 992.97mb in May 2001 and 999.38mb in June 2004.
1 3 5 7 9 11 13 15 17 19 210
90180270360
09182736
15 17 19 21 23 25 27 29 31 2 4 60
90180270360
15 17 19 21 23 25 27 29 31 2 4 609182736
10 12 14 16 18 20 22 24 26 28 30 10
90180270360
10 12 14 16 18 20 22 24 26 28 30 109182736
Jun 04
Dec 98
May01
Jun 98
May 99 Win
d Sp
d (m
/s)
5 7 9 11 13 15 17 19 21 23 25 27 29 310
90180270360
Win
d D
irn
(deg
.)
5 7 9 11 13 15 17 19 21 23 25 27 29 3109182736
Date
090
180270360
1 3 5 7 9 11 13 15 17 19 21 23 2509182736
24
28
32
36
1 3 5 7 9 11 13 15 17 19 21990
997
1004
1011
1018
24
28
32
15 17 19 21 23 25 27 29 31 2 4 6990
997
1004
1011
1018
10 12 14 16 18 20 22 24 26 28 30 124
28
32
36
990
997
1004
1011
1018
Sea
Lev
el P
res (
mb)
5 7 9 11 13 15 17 19 21 23 25 27 29 3124
28
32
36
Air
Tem
p (o C
)
990
997
1004
1011
1018
24
28
32
36
1 3 5 7 9 11 13 15 17 19 21 23 25990
997
1004
1011
1018
Fig. 4.2: Wind, sea level pressure and air temperature observations during the passage of
cyclones in AS. The horizontal lines at 10m/s, 1005/1010mb are used as an indicator for
duration of cyclones
The air temperature observations exhibit the rapid decrease which lasted for a day
associated with cyclone passage. The minimum air temperature at the time of cyclone
passage was 26.64oC in June 1998, 25.55oC in December 1998, 26.5oC in May 1999,
24.49oC in May 2001 and 25.78oC in June 2004. The air temperature exhibited minimum
value before reaching the minimum SLP during all cyclone events and exhibited lot of
fluctuations. This could be due to the intense rain associated with the cyclone passage;
unfortunately the rain measurements are not available at the location.

Chapter IV – Upper Ocean Response to Cyclones in Arabian Sea
45
4.5 Wave Observations
The wave observations exhibited calm sea conditions before the cyclone passage. Sharp
increase and a gradual decrease in wave height are observed during most of the cyclones.
The maximum value of significant wave height recorded are; 7.66m in June 1998, 5m in
December 1998, 6.41m in May 1999, 7.81m in May 2001 and 6.72m in June 2004
(Fig. 4.3). The narrow peak in high wind speed during May 1999 is repeated in wave
height as well. Similarly the sustained high wind speed during May 2001 and June 2004
corresponds to high waves for longer duration. An interesting observation is that the
highest wind speed (35.49m/s) in May 1999 does not correspond to the highest wave
height whereas the maximum value of 7.81m is observed for a much smaller wind speed
of 23.74m/s in May 2001. This indicates the importance of duration of wind in generating
oceanic response in waves (Young, 1988; Young and Burchell, 1996 and Young, 2003).
1 3 5 7 9 11 13 15 17 19 210
90
180
270
360
1 3 5 7 9 11 13 15 17 19 21 0
2
4
6
8
15 17 19 21 23 25 27 29 31 2 4 60
90
180
270
360
15 17 19 21 23 25 27 29 31 2 4 60
2
4
6
8
10 12 14 16 18 20 22 24 26 28 30 10
90
180
270
360
10 12 14 16 18 20 22 24 26 28 30 10
2
4
6
8
Wav
e H
t(m
)
Jun 04
Dec 98
May01
Jun 98
May 99
5 8 11 14 17 20 23 26 290
90
180
270
360
Wav
e D
ir (d
eg.)
5 8 11 14 17 20 23 26 290
2
4
6
8
Date
1 3 5 7 9 11 13 15 17 19 21 23 250
90
180
270
360
1 3 5 7 9 11 13 15 17 19 21 23 250
2
4
6
8
1 3 5 7 9 11 13 15 17 19 214
6
8
10
12
15 17 19 21 23 25 27 29 31 2 4 64
6
8
10
12
10 12 14 16 18 20 22 24 26 28 30 14
6
8
10
12
Wave PeriodWave Height
Wav
e Pe
riod
(S)
Wave Direction
5 8 11 14 17 20 23 26 294
6
8
10
12
1 3 5 7 9 11 13 15 17 19 21 23 254
6
8
10
12
Fig. 4.3: Wave observations during the cyclones in AS

Chapter IV – Upper Ocean Response to Cyclones in Arabian Sea
46
The mean wave direction exhibits clockwise rotation during June 1998, December 1998,
May 1999. Slight anticlockwise rotation in wave direction is observed during May 2001,
whereas the wave direction did not exhibit any significant change during June 2004. The
rotation in June 1998 and May 2001 are more rapid and didn’t make complete cycle.
The mean wave direction made a slow and a single cycle during December 1998 whereas
that of May 1999 made many rotations in short period. The buoy was on the right side
and closer to the track during May 1999, which might have lead to the clockwise
rotations in wave direction and resulted in churning up of sea surface. The chaotic sea
state combined with sudden rise and fall of wave height indicates a dangerous sea
condition near the cyclone track. The buoy was located farthest from the cyclone track
during December 1998, which could be the reason for the slow rotation in wave direction.
4.5.1 Wave Spectra
The wave spectrum exhibits the distribution of wave energy as a function of frequency
and direction. 1-D frequency spectra are available during June 2004 and are utilized to
identify the spectral pattern during the passage of cyclone (Fig. 4.4).
WaveSpectra(m2/hz)Above 0.9
0.8 - 0.90.7 - 0.80.6 - 0.70.5 - 0.60.4 - 0.50.3 - 0.40.2 - 0.30.1 - 0.2
0 - 0.1Below 0Undefined Value
00:002004-05-26
00:0005-31
00:0006-05
00:0006-10
00:0006-15
00:0006-20
0.00
0.05
0.10
0.15
0.20
0.25
Freq
uenc
y (H
z)
Fig.4.4: Wave spectra before, during and after the passage of cyclone in June 2004

Chapter IV – Upper Ocean Response to Cyclones in Arabian Sea
47
The spectra are in general single peaked except for the period 27 May to 04 June 2004.
Single peaked spectra with spectral peak around 0.09Hz (11s) is observed in the
beginning. Double peaks in spectra started appearing from 27 May 2004 with a shift in
spectral peak around 0.06 Hz (16s). The shift in spectral peak from 11s to 16s indicates
the dominance of swell component generated by the distant cyclone. The double peaks in
wave spectra represent the contribution from both locally generated sea and the long
swells (Fig. 4.4).
The double peak in wave spectra remained till 04 June with major peak shifting between
sea and swell component. The wave spectra shifted to single peak on 05 June and the
spectral peak exhibits gradual shift from 0.1hz to 0.08Hz during 06 to 9 June. The
spectral energy exhibits considerable increase as the cyclone approaches the buoy
location. The cyclone was closer to the buoy location on 09 June and exhibits spectral
peak at 0.08Hz (12.5s). The spectra remained single peak at 0.08Hz for the remaining
period. The cyclone dissipated on 10 June immediately after crossing the buoy location.
The wave spectra indicates the prevalence of long swells reaching the buoy location
before the cyclone, which changed to sea dominated single peak wave spectra during the
cyclone passage.
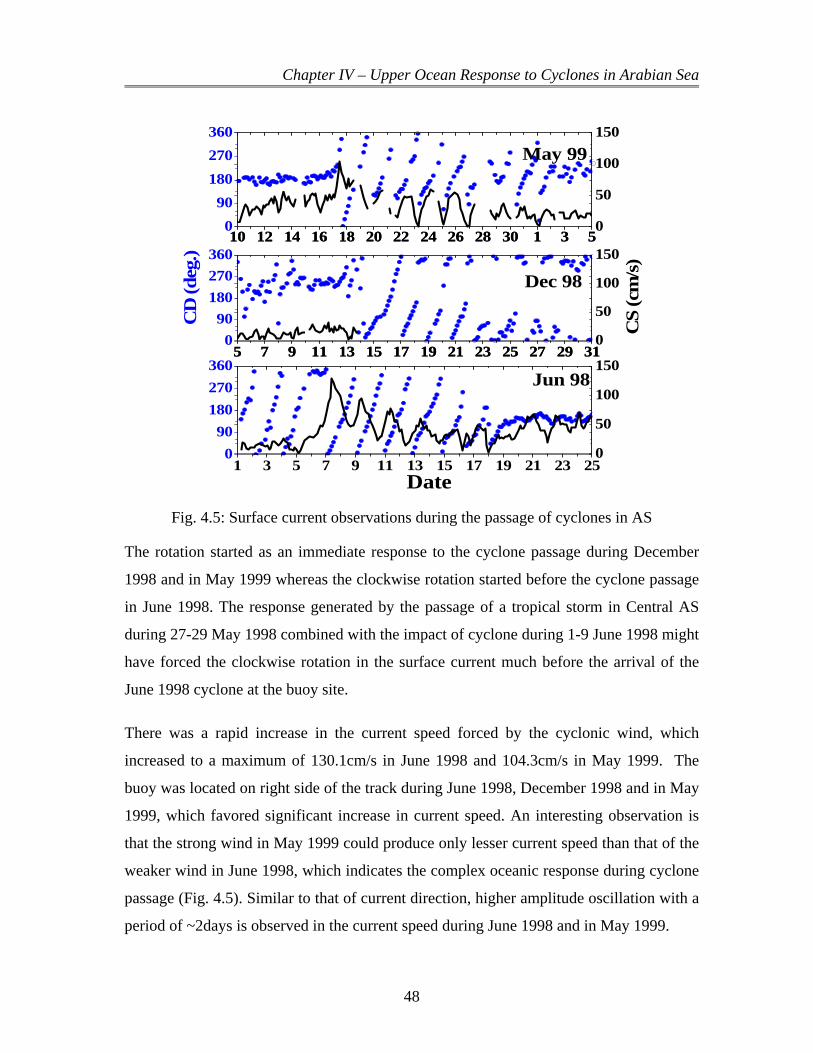
4.6 Surface current
The surface current observations at the buoy location during the passage of cyclones
indicate clockwise rotation with significant increase in current speed (Current speed data
is not available during December 1998 and both current speed and direction are not
available during May 2001). The clockwise rotation observed at the buoy site made
complete circles with a period of ~2days and continued for a longer duration even after
the passage of cyclones (Fig. 4.5). This indicates the dissipation of kinetic energy as
inertial currents which propagate to greater distance (Lien et al., 1996). The current
direction resumed the pre-cyclonic condition after the clockwise rotation.
Chapter IV – Upper Ocean Response to Cyclones in Arabian Sea
48
10 12 14 16 18 20 22 24 26 28 30 1 3 50
90180270360
10 12 14 16 18 20 22 24 26 28 30 1 3 50
50
100
150
CS
(cm
/s)
Dec 98
Jun 98
May 99
5 7 9 11 13 15 17 19 21 23 25 27 29 310
90180270360
CD
(deg
.)
5 7 9 11 13 15 17 19 21 23 25 27 29 310
50
100
150
Date
1 3 5 7 9 11 13 15 17 19 21 23 250
90180270360
0
50
100
150
Fig. 4.5: Surface current observations during the passage of cyclones in AS
The rotation started as an immediate response to the cyclone passage during December
1998 and in May 1999 whereas the clockwise rotation started before the cyclone passage
in June 1998. The response generated by the passage of a tropical storm in Central AS
during 27-29 May 1998 combined with the impact of cyclone during 1-9 June 1998 might
have forced the clockwise rotation in the surface current much before the arrival of the
June 1998 cyclone at the buoy site.
There was a rapid increase in the current speed forced by the cyclonic wind, which
increased to a maximum of 130.1cm/s in June 1998 and 104.3cm/s in May 1999. The
buoy was located on right side of the track during June 1998, December 1998 and in May
1999, which favored significant increase in current speed. An interesting observation is
that the strong wind in May 1999 could produce only lesser current speed than that of the
weaker wind in June 1998, which indicates the complex oceanic response during cyclone
passage (Fig. 4.5). Similar to that of current direction, higher amplitude oscillation with a
period of ~2days is observed in the current speed during June 1998 and in May 1999.
Chapter IV – Upper Ocean Response to Cyclones in Arabian Sea
49
1 3 5 7 9 11 13 15 17 19 21 23 25-100
-50
0
50
100
150
-100
-50
0
50
100
150Jun '98
Cur
Uco
m (c
m/s
)
Date
10 12 14 16 18 20 22 24 26 28 30 1 3 5-150-100-50
050
100150
-150-100-50050100150
May '99
Cur
Vco
m (c
m/s
)
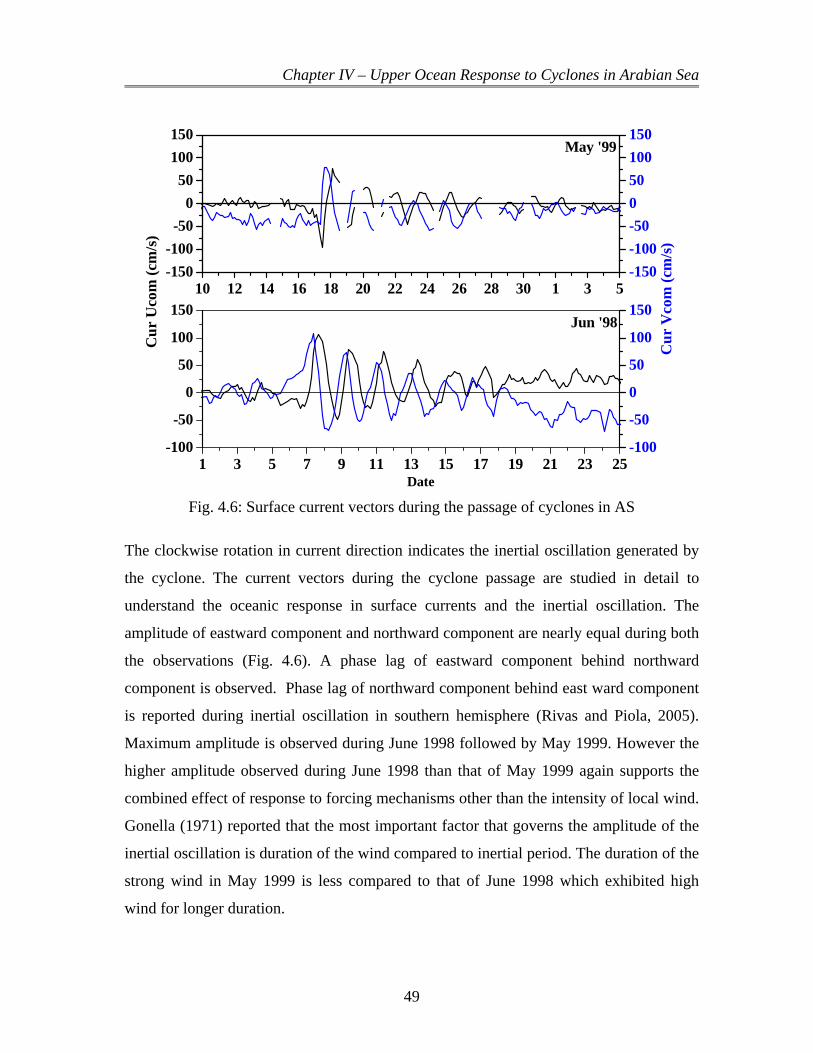
Fig. 4.6: Surface current vectors during the passage of cyclones in AS
The clockwise rotation in current direction indicates the inertial oscillation generated by
the cyclone. The current vectors during the cyclone passage are studied in detail to
understand the oceanic response in surface currents and the inertial oscillation. The
amplitude of eastward component and northward component are nearly equal during both
the observations (Fig. 4.6). A phase lag of eastward component behind northward
component is observed. Phase lag of northward component behind east ward component
is reported during inertial oscillation in southern hemisphere (Rivas and Piola, 2005).
Maximum amplitude is observed during June 1998 followed by May 1999. However the
higher amplitude observed during June 1998 than that of May 1999 again supports the
combined effect of response to forcing mechanisms other than the intensity of local wind.
Gonella (1971) reported that the most important factor that governs the amplitude of the
inertial oscillation is duration of the wind compared to inertial period. The duration of the
strong wind in May 1999 is less compared to that of June 1998 which exhibited high
wind for longer duration.

Chapter IV – Upper Ocean Response to Cyclones in Arabian Sea
50
4.6.1 Progressive vector Diagrams
The progressive vector diagrams indicate the inertial oscillations associated with cyclone
passage. Well-defined circular oscillations are generated by the strong wind forcing
associated with cyclones during June 1998 and in May 1999 (Fig. 4.7). The progressive
vector diagram during June 1998 shows mean eastward flow with five well defined
clockwise rotations during the first two weeks, thereafter the flow is towards southeast.
The theoretical period of the inertial oscillation at the point of observation is 45.3hr and
the inertial radius corresponding to the highest current speed is 33.2km while the
corresponding observed values are 45.0hr and 30.0km respectively.
68 69 70 71 7212
13
14
15
16
17
Jun 98 May 99
Lat
(o N)
Long (oE) Fig. 4.7: Progressive vector diagram during the passage of cyclones in AS
The progressive vector diagram during May 1999 shows the mean flow towards south.
Only one well defined inertial circle is observed during this period. The inertial
oscillation started on 15 May 1999 and lasted till 27 May. The inertial period
corresponding to the latitude of observation is 44.84 hrs whereas the observed period is
45 hrs. The inertial radius corresponding to the maximum current speed of 104.3 cm/s is
26.73km whereas the observed value is 29.0km. The difference between the observed and
the computed values could be due to the coarse sampling interval of three hour.

Chapter IV – Upper Ocean Response to Cyclones in Arabian Sea
51
4.6.2 Rotary spectra
The rotary spectral analysis of the surface current vectors indicates the characteristics of
inertial oscillation generated by the cyclones. A minimum sample size of 10 times the
local inertial period centered during the period of inertial oscillation is used for this
analysis which helps the better identification of the inertial frequency. The rotary
spectrum analysis exhibits significant peak at the inertial band in the negative rotary
component (S-), which agrees well with the theories of clockwise rotation in the northern
hemisphere (Fig. 4.8). There is significant difference between the positive and negative
components where the negative component dominates the spectrum in inertial band. The
rotary coefficient, which indicates the strength of the inertial oscillation at the time of
inertial peak, is negative with high magnitude. It shows that the inertial oscillation
observed at the buoy site is nearly circular in clockwise direction. The inertial peak is
observed slightly higher or lower than the local inertial frequency. The coarse sampling
interval of 3.0hour limits the identification of exact inertial peak.
10-4
10-2
100
102
104
10-3 10-2 10-1 10010-4
10-2
100
102
104
Surface WindSurface CurrentMay 99
June 98
f f
Rot
ary
Spec
trum
((cm
/s)2 /c
ph) SPlus
SMinus STotal
Freq (cph)10-3 10-2 10-1 100
Fig. 4.8: Rotary spectrum of surface current and wind during the passage of June 1998
and May 1999 cyclones in AS
The rotary spectrum analysis of the current in both the observations shows spectral peaks
at inertial frequency with dominant negative rotary component (S-). The observations
during June 1998 and in May 1999 exhibit inertial peak at 0.533cpd (45.0 hr). The
Chapter IV – Upper Ocean Response to Cyclones in Arabian Sea
52
inertial frequency for the latitude of observation is 0.5298cpd (45.3 hr) during June 1998
and that of May 1999 is 0.5352cpd (44.84hr). The inertial period during June 1998
exhibits slightly lesser value than the theoretical period and hence shows a blue shift
whereas that of May exhibits a higher value and hence a red shift (Fig 4.8). Jacobs et. al.
(2001) reported that the blue shift in inertial oscillation is due to the presence of internal
waves. The difference between the observed and local inertial peak are less. Gonella
(1971) suggested that the difference in period/frequency is smallest when the transfer of
momentum is at a maximum due to the homogeneity of the surface layer. The slight
difference shows that the transfer of momentum is at maximum during both the
observations.
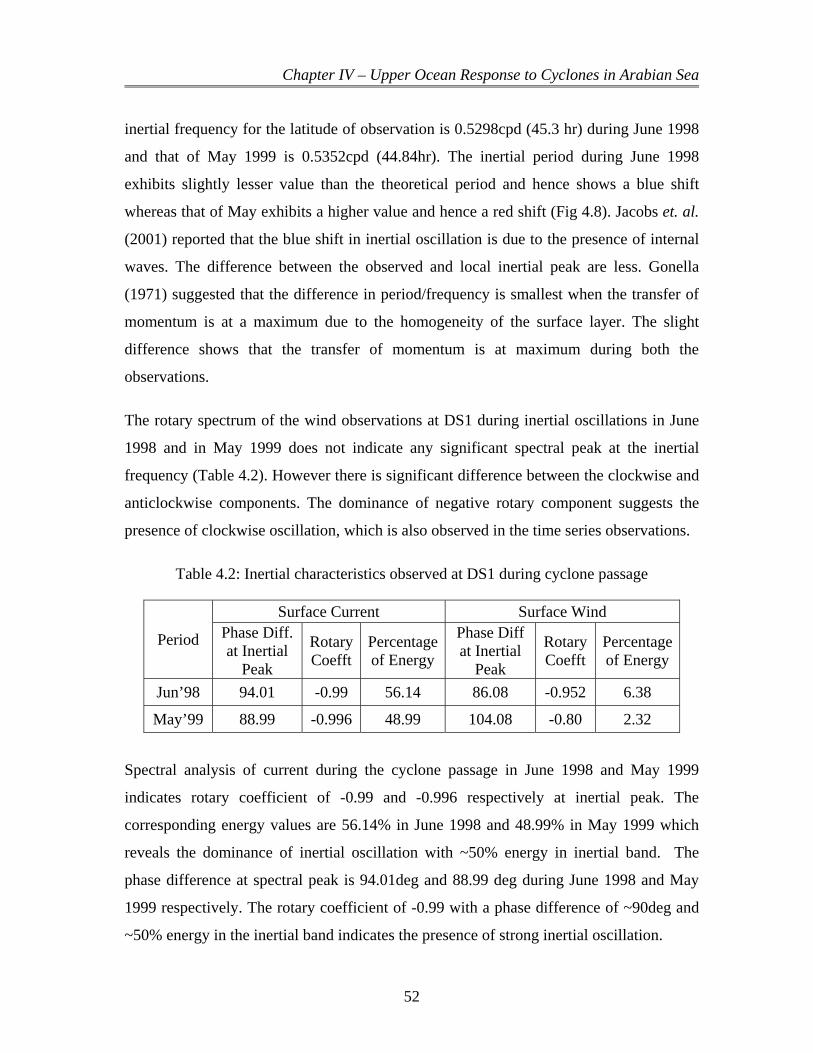
The rotary spectrum of the wind observations at DS1 during inertial oscillations in June
1998 and in May 1999 does not indicate any significant spectral peak at the inertial
frequency (Table 4.2). However there is significant difference between the clockwise and
anticlockwise components. The dominance of negative rotary component suggests the
presence of clockwise oscillation, which is also observed in the time series observations.
Table 4.2: Inertial characteristics observed at DS1 during cyclone passage
Period
Surface Current Surface Wind Phase Diff. at Inertial
Peak
Rotary Coefft
Percentage of Energy
Phase Diff at Inertial
Peak
Rotary Coefft
Percentage of Energy
Jun’98 94.01 -0.99 56.14 86.08 -0.952 6.38
May’99 88.99 -0.996 48.99 104.08 -0.80 2.32
Spectral analysis of current during the cyclone passage in June 1998 and May 1999
indicates rotary coefficient of -0.99 and -0.996 respectively at inertial peak. The
corresponding energy values are 56.14% in June 1998 and 48.99% in May 1999 which
reveals the dominance of inertial oscillation with ~50% energy in inertial band. The
phase difference at spectral peak is 94.01deg and 88.99 deg during June 1998 and May
1999 respectively. The rotary coefficient of -0.99 with a phase difference of ~90deg and
~50% energy in the inertial band indicates the presence of strong inertial oscillation.
Chapter IV – Upper Ocean Response to Cyclones in Arabian Sea
53
4.7 Mixed Layer Temperature
4.7.1 Sea Surface Temperature
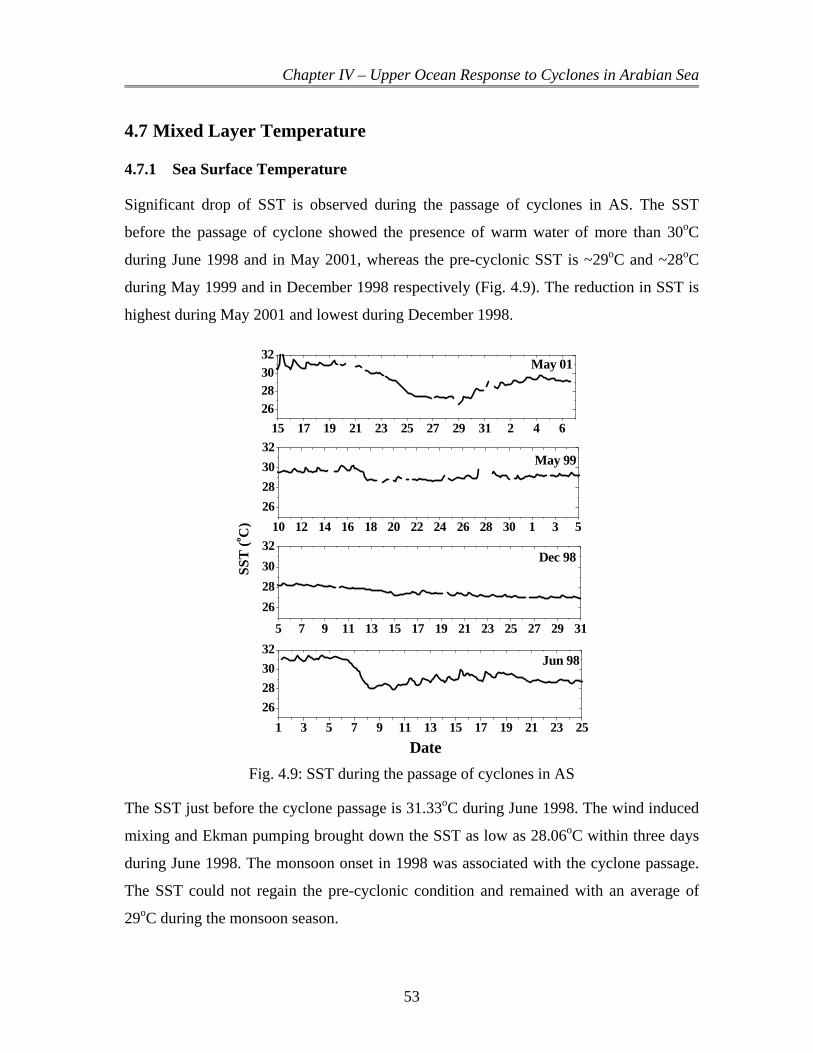
Significant drop of SST is observed during the passage of cyclones in AS. The SST
before the passage of cyclone showed the presence of warm water of more than 30oC
during June 1998 and in May 2001, whereas the pre-cyclonic SST is ~29oC and ~28oC
during May 1999 and in December 1998 respectively (Fig. 4.9). The reduction in SST is
highest during May 2001 and lowest during December 1998.
15 17 19 21 23 25 27 29 31 2 4 626283032
May 01
10 12 14 16 18 20 22 24 26 28 30 1 3 526283032
Date
May 99
SST
(o C)
5 7 9 11 13 15 17 19 21 23 25 27 29 31
26283032
Dec 98
1 3 5 7 9 11 13 15 17 19 21 23 2526283032
Jun 98
Fig. 4.9: SST during the passage of cyclones in AS
The SST just before the cyclone passage is 31.33oC during June 1998. The wind induced
mixing and Ekman pumping brought down the SST as low as 28.06oC within three days
during June 1998. The monsoon onset in 1998 was associated with the cyclone passage.
The SST could not regain the pre-cyclonic condition and remained with an average of
29oC during the monsoon season.

Chapter IV – Upper Ocean Response to Cyclones in Arabian Sea
54
The SST observations during December 1998 did not exhibit much variation. The values
exhibit a steady decreasing trend during the entire reporting period. The SST before the
cyclone passage was 28.18oC, which gradually reduced to 27.23oC after the cyclone
passage. Weaker wind forcing of a short duration could be the reason for less reduction in
SST during December 1998.
The SST before cyclone passage was 29.96oC on 16 May 1999, which reached a
minimum of 28.55oC on 17 May. Even though the cyclone was intense with wind speed
of 35.49m/s near the buoy, the cooling observed in SST is only 1.41oC, much less than
that observed in June 1998. Even though the wind forcing was strong, the short duration
could be the reason for the comparatively lesser cooling in SST.
The maximum SST observed at the location was 30.92oC on 19 May 2001. SST dropped
by 4.4oC, reaching a minimum of 26.52oC on 29 May (Fig. 4.9). Even though the wind
forcing was not as high as that of June 1998 and May 1999, the continuous high wind
stress from 23rd to 27th enhanced the mixing of the water column and resulted in the
significant drop of SST. This supports the importance of duration of strong wind in ocean
response.
It is observed that the reduction in SST greatly depends on the duration of the strong
wind (Price, 1981). The buoy was on the right side, closer to the track during May 1999
and again, was on the right side of the track during June 1998 as well in December 1998.
But the maximum reduction in SST is observed during May 2001; in this case, the buoy
was located on the left side of the track. It is also noted that the lesser cooling in SST
associated with cyclone passage is coincident with lower pre-cyclonic SST.
4.7.2 Subsurface Variability in Temperature
Time series observations of temperature profile during June 1998 show the pre-monsoon
warming of SST to more than 30oC and the sudden deepening of the mixed layer
associated with the passage of cyclone. The mixed layer depth (MLD) is computed as the
depth at which a reduction of 0.5oC from SST is observed (Levitus, 1982). The pre-

Chapter IV – Upper Ocean Response to Cyclones in Arabian Sea
55
cyclone MLD at the buoy site was ~20m which became ~50m by 9 June due to the
intense mixing associated with cyclone passage. It also exhibits near inertial oscillation in
the deeper layers after the cyclone passage (Fig. 4.10).
Fig. 4.10: Vertical distribution of temperature before, during and after the passage of
cyclone in June 1998
The response to the wind stress during the forced stage and that of wind stress curl during
the relaxation stage brought about substantial cooling of the SST and mixed layer
resulting in significant increase in the MLD (Price et al., 1994). Very high pre-cyclonic
SST combined with a very thin MLD could have been the reason for the significant
deepening of MLD in AS. The energy of the mixed layer currents are dispersed as near
inertial frequency internal waves and inertial currents which lasted for two weeks.
The temperature observations exhibit the warming of seawater during the pre-monsoon
period, which acquires a maximum of more than 31oC and collapses after the cyclone
passage at the buoy site (Fig 4.10). A sudden decrease in temperature up to a depth of
27m and increase in temperature at deeper levels due to the wind induced mixing
associated with cyclone passage is observed.
Chapter IV – Upper Ocean Response to Cyclones in Arabian Sea
56
1E-3
0.01
0.1
1
10
1E-3
0.01
0.1
1
10
1E-3
0.01
0.1
1
10
1E-3
0.01
0.1
1
10
1E-3 0.01 0.11E-3
0.01
0.1
1
10
1E-3 0.01 0.1 1E-3 0.01 0.1
Ene
rgy
((o C
)2 /cph
)
7m2m 12m
17m 22m 27m
32m 37m 42m
47m 52m 57m
72m
Freq (cph)
92m 122m
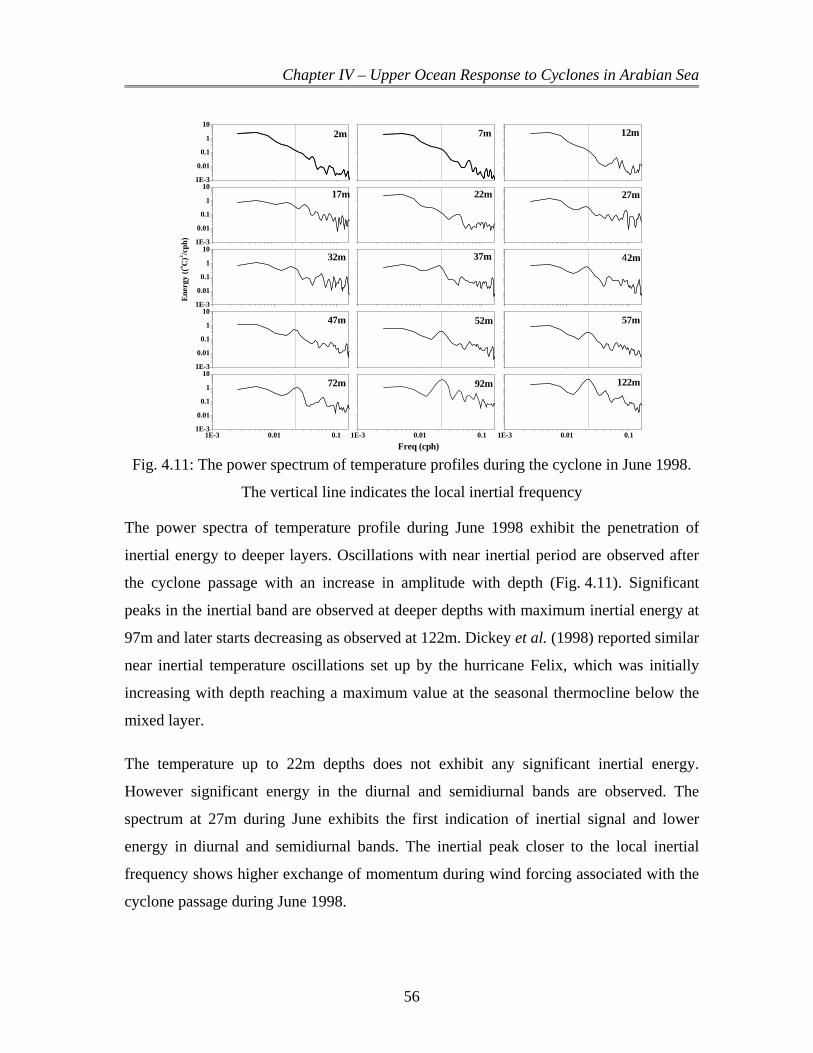
Fig. 4.11: The power spectrum of temperature profiles during the cyclone in June 1998.
The vertical line indicates the local inertial frequency
The power spectra of temperature profile during June 1998 exhibit the penetration of
inertial energy to deeper layers. Oscillations with near inertial period are observed after
the cyclone passage with an increase in amplitude with depth (Fig. 4.11). Significant
peaks in the inertial band are observed at deeper depths with maximum inertial energy at
97m and later starts decreasing as observed at 122m. Dickey et al. (1998) reported similar
near inertial temperature oscillations set up by the hurricane Felix, which was initially
increasing with depth reaching a maximum value at the seasonal thermocline below the
mixed layer.
The temperature up to 22m depths does not exhibit any significant inertial energy.
However significant energy in the diurnal and semidiurnal bands are observed. The
spectrum at 27m during June exhibits the first indication of inertial signal and lower
energy in diurnal and semidiurnal bands. The inertial peak closer to the local inertial
frequency shows higher exchange of momentum during wind forcing associated with the
cyclone passage during June 1998.
Chapter IV – Upper Ocean Response to Cyclones in Arabian Sea
57
4.8 Spatial and Temporal Variability in Temperature
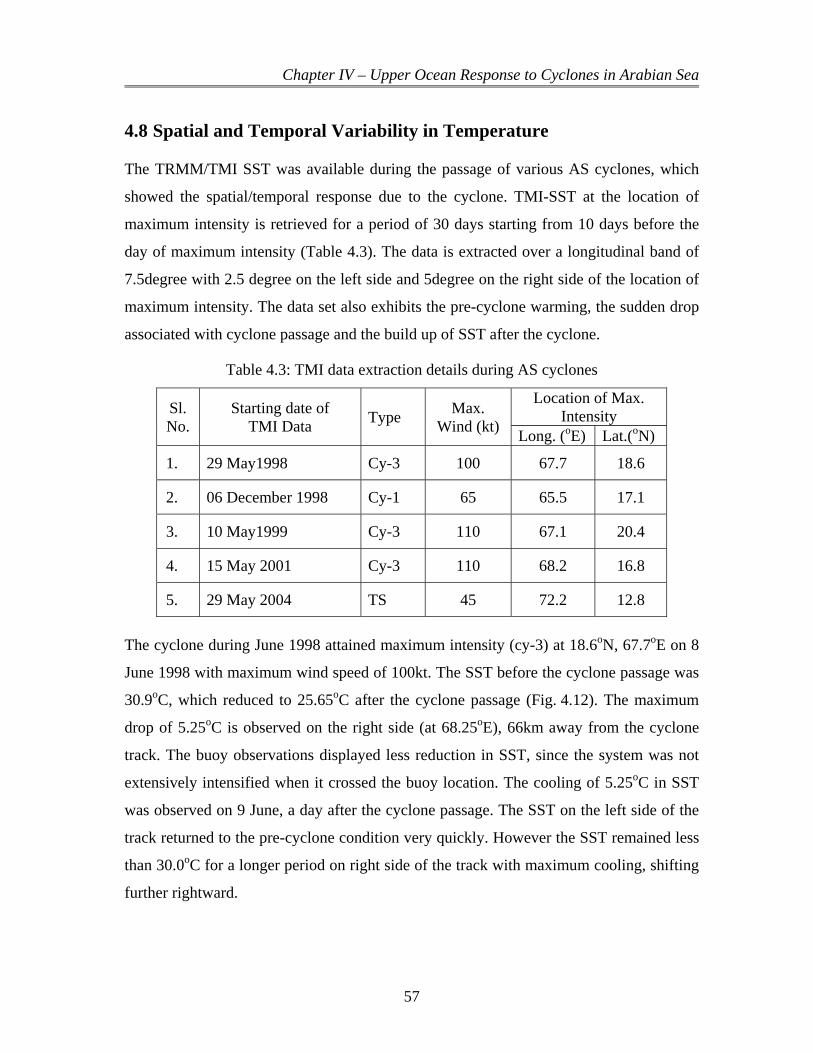
The TRMM/TMI SST was available during the passage of various AS cyclones, which
showed the spatial/temporal response due to the cyclone. TMI-SST at the location of
maximum intensity is retrieved for a period of 30 days starting from 10 days before the
day of maximum intensity (Table 4.3). The data is extracted over a longitudinal band of
7.5degree with 2.5 degree on the left side and 5degree on the right side of the location of
maximum intensity. The data set also exhibits the pre-cyclone warming, the sudden drop
associated with cyclone passage and the build up of SST after the cyclone.
Table 4.3: TMI data extraction details during AS cyclones
Sl. No.
Starting date of TMI Data Type Max.
Wind (kt)
Location of Max. Intensity
Long. (oE) Lat.(oN)
1. 29 May1998 Cy-3 100 67.7 18.6
2. 06 December 1998 Cy-1 65 65.5 17.1
3. 10 May1999 Cy-3 110 67.1 20.4
4. 15 May 2001 Cy-3 110 68.2 16.8
5. 29 May 2004 TS 45 72.2 12.8
The cyclone during June 1998 attained maximum intensity (cy-3) at 18.6oN, 67.7oE on 8
June 1998 with maximum wind speed of 100kt. The SST before the cyclone passage was
30.9oC, which reduced to 25.65oC after the cyclone passage (Fig. 4.12). The maximum
drop of 5.25oC is observed on the right side (at 68.25oE), 66km away from the cyclone
track. The buoy observations displayed less reduction in SST, since the system was not
extensively intensified when it crossed the buoy location. The cooling of 5.25oC in SST
was observed on 9 June, a day after the cyclone passage. The SST on the left side of the
track returned to the pre-cyclone condition very quickly. However the SST remained less
than 30.0oC for a longer period on right side of the track with maximum cooling, shifting
further rightward.

Chapter IV – Upper Ocean Response to Cyclones in Arabian Sea
58
The cyclone attained maximum intensity (Cyclone-1) at 17.1oN, 65.5oE on 15 December
1998 with a maximum wind speed of 65kt. The TMI-SST exhibited maximum drop of
2.4oC, which is observed at 66oE, 55km away on the right side of the track (Fig. 4.12).
The cooling remained at this location for a longer period compared to earlier events. The
DS1 buoy was far away (330km) from the cyclone track and the observed cooling was
only ~1oC. However this exhibits the wide spread effect of cyclone passage. It can also
be inferred that post monsoon cyclones in AS produce noticeable cooling even though the
magnitude of cooling is less than that of pre-monsoon cyclones.
a b c d e
Fig. 4.12: 30 days Hovmoller diagram of SST before, during and after the passage of AS
cyclones in a) Jun'98, b) Dec'98, c)May'99, d)May'01 and e) Jun'04
The cyclone during May 1999 attained maximum intensity (Cyclone-3) at 20.4oN, 67.1oE
on 19 May 1999 with maximum wind speed of 110kt. The TMI-SST from 10 May to 08
June 1999 exhibit the intense cooling associated with the cyclone passage and its spatial
coverage (Fig. 4.12). It can be noted that the maximum cooling of 5.5oC was observed at
72km (67.75oE) away on the right side of the track. The spatial and temporal coverage of
the cooling is extensive which lasted for 10 days over a longitudinal belt of 275km.
However the buoy reported lesser cooling due to lower intensity (Cyclone-1) of the
cyclone near the buoy location.

Chapter IV – Upper Ocean Response to Cyclones in Arabian Sea
59
The Arabian Sea cyclone in May 2001 is peculiar for being practically stationary at a
location for a longer period after intensifying into cyclone-3. The cyclone during May
2001 attained maximum intensity (Cyclone-3) at 16.8oN, 68.2oE on 24 May 2001 with
maximum wind speed of 110kt. TMI-SST was more than 30.6°C before the cyclone
passage and started decreasing as the cyclone intensified (Figure 4.12). The maximum
cooling of 7.5oC with lowest SST of 22.8°C was observed around 68.25oE near the
cyclone track; this is attributed to the slow transition towards northeast during that period.
Price (1981) also reported less rightward bias in cooling for slow moving cyclones.
The cyclone during June 2004 did not intensify beyond the category of tropical storm.
The time series SST for the Hovmoller diagram is extracted along the longitudinal belt at
12.8oN, 72.2oE. The corresponding maximum wind speed is only 45kt. The cooling
observed at this location is much less compared to other cyclones, attributed to the low
intensity.
The AS had experienced three cyclones (June 1998, May 1999 and May 2001) with
similar intensity (cy-3); however the associated cooling indicates a different picture. The
maximum cooling observed during May 2001 (7.5oC) is much higher than that of June
1998 (~5.25oC) and May 1999 (~5.5oC). A lag of approximately one day is observed
between maximum cyclone intensity and maximum cooling in AS, again with maximum
lag during May 2001. This indicates the role of factors other than the intensity in
determining the oceanic response. The May 2001 cyclone belong to the category of slow
moving cyclones with a speed of 2.34m/s whereas the speed of the other systems were
4.93m/s (June 1998) and 3.59m/s (May 1999). This supports the findings of Price et al.
(1981) on higher upper ocean responses to slow moving cyclones.
4.9 Results and Discussion
The upper ocean response(s) to cyclones in AS, importantly, exhibits significant
variability. The importance of (relative) location and proximity to cyclone track are
evident in various met-ocean parameters. The wind direction exhibits only one rotation
with period increasing with distance from the cyclone track whereas the speed decreases
Chapter IV – Upper Ocean Response to Cyclones in Arabian Sea
60
as it move away from the track. The waves are in resonance with wind on both sides of
the track and exhibits higher response on the right side of the track. The current direction
rotates with near inertial period, whereas the period of rotation in wave direction
increases as it moves away from the track as observed during December 1998. The wave
spectra during the cyclone indicates double peak before the arrival of the storm and
exhibits single peak during the cyclone passage. The double peak indicates the co-
existence of sea waves and long swells. The single peak during the cyclone passage
indicates the dominance of sea waves over long swells.
The wave height and current speed depends on the relative location of observation and
the duration/cyclone translation speed with maximum response to slow moving cyclones.
The inertial oscillation is observed in surface current and in the mixed layer temperature.
The inertial peak closer to the local inertial period indicates maximum transfer of energy
during the cyclone passage. The inertial energy increases with depth in temperature and
reaches maximum at depth of 97m and thereafter the inertial energy decreases. This
indicates the propagation of inertial energy into deeper layers below the mixed layer
which reaches maximum at thermocline region (Dick et al., 1998 and Lien et al., 1996).
Significant effect on the upper ocean due to the passage of a cyclone is the noticeable
cooling in the SST. The time evolution of the enhanced wind mixing and the resulting
drop in SST is demonstrated in the moored buoys and satellite observations. It is
observed that the intensity of cyclones are more during pre-monsoon in AS. The
Cyclones during the post-monsoon season also generate noticable response in upper
ocean, but to a lesser magnitude. The presence of warm SST (> 28oC) before the cyclone
formation and the cooling due to intense mixing brings out significant changes in upper
ocean. Maximum buoy observed cooling is 4.4oC at DS1 associated with AS cyclone
during May 2001. The highest wind speed observed at the buoy site was 35.49m/s at DS1
during AS cyclone in May 1999, which could produce a cooling of 1.41oC only. The May
2001 cyclone belong to the slow moving whereas the May 1999 cyclone belongs to the
category of moderate speed cyclone. It supports the fact that slowly moving cyclones

Chapter IV – Upper Ocean Response to Cyclones in Arabian Sea
61
induce higher response than that of fast moving cyclones. It is also observed that the
cooling in AS during a post monsoon cyclone is significant.
The detailed analysis of the oceanic response during various cyclones indicates the major
factors that control the upper ocean response. The duration of the strong wind and the
cyclone translation speed are important factors controlling the oceanic response(s). It is
observed that the most important factor controlling the SST response is the duration of
the strong wind. Another important factor is the relative location with the cyclone track,
with maximum response near right side of the track. The oceanic response closer to the
track reports chaotic sea state with waves from all directions combined with sudden rise
and fall of wave height. However the corresponding oceanic response exhibits lesser
response in wave height, cooling and current speed. The asymmetric response of surface
wind is well depicted in the buoy observations and the period of rotation of wind
increases with distance from the track. The cyclone passage generates near inertial
currents which contributes to the mixed layer dynamics.