Embed Size (px)
Citation preview
Submitted to: Pennsylvania Public Utility Commission Submitted by:
November 30, 2015 Revised February 12, 2016 Revised December 17, 2019
PECO Exhibit No. 1 PECO PROGRAM YEARS 2016-2020
ACT 129 - PHASE III ENERGY EFFICIENCY AND CONSERVATION PLAN

PECO PY 2016-2020 Act 129 - Phase III Energy Efficiency And Conservation Plan Page 1
Table of Contents
Introduction ........................................................................................................................... 6
Features and Benefits of PECO’s Phase III Plan ........................................................................................ 7
1. Overview of Plan .......................................................................................................... 9
1.1 Summary Description of Plan, Objectives, and Overall Strategy ................................................. 9 1.2 Summary Description of Process Used to Develop the Phase III Plan ...................................... 10 1.3 Summary Tables of Portfolio Savings Goals, Budget and Cost-Effectiveness .......................... 13 1.4 Summary of Program Implementation .......................................................................................... 21 1.5 Summary Description of PECO’s Strategy to Acquire No Less Than 15% Savings Each
Program Year ..................................................................................................................................... 22 1.6 Summary Descriptions of PECO’s Implementation Strategy to Manage the EE&C Portfolio
and Engage Customers and Trade Allies....................................................................................... 22 1.7 Summary Description of PECO’s Data Management, Quality Assurance, and Evaluation
Processes ............................................................................................................................................. 23 1.8 Summary Description of Cost Recovery Mechanism................................................................... 24
2. Energy Efficiency and Demand Response Portfolio / Program Summary Tables
and Charts .................................................................................................................... 25
2.1 Residential, Small C&I, Large C&I and G/E/NP Portfolio Summaries ...................................... 25 2.2 Plan Data: Costs, Cost-Effectiveness and Savings by Program, Sector and Portfolio ............. 30 2.3 Budget and Parity Analysis ............................................................................................................. 30
3. Program Descriptions ................................................................................................. 31
3.1 Discussion of Criteria and Process Used for Selection of Programs .......................................... 31 3.1.1 Portfolio Objectives and Metrics that Define Program Success.................................... 31 3.1.2 Process for Program Development ................................................................................... 31 3.1.3 How Energy Efficiency and Demand Response Measures Were Included in the
Portfolio ................................................................................................................................ 33 3.1.3.1 Treatment of Measures in the Portfolio of Programs ........................................... 33 3.1.3.2 Identification of Measures ................................................................................... 33 3.1.3.3 Applicability and Qualitative Screens ................................................................. 33 3.1.3.4 Economic Screen .................................................................................................. 34
3.1.4 Comprehensiveness of Measures ..................................................................................... 34 3.2 Individual Program Descriptions ................................................................................................... 35
3.2.1 Residential Programs ......................................................................................................... 35 3.2.1.1 Residential Energy Efficiency Program, (Exclusive of Low-Income) .................. 35 3.2.1.2 Low-Income Energy Efficiency Program ............................................................. 44
3.2.2 Commercial and Industrial Programs ............................................................................. 54 3.2.2.1 Small Commercial and Industrial Energy Efficiency Program ........................... 54 3.2.2.2 Large Commercial and Industrial Energy Efficiency Program ........................... 63 3.2.2.3 PECO Combined Heat and Power Program ........................................................ 71
3.2.3 Demand Response Programs ............................................................................................ 80 3.2.3.1 Residential Demand Response Program .............................................................. 80 3.2.3.2 Small Commercial and Industrial Demand Response Program .......................... 87
PECO PY 2016-2020 Act 129 - Phase III Energy Efficiency And Conservation Plan Page 2
3.2.3.3 Large Commercial and Industrial Demand Response Program .......................... 94
4. Program Management and Implementation Strategies ......................................... 99
4.1 Overview of PECO Management and Implementation Strategies ............................................. 99 4.1.1 Types of services offered by PECO and other parties ................................................... 99 4.1.2 Risk categories and risk mitigation strategies ................................................................. 99
4.1.2.1 Performance Risk ................................................................................................. 99 4.1.2.2 Technology Risk ................................................................................................. 100 4.1.2.3 Market Risk........................................................................................................ 100 4.1.2.4 Evaluation Risk .................................................................................................. 101
4.1.3 Human resource and contractor resource constraints ................................................. 101 4.1.4 Early warning systems to indicate progress towards goals and process for
adjustment ......................................................................................................................... 101 4.1.5 Implementation schedules with milestones .................................................................. 102 4.1.6 Stakeholder Engagement ................................................................................................. 102
4.2 Executive Management Structure ................................................................................................. 102 4.2.1 PECO Structure for Addressing Portfolio Strategy ...................................................... 102 4.2.2 Approach for overseeing the performance of CSPs and other providers ................. 104 4.2.3 Basis for Administrative Budget ..................................................................................... 104
4.3 Conservation Service Providers (CSPs) ....................................................................................... 105 4.3.1 Selected CSPs ..................................................................................................................... 105 4.3.2 Describe the work and measures being performed by CSPs ...................................... 105 4.3.3 Describe any pending RFPs to be issued for additional CSPs .................................... 105
5. Reporting and Tracking Systems ........................................................................... 106
5.1 Reporting .......................................................................................................................................... 106 5.1.1 Data Submissions .............................................................................................................. 107
5.2 Project Management Tracking Systems ....................................................................................... 107 5.2.1 Data Tracking System Overview .................................................................................... 107 5.2.2 Software Format, Data Exchange Format and Database Structure ............................ 108 5.2.3 Access for Commission and Statewide Plan Evaluator ............................................... 109
6. Quality Assurance and Evaluation, Measurement and Verification ................. 111
6.1 Quality Assurance/Quality Control .............................................................................................. 111 6.1.1 Overall Approach to Quality Assurance/Quality Control .......................................... 111 6.1.2 Procedures for Measure and Project Installation Verification, QA/QC and Savings
Documentation .................................................................................................................. 112 6.1.3 Process for Collecting and Addressing Participant, Contractor and Trade Ally
Feedback............................................................................................................................. 112 6.2 Market and Process Evaluations ................................................................................................... 113 6.3 Strategy for Coordinating with Statewide Evaluator ................................................................. 113
7. Cost Recovery Mechanism ...................................................................................... 114
7.1 Total Annual Revenues for Phase III ............................................................................................ 114 7.2 Description of Phase III Plan in Accordance with 66 Pa. C.S. § 1307 and 2806.1 ................... 114 7.3 Data Tables ....................................................................................................................................... 115 7.4 Tariffs and Section 1307 Cost Recovery Mechanism for Phase III Plan ................................... 115
7.4.1 Tariffs .................................................................................................................................. 115 7.4.2 Cost Recovery Mechanism .............................................................................................. 115 7.4.3 True-Up .............................................................................................................................. 116

PECO PY 2016-2020 Act 129 - Phase III Energy Efficiency And Conservation Plan Page 3
7.5 Cost Allocation and Recovery Period .......................................................................................... 117 7.6 Accounting for Phase III Costs versus Prior Phase Costs .......................................................... 117
8. Cost-Effectiveness ..................................................................................................... 118
8.1 Description of Application of the TRC Analysis ........................................................................ 118 8.1.1 Cost-Effectiveness Analysis Approach .......................................................................... 118 8.1.2 Avoided Costs ................................................................................................................... 118
8.1.2.1 Energy Prices ..................................................................................................... 118 8.1.2.2 Capacity Prices .................................................................................................. 119 8.1.2.3 Transmission and Distribution ......................................................................... 119
8.2 Data Tables ....................................................................................................................................... 120
9. Plan Compliance Information and Other Key Issues .......................................... 121
9.1 Plan Compliance ............................................................................................................................. 121 9.1.1 Description of Plan ........................................................................................................... 121 9.1.2 Statement Delineating the EE&C Plan ........................................................................... 121 9.1.3 Low-Income requirements............................................................................................... 121 9.1.4 Government/Education/Non-Profit requirements ....................................................... 121 9.1.5 Spending on experimental equipment or devices limited to two percent ................ 121 9.1.6 Competitively neutral to all electric distribution customers ...................................... 122
9.2 Other Key Issues.............................................................................................................................. 122 9.2.1 Describe how this EE&C Plan will lead to long-term, sustainable energy efficiency
savings in the EDC’s service territory and in Pennsylvania ....................................... 122 9.2.2 Describe how this EE&C Plan will leverage and utilize other financial resources,
including funds from other public and private sector energy efficiency and solar energy programs ............................................................................................................... 122
9.2.3 Describe how the EDC will address customer education for its programs .............. 122 9.2.4 Indicate how the EDC will provide a list of all eligible federal and state funding
programs available to ratepayers for energy efficiency and conservation ............... 122 9.2.5 Describe how the EDC will provide the public with information about the results
from the programs ............................................................................................................ 123
Appendix A. PECO Electricity Consumption Forecast ........................................... 124
Appendix B. CSP Contract(s) ..................................................................................... 125
Appendix C. Program by Program Savings and Costs for Each Program Year ... 126
Tables C-1 to C-4: Program Cost Data .................................................................................................... 126 Tables C-5 to C-10: TRC Benefits Tables ................................................................................................. 130
Appendix D. Calculation Methods and Assumptions ............................................ 140
D.1 Total Resource Cost Test Calculation Methods .......................................................................... 140 D.2 Seasonal Avoided Costs for Electricity ........................................................................................ 143 D.3 Seasonal End-Use Load Shapes ..................................................................................................... 145
Appendix E. Measure Level Details .......................................................................... 148
Appendix F. Exhibits RAS ......................................................................................... 206

PECO PY 2016-2020 Act 129 - Phase III Energy Efficiency And Conservation Plan Page 4
Appendix G. Glossary ...................................................................................................... 207
List of Figures and Tables
Figures: Figure 1. Phase III Plan Development Process ................................................................................................... 12 Figure 2: PECO Phase III PY 2016-2020 Energy Efficiency and Demand Response Portfolio Structure .... 14 Figure 3. Major Program Implementation Milestones ...................................................................................... 21 Figure 4: Program Documentation and Measurement, Verification and Evaluation Framework .............. 23 Figure 5: Process for Developing Energy Efficiency and Demand Response Programs .............................. 32 Figure 6. Implementation Schedule ................................................................................................................... 102 Figure 7. PECO Proposed EE&C Organization ................................................................................................ 103 Tables: Table 1. Summary Overview .................................................................................................................................. 9 Table 2. PECO EE and DR Program Summary – Phase III Energy Savings and Acquisition Costs ........... 15 Table 3. PECO EE and DR Program Summary – Phase III Demand Savings ................................................ 16 Table 4. PECO EE and DR Program Summary – Phase III Budget and Total Participants .......................... 17 Table 5. Portfolio Summary of Lifetime Costs and Benefits of Energy Efficiency Measures ....................... 18 Table 6. Portfolio Summary of Lifetime Costs and Benefits of Demand Response Measures ..................... 18 Table 7. Summary of Portfolio Energy and Demand Savings .......................................................................... 19 Table 8. Summary of Portfolio Costs ................................................................................................................... 20 Table 9. Program Summaries ................................................................................................................................ 25 Table 10. Budget and Parity Analysis Summary (PY 2016-2020) ..................................................................... 30 Table 11. Administrative Costs 2016-2020 ($M) ............................................................................................... 104 Table 12. RFPs for Phase III Implementation Services .................................................................................... 105 Table 13. Calculation of 2006 Annual Revenue ................................................................................................ 114 Table 14. Periods for Energy and Coincident Peak Demand Savings ........................................................... 119 Table C-1. Portfolio-Specific Assignment of EE&C Costs1 .............................................................................. 126 Table C-2. Allocation of Common Costs to Applicable Customer Sector2 ................................................... 127 Table C-3. Summary of Portfolio EE&C Costs ($M) 1 ...................................................................................... 127 Table C-4. Summary of Programs Cost by Year ............................................................................................... 128 Table C-5. Gross TRC Benefits Table ................................................................................................................. 130 Table C-6. Net TRC Benefits Table ..................................................................................................................... 133 Table C-7. Residential Low Income TRC Benefits Table ................................................................................. 136 Table C-8. Residential (Exclusive of Low-Income) TRC Benefits Table ........................................................ 137 Table C-9. Small C&I TRC Benefits Table ......................................................................................................... 138 Table C-10. Large C&I TRC Benefits Table ....................................................................................................... 139 Table D-1. Avoided Costs for Electricity ($/kWh) ............................................................................................ 143 Table D-2. Avoided Costs for Non-Electricity Benefits ................................................................................... 144 Table D-3. End-Use Load Shapes ....................................................................................................................... 145 Table E-1. Residential EE Program Measure Level Details ............................................................................. 148 Table E-2. Low-Income EE Program Measure Level Details .......................................................................... 157 Table E-3. Small C&I EE Program Measure Level Details .............................................................................. 168 Table E-4. Large C&I EE Program Measure Level Details .............................................................................. 186 Table E-5. CHP Program Measure Level Details.............................................................................................. 204
PECO PY 2016-2020 Act 129 - Phase III Energy Efficiency And Conservation Plan Page 5
Table E-6. Residential DR Program Measure Level Details ............................................................................ 205 Table E-7. Small C&I DR Program Measure Level Details ............................................................................. 205 Table E-8. Large C&I DR Measure Level Details ............................................................................................. 205
PECO PY 2016-2020 Act 129 - Phase III Energy Efficiency And Conservation Plan Page 6
Introduction
PECO’s Phase III portfolio is the evolution of PECO’s Phases I and II plan models towards a more comprehensive and customer centric portfolio of energy solutions which are designed with the best interest of customers in mind. The overarching goal is to make energy efficiency solutions the default choice for all of PECO’s customers and their service providers. PECO’s Phase III plan features a comprehensive measure mix of solutions that meet the needs of all customers. Phase III will enable the customers with the right tools, knowledge and financial incentives necessary to make smarter energy choices. PECO’s Phase III Plan (“PECO’s Plan” or “the Plan”) has a solution to meet the needs of each customer, regardless of whether the customer is residential; multifamily; Small C&I or Large C&I; governmental, educational, non-profit; or low-income. The Company will offer customers eight comprehensive programs: five energy efficiency and three demand response. PECO’s Plan will encourage customers to think more broadly about energy efficiency. Through strategic engagement with retailers, suppliers, and trade allies, PECO’s customers will find energy efficiency solutions readily available when they are making energy decisions for their homes and businesses. Rebates and supporting technical information will be targeted to specific customer segments. This will facilitate customer realization of efficiency benefits including reduced operating costs, increased comfort, and improved performance. PECO is offering the following eight programs for Phase III:
1. Residential Energy Efficiency Program (Residential EE Program) 2. Low-Income Energy Efficiency Program (Low-Income EE Program); for all low-income
customers whether on a single family or multifamily residential meter, or on a commercial meter in a multifamily building, where a multifamily building is defined as having more than one unit, and bigger than a duplex (or 1-family attached unit.)
3. Small Commercial and Industrial Energy Efficiency Program (Small C&I EE Program) 4. Large Commercial and Industrial Energy Efficiency Program (Large C&I EE Program) 5. Combined Heat and Power Program (CHP Program); for both Small C&I and Large C&I
Customers 6. Residential Demand Response Program (Residential DR Program) 7. Small Commercial and Industrial Demand Response Program (Small C&I DR Program) 8. Large Commercial and Industrial Demand Response Program (Large C&I DR Program)
Within each of the energy efficiency programs will be a set of solutions across all electric end-uses that will tailor services towards specific customer sectors and technologies. Each of the demand response programs will offer specific solutions appropriate for the applicable customer class. Customers in the government, education, and non-profit (G/E/NP) sector will be served by programs for either the large C&I or small C&I customer classes, depending on the size of the G/E/NP customer. Customers residing in multifamily properties will be served through residential programs when units are individually metered, and through the commercial programs when master-metered. Low-income customers living in multifamily, master-metered buildings will receive special focused attention with our low-income program. PECO’s multifamily programming does not involve the designation of buildings as “low-income.” Therefore, the Company will count savings from both individually metered and certain master-metered multifamily buildings towards the low-income carve out if those savings can be attributed to households with incomes at or below 150% of the federal poverty income guidelines.
PECO PY 2016-2020 Act 129 - Phase III Energy Efficiency And Conservation Plan Page 7
PECO will work with the building owner to identify units in master-metered buildings that have received federal, state, local, or tax credit funding and have long-term use restrictions on rent or income-eligibility, as well as contain households whose income does not exceed 150% of the federal poverty income guidelines, and will rely on the certification of the building owner when this information is readily verifiable by the building owner/operator. In Phase III, PECO will provide demand response (DR) program offerings to target residential, small C&I, and large C&I customers. The DR programs will call upon demand resources across these customer classes during discrete DR events in the four summer months of June through September. Residential customers will have several opportunities to participate in DR, including direct load control (DLC) solution, smart thermostats for DR events solution, and a behavioral DR solution. Small C&I customers will be able to participate in a DLC solution, and large C&I customers can take advantage of a demand response aggregation (DRA) solution. All participants will receive incentives for DR events, if and when such events are called consistent with the Pennsylvania Public Utility Commission (“PUC” or “Commission”) criteria for DR events.
Features and Benefits of PECO’s Phase III Plan Enhancements included in PECO’s Plan will focus on providing customers with comprehensive solutions, innovative technologies, and practical services to meet their energy needs. The Plan provides all customers opportunities to participate in energy efficiency and DR programs. Key features include:
1. Budget Structure, Savings and TRC: The Plan forecasts achieving cost-effective energy and demand savings targets within the budget through a comprehensive set of measures available to all customer classes. PECO will implement the five-year plan by closely monitoring market conditions and program performance.
2. Customer Centric: PECO’s approach is focused on engaging all of our customers to realize the benefits of increased energy efficiency and building performance as well as demand reductions. A customer centric approach with a deliberate management focus on making participation an easy, convenient and smart choice for customers to take advantage of the comprehensive energy solutions is the most certain path to cost effectively meeting PECO’s energy savings and peak load reduction requirements for Phase III.
a. Solutions: Programs have been developed to serve each customer class through a number of customer focused “Solution” offerings. PECO’s Energy Efficiency and Demand Response Solutions are designed to proactively identify the energy needs of our customers, when and where they make decisions that impact the energy and demand performance of their homes or businesses; and actively overcome barriers to participation.
b. Measures: The Plan is grounded on a comprehensive set of energy or demand saving measures across all electric end-uses. The measures have been selected to ensure PECO delivers products and services aligned with our customers’ ongoing needs; incorporating the most innovative technologies ranging from LED lighting to efficient data center solutions. Audits and custom project measures are included in the portfolio to provide customers with the greatest opportunity to improve the energy performance of their homes and businesses.
c. Pathways: Customers will have multiple avenues of engagement to take advantage of the solutions and measures available including:
PECO PY 2016-2020 Act 129 - Phase III Energy Efficiency And Conservation Plan Page 8
i. A Retail pathway offering a wide array of discounted efficient products available for customer purchase at retail stores or distributors when customers are shopping for new energy consuming products. Generally a pathway for residential and smaller commercial customers that shop in same establishments as residential customers
ii. A Direct-Action pathway where customers work directly with PECO for coordinated and delivered Solutions through Conservation Service Providers (CSPs). Examples include giveaways, direct install, appliance recycling, energy kits, historical DLC program, etc.,
iii. A Trade Ally/Contractor pathway encompassing solutions and measures where a customer works through an independent trade ally or contractor to receive the incentives. They will not be purchasing the equipment through a retail channel. PECO depends on the 3rd party, with which PECO has no contract, to promote participation in the pathway. Examples of this include home energy audits, retrofits, HVAC measures, insulation retrofits, most new construction measures, design assistance, and possibly organizational partnerships such as PHA/HUD.
iv. A Participant-Initiated pathway where customers, generally commercial and industrial, with the skills and resources to pursue energy saving solutions and measures on their own and receive rebate incentives through applications they submit to PECO.
3. Customer Options: The Plan design will allow customers to choose which Solution offerings best
meets their needs for identifying, purchasing, and installing efficient equipment or participating in DR events.
4. CSP Management: To deliver industry-leading service and value to PECO customers, PECO will competitively bid CSP services to implement the Phase III Plan. PECO will manage the CSPs with goals and objectives to ensure customers receive comprehensive benefits of energy efficiency through projects, including a diversity of measures to the extent possible.
5. Rebate Structure: PECO’s rebate structure will address customer financial barriers to implementing energy efficiency projects. Commercial custom projects will promote comprehensive solutions with enhanced incentives for difficult to fund projects in order to minimize lost energy saving opportunities. Incentives will also be provided to customers to encourage participation in the demand response events.
Combined, these Phase III portfolio enhancements will provide our customers with:
1. Valuable comprehensive energy solutions and innovative technologies across all customer classes and electric end-uses; and
2. Improved customer participation experience through providing ‘One Stop Shop’ Solutions through a broad and flexible array of participation options.
PECO believes it has developed a comprehensive portfolio of programs and participation options that offer its customers numerous ways to learn about energy and demand saving opportunities and to select the energy or demand response solutions that best meet their needs. PECO looks forward to approval of this Plan and implementing the comprehensive programs.
PECO PY 2016-2020 Act 129 - Phase III Energy Efficiency And Conservation Plan Page 9
1. Overview of Plan
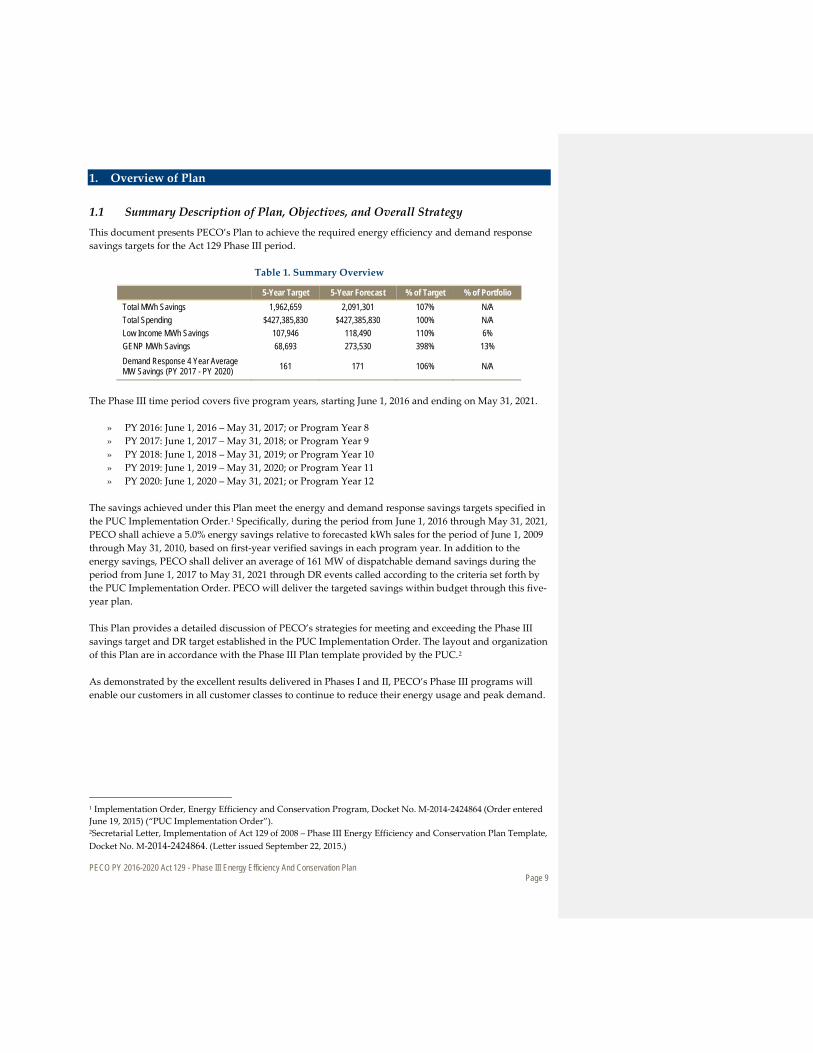
1.1 Summary Description of Plan, Objectives, and Overall Strategy This document presents PECO’s Plan to achieve the required energy efficiency and demand response savings targets for the Act 129 Phase III period.
Table 1. Summary Overview
5-Year Target 5-Year Forecast % of Target % of Portfolio Total MWh Savings 1,962,659 2,091,301 107% N/A Total Spending $427,385,830 $427,385,830 100% N/A Low Income MWh Savings 107,946 118,490 110% 6% GENP MWh Savings 68,693 273,530 398% 13% Demand Response 4 Year Average MW Savings (PY 2017 - PY 2020) 161 171 106% N/A
The Phase III time period covers five program years, starting June 1, 2016 and ending on May 31, 2021.
» PY 2016: June 1, 2016 – May 31, 2017; or Program Year 8 » PY 2017: June 1, 2017 – May 31, 2018; or Program Year 9 » PY 2018: June 1, 2018 – May 31, 2019; or Program Year 10 » PY 2019: June 1, 2019 – May 31, 2020; or Program Year 11 » PY 2020: June 1, 2020 – May 31, 2021; or Program Year 12
The savings achieved under this Plan meet the energy and demand response savings targets specified in the PUC Implementation Order.1 Specifically, during the period from June 1, 2016 through May 31, 2021, PECO shall achieve a 5.0% energy savings relative to forecasted kWh sales for the period of June 1, 2009 through May 31, 2010, based on first-year verified savings in each program year. In addition to the energy savings, PECO shall deliver an average of 161 MW of dispatchable demand savings during the period from June 1, 2017 to May 31, 2021 through DR events called according to the criteria set forth by the PUC Implementation Order. PECO will deliver the targeted savings within budget through this five-year plan. This Plan provides a detailed discussion of PECO’s strategies for meeting and exceeding the Phase III savings target and DR target established in the PUC Implementation Order. The layout and organization of this Plan are in accordance with the Phase III Plan template provided by the PUC.2 As demonstrated by the excellent results delivered in Phases I and II, PECO’s Phase III programs will enable our customers in all customer classes to continue to reduce their energy usage and peak demand.
1 Implementation Order, Energy Efficiency and Conservation Program, Docket No. M-2014-2424864 (Order entered June 19, 2015) (“PUC Implementation Order”). 2Secretarial Letter, Implementation of Act 129 of 2008 – Phase III Energy Efficiency and Conservation Plan Template, Docket No. M-2014-2424864. (Letter issued September 22, 2015.)

PECO PY 2016-2020 Act 129 - Phase III Energy Efficiency And Conservation Plan Page 10
PECO is proposing the following eight programs for Phase III:
1. Residential EE Program 2. Low-Income EE Program 3. Small C&I EE Program 4. Large C&I EE Program 5. CHP Program 6. Residential DR Program 7. Small C&I DR Program 8. Large C&I DR Program
PECO’s primary objectives for the Phase III period include:
» Meet energy and demand savings targets while laying the groundwork for long term market transformation.
» Offer our customers a comprehensive list of eligible measures across all electric end-uses delivered through a diverse array of pathways and Solutions to meet their specific interests and needs.
» Deliver portfolio savings cost-effectively. » Transform the market for efficient technologies and highly qualified, efficiency-oriented trade
allies (such as electricians, HVAC contractors, builders, architects and engineers). » Inform and educate customers on how to use energy more efficiently and reduce peak demand.
This Plan presents detailed information on the Company’s proposed approach, energy efficiency measures, demand response measures, and incentive levels. PECO has made significant efforts to build into this Plan a robust forecast of future participation, anticipating changes from codes and standards and other market forces that will impact program delivery. However, PECO anticipates the need to periodically update portions of this Plan to ensure excellence and cost-effectiveness in program design and delivery. The Company will seek the Commission’s approval for Plan changes when required.
1.2 Summary Description of Process Used to Develop the Phase III Plan The process used to develop the Phase III Plan was informed by numerous inputs. Given PECO’s successful history with the Phase I and II implementation, the initial starting point for the Phase III Plan development was to focus on continuous program improvement through proactive engagement with customers, CSPs and Stakeholders, and application of evaluation, measurement and verification (EM&V) research findings and recommendations. PECO assessed the effectiveness of its Phase I and II programs, and identified and incorporated areas for continuation, modification, or adding new technologies and program services. PECO developed guiding principles for the development of the Phase III plan to align the portfolio of offerings with Stakeholder and PUC objectives, and our customers’ needs and interests. PECO’s goal was to achieve the compliance targets through a comprehensive value proposition to PECO’s customers while meeting the Stakeholders’ and customers’ interests. The Phase III guiding principles are:
1. Deliver valuable energy management and savings solutions to our customers. 2. Engage participating customers in meaningful interactions, leading to comprehensive, persistent
and cost-effective energy efficiency savings. 3. Provide customers a comprehensive portfolio of energy efficiency and demand response
solutions and programs. 4. Keep stakeholders aware and engaged as partners, to continually improve the energy efficiency
and demand response solutions available to our customers.
PECO PY 2016-2020 Act 129 - Phase III Energy Efficiency And Conservation Plan Page 11
Based on these guiding principles, PECO developed design criteria for the detailed Phase III plan. These criteria illustrate PECO’s commitment to delivering a high level of customer service quality and achieving PUC targets:
1. Design a customer centric plan for all customer classes with a delivered focus on a solutions oriented approach and on making participation an easy, convenient and smart choice for customers.
2. Design a plan that will deliver as close as possible to 110% of the energy compliance target as is reasonably achievable over the five year Plan period from June 1, 2016 to May 31, 2021. The Plan currently forecasts energy savings at 107% of the compliance target.
3. Achieve all energy efficiency and demand response targets over the five year period without exceeding the maximum spending amount of $427.4 million over the five year Phase III period, with an expected annual investment of approximately $85.5 million per year.
4. Design a plan that will deliver energy savings as close as possible to 5% of the energy savings compliance targets from PECO’s G/E/NP customers, or 2% higher than the 3.5% energy savings requirement. The Plan currently forecasts G/E/NP energy savings at approximately 14% of the compliance target.
5. Design a plan that will deliver energy savings as close as possible to 6.5% of the energy savings compliance targets from PECO’s low-income customers, or 1% higher than the 5.5% energy savings requirement. The Plan currently forecasts low-income energy savings at 6.0% of the compliance target.
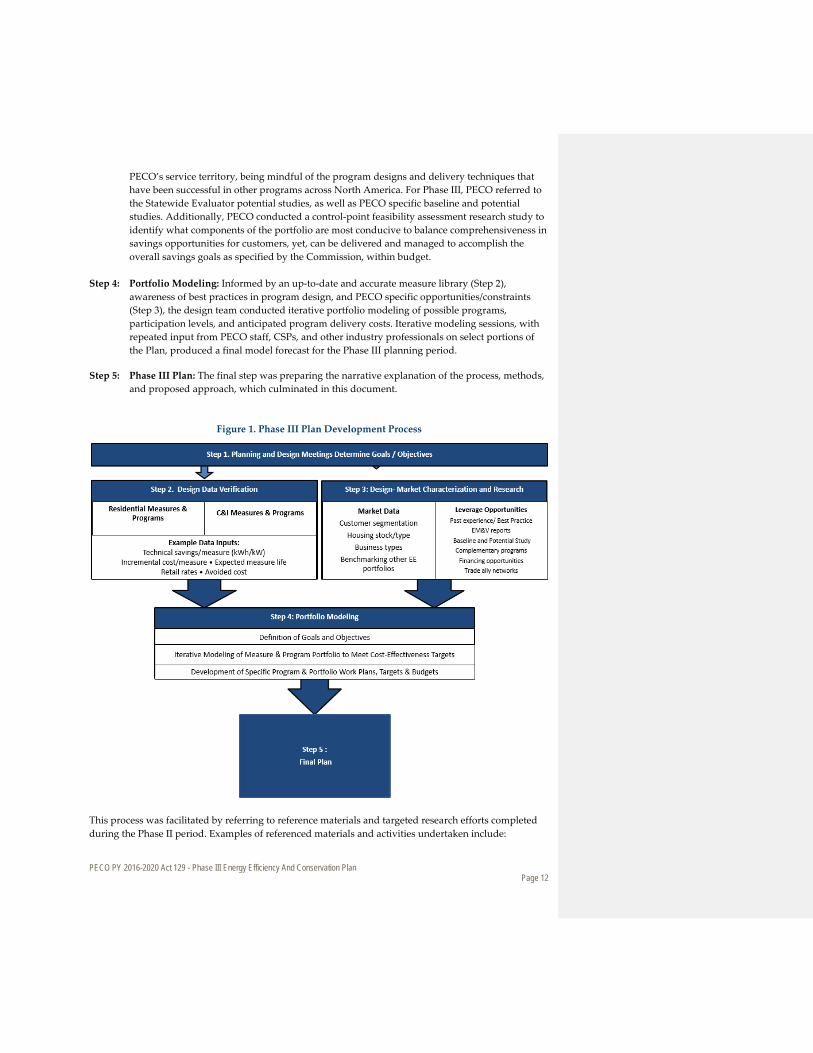
Design a plan that will deliver as close as possible to 185 MW of average demand response savings from dedicated DR programs over the four year compliance period from June 1, 2017 to May 31, 2021, or 15% higher than the 161 MW peak demand reduction target. The Plan currently forecasts demand savings at 171 MW or 106% of the compliance target. The process of preparing this Plan was informed by the following five major steps, shown in Figure 1: Step 1: Planning and Design Meetings: Energy efficiency and demand response program design
requires focused research and forecasting of anticipated programs, measures, measure details, delivery costs, and cost-effectiveness analysis. This is best accomplished through a review of relevant reports, white papers, and discussions with existing CSPs, potential future CSPs, evaluators, etc. The overall purpose of the design meetings is to present ideas and approaches, receive input from multiple perspectives, and settle on the preferred approach.
Step 2: Design-Data Verification: A comprehensive list of residential and C&I measures was
developed to provide a library from which measures were selected to meet savings targets, and other portfolio objectives such as comprehensiveness, participation levels by customer class, and minimum savings thresholds for certain customer segments (e.g., low-income and G/E/NP). PECO worked to update the measure savings estimates to be as current as possible with the 2016 PA TRM. This included a detailed review and application of the appropriate per unit kWh, kW, measure lifetime, incremental cost, etc.
Step 3: Design-Market Characterization Research: The lessons learned from past experience with
energy efficiency and demand response program delivery, market research, baseline studies, potential studies, and other opportunities were applied to the specific programs and program delivery tactics. Attention was focused specifically on the opportunities and constraints of
PECO PY 2016-2020 Act 129 - Phase III Energy Efficiency And Conservation Plan Page 12
PECO’s service territory, being mindful of the program designs and delivery techniques that have been successful in other programs across North America. For Phase III, PECO referred to the Statewide Evaluator potential studies, as well as PECO specific baseline and potential studies. Additionally, PECO conducted a control-point feasibility assessment research study to identify what components of the portfolio are most conducive to balance comprehensiveness in savings opportunities for customers, yet, can be delivered and managed to accomplish the overall savings goals as specified by the Commission, within budget.
Step 4: Portfolio Modeling: Informed by an up-to-date and accurate measure library (Step 2),
awareness of best practices in program design, and PECO specific opportunities/constraints (Step 3), the design team conducted iterative portfolio modeling of possible programs, participation levels, and anticipated program delivery costs. Iterative modeling sessions, with repeated input from PECO staff, CSPs, and other industry professionals on select portions of the Plan, produced a final model forecast for the Phase III planning period.
Step 5: Phase III Plan: The final step was preparing the narrative explanation of the process, methods, and proposed approach, which culminated in this document.
Figure 1. Phase III Plan Development Process
This process was facilitated by referring to reference materials and targeted research efforts completed during the Phase II period. Examples of referenced materials and activities undertaken include:
PECO PY 2016-2020 Act 129 - Phase III Energy Efficiency And Conservation Plan Page 13
» Annual reports filed with the Commission in Phase II
» Energy Efficiency and Demand Response portfolio benchmarking research on program delivery achieved in other states, as well as a review of best practice design and delivery approaches
» PECO evaluator reports: a) Baseline Study; b) Potential Study; c) Control Points Study
» Statewide Evaluator reports: a) Baseline Studies3,4,5; b) Potential Studies6,7; c) Light Metering Study8; d) Incremental Cost Databases9,10
» Updated savings and other inputs per the 2016 Final TRM Order12
» Other updated information (e.g., avoided costs, discount rates, load shapes, cost escalation rates, line loss factors, internal labor rates, etc.)
» Discussions with other PA utilities and members of our stakeholder group to review strategies and areas of possible coordination
» Customization of a comprehensive benefit-cost screening tool, with specific adjustments to the required calculation11
» Iterative program design planning meetings to ensure a combination of programs for all customer classes, including comprehensive measures, with attention to cost-effectiveness thresholds
1.3 Summary Tables of Portfolio Savings Goals, Budget and Cost-Effectiveness PECO will invest up to a total of $427.4 million in energy efficiency and demand response programs over a five-year program period for PY 2016 through PY 2020. The Company plans to achieve approximately 107% of the energy savings target established in the PUC Implementation Order. Additionally, consistent with Phase III requirements, PECO has developed this Plan to meet or exceed the required G/E/NP savings requirement of at least 3.5% of the overall energy savings target and meet or exceed the requirement of 5.5% of the overall energy savings target coming from the low-income sector. In addition, PECO plans to achieve approximately 106% of the PY 2017 - PY 2020 peak load reduction target of 161 MW from dedicated demand response programs. Figure 2 presents the Phase III portfolio structure. Section 3.2 of this report provides a full description of each program.
3 Pennsylvania Statewide Act 129 2014 Non-Residential End-Use & Saturation Study, Nexant, April 2014. 4 Pennsylvania Statewide Act 129 Residential Baseline Study. GDS Associates. April 2014. 5 Demand Response Potential Study, 2015. Prepared by the PA Statewide Evaluation Team; GDS Associates, Nexant, Research Into Action, Apex Analytics. February 25, 2015. 6 Energy Efficiency Potential for Pennsylvania. Prepared by the PA Statewide Evaluation Team; GDS Associates, Nexant, Research Into Action, Apex Analytics. February 2015. 7 Distributed Generation Potential Study for Pennsylvania. Prepared by the PA Statewide Evaluation Team; GDS Associates, Nexant, Research Into Action, Apex Analytics. March, 2015. 8 Pennsylvania Statewide Act 129 2014 Commercial & Residential Light Metering Study. Prepared by the PA Statewide Evaluation Team; GDS Associates, Nexant, Research Into Action, Apex Analytics. January 13, 2014. 9 SWE Team Residential Incremental Measure Cost Database, V2.1. Prepared by the PA Statewide Evaluation Team; GDS Associates, Nexant, Research Into Action, Apex Analytics. May 15, 2015. 10 SWE Team Incremental Measure Cost Database, V1.1. Prepared by the PA Statewide Evaluation Team; GDS Associates, Nexant, Research Into Action, Apex Analytics. February 15, 2013. 11 Pennsylvania PUC 2016 Total Resource Cost Test M-2015-2468992, June 11, 2015

PECO PY 2016-2020 Act 129 - Phase III Energy Efficiency And Conservation Plan Page 14
Figure 2: PECO Phase III PY 2016-2020 Energy Efficiency and Demand Response Portfolio Structure
PECO PY 2016-2020 Act 129 - Phase III Energy Efficiency And Conservation Plan Page 15
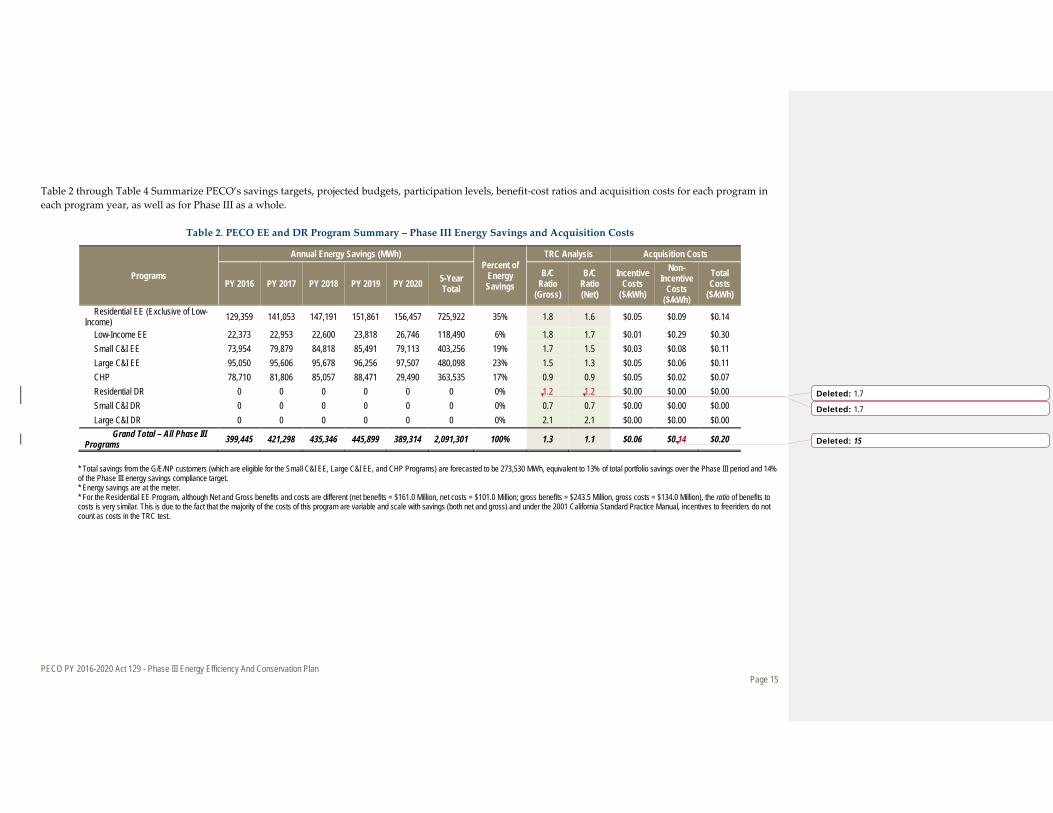
Table 2 through Table 4 Summarize PECO’s savings targets, projected budgets, participation levels, benefit-cost ratios and acquisition costs for each program in each program year, as well as for Phase III as a whole.
Table 2. PECO EE and DR Program Summary – Phase III Energy Savings and Acquisition Costs
Programs
Annual Energy Savings (MWh) Percent of
Energy Savings
TRC Analysis Acquisition Costs
PY 2016 PY 2017 PY 2018 PY 2019 PY 2020 5-Year Total
B/C Ratio
(Gross)
B/C Ratio (Net)
Incentive Costs
($/kWh)
Non-Incentive
Costs ($/kWh)
Total Costs
($/kWh)
Residential EE (Exclusive of Low-Income) 129,359 141,053 147,191 151,861 156,457 725,922 35% 1.8 1.6 $0.05 $0.09 $0.14
Low-Income EE 22,373 22,953 22,600 23,818 26,746 118,490 6% 1.8 1.7 $0.01 $0.29 $0.30 Small C&I EE 73,954 79,879 84,818 85,491 79,113 403,256 19% 1.7 1.5 $0.03 $0.08 $0.11 Large C&I EE 95,050 95,606 95,678 96,256 97,507 480,098 23% 1.5 1.3 $0.05 $0.06 $0.11 CHP 78,710 81,806 85,057 88,471 29,490 363,535 17% 0.9 0.9 $0.05 $0.02 $0.07 Residential DR 0 0 0 0 0 0 0% 1.2 1.2 $0.00 $0.00 $0.00 Small C&I DR 0 0 0 0 0 0 0% 0.7 0.7 $0.00 $0.00 $0.00 Large C&I DR 0 0 0 0 0 0 0% 2.1 2.1 $0.00 $0.00 $0.00
Grand Total – All Phase IlI Programs 399,445 421,298 435,346 445,899 389,314 2,091,301 100% 1.3 1.1 $0.06 $0.14 $0.20
* Total savings from the G/E/NP customers (which are eligible for the Small C&I EE, Large C&I EE, and CHP Programs) are forecasted to be 273,530 MWh, equivalent to 13% of total portfolio savings over the Phase III period and 14% of the Phase III energy savings compliance target. * Energy savings are at the meter. * For the Residential EE Program, although Net and Gross benefits and costs are different (net benefits = $161.0 Million, net costs = $101.0 Million; gross benefits = $243.5 Million, gross costs = $134.0 Million), the ratio of benefits to costs is very similar. This is due to the fact that the majority of the costs of this program are variable and scale with savings (both net and gross) and under the 2001 California Standard Practice Manual, incentives to freeriders do not count as costs in the TRC test.
Deleted: 1.7
Deleted: 1.7
Deleted: 15
PECO PY 2016-2020 Act 129 - Phase III Energy Efficiency And Conservation Plan Page 16
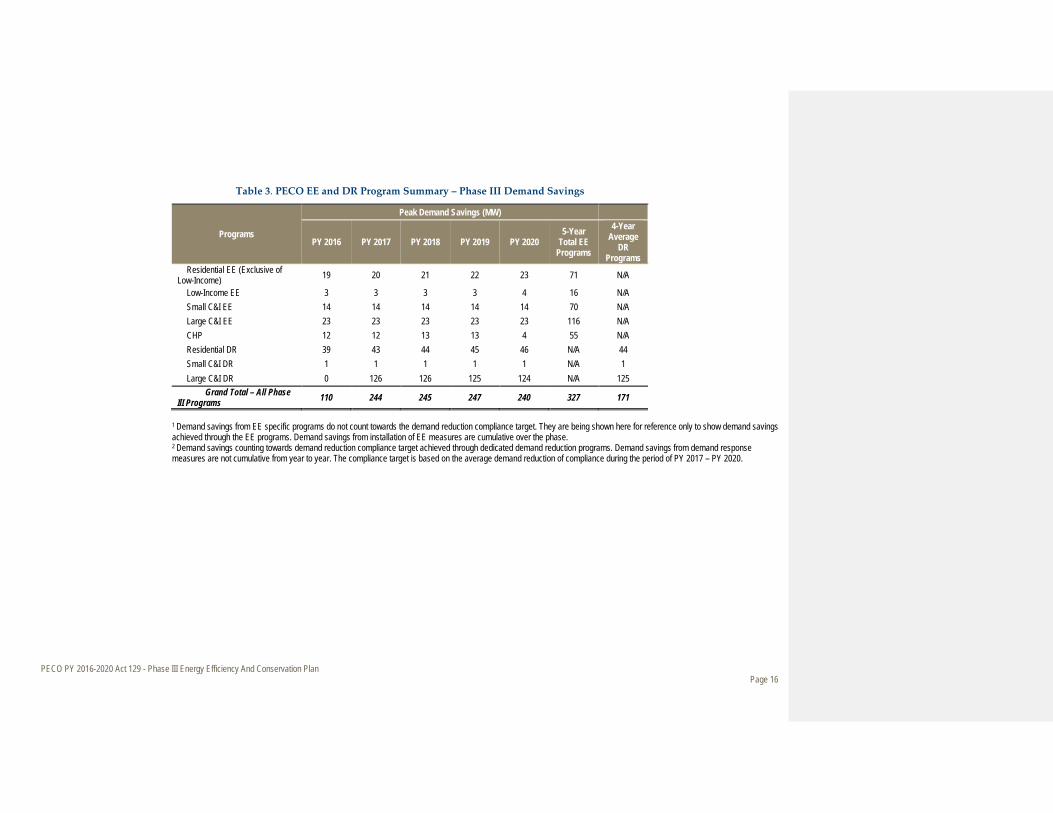
Table 3. PECO EE and DR Program Summary – Phase III Demand Savings
Programs
Peak Demand Savings (MW)
PY 2016 PY 2017 PY 2018 PY 2019 PY 2020 5-Year
Total EE Programs
4-Year Average
DR Programs
Residential EE (Exclusive of Low-Income) 19 20 21 22 23 71 N/A
Low-Income EE 3 3 3 3 4 16 N/A Small C&I EE 14 14 14 14 14 70 N/A Large C&I EE 23 23 23 23 23 116 N/A CHP 12 12 13 13 4 55 N/A Residential DR 39 43 44 45 46 N/A 44 Small C&I DR 1 1 1 1 1 N/A 1 Large C&I DR 0 126 126 125 124 N/A 125
Grand Total – All Phase IlI Programs 110 244 245 247 240 327 171
1 Demand savings from EE specific programs do not count towards the demand reduction compliance target. They are being shown here for reference only to show demand savings achieved through the EE programs. Demand savings from installation of EE measures are cumulative over the phase. 2 Demand savings counting towards demand reduction compliance target achieved through dedicated demand reduction programs. Demand savings from demand response measures are not cumulative from year to year. The compliance target is based on the average demand reduction of compliance during the period of PY 2017 – PY 2020.
PECO PY 2016-2020 Act 129 - Phase III Energy Efficiency And Conservation Plan Page 17
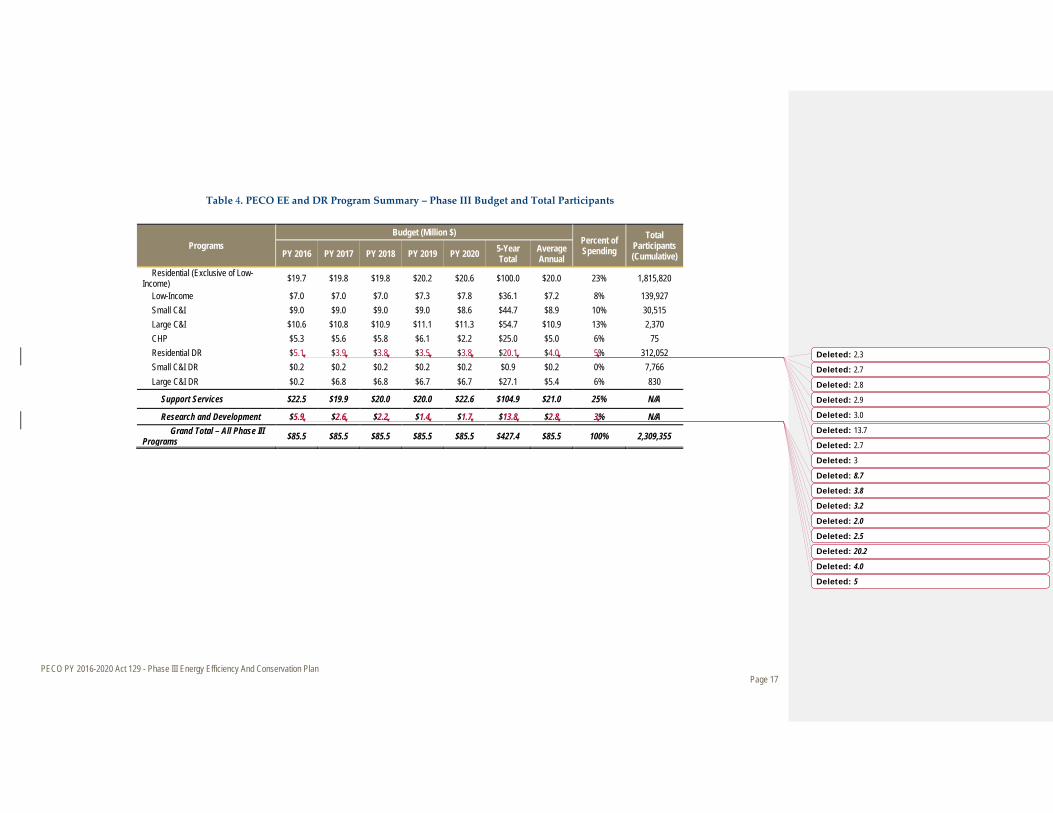
Table 4. PECO EE and DR Program Summary – Phase III Budget and Total Participants
Programs Budget (Million $)
Percent of Spending
Total Participants (Cumulative) PY 2016 PY 2017 PY 2018 PY 2019 PY 2020 5-Year
Total Average Annual
Residential (Exclusive of Low-Income) $19.7 $19.8 $19.8 $20.2 $20.6 $100.0 $20.0 23% 1,815,820
Low-Income $7.0 $7.0 $7.0 $7.3 $7.8 $36.1 $7.2 8% 139,927 Small C&I $9.0 $9.0 $9.0 $9.0 $8.6 $44.7 $8.9 10% 30,515 Large C&I $10.6 $10.8 $10.9 $11.1 $11.3 $54.7 $10.9 13% 2,370 CHP $5.3 $5.6 $5.8 $6.1 $2.2 $25.0 $5.0 6% 75 Residential DR $5.1 $3.9 $3.8 $3.5 $3.8 $20.1 $4.0 5% 312,052 Small C&I DR $0.2 $0.2 $0.2 $0.2 $0.2 $0.9 $0.2 0% 7,766 Large C&I DR $0.2 $6.8 $6.8 $6.7 $6.7 $27.1 $5.4 6% 830
Support Services $22.5 $19.9 $20.0 $20.0 $22.6 $104.9 $21.0 25% N/A
Research and Development $5.9 $2.6 $2.2 $1.4 $1.7 $13.8 $2.8 3% N/A Grand Total – All Phase IlI
Programs $85.5 $85.5 $85.5 $85.5 $85.5 $427.4 $85.5 100% 2,309,355
Deleted: 2.3
Deleted: 2.7
Deleted: 2.8
Deleted: 2.9
Deleted: 3.0
Deleted: 13.7
Deleted: 2.7
Deleted: 3
Deleted: 8.7
Deleted: 3.8
Deleted: 3.2
Deleted: 2.0
Deleted: 2.5
Deleted: 20.2
Deleted: 4.0
Deleted: 5
PECO PY 2016-2020 Act 129 - Phase III Energy Efficiency And Conservation Plan Page 18
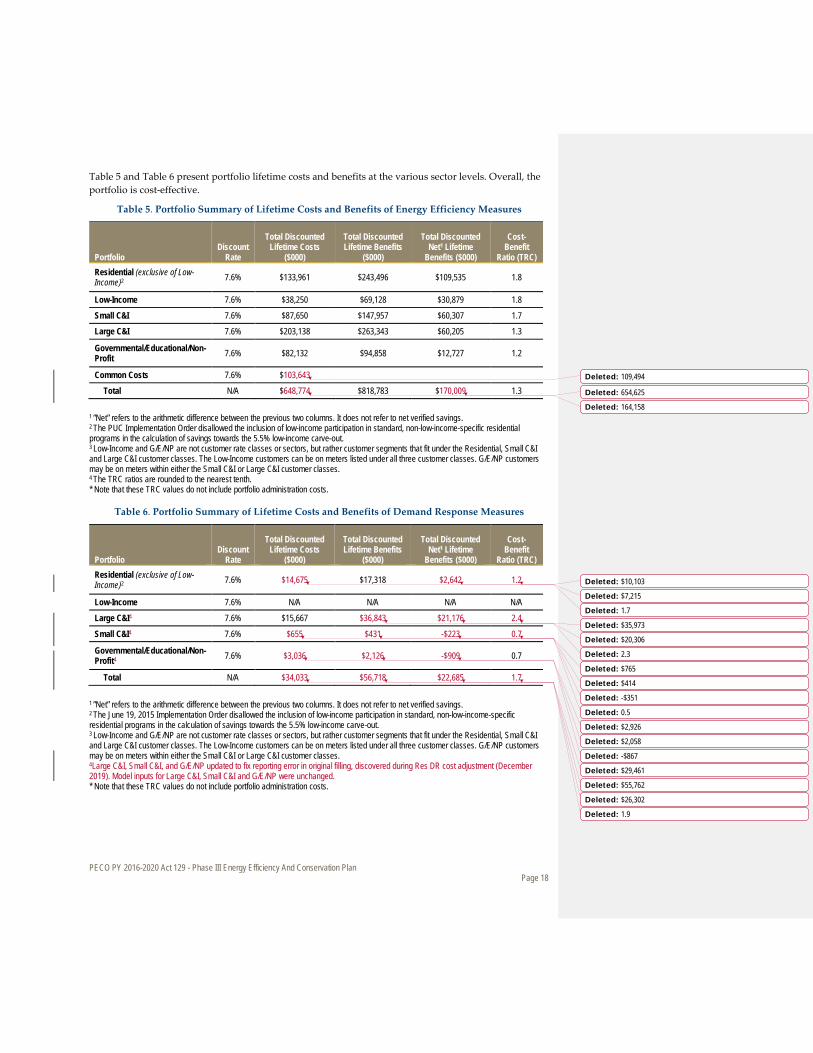
Table 5 and Table 6 present portfolio lifetime costs and benefits at the various sector levels. Overall, the portfolio is cost-effective.
Table 5. Portfolio Summary of Lifetime Costs and Benefits of Energy Efficiency Measures
Portfolio Discount
Rate
Total Discounted Lifetime Costs
($000)
Total Discounted Lifetime Benefits
($000)
Total Discounted Net1 Lifetime
Benefits ($000)
Cost-Benefit
Ratio (TRC) Residential (exclusive of Low-Income)2 7.6% $133,961 $243,496 $109,535 1.8
Low-Income 7.6% $38,250 $69,128 $30,879 1.8
Small C&I 7.6% $87,650 $147,957 $60,307 1.7
Large C&I 7.6% $203,138 $263,343 $60,205 1.3
Governmental/Educational/Non-Profit 7.6% $82,132 $94,858 $12,727 1.2
Common Costs 7.6% $103,643
Total N/A $648,774 $818,783 $170,009 1.3
1 ”Net” refers to the arithmetic difference between the previous two columns. It does not refer to net verified savings. 2 The PUC Implementation Order disallowed the inclusion of low-income participation in standard, non-low-income-specific residential programs in the calculation of savings towards the 5.5% low-income carve-out. 3 Low-Income and G/E/NP are not customer rate classes or sectors, but rather customer segments that fit under the Residential, Small C&I and Large C&I customer classes. The Low-Income customers can be on meters listed under all three customer classes. G/E/NP customers may be on meters within either the Small C&I or Large C&I customer classes. 4 The TRC ratios are rounded to the nearest tenth. * Note that these TRC values do not include portfolio administration costs.
Table 6. Portfolio Summary of Lifetime Costs and Benefits of Demand Response Measures
Portfolio Discount
Rate
Total Discounted Lifetime Costs
($000)
Total Discounted Lifetime Benefits
($000)
Total Discounted Net1 Lifetime
Benefits ($000)
Cost-Benefit
Ratio (TRC) Residential (exclusive of Low-Income)2 7.6% $14,675 $17,318 $2,642 1.2
Low-Income 7.6% N/A N/A N/A N/A
Large C&I4 7.6% $15,667 $36,843 $21,176 2.4
Small C&I4 7.6% $655 $431 -$223 0.7
Governmental/Educational/Non-Profit4 7.6% $3,036 $2,126 -$909 0.7
Total N/A $34,033 $56,718 $22,685 1.7
1 ”Net” refers to the arithmetic difference between the previous two columns. It does not refer to net verified savings. 2 The June 19, 2015 Implementation Order disallowed the inclusion of low-income participation in standard, non-low-income-specific residential programs in the calculation of savings towards the 5.5% low-income carve-out. 3 Low-Income and G/E/NP are not customer rate classes or sectors, but rather customer segments that fit under the Residential, Small C&I and Large C&I customer classes. The Low-Income customers can be on meters listed under all three customer classes. G/E/NP customers may be on meters within either the Small C&I or Large C&I customer classes. 4Large C&I, Small C&I, and G/E/NP updated to fix reporting error in original filling, discovered during Res DR cost adjustment (December 2019). Model inputs for Large C&I, Small C&I and G/E/NP were unchanged. * Note that these TRC values do not include portfolio administration costs.
Deleted: 109,494
Deleted: 654,625
Deleted: 164,158
Deleted: $10,103
Deleted: $7,215
Deleted: 1.7
Deleted: $35,973
Deleted: $20,306
Deleted: 2.3
Deleted: $765
Deleted: $414
Deleted: -$351
Deleted: 0.5
Deleted: $2,926
Deleted: $2,058
Deleted: -$867
Deleted: $29,461
Deleted: $55,762
Deleted: $26,302
Deleted: 1.9
PECO PY 2016-2020 Act 129 - Phase III Energy Efficiency And Conservation Plan Page 19
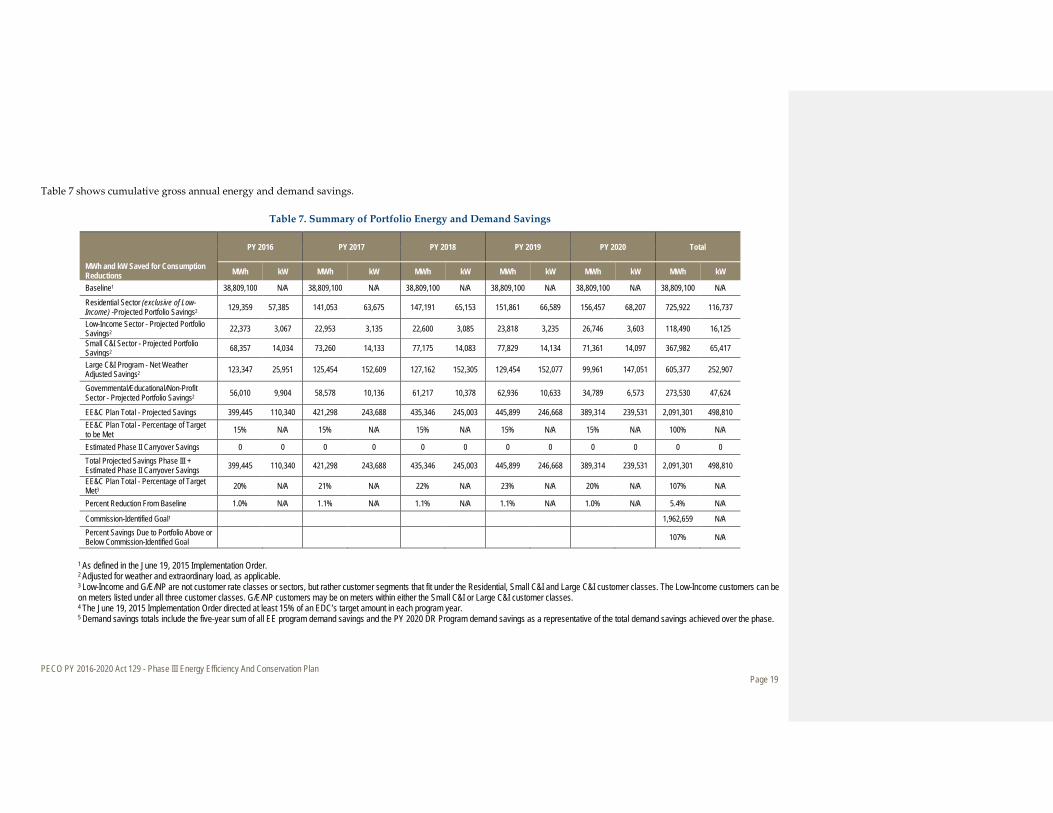
Table 7 shows cumulative gross annual energy and demand savings.
Table 7. Summary of Portfolio Energy and Demand Savings
MWh and kW Saved for Consumption Reductions
PY 2016 PY 2017 PY 2018 PY 2019 PY 2020 Total
MWh kW MWh kW MWh kW MWh kW MWh kW MWh kW
Baseline1 38,809,100 N/A 38,809,100 N/A 38,809,100 N/A 38,809,100 N/A 38,809,100 N/A 38,809,100 N/A
Residential Sector (exclusive of Low-Income) -Projected Portfolio Savings2 129,359 57,385 141,053 63,675 147,191 65,153 151,861 66,589 156,457 68,207 725,922 116,737
Low-Income Sector - Projected Portfolio Savings2 22,373 3,067 22,953 3,135 22,600 3,085 23,818 3,235 26,746 3,603 118,490 16,125
Small C&I Sector - Projected Portfolio Savings2 68,357 14,034 73,260 14,133 77,175 14,083 77,829 14,134 71,361 14,097 367,982 65,417
Large C&I Program - Net Weather Adjusted Savings2 123,347 25,951 125,454 152,609 127,162 152,305 129,454 152,077 99,961 147,051 605,377 252,907
Governmental/Educational/Non-Profit Sector - Projected Portfolio Savings2 56,010 9,904 58,578 10,136 61,217 10,378 62,936 10,633 34,789 6,573 273,530 47,624
EE&C Plan Total - Projected Savings 399,445 110,340 421,298 243,688 435,346 245,003 445,899 246,668 389,314 239,531 2,091,301 498,810 EE&C Plan Total - Percentage of Target to be Met 15% N/A 15% N/A 15% N/A 15% N/A 15% N/A 100% N/A
Estimated Phase II Carryover Savings 0 0 0 0 0 0 0 0 0 0 0 0 Total Projected Savings Phase III + Estimated Phase II Carryover Savings 399,445 110,340 421,298 243,688 435,346 245,003 445,899 246,668 389,314 239,531 2,091,301 498,810
EE&C Plan Total - Percentage of Target Met3 20% N/A 21% N/A 22% N/A 23% N/A 20% N/A 107% N/A
Percent Reduction From Baseline 1.0% N/A 1.1% N/A 1.1% N/A 1.1% N/A 1.0% N/A 5.4% N/A
Commission-Identified Goal1 1,962,659 N/A Percent Savings Due to Portfolio Above or Below Commission-Identified Goal 107% N/A
1 As defined in the June 19, 2015 Implementation Order. 2 Adjusted for weather and extraordinary load, as applicable. 3 Low-Income and G/E/NP are not customer rate classes or sectors, but rather customer segments that fit under the Residential, Small C&I and Large C&I customer classes. The Low-Income customers can be on meters listed under all three customer classes. G/E/NP customers may be on meters within either the Small C&I or Large C&I customer classes. 4 The June 19, 2015 Implementation Order directed at least 15% of an EDC’s target amount in each program year. 5 Demand savings totals include the five-year sum of all EE program demand savings and the PY 2020 DR Program demand savings as a representative of the total demand savings achieved over the phase.
PECO PY 2016-2020 Act 129 - Phase III Energy Efficiency And Conservation Plan Page 20
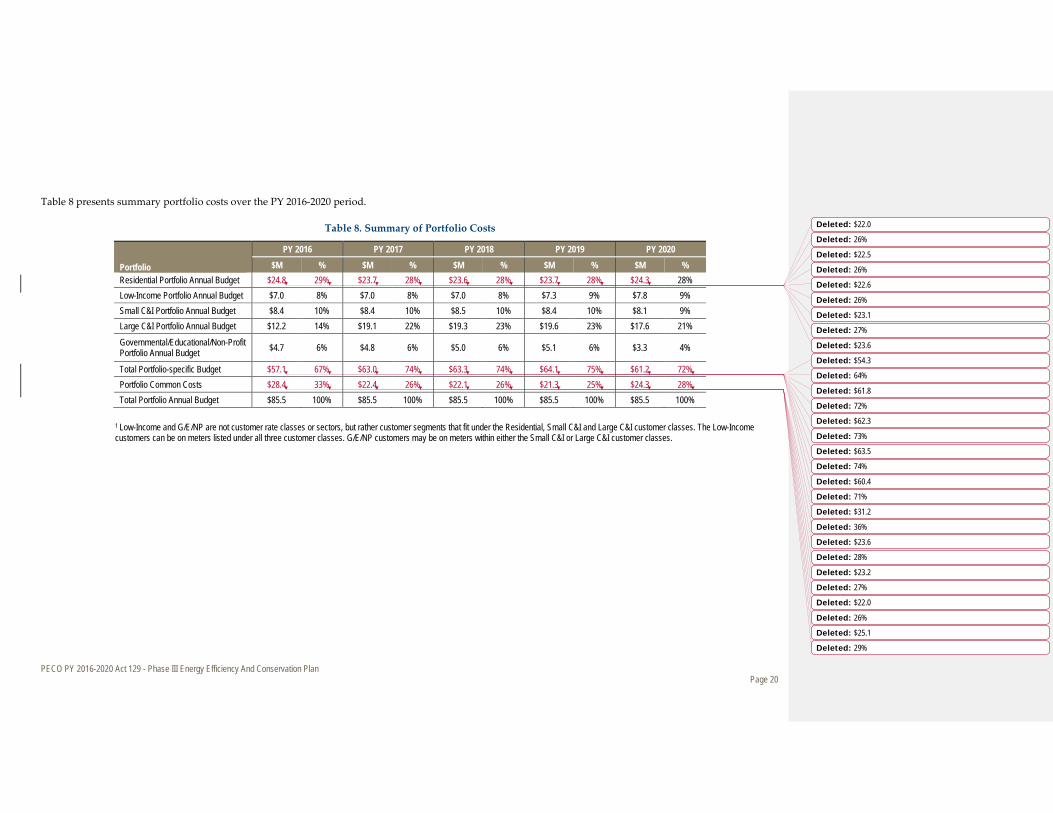
Table 8 presents summary portfolio costs over the PY 2016-2020 period.
Table 8. Summary of Portfolio Costs
Portfolio
PY 2016 PY 2017 PY 2018 PY 2019 PY 2020 $M % $M % $M % $M % $M %
Residential Portfolio Annual Budget $24.8 29% $23.7 28% $23.6 28% $23.7 28% $24.3 28% Low-Income Portfolio Annual Budget $7.0 8% $7.0 8% $7.0 8% $7.3 9% $7.8 9% Small C&I Portfolio Annual Budget $8.4 10% $8.4 10% $8.5 10% $8.4 10% $8.1 9% Large C&I Portfolio Annual Budget $12.2 14% $19.1 22% $19.3 23% $19.6 23% $17.6 21%
Governmental/Educational/Non-Profit Portfolio Annual Budget $4.7 6% $4.8 6% $5.0 6% $5.1 6% $3.3 4%
Total Portfolio-specific Budget $57.1 67% $63.0 74% $63.3 74% $64.1 75% $61.2 72% Portfolio Common Costs $28.4 33% $22.4 26% $22.1 26% $21.3 25% $24.3 28% Total Portfolio Annual Budget $85.5 100% $85.5 100% $85.5 100% $85.5 100% $85.5 100%
1 Low-Income and G/E/NP are not customer rate classes or sectors, but rather customer segments that fit under the Residential, Small C&I and Large C&I customer classes. The Low-Income customers can be on meters listed under all three customer classes. G/E/NP customers may be on meters within either the Small C&I or Large C&I customer classes.
Deleted: $22.0
Deleted: 26%
Deleted: $22.5
Deleted: 26%
Deleted: $22.6
Deleted: 26%
Deleted: $23.1
Deleted: 27%
Deleted: $23.6
Deleted: $54.3
Deleted: 64%
Deleted: $61.8
Deleted: 72%
Deleted: $62.3
Deleted: 73%
Deleted: $63.5
Deleted: 74%
Deleted: $60.4
Deleted: 71%
Deleted: $31.2
Deleted: 36%
Deleted: $23.6
Deleted: 28%
Deleted: $23.2
Deleted: 27%
Deleted: $22.0
Deleted: 26%
Deleted: $25.1
Deleted: 29%
PECO PY 2016-2020 Act 129 - Phase III Energy Efficiency And Conservation Plan Page 21
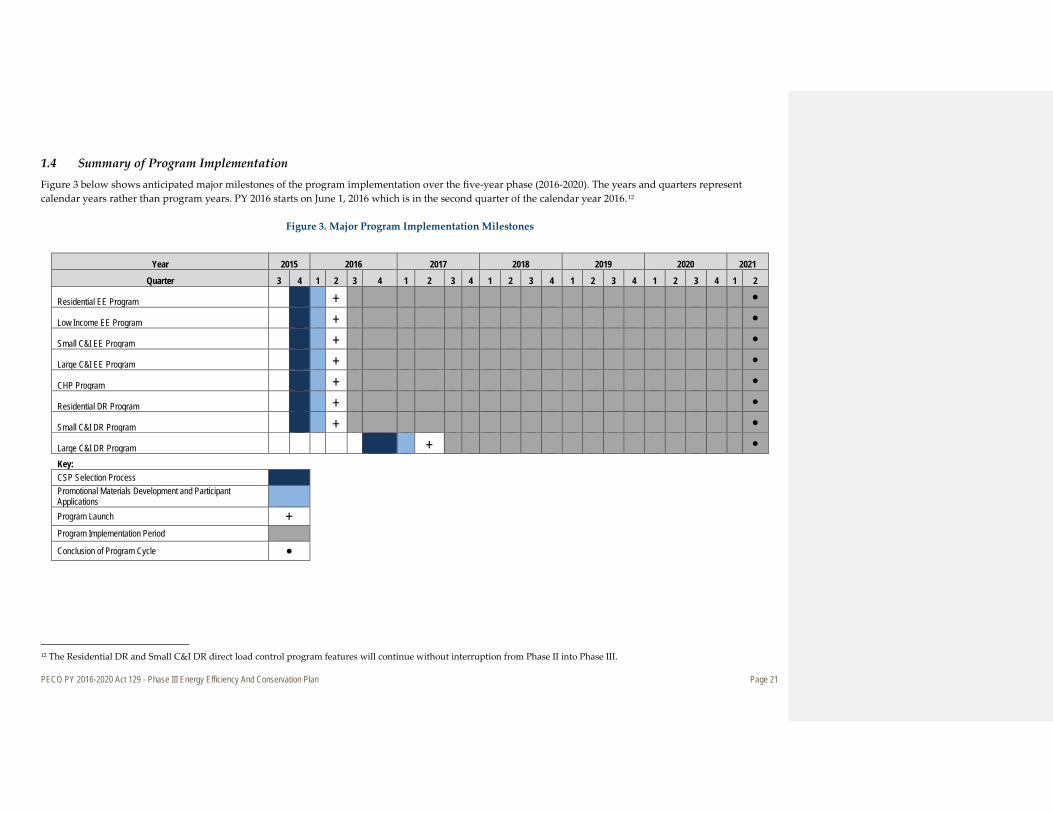
1.4 Summary of Program Implementation Figure 3 below shows anticipated major milestones of the program implementation over the five-year phase (2016-2020). The years and quarters represent calendar years rather than program years. PY 2016 starts on June 1, 2016 which is in the second quarter of the calendar year 2016.12
Figure 3. Major Program Implementation Milestones
Year 2015 2016 2017 2018 2019 2020 2021
Quarter 3 4 1 2 3 4 1 2 3 4 1 2 3 4 1 2 3 4 1 2 3 4 1 2
Residential EE Program + • Low Income EE Program + • Small C&I EE Program + • Large C&I EE Program + • CHP Program + • Residential DR Program + • Small C&I DR Program + • Large C&I DR Program + • Key: CSP Selection Process Promotional Materials Development and Participant Applications Program Launch + Program Implementation Period Conclusion of Program Cycle •
12 The Residential DR and Small C&I DR direct load control program features will continue without interruption from Phase II into Phase III.
PECO PY 2016-2020 Act 129 - Phase III Energy Efficiency And Conservation Plan Page 22
1.5 Summary Description of PECO’s Strategy to Acquire No Less Than 15% Savings Each Program Year
PECO’s portfolio of programs is designed to produce significant savings in each of the five program years. As shown in Table 7 above, the Company projects that no less than 15% of the five year savings target will be achieved in each program year.
1.6 Summary Descriptions of PECO’s Implementation Strategy to Manage the EE&C Portfolio and Engage Customers and Trade Allies
PECO will take a number of steps to ensure effective, Act 129-compliant implementation of this Phase III Plan. These include:
» Implementation contracting: PECO will contract with registered implementation CSPs that have specific experience implementing utility energy efficiency and demand response programs and working with specific targeted markets. This will maximize the use of expertise already developed, enable PECO to make the programs available to customers quickly and begin achieving savings as soon as possible.
» Utilization of delivery channels: Each program in the Plan calls for using appropriate and available means of delivering program services, including ensuring an adequate supply of featured equipment, promotion and distribution of the rebated products, and training and education. Depending on the program, channels may include, but are not limited to: trade allies such as equipment manufacturers, retailers, distributors, contractors, equipment installers, architects, engineers, facility auditors, and trade associations; government, community, and affinity groups; PECO field staff; PECO bill inserts, web pages devoted to the programs, on-line audits; news media advertising; as well as the implementation CSP.
» Awareness and education: PECO will maintain its general education campaign to inform customers and other stakeholders about the programs, PECO’s commitment to reducing customer electricity use, and the benefits of energy efficiency and demand reductions. Depending on the program, these activities may include, but may not necessarily be limited to, training seminars, fact sheets, case studies, on-line audits and energy profiles, home/facility site visits, and demonstration projects.
» Tracking database: PECO’s tracking database was developed and is maintained by a third-party database vendor. Database protocols were developed to ensure accurate data entry through proper field definitions and input validations. Program activity tracking queries were written to facilitate program tracking and reporting for PECO and the Commission. The implementation CSPs upload program data into the database at defined intervals and according to the data protocols. The EM&V vendor is able to access the information in the database.
» Pre-launch design and preparation period: The implementation schedule for each new program includes a design phase to allow PECO and the implementation CSP to properly prepare for the program launch. This time will be used to refine the program, develop protocols and training materials, recruit trade allies, conduct educational activities, and develop and print incentive applications. The elements will be in place prior to full operation of the program. They will also be reviewed during process evaluations so that improvements may be incorporated during this Plan cycle.
» Continuous review of implementation practices: The Plan explicitly addresses the challenges that each program will face in achieving success. Internal process reviews and evaluations by the EM&V contractor of the program protocols, procedures, participant satisfaction, and reporting will be conducted to identify and address issues that arise during program operation and to facilitate ongoing program improvement.
PECO PY 2016-2020 Act 129 - Phase III Energy Efficiency And Conservation Plan Page 23
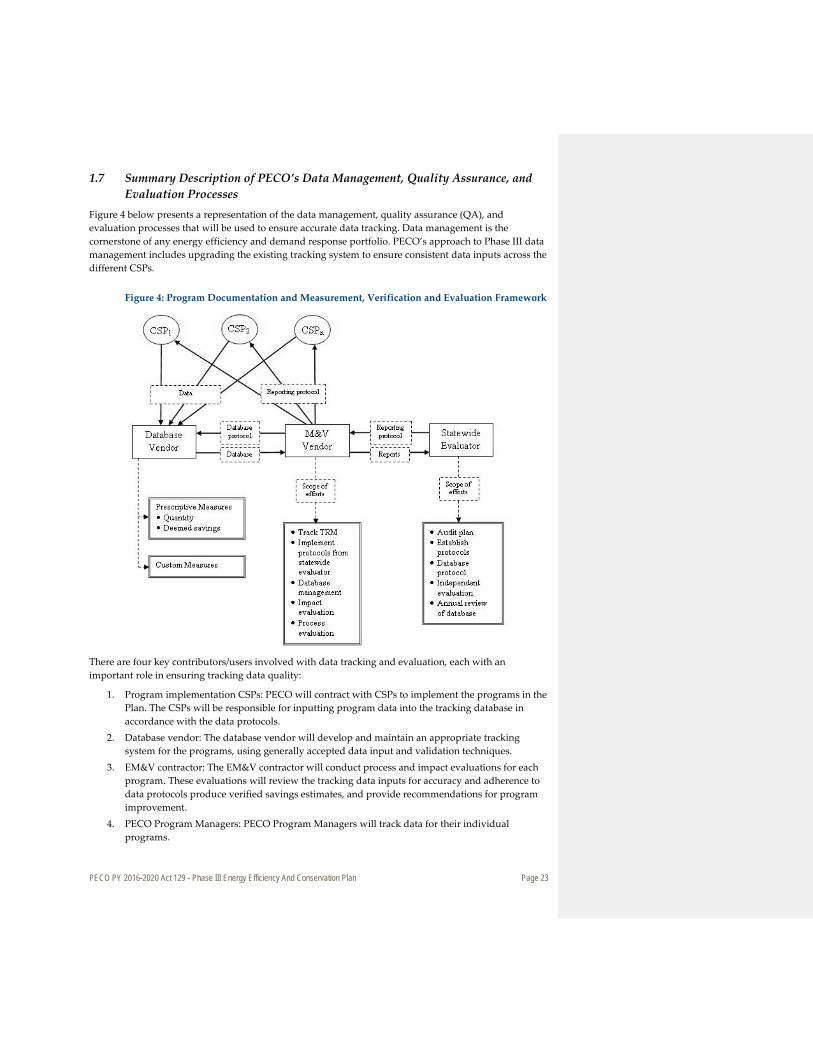
1.7 Summary Description of PECO’s Data Management, Quality Assurance, and Evaluation Processes
Figure 4 below presents a representation of the data management, quality assurance (QA), and evaluation processes that will be used to ensure accurate data tracking. Data management is the cornerstone of any energy efficiency and demand response portfolio. PECO’s approach to Phase III data management includes upgrading the existing tracking system to ensure consistent data inputs across the different CSPs.
Figure 4: Program Documentation and Measurement, Verification and Evaluation Framework
There are four key contributors/users involved with data tracking and evaluation, each with an important role in ensuring tracking data quality:
1. Program implementation CSPs: PECO will contract with CSPs to implement the programs in the Plan. The CSPs will be responsible for inputting program data into the tracking database in accordance with the data protocols.
2. Database vendor: The database vendor will develop and maintain an appropriate tracking system for the programs, using generally accepted data input and validation techniques.
3. EM&V contractor: The EM&V contractor will conduct process and impact evaluations for each program. These evaluations will review the tracking data inputs for accuracy and adherence to data protocols produce verified savings estimates, and provide recommendations for program improvement.
4. PECO Program Managers: PECO Program Managers will track data for their individual programs.
PECO PY 2016-2020 Act 129 - Phase III Energy Efficiency And Conservation Plan Page 24
PECO’s approach addresses five areas critical to ensuring program implementation quality: 1. Implementation CSP selection: PECO will select and contract with CSPs who have demonstrated
experience implementing data management protocols and a commitment to maintaining data quality and integrity. Contracts will be awarded based on the vendors’ ability to meet the criteria of shared risks and rewards at highest levels of performance.
2. Development of program implementation and documentation protocols: PECO and the CSPs will develop specific data management protocols and procedures for each program. These will govern all aspects of the program implementation, from procedures for conducting site visits to data input.
3. Verification and documentation of activities and savings: Verification of project eligibility and actual installation of measures is important. Documentation of purchases and installations will ensure that programs are implemented in top quality fashion and will provide the basis for defensible program evaluations.
4. Program evaluation: PECO will contract with an experienced EM&V vendor to conduct an independent assessment of each program’s performance. This contractor will develop a comprehensive Plan for conducting process and impact evaluations. The EM&V contractor will work with the Statewide Evaluator to ensure that the evaluations are conducted according to state requirements.
5. Evaluation-based program adjustments: PECO will utilize the findings and recommendations resulting from the impact and process evaluations to make adjustments to program implementation as necessary to ensure that the programs are implemented in accordance with recognized best practices, maintain participant satisfaction, and contribute to PECO’s successful attainment of its portfolio savings goals.
1.8 Summary Description of Cost Recovery Mechanism As required by Act 129, PECO’s EE&C Plan costs are recoverable through a 66 Pa. C.S.§1307 cost-recovery mechanism. In its Phase III Implementation Order, the Commission again provided direction on the cost recovery tariff mechanism to be used.13 The Commission described a Phase III mechanism similar to the Phase I and Phase II mechanisms. They indicated that the mechanism shall be designed to recover, on a full and current basis, without interest, from each customer class, all prudent and reasonable EE&C costs that have been assigned to each class. In addition, the Commission required that the mechanism be reconciled annually with revised rates effective June 1st of each program year. As such, PECO proposes to use a cost recovery mechanism for Phase III similar to that used in prior Phases, but modified to meet the additional Phase III requirements. As with Phases I and II, PECO proposes that the cost recovery mechanism for Phase III includes four separate recovery charges, one for the Residential rate class (which includes low-income customers), one for the Small C&I rate class, one for the Large C&I rate class, and one for the Municipal Lighting rate class (street lights and traffic lights). For the G/E/NP customers, who are defined in Act 129, PECO does not have a separate recovery mechanism because their electric accounts are already included in the Small C&I and the Large C&I rate classes. Four separate charges were developed to ensure that the rate classes that finance the measures are the classes that receive the direct energy and conservation benefits. See Section 7 for a detailed description of and estimated values for the cost recovery mechanisms.
13 Pennsylvania PUC. Implementation Order, June 19, 2015, pp. 130 - 150
PECO PY 2016-2020 Act 129 - Phase III Energy Efficiency And Conservation Plan Page 25
2. Energy Efficiency and Demand Response Portfolio / Program Summary Tables and Charts
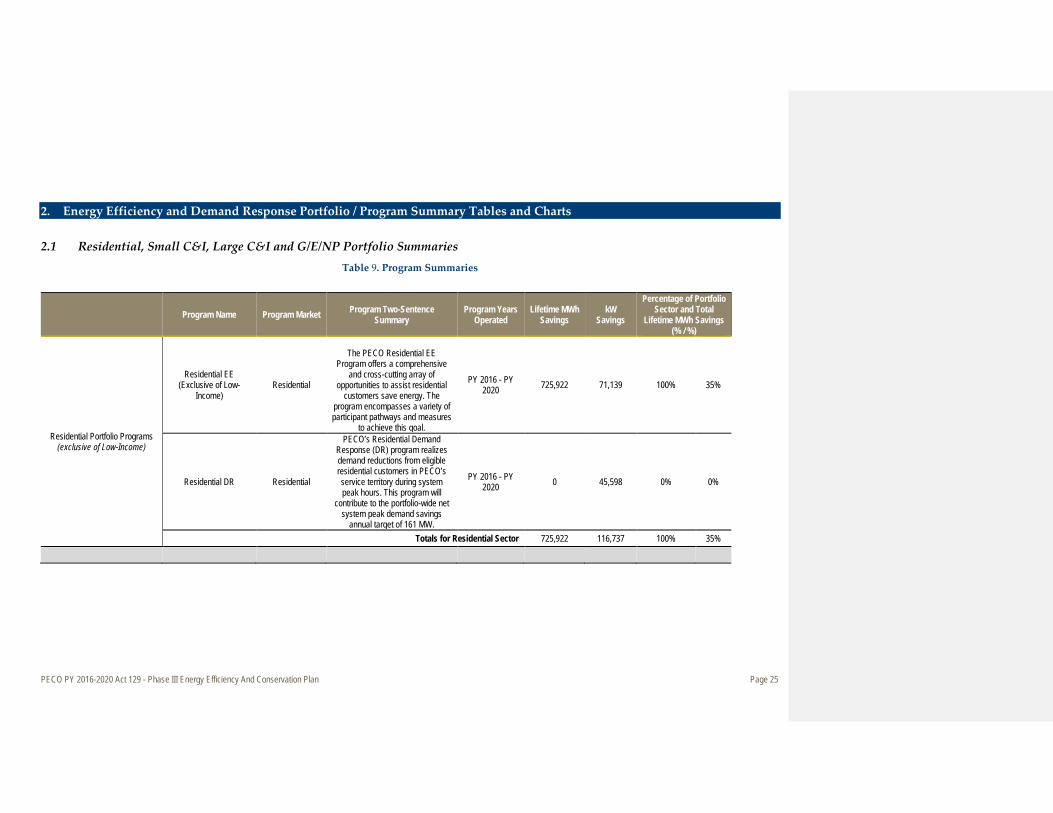
2.1 Residential, Small C&I, Large C&I and G/E/NP Portfolio Summaries Table 9. Program Summaries
Program Name Program Market Program Two-Sentence Summary
Program Years Operated
Lifetime MWh Savings
kW Savings
Percentage of Portfolio Sector and Total
Lifetime MWh Savings (% / %)
Residential Portfolio Programs (exclusive of Low-Income)
Residential EE (Exclusive of Low-
Income) Residential
The PECO Residential EE Program offers a comprehensive
and cross-cutting array of opportunities to assist residential
customers save energy. The program encompasses a variety of participant pathways and measures
to achieve this goal.
PY 2016 - PY 2020 725,922 71,139 100% 35%
Residential DR Residential
PECO’s Residential Demand Response (DR) program realizes demand reductions from eligible residential customers in PECO’s service territory during system peak hours. This program will
contribute to the portfolio-wide net system peak demand savings
annual target of 161 MW.
PY 2016 - PY 2020 0 45,598 0% 0%
Totals for Residential Sector 725,922 116,737 100% 35%

PECO PY 2016-2020 Act 129 - Phase III Energy Efficiency And Conservation Plan Page 26
Program Name Program Market Program Two-Sentence Summary
Program Years Operated
Lifetime MWh Savings
kW Savings
Percentage of Portfolio Sector and Total
Lifetime MWh Savings (% / %)
Low-Income Sector Programs Low-Income EE
Low-Income Residential (including
Master-Metered)
The purpose of the PECO Low-Income EE Program is to offer a comprehensive and cross-cutting array of opportunities to assist low income residential customers in
saving energy. The program focuses on serving the needs of
PECO’s customers and contractors who work on a daily basis to advance residential energy
efficiency and the associated multiple non-energy benefits.
PY 2016 - PY 2020 118,490 16,125 100% 6%
Totals for Low-Income Sector 118,490 16,125 100% 6%
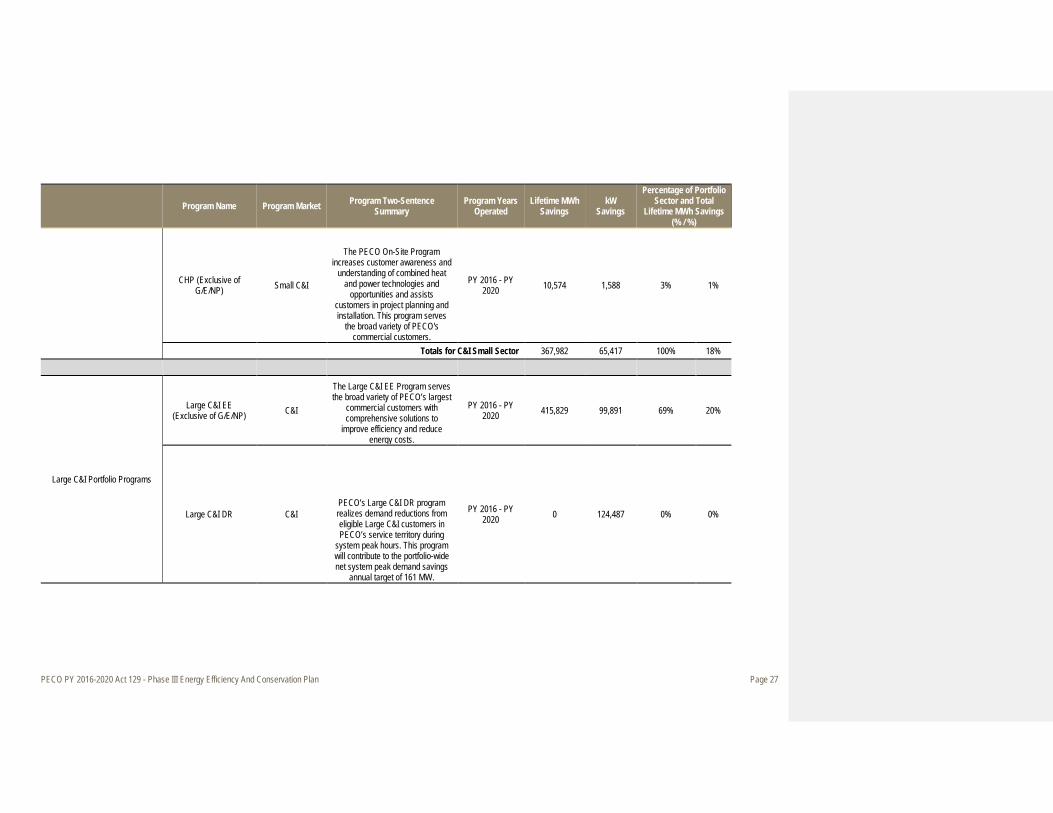
Small C&I Portfolio Programs
Small C&I EE (Exclusive of G/E/NP) C&I
The Small C&I EE Program serves the broad variety of PECO’s small
commercial customers with comprehensive solutions to
improve efficiency and reduce energy costs.
PY 2016 - PY 2020 357,408 62,602 97% 17%
Small C&I DR C&I PECO’s Small C&I DR program realizes demand reductions from eligible small C&I customers in PECO’s service territory during
system peak hours. This program will contribute to the portfolio-wide net system peak demand savings
annual target of 161 MW.
PY 2016 - PY 2020 0 1,226 0% 0%
PECO PY 2016-2020 Act 129 - Phase III Energy Efficiency And Conservation Plan Page 27
Program Name Program Market Program Two-Sentence Summary
Program Years Operated
Lifetime MWh Savings
kW Savings
Percentage of Portfolio Sector and Total
Lifetime MWh Savings (% / %)
CHP (Exclusive of G/E/NP) Small C&I
The PECO On-Site Program increases customer awareness and
understanding of combined heat and power technologies and
opportunities and assists customers in project planning and installation. This program serves
the broad variety of PECO's commercial customers.
PY 2016 - PY 2020 10,574 1,588 3% 1%
Totals for C&I Small Sector 367,982 65,417 100% 18%
Large C&I Portfolio Programs
Large C&I EE (Exclusive of G/E/NP) C&I
The Large C&I EE Program serves the broad variety of PECO’s largest
commercial customers with comprehensive solutions to
improve efficiency and reduce energy costs.
PY 2016 - PY 2020 415,829 99,891 69% 20%
Large C&I DR C&I PECO’s Large C&I DR program realizes demand reductions from eligible Large C&I customers in PECO’s service territory during
system peak hours. This program will contribute to the portfolio-wide net system peak demand savings
annual target of 161 MW.
PY 2016 - PY 2020 0 124,487 0% 0%

PECO PY 2016-2020 Act 129 - Phase III Energy Efficiency And Conservation Plan Page 28
Program Name Program Market Program Two-Sentence Summary
Program Years Operated
Lifetime MWh Savings
kW Savings
Percentage of Portfolio Sector and Total
Lifetime MWh Savings (% / %)
CHP (Exclusive of G/E/NP) Large C&I
The PECO On-Site Program increases customer awareness and
understanding of combined heat and power technologies and
opportunities and assists customers in project planning and installation. This program serves
the broad variety of PECO's commercial customers.
PY 2016 - PY 2020 189,548 28,529 31% 9%
Totals for C&I Large Sector 605,377 252,907 100% 29%
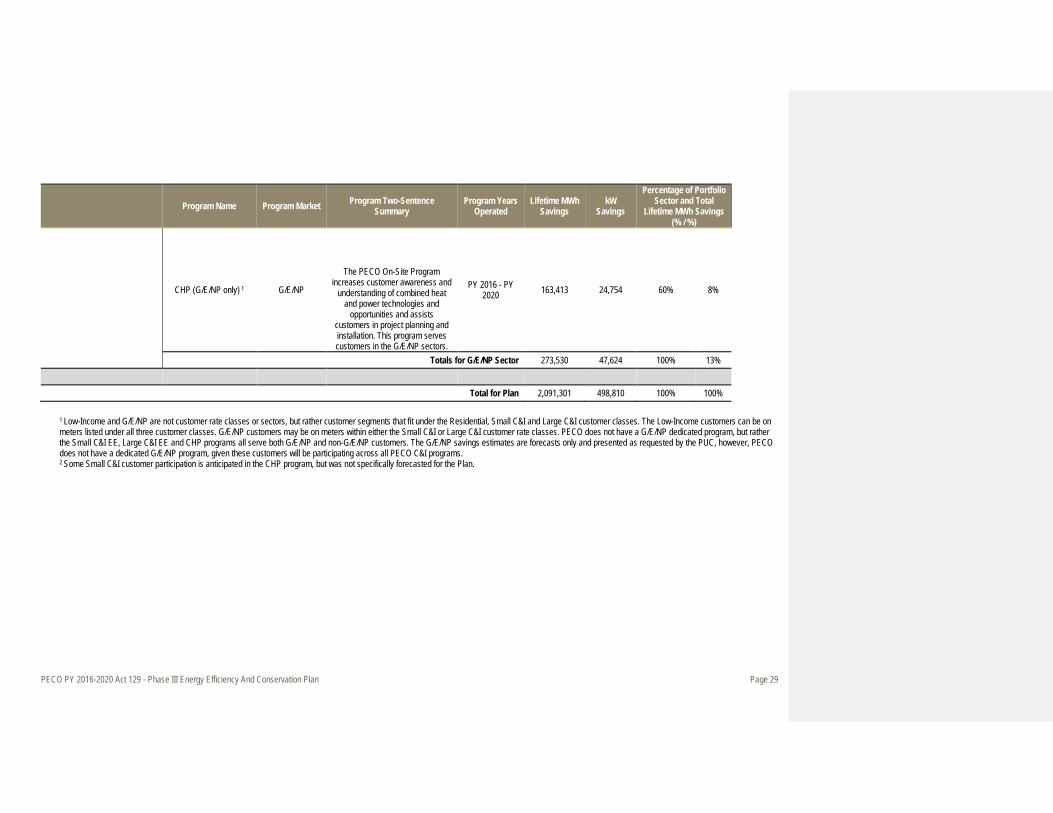
Governmental/Educational/Non-Profit Portfolio Programs
Small C&I EE (G/E/NP only) 1 G/E/NP
The purpose of the Small C&I EE Program is to serve the broad
variety of PECO’s small commercial customers in the
G/E/NP sectors with comprehensive solutions to
improve efficiency and reduce energy costs.
PY 2016 - PY 2020 45,848 7,116 17% 2%
Large C&I EE (G/E/NP only) 1 G/E/NP
The Large C&I EE Program serves the broad variety of PECO’s largest
commercial customers in the G/E/NP sectors with
comprehensive solutions to improve efficiency and reduce
energy costs.
PY 2016 - PY 2020 64,269 15,754 23% 3%
PECO PY 2016-2020 Act 129 - Phase III Energy Efficiency And Conservation Plan Page 29
Program Name Program Market Program Two-Sentence Summary
Program Years Operated
Lifetime MWh Savings
kW Savings
Percentage of Portfolio Sector and Total
Lifetime MWh Savings (% / %)
CHP (G/E/NP only) 1 G/E/NP
The PECO On-Site Program increases customer awareness and
understanding of combined heat and power technologies and
opportunities and assists customers in project planning and installation. This program serves customers in the G/E/NP sectors.
PY 2016 - PY 2020 163,413 24,754 60% 8%
Totals for G/E/NP Sector 273,530 47,624 100% 13%
Total for Plan 2,091,301 498,810 100% 100%
1 Low-Income and G/E/NP are not customer rate classes or sectors, but rather customer segments that fit under the Residential, Small C&I and Large C&I customer classes. The Low-Income customers can be on meters listed under all three customer classes. G/E/NP customers may be on meters within either the Small C&I or Large C&I customer rate classes. PECO does not have a G/E/NP dedicated program, but rather the Small C&I EE, Large C&I EE and CHP programs all serve both G/E/NP and non-G/E/NP customers. The G/E/NP savings estimates are forecasts only and presented as requested by the PUC, however, PECO does not have a dedicated G/E/NP program, given these customers will be participating across all PECO C&I programs. 2 Some Small C&I customer participation is anticipated in the CHP program, but was not specifically forecasted for the Plan.
PECO PY 2016-2020 Act 129 - Phase III Energy Efficiency And Conservation Plan Page 30
2.2 Plan Data: Costs, Cost-Effectiveness and Savings by Program, Sector and Portfolio
Various sections of this report contain the following data tables as required by the Commission’s Plan III template:
» Section 1.3: Table 5. Portfolio Summary of Lifetime Costs and Benefits of Energy Efficiency Measures
» Section 1.3: Table 6. Portfolio Summary of Lifetime Costs and Benefits of Demand Response Measures
» Section 1.3: Table 7. Summary of Portfolio Energy and Demand Savings » Section 1.3: Table 8. Summary of Portfolio Costs » Section 2.1: Table 9. Program Summaries
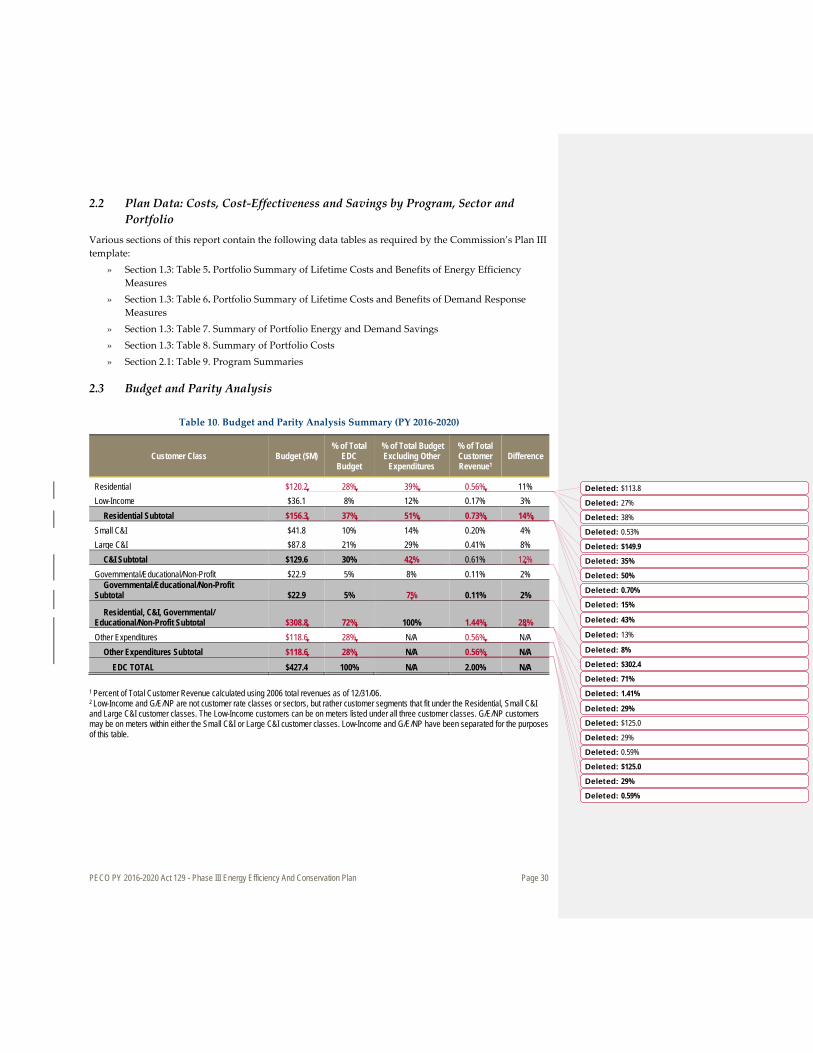
2.3 Budget and Parity Analysis
Table 10. Budget and Parity Analysis Summary (PY 2016-2020)
Customer Class Budget ($M) % of Total
EDC Budget
% of Total Budget Excluding Other
Expenditures
% of Total Customer Revenue1
Difference
Residential $120.2 28% 39% 0.56% 11% Low-Income $36.1 8% 12% 0.17% 3%
Residential Subtotal $156.3 37% 51% 0.73% 14% Small C&I $41.8 10% 14% 0.20% 4% Large C&I $87.8 21% 29% 0.41% 8%
C&I Subtotal $129.6 30% 42% 0.61% 12% Governmental/Educational/Non-Profit $22.9 5% 8% 0.11% 2%
Governmental/Educational/Non-Profit Subtotal $22.9 5% 7% 0.11% 2%
Residential, C&I, Governmental/ Educational/Non-Profit Subtotal $308.8 72% 100% 1.44% 28% Other Expenditures $118.6 28% N/A 0.56% N/A
Other Expenditures Subtotal $118.6 28% N/A 0.56% N/A EDC TOTAL $427.4 100% N/A 2.00% N/A
1 Percent of Total Customer Revenue calculated using 2006 total revenues as of 12/31/06. 2 Low-Income and G/E/NP are not customer rate classes or sectors, but rather customer segments that fit under the Residential, Small C&I and Large C&I customer classes. The Low-Income customers can be on meters listed under all three customer classes. G/E/NP customers may be on meters within either the Small C&I or Large C&I customer classes. Low-Income and G/E/NP have been separated for the purposes of this table.
Deleted: $113.8
Deleted: 27%
Deleted: 38%
Deleted: 0.53%
Deleted: $149.9
Deleted: 35%
Deleted: 50%
Deleted: 0.70%
Deleted: 15%
Deleted: 43%
Deleted: 13%
Deleted: 8%
Deleted: $302.4
Deleted: 71%
Deleted: 1.41%
Deleted: 29%
Deleted: $125.0
Deleted: 29%
Deleted: 0.59%
Deleted: $125.0
Deleted: 29%
Deleted: 0.59%

PECO PY 2016-2020 Act 129 - Phase III Energy Efficiency And Conservation Plan Page 31
3. Program Descriptions
3.1 Discussion of Criteria and Process Used for Selection of Programs
3.1.1 Portfolio Objectives and Metrics that Define Program Success
The Energy Efficiency and Conservation (EE&C) portfolio objectives are to achieve the requirements set forth in the Act 129-Phase III targets specific to PECO. This includes achieving the following milestones:
» Achieve at least 5.0% energy savings relative to PECO’s 2010 forecast kWh (1,962,659 MWh) over the five-year Plan period between June 1, 2016 and May 31, 2021.
» Invest in energy efficiency and demand response up to 2% of PECO’s annual revenue or $85.5 million per year for a not-to-exceed spending maximum of $427.4 million over the five-year period from June 1, 2016 to May 31, 2021.
» Achieve at least 3.5% of the total EE&C portfolio energy savings overall energy savings target from PECO’s G/E/NP customers.
» Achieve at least 5.5% of the overall energy savings target through a dedicated low-income program. » Achieve at least 15% of the total energy savings compliance target in each of the program years
during the five-year phase. » Achieve an average of at least 161 MW of demand savings from dedicated demand response
programs during PY 2017 - PY 2020. » Provide a comprehensive portfolio of program pathways with opportunities for all customers to
participate. In addition to monitoring the above-referenced Act 129 metrics, PECO will focus on other portfolio objectives such as: » Maintain high customer satisfaction with the EE&C program offerings » Monitor the marketplace for additional measures and solutions that could be offered in the future » Maintain a comprehensive set of energy solution offerings across all end-uses to its customers » Ensure all customer segments are appropriately represented » Present a comprehensive and appropriate set of participation channels (e.g. retail vs. direct-action vs.
contractor) through which customers can access energy solutions PECO will continuously monitor portfolio performance and make mid-course corrections as necessary.
3.1.2 Process for Program Development
The process of developing comprehensive and cost-effective energy efficiency and demand response programs requires rigorous quantitative analysis, thorough benchmarking, and a thoughtful stakeholder process. Each program is comprised of a set of measure options which are weighed and prioritized against forecast participation rates, energy saving estimates, implementation costs, and public policy goals to develop the final portfolio design. The process employed by PECO to develop this Plan includes all of these components and is illustrated in Figure 5. Each element is described in the section below.
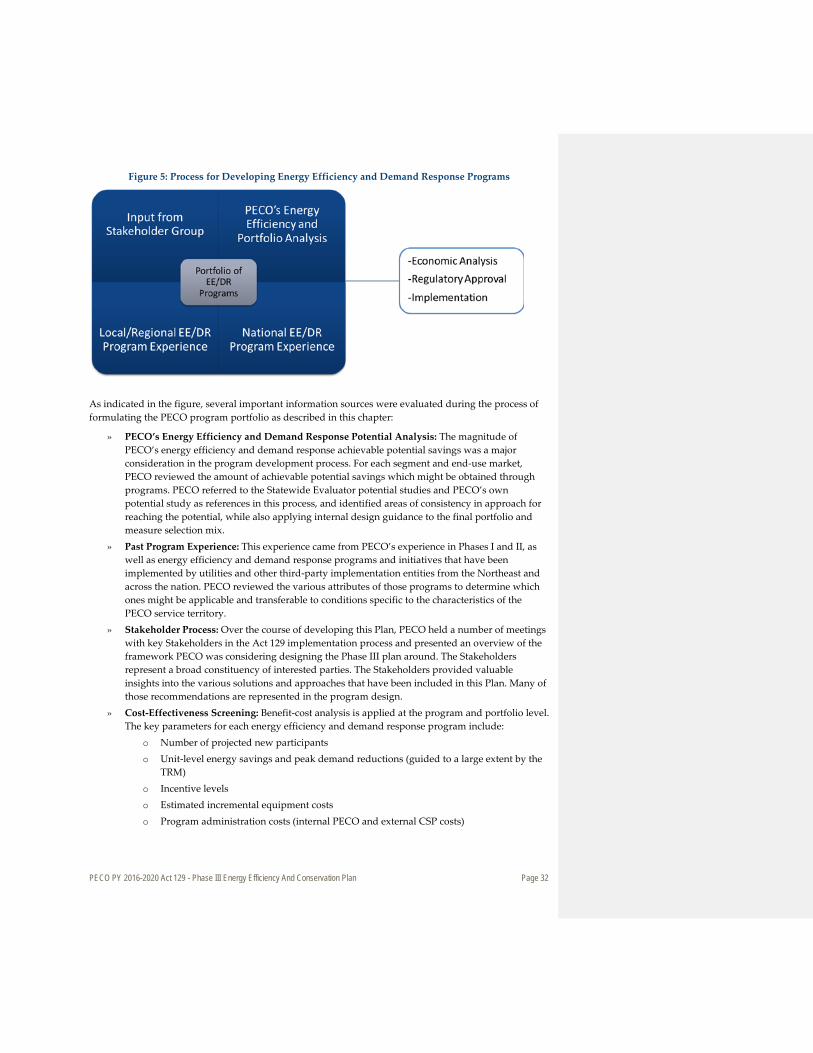
PECO PY 2016-2020 Act 129 - Phase III Energy Efficiency And Conservation Plan Page 32
Figure 5: Process for Developing Energy Efficiency and Demand Response Programs
As indicated in the figure, several important information sources were evaluated during the process of formulating the PECO program portfolio as described in this chapter:
» PECO’s Energy Efficiency and Demand Response Potential Analysis: The magnitude of PECO’s energy efficiency and demand response achievable potential savings was a major consideration in the program development process. For each segment and end-use market, PECO reviewed the amount of achievable potential savings which might be obtained through programs. PECO referred to the Statewide Evaluator potential studies and PECO’s own potential study as references in this process, and identified areas of consistency in approach for reaching the potential, while also applying internal design guidance to the final portfolio and measure selection mix.
» Past Program Experience: This experience came from PECO’s experience in Phases I and II, as well as energy efficiency and demand response programs and initiatives that have been implemented by utilities and other third-party implementation entities from the Northeast and across the nation. PECO reviewed the various attributes of those programs to determine which ones might be applicable and transferable to conditions specific to the characteristics of the PECO service territory.
» Stakeholder Process: Over the course of developing this Plan, PECO held a number of meetings with key Stakeholders in the Act 129 implementation process and presented an overview of the framework PECO was considering designing the Phase III plan around. The Stakeholders represent a broad constituency of interested parties. The Stakeholders provided valuable insights into the various solutions and approaches that have been included in this Plan. Many of those recommendations are represented in the program design.
» Cost-Effectiveness Screening: Benefit-cost analysis is applied at the program and portfolio level. The key parameters for each energy efficiency and demand response program include:
o Number of projected new participants o Unit-level energy savings and peak demand reductions (guided to a large extent by the
TRM) o Incentive levels o Estimated incremental equipment costs o Program administration costs (internal PECO and external CSP costs)
PECO PY 2016-2020 Act 129 - Phase III Energy Efficiency And Conservation Plan Page 33
3.1.3 How Energy Efficiency and Demand Response Measures Were Included in the Portfolio
3.1.3.1 Treatment of Measures in the Portfolio of Programs
Individual measures are subjected to a rigorous screening process and are ultimately bundled into the various programs. Three levels of screening are used to assess new measures:
» Level 1 – Identification of Measures » Level 2 – Qualitative Screen » Level 3 – Economic Screen
3.1.3.2 Identification of Measures
The first step of the measure savings assessment is to compile a list of energy efficiency and demand response measures that are available for consideration. A number of secondary sources are used to identify measures for consideration including measure databases for other utilities and municipalities and databases of emerging technologies.
3.1.3.3 Applicability and Qualitative Screens
The next step in the measure analysis is to qualitatively screen the measures. The purpose of this process is to isolate measures that do not belong in the portfolio of programs that PECO intends to offer. There are two steps in this process. The first is the inapplicability screen that determines whether or not each measure is applicable for implementation in the PECO service territory. If a measure is determined to have possible applications (by passing the inapplicability screen), then it would be further subjected to the qualitative screen. The qualitative screen assesses the appropriateness of each measure to the unique market conditions in the PECO service territory. Measures that failed the inapplicability and qualitative screens would not be included in further analyses. Inapplicability Screening Criteria: Three inapplicability screening criteria were applied. If a measure meets any of the three criteria, it would fail this section of the screen and be excluded from further measure-level analyses.
» Already widely implemented or required by building code: Certain measures may have already gained a high level of market penetration and saturation in the PECO service territory. This may be due to market transformation brought about by past and/or existing energy efficiency programs. An example of such a measure might be T-8 fluorescent lamps in commercial buildings. Another possibility is that the technology may have reached a point in market maturity such that customers are selecting the efficient technology over a less efficient one. Certain measures may already be required by building codes or federal energy efficiency standards, such that customers must select the measure in all new or replacement situations. An example of this type of measure might be duct insulation or hot water pipe insulation. These types of measures would already be included in the forecast baseline and there would be no additional energy savings to be gained.
» Bad match to local condition: If a measure was considered to be irrelevant or not a good match to the PECO service territory’s particular conditions, then it is not considered for measure-level analysis. An example of this type of measure is an evaporative cooler. Summers in the PECO service territory are humid, and thus an evaporative cooler would not be able to function and provide the required cooling.
» Non-verifiable or indeterminable savings: If the savings impact or costs of the measure cannot be quantified such that an economic evaluation is both possible and reasonable, then the measure is not considered any further in this study. Oftentimes, savings cannot be determined because they

PECO PY 2016-2020 Act 129 - Phase III Energy Efficiency And Conservation Plan Page 34
are too site-specific and the derivation of a savings estimate would involve making assumptions that would be difficult to verify or justify. These measures are more conducive to an assessment on a site-by-site basis. It should be noted that some of these measures might be suitable for customized programs.
Any measure that was determined to possess any of the three characteristics defined by the criteria above was eliminated from further consideration, and thus was not subjected to the qualitative screen that follows. Qualitative Screening Criteria: The purpose of the qualitative screen is to assess the appropriateness of each measure to the unique market conditions that might be expected in the PECO service territory. PECO utilized four qualitative screening criteria that are described as follows:
» Technological Maturity: Is the technology currently available commercially? If not, will the technology be commercially available within the time period that is covered under this study?
» Market Maturity: Is the technology currently supported by the necessary market infrastructure and resources? If not, will the required support be commercially available within the time period that is covered under this study?
» Customer Acceptance: Does the measure reduce comfort, productivity, or the quality of electric service to the point that customers are unwilling to install it in important markets? For example, early low-flow showerheads had spray characteristics that were so unlike what customers were used to and thus were not well liked by customers, and thus market penetration was initially very low. Similarly, demand response measures that require customers to turn off their air conditioners indefinitely during the hottest days of the year would be unacceptable to the market.
» Non-Energy Benefits: Does the measure provide additional value to the customer besides reducing energy consumption or reducing peak demand? Does the measure provide any beneficial environmental or community impacts that might enhance the quality of life?
3.1.3.4 Economic Screen
Each measure passing the qualitative screen was further assessed in an economic screen. The economic screen uses the Total Resource Cost (TRC) test (described in Section 8) to compare the lifetime benefits of each applicable measure (avoided cost times energy savings) with each measure’s lifetime costs (incremental capital and installation costs and O&M costs). The lifetime benefits are obtained by multiplying the annual energy and demand savings for each measure by the avoided cost for each year, and discounting the dollar savings to a present value equivalent basis. The measure savings, costs and lifetimes are obtained as part of the measure characterization. Not all measures are required to pass the TRC test for inclusion in the program, but the overall portfolio must pass this screening test. If too many measures were included that do not pass the TRC test, then it would push the overall portfolio out of compliance. Therefore a measure mix was sought that provides a comprehensive set of energy and demand savings measures to be offered through the programs to all customers while allowing the portfolio as a whole to pass the TRC test.
3.1.4 Comprehensiveness of Measures
PECO’s Phase III portfolio of programs was designed to include program offerings that emphasize comprehensiveness in energy efficiency and demand response savings and multiple participation pathways to address participation barriers unique to each customer segment. Special efforts were made to ensure that programs available to residential and small C&I customers offer a comprehensive set of measures, known to have reliable performance and predictable energy savings delivered in a turnkey manner. PECO’s Residential EE Program will offer measures that include air sealing and insulation, duct
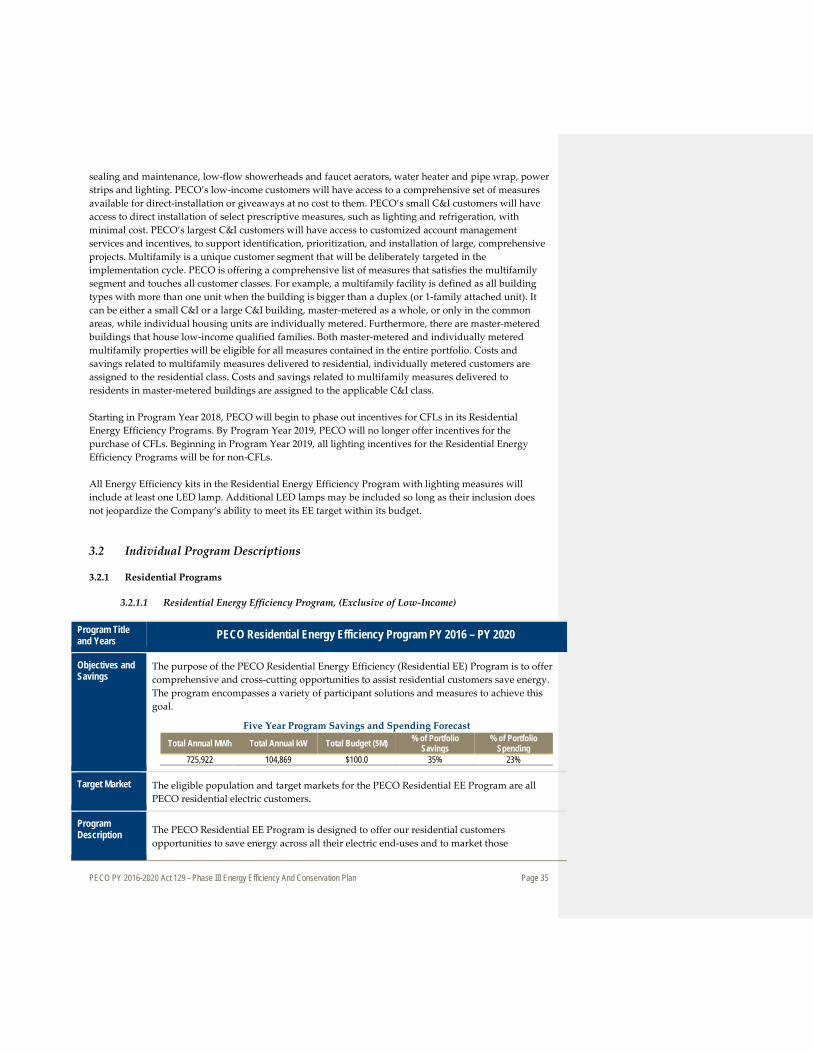
PECO PY 2016-2020 Act 129 - Phase III Energy Efficiency And Conservation Plan Page 35
sealing and maintenance, low-flow showerheads and faucet aerators, water heater and pipe wrap, power strips and lighting. PECO’s low-income customers will have access to a comprehensive set of measures available for direct-installation or giveaways at no cost to them. PECO’s small C&I customers will have access to direct installation of select prescriptive measures, such as lighting and refrigeration, with minimal cost. PECO’s largest C&I customers will have access to customized account management services and incentives, to support identification, prioritization, and installation of large, comprehensive projects. Multifamily is a unique customer segment that will be deliberately targeted in the implementation cycle. PECO is offering a comprehensive list of measures that satisfies the multifamily segment and touches all customer classes. For example, a multifamily facility is defined as all building types with more than one unit when the building is bigger than a duplex (or 1-family attached unit). It can be either a small C&I or a large C&I building, master-metered as a whole, or only in the common areas, while individual housing units are individually metered. Furthermore, there are master-metered buildings that house low-income qualified families. Both master-metered and individually metered multifamily properties will be eligible for all measures contained in the entire portfolio. Costs and savings related to multifamily measures delivered to residential, individually metered customers are assigned to the residential class. Costs and savings related to multifamily measures delivered to residents in master-metered buildings are assigned to the applicable C&I class. Starting in Program Year 2018, PECO will begin to phase out incentives for CFLs in its Residential Energy Efficiency Programs. By Program Year 2019, PECO will no longer offer incentives for the purchase of CFLs. Beginning in Program Year 2019, all lighting incentives for the Residential Energy Efficiency Programs will be for non-CFLs. All Energy Efficiency kits in the Residential Energy Efficiency Program with lighting measures will include at least one LED lamp. Additional LED lamps may be included so long as their inclusion does not jeopardize the Company’s ability to meet its EE target within its budget.
3.2 Individual Program Descriptions
3.2.1 Residential Programs
3.2.1.1 Residential Energy Efficiency Program, (Exclusive of Low-Income)
Program Title and Years PECO Residential Energy Efficiency Program PY 2016 – PY 2020
Objectives and Savings
The purpose of the PECO Residential Energy Efficiency (Residential EE) Program is to offer comprehensive and cross-cutting opportunities to assist residential customers save energy. The program encompasses a variety of participant solutions and measures to achieve this goal.
Five Year Program Savings and Spending Forecast
Total Annual MWh Total Annual kW Total Budget ($M) % of Portfolio Savings
% of Portfolio Spending
725,922 104,869 $100.0 35% 23%
Target Market The eligible population and target markets for the PECO Residential EE Program are all PECO residential electric customers.
Program Description The PECO Residential EE Program is designed to offer our residential customers
opportunities to save energy across all their electric end-uses and to market those

PECO PY 2016-2020 Act 129 - Phase III Energy Efficiency And Conservation Plan Page 36
Program Title and Years PECO Residential Energy Efficiency Program PY 2016 – PY 2020
opportunities in ways that minimize lost savings opportunities. The program encompasses a comprehensive series of Solutions designed to influence customer behavior and purchasing decisions. The Solutions in the Residential EE Program include approaches that cut across major channels for communicating with customers or trade allies, and reflect the various ways a customer may take advantage of the energy efficiency opportunities available.
The program includes Lighting, Appliances & HVAC Solutions to offer customers energy savings opportunities through a retail pathway to assist customers in purchasing the most efficient technology when they are shopping for new products. The program also includes an Appliance Recycling Solution to help customers recycle energy wasting appliances. For those customers that want to understand how to improve the energy performance of their entire home, PECO will offer the comprehensive Whole Home Solution; and when developers or customers are building a new single family or multifamily home they can take advantage of the New Construction Solution.
Multifamily buildings will be a particular focus of the Residential EE Program. Families in multifamily buildings, which are defined as building types with more than one unit when the building is bigger than a duplex or 1-family attached unit, will have access to participation opportunities for both low-cost, in-unit, direct-install measures (e.g., LEDs, CFLs, power strips, showerheads and faucet aerators) as well as opportunities to participate in higher-cost incentivized measures such as appliance replacements. Multifamily building owners will have efficiency opportunities addressing whole building components such as HVAC updates or maintenance and building shell upgrades. Both master-metered and individually metered multifamily properties will be eligible for all measures contained in the entire portfolio. Costs and savings related to multifamily measures delivered to residential, individually metered customers are assigned to the residential class.
Measures installed in common areas of multifamily buildings, the costs and savings will be assigned according to the type of meter associated with the particular common area. For multifamily buildings in which verified low-income residents comprise less than 66 percent of units, the subsidies for common areas in individually metered buildings and all subsidies for master-metered buildings, except for those subsidies provided to residences that are verified as low-income, will be consistent with those available to other customers in the rate class in which electric service is taken.
A major element of the Residential EE Program is education and awareness for those customers that want an easy entry to, and benefit from, energy efficient products. Further, PECO’s Residential EE Program will use the Behavioral Solution offering to leverage the power of social norming to drive persistent energy savings through smart energy practices.
For planning purposes, we used the following estimated forecasted savings across the Solutions:
Solution Offering Forecasted Phase III Sum
of First Year Savings (MWh)
Lighting, Appliances & HVAC 283,640
Appliance Recycling 76,882
Whole Home 37,667
Residential New Construction 4,386
Behavioral 304,999

PECO PY 2016-2020 Act 129 - Phase III Energy Efficiency And Conservation Plan Page 37
Program Title and Years PECO Residential Energy Efficiency Program PY 2016 – PY 2020
In addition there is one unique segment that will receive targeted focus: Multifamily. The Multifamily segment as defined above is estimated to contribute 18,346 MWh.
Targeted Market Segments Forecasted Phase III Sum of First Year Savings (MWh)
Multifamily 18,346
The Solution level savings projected here are estimated forecasts of activity for plan development purposes. PECO plans to spend no more $100.0M and achieve approximately 725,922 MWh from the Residential EE Program. This program is cost-effective with a gross TRC of 1.8 and net TRC of 1.6.
Implementation Strategy
PECO will administer the Residential EE Program through CSPs that have a proven record of providing the services to be offered in this program effectively.
For the Lighting, Appliances & HVAC Solution, PECO will employ a retail pathway and will offer a combination of cash rebates, and upstream- or midstream-discounts to influence the adoption of energy efficiency measures. Rebates will reduce the initial cost barrier for customers purchasing and installing qualifying efficient products including high efficiency lighting, appliances, electronics, HVAC and water heating equipment that are typically sold through major retail outlets or through HVAC trade ally contractors.
PECO will offer the New Construction Solution and certain equipment replacement solutions through a trade ally and contractor pathway where PECO will collaborate with the community of architects, builders, and contractors to design and promote ENERGY STAR homes or other new construction standards that meet high energy efficiency performance standards. In many cases residential customers face decisions to replace certain equipment through contractors such as HVAC or water heating equipment. This pathway will also ensure that our residential customers have the opportunity to take advantage of our solutions when they are facing these types of projects in their homes.
The remaining solutions included in the Residential EE Program will be delivered through a direct action pathway where PECO will offer customer energy audits and assessments, and directly install energy efficiency improvements in customer homes and apartments at no cost, or significantly reduced cost, to the customer. Appliance recycling opportunities will be provided and homeowners and renters will be engaged directly to make products and informational material readily available through product giveaways, energy kits, an online web store, or opt-in direct mail technology as an option in-lieu of rebates.
The Behavioral Solution involves providing both digital and paper versions of home energy reports that compares the customers’ electric consumption to similar households and makes personalized recommendations for the participates to use energy more efficiently. Other behavioral awareness tactics that may be utilized include real-time energy displays, social media updates, and community energy competitions.
Overview of Roles and Activities
PECO will lead the marketing efforts for the Residential EE Program, and will hire and manage experienced CSPs for implementation of the solutions within the program. PECO
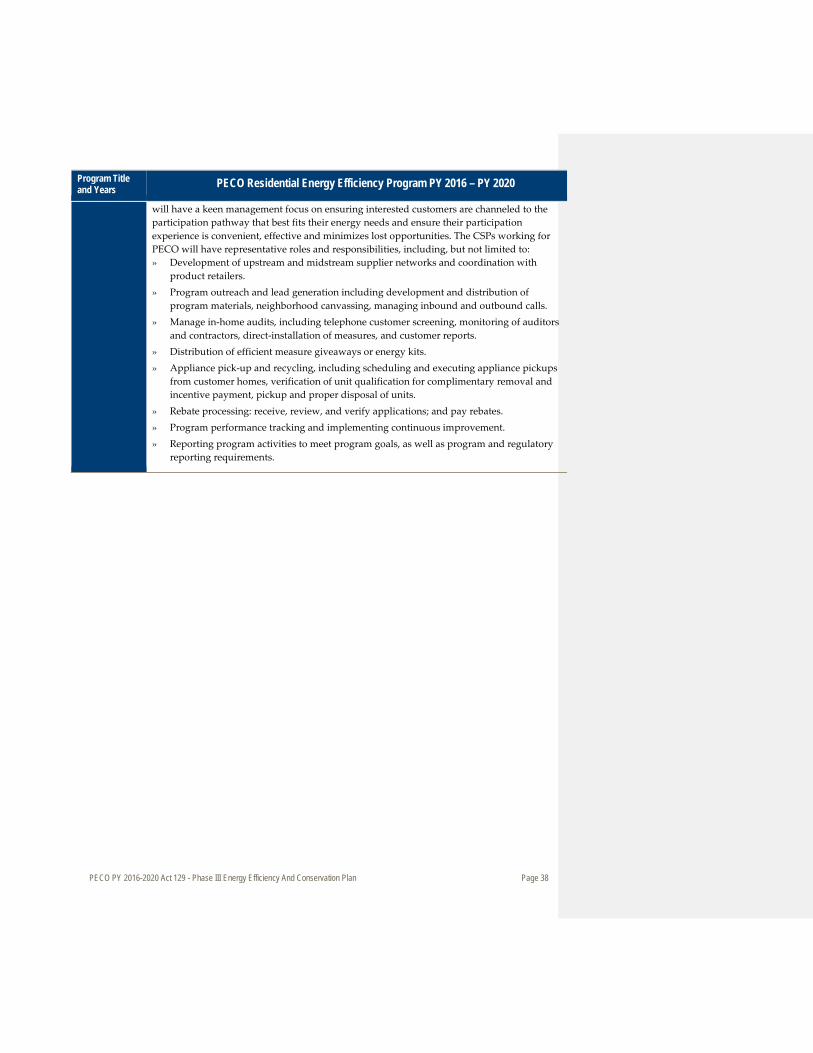
PECO PY 2016-2020 Act 129 - Phase III Energy Efficiency And Conservation Plan Page 38
Program Title and Years PECO Residential Energy Efficiency Program PY 2016 – PY 2020
will have a keen management focus on ensuring interested customers are channeled to the participation pathway that best fits their energy needs and ensure their participation experience is convenient, effective and minimizes lost opportunities. The CSPs working for PECO will have representative roles and responsibilities, including, but not limited to: » Development of upstream and midstream supplier networks and coordination with
product retailers. » Program outreach and lead generation including development and distribution of
program materials, neighborhood canvassing, managing inbound and outbound calls. » Manage in-home audits, including telephone customer screening, monitoring of auditors
and contractors, direct-installation of measures, and customer reports. » Distribution of efficient measure giveaways or energy kits. » Appliance pick-up and recycling, including scheduling and executing appliance pickups
from customer homes, verification of unit qualification for complimentary removal and incentive payment, pickup and proper disposal of units.
» Rebate processing: receive, review, and verify applications; and pay rebates. » Program performance tracking and implementing continuous improvement. » Reporting program activities to meet program goals, as well as program and regulatory
reporting requirements.
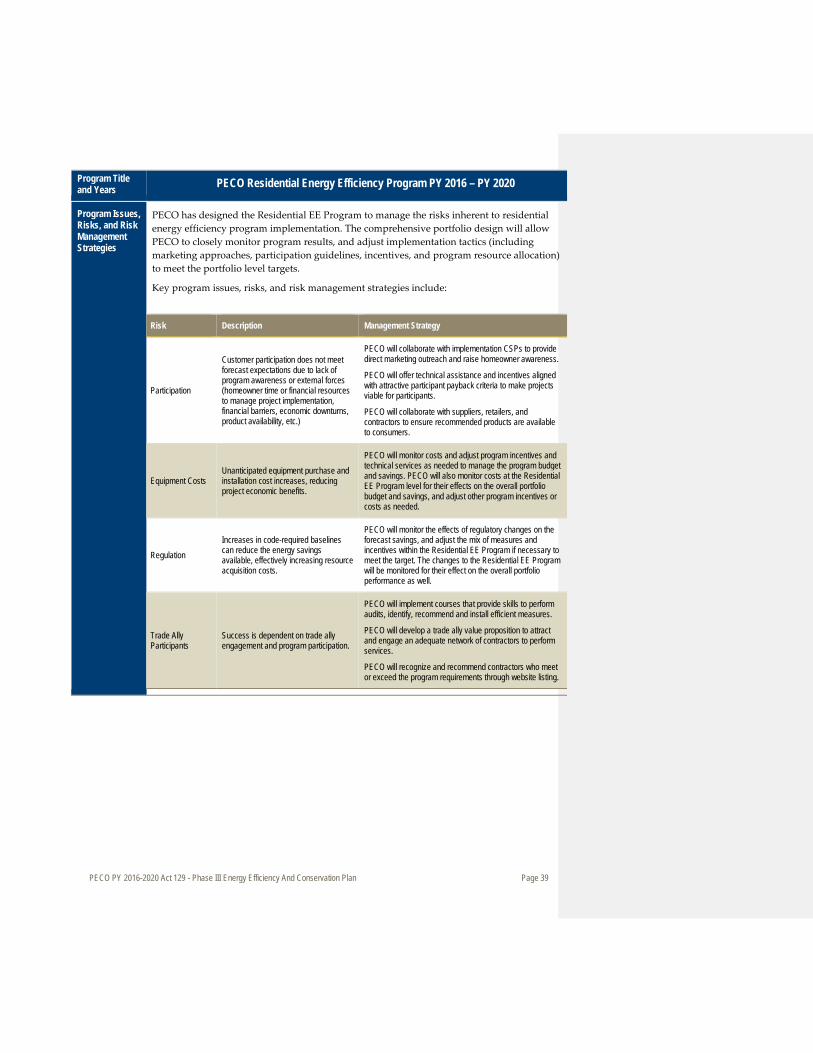
PECO PY 2016-2020 Act 129 - Phase III Energy Efficiency And Conservation Plan Page 39
Program Title and Years PECO Residential Energy Efficiency Program PY 2016 – PY 2020
Program Issues, Risks, and Risk Management Strategies
PECO has designed the Residential EE Program to manage the risks inherent to residential energy efficiency program implementation. The comprehensive portfolio design will allow PECO to closely monitor program results, and adjust implementation tactics (including marketing approaches, participation guidelines, incentives, and program resource allocation) to meet the portfolio level targets.
Key program issues, risks, and risk management strategies include:
Risk Description Management Strategy
Participation
Customer participation does not meet forecast expectations due to lack of program awareness or external forces (homeowner time or financial resources to manage project implementation, financial barriers, economic downturns, product availability, etc.)
PECO will collaborate with implementation CSPs to provide direct marketing outreach and raise homeowner awareness.
PECO will offer technical assistance and incentives aligned with attractive participant payback criteria to make projects viable for participants.
PECO will collaborate with suppliers, retailers, and contractors to ensure recommended products are available to consumers.
Equipment Costs Unanticipated equipment purchase and installation cost increases, reducing project economic benefits.
PECO will monitor costs and adjust program incentives and technical services as needed to manage the program budget and savings. PECO will also monitor costs at the Residential EE Program level for their effects on the overall portfolio budget and savings, and adjust other program incentives or costs as needed.
Regulation Increases in code-required baselines can reduce the energy savings available, effectively increasing resource acquisition costs.
PECO will monitor the effects of regulatory changes on the forecast savings, and adjust the mix of measures and incentives within the Residential EE Program if necessary to meet the target. The changes to the Residential EE Program will be monitored for their effect on the overall portfolio performance as well.
Trade Ally Participants
Success is dependent on trade ally engagement and program participation.
PECO will implement courses that provide skills to perform audits, identify, recommend and install efficient measures.
PECO will develop a trade ally value proposition to attract and engage an adequate network of contractors to perform services.
PECO will recognize and recommend contractors who meet or exceed the program requirements through website listing.

PECO PY 2016-2020 Act 129 - Phase III Energy Efficiency And Conservation Plan Page 40
Program Title and Years PECO Residential Energy Efficiency Program PY 2016 – PY 2020
Marketing Strategy
PECO will provide customers with an enhanced experience, where each inbound customer contact is treated as personal and unique, and where each outbound response to the customer is determined by the customer’s inbound engagement history along with his/her communication and customer/utility engagement preference. PECO’s marketing strategy will provide a customer-centric experience and approach with a deliberate management focus on making participation in comprehensive energy solutions easy, convenient and a smart choice for customers. PECO will continue to develop and execute a broad awareness campaign in support of the overall plan. PECO will also develop and execute program and Solution level strategies to generate interest and participation in the program by focusing on the customer relationship and stream of offerings we can provide to help homeowners and renters use energy more efficiently. PECO will engage with customers both directly and through indirect channels. A list of key consumer targets includes:
• All PECO residential electric account customers • Current and past PECO efficiency program participants • Non-participating customers • New construction design and builder trade allies • Installation trade allies including HVAC, lighting, etc. • Suppliers and retailers
PECO will develop communication protocols that will seek to reach prospective customers at the right time, through the right channel, with the right message. This will require customer data analysis and segmentation; testing, tracking and multiple channel deployment strategies. PECO will make regular adjustments to communication protocols and deployment strategies to achieve the program goals, balancing program participation and changes in market conditions. PECO will use a variety of deployment strategies to meet the specific needs of each program Solution offering, which may include:
• Direct Marketing o Direct mail o Email marketing o Direct response digital o Outbound calling
• General Awareness o Special sponsorships o Banner Ads o TV, Radio
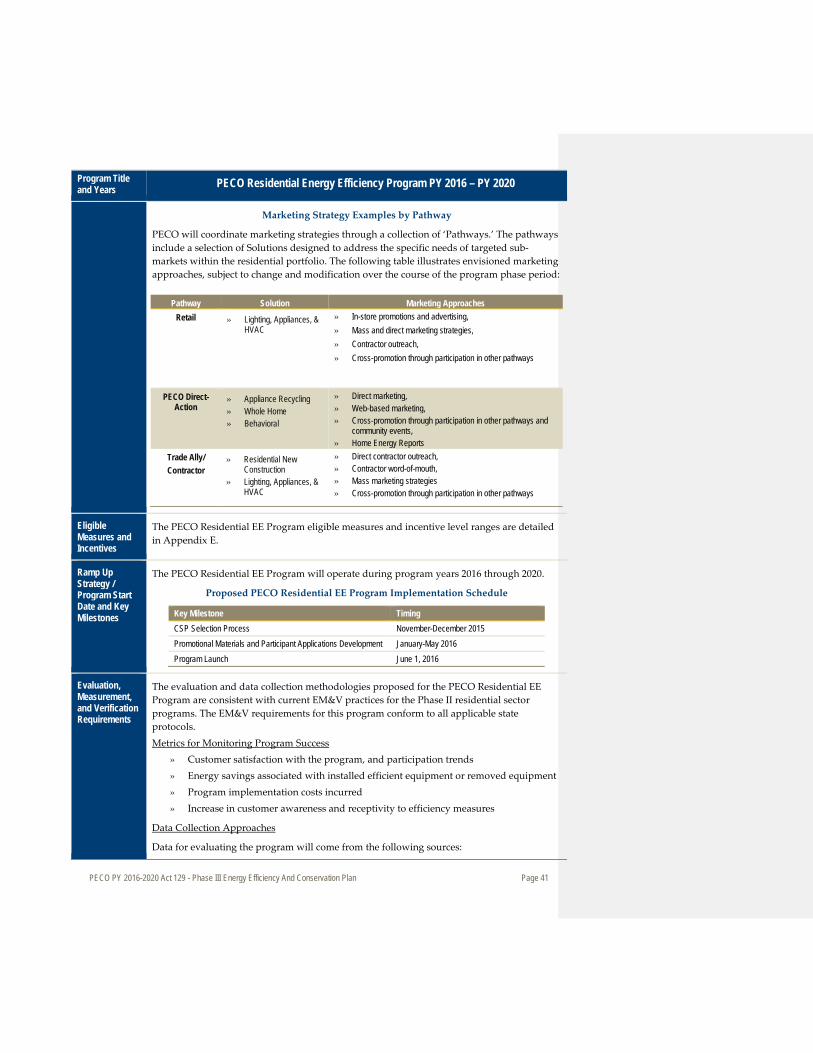
PECO PY 2016-2020 Act 129 - Phase III Energy Efficiency And Conservation Plan Page 41
Program Title and Years PECO Residential Energy Efficiency Program PY 2016 – PY 2020
Marketing Strategy Examples by Pathway
PECO will coordinate marketing strategies through a collection of ‘Pathways.’ The pathways include a selection of Solutions designed to address the specific needs of targeted sub-markets within the residential portfolio. The following table illustrates envisioned marketing approaches, subject to change and modification over the course of the program phase period:
Pathway Solution Marketing Approaches Retail » Lighting, Appliances, &
HVAC » In-store promotions and advertising, » Mass and direct marketing strategies, » Contractor outreach, » Cross-promotion through participation in other pathways
PECO Direct-Action
» Appliance Recycling » Whole Home » Behavioral
» Direct marketing, » Web-based marketing, » Cross-promotion through participation in other pathways and
community events, » Home Energy Reports
Trade Ally/ Contractor
» Residential New Construction
» Lighting, Appliances, & HVAC
» Direct contractor outreach, » Contractor word-of-mouth, » Mass marketing strategies » Cross-promotion through participation in other pathways
Eligible Measures and Incentives
The PECO Residential EE Program eligible measures and incentive level ranges are detailed in Appendix E.
Ramp Up Strategy / Program Start Date and Key Milestones
The PECO Residential EE Program will operate during program years 2016 through 2020.
Proposed PECO Residential EE Program Implementation Schedule
Key Milestone Timing CSP Selection Process November-December 2015 Promotional Materials and Participant Applications Development January-May 2016 Program Launch June 1, 2016
Evaluation, Measurement, and Verification Requirements
The evaluation and data collection methodologies proposed for the PECO Residential EE Program are consistent with current EM&V practices for the Phase II residential sector programs. The EM&V requirements for this program conform to all applicable state protocols. Metrics for Monitoring Program Success
» Customer satisfaction with the program, and participation trends » Energy savings associated with installed efficient equipment or removed equipment » Program implementation costs incurred » Increase in customer awareness and receptivity to efficiency measures
Data Collection Approaches
Data for evaluating the program will come from the following sources:
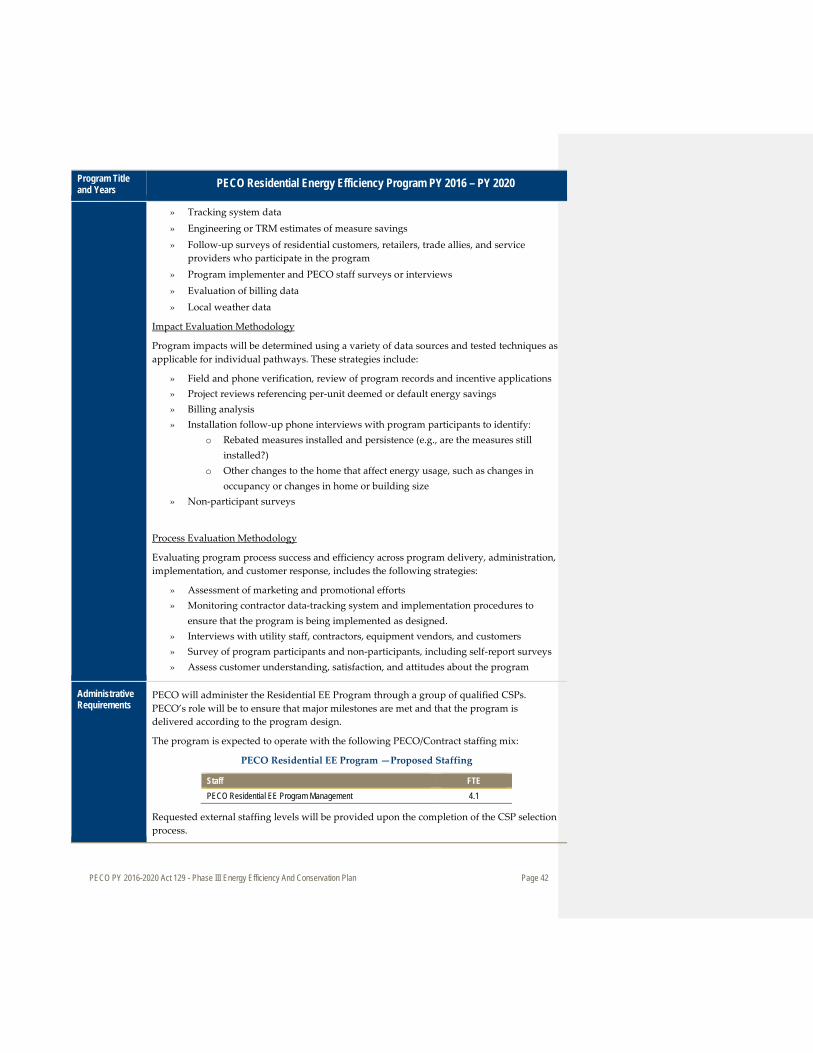
PECO PY 2016-2020 Act 129 - Phase III Energy Efficiency And Conservation Plan Page 42
Program Title and Years PECO Residential Energy Efficiency Program PY 2016 – PY 2020
» Tracking system data » Engineering or TRM estimates of measure savings » Follow-up surveys of residential customers, retailers, trade allies, and service
providers who participate in the program » Program implementer and PECO staff surveys or interviews » Evaluation of billing data » Local weather data
Impact Evaluation Methodology
Program impacts will be determined using a variety of data sources and tested techniques as applicable for individual pathways. These strategies include:
» Field and phone verification, review of program records and incentive applications » Project reviews referencing per-unit deemed or default energy savings » Billing analysis » Installation follow-up phone interviews with program participants to identify:
o Rebated measures installed and persistence (e.g., are the measures still installed?)
o Other changes to the home that affect energy usage, such as changes in occupancy or changes in home or building size
» Non-participant surveys
Process Evaluation Methodology
Evaluating program process success and efficiency across program delivery, administration, implementation, and customer response, includes the following strategies:
» Assessment of marketing and promotional efforts » Monitoring contractor data-tracking system and implementation procedures to
ensure that the program is being implemented as designed. » Interviews with utility staff, contractors, equipment vendors, and customers » Survey of program participants and non-participants, including self-report surveys » Assess customer understanding, satisfaction, and attitudes about the program
Administrative Requirements
PECO will administer the Residential EE Program through a group of qualified CSPs. PECO’s role will be to ensure that major milestones are met and that the program is delivered according to the program design.
The program is expected to operate with the following PECO/Contract staffing mix:
PECO Residential EE Program —Proposed Staffing
Staff FTE PECO Residential EE Program Management 4.1
Requested external staffing levels will be provided upon the completion of the CSP selection process.
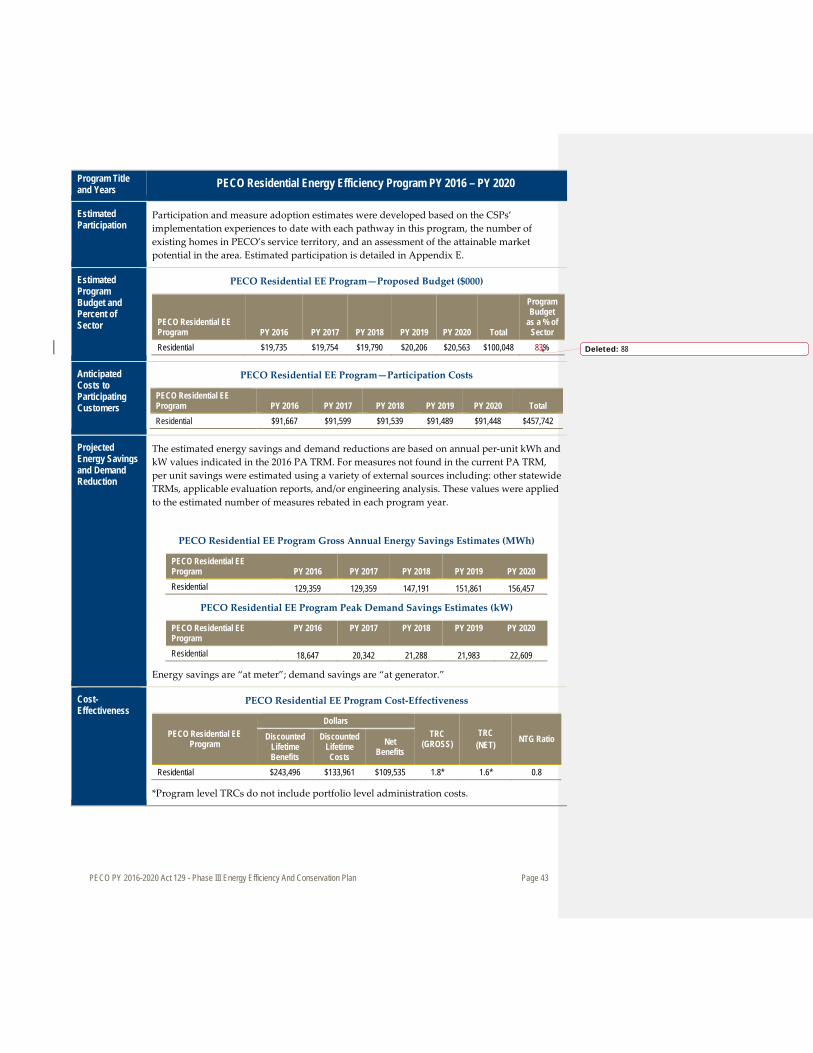
PECO PY 2016-2020 Act 129 - Phase III Energy Efficiency And Conservation Plan Page 43
Program Title and Years PECO Residential Energy Efficiency Program PY 2016 – PY 2020
Estimated Participation
Participation and measure adoption estimates were developed based on the CSPs’ implementation experiences to date with each pathway in this program, the number of existing homes in PECO’s service territory, and an assessment of the attainable market potential in the area. Estimated participation is detailed in Appendix E.
Estimated Program Budget and Percent of Sector
PECO Residential EE Program—Proposed Budget ($000)
PECO Residential EE Program PY 2016 PY 2017 PY 2018 PY 2019 PY 2020 Total
Program Budget
as a % of Sector
Residential $19,735 $19,754 $19,790 $20,206 $20,563 $100,048 83%
Anticipated Costs to Participating Customers
PECO Residential EE Program—Participation Costs
PECO Residential EE Program PY 2016 PY 2017 PY 2018 PY 2019 PY 2020 Total Residential $91,667 $91,599 $91,539 $91,489 $91,448 $457,742
Projected Energy Savings and Demand Reduction
The estimated energy savings and demand reductions are based on annual per-unit kWh and kW values indicated in the 2016 PA TRM. For measures not found in the current PA TRM, per unit savings were estimated using a variety of external sources including: other statewide TRMs, applicable evaluation reports, and/or engineering analysis. These values were applied to the estimated number of measures rebated in each program year.
PECO Residential EE Program Gross Annual Energy Savings Estimates (MWh)
PECO Residential EE Program PY 2016 PY 2017 PY 2018 PY 2019 PY 2020 Residential 129,359 129,359 147,191 151,861 156,457
PECO Residential EE Program Peak Demand Savings Estimates (kW)
PECO Residential EE Program
PY 2016 PY 2017 PY 2018 PY 2019 PY 2020
Residential 18,647 20,342 21,288 21,983 22,609
Energy savings are “at meter”; demand savings are “at generator.”
Cost-Effectiveness
PECO Residential EE Program Cost-Effectiveness
PECO Residential EE Program
Dollars TRC
(GROSS) TRC
(NET) NTG Ratio Discounted Lifetime Benefits
Discounted Lifetime Costs
Net Benefits
Residential $243,496 $133,961 $109,535 1.8* 1.6* 0.8
*Program level TRCs do not include portfolio level administration costs.
Deleted: 88
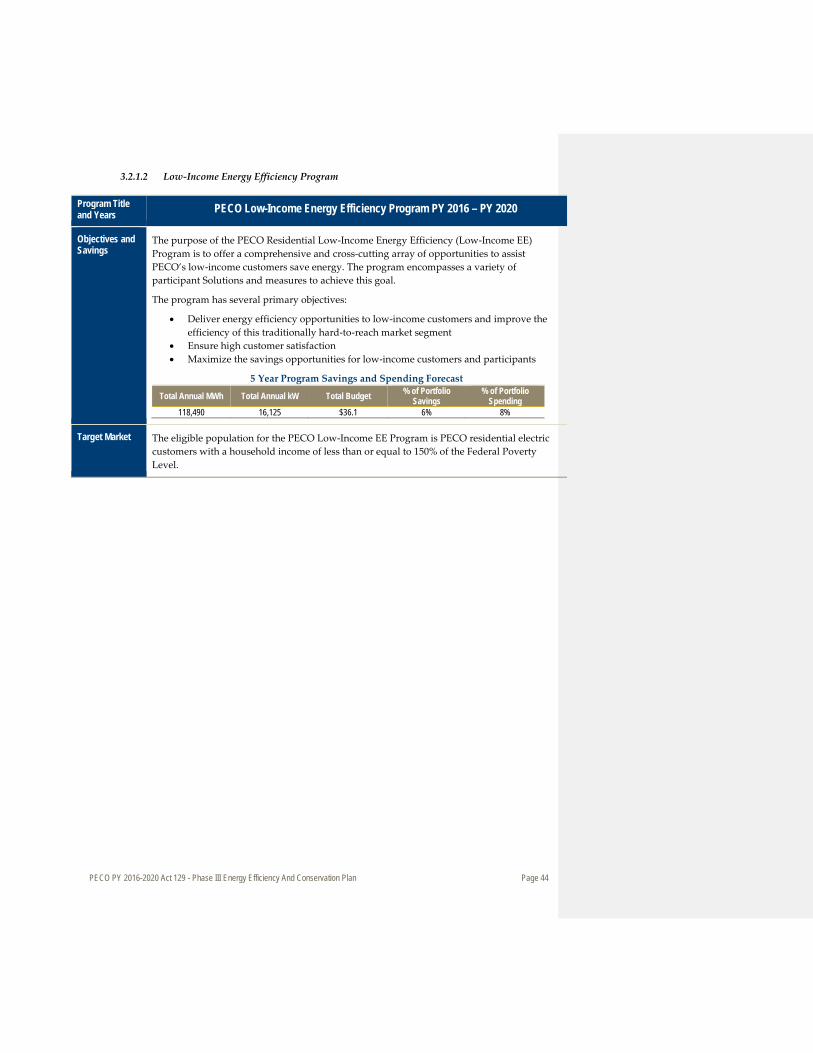
PECO PY 2016-2020 Act 129 - Phase III Energy Efficiency And Conservation Plan Page 44
3.2.1.2 Low-Income Energy Efficiency Program
Program Title and Years PECO Low-Income Energy Efficiency Program PY 2016 – PY 2020
Objectives and Savings
The purpose of the PECO Residential Low-Income Energy Efficiency (Low-Income EE) Program is to offer a comprehensive and cross-cutting array of opportunities to assist PECO’s low-income customers save energy. The program encompasses a variety of participant Solutions and measures to achieve this goal.
The program has several primary objectives:
• Deliver energy efficiency opportunities to low-income customers and improve the efficiency of this traditionally hard-to-reach market segment
• Ensure high customer satisfaction • Maximize the savings opportunities for low-income customers and participants
5 Year Program Savings and Spending Forecast
Total Annual MWh Total Annual kW Total Budget % of Portfolio Savings
% of Portfolio Spending
118,490 16,125 $36.1 6% 8%
Target Market The eligible population for the PECO Low-Income EE Program is PECO residential electric customers with a household income of less than or equal to 150% of the Federal Poverty Level.
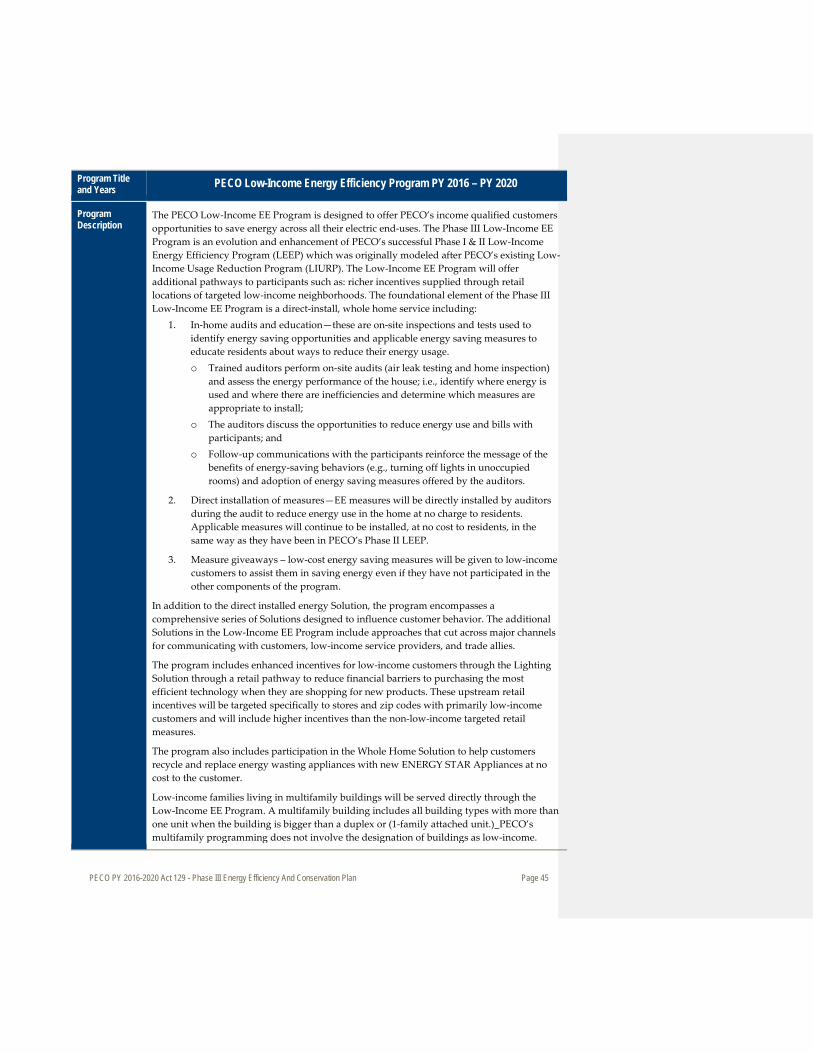
PECO PY 2016-2020 Act 129 - Phase III Energy Efficiency And Conservation Plan Page 45
Program Title and Years PECO Low-Income Energy Efficiency Program PY 2016 – PY 2020
Program Description
The PECO Low-Income EE Program is designed to offer PECO’s income qualified customers opportunities to save energy across all their electric end-uses. The Phase III Low-Income EE Program is an evolution and enhancement of PECO’s successful Phase I & II Low-Income Energy Efficiency Program (LEEP) which was originally modeled after PECO’s existing Low-Income Usage Reduction Program (LIURP). The Low-Income EE Program will offer additional pathways to participants such as: richer incentives supplied through retail locations of targeted low-income neighborhoods. The foundational element of the Phase III Low-Income EE Program is a direct-install, whole home service including:
1. In-home audits and education—these are on-site inspections and tests used to identify energy saving opportunities and applicable energy saving measures to educate residents about ways to reduce their energy usage. o Trained auditors perform on-site audits (air leak testing and home inspection)
and assess the energy performance of the house; i.e., identify where energy is used and where there are inefficiencies and determine which measures are appropriate to install;
o The auditors discuss the opportunities to reduce energy use and bills with participants; and
o Follow-up communications with the participants reinforce the message of the benefits of energy-saving behaviors (e.g., turning off lights in unoccupied rooms) and adoption of energy saving measures offered by the auditors.
2. Direct installation of measures—EE measures will be directly installed by auditors during the audit to reduce energy use in the home at no charge to residents. Applicable measures will continue to be installed, at no cost to residents, in the same way as they have been in PECO’s Phase II LEEP.
3. Measure giveaways – low-cost energy saving measures will be given to low-income customers to assist them in saving energy even if they have not participated in the other components of the program.
In addition to the direct installed energy Solution, the program encompasses a comprehensive series of Solutions designed to influence customer behavior. The additional Solutions in the Low-Income EE Program include approaches that cut across major channels for communicating with customers, low-income service providers, and trade allies.
The program includes enhanced incentives for low-income customers through the Lighting Solution through a retail pathway to reduce financial barriers to purchasing the most efficient technology when they are shopping for new products. These upstream retail incentives will be targeted specifically to stores and zip codes with primarily low-income customers and will include higher incentives than the non-low-income targeted retail measures.
The program also includes participation in the Whole Home Solution to help customers recycle and replace energy wasting appliances with new ENERGY STAR Appliances at no cost to the customer.
Low-income families living in multifamily buildings will be served directly through the Low-Income EE Program. A multifamily building includes all building types with more than one unit when the building is bigger than a duplex or (1-family attached unit.)_PECO’s multifamily programming does not involve the designation of buildings as low-income.
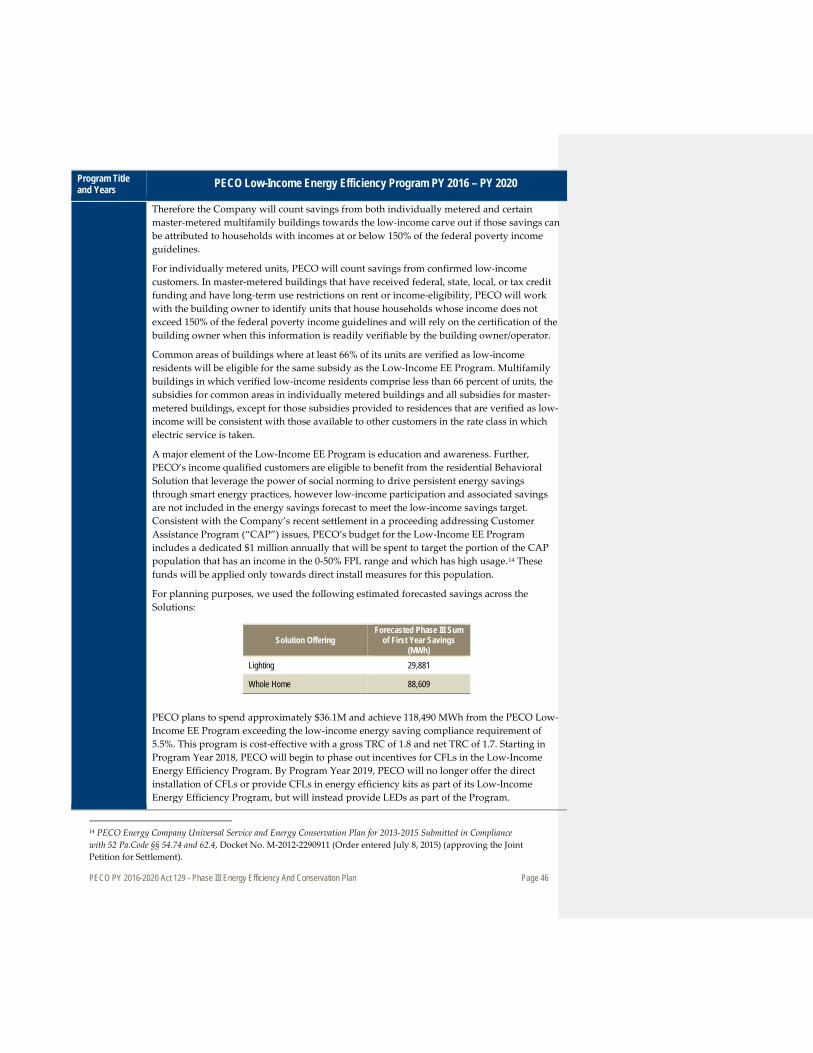
PECO PY 2016-2020 Act 129 - Phase III Energy Efficiency And Conservation Plan Page 46
Program Title and Years PECO Low-Income Energy Efficiency Program PY 2016 – PY 2020
Therefore the Company will count savings from both individually metered and certain master-metered multifamily buildings towards the low-income carve out if those savings can be attributed to households with incomes at or below 150% of the federal poverty income guidelines.
For individually metered units, PECO will count savings from confirmed low-income customers. In master-metered buildings that have received federal, state, local, or tax credit funding and have long-term use restrictions on rent or income-eligibility, PECO will work with the building owner to identify units that house households whose income does not exceed 150% of the federal poverty income guidelines and will rely on the certification of the building owner when this information is readily verifiable by the building owner/operator.
Common areas of buildings where at least 66% of its units are verified as low-income residents will be eligible for the same subsidy as the Low-Income EE Program. Multifamily buildings in which verified low-income residents comprise less than 66 percent of units, the subsidies for common areas in individually metered buildings and all subsidies for master-metered buildings, except for those subsidies provided to residences that are verified as low-income will be consistent with those available to other customers in the rate class in which electric service is taken.
A major element of the Low-Income EE Program is education and awareness. Further, PECO’s income qualified customers are eligible to benefit from the residential Behavioral Solution that leverage the power of social norming to drive persistent energy savings through smart energy practices, however low-income participation and associated savings are not included in the energy savings forecast to meet the low-income savings target. Consistent with the Company’s recent settlement in a proceeding addressing Customer Assistance Program (“CAP”) issues, PECO’s budget for the Low-Income EE Program includes a dedicated $1 million annually that will be spent to target the portion of the CAP population that has an income in the 0-50% FPL range and which has high usage.14 These funds will be applied only towards direct install measures for this population.
For planning purposes, we used the following estimated forecasted savings across the Solutions:
Solution Offering Forecasted Phase III Sum
of First Year Savings (MWh)
Lighting 29,881
Whole Home 88,609
PECO plans to spend approximately $36.1M and achieve 118,490 MWh from the PECO Low-Income EE Program exceeding the low-income energy saving compliance requirement of 5.5%. This program is cost-effective with a gross TRC of 1.8 and net TRC of 1.7. Starting in Program Year 2018, PECO will begin to phase out incentives for CFLs in the Low-Income Energy Efficiency Program. By Program Year 2019, PECO will no longer offer the direct installation of CFLs or provide CFLs in energy efficiency kits as part of its Low-Income Energy Efficiency Program, but will instead provide LEDs as part of the Program.
14 PECO Energy Company Universal Service and Energy Conservation Plan for 2013-2015 Submitted in Compliance with 52 Pa.Code §§ 54.74 and 62.4, Docket No. M-2012-2290911 (Order entered July 8, 2015) (approving the Joint Petition for Settlement).
PECO PY 2016-2020 Act 129 - Phase III Energy Efficiency And Conservation Plan Page 47
Program Title and Years PECO Low-Income Energy Efficiency Program PY 2016 – PY 2020
Distribution of energy efficiency kits as part of the Low-Income Energy Efficiency Program will be accompanied by an interactive educational component informing the kit recipient about how to install the contents of the kit and the benefits of that installation. A Conservation Service Provider completing direct installation measures as part of the Low-Income Energy Efficiency Program will provide an energy efficiency kit to the recipient of those measures if the Conservation Service Provider believes it would be beneficial for the recipient and would not be duplicative of the measures that were already installed.
PECO PY 2016-2020 Act 129 - Phase III Energy Efficiency And Conservation Plan Page 48
Program Title and Years PECO Low-Income Energy Efficiency Program PY 2016 – PY 2020
Implementation Strategy
PECO will administer the Low-Income EE Program through CSPs that have a proven record of providing the services to be offered in this program effectively.
The core delivery of this dedicated low-income program will be through the direct action pathway where PECO will offer customers energy audits and assessments, and directly install energy efficiency improvements in customer homes and apartments at no cost to the customer. PECO will directly install improvements in apartments at no cost to the income qualified customers and property owners of income qualified multifamily housing. PECO will also directly install improvements to the common areas of multifamily buildings at no cost or significantly reduced costs to the property owners. Appliance recycling and replacement opportunities will be provided in addition to engaging directly with homeowners and renters to make products and informational material readily available through product giveaways, energy kits, an online web store, and/or opt-in direct mail technology as an option in lieu of rebates.
Phase II evaluations have shown that low-income customers have a harder time participating in the standard upstream and midstream rebate offerings because they are less likely to frequent the existing participating retailers. In Phase III, PECO provide enhanced upstream and midstream rebates (relative to the non-low-income targeted incentives) through the Lighting Solution targeting retailers located in low-income specific neighborhoods and zip codes. This Solution offering will employ a retail pathway offering a combination of cash rebates, upstream, or midstream discounts to influence the adoption of energy efficiency measures. These increased incentive levels will be provided above the standard upstream and midstream incentives to serve income qualified customers where they shop. Rebates will significantly reduce the initial cost barrier for low-income customers purchasing and installing qualifying efficient products including high efficiency lighting, appliances, electronics, HVAC and water heating, that are typically sold through major retail outlets or through HVAC trade ally contractors.
Overview of Roles and Activities
PECO will collaborate with implementation CSPs for delivery of all aspects of the program. Activities will include:
» Development of upstream and midstream supplier networks and coordination with product retailers in historically low-income neighborhoods.
» Program outreach and lead generation including development and distribution of program materials, neighborhood canvassing, managing inbound and outbound calls.
» Manage in-home audits, including telephone customer screening, monitoring of auditors and contractors, direct-installation of measures, and customer reports.
» Distribution of efficient measure giveaways and energy kits. » Appliance pick-up and recycling, including scheduling and executing appliance
pickups from customer homes, verification of unit qualification for complimentary removal and incentive payment, pickup and proper disposal of units.
» Rebate processing: receive, review, and verify applications; and pay rebates. » Program performance tracking and implementing continuous improvement. » Reporting program activities to meet program goals, as well as program and
regulatory reporting requirements.
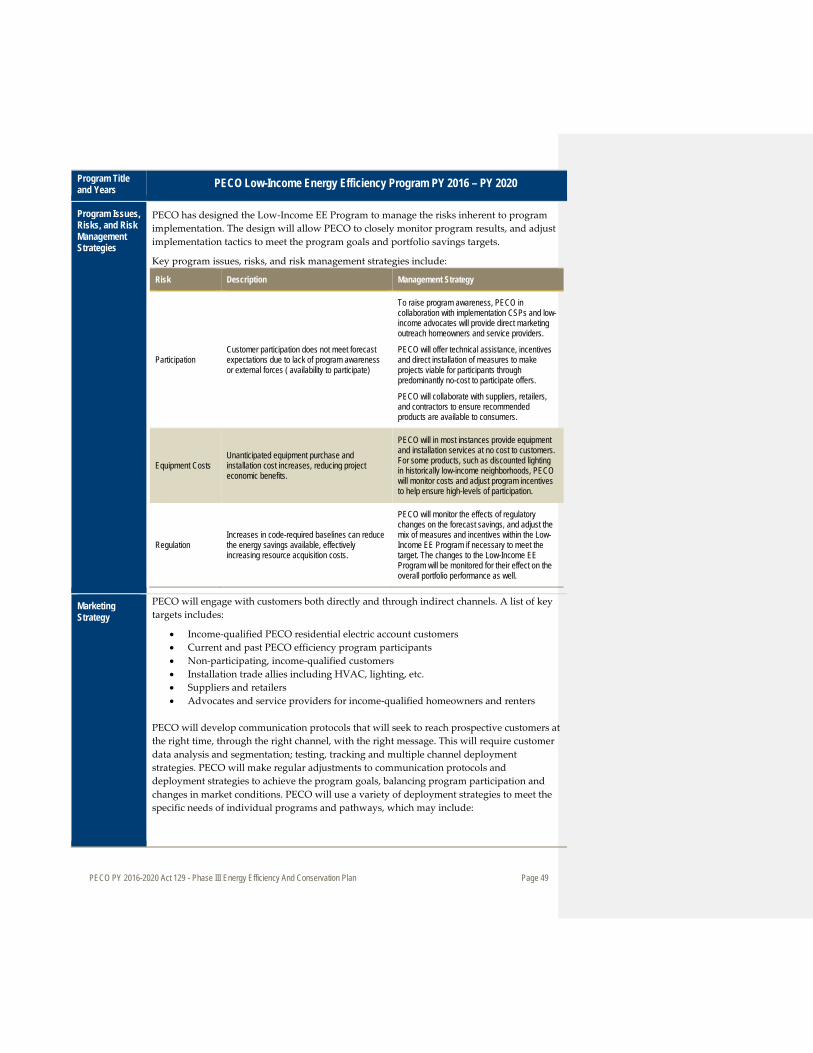
PECO PY 2016-2020 Act 129 - Phase III Energy Efficiency And Conservation Plan Page 49
Program Title and Years PECO Low-Income Energy Efficiency Program PY 2016 – PY 2020
Program Issues, Risks, and Risk Management Strategies
PECO has designed the Low-Income EE Program to manage the risks inherent to program implementation. The design will allow PECO to closely monitor program results, and adjust implementation tactics to meet the program goals and portfolio savings targets.
Key program issues, risks, and risk management strategies include:
Risk Description Management Strategy
Participation Customer participation does not meet forecast expectations due to lack of program awareness or external forces ( availability to participate)
To raise program awareness, PECO in collaboration with implementation CSPs and low-income advocates will provide direct marketing outreach homeowners and service providers.
PECO will offer technical assistance, incentives and direct installation of measures to make projects viable for participants through predominantly no-cost to participate offers.
PECO will collaborate with suppliers, retailers, and contractors to ensure recommended products are available to consumers.
Equipment Costs Unanticipated equipment purchase and installation cost increases, reducing project economic benefits.
PECO will in most instances provide equipment and installation services at no cost to customers. For some products, such as discounted lighting in historically low-income neighborhoods, PECO will monitor costs and adjust program incentives to help ensure high-levels of participation.
Regulation Increases in code-required baselines can reduce the energy savings available, effectively increasing resource acquisition costs.
PECO will monitor the effects of regulatory changes on the forecast savings, and adjust the mix of measures and incentives within the Low-Income EE Program if necessary to meet the target. The changes to the Low-Income EE Program will be monitored for their effect on the overall portfolio performance as well.
Marketing Strategy
PECO will engage with customers both directly and through indirect channels. A list of key targets includes:
• Income-qualified PECO residential electric account customers • Current and past PECO efficiency program participants • Non-participating, income-qualified customers • Installation trade allies including HVAC, lighting, etc. • Suppliers and retailers • Advocates and service providers for income-qualified homeowners and renters
PECO will develop communication protocols that will seek to reach prospective customers at the right time, through the right channel, with the right message. This will require customer data analysis and segmentation; testing, tracking and multiple channel deployment strategies. PECO will make regular adjustments to communication protocols and deployment strategies to achieve the program goals, balancing program participation and changes in market conditions. PECO will use a variety of deployment strategies to meet the specific needs of individual programs and pathways, which may include:
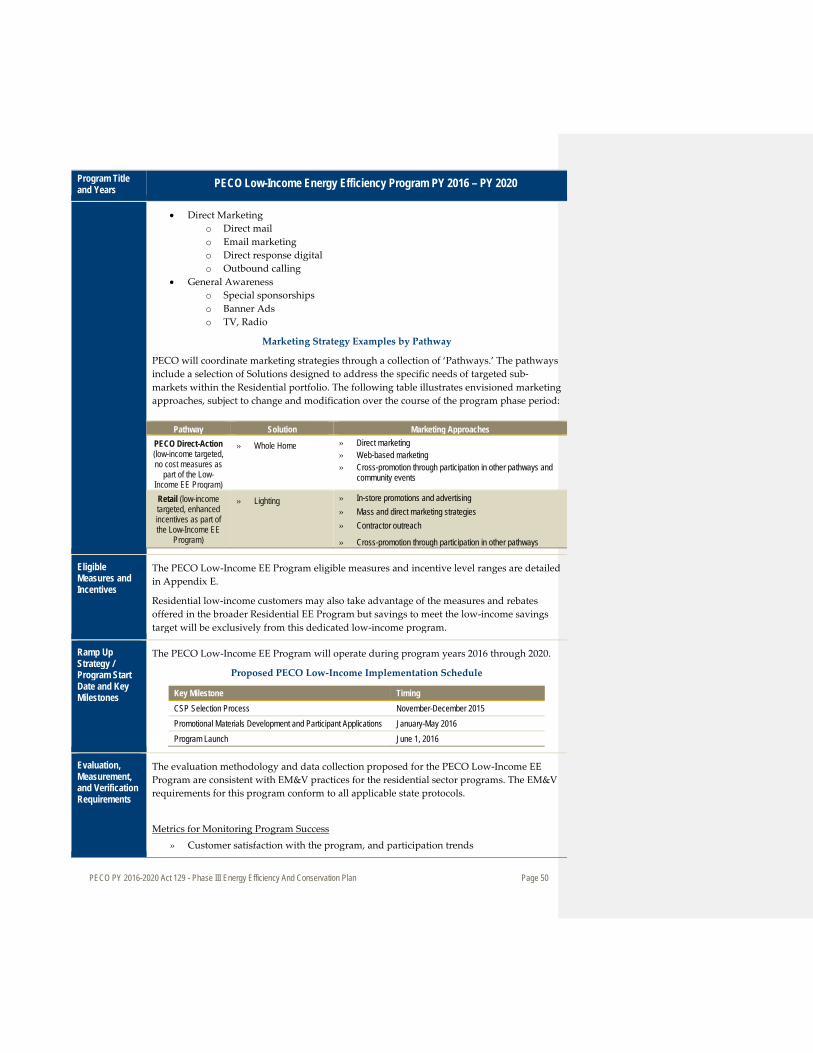
PECO PY 2016-2020 Act 129 - Phase III Energy Efficiency And Conservation Plan Page 50
Program Title and Years PECO Low-Income Energy Efficiency Program PY 2016 – PY 2020
• Direct Marketing o Direct mail o Email marketing o Direct response digital o Outbound calling
• General Awareness o Special sponsorships o Banner Ads o TV, Radio
Marketing Strategy Examples by Pathway
PECO will coordinate marketing strategies through a collection of ‘Pathways.’ The pathways include a selection of Solutions designed to address the specific needs of targeted sub-markets within the Residential portfolio. The following table illustrates envisioned marketing approaches, subject to change and modification over the course of the program phase period:
Pathway Solution Marketing Approaches PECO Direct-Action (low-income targeted, no cost measures as
part of the Low-Income EE Program)
» Whole Home
» Direct marketing » Web-based marketing » Cross-promotion through participation in other pathways and
community events
Retail (low-income targeted, enhanced incentives as part of the Low-Income EE
Program)
» Lighting » In-store promotions and advertising » Mass and direct marketing strategies » Contractor outreach
» Cross-promotion through participation in other pathways
Eligible Measures and Incentives
The PECO Low-Income EE Program eligible measures and incentive level ranges are detailed in Appendix E.
Residential low-income customers may also take advantage of the measures and rebates offered in the broader Residential EE Program but savings to meet the low-income savings target will be exclusively from this dedicated low-income program.
Ramp Up Strategy / Program Start Date and Key Milestones
The PECO Low-Income EE Program will operate during program years 2016 through 2020.
Proposed PECO Low-Income Implementation Schedule
Key Milestone Timing CSP Selection Process November-December 2015 Promotional Materials Development and Participant Applications January-May 2016 Program Launch June 1, 2016
Evaluation, Measurement, and Verification Requirements
The evaluation methodology and data collection proposed for the PECO Low-Income EE Program are consistent with EM&V practices for the residential sector programs. The EM&V requirements for this program conform to all applicable state protocols.
Metrics for Monitoring Program Success
» Customer satisfaction with the program, and participation trends
PECO PY 2016-2020 Act 129 - Phase III Energy Efficiency And Conservation Plan Page 51
Program Title and Years PECO Low-Income Energy Efficiency Program PY 2016 – PY 2020
» Energy savings associated with installed efficient equipment or removed equipment » Program implementation costs incurred » Increase in customer awareness and receptivity to efficiency measures
Data Collection Approaches
Data for evaluating the program will come from the following sources: » Tracking system data » Engineering or TRM estimates of measure savings » Follow-up surveys of residential customers, retailers, trade allies, and service
providers who participate in the program » Program implementer and PECO staff surveys or interviews » Evaluation of billing data » Local weather data
Impact Evaluation Methodology
Program impacts will be determined using a variety of data sources and tested techniques as applicable for individual pathways. These strategies include:
» Field and phone verification, review of program records and incentive applications » Project reviews referencing per-unit deemed or default energy savings » Billing analysis » Installation follow-up phone interviews with program participants to identify:
o Rebated measures installed and persistence (e.g., are the measures still installed?)
o Other changes to the home that affect energy usage, such as changes in occupancy or changes in home or building size
» Non-participant surveys
Process Evaluation Methodology
Evaluating program process success and efficiency across program delivery, administration, implementation, and customer response, includes the following strategies:
» Assessment of marketing and promotional efforts » Monitoring contractor data-tracking system and implementation procedures to
ensure that the program is being implemented as designed. » Interviews with utility staff, contractors, equipment vendors, and customers » Survey of program participants and non-participants, including self-report surveys
Assess customer understanding, satisfaction, and attitudes about the program
Administrative Requirements
PECO will administer the Low-Income EE Program through a group of qualified CSPs. PECO’s role will be to ensure that major milestones are met and that the program is delivered according to the program design.
The program is expected to operate with the following PECO/Contract staffing mix:

PECO PY 2016-2020 Act 129 - Phase III Energy Efficiency And Conservation Plan Page 52
Program Title and Years PECO Low-Income Energy Efficiency Program PY 2016 – PY 2020
PECO Low-Income EE Program —Proposed Staffing
Staff FTE PECO Low-Income EE Program Management 1.1
Requested external staffing levels will be provided upon the completion of the CSP selection process.
Estimated Participation
Participation and measure adoption estimates were developed based on the CSPs’ implementation experiences to date in this program, the number of existing low-income residences in PECO’s service territory, and an assessment of the attainable market potential in the area. Estimated participation is detailed at the measure level in Appendix E.
Estimated Program Budget and Percent of Sector
PECO Low-Income EE Program—Proposed Budget ($000)
PECO Low-Income EE Program PY 2016 PY 2017 PY 2018 PY 2019 PY 2020 Total
Program Budget
as a % of Sector
Low-Income $6,966 $6,994 $7,003 $7,307 $7,847 $36,117 100%
Anticipated Costs to Participating Customers
PECO Low-Income EE Program—Participation Costs
PECO Low-Income EE Program PY 2016 PY 2017 PY 2018 PY 2019 PY 2020 Total Low-Income $91,205 $91,112 $91,028 $90,954 $90,888 $455,188
Projected Energy Savings and Demand Reduction
The estimated energy savings and demand reduction are based on annual per-unit kWh and kW values and effective useful life values indicated in the TRM. These values were applied to the estimated number of measures rebated in each program year.
PECO Low-Income EE Program Gross Annual Energy Savings Estimates (MWh)
PECO Low-Income EE Program PY 2016 PY 2017 PY 2018 PY 2019 PY 2020 Residential Low-Income 22,373 22,953 22,600 23,818 26,746
PECO Low-Income EE Program Peak Demand Savings Estimates (kW)
PECO Low-Income EE Program PY 2016 PY 2017 PY 2018 PY 2019 PY 2020 Residential Low-Income 3,067 3,135 3,085 3,235 3,603
Energy savings are “at meter”; demand savings are “at generator”.
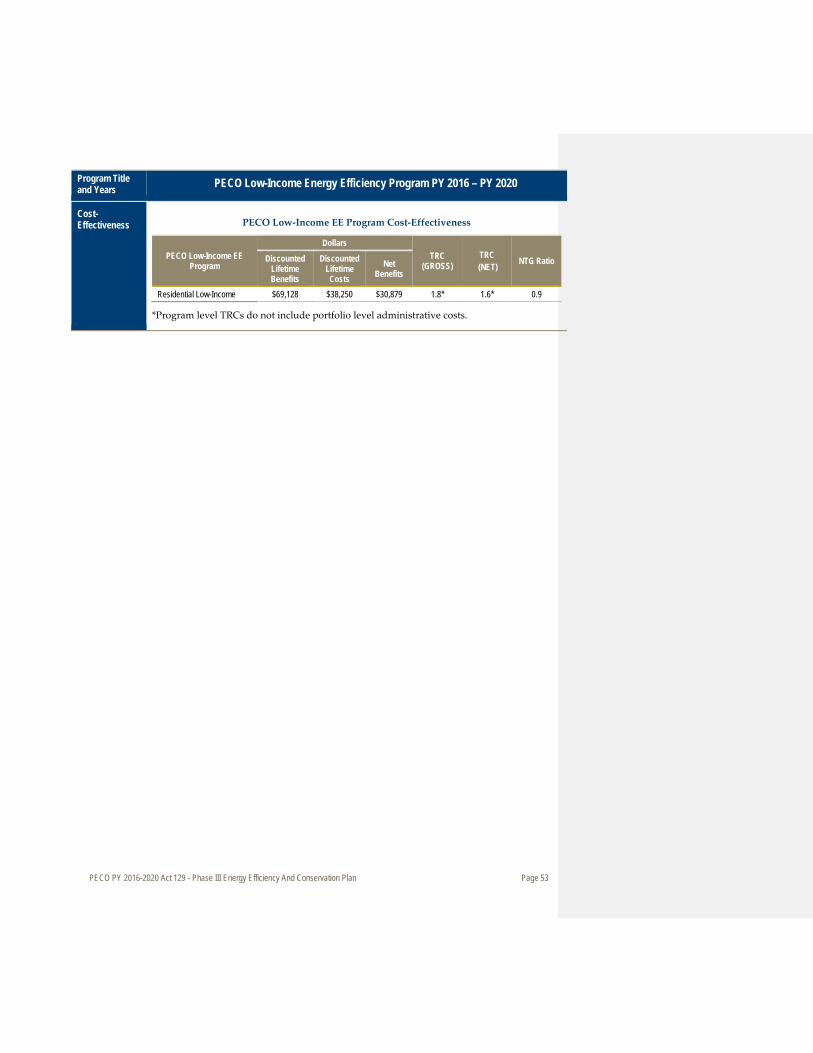
PECO PY 2016-2020 Act 129 - Phase III Energy Efficiency And Conservation Plan Page 53
Program Title and Years PECO Low-Income Energy Efficiency Program PY 2016 – PY 2020
Cost-Effectiveness
PECO Low-Income EE Program Cost-Effectiveness
PECO Low-Income EE Program
Dollars TRC
(GROSS) TRC
(NET) NTG Ratio Discounted Lifetime Benefits
Discounted Lifetime Costs
Net Benefits
Residential Low-Income $69,128 $38,250 $30,879 1.8* 1.6* 0.9
*Program level TRCs do not include portfolio level administrative costs.

PECO PY 2016-2020 Act 129 - Phase III Energy Efficiency And Conservation Plan Page 54
3.2.2 Commercial and Industrial Programs
3.2.2.1 Small Commercial and Industrial Energy Efficiency Program
Program Title and Years Small Commercial and Industrial Energy Efficiency Program PY 2016 – PY 2020
Objectives and Savings
The purpose of the Small Commercial and Industrial Energy Efficiency Program (Small C&I EE Program) is to offer a comprehensive and cross-cutting array of opportunities to assist small C&I customers in reducing their energy consumption and costs. The program encompasses a variety of energy Solutions and measures to achieve this goal.
5 Year Program Savings and Spending Forecast
Total Annual MWh Total Annual kW Total Budget ($M)
% of Portfolio Savings
% of Portfolio Spending
403,256 69,718 $44.7 19% 10%
Primary objectives of the Small C&I EE Program include:
• Provide customers with multiple engagement options for easy access to technical support, project analysis, and rebates.
• Allow small businesses to realize the economic benefits of energy efficiency through comprehensive energy efficiency solutions.
Target Market The eligible population for the Small C&I EE Program is all PECO Small C&I rate class electric customers, including customers who are in the G/E/NP sector or reside in master-metered multifamily buildings.
Program Description
The PECO Small C&I EE Program is designed to offer PECO’s Small C&I customers opportunities to save energy across all their electric end-uses, and to market those opportunities in a way that minimizes lost savings opportunities. The program encompasses a series of energy efficiency Solutions designed to influence customer behavior and purchasing decisions. The energy efficiency Solutions in the Small C&I EE Program include approaches that cut across major channels for communicating with customers or trade allies, and reflect the various ways a small business customer may take advantage of the energy efficiency opportunities available.
The Equipment and Systems Solution assists customers in purchasing and installing the most efficient technology when they are acquiring new equipment. This is accomplished through the participant-initiated pathway to assist customers in purchasing the most efficient technology when they are considering a retrofit or new equipment purchase. There will be a trade ally/contractor pathway where contractors will be engaged to stimulate participation in the lighting, HVAC, refrigeration and compressed air end-uses.
For customers that want to understand how to improve the energy performance of their entire business, the program will offer a Whole Building Solution which will include the direct installation of comprehensive energy efficiency measures. When developers or customers are constructing a new building they can take advantage of New Construction Solutions. Master-metered, multifamily buildings will be a deliberately targeted segment of the Small C&I EE Program. Multifamily buildings are defined as all building types with more than one unit when the building is bigger than a duplex (or 1-family attached unit). A major element of the Small C&I EE Program is education and awareness for those multifamily building owners that want an easy entry to, and benefit from, energy efficient products and broader education.
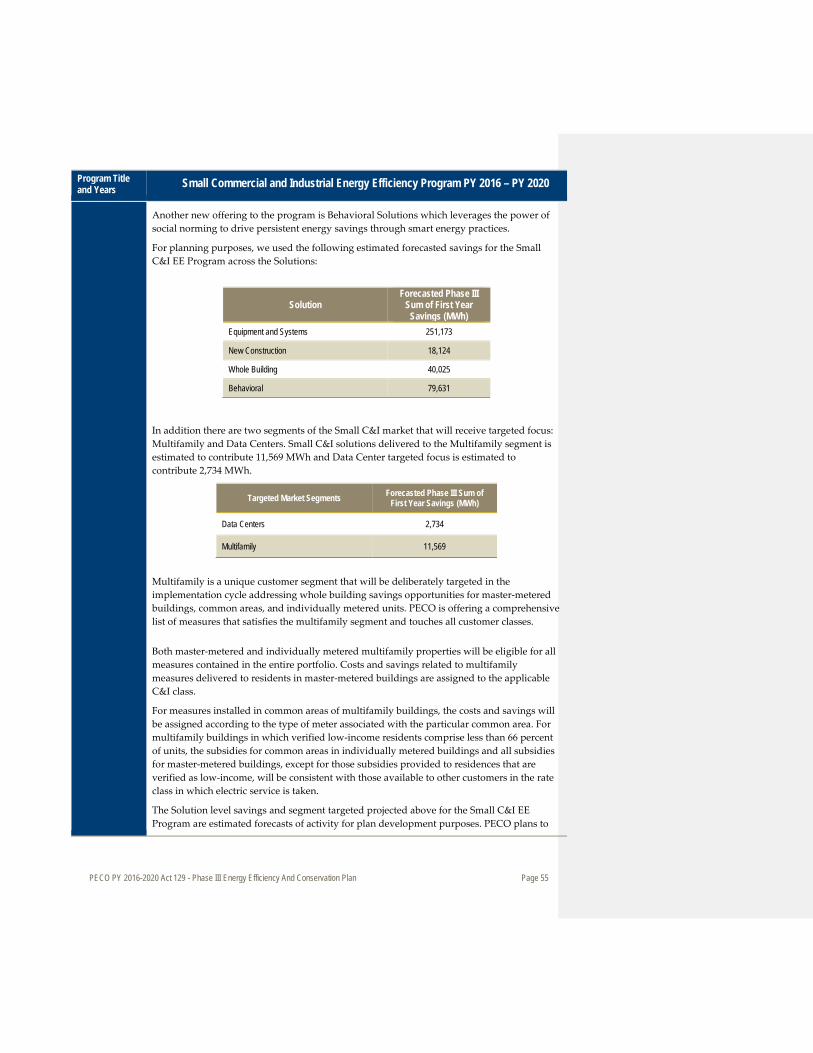
PECO PY 2016-2020 Act 129 - Phase III Energy Efficiency And Conservation Plan Page 55
Program Title and Years Small Commercial and Industrial Energy Efficiency Program PY 2016 – PY 2020
Another new offering to the program is Behavioral Solutions which leverages the power of social norming to drive persistent energy savings through smart energy practices.
For planning purposes, we used the following estimated forecasted savings for the Small C&I EE Program across the Solutions:
Solution Forecasted Phase III
Sum of First Year Savings (MWh)
Equipment and Systems 251,173
New Construction 18,124
Whole Building 40,025
Behavioral 79,631
In addition there are two segments of the Small C&I market that will receive targeted focus: Multifamily and Data Centers. Small C&I solutions delivered to the Multifamily segment is estimated to contribute 11,569 MWh and Data Center targeted focus is estimated to contribute 2,734 MWh.
Targeted Market Segments Forecasted Phase III Sum of First Year Savings (MWh)
Data Centers 2,734
Multifamily 11,569
Multifamily is a unique customer segment that will be deliberately targeted in the implementation cycle addressing whole building savings opportunities for master-metered buildings, common areas, and individually metered units. PECO is offering a comprehensive list of measures that satisfies the multifamily segment and touches all customer classes. Both master-metered and individually metered multifamily properties will be eligible for all measures contained in the entire portfolio. Costs and savings related to multifamily measures delivered to residents in master-metered buildings are assigned to the applicable C&I class.
For measures installed in common areas of multifamily buildings, the costs and savings will be assigned according to the type of meter associated with the particular common area. For multifamily buildings in which verified low-income residents comprise less than 66 percent of units, the subsidies for common areas in individually metered buildings and all subsidies for master-metered buildings, except for those subsidies provided to residences that are verified as low-income, will be consistent with those available to other customers in the rate class in which electric service is taken.
The Solution level savings and segment targeted projected above for the Small C&I EE Program are estimated forecasts of activity for plan development purposes. PECO plans to
PECO PY 2016-2020 Act 129 - Phase III Energy Efficiency And Conservation Plan Page 56
Program Title and Years Small Commercial and Industrial Energy Efficiency Program PY 2016 – PY 2020
spend approximately $44.7M and achieve approximately 403,256 MWh from the Small C&I EE Program. This program is cost-effective with a gross TRC of 1.7 and net TRC of 1.5.
Generally speaking the Small C&I EE Program measures will be presented uniformly to all PECO Small C&I customers, including those who are part of the G/E/NP sector. However PECO will conduct enhanced outreach to the G/E/NP sector to ensure that it achieves the G/E/NP savings requirement. CSP implementation agreements will include specific performance metrics requiring prioritization of these targeted customer markets. Starting in Program Year 2018, PECO will begin to phase out incentives for CFLs in its Residential Energy Efficiency Programs. By Program Year 2019, PECO will no longer offer incentives for the purchase of CFLs as part of its Small C&I Energy Efficiency Programs. Beginning in Program Year 2019, all lighting incentives for the Small C&I Energy Efficiency Programs will be for non-CFLs.
Implementation Strategy
PECO will administer the Small C&I EE Program through CSPs that have a proven record of providing the services to be offered in this program effectively.
For Equipment and Systems Solutions, the retail and participant-initiated pathways will offer a combination of cash rebates, upstream, or midstream discounts to influence the adoption of energy efficiency measures. The trade ally/contractor pathway will utilize the same cash rebates, and will also include contractor training and outreach. This pathway will also be available for commercial customers to take advantage of larger and more comprehensive project benefits with the support of customized technical and financial assistance. Rebates will reduce the initial barrier for customers purchasing and installing qualifying efficient equipment including high efficiency lighting, refrigeration, compressed air, HVAC and water heating equipment, that are typically sold through major retail outlets or through HVAC trade ally contractors.
PECO will offer the New Construction Solutions through a trade ally and contractor pathway where PECO will collaborate with the community of architects, builders, and contractors to design and promote new construction standards that meet high energy efficiency performance standards. Data Centers is a unique market which will be targeted through the trade ally pathway.
The Whole Building Solution will be delivered through direct action pathways where PECO will offer energy audits, assessments, and directly install energy efficiency improvements in businesses and apartments at no cost, or significantly reduced cost to the customer.
The Behavior Solution involves both digital and paper versions of energy reports provided to geographically targeted, small C&I customers that compare their electric consumption relative to similar businesses and make personalized recommendations for ways to use energy more efficiently. Other behavioral awareness tactics that may be utilized include real-time energy displays, social media updates, and community energy competitions.
Overview of Roles and Activities
PECO will coordinate the marketing efforts for the Small C&I Program, and will hire and manage experienced CSPs for implementation of the Solutions within the program. PECO will have a keen management focus on ensuring interested customers are channeled to the most appropriate participation pathway that best fits their energy needs and ensure their

PECO PY 2016-2020 Act 129 - Phase III Energy Efficiency And Conservation Plan Page 57
Program Title and Years Small Commercial and Industrial Energy Efficiency Program PY 2016 – PY 2020
participation experience is convenient, effective and minimizes lost opportunities. PECO will collaborate with implementation CSPs for delivery of all aspects of the program. Activities will include: » Development of upstream and midstream supplier networks and coordination with
product retailers. » Program outreach and lead generation including development and distribution of
program materials, trade ally and association networking, managing inbound and outbound calls.
» Manage in-business audits, including telephone customer screening, monitoring of auditors and contractors, direct installation of measures, and customer reports.
» Rebate processing: receive, review, and verify applications; and pay rebates. » Program performance tracking and implementing continuous improvement. » Reporting program activities to meet program goals, as well as program and regulatory
reporting requirements.

PECO PY 2016-2020 Act 129 - Phase III Energy Efficiency And Conservation Plan Page 58
Program Issues, Risks, and Risk Management Strategies
PECO has designed the Small C&I EE Program to manage the risks inherent to energy efficiency program implementation and to provide flexibility to adapt to changing market conditions or participation patterns. The comprehensive program design will allow PECO to closely monitor program results, and adjust implementation tactics (including marketing approaches, participation guidelines, incentives, and program resource allocation) to meet the program level targets.
Key program issues, risks, and risk management strategies for the Small C&I EE Program include:
Risk Description Management Strategy
Participation
Customer participation does not meet forecast expectations due to lack of program awareness or external forces (business owner time or financial resources to manage project implementation, economic downturns, product availability, etc.)
To raise program awareness, PECO in collaboration with implementation CSPs will provide direct marketing outreach to businesses, service providers businesses, and business associations.
PECO will offer technical assistance and incentives aligned with attractive participant payback criteria to make projects viable for participants.
PECO will collaborate with suppliers, retailers, and contractors to ensure recommended products are available to business customers.
Equipment Costs Unanticipated equipment purchase and installation cost increases, reducing project economic benefits.
PECO will monitor costs and adjust program incentives and technical services within the provided range to manage the comprehensive program budget and savings.
Regulation Increases in code required baselines can reduce the energy savings available, effectively increasing resource acquisition costs.
PECO will monitor the effects of regulatory changes on the forecast savings, and adjust the mix of measures and incentives within the Small C&I EE Program if necessary to meet the target. The changes to the Small C&I EE Program will be monitored for their effect on the overall portfolio performance as well.
Trade Ally Participants
Success is dependent on trade ally engagement and program participation.
PECO will implement courses that provide skills to perform audits, identify, recommend and install efficient measures.
PECO will develop a trade ally value proposition to attract and engage an adequate network of contractors to perform services.
PECO will recognize and recommend contractors who meet or exceed the program requirements through website listing.
G/E/NP Participation
Achieve the G/E/NP target for the portfolio of programs.
PECO expects to provide incentives consistently across the entire Small C&I sector, including G/E/NP customers. PECO’s strategy for achieving G/E/NP participation will include additional outreach, project management and technical assistance to this customer segment, including project financial analysis demonstrating positive cash flow and cost-effectiveness.
PECO PY 2016-2020 Act 129 - Phase III Energy Efficiency And Conservation Plan Page 59
Program Title and Years Small Commercial and Industrial Energy Efficiency Program PY 2016 – PY 2020
Marketing Strategy
PECO’s marketing strategy will provide a customer-centric experience and approach with a deliberate management focus on making participation easy, convenient and a smart choice for customers to take advantage of the comprehensive energy solutions available to them. PECO will continue to develop and execute a broad awareness campaign in support of the overall plan. PECO will also develop and execute program and Solution level strategies to generate interest and participation in the programs by focusing on the customer relationship and stream of offerings we can provide to help small business and multifamily building owners use energy more efficiently. PECO will engage with customers both directly and through indirect channels. A list of key marketing targets includes:
• PECO Small C&I electric account customers • Current and past PECO efficiency program participants • Installation trade allies including refrigeration, HVAC, compressed air, lighting,
etc. • Distributors, suppliers and retailers • Small business associations and advocates.
PECO will develop communication protocols that will seek to reach prospective customers at the right time, through the right channel, with the right message. This will require customer data analysis and segmentation; testing, tracking and multiple channel deployment strategies. PECO will make regular adjustments to communication protocols and deployment strategies to achieve the program goals, balancing program participation and changes in market conditions. PECO will use a variety of deployment strategies, which may include:
• Direct Marketing o Direct mail o Email marketing o Direct response digital o Outbound calling
• General Awareness o Special sponsorships o Banner Ads o TV, Radio
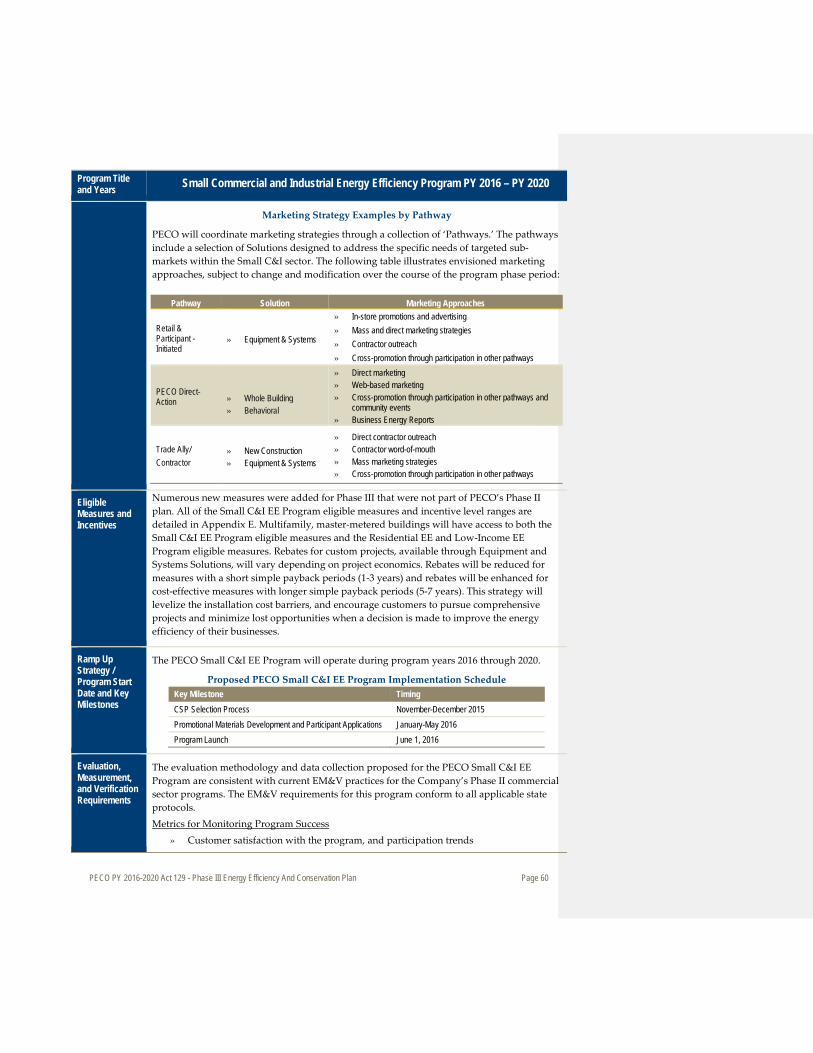
PECO PY 2016-2020 Act 129 - Phase III Energy Efficiency And Conservation Plan Page 60
Program Title and Years Small Commercial and Industrial Energy Efficiency Program PY 2016 – PY 2020
Marketing Strategy Examples by Pathway
PECO will coordinate marketing strategies through a collection of ‘Pathways.’ The pathways include a selection of Solutions designed to address the specific needs of targeted sub-markets within the Small C&I sector. The following table illustrates envisioned marketing approaches, subject to change and modification over the course of the program phase period:
Pathway Solution Marketing Approaches
Retail & Participant - Initiated
» Equipment & Systems
» In-store promotions and advertising » Mass and direct marketing strategies » Contractor outreach » Cross-promotion through participation in other pathways
PECO Direct-Action
» Whole Building » Behavioral
» Direct marketing » Web-based marketing » Cross-promotion through participation in other pathways and
community events » Business Energy Reports
Trade Ally/ Contractor
» New Construction » Equipment & Systems
» Direct contractor outreach » Contractor word-of-mouth » Mass marketing strategies » Cross-promotion through participation in other pathways
Eligible Measures and Incentives
Numerous new measures were added for Phase III that were not part of PECO’s Phase II plan. All of the Small C&I EE Program eligible measures and incentive level ranges are detailed in Appendix E. Multifamily, master-metered buildings will have access to both the Small C&I EE Program eligible measures and the Residential EE and Low-Income EE Program eligible measures. Rebates for custom projects, available through Equipment and Systems Solutions, will vary depending on project economics. Rebates will be reduced for measures with a short simple payback periods (1-3 years) and rebates will be enhanced for cost-effective measures with longer simple payback periods (5-7 years). This strategy will levelize the installation cost barriers, and encourage customers to pursue comprehensive projects and minimize lost opportunities when a decision is made to improve the energy efficiency of their businesses.
Ramp Up Strategy / Program Start Date and Key Milestones
The PECO Small C&I EE Program will operate during program years 2016 through 2020.
Proposed PECO Small C&I EE Program Implementation Schedule Key Milestone Timing CSP Selection Process November-December 2015 Promotional Materials Development and Participant Applications January-May 2016 Program Launch June 1, 2016
Evaluation, Measurement, and Verification Requirements
The evaluation methodology and data collection proposed for the PECO Small C&I EE Program are consistent with current EM&V practices for the Company’s Phase II commercial sector programs. The EM&V requirements for this program conform to all applicable state protocols. Metrics for Monitoring Program Success
» Customer satisfaction with the program, and participation trends
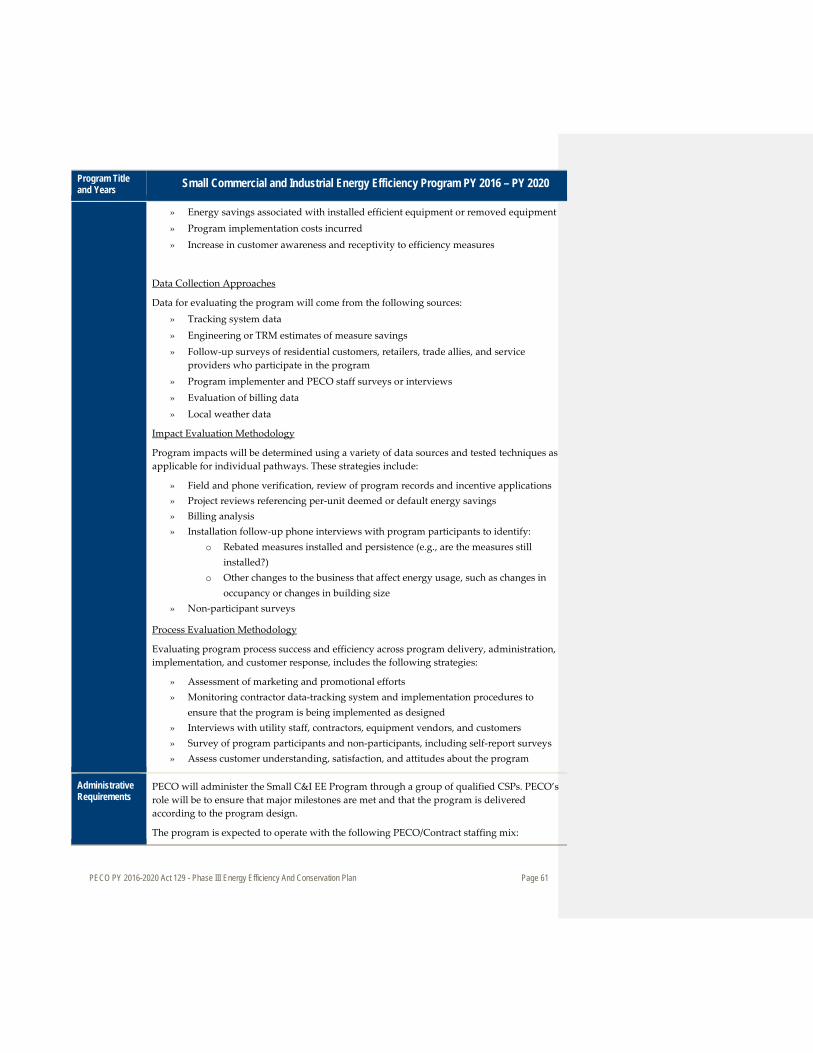
PECO PY 2016-2020 Act 129 - Phase III Energy Efficiency And Conservation Plan Page 61
Program Title and Years Small Commercial and Industrial Energy Efficiency Program PY 2016 – PY 2020
» Energy savings associated with installed efficient equipment or removed equipment » Program implementation costs incurred » Increase in customer awareness and receptivity to efficiency measures
Data Collection Approaches
Data for evaluating the program will come from the following sources: » Tracking system data » Engineering or TRM estimates of measure savings » Follow-up surveys of residential customers, retailers, trade allies, and service
providers who participate in the program » Program implementer and PECO staff surveys or interviews » Evaluation of billing data » Local weather data
Impact Evaluation Methodology
Program impacts will be determined using a variety of data sources and tested techniques as applicable for individual pathways. These strategies include:
» Field and phone verification, review of program records and incentive applications » Project reviews referencing per-unit deemed or default energy savings » Billing analysis » Installation follow-up phone interviews with program participants to identify:
o Rebated measures installed and persistence (e.g., are the measures still installed?)
o Other changes to the business that affect energy usage, such as changes in occupancy or changes in building size
» Non-participant surveys
Process Evaluation Methodology
Evaluating program process success and efficiency across program delivery, administration, implementation, and customer response, includes the following strategies:
» Assessment of marketing and promotional efforts » Monitoring contractor data-tracking system and implementation procedures to
ensure that the program is being implemented as designed » Interviews with utility staff, contractors, equipment vendors, and customers » Survey of program participants and non-participants, including self-report surveys » Assess customer understanding, satisfaction, and attitudes about the program
Administrative Requirements
PECO will administer the Small C&I EE Program through a group of qualified CSPs. PECO’s role will be to ensure that major milestones are met and that the program is delivered according to the program design.
The program is expected to operate with the following PECO/Contract staffing mix:
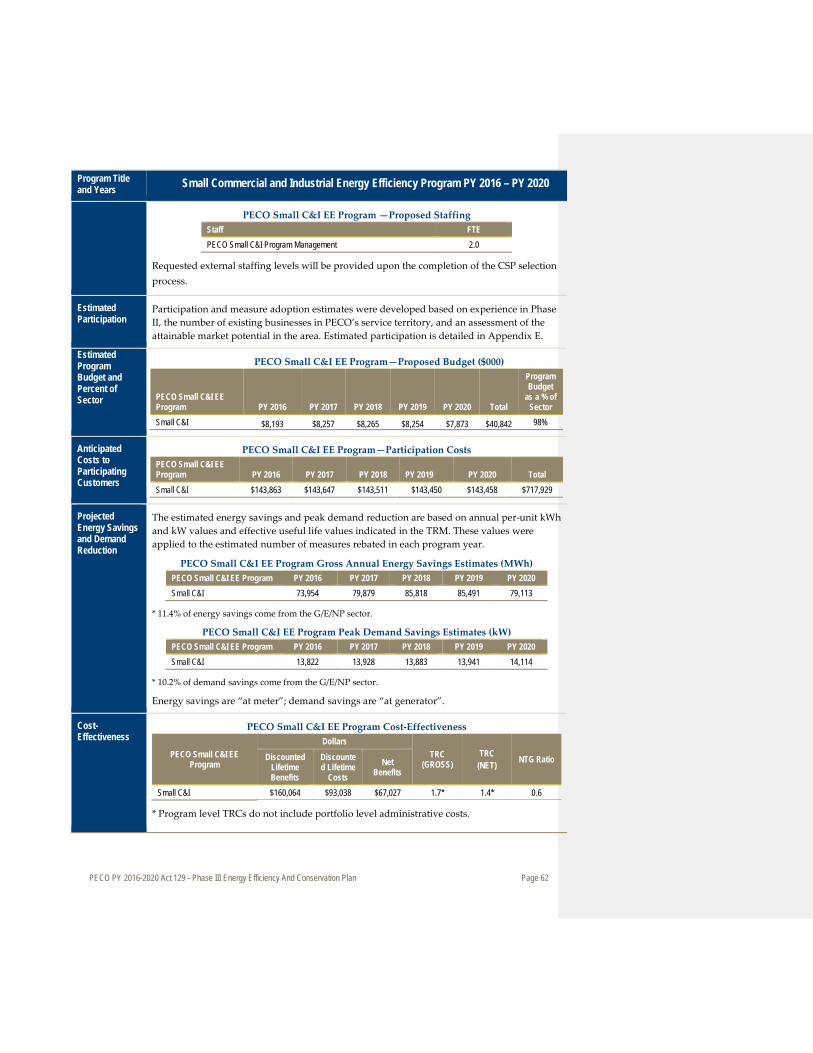
PECO PY 2016-2020 Act 129 - Phase III Energy Efficiency And Conservation Plan Page 62
Program Title and Years Small Commercial and Industrial Energy Efficiency Program PY 2016 – PY 2020
PECO Small C&I EE Program —Proposed Staffing Staff FTE PECO Small C&I Program Management 2.0
Requested external staffing levels will be provided upon the completion of the CSP selection process.
Estimated Participation
Participation and measure adoption estimates were developed based on experience in Phase II, the number of existing businesses in PECO’s service territory, and an assessment of the attainable market potential in the area. Estimated participation is detailed in Appendix E.
Estimated Program Budget and Percent of Sector
PECO Small C&I EE Program—Proposed Budget ($000)
PECO Small C&I EE Program PY 2016 PY 2017 PY 2018 PY 2019 PY 2020 Total
Program Budget
as a % of Sector
Small C&I $8,193 $8,257 $8,265 $8,254 $7,873 $40,842 98%
Anticipated Costs to Participating Customers
PECO Small C&I EE Program—Participation Costs PECO Small C&I EE Program PY 2016 PY 2017 PY 2018 PY 2019 PY 2020 Total Small C&I $143,863 $143,647 $143,511 $143,450 $143,458 $717,929
Projected Energy Savings and Demand Reduction
The estimated energy savings and peak demand reduction are based on annual per-unit kWh and kW values and effective useful life values indicated in the TRM. These values were applied to the estimated number of measures rebated in each program year.
PECO Small C&I EE Program Gross Annual Energy Savings Estimates (MWh) PECO Small C&I EE Program PY 2016 PY 2017 PY 2018 PY 2019 PY 2020 Small C&I 73,954 79,879 85,818 85,491 79,113
* 11.4% of energy savings come from the G/E/NP sector.
PECO Small C&I EE Program Peak Demand Savings Estimates (kW) PECO Small C&I EE Program PY 2016 PY 2017 PY 2018 PY 2019 PY 2020 Small C&I 13,822 13,928 13,883 13,941 14,114
* 10.2% of demand savings come from the G/E/NP sector.
Energy savings are “at meter”; demand savings are “at generator”.
Cost-Effectiveness
PECO Small C&I EE Program Cost-Effectiveness
PECO Small C&I EE Program
Dollars TRC
(GROSS) TRC
(NET) NTG Ratio Discounted Lifetime Benefits
Discounted Lifetime
Costs Net
Benefits
Small C&I $160,064 $93,038 $67,027 1.7* 1.4* 0.6
* Program level TRCs do not include portfolio level administrative costs.

PECO PY 2016-2020 Act 129 - Phase III Energy Efficiency And Conservation Plan Page 63
3.2.2.2 Large Commercial and Industrial Energy Efficiency Program
Program Title and Years Large Commercial and Industrial Energy Efficiency Program PY 2016 – PY 2020
Objectives and Savings
The purpose of the Large Commercial and Industrial Energy Efficiency Program (Large C&I EE Program) is to offer a comprehensive and cross-cutting array of opportunities to assist large C&I rate class customers in reducing their energy consumption and costs. The program encompasses a variety of energy Solutions and measures to achieve this goal.
Five-Year Program Savings and Spending Forecast
Total Annual MWh Total Annual kW Total Budget ($M) % of Portfolio Savings
% of Portfolio Spending
480,098 115,645 $54.7 23% 13%
Primary objectives of the Large C&I EE Program include:
• Provide customers with multiple engagement options for easy access to technical support, project analysis, and rebates. Simplifying the process to take advantage of energy efficient solutions, wherever and whenever energy equipment decisions are made.
• Provide large C&I facilities with access to customized, comprehensive, technical and financial solutions available to allow them to overcome implementation barriers and realize the significant economic benefits of energy efficiency improvements.
Target Market The eligible population for the Large C&I EE Program is all PECO Large C&I rate class electric customers (including customers who are in the G/E/NP sector or reside in master-metered, multifamily buildings).
Program Description
The Large C&I EE Program is designed to offer PECO’s large C&I customers opportunities to save energy across all their electric end-uses, and to market those opportunities in a way that minimizes lost savings opportunities. The program encompasses a series of energy efficiency Solutions designed to influence energy oriented decisions. The energy efficiency Solutions in the Large C&I EE Program include approaches that cut across major channels for communicating with customers or trade allies, and reflect the various ways a large business customer may take advantage of the energy efficiency opportunities available.
Equipment and Systems Solutions assist customers in selecting the most efficient technology when they are acquiring new equipment. This is accomplished through a Participant-Initiated pathway to assist customers in selecting the most efficient technology when they are considering a retrofit or new equipment purchase. There will be a trade ally/contractor pathway where contractors will be engaged to stimulate participation in the lighting, HVAC, refrigeration and compressed air end-uses. In addition there will be a custom pathway for customers who are seeking customized energy efficiency assistance and do not fit into other pathways that are offered. For very large customers that want to understand how to improve the energy performance of their entire business, Equipment and Systems Solutions will offer account management services.
Developers or customers that are constructing a new building can take advantage of the New Construction Solutions. Master-metered, multifamily residential buildings will be a particular focus of the Large C&I EE Program as well. Multifamily building is defined as all building types with more than one unit when the building is bigger than a duplex (or 1-
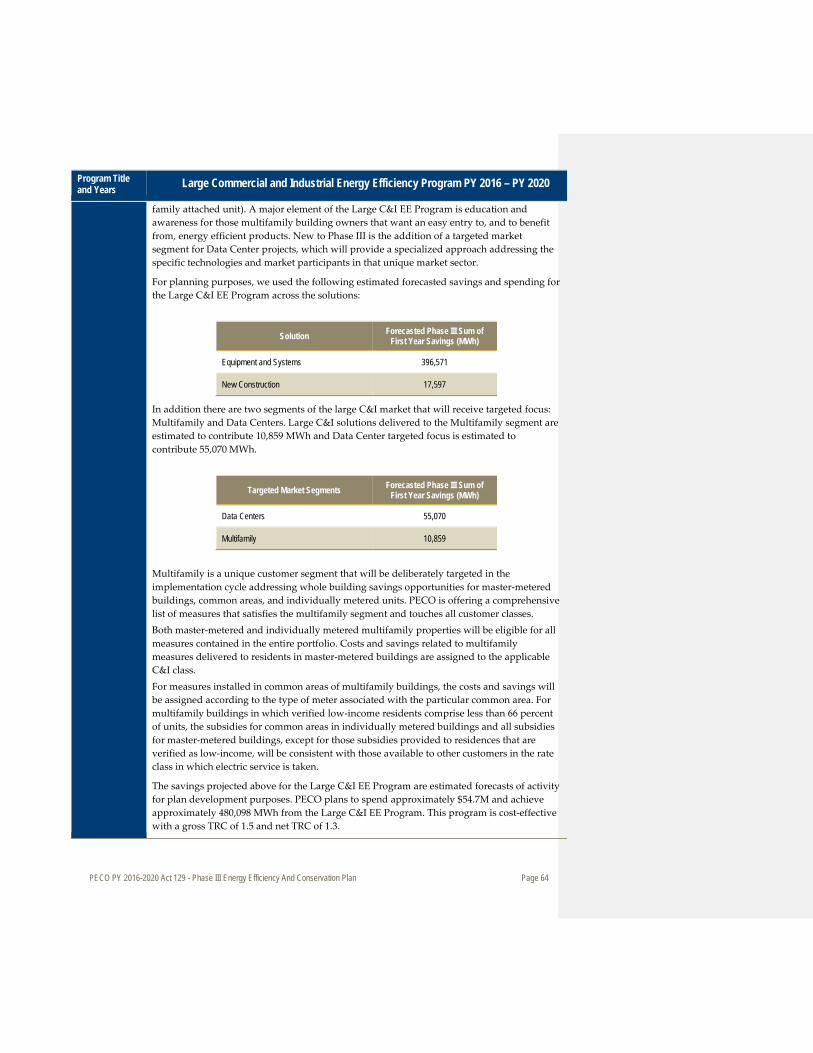
PECO PY 2016-2020 Act 129 - Phase III Energy Efficiency And Conservation Plan Page 64
Program Title and Years Large Commercial and Industrial Energy Efficiency Program PY 2016 – PY 2020
family attached unit). A major element of the Large C&I EE Program is education and awareness for those multifamily building owners that want an easy entry to, and to benefit from, energy efficient products. New to Phase III is the addition of a targeted market segment for Data Center projects, which will provide a specialized approach addressing the specific technologies and market participants in that unique market sector.
For planning purposes, we used the following estimated forecasted savings and spending for the Large C&I EE Program across the solutions:
Solution Forecasted Phase III Sum of First Year Savings (MWh)
Equipment and Systems 396,571
New Construction 17,597
In addition there are two segments of the large C&I market that will receive targeted focus: Multifamily and Data Centers. Large C&I solutions delivered to the Multifamily segment are estimated to contribute 10,859 MWh and Data Center targeted focus is estimated to contribute 55,070 MWh.
Targeted Market Segments Forecasted Phase III Sum of First Year Savings (MWh)
Data Centers 55,070
Multifamily 10,859
Multifamily is a unique customer segment that will be deliberately targeted in the implementation cycle addressing whole building savings opportunities for master-metered buildings, common areas, and individually metered units. PECO is offering a comprehensive list of measures that satisfies the multifamily segment and touches all customer classes. Both master-metered and individually metered multifamily properties will be eligible for all measures contained in the entire portfolio. Costs and savings related to multifamily measures delivered to residents in master-metered buildings are assigned to the applicable C&I class. For measures installed in common areas of multifamily buildings, the costs and savings will be assigned according to the type of meter associated with the particular common area. For multifamily buildings in which verified low-income residents comprise less than 66 percent of units, the subsidies for common areas in individually metered buildings and all subsidies for master-metered buildings, except for those subsidies provided to residences that are verified as low-income, will be consistent with those available to other customers in the rate class in which electric service is taken.
The savings projected above for the Large C&I EE Program are estimated forecasts of activity for plan development purposes. PECO plans to spend approximately $54.7M and achieve approximately 480,098 MWh from the Large C&I EE Program. This program is cost-effective with a gross TRC of 1.5 and net TRC of 1.3.
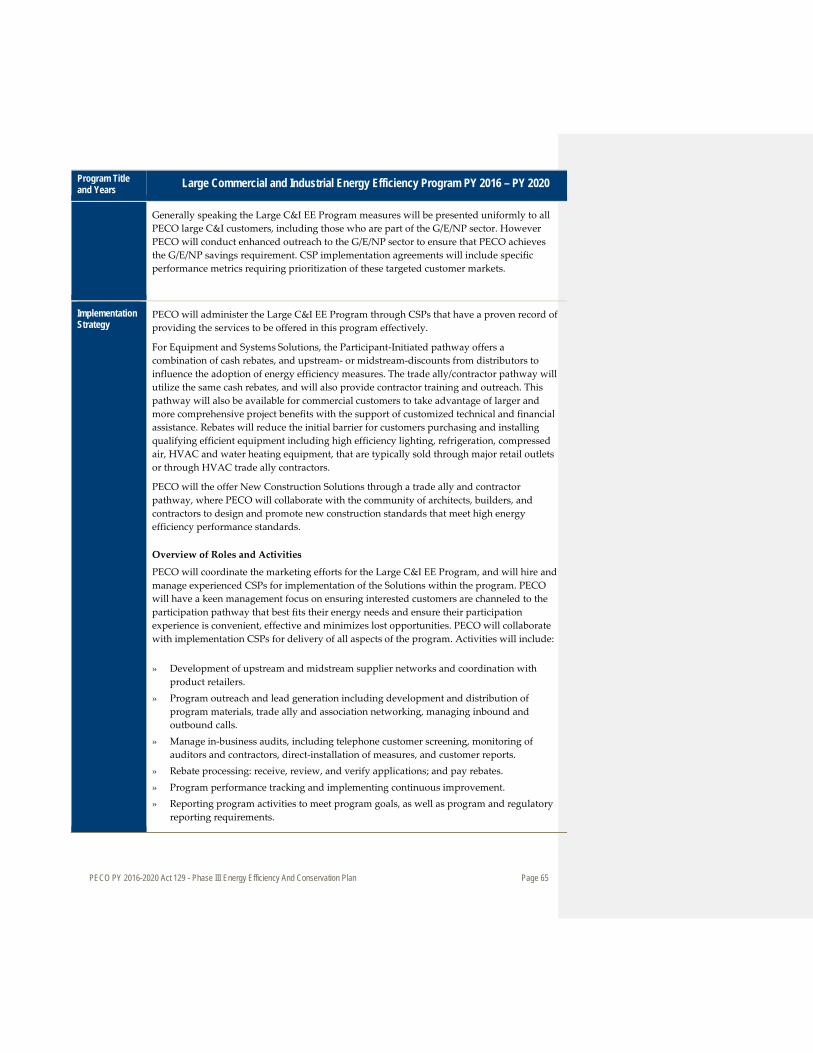
PECO PY 2016-2020 Act 129 - Phase III Energy Efficiency And Conservation Plan Page 65
Program Title and Years Large Commercial and Industrial Energy Efficiency Program PY 2016 – PY 2020
Generally speaking the Large C&I EE Program measures will be presented uniformly to all PECO large C&I customers, including those who are part of the G/E/NP sector. However PECO will conduct enhanced outreach to the G/E/NP sector to ensure that PECO achieves the G/E/NP savings requirement. CSP implementation agreements will include specific performance metrics requiring prioritization of these targeted customer markets.
Implementation Strategy
PECO will administer the Large C&I EE Program through CSPs that have a proven record of providing the services to be offered in this program effectively.
For Equipment and Systems Solutions, the Participant-Initiated pathway offers a combination of cash rebates, and upstream- or midstream-discounts from distributors to influence the adoption of energy efficiency measures. The trade ally/contractor pathway will utilize the same cash rebates, and will also provide contractor training and outreach. This pathway will also be available for commercial customers to take advantage of larger and more comprehensive project benefits with the support of customized technical and financial assistance. Rebates will reduce the initial barrier for customers purchasing and installing qualifying efficient equipment including high efficiency lighting, refrigeration, compressed air, HVAC and water heating equipment, that are typically sold through major retail outlets or through HVAC trade ally contractors.
PECO will the offer New Construction Solutions through a trade ally and contractor pathway, where PECO will collaborate with the community of architects, builders, and contractors to design and promote new construction standards that meet high energy efficiency performance standards. Overview of Roles and Activities
PECO will coordinate the marketing efforts for the Large C&I EE Program, and will hire and manage experienced CSPs for implementation of the Solutions within the program. PECO will have a keen management focus on ensuring interested customers are channeled to the participation pathway that best fits their energy needs and ensure their participation experience is convenient, effective and minimizes lost opportunities. PECO will collaborate with implementation CSPs for delivery of all aspects of the program. Activities will include: » Development of upstream and midstream supplier networks and coordination with
product retailers. » Program outreach and lead generation including development and distribution of
program materials, trade ally and association networking, managing inbound and outbound calls.
» Manage in-business audits, including telephone customer screening, monitoring of auditors and contractors, direct-installation of measures, and customer reports.
» Rebate processing: receive, review, and verify applications; and pay rebates. » Program performance tracking and implementing continuous improvement. » Reporting program activities to meet program goals, as well as program and regulatory
reporting requirements.
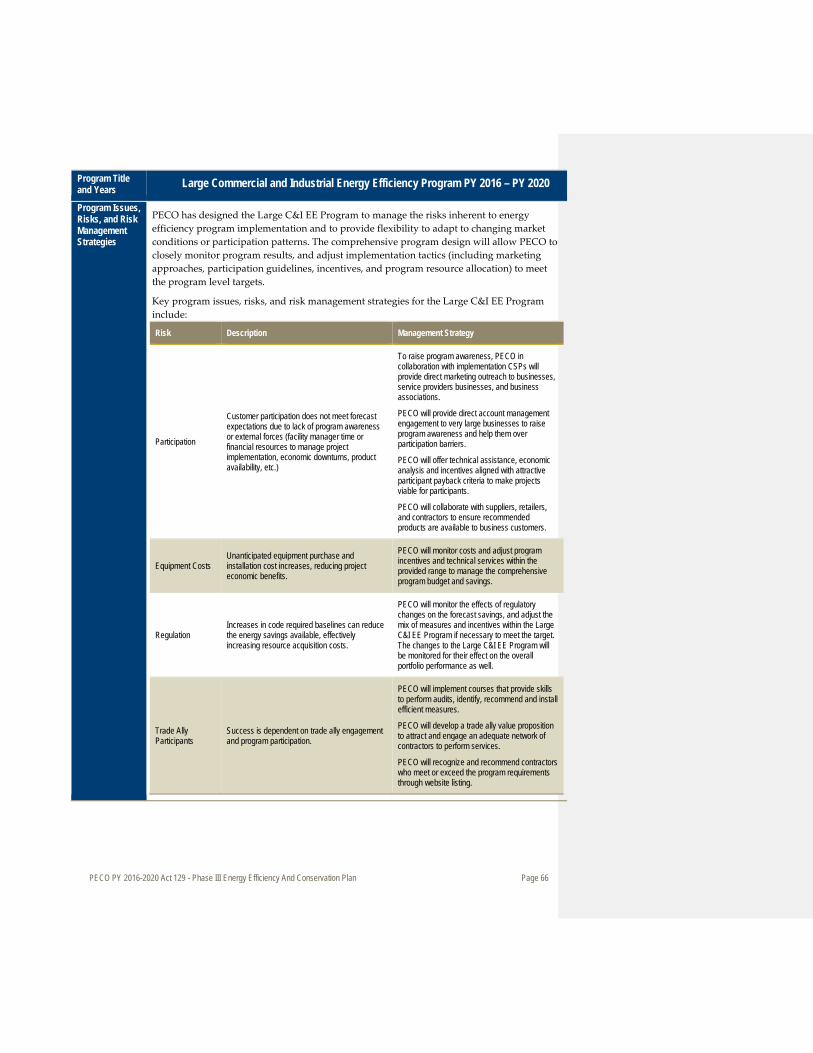
PECO PY 2016-2020 Act 129 - Phase III Energy Efficiency And Conservation Plan Page 66
Program Title and Years Large Commercial and Industrial Energy Efficiency Program PY 2016 – PY 2020
Program Issues, Risks, and Risk Management Strategies
PECO has designed the Large C&I EE Program to manage the risks inherent to energy efficiency program implementation and to provide flexibility to adapt to changing market conditions or participation patterns. The comprehensive program design will allow PECO to closely monitor program results, and adjust implementation tactics (including marketing approaches, participation guidelines, incentives, and program resource allocation) to meet the program level targets.
Key program issues, risks, and risk management strategies for the Large C&I EE Program include:
Risk Description Management Strategy
Participation
Customer participation does not meet forecast expectations due to lack of program awareness or external forces (facility manager time or financial resources to manage project implementation, economic downturns, product availability, etc.)
To raise program awareness, PECO in collaboration with implementation CSPs will provide direct marketing outreach to businesses, service providers businesses, and business associations.
PECO will provide direct account management engagement to very large businesses to raise program awareness and help them over participation barriers.
PECO will offer technical assistance, economic analysis and incentives aligned with attractive participant payback criteria to make projects viable for participants.
PECO will collaborate with suppliers, retailers, and contractors to ensure recommended products are available to business customers.
Equipment Costs Unanticipated equipment purchase and installation cost increases, reducing project economic benefits.
PECO will monitor costs and adjust program incentives and technical services within the provided range to manage the comprehensive program budget and savings.
Regulation Increases in code required baselines can reduce the energy savings available, effectively increasing resource acquisition costs.
PECO will monitor the effects of regulatory changes on the forecast savings, and adjust the mix of measures and incentives within the Large C&I EE Program if necessary to meet the target. The changes to the Large C&I EE Program will be monitored for their effect on the overall portfolio performance as well.
Trade Ally Participants
Success is dependent on trade ally engagement and program participation.
PECO will implement courses that provide skills to perform audits, identify, recommend and install efficient measures.
PECO will develop a trade ally value proposition to attract and engage an adequate network of contractors to perform services.
PECO will recognize and recommend contractors who meet or exceed the program requirements through website listing.
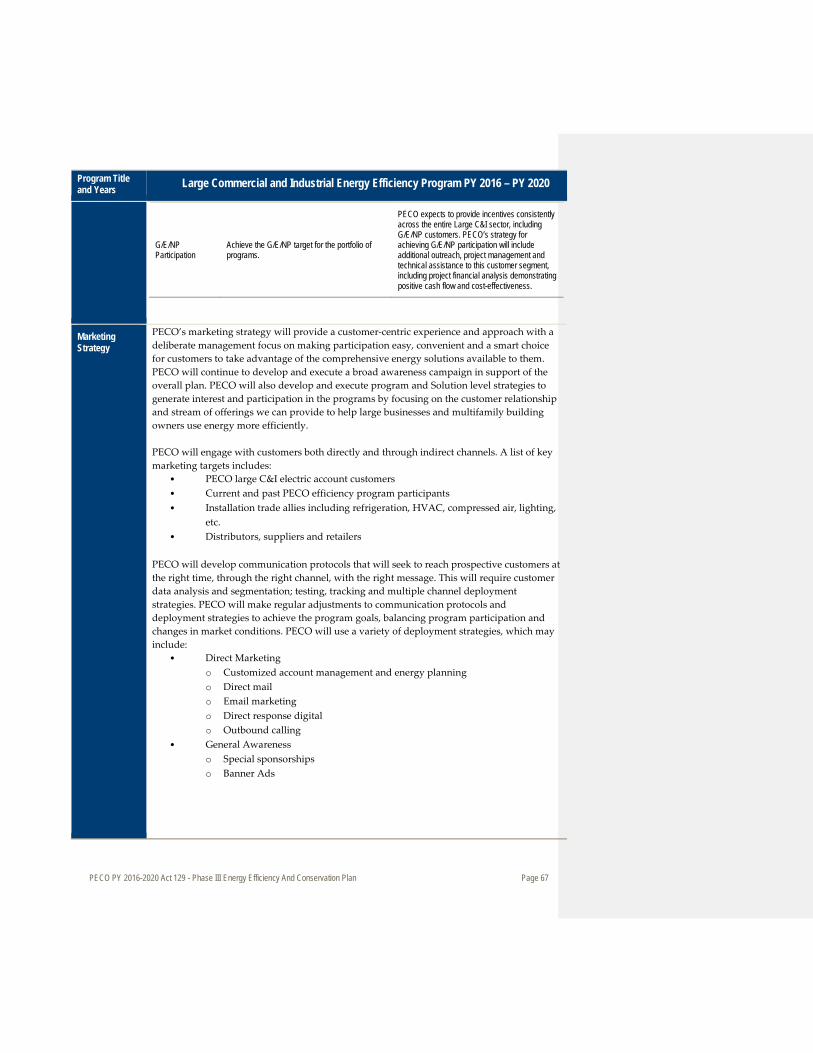
PECO PY 2016-2020 Act 129 - Phase III Energy Efficiency And Conservation Plan Page 67
Program Title and Years Large Commercial and Industrial Energy Efficiency Program PY 2016 – PY 2020
G/E/NP Participation
Achieve the G/E/NP target for the portfolio of programs.
PECO expects to provide incentives consistently across the entire Large C&I sector, including G/E/NP customers. PECO’s strategy for achieving G/E/NP participation will include additional outreach, project management and technical assistance to this customer segment, including project financial analysis demonstrating positive cash flow and cost-effectiveness.
Marketing Strategy
PECO’s marketing strategy will provide a customer-centric experience and approach with a deliberate management focus on making participation easy, convenient and a smart choice for customers to take advantage of the comprehensive energy solutions available to them. PECO will continue to develop and execute a broad awareness campaign in support of the overall plan. PECO will also develop and execute program and Solution level strategies to generate interest and participation in the programs by focusing on the customer relationship and stream of offerings we can provide to help large businesses and multifamily building owners use energy more efficiently. PECO will engage with customers both directly and through indirect channels. A list of key marketing targets includes:
• PECO large C&I electric account customers • Current and past PECO efficiency program participants • Installation trade allies including refrigeration, HVAC, compressed air, lighting,
etc. • Distributors, suppliers and retailers
PECO will develop communication protocols that will seek to reach prospective customers at the right time, through the right channel, with the right message. This will require customer data analysis and segmentation; testing, tracking and multiple channel deployment strategies. PECO will make regular adjustments to communication protocols and deployment strategies to achieve the program goals, balancing program participation and changes in market conditions. PECO will use a variety of deployment strategies, which may include:
• Direct Marketing o Customized account management and energy planning o Direct mail o Email marketing o Direct response digital o Outbound calling
• General Awareness o Special sponsorships o Banner Ads
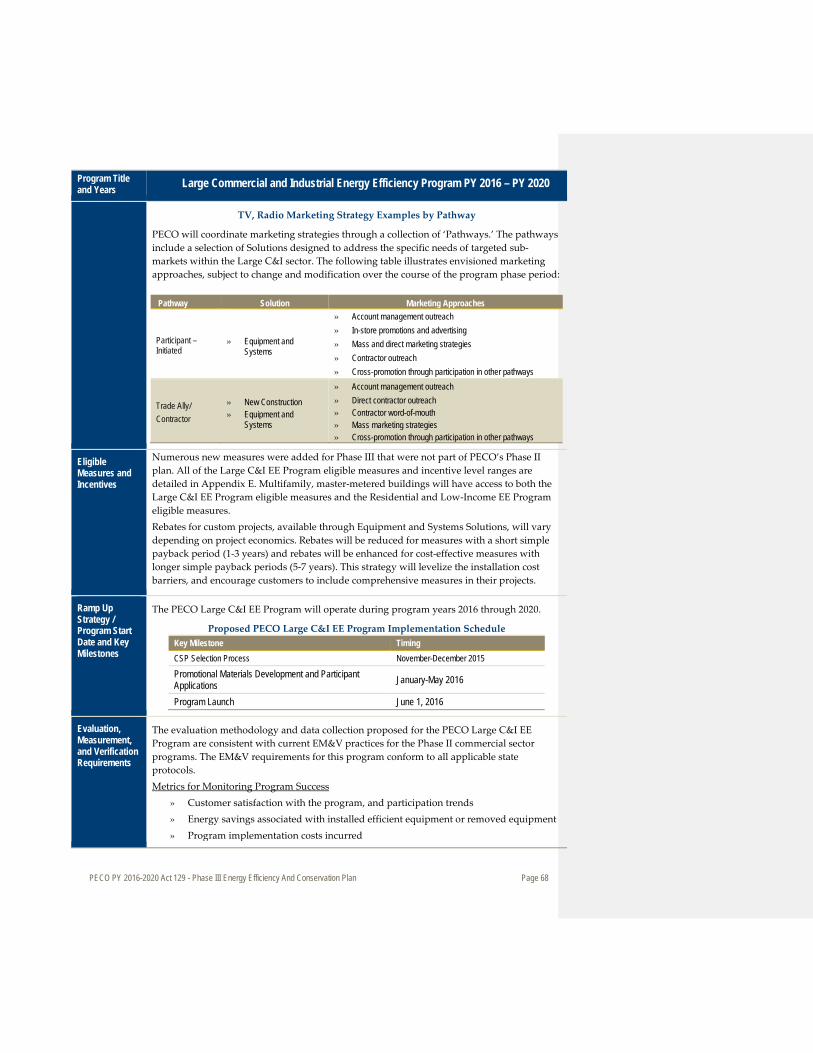
PECO PY 2016-2020 Act 129 - Phase III Energy Efficiency And Conservation Plan Page 68
Program Title and Years Large Commercial and Industrial Energy Efficiency Program PY 2016 – PY 2020
TV, Radio Marketing Strategy Examples by Pathway
PECO will coordinate marketing strategies through a collection of ‘Pathways.’ The pathways include a selection of Solutions designed to address the specific needs of targeted sub-markets within the Large C&I sector. The following table illustrates envisioned marketing approaches, subject to change and modification over the course of the program phase period: Pathway Solution Marketing Approaches
Participant –Initiated
» Equipment and Systems
» Account management outreach » In-store promotions and advertising » Mass and direct marketing strategies » Contractor outreach » Cross-promotion through participation in other pathways
Trade Ally/ Contractor
» New Construction » Equipment and
Systems
» Account management outreach » Direct contractor outreach » Contractor word-of-mouth » Mass marketing strategies » Cross-promotion through participation in other pathways
Eligible Measures and Incentives
Numerous new measures were added for Phase III that were not part of PECO’s Phase II plan. All of the Large C&I EE Program eligible measures and incentive level ranges are detailed in Appendix E. Multifamily, master-metered buildings will have access to both the Large C&I EE Program eligible measures and the Residential and Low-Income EE Program eligible measures. Rebates for custom projects, available through Equipment and Systems Solutions, will vary depending on project economics. Rebates will be reduced for measures with a short simple payback period (1-3 years) and rebates will be enhanced for cost-effective measures with longer simple payback periods (5-7 years). This strategy will levelize the installation cost barriers, and encourage customers to include comprehensive measures in their projects.
Ramp Up Strategy / Program Start Date and Key Milestones
The PECO Large C&I EE Program will operate during program years 2016 through 2020.
Proposed PECO Large C&I EE Program Implementation Schedule Key Milestone Timing CSP Selection Process November-December 2015
Promotional Materials Development and Participant Applications January-May 2016
Program Launch June 1, 2016
Evaluation, Measurement, and Verification Requirements
The evaluation methodology and data collection proposed for the PECO Large C&I EE Program are consistent with current EM&V practices for the Phase II commercial sector programs. The EM&V requirements for this program conform to all applicable state protocols. Metrics for Monitoring Program Success
» Customer satisfaction with the program, and participation trends » Energy savings associated with installed efficient equipment or removed equipment » Program implementation costs incurred
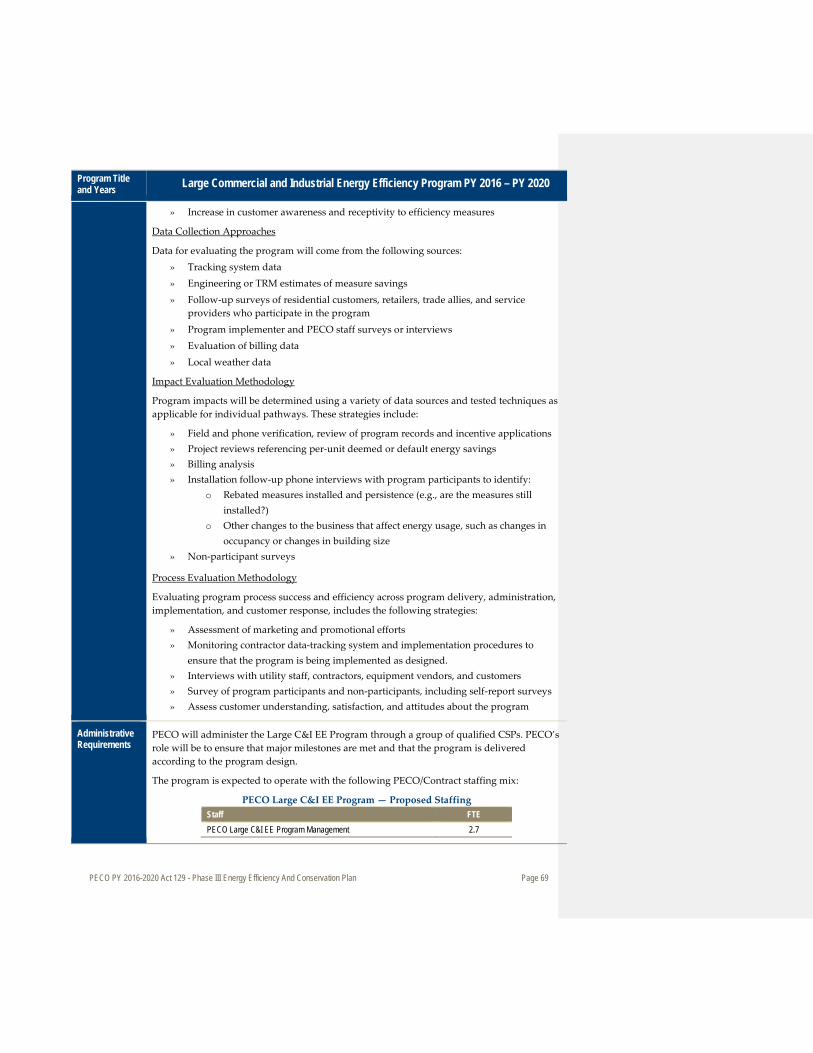
PECO PY 2016-2020 Act 129 - Phase III Energy Efficiency And Conservation Plan Page 69
Program Title and Years Large Commercial and Industrial Energy Efficiency Program PY 2016 – PY 2020
» Increase in customer awareness and receptivity to efficiency measures
Data Collection Approaches
Data for evaluating the program will come from the following sources: » Tracking system data » Engineering or TRM estimates of measure savings » Follow-up surveys of residential customers, retailers, trade allies, and service
providers who participate in the program » Program implementer and PECO staff surveys or interviews » Evaluation of billing data » Local weather data
Impact Evaluation Methodology
Program impacts will be determined using a variety of data sources and tested techniques as applicable for individual pathways. These strategies include:
» Field and phone verification, review of program records and incentive applications » Project reviews referencing per-unit deemed or default energy savings » Billing analysis » Installation follow-up phone interviews with program participants to identify:
o Rebated measures installed and persistence (e.g., are the measures still installed?)
o Other changes to the business that affect energy usage, such as changes in occupancy or changes in building size
» Non-participant surveys
Process Evaluation Methodology
Evaluating program process success and efficiency across program delivery, administration, implementation, and customer response, includes the following strategies:
» Assessment of marketing and promotional efforts » Monitoring contractor data-tracking system and implementation procedures to
ensure that the program is being implemented as designed. » Interviews with utility staff, contractors, equipment vendors, and customers » Survey of program participants and non-participants, including self-report surveys » Assess customer understanding, satisfaction, and attitudes about the program
Administrative Requirements
PECO will administer the Large C&I EE Program through a group of qualified CSPs. PECO’s role will be to ensure that major milestones are met and that the program is delivered according to the program design.
The program is expected to operate with the following PECO/Contract staffing mix:
PECO Large C&I EE Program — Proposed Staffing Staff FTE PECO Large C&I EE Program Management 2.7
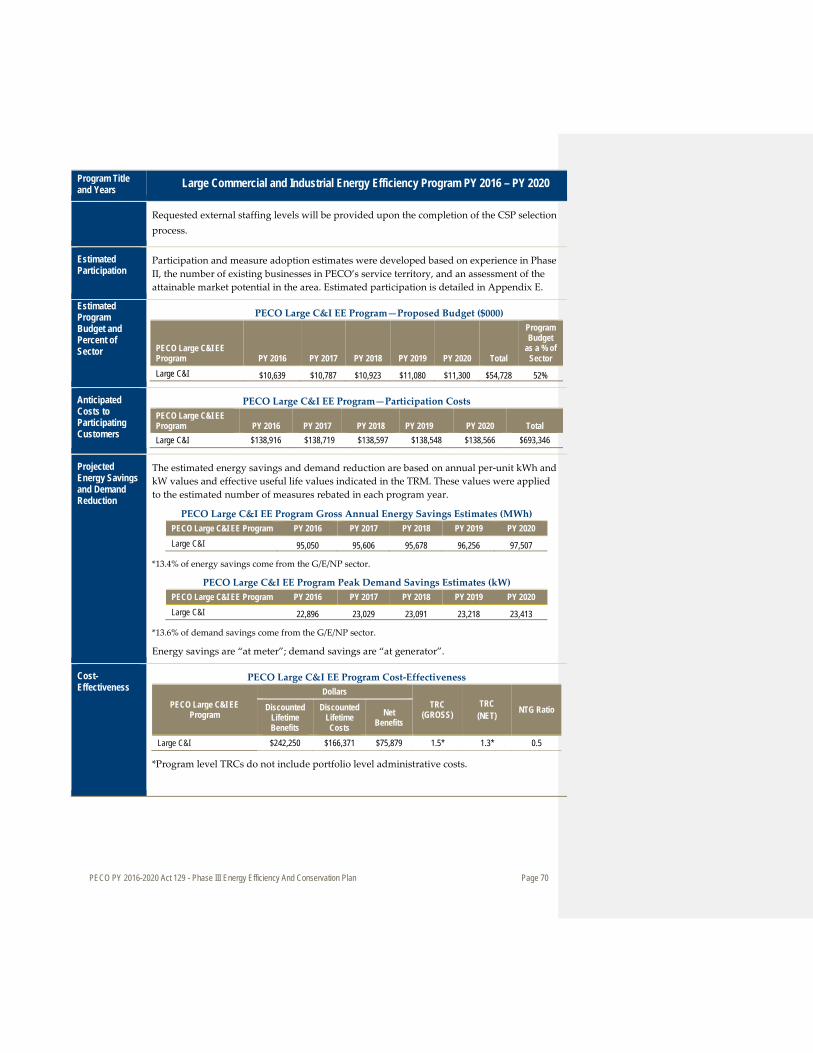
PECO PY 2016-2020 Act 129 - Phase III Energy Efficiency And Conservation Plan Page 70
Program Title and Years Large Commercial and Industrial Energy Efficiency Program PY 2016 – PY 2020
Requested external staffing levels will be provided upon the completion of the CSP selection process.
Estimated Participation
Participation and measure adoption estimates were developed based on experience in Phase II, the number of existing businesses in PECO’s service territory, and an assessment of the attainable market potential in the area. Estimated participation is detailed in Appendix E.
Estimated Program Budget and Percent of Sector
PECO Large C&I EE Program—Proposed Budget ($000)
PECO Large C&I EE Program PY 2016 PY 2017 PY 2018 PY 2019 PY 2020 Total
Program Budget
as a % of Sector
Large C&I $10,639 $10,787 $10,923 $11,080 $11,300 $54,728 52%
Anticipated Costs to Participating Customers
PECO Large C&I EE Program—Participation Costs PECO Large C&I EE Program PY 2016 PY 2017 PY 2018 PY 2019 PY 2020 Total Large C&I $138,916 $138,719 $138,597 $138,548 $138,566 $693,346
Projected Energy Savings and Demand Reduction
The estimated energy savings and demand reduction are based on annual per-unit kWh and kW values and effective useful life values indicated in the TRM. These values were applied to the estimated number of measures rebated in each program year.
PECO Large C&I EE Program Gross Annual Energy Savings Estimates (MWh) PECO Large C&I EE Program PY 2016 PY 2017 PY 2018 PY 2019 PY 2020 Large C&I 95,050 95,606 95,678 96,256 97,507
*13.4% of energy savings come from the G/E/NP sector.
PECO Large C&I EE Program Peak Demand Savings Estimates (kW) PECO Large C&I EE Program PY 2016 PY 2017 PY 2018 PY 2019 PY 2020 Large C&I 22,896 23,029 23,091 23,218 23,413
*13.6% of demand savings come from the G/E/NP sector.
Energy savings are “at meter”; demand savings are “at generator”.
Cost-Effectiveness
PECO Large C&I EE Program Cost-Effectiveness
PECO Large C&I EE Program
Dollars TRC
(GROSS) TRC
(NET) NTG Ratio Discounted Lifetime Benefits
Discounted Lifetime Costs
Net Benefits
Large C&I $242,250 $166,371 $75,879 1.5* 1.3* 0.5
*Program level TRCs do not include portfolio level administrative costs.
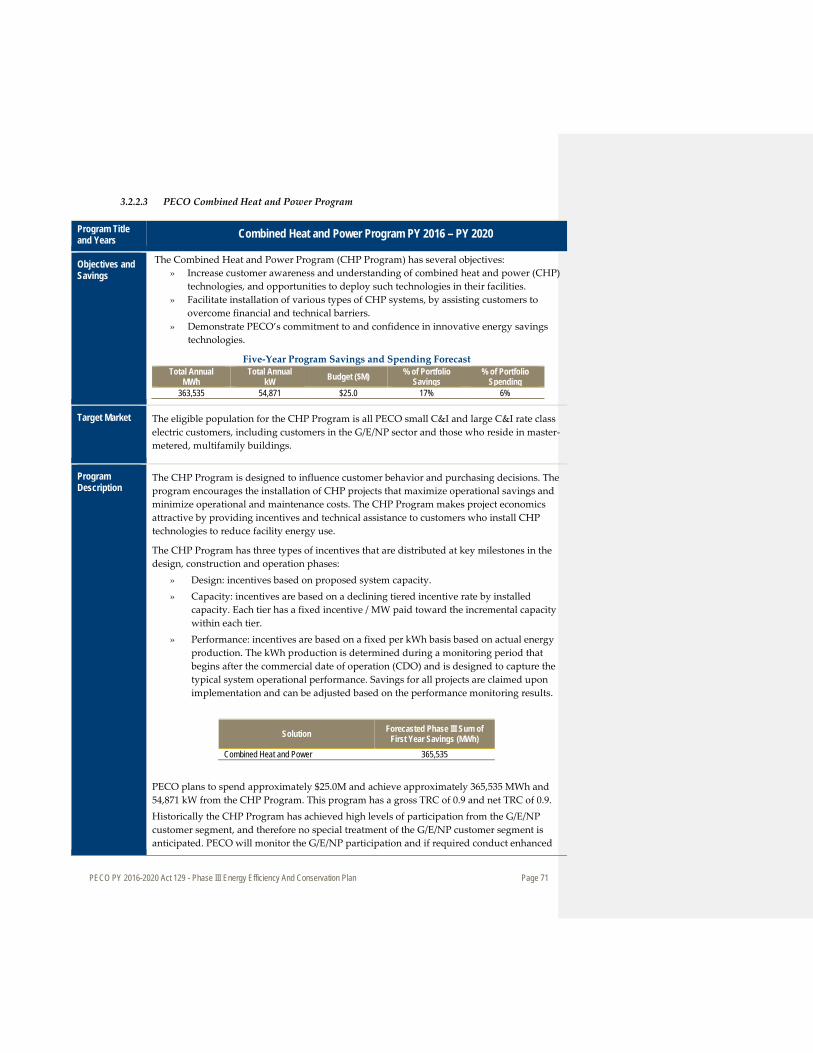
PECO PY 2016-2020 Act 129 - Phase III Energy Efficiency And Conservation Plan Page 71
3.2.2.3 PECO Combined Heat and Power Program
Program Title and Years Combined Heat and Power Program PY 2016 – PY 2020
Objectives and Savings
The Combined Heat and Power Program (CHP Program) has several objectives: » Increase customer awareness and understanding of combined heat and power (CHP)
technologies, and opportunities to deploy such technologies in their facilities. » Facilitate installation of various types of CHP systems, by assisting customers to
overcome financial and technical barriers. » Demonstrate PECO’s commitment to and confidence in innovative energy savings
technologies.
Five-Year Program Savings and Spending Forecast Total Annual
MWh Total Annual
kW Budget ($M) % of Portfolio Savings
% of Portfolio Spending
363,535 54,871 $25.0 17% 6%
Target Market The eligible population for the CHP Program is all PECO small C&I and large C&I rate class electric customers, including customers in the G/E/NP sector and those who reside in master-metered, multifamily buildings.
Program Description
The CHP Program is designed to influence customer behavior and purchasing decisions. The program encourages the installation of CHP projects that maximize operational savings and minimize operational and maintenance costs. The CHP Program makes project economics attractive by providing incentives and technical assistance to customers who install CHP technologies to reduce facility energy use.
The CHP Program has three types of incentives that are distributed at key milestones in the design, construction and operation phases:
» Design: incentives based on proposed system capacity. » Capacity: incentives are based on a declining tiered incentive rate by installed
capacity. Each tier has a fixed incentive / MW paid toward the incremental capacity within each tier.
» Performance: incentives are based on a fixed per kWh basis based on actual energy production. The kWh production is determined during a monitoring period that begins after the commercial date of operation (CDO) and is designed to capture the typical system operational performance. Savings for all projects are claimed upon implementation and can be adjusted based on the performance monitoring results.
Solution Forecasted Phase III Sum of First Year Savings (MWh)
Combined Heat and Power 365,535
PECO plans to spend approximately $25.0M and achieve approximately 365,535 MWh and 54,871 kW from the CHP Program. This program has a gross TRC of 0.9 and net TRC of 0.9. Historically the CHP Program has achieved high levels of participation from the G/E/NP customer segment, and therefore no special treatment of the G/E/NP customer segment is anticipated. PECO will monitor the G/E/NP participation and if required conduct enhanced
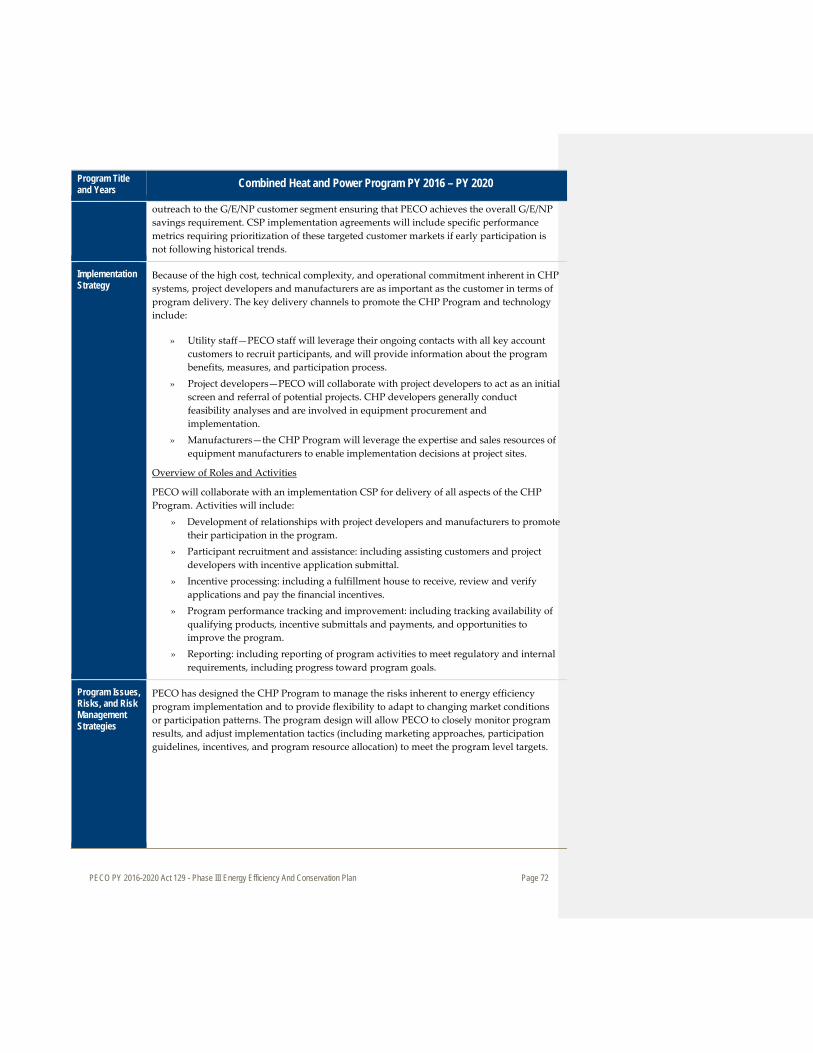
PECO PY 2016-2020 Act 129 - Phase III Energy Efficiency And Conservation Plan Page 72
Program Title and Years Combined Heat and Power Program PY 2016 – PY 2020
outreach to the G/E/NP customer segment ensuring that PECO achieves the overall G/E/NP savings requirement. CSP implementation agreements will include specific performance metrics requiring prioritization of these targeted customer markets if early participation is not following historical trends.
Implementation Strategy
Because of the high cost, technical complexity, and operational commitment inherent in CHP systems, project developers and manufacturers are as important as the customer in terms of program delivery. The key delivery channels to promote the CHP Program and technology include:
» Utility staff—PECO staff will leverage their ongoing contacts with all key account customers to recruit participants, and will provide information about the program benefits, measures, and participation process.
» Project developers—PECO will collaborate with project developers to act as an initial screen and referral of potential projects. CHP developers generally conduct feasibility analyses and are involved in equipment procurement and implementation.
» Manufacturers—the CHP Program will leverage the expertise and sales resources of equipment manufacturers to enable implementation decisions at project sites.
Overview of Roles and Activities
PECO will collaborate with an implementation CSP for delivery of all aspects of the CHP Program. Activities will include:
» Development of relationships with project developers and manufacturers to promote their participation in the program.
» Participant recruitment and assistance: including assisting customers and project developers with incentive application submittal.
» Incentive processing: including a fulfillment house to receive, review and verify applications and pay the financial incentives.
» Program performance tracking and improvement: including tracking availability of qualifying products, incentive submittals and payments, and opportunities to improve the program.
» Reporting: including reporting of program activities to meet regulatory and internal requirements, including progress toward program goals.
Program Issues, Risks, and Risk Management Strategies
PECO has designed the CHP Program to manage the risks inherent to energy efficiency program implementation and to provide flexibility to adapt to changing market conditions or participation patterns. The program design will allow PECO to closely monitor program results, and adjust implementation tactics (including marketing approaches, participation guidelines, incentives, and program resource allocation) to meet the program level targets.
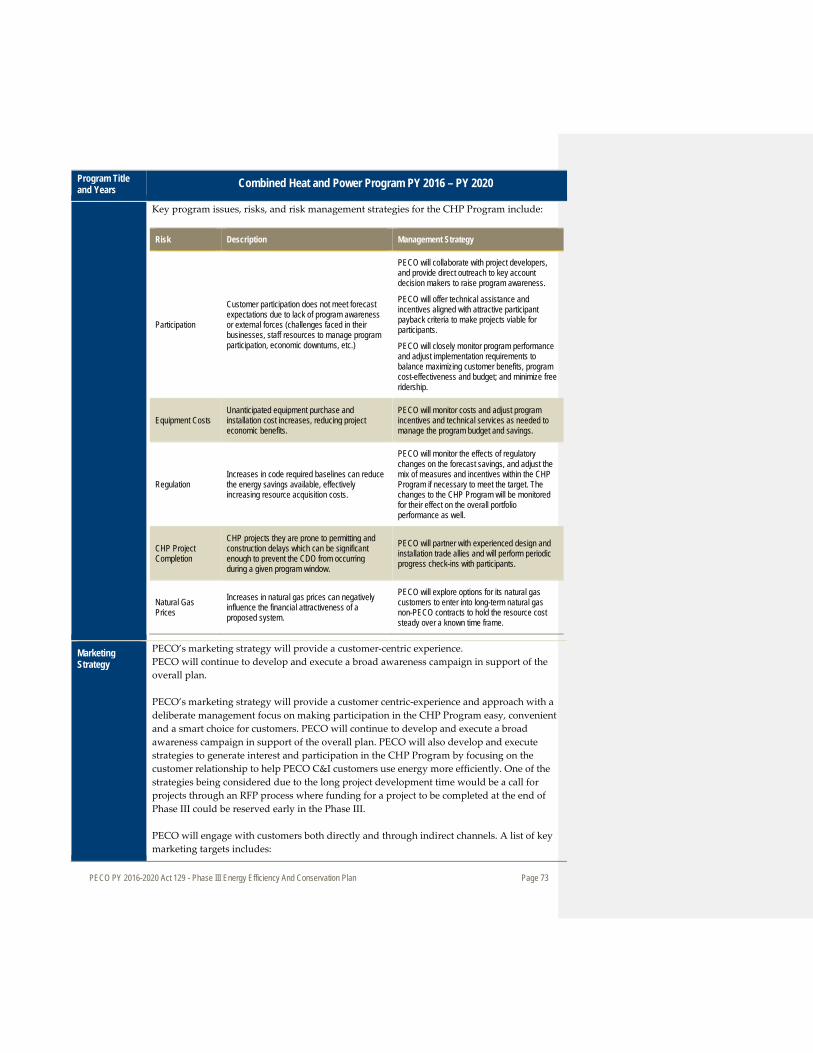
PECO PY 2016-2020 Act 129 - Phase III Energy Efficiency And Conservation Plan Page 73
Program Title and Years Combined Heat and Power Program PY 2016 – PY 2020
Key program issues, risks, and risk management strategies for the CHP Program include:
Risk Description Management Strategy
Participation
Customer participation does not meet forecast expectations due to lack of program awareness or external forces (challenges faced in their businesses, staff resources to manage program participation, economic downturns, etc.)
PECO will collaborate with project developers, and provide direct outreach to key account decision makers to raise program awareness.
PECO will offer technical assistance and incentives aligned with attractive participant payback criteria to make projects viable for participants.
PECO will closely monitor program performance and adjust implementation requirements to balance maximizing customer benefits, program cost-effectiveness and budget; and minimize free ridership.
Equipment Costs Unanticipated equipment purchase and installation cost increases, reducing project economic benefits.
PECO will monitor costs and adjust program incentives and technical services as needed to manage the program budget and savings.
Regulation Increases in code required baselines can reduce the energy savings available, effectively increasing resource acquisition costs.
PECO will monitor the effects of regulatory changes on the forecast savings, and adjust the mix of measures and incentives within the CHP Program if necessary to meet the target. The changes to the CHP Program will be monitored for their effect on the overall portfolio performance as well.
CHP Project Completion
CHP projects they are prone to permitting and construction delays which can be significant enough to prevent the CDO from occurring during a given program window.
PECO will partner with experienced design and installation trade allies and will perform periodic progress check-ins with participants.
Natural Gas Prices
Increases in natural gas prices can negatively influence the financial attractiveness of a proposed system.
PECO will explore options for its natural gas customers to enter into long-term natural gas non-PECO contracts to hold the resource cost steady over a known time frame.
Marketing Strategy
PECO’s marketing strategy will provide a customer-centric experience. PECO will continue to develop and execute a broad awareness campaign in support of the overall plan. PECO’s marketing strategy will provide a customer centric-experience and approach with a deliberate management focus on making participation in the CHP Program easy, convenient and a smart choice for customers. PECO will continue to develop and execute a broad awareness campaign in support of the overall plan. PECO will also develop and execute strategies to generate interest and participation in the CHP Program by focusing on the customer relationship to help PECO C&I customers use energy more efficiently. One of the strategies being considered due to the long project development time would be a call for projects through an RFP process where funding for a project to be completed at the end of Phase III could be reserved early in the Phase III. PECO will engage with customers both directly and through indirect channels. A list of key marketing targets includes:
PECO PY 2016-2020 Act 129 - Phase III Energy Efficiency And Conservation Plan Page 74
Program Title and Years Combined Heat and Power Program PY 2016 – PY 2020
• All PECO small C&I and large C&I electric account holder customers • Current and past PECO efficiency program participants • CHP design and installation trade allies • Call for CHP project through an RFP process
PECO will develop communication protocols that will seek to reach prospective customers at the right time, through the right channel, with the right message. This will require customer data analysis and segmentation; testing, tracking and multiple channel deployment strategies. PECO will make regular adjustments to communication protocols and deployment strategies to achieve the program goals, balancing program participation and changes in market conditions. PECO will use a variety of deployment strategies, which may include:
• Direct Marketing o Customized account management and energy planning o Direct mail o Email marketing o Direct response digital o Outbound calling
• General Awareness o Special sponsorships o Banner Ads o TV, Radio
CHP systems are significant investments for customers not only in terms of cost but in operational commitment. The CHP market is heavily driven by project developers and manufacturers who have significant influence with customers in their decision making process. The sales cycle for a CHP system is long, complex and requires a significant investment of time by the project developer. Therefore, program marketing efforts will be directed primarily at this group with supplemental activities directed at the end-use customer.
Eligible Measures and Incentives
Measures
Any type of CHP configuration may be installed through this program including but not limited to:
» Reciprocating engines
» Steam Turbines » Gas Turbines » Micro turbines » Fuel cells » Bottoming Cycle systems
Incentives
The CHP Program has three types of incentives that are distributed at key milestones in the design and construction processes:
PECO PY 2016-2020 Act 129 - Phase III Energy Efficiency And Conservation Plan Page 75
Program Title and Years Combined Heat and Power Program PY 2016 – PY 2020
» Design Incentives are paid based on proposed system capacity at maximum rate of $100/kW and may have eligibility limited based on system size.
» Capacity Incentives are paid on a declining tiered incentive rate by installed capacity and could range between $40/kW and $400/kW depending on system size. For each project, capacity incentives can be no more than 40% of the project cost up to at capacity incentive maximum. The capacity incentive maximum will be between $400,000 and $1,500,000.
» Performance Incentives are paid at a fixed $/kWh rate generated during the monitoring period. The fixed rate will be set in the $25 - $75/MWh range.
» Maximum Total Incentive is 50% of the project cost up to maximum incentive level. The maximum incentive will be set in the range of $500,000 to $2,000,000.
The CHP Program requires the following of eligible projects to minimize degradation of savings in future operation:
» Participants must designate a primary contact that is responsible for the design, installation, service, and warranty of installed systems.
» Participants must show proof of a five-year (or greater) warranty for all system components beginning at the date of electric grid interconnection.
Installed equipment must also meet the following minimum efficiency levels:
» Steam turbine: 80% » Reciprocating engine: 70% » Gas turbine: 70% » Micro turbine: 65% » Fuel cell: 55% » Other: 60%
Project Carry Over:
If a customer completes a substantial portion of a CHP project in Phase II (i.e., facilities have been constructed and CHP generating equipment has been received on-site), and the anticipated date of commercial operation (completion date) is after May 31, 2016 but prior to December 31, 2016, incentives will be paid at Phase II incentive levels with the funds proposed for the Phase III CHP Program. If project construction is initiated during Phase II, project construction is not substantial during Phase II (i.e., facilities have not been constructed and/or CHP generating equipment has not been received), or the anticipated date of commercial operation (completion date) of the project is after December 31, 2016, incentives will be paid at Phase III levels with funds and program rules proposed for the Phase III CHP Program.
The PECO Combined Heat and Power Solution eligible measures and incentive level ranges are detailed in Appendix E.
Deadlines for Rebates
Projects will be classified into one of two enrollment categories based on nameplate capacity:
» Rolling: The application process for rolling projects will be administered on a continual basis.
» Call: Call projects will be restricted to periodic application windows known as calls. Once a call period has closed, PECO will evaluate each project based on a scoring criteria involving timeline, likelihood of completion and cost-effectiveness
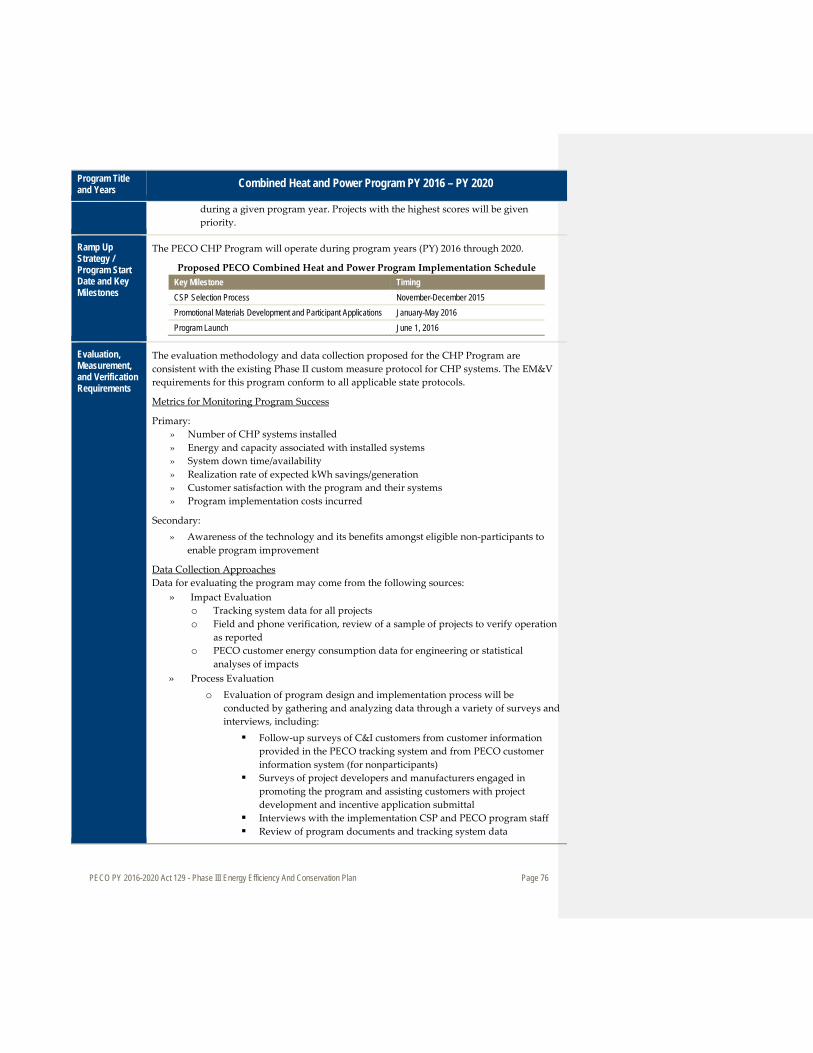
PECO PY 2016-2020 Act 129 - Phase III Energy Efficiency And Conservation Plan Page 76
Program Title and Years Combined Heat and Power Program PY 2016 – PY 2020
during a given program year. Projects with the highest scores will be given priority.
Ramp Up Strategy / Program Start Date and Key Milestones
The PECO CHP Program will operate during program years (PY) 2016 through 2020.
Proposed PECO Combined Heat and Power Program Implementation Schedule Key Milestone Timing CSP Selection Process November-December 2015 Promotional Materials Development and Participant Applications January-May 2016 Program Launch June 1, 2016
Evaluation, Measurement, and Verification Requirements
The evaluation methodology and data collection proposed for the CHP Program are consistent with the existing Phase II custom measure protocol for CHP systems. The EM&V requirements for this program conform to all applicable state protocols.
Metrics for Monitoring Program Success
Primary: » Number of CHP systems installed » Energy and capacity associated with installed systems » System down time/availability » Realization rate of expected kWh savings/generation » Customer satisfaction with the program and their systems » Program implementation costs incurred
Secondary: » Awareness of the technology and its benefits amongst eligible non-participants to
enable program improvement
Data Collection Approaches Data for evaluating the program may come from the following sources:
» Impact Evaluation o Tracking system data for all projects o Field and phone verification, review of a sample of projects to verify operation
as reported o PECO customer energy consumption data for engineering or statistical
analyses of impacts » Process Evaluation
o Evaluation of program design and implementation process will be conducted by gathering and analyzing data through a variety of surveys and interviews, including: Follow-up surveys of C&I customers from customer information
provided in the PECO tracking system and from PECO customer information system (for nonparticipants)
Surveys of project developers and manufacturers engaged in promoting the program and assisting customers with project development and incentive application submittal
Interviews with the implementation CSP and PECO program staff Review of program documents and tracking system data

PECO PY 2016-2020 Act 129 - Phase III Energy Efficiency And Conservation Plan Page 77
Program Title and Years Combined Heat and Power Program PY 2016 – PY 2020
Impact Evaluation Methodology
The CHP Program will record energy savings and peak load reductions from the incentive applications processed. For CHP projects, the gross savings need to be estimated based on engineering models and estimates. The EM&V assessment will utilize metering to verify the project savings. For program impact assessment, this can be accomplished through verification of a sample of projects that are representative of projects in the different target market segments.
PECO will credit toward the CHP Program only savings from incented CHP systems. This means that any additional systems that may be induced by the program, but not incented (that is, spillover or free-driver effects) are not claimed by PECO under the program.
Process Evaluation Methodology
Evaluation of the CHP Program implementation is important to ensure that the program is operating as intended and to provide information that can enable improvements in both the program design and implementation. The EM&V contractor(s) selected by PECO will conduct process evaluations throughout Phase III.
Process evaluation will assess the customer’s understanding of, attitudes about, and satisfaction with both the program and with PECO’s broader educational activities. The evaluations will make use of survey data collected by the implementation and EM&V contractors. The diversity of customers in this target market requires that survey content and fielding will need to accommodate a wide variety of participation experiences.
The EM&V contractor will conduct interviews with program trade allies to assess satisfaction with the program and to identify problems and possible program services/implementation improvements.
The EM&V contractor will also help PECO assess the performance of the program design and delivery of the products and services featured in the program, including effectiveness of the educational materials, effectiveness of promotional campaigns and messages, effectiveness of the trade ally involvement, and whether implementation milestones are met adequately and on schedule. These evaluations will use sales and promotion data maintained by the implementation CSP, information provided by PECO, and customer survey data.

PECO PY 2016-2020 Act 129 - Phase III Energy Efficiency And Conservation Plan Page 78
Program Title and Years Combined Heat and Power Program PY 2016 – PY 2020
Administrative Requirements
PECO will administer the CHP Program through a CSP implementation contractor. PECO’s role will be to ensure that:
» The CSP performs all activities associated with delivery of all components of the program, and
» PECO’s educational and program messages are delivered accurately and clearly to ensure the effectiveness of program delivery and maximize customer satisfaction with the program.
The CHP Program is expected to operate with the following PECO/Contract staffing mix:
PECO Combined Heat and Power Program—Proposed Staffing
Staff Estimated Full-Time
Equivalent PECO Combined Heat and Power Program Management
1.0
Requested external staffing levels will be provided upon the completion of the CSP selection process.
Estimated Participation
Participation and measure adoption estimates were developed based on experience in Phase II, the number of existing businesses in PECO’s service territory, and an assessment of the attainable market potential in the area. Estimated participation is detailed in Appendix E.
Estimated Program Budget and Percent of Sector
PECO Combined Heat and Power Program—Proposed Budget ($000)
PECO Combined Heat and Power Program
PY 2016 PY 2017 PY 2018 PY 2019 PY 2020 Total
Program Budget as
a % of Large C&I
Sector CHP $5,328 $5,572 $5,829 $6,101 $2,165 $24,995 23%
Anticipated Costs to Participating Customers
PECO Combined Heat and Power Program—Participation Costs ($000) PECO Combined Heat and Power Program PY 2016 PY 2017 PY 2018 PY 2019 PY 2020 Total
CHP $143,369 $144,769 $146,183 $147,611 $149,054 $730,986

PECO PY 2016-2020 Act 129 - Phase III Energy Efficiency And Conservation Plan Page 79
Program Title and Years Combined Heat and Power Program PY 2016 – PY 2020
Projected Energy Savings and Demand Reduction
The estimated energy savings and demand reduction are based on PECO’s estimates of annual per-unit kWh and kW values and the maximum effective useful life permitted by Act 129 (15 years). These values were applied to the estimated number of systems expected in each capacity range that PECO estimates will be completed in each program year.
PECO Combined Heat and Power Program Gross Annual Energy Savings Estimates (MWh)
PECO Combined Heat and Power Program PY 2016 PY 2017 PY 2018 PY 2019 PY 2020
CHP 78,710 81,806 85,057 88,471 29,490
*45.0% of energy savings come from the G/E/NP sector.
PECO Combined Heat and Power Program Peak Demand Savings Estimates (kW) PECO Combined Heat and Power Program PY 2016 PY 2017 PY 2018 PY 2019 PY 2020
CHP 11,881 12,348 12,838 13,353 4,451
*45.1% of demand savings come from the G/E/NP sector.
Energy savings are “at meter”; demand savings are “at generator”.
Cost-Effectiveness
PECO Combined Heat and Power Program Cost-Effectiveness
PECO Combined Heat and Power Program
Dollars TRC
(GROSS) TRC
(NET) NTG Ratio Discounted Lifetime Benefits
Discounted Lifetime Costs
Net Benefits
CHP $103,844 $113,512 -$9,668 0.9* 0.9* 0.8 *Program level TRCs do not include portfolio level administrative costs.
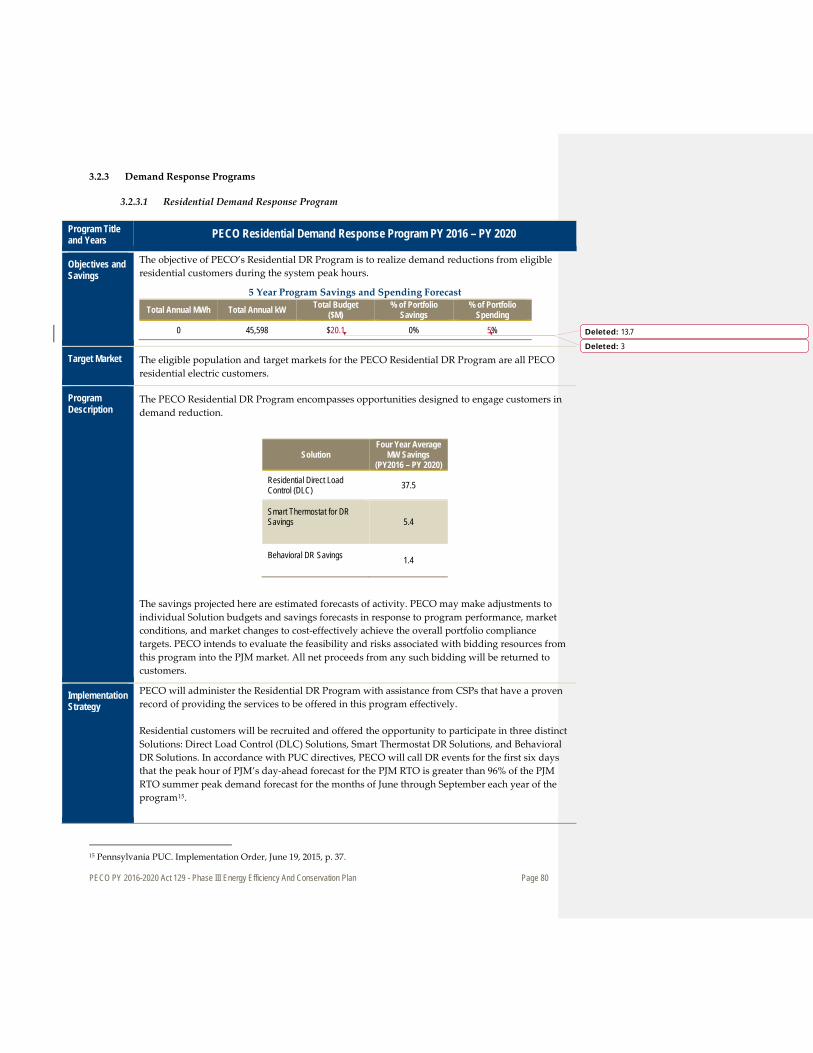
PECO PY 2016-2020 Act 129 - Phase III Energy Efficiency And Conservation Plan Page 80
3.2.3 Demand Response Programs
3.2.3.1 Residential Demand Response Program
Program Title and Years PECO Residential Demand Response Program PY 2016 – PY 2020
Objectives and Savings
The objective of PECO’s Residential DR Program is to realize demand reductions from eligible residential customers during the system peak hours.
5 Year Program Savings and Spending Forecast
Total Annual MWh Total Annual kW Total Budget ($M)
% of Portfolio Savings
% of Portfolio Spending
0 45,598 $20.1 0% 5%
Target Market The eligible population and target markets for the PECO Residential DR Program are all PECO residential electric customers.
Program Description
The PECO Residential DR Program encompasses opportunities designed to engage customers in demand reduction.
Solution Four Year Average
MW Savings (PY2016 – PY 2020)
Residential Direct Load Control (DLC) 37.5
Smart Thermostat for DR Savings
5.4
Behavioral DR Savings
1.4
The savings projected here are estimated forecasts of activity. PECO may make adjustments to individual Solution budgets and savings forecasts in response to program performance, market conditions, and market changes to cost-effectively achieve the overall portfolio compliance targets. PECO intends to evaluate the feasibility and risks associated with bidding resources from this program into the PJM market. All net proceeds from any such bidding will be returned to customers.
Implementation Strategy
PECO will administer the Residential DR Program with assistance from CSPs that have a proven record of providing the services to be offered in this program effectively. Residential customers will be recruited and offered the opportunity to participate in three distinct Solutions: Direct Load Control (DLC) Solutions, Smart Thermostat DR Solutions, and Behavioral DR Solutions. In accordance with PUC directives, PECO will call DR events for the first six days that the peak hour of PJM’s day-ahead forecast for the PJM RTO is greater than 96% of the PJM RTO summer peak demand forecast for the months of June through September each year of the program15.
15 Pennsylvania PUC. Implementation Order, June 19, 2015, p. 37.
Deleted: 13.7
Deleted: 3
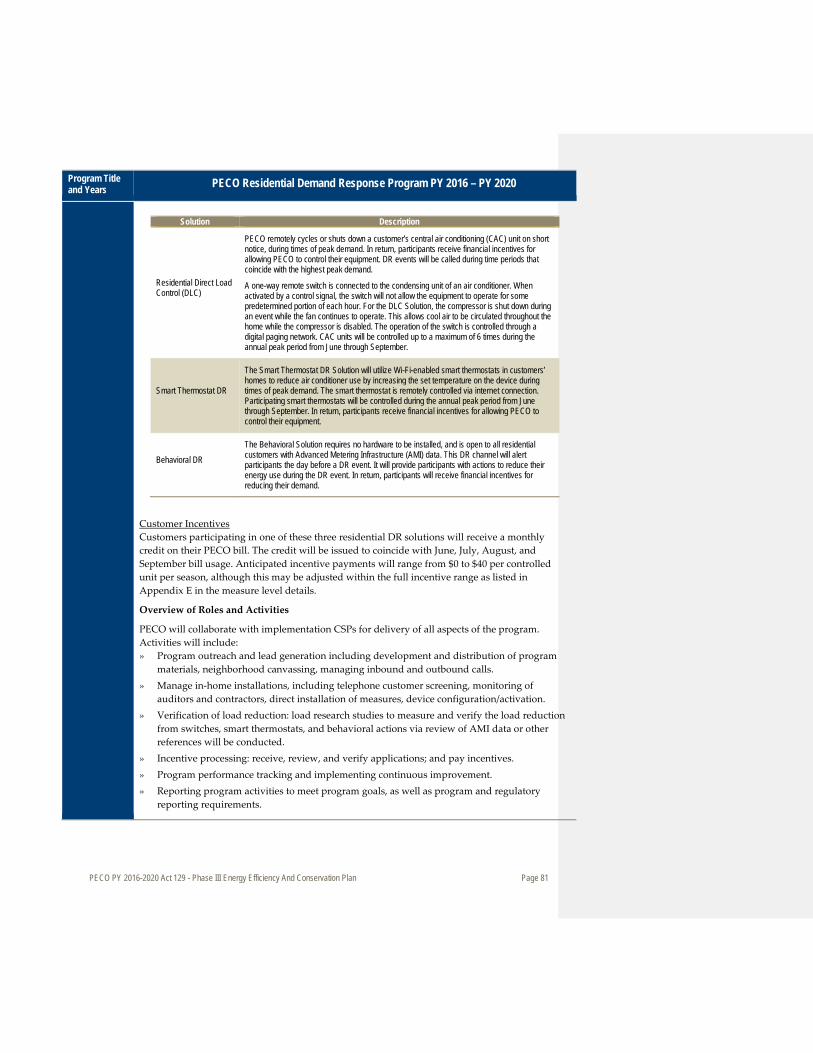
PECO PY 2016-2020 Act 129 - Phase III Energy Efficiency And Conservation Plan Page 81
Program Title and Years PECO Residential Demand Response Program PY 2016 – PY 2020
Solution Description
Residential Direct Load Control (DLC)
PECO remotely cycles or shuts down a customer’s central air conditioning (CAC) unit on short notice, during times of peak demand. In return, participants receive financial incentives for allowing PECO to control their equipment. DR events will be called during time periods that coincide with the highest peak demand.
A one-way remote switch is connected to the condensing unit of an air conditioner. When activated by a control signal, the switch will not allow the equipment to operate for some predetermined portion of each hour. For the DLC Solution, the compressor is shut down during an event while the fan continues to operate. This allows cool air to be circulated throughout the home while the compressor is disabled. The operation of the switch is controlled through a digital paging network. CAC units will be controlled up to a maximum of 6 times during the annual peak period from June through September.
Smart Thermostat DR
The Smart Thermostat DR Solution will utilize Wi-Fi-enabled smart thermostats in customers’ homes to reduce air conditioner use by increasing the set temperature on the device during times of peak demand. The smart thermostat is remotely controlled via internet connection. Participating smart thermostats will be controlled during the annual peak period from June through September. In return, participants receive financial incentives for allowing PECO to control their equipment.
Behavioral DR
The Behavioral Solution requires no hardware to be installed, and is open to all residential customers with Advanced Metering Infrastructure (AMI) data. This DR channel will alert participants the day before a DR event. It will provide participants with actions to reduce their energy use during the DR event. In return, participants will receive financial incentives for reducing their demand.
Customer Incentives Customers participating in one of these three residential DR solutions will receive a monthly credit on their PECO bill. The credit will be issued to coincide with June, July, August, and September bill usage. Anticipated incentive payments will range from $0 to $40 per controlled unit per season, although this may be adjusted within the full incentive range as listed in Appendix E in the measure level details.
Overview of Roles and Activities
PECO will collaborate with implementation CSPs for delivery of all aspects of the program. Activities will include: » Program outreach and lead generation including development and distribution of program
materials, neighborhood canvassing, managing inbound and outbound calls. » Manage in-home installations, including telephone customer screening, monitoring of
auditors and contractors, direct installation of measures, device configuration/activation. » Verification of load reduction: load research studies to measure and verify the load reduction
from switches, smart thermostats, and behavioral actions via review of AMI data or other references will be conducted.
» Incentive processing: receive, review, and verify applications; and pay incentives. » Program performance tracking and implementing continuous improvement. » Reporting program activities to meet program goals, as well as program and regulatory
reporting requirements.
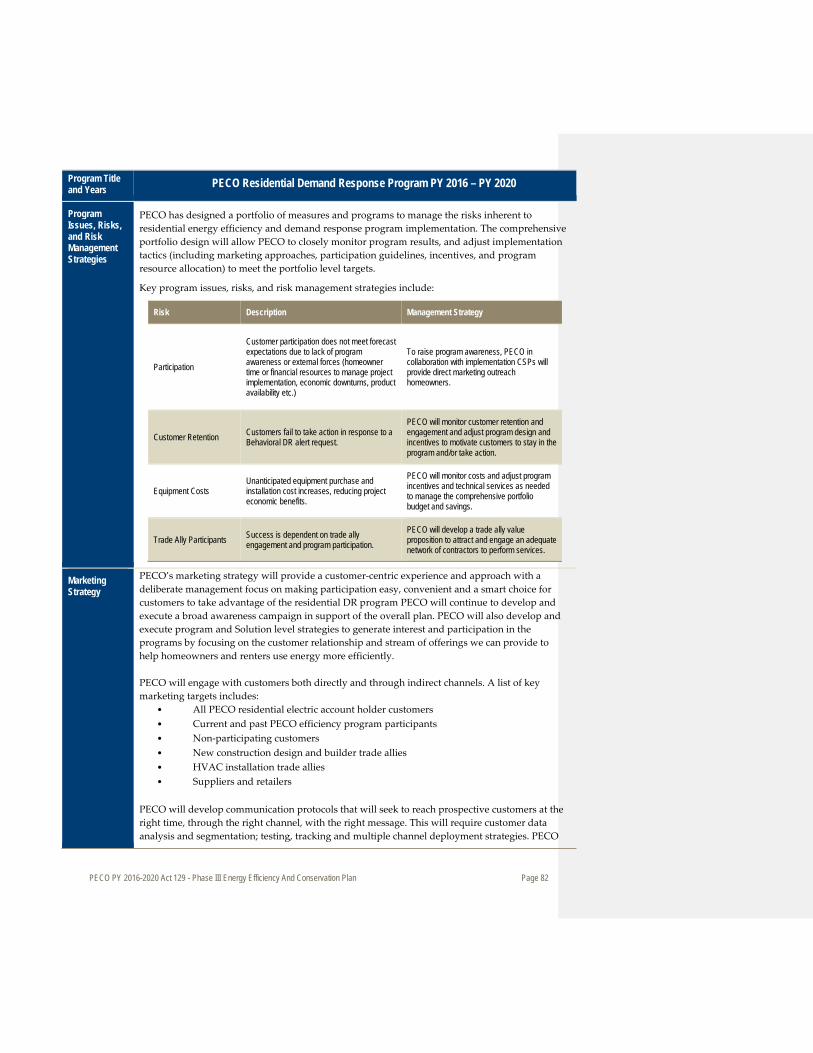
PECO PY 2016-2020 Act 129 - Phase III Energy Efficiency And Conservation Plan Page 82
Program Title and Years PECO Residential Demand Response Program PY 2016 – PY 2020
Program Issues, Risks, and Risk Management Strategies
PECO has designed a portfolio of measures and programs to manage the risks inherent to residential energy efficiency and demand response program implementation. The comprehensive portfolio design will allow PECO to closely monitor program results, and adjust implementation tactics (including marketing approaches, participation guidelines, incentives, and program resource allocation) to meet the portfolio level targets.
Key program issues, risks, and risk management strategies include:
Risk Description Management Strategy
Participation
Customer participation does not meet forecast expectations due to lack of program awareness or external forces (homeowner time or financial resources to manage project implementation, economic downturns, product availability etc.)
To raise program awareness, PECO in collaboration with implementation CSPs will provide direct marketing outreach homeowners.
Customer Retention Customers fail to take action in response to a Behavioral DR alert request.
PECO will monitor customer retention and engagement and adjust program design and incentives to motivate customers to stay in the program and/or take action.
Equipment Costs Unanticipated equipment purchase and installation cost increases, reducing project economic benefits.
PECO will monitor costs and adjust program incentives and technical services as needed to manage the comprehensive portfolio budget and savings.
Trade Ally Participants Success is dependent on trade ally engagement and program participation.
PECO will develop a trade ally value proposition to attract and engage an adequate network of contractors to perform services.
Marketing Strategy
PECO’s marketing strategy will provide a customer-centric experience and approach with a deliberate management focus on making participation easy, convenient and a smart choice for customers to take advantage of the residential DR program PECO will continue to develop and execute a broad awareness campaign in support of the overall plan. PECO will also develop and execute program and Solution level strategies to generate interest and participation in the programs by focusing on the customer relationship and stream of offerings we can provide to help homeowners and renters use energy more efficiently. PECO will engage with customers both directly and through indirect channels. A list of key marketing targets includes:
• All PECO residential electric account holder customers • Current and past PECO efficiency program participants • Non-participating customers • New construction design and builder trade allies • HVAC installation trade allies • Suppliers and retailers
PECO will develop communication protocols that will seek to reach prospective customers at the right time, through the right channel, with the right message. This will require customer data analysis and segmentation; testing, tracking and multiple channel deployment strategies. PECO
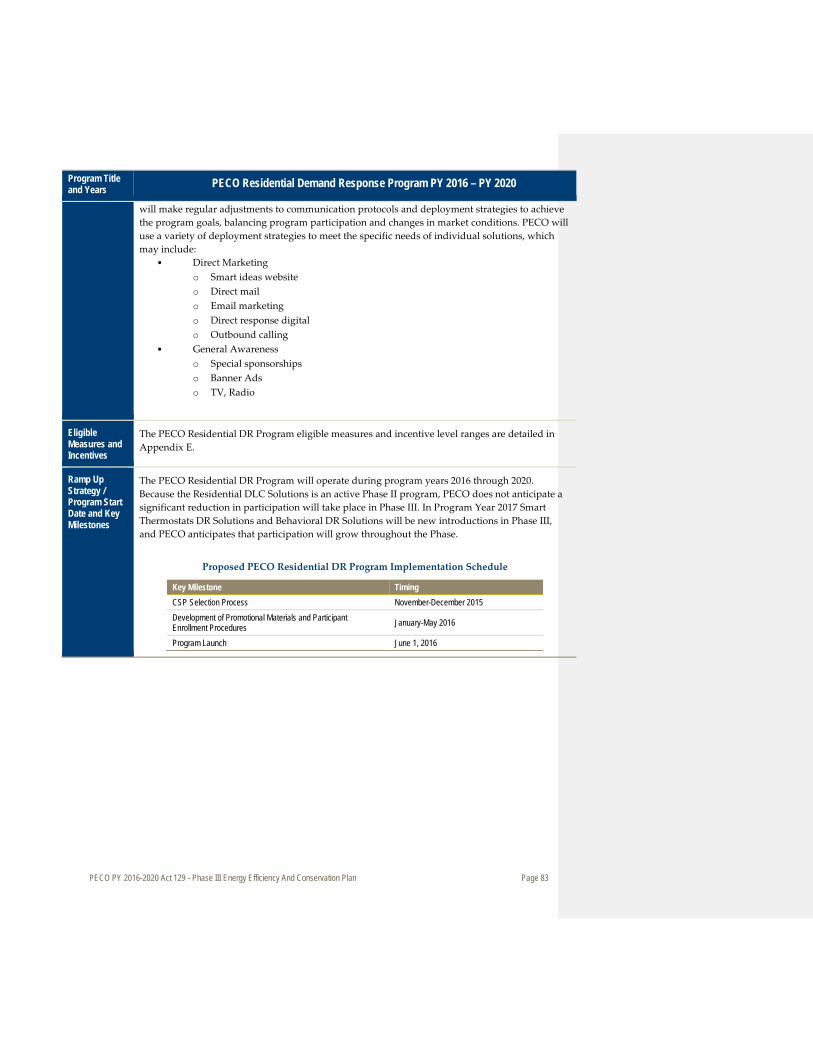
PECO PY 2016-2020 Act 129 - Phase III Energy Efficiency And Conservation Plan Page 83
Program Title and Years PECO Residential Demand Response Program PY 2016 – PY 2020
will make regular adjustments to communication protocols and deployment strategies to achieve the program goals, balancing program participation and changes in market conditions. PECO will use a variety of deployment strategies to meet the specific needs of individual solutions, which may include:
• Direct Marketing o Smart ideas website o Direct mail o Email marketing o Direct response digital o Outbound calling
• General Awareness o Special sponsorships o Banner Ads o TV, Radio
Eligible Measures and Incentives
The PECO Residential DR Program eligible measures and incentive level ranges are detailed in Appendix E.
Ramp Up Strategy / Program Start Date and Key Milestones
The PECO Residential DR Program will operate during program years 2016 through 2020. Because the Residential DLC Solutions is an active Phase II program, PECO does not anticipate a significant reduction in participation will take place in Phase III. In Program Year 2017 Smart Thermostats DR Solutions and Behavioral DR Solutions will be new introductions in Phase III, and PECO anticipates that participation will grow throughout the Phase.
Proposed PECO Residential DR Program Implementation Schedule
Key Milestone Timing CSP Selection Process November-December 2015 Development of Promotional Materials and Participant Enrollment Procedures January-May 2016
Program Launch June 1, 2016
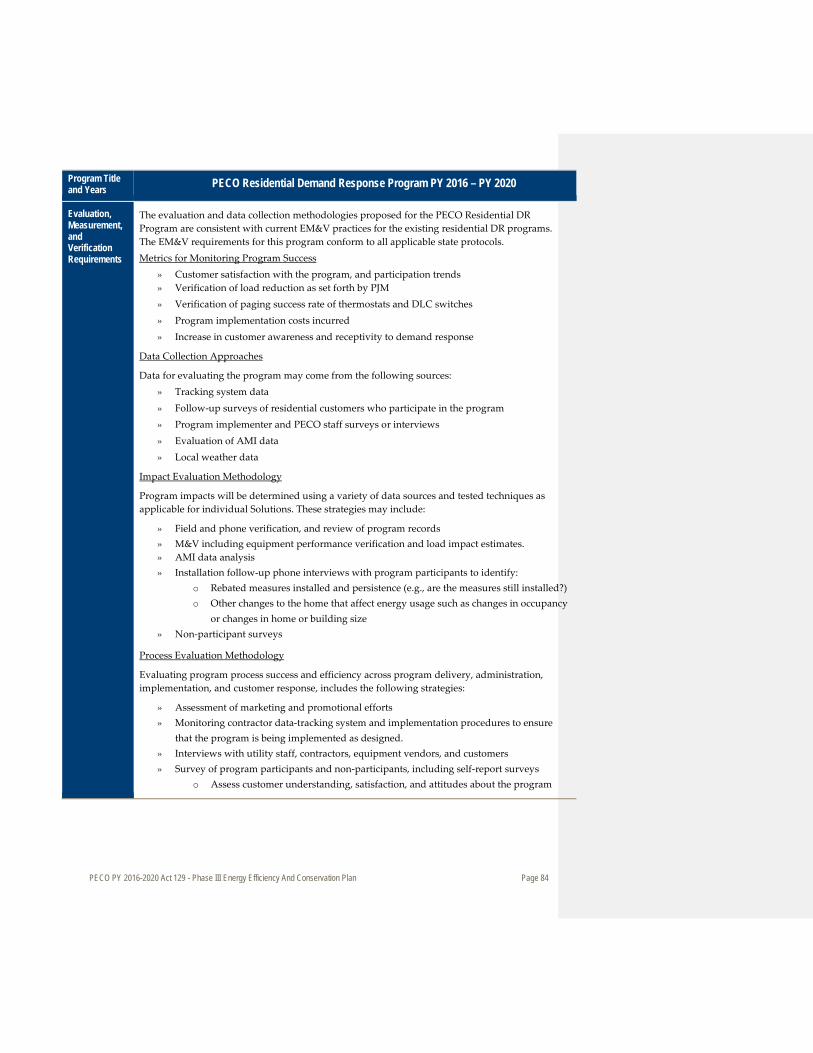
PECO PY 2016-2020 Act 129 - Phase III Energy Efficiency And Conservation Plan Page 84
Program Title and Years PECO Residential Demand Response Program PY 2016 – PY 2020
Evaluation, Measurement, and Verification Requirements
The evaluation and data collection methodologies proposed for the PECO Residential DR Program are consistent with current EM&V practices for the existing residential DR programs. The EM&V requirements for this program conform to all applicable state protocols. Metrics for Monitoring Program Success
» Customer satisfaction with the program, and participation trends » Verification of load reduction as set forth by PJM » Verification of paging success rate of thermostats and DLC switches » Program implementation costs incurred » Increase in customer awareness and receptivity to demand response
Data Collection Approaches
Data for evaluating the program may come from the following sources: » Tracking system data » Follow-up surveys of residential customers who participate in the program » Program implementer and PECO staff surveys or interviews » Evaluation of AMI data » Local weather data
Impact Evaluation Methodology
Program impacts will be determined using a variety of data sources and tested techniques as applicable for individual Solutions. These strategies may include:
» Field and phone verification, and review of program records » M&V including equipment performance verification and load impact estimates. » AMI data analysis » Installation follow-up phone interviews with program participants to identify:
o Rebated measures installed and persistence (e.g., are the measures still installed?) o Other changes to the home that affect energy usage such as changes in occupancy
or changes in home or building size » Non-participant surveys
Process Evaluation Methodology
Evaluating program process success and efficiency across program delivery, administration, implementation, and customer response, includes the following strategies:
» Assessment of marketing and promotional efforts » Monitoring contractor data-tracking system and implementation procedures to ensure
that the program is being implemented as designed. » Interviews with utility staff, contractors, equipment vendors, and customers » Survey of program participants and non-participants, including self-report surveys
o Assess customer understanding, satisfaction, and attitudes about the program
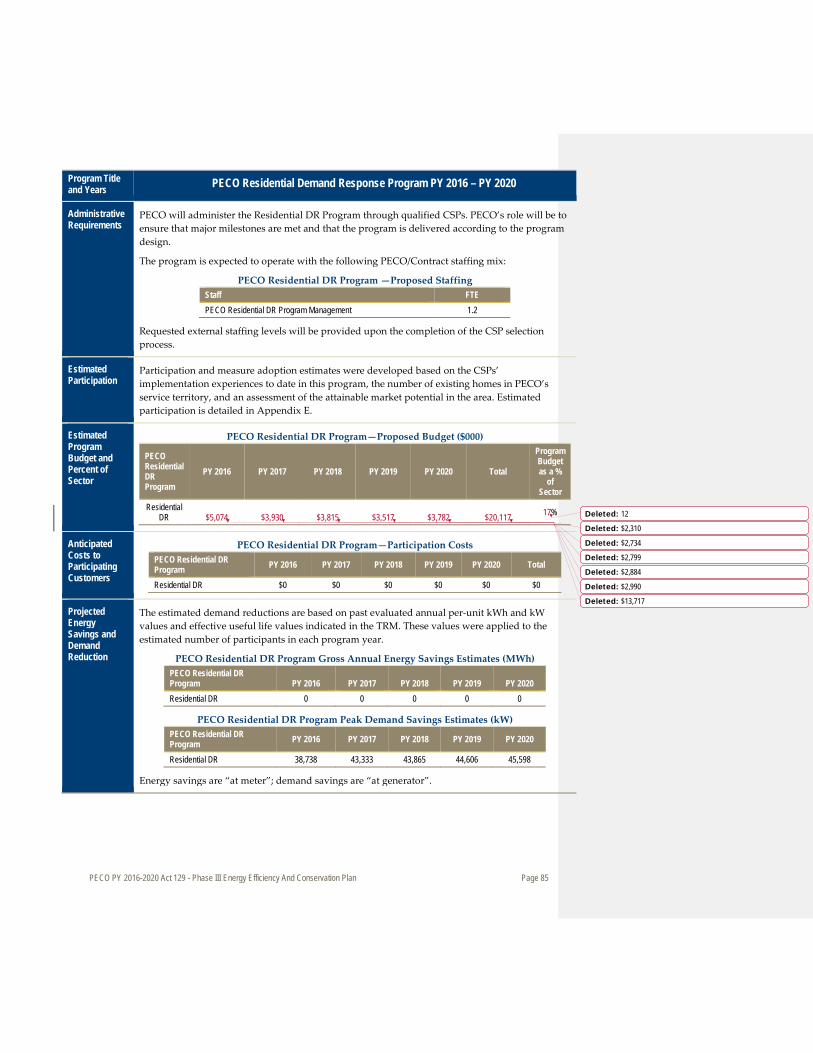
PECO PY 2016-2020 Act 129 - Phase III Energy Efficiency And Conservation Plan Page 85
Program Title and Years PECO Residential Demand Response Program PY 2016 – PY 2020
Administrative Requirements
PECO will administer the Residential DR Program through qualified CSPs. PECO’s role will be to ensure that major milestones are met and that the program is delivered according to the program design.
The program is expected to operate with the following PECO/Contract staffing mix:
PECO Residential DR Program —Proposed Staffing Staff FTE PECO Residential DR Program Management 1.2
Requested external staffing levels will be provided upon the completion of the CSP selection process.
Estimated Participation
Participation and measure adoption estimates were developed based on the CSPs’ implementation experiences to date in this program, the number of existing homes in PECO’s service territory, and an assessment of the attainable market potential in the area. Estimated participation is detailed in Appendix E.
Estimated Program Budget and Percent of Sector
PECO Residential DR Program—Proposed Budget ($000)
PECO Residential DR Program
PY 2016 PY 2017 PY 2018 PY 2019 PY 2020 Total
Program Budget as a %
of Sector
Residential DR $5,074 $3,930 $3,815 $3,517 $3,782 $20,117 17%
Anticipated Costs to Participating Customers
PECO Residential DR Program—Participation Costs PECO Residential DR Program PY 2016 PY 2017 PY 2018 PY 2019 PY 2020 Total
Residential DR $0 $0 $0 $0 $0 $0
Projected Energy Savings and Demand Reduction
The estimated demand reductions are based on past evaluated annual per-unit kWh and kW values and effective useful life values indicated in the TRM. These values were applied to the estimated number of participants in each program year.
PECO Residential DR Program Gross Annual Energy Savings Estimates (MWh) PECO Residential DR Program PY 2016 PY 2017 PY 2018 PY 2019 PY 2020 Residential DR 0 0 0 0 0
PECO Residential DR Program Peak Demand Savings Estimates (kW) PECO Residential DR Program PY 2016 PY 2017 PY 2018 PY 2019 PY 2020
Residential DR 38,738 43,333 43,865 44,606 45,598
Energy savings are “at meter”; demand savings are “at generator”.
Deleted: $2,310
Deleted: $2,734
Deleted: $2,799
Deleted: $2,884
Deleted: $2,990
Deleted: $13,717
Deleted: 12
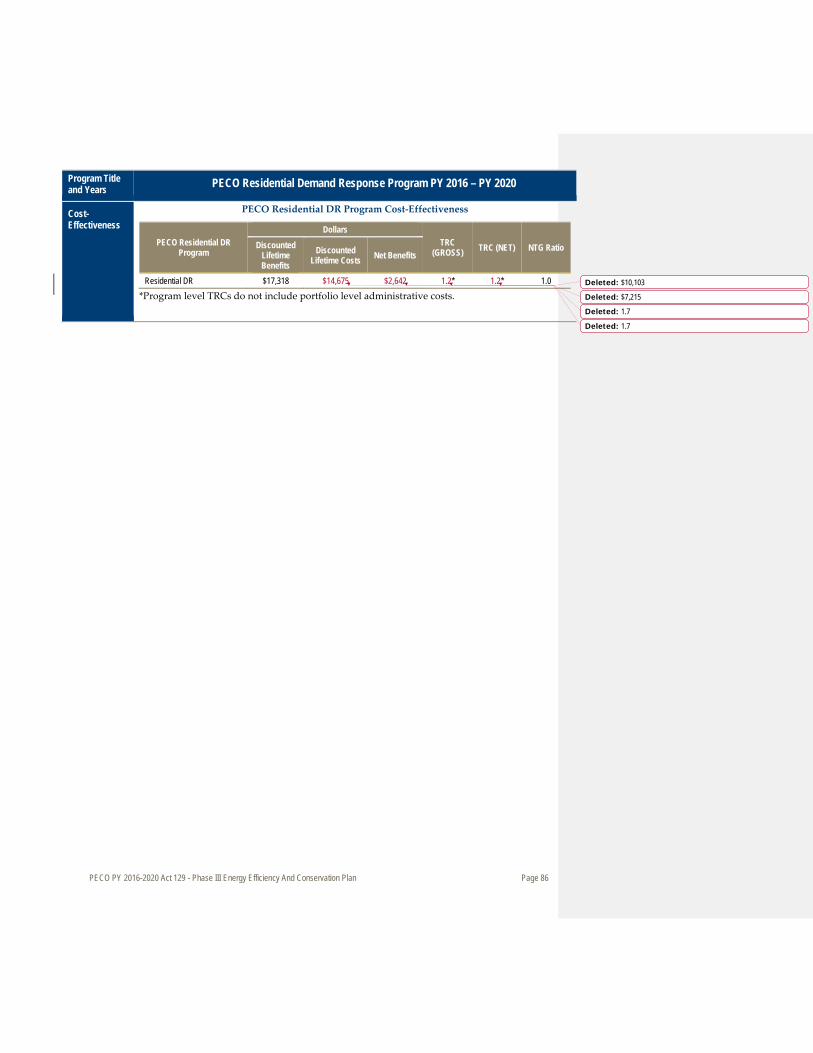
PECO PY 2016-2020 Act 129 - Phase III Energy Efficiency And Conservation Plan Page 86
Program Title and Years PECO Residential Demand Response Program PY 2016 – PY 2020
Cost-Effectiveness
PECO Residential DR Program Cost-Effectiveness
PECO Residential DR Program
Dollars TRC
(GROSS) TRC (NET) NTG Ratio Discounted Lifetime Benefits
Discounted Lifetime Costs Net Benefits
Residential DR $17,318 $14,675 $2,642 1.2* 1.2* 1.0 *Program level TRCs do not include portfolio level administrative costs.
Deleted: $10,103
Deleted: $7,215
Deleted: 1.7
Deleted: 1.7

PECO PY 2016-2020 Act 129 - Phase III Energy Efficiency And Conservation Plan Page 87
3.2.3.2 Small Commercial and Industrial Demand Response Program
Program Title and Years PECO Small Commercial and Industrial DR Program PY 2016 – PY 2020
Objectives and Savings
The objective of PECO’s Small Commercial and Industrial Demand Response (Small C&I DR) Program is to realize demand reductions from eligible small C&I customers in PECO’s service territory during the system peak hours.
Five-Year Program Savings and Spending Forecast
Total Annual MWh Savings
Total Annual kW Savings
Total Budget ($M)
% of Portfolio Savings
% of Portfolio Spending
0 1,226 $0.9 0% 0%
Target Market The eligible population and target markets for the Small C&I DR Program are all PECO small C&I customers, which includes customers in the G/E/NP sector.
Program Description
The PECO Small C&I DR Program is designed to engage customers in demand reduction predominately through direct load control of major electrical end-use equipment during designated peak load hours.
Solution Four Year Average
MW Savings (PY2017 – PY 2020)
Direct Load Control (DLC) 1.2
The savings and spending projected here are estimated forecasts of activity. PECO may make adjustments to individual Solution budgets and savings forecasts in response to program performance, market conditions, and market changes to cost-effectively achieve the program targets. PECO intends to evaluate the feasibility and risks associated with bidding resources from this program into the PJM market. All net proceeds from any such bidding will be returned to customers.
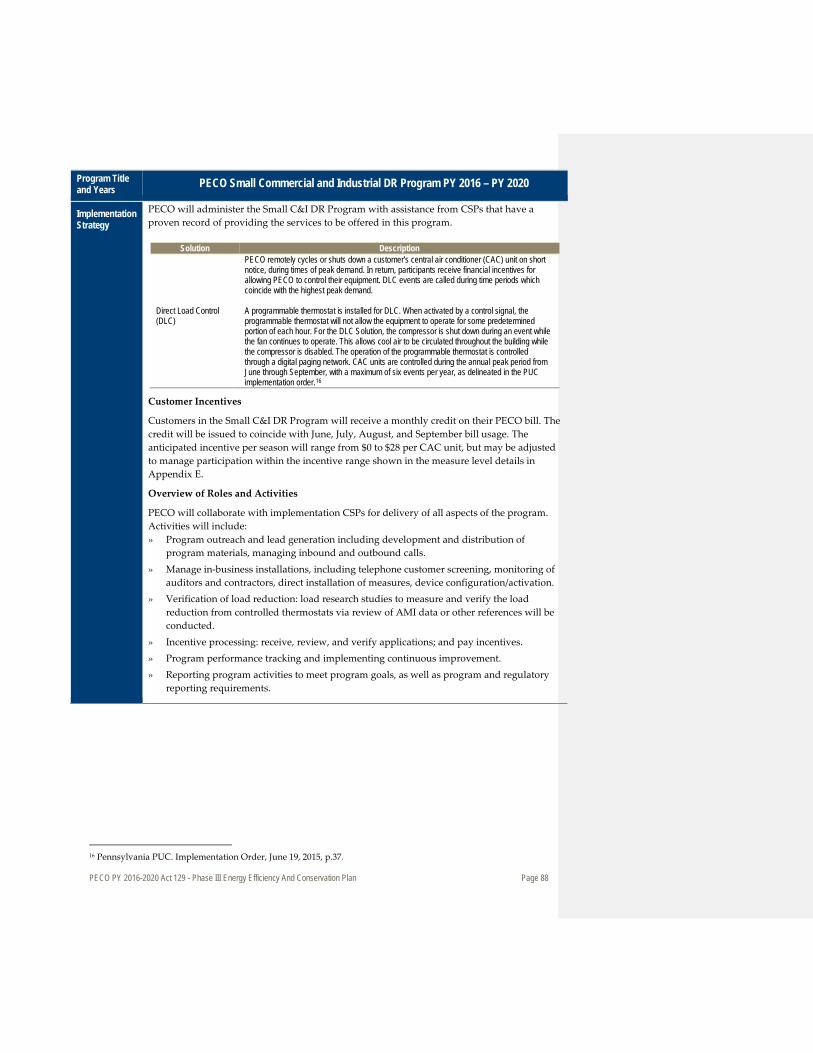
PECO PY 2016-2020 Act 129 - Phase III Energy Efficiency And Conservation Plan Page 88
Program Title and Years PECO Small Commercial and Industrial DR Program PY 2016 – PY 2020
Implementation Strategy
PECO will administer the Small C&I DR Program with assistance from CSPs that have a proven record of providing the services to be offered in this program.
Solution Description
Direct Load Control (DLC)
PECO remotely cycles or shuts down a customer’s central air conditioner (CAC) unit on short notice, during times of peak demand. In return, participants receive financial incentives for allowing PECO to control their equipment. DLC events are called during time periods which coincide with the highest peak demand. A programmable thermostat is installed for DLC. When activated by a control signal, the programmable thermostat will not allow the equipment to operate for some predetermined portion of each hour. For the DLC Solution, the compressor is shut down during an event while the fan continues to operate. This allows cool air to be circulated throughout the building while the compressor is disabled. The operation of the programmable thermostat is controlled through a digital paging network. CAC units are controlled during the annual peak period from June through September, with a maximum of six events per year, as delineated in the PUC implementation order.16
Customer Incentives
Customers in the Small C&I DR Program will receive a monthly credit on their PECO bill. The credit will be issued to coincide with June, July, August, and September bill usage. The anticipated incentive per season will range from $0 to $28 per CAC unit, but may be adjusted to manage participation within the incentive range shown in the measure level details in Appendix E.
Overview of Roles and Activities
PECO will collaborate with implementation CSPs for delivery of all aspects of the program. Activities will include: » Program outreach and lead generation including development and distribution of
program materials, managing inbound and outbound calls. » Manage in-business installations, including telephone customer screening, monitoring of
auditors and contractors, direct installation of measures, device configuration/activation. » Verification of load reduction: load research studies to measure and verify the load
reduction from controlled thermostats via review of AMI data or other references will be conducted.
» Incentive processing: receive, review, and verify applications; and pay incentives. » Program performance tracking and implementing continuous improvement. » Reporting program activities to meet program goals, as well as program and regulatory
reporting requirements.
16 Pennsylvania PUC. Implementation Order, June 19, 2015, p.37.
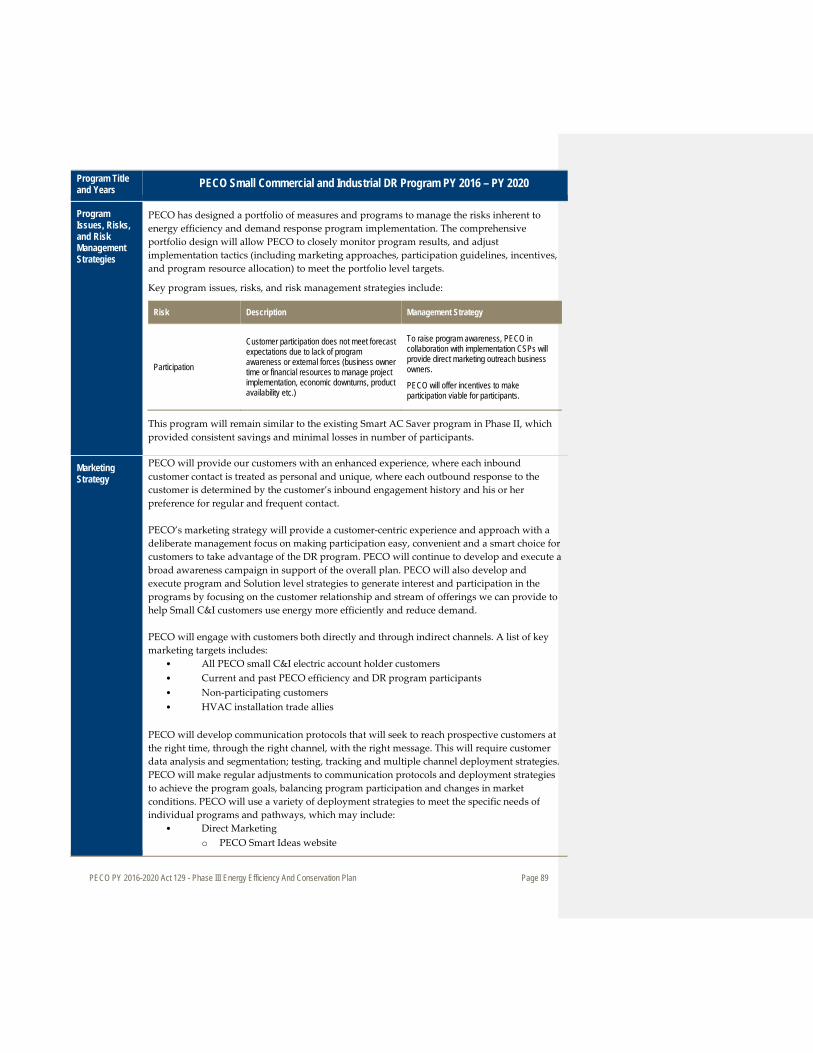
PECO PY 2016-2020 Act 129 - Phase III Energy Efficiency And Conservation Plan Page 89
Program Title and Years PECO Small Commercial and Industrial DR Program PY 2016 – PY 2020
Program Issues, Risks, and Risk Management Strategies
PECO has designed a portfolio of measures and programs to manage the risks inherent to energy efficiency and demand response program implementation. The comprehensive portfolio design will allow PECO to closely monitor program results, and adjust implementation tactics (including marketing approaches, participation guidelines, incentives, and program resource allocation) to meet the portfolio level targets.
Key program issues, risks, and risk management strategies include:
Risk Description Management Strategy
Participation
Customer participation does not meet forecast expectations due to lack of program awareness or external forces (business owner time or financial resources to manage project implementation, economic downturns, product availability etc.)
To raise program awareness, PECO in collaboration with implementation CSPs will provide direct marketing outreach business owners.
PECO will offer incentives to make participation viable for participants.
This program will remain similar to the existing Smart AC Saver program in Phase II, which provided consistent savings and minimal losses in number of participants.
Marketing Strategy
PECO will provide our customers with an enhanced experience, where each inbound customer contact is treated as personal and unique, where each outbound response to the customer is determined by the customer’s inbound engagement history and his or her preference for regular and frequent contact. PECO’s marketing strategy will provide a customer-centric experience and approach with a deliberate management focus on making participation easy, convenient and a smart choice for customers to take advantage of the DR program. PECO will continue to develop and execute a broad awareness campaign in support of the overall plan. PECO will also develop and execute program and Solution level strategies to generate interest and participation in the programs by focusing on the customer relationship and stream of offerings we can provide to help Small C&I customers use energy more efficiently and reduce demand. PECO will engage with customers both directly and through indirect channels. A list of key marketing targets includes:
• All PECO small C&I electric account holder customers • Current and past PECO efficiency and DR program participants • Non-participating customers • HVAC installation trade allies
PECO will develop communication protocols that will seek to reach prospective customers at the right time, through the right channel, with the right message. This will require customer data analysis and segmentation; testing, tracking and multiple channel deployment strategies. PECO will make regular adjustments to communication protocols and deployment strategies to achieve the program goals, balancing program participation and changes in market conditions. PECO will use a variety of deployment strategies to meet the specific needs of individual programs and pathways, which may include:
• Direct Marketing o PECO Smart Ideas website

PECO PY 2016-2020 Act 129 - Phase III Energy Efficiency And Conservation Plan Page 90
Program Title and Years PECO Small Commercial and Industrial DR Program PY 2016 – PY 2020
o Direct mail o Email marketing o Direct response digital o Outbound calling
• General Awareness o Special sponsorships o Banner Ads o TV, Radio
Pathway Solution Marketing Tactics
PECO Direct-Action Direct Load Control (DLC) » Mailing to currently enrolled customers
Eligible Measures and Incentives
The PECO Small C&I DR Program eligible measure and incentive level range is detailed below.
Measure Incentive Level
DLC – 50% cycling strategy $0 - $28
Ramp Up Strategy / Program Start Date and Key Milestones
The PECO Small C&I DR Program will operate during program years 2016 through 2020. The Small C&I DLC Solution is an active Phase II program and it is not anticipated that significant reductions in participation will take place in Phase III.
Proposed PECO Small C&I DR Program Implementation Schedule Key Milestone Timing CSP Selection Process November-December 2015 Development of Promotional Materials and Participant Enrollment Procedures January-May 2016
Program Launch June 1, 2016
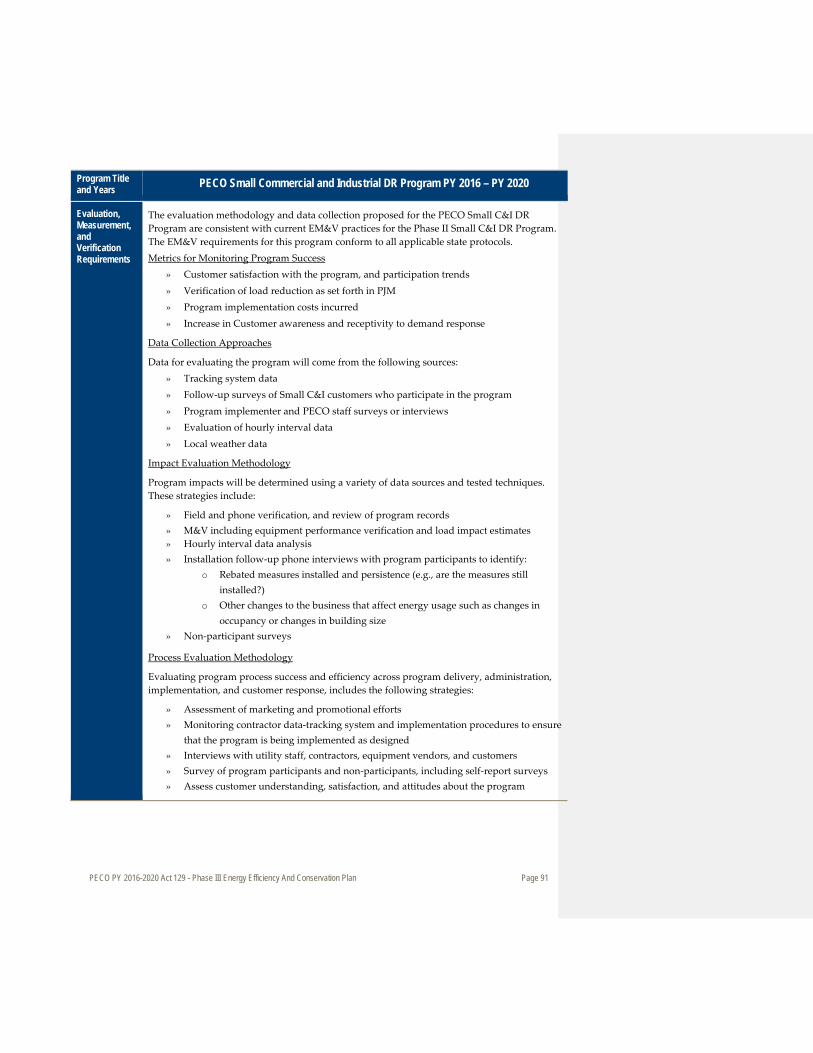
PECO PY 2016-2020 Act 129 - Phase III Energy Efficiency And Conservation Plan Page 91
Program Title and Years PECO Small Commercial and Industrial DR Program PY 2016 – PY 2020
Evaluation, Measurement, and Verification Requirements
The evaluation methodology and data collection proposed for the PECO Small C&I DR Program are consistent with current EM&V practices for the Phase II Small C&I DR Program. The EM&V requirements for this program conform to all applicable state protocols. Metrics for Monitoring Program Success
» Customer satisfaction with the program, and participation trends » Verification of load reduction as set forth in PJM » Program implementation costs incurred » Increase in Customer awareness and receptivity to demand response
Data Collection Approaches
Data for evaluating the program will come from the following sources: » Tracking system data » Follow-up surveys of Small C&I customers who participate in the program » Program implementer and PECO staff surveys or interviews » Evaluation of hourly interval data » Local weather data
Impact Evaluation Methodology
Program impacts will be determined using a variety of data sources and tested techniques. These strategies include:
» Field and phone verification, and review of program records » M&V including equipment performance verification and load impact estimates » Hourly interval data analysis » Installation follow-up phone interviews with program participants to identify:
o Rebated measures installed and persistence (e.g., are the measures still installed?)
o Other changes to the business that affect energy usage such as changes in occupancy or changes in building size
» Non-participant surveys
Process Evaluation Methodology
Evaluating program process success and efficiency across program delivery, administration, implementation, and customer response, includes the following strategies:
» Assessment of marketing and promotional efforts » Monitoring contractor data-tracking system and implementation procedures to ensure
that the program is being implemented as designed » Interviews with utility staff, contractors, equipment vendors, and customers » Survey of program participants and non-participants, including self-report surveys » Assess customer understanding, satisfaction, and attitudes about the program

PECO PY 2016-2020 Act 129 - Phase III Energy Efficiency And Conservation Plan Page 92
Program Title and Years PECO Small Commercial and Industrial DR Program PY 2016 – PY 2020
Administrative Requirements
PECO will administer the Small C&I DR Program through a qualified CSP. PECO’s role will be to ensure that major milestones are met and that the program is delivered according to the program design.
The program is expected to operate with the following PECO/Contract staffing mix:
PECO Small C&I DR Program —Proposed Staffing Staff FTE PECO Small C&I DR Program Management 0.5
Requested external staffing levels will be provided upon the completion of the CSP selection process.
Estimated Participation
Participation and measure adoption estimates were developed based on PECO Phase II program participation and average demand savings per enrolled customer.
Estimated Program Budget and Percent of Sector
PECO Small C&I DR Program—Proposed Budget ($000)
PECO Small C&I DR Program
PY 2016 PY 2017 PY 2018 PY 2019 PY 2020 Total Program
Budget as a % of Sector
Small C&I DR $186 $187 $188 $190 $192 $943 2%
Anticipated Costs to Participating Customers
PECO Small C&I DR Program—Participation Costs PECO Small C&I DR Program PY 2016 PY 2017 PY 2018 PY 2019 PY 2020 Total
Small C&I DR $0 $0 $0 $0 $0 $0
Projected Energy Savings and Demand Reduction
The estimated demand reductions are based on historical evaluation data from PECO Phase I and II DR programs. These values were applied to the estimated number of participants to be retained in the Small C&I DR Program in Phase III.
PECO Small C&I DR Program Gross Annual Energy Savings Estimates (MWh) PECO Small C&I DR Program PY 2016 PY 2017 PY 2018 PY 2019 PY 2020
Small C&I DR 0 0 0 0 0
PECO Small C&I DR Program Peak Demand Savings Estimates (kW) PECO Small C&I DR Program PY 2016 PY 2017 PY 2018 PY 2019 PY 2020
Small C&I DR 1,290 1,274 1,258 1,242 1,226
Energy savings are “at meter”; demand savings are “at generator”.
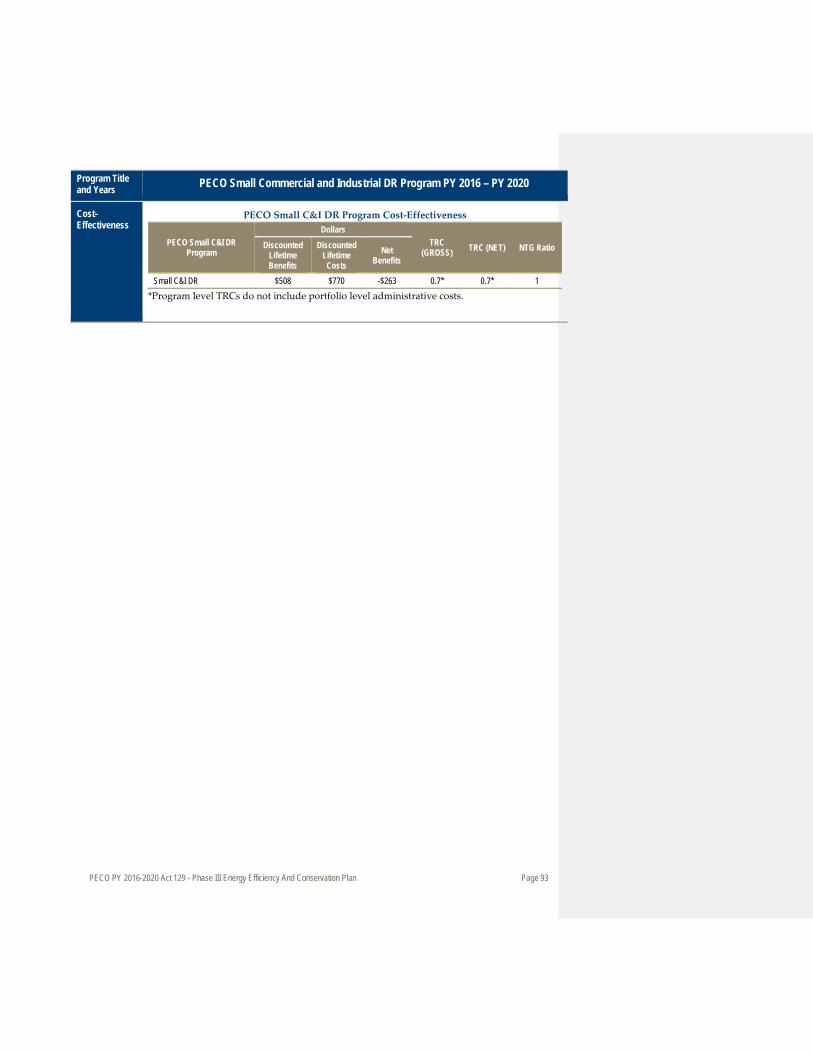
PECO PY 2016-2020 Act 129 - Phase III Energy Efficiency And Conservation Plan Page 93
Program Title and Years PECO Small Commercial and Industrial DR Program PY 2016 – PY 2020
Cost-Effectiveness
PECO Small C&I DR Program Cost-Effectiveness
PECO Small C&I DR Program
Dollars TRC
(GROSS) TRC (NET) NTG Ratio Discounted Lifetime Benefits
Discounted Lifetime Costs
Net Benefits
Small C&I DR $508 $770 -$263 0.7* 0.7* 1 *Program level TRCs do not include portfolio level administrative costs.
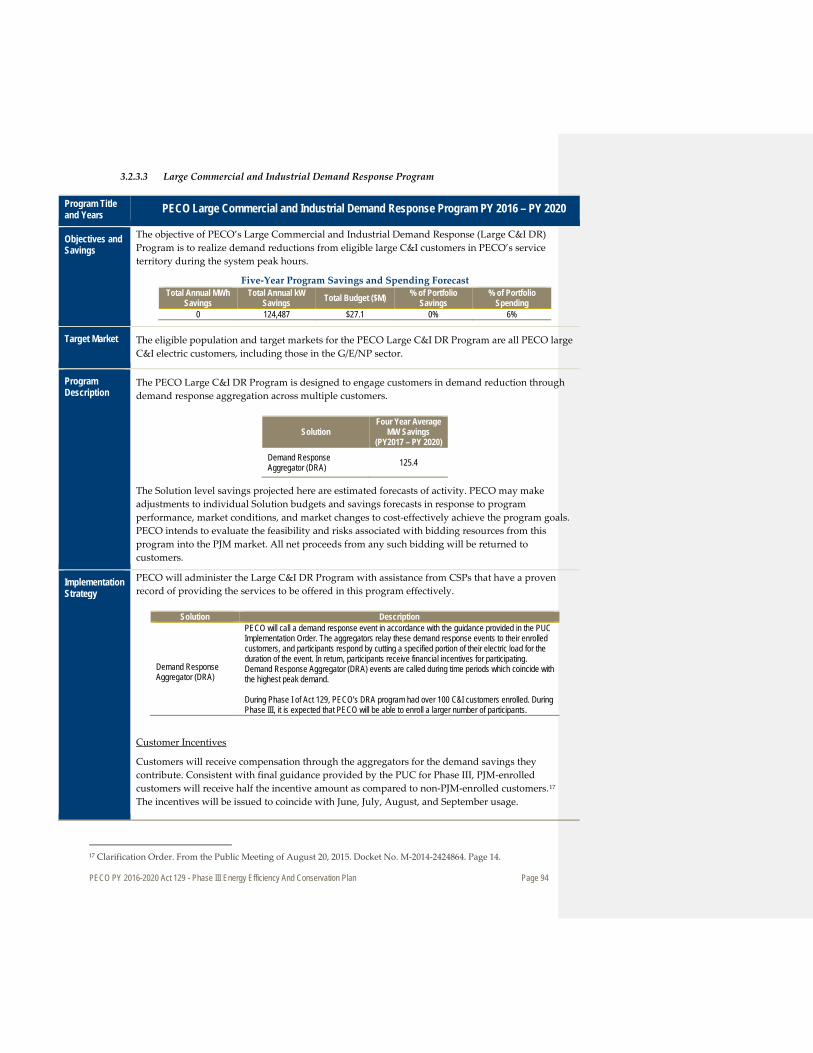
PECO PY 2016-2020 Act 129 - Phase III Energy Efficiency And Conservation Plan Page 94
3.2.3.3 Large Commercial and Industrial Demand Response Program
Program Title and Years PECO Large Commercial and Industrial Demand Response Program PY 2016 – PY 2020
Objectives and Savings
The objective of PECO’s Large Commercial and Industrial Demand Response (Large C&I DR) Program is to realize demand reductions from eligible large C&I customers in PECO’s service territory during the system peak hours.
Five-Year Program Savings and Spending Forecast Total Annual MWh
Savings Total Annual kW
Savings Total Budget ($M) % of Portfolio Savings
% of Portfolio Spending
0 124,487 $27.1 0% 6%
Target Market The eligible population and target markets for the PECO Large C&I DR Program are all PECO large C&I electric customers, including those in the G/E/NP sector.
Program Description
The PECO Large C&I DR Program is designed to engage customers in demand reduction through demand response aggregation across multiple customers.
Solution Four Year Average
MW Savings (PY2017 – PY 2020)
Demand Response Aggregator (DRA) 125.4
The Solution level savings projected here are estimated forecasts of activity. PECO may make adjustments to individual Solution budgets and savings forecasts in response to program performance, market conditions, and market changes to cost-effectively achieve the program goals. PECO intends to evaluate the feasibility and risks associated with bidding resources from this program into the PJM market. All net proceeds from any such bidding will be returned to customers.
Implementation Strategy
PECO will administer the Large C&I DR Program with assistance from CSPs that have a proven record of providing the services to be offered in this program effectively.
Solution Description
Demand Response Aggregator (DRA)
PECO will call a demand response event in accordance with the guidance provided in the PUC Implementation Order. The aggregators relay these demand response events to their enrolled customers, and participants respond by cutting a specified portion of their electric load for the duration of the event. In return, participants receive financial incentives for participating. Demand Response Aggregator (DRA) events are called during time periods which coincide with the highest peak demand. During Phase I of Act 129, PECO’s DRA program had over 100 C&I customers enrolled. During Phase III, it is expected that PECO will be able to enroll a larger number of participants.
Customer Incentives
Customers will receive compensation through the aggregators for the demand savings they contribute. Consistent with final guidance provided by the PUC for Phase III, PJM-enrolled customers will receive half the incentive amount as compared to non-PJM-enrolled customers.17 The incentives will be issued to coincide with June, July, August, and September usage.
17 Clarification Order. From the Public Meeting of August 20, 2015. Docket No. M-2014-2424864. Page 14.
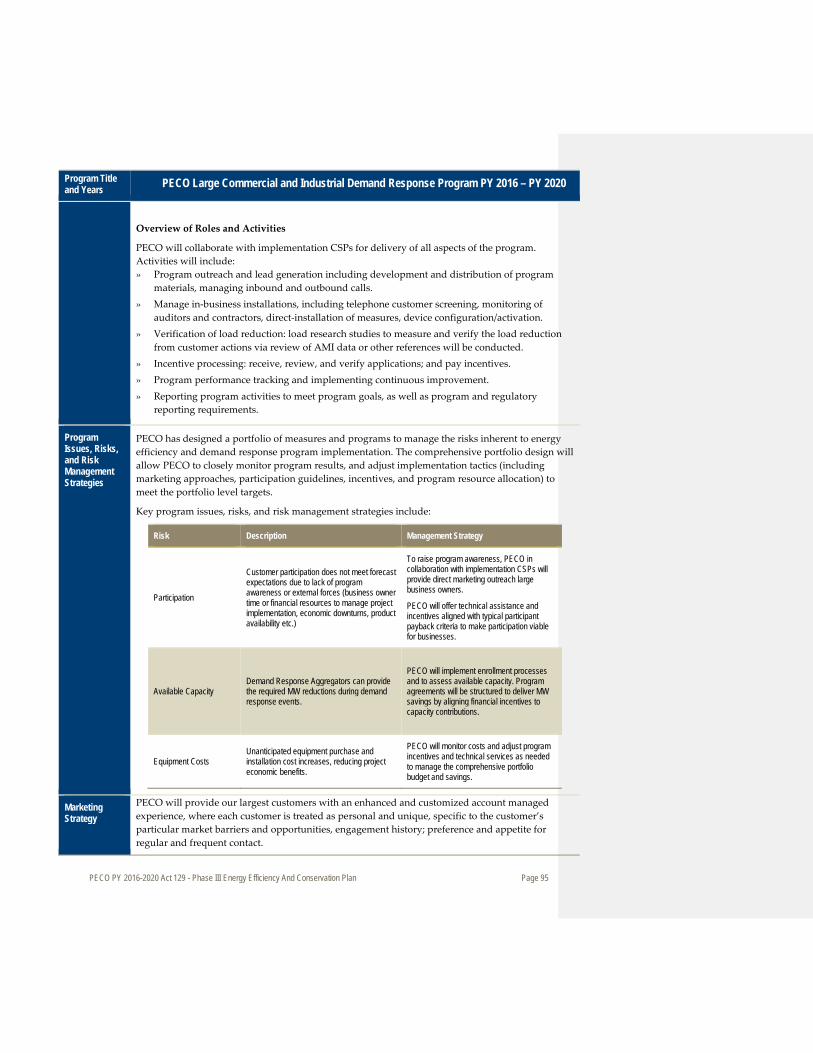
PECO PY 2016-2020 Act 129 - Phase III Energy Efficiency And Conservation Plan Page 95
Program Title and Years PECO Large Commercial and Industrial Demand Response Program PY 2016 – PY 2020
Overview of Roles and Activities
PECO will collaborate with implementation CSPs for delivery of all aspects of the program. Activities will include: » Program outreach and lead generation including development and distribution of program
materials, managing inbound and outbound calls. » Manage in-business installations, including telephone customer screening, monitoring of
auditors and contractors, direct-installation of measures, device configuration/activation. » Verification of load reduction: load research studies to measure and verify the load reduction
from customer actions via review of AMI data or other references will be conducted. » Incentive processing: receive, review, and verify applications; and pay incentives. » Program performance tracking and implementing continuous improvement. » Reporting program activities to meet program goals, as well as program and regulatory
reporting requirements.
Program Issues, Risks, and Risk Management Strategies
PECO has designed a portfolio of measures and programs to manage the risks inherent to energy efficiency and demand response program implementation. The comprehensive portfolio design will allow PECO to closely monitor program results, and adjust implementation tactics (including marketing approaches, participation guidelines, incentives, and program resource allocation) to meet the portfolio level targets.
Key program issues, risks, and risk management strategies include:
Risk Description Management Strategy
Participation
Customer participation does not meet forecast expectations due to lack of program awareness or external forces (business owner time or financial resources to manage project implementation, economic downturns, product availability etc.)
To raise program awareness, PECO in collaboration with implementation CSPs will provide direct marketing outreach large business owners.
PECO will offer technical assistance and incentives aligned with typical participant payback criteria to make participation viable for businesses.
Available Capacity Demand Response Aggregators can provide the required MW reductions during demand response events.
PECO will implement enrollment processes and to assess available capacity. Program agreements will be structured to deliver MW savings by aligning financial incentives to capacity contributions.
Equipment Costs Unanticipated equipment purchase and installation cost increases, reducing project economic benefits.
PECO will monitor costs and adjust program incentives and technical services as needed to manage the comprehensive portfolio budget and savings.
Marketing Strategy
PECO will provide our largest customers with an enhanced and customized account managed experience, where each customer is treated as personal and unique, specific to the customer’s particular market barriers and opportunities, engagement history; preference and appetite for regular and frequent contact.
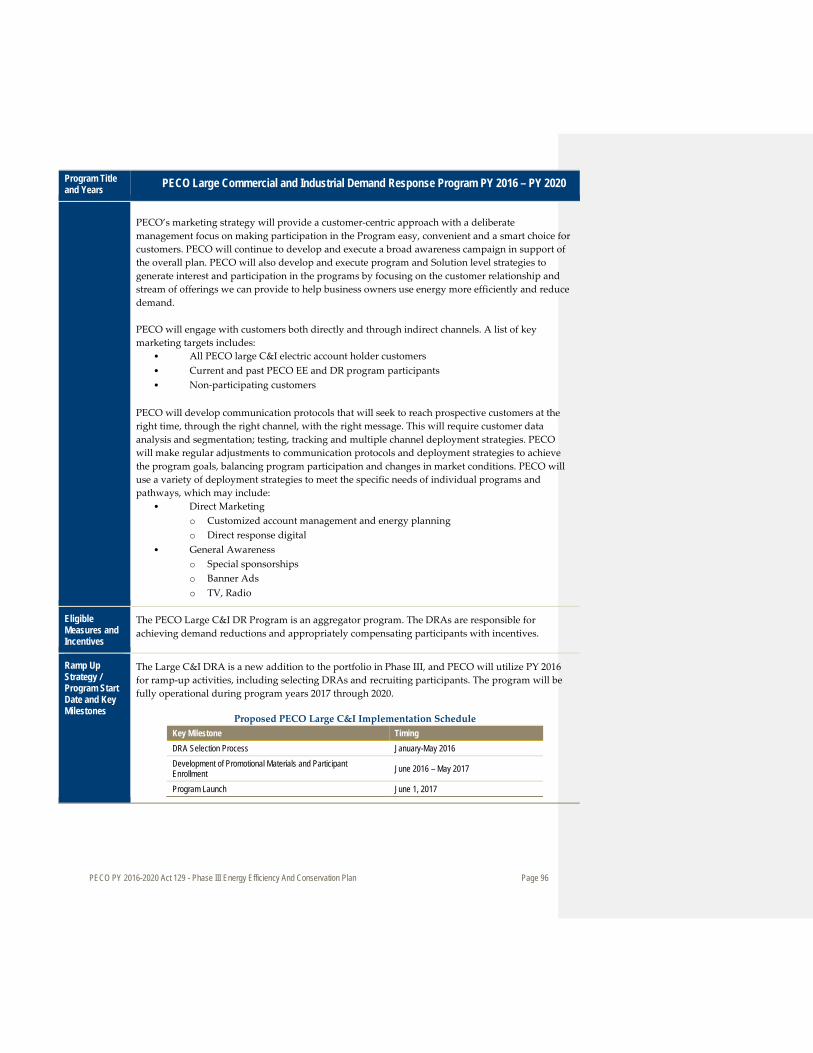
PECO PY 2016-2020 Act 129 - Phase III Energy Efficiency And Conservation Plan Page 96
Program Title and Years PECO Large Commercial and Industrial Demand Response Program PY 2016 – PY 2020
PECO’s marketing strategy will provide a customer-centric approach with a deliberate management focus on making participation in the Program easy, convenient and a smart choice for customers. PECO will continue to develop and execute a broad awareness campaign in support of the overall plan. PECO will also develop and execute program and Solution level strategies to generate interest and participation in the programs by focusing on the customer relationship and stream of offerings we can provide to help business owners use energy more efficiently and reduce demand. PECO will engage with customers both directly and through indirect channels. A list of key marketing targets includes:
• All PECO large C&I electric account holder customers • Current and past PECO EE and DR program participants • Non-participating customers
PECO will develop communication protocols that will seek to reach prospective customers at the right time, through the right channel, with the right message. This will require customer data analysis and segmentation; testing, tracking and multiple channel deployment strategies. PECO will make regular adjustments to communication protocols and deployment strategies to achieve the program goals, balancing program participation and changes in market conditions. PECO will use a variety of deployment strategies to meet the specific needs of individual programs and pathways, which may include:
• Direct Marketing o Customized account management and energy planning o Direct response digital
• General Awareness o Special sponsorships o Banner Ads o TV, Radio
Eligible Measures and Incentives
The PECO Large C&I DR Program is an aggregator program. The DRAs are responsible for achieving demand reductions and appropriately compensating participants with incentives.
Ramp Up Strategy / Program Start Date and Key Milestones
The Large C&I DRA is a new addition to the portfolio in Phase III, and PECO will utilize PY 2016 for ramp-up activities, including selecting DRAs and recruiting participants. The program will be fully operational during program years 2017 through 2020.
Proposed PECO Large C&I Implementation Schedule Key Milestone Timing DRA Selection Process January-May 2016 Development of Promotional Materials and Participant Enrollment June 2016 – May 2017
Program Launch June 1, 2017

PECO PY 2016-2020 Act 129 - Phase III Energy Efficiency And Conservation Plan Page 97
Program Title and Years PECO Large Commercial and Industrial Demand Response Program PY 2016 – PY 2020
Evaluation, Measurement, and Verification Requirements
The evaluation methodology and data collection proposed for the PECO Large C&I DR Program are consistent with current EM&V practices for the existing Residential and Small C&I DR Programs. The EM&V requirements for this program conform to all applicable state protocols. Metrics for Monitoring Program Success
» Customer satisfaction with the program, and participation trends » Verification of load reduction as set forth in PJM » Program implementation costs incurred » Increase in customer awareness and receptivity to demand response
Data Collection Approaches
Data for evaluating the program will come from the following sources: » Tracking system data » Follow-up surveys of large C&I and G/E/NP customers who participate in the program » Program implementer and PECO staff surveys or interviews » Evaluation of hourly interval data » Local weather data
Impact Evaluation Methodology
PECO will calculate demand impacts for each participant in accordance with the PJM protocols. Strategies include:
» Field and phone verification, and review of program records » M&V including hourly interval data analysis
Process Evaluation Methodology
Evaluating program process success and efficiency across program delivery, administration, implementation, and customer response, includes the following strategies:
» Assessment of marketing and promotional efforts. » Monitoring contractor data-tracking system and implementation procedures to ensure that
the program is being implemented as designed. » Interviews with utility staff, contractors, equipment vendors, and customers. » Survey of program participants and non-participants, including self-report surveys. » Assess customer understanding, satisfaction, and attitudes about the program.

PECO PY 2016-2020 Act 129 - Phase III Energy Efficiency And Conservation Plan Page 98
Program Title and Years PECO Large Commercial and Industrial Demand Response Program PY 2016 – PY 2020
Administrative Requirements
PECO will administer the Large C&I DR Program through Demand Response Aggregators. PECO’s role will be to ensure that major milestones are met and that the program is delivered according to the program design.
The program is expected to operate with the following PECO/Contract staffing mix:
PECO Large C&I DR Program —Proposed Staffing Staff FTE PECO Large C&I DR Program Management 1.0
Requested external staffing levels will be provided upon the completion of the CSP selection process.
Estimated Participation
Estimated participation is detailed in Appendix E.
Estimated Program Budget and Percent of Sector
PECO Large C&I DR Program—Proposed Budget ($000)
PECO Large C&I DR Program PY 2016 PY 2017 PY 2018 PY 2019 PY 2020 Total
Program Budget as
a % of Sector
Large C&I DR $165 $6,771 $6,752 $6,733 $6,715 $27,137 25%
Anticipated Costs to Participating Customers
PECO Large C&I DR Program—Participation Costs PECO Large C&I DR Program PY 2016 PY 2017 PY 2018 PY 2019 PY 2020 Total
Large C&I DR $0 $0 $0 $0 $0 $0
Projected Energy Savings and Demand Reduction
The estimated demand reduction is based on Phase I DRA Program evaluated average per-unit kW demand reductions.
PECO Large C&I DR Program Gross Annual Energy Savings Estimates (MWh) PECO Large C&I DR Program PY 2016 PY 2017 PY 2018 PY 2019 PY 2020
Large C&I DR 0 0 0 0 0
PECO Large C&I DR Program Peak Demand Savings Estimates (kW) PECO Large C&I DR Program PY 2016 PY 2017 PY 2018 PY 2019 PY 2020
Large C&I DR 0 126,300 125,695 125,091 124,487
Energy savings are “at meter”; demand savings are “at generator”.
Cost-Effectiveness
PECO Large C&I DR Program Cost-Effectiveness
PECO Large C&I DR Program
Dollars TRC
(GROSS) TRC (NET) NTG Ratio Discounted Lifetime Benefits
Discounted Lifetime Costs
Net Benefits
Large C&I DR $38,893 $18,587 $20,306 2.1* 2.1* 1.0 *Program level TRCs do not include portfolio level administrative costs.

PECO PY 2016-2020 Act 129 - Phase III Energy Efficiency And Conservation Plan Page 99
4. Program Management and Implementation Strategies
4.1 Overview of PECO Management and Implementation Strategies
4.1.1 Types of services offered by PECO and other parties
The objective of PECO’s energy efficiency and demand response activities is to offer customer centric energy management solutions that result in reducing PECO’s customer electric costs and while delivering cost-effective energy and demand savings to meet the PUC. This is accomplished through a portfolio of comprehensive program offerings, delivered through the most effective means available. PECO will support the Plan implementation through a combination of internal resources, CSPs, and the use of trade allies and retail distribution outlets. The programs will employ multiple implementation and communication strategies to maximize customer awareness and channel interested customers into the most appropriate participation pathway. PECO assumes responsibility across all CSPs to provide strategic direction, develop and review Request for Proposals (RFPs), analyze program performance, develop, coordinate and execute education and awareness raising activities and promotions, develop and recommend program changes, and ensure overall program success and budget management. CSPs will provide program delivery services in accordance with PECO’s plan and program designs, recruitment of participants and participating trade allies, tracking and reporting, resolution of issues, and payment of incentives and rebates. As per PUC requirements, PECO will engage an evaluation contractor to be responsible for measurement, verification and evaluation of the portfolio. The evaluation contractor will verify that programs are meeting their goals and are being operated consistently with the approved plan. The evaluation contractor will interface with the Statewide Evaluator to ensure measurement and verification protocols are aligned with the state’s requirements, in addition to providing feedback periodically to PECO on the identified areas where delivery performance could be improved.
4.1.2 Risk categories and risk mitigation strategies
There are risks inherent in the delivery of any energy efficiency and demand response portfolio. The following are some key steps PECO is taking to manage those risks:
1. Selecting programs that are diversified in design and implementation strategy, including some energy efficiency programs that are relatively simple, flexible and have a history of delivering results in other states (e.g. upstream and midstream retail programs), combined with comprehensive program offerings that strive for deeper energy savings, as well as varied demand response programs that utilize different technologies to target all customer classes
2. Developing a Plan with a broad mix of solutions, measures and participation pathways to avoid over reliance on any single measure, channel or customer segment.
3. Forecasting to exceed the overall energy and demand savings targets to hedge unknown performance across the entire portfolio.
4.1.2.1 Performance Risk
Program benchmarking is the first step PECO took to ensure the portfolio was well balanced with a high likelihood of success. In addition to PECO’s Phase I and II experience with many of the solutions and measures it is proposing for Phase III, the types of programs and solutions in the Phase III portfolio have
PECO PY 2016-2020 Act 129 - Phase III Energy Efficiency And Conservation Plan Page 100
been operating for many years in states such as California, Vermont and New York. PECO has incorporated its own experience with lessons learned from other jurisdictions in the current plan design. PECO will also manage performance risk using a clear and robust CSP RFP process for selecting the CSPs with the proven experience to implement the approved plan. PECO will utilize a disciplined RFP evaluation and selection process to ensure it engages experienced CSPs in the delivery of the programs. PECO’s RFPs will require CSPs to demonstrate a proven track record of performance. CSP contracts, where possible, will include performance clauses to ensure CSPs have a strong financial incentive to succeed. PECO program managers will be responsible for continual oversight of the CSP performance against the Plan and will promptly implement corrective actions if goals are not being met. Lastly, PECO Plans to continue to meet with stakeholders and other Pennsylvania EDCs to share learnings and draw on program experience across the state to improve the programs in its portfolio.
4.1.2.2 Technology Risk
This Plan focuses the majority of the incentives on known technologies and products with established energy and demand savings. The TRM provides the majority of standards upon which prescriptive or deemed energy savings will be determined. Using this approach removes much of the technology risk from the prescriptive energy efficiency measures in the Plan and results in a more cost-effective measurement and verification process. The technology to be used in the direct load control demand response programs is the same technology PECO used successfully in Phases I and II. PECO used the observed demand reductions from previous years to predict demand savings for Phase III. This continuity removes much of the technological risks associated with demand response. PECO’s CSPs will calculate savings for custom projects on a project by project basis, using the existing (or code-required) equipment as the baseline of energy use. CSPs will conduct pre- and post-inspections, where appropriate, to verify equipment and operating conditions. Incentive payment estimates will be based on standard engineering and energy calculation principles and final payments will be based on the confirmed savings.
4.1.2.3 Market Risk
PECO has worked diligently to ensure a strong portfolio of programs, benchmarked for success in other jurisdictions, and developed with input from key stakeholders. Program success is a function of uncovering barriers to participation and developing approaches that address these barriers. PECO has gained significant experience and connection to the market in the process of delivering its Phase I and Phase II programs. Below are some of PECO’s strategies to reduce market risk:
1. Education and awareness will be a component of every program. This will include not only program awareness but also the benefits of becoming more energy efficient.
2. All trade allies will be offered training opportunities and provided appropriate materials and support. The intent will be to ensure awareness and knowledge of the programs, to provide strategies for selling energy efficiency and demand response to their customers, and to educate the trade allies on the how these programs will help them further their business goals.
3. PECO and its contractors will implement a strong promotional advertising campaign to drive awareness and call on PECO customers to take action.
4. As appropriate, point of sale material will be placed in participating retail stores.

PECO PY 2016-2020 Act 129 - Phase III Energy Efficiency And Conservation Plan Page 101
5. Clear program eligibility and streamlined application processes will make participation as easy as possible for customers.
6. PECO will select only CSPs that can demonstrate an extensive and successful record of program design and implementation experience. This will ensure that each program strategy is implemented by a strong team and has the best chance for success.
4.1.2.4 Evaluation Risk
PECO will utilize several strategies to minimize evaluation risk. Eliminating evaluation risk begins with program design, to ensure all assumptions and EM&V protocols are agreed upon in advance. PECO will work closely with the Statewide Evaluator to ensure consistent assumptions and processes are used. The TRM will provide a known set of assumptions for most prescriptive measures. PECO’s EM&V contractor will conduct a disciplined verification activity for each program to ensure measures that customers received incentives for have, in fact, been installed. PECO and its EM&V contractor will use industry standards and state-approved methods to perform the measurement and verification process.
4.1.3 Human resource and contractor resource constraints
PECO understands that flexibility in resource staffing is needed to effectively implement the Plan and will manage human resource and contractor resources constraints through deliberate staffing and training. Understanding that program activity is not consistent over the year or program cycle, implementation staff will be cross-trained so they can be moved into different functional areas at times of high volume. For instance, supervisors or engineers may be trained on the procedures for field inspections so they can be deployed if a backlog develops. Internally, the organization will be overseen by PECO’s Energy and Marketing Services and will be further broken out in the marketing department by the following groups: Residential Energy Efficiency Programs, Commercial and Industrial Programs, Demand Response Programs, Measurement and Verification, Business Planning and Promotions.
4.1.4 Early warning systems to indicate progress towards goals and process for adjustment
PECO has several methods for monitoring progress towards goals and ensuring that corrective actions are taken. Program Managers will closely monitor the programs through direct interface with the CSPs and through the DSM program tracking database. PECO will develop and monitor performance indicators for each program on a monthly basis. Regular review of performance metrics as well as feedback from CSPs will allow the Program Manager to identify potential issues and take prompt corrective actions. Regular program evaluation will also identify issues that may impede a program’s ability to effectively reach its goals. The EM&V contractor will conduct evaluations early in the program cycle, especially for new programs, to make sure that issues are identified early. It will be the Evaluation Manager’s responsibility to ensure that program managers consider recommended improvements carefully and incorporate them into the program design as warranted. PECO will monitor efforts to update building and appliance codes that may affect the building or equipment baselines, and develop strategies to adapt these changes into any affected program’s design. Whether from codes and standards changes or evaluation results, PECO will quickly react to actual or potential changes in the TRM to ensure that programs are claiming appropriate energy savings.
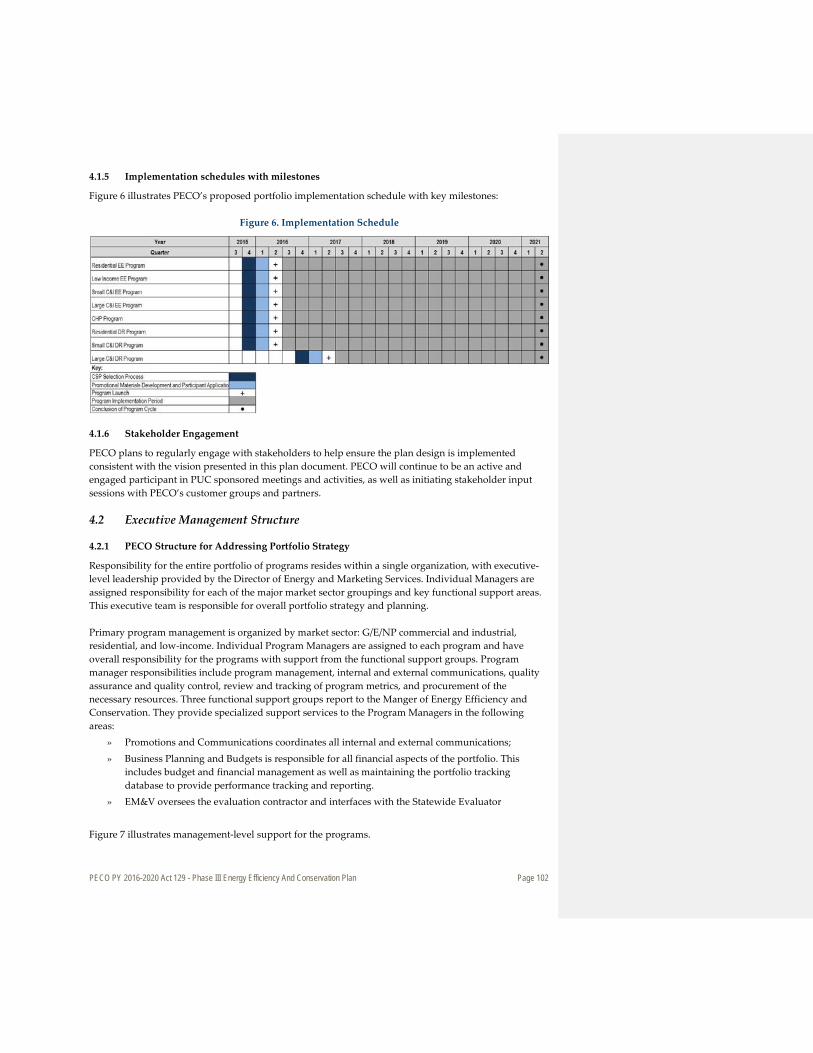
PECO PY 2016-2020 Act 129 - Phase III Energy Efficiency And Conservation Plan Page 102
4.1.5 Implementation schedules with milestones
Figure 6 illustrates PECO’s proposed portfolio implementation schedule with key milestones:
Figure 6. Implementation Schedule
4.1.6 Stakeholder Engagement
PECO plans to regularly engage with stakeholders to help ensure the plan design is implemented consistent with the vision presented in this plan document. PECO will continue to be an active and engaged participant in PUC sponsored meetings and activities, as well as initiating stakeholder input sessions with PECO’s customer groups and partners.
4.2 Executive Management Structure
4.2.1 PECO Structure for Addressing Portfolio Strategy
Responsibility for the entire portfolio of programs resides within a single organization, with executive-level leadership provided by the Director of Energy and Marketing Services. Individual Managers are assigned responsibility for each of the major market sector groupings and key functional support areas. This executive team is responsible for overall portfolio strategy and planning. Primary program management is organized by market sector: G/E/NP commercial and industrial, residential, and low-income. Individual Program Managers are assigned to each program and have overall responsibility for the programs with support from the functional support groups. Program manager responsibilities include program management, internal and external communications, quality assurance and quality control, review and tracking of program metrics, and procurement of the necessary resources. Three functional support groups report to the Manger of Energy Efficiency and Conservation. They provide specialized support services to the Program Managers in the following areas:
» Promotions and Communications coordinates all internal and external communications; » Business Planning and Budgets is responsible for all financial aspects of the portfolio. This
includes budget and financial management as well as maintaining the portfolio tracking database to provide performance tracking and reporting.
» EM&V oversees the evaluation contractor and interfaces with the Statewide Evaluator Figure 7 illustrates management-level support for the programs.

PECO PY 2016-2020 Act 129 - Phase III Energy Efficiency And Conservation Plan Page 103
Figure 7. PECO Proposed EE&C Organization
DirectorEnergy & Marketing Services
Kathy Lentini
EE&DR Program PlanningCoordinator & EM&V Specialist
Marina Geneles
Manager EE&DR, EM&V &Strategic PlanningNick DeDominicis
ManagerEnergy Efficiency and Conservation
Sabrina Brooks
Administrative AssistantLisa Andrews
ManagerDemand Response & Technical
Services
Paul Miles
ManagerMarketing
Promotions/Communications
Liz Finocchio
ManagerBusiness Planning and Budget
Meilinda Tjokrohadinata
ManagerGovernment and Commercial
Programs
Mike O'Leary
ManagerResidential Low Income
Kathy MacWilliams
Administrative AssistantPat Szukalski
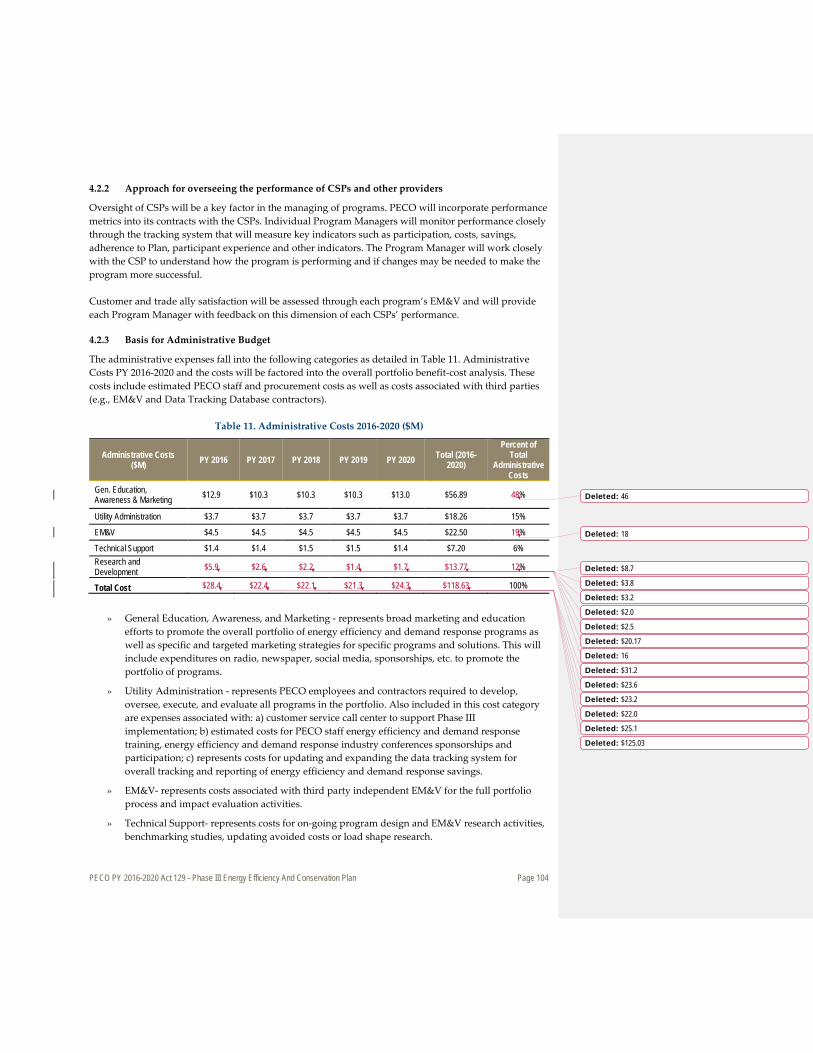
PECO PY 2016-2020 Act 129 - Phase III Energy Efficiency And Conservation Plan Page 104
4.2.2 Approach for overseeing the performance of CSPs and other providers
Oversight of CSPs will be a key factor in the managing of programs. PECO will incorporate performance metrics into its contracts with the CSPs. Individual Program Managers will monitor performance closely through the tracking system that will measure key indicators such as participation, costs, savings, adherence to Plan, participant experience and other indicators. The Program Manager will work closely with the CSP to understand how the program is performing and if changes may be needed to make the program more successful. Customer and trade ally satisfaction will be assessed through each program’s EM&V and will provide each Program Manager with feedback on this dimension of each CSPs’ performance.
4.2.3 Basis for Administrative Budget
The administrative expenses fall into the following categories as detailed in Table 11. Administrative Costs PY 2016-2020 and the costs will be factored into the overall portfolio benefit-cost analysis. These costs include estimated PECO staff and procurement costs as well as costs associated with third parties (e.g., EM&V and Data Tracking Database contractors).
Table 11. Administrative Costs 2016-2020 ($M)
Administrative Costs ($M) PY 2016 PY 2017 PY 2018 PY 2019 PY 2020 Total (2016-
2020)
Percent of Total
Administrative Costs
Gen. Education, Awareness & Marketing $12.9 $10.3 $10.3 $10.3 $13.0 $56.89 48%
Utility Administration $3.7 $3.7 $3.7 $3.7 $3.7 $18.26 15%
EM&V $4.5 $4.5 $4.5 $4.5 $4.5 $22.50 19%
Technical Support $1.4 $1.4 $1.5 $1.5 $1.4 $7.20 6% Research and Development $5.9 $2.6 $2.2 $1.4 $1.7 $13.77 12%
Total Cost $28.4 $22.4 $22.1 $21.3 $24.3 $118.63 100%
» General Education, Awareness, and Marketing - represents broad marketing and education efforts to promote the overall portfolio of energy efficiency and demand response programs as well as specific and targeted marketing strategies for specific programs and solutions. This will include expenditures on radio, newspaper, social media, sponsorships, etc. to promote the portfolio of programs.
» Utility Administration - represents PECO employees and contractors required to develop, oversee, execute, and evaluate all programs in the portfolio. Also included in this cost category are expenses associated with: a) customer service call center to support Phase III implementation; b) estimated costs for PECO staff energy efficiency and demand response training, energy efficiency and demand response industry conferences sponsorships and participation; c) represents costs for updating and expanding the data tracking system for overall tracking and reporting of energy efficiency and demand response savings.
» EM&V- represents costs associated with third party independent EM&V for the full portfolio process and impact evaluation activities.
» Technical Support- represents costs for on-going program design and EM&V research activities, benchmarking studies, updating avoided costs or load shape research.
Deleted: 46
Deleted: 18
Deleted: $8.7
Deleted: $3.8
Deleted: $3.2
Deleted: $2.0
Deleted: $2.5
Deleted: $20.17
Deleted: 16
Deleted: $31.2
Deleted: $23.6
Deleted: $23.2
Deleted: $22.0
Deleted: $25.1
Deleted: $125.03
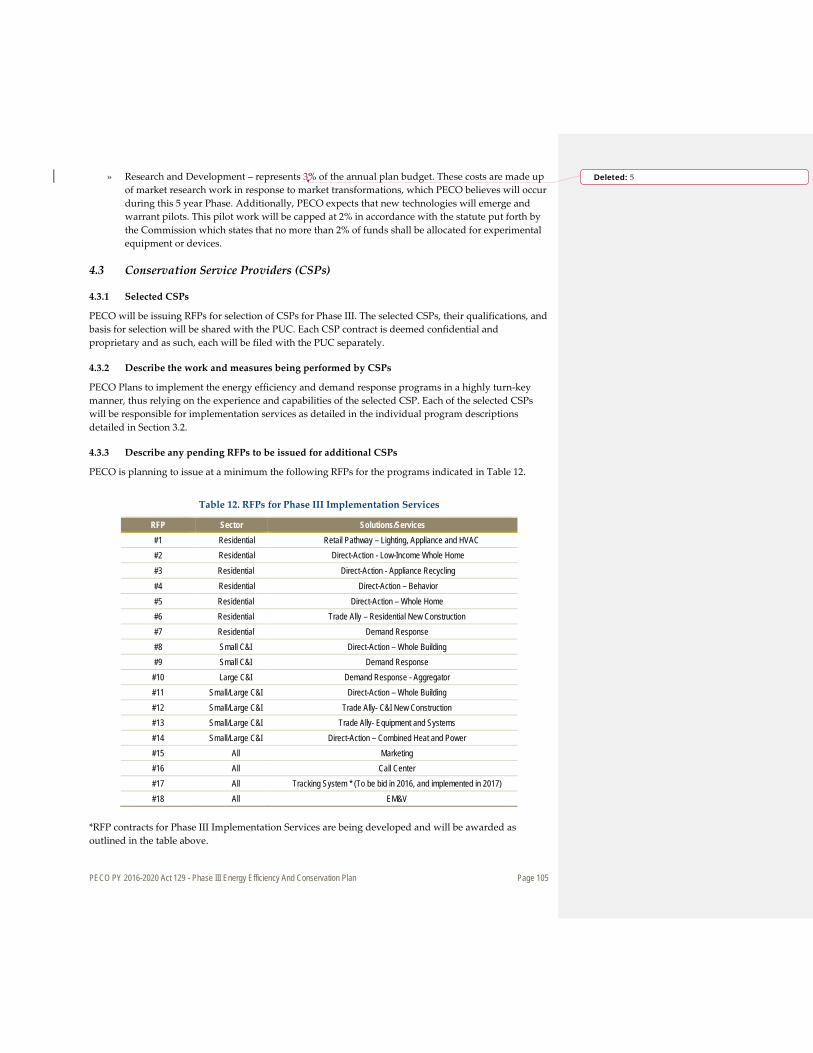
PECO PY 2016-2020 Act 129 - Phase III Energy Efficiency And Conservation Plan Page 105
» Research and Development – represents 3% of the annual plan budget. These costs are made up of market research work in response to market transformations, which PECO believes will occur during this 5 year Phase. Additionally, PECO expects that new technologies will emerge and warrant pilots. This pilot work will be capped at 2% in accordance with the statute put forth by the Commission which states that no more than 2% of funds shall be allocated for experimental equipment or devices.
4.3 Conservation Service Providers (CSPs)
4.3.1 Selected CSPs
PECO will be issuing RFPs for selection of CSPs for Phase III. The selected CSPs, their qualifications, and basis for selection will be shared with the PUC. Each CSP contract is deemed confidential and proprietary and as such, each will be filed with the PUC separately.
4.3.2 Describe the work and measures being performed by CSPs
PECO Plans to implement the energy efficiency and demand response programs in a highly turn-key manner, thus relying on the experience and capabilities of the selected CSP. Each of the selected CSPs will be responsible for implementation services as detailed in the individual program descriptions detailed in Section 3.2.
4.3.3 Describe any pending RFPs to be issued for additional CSPs
PECO is planning to issue at a minimum the following RFPs for the programs indicated in Table 12.
Table 12. RFPs for Phase III Implementation Services
RFP Sector Solutions/Services #1 Residential Retail Pathway – Lighting, Appliance and HVAC #2 Residential Direct-Action - Low-Income Whole Home #3 Residential Direct-Action - Appliance Recycling #4 Residential Direct-Action – Behavior #5 Residential Direct-Action – Whole Home #6 Residential Trade Ally – Residential New Construction #7 Residential Demand Response #8 Small C&I Direct-Action – Whole Building #9 Small C&I Demand Response
#10 Large C&I Demand Response - Aggregator #11 Small/Large C&I Direct-Action – Whole Building #12 Small/Large C&I Trade Ally- C&I New Construction #13 Small/Large C&I Trade Ally- Equipment and Systems #14 Small/Large C&I Direct-Action – Combined Heat and Power #15 All Marketing #16 All Call Center #17 All Tracking System * (To be bid in 2016, and implemented in 2017) #18 All EM&V
*RFP contracts for Phase III Implementation Services are being developed and will be awarded as outlined in the table above.
Deleted: 5
PECO PY 2016-2020 Act 129 - Phase III Energy Efficiency And Conservation Plan Page 106
5. Reporting and Tracking Systems
5.1 Reporting PECO Plans to utilize a CSP to conduct impact and process evaluations and a separate CSP to develop and maintain an EM&V Tracking System. The EM&V contractor will be responsible for conducting impact and process evaluations of all programs and interfacing with the Statewide Evaluator to determine the required data collection and reporting requirements. The EM&V Evaluation Contractor will then disseminate that information to the EM&V tracking system vendor and implementation CSPs to ensure that all data collection and reporting requirements are satisfied. The EM&V tracking system vendor will be responsible for developing and maintaining a robust tracking system, capable of storing all of the required data and providing reports, outlined by the Statewide Evaluator, on a secure electronic platform. In June 2017, PECO will deploy a new EM&V Tracking System to replace the current Smart Ideas Database System (SIDS). This timeline ensures PECO has sufficient time to both develop and implement the new system to handle data from either new or retained CSPs, and also migrate all historical data from Phases I and II into the new system to facilitate reporting. PECO will conduct a two-stage process, first issuing a Request for Information, followed by a Request for Proposals, to select a vendor to develop and implement a new EM&V Tracking System to support Phase III, by June 1 2017. Act 129 EE&C Phase III Reports will include semi-annual activity reports and an annual report for each program year of Phase III.
1. Semi-Annual Reports – These reports capture program activity for the period and are filed 45 days after the close of the six month reporting period. The reports will contain the following sections
• Overview of Portfolio Summary of Achievements Program Updates and Findings Evaluation updates and Findings
• Summary of Energy Impacts by Program • Summary of Finances Portfolio-Level Expenditures Program-Level Expenditures
2. Annual Reports – These final annual reports will be filed no later than November 15 following the last day of each full program year and include the following sections:
• Overview of Portfolio Summary of Progress Toward Compliance Target Summary of Energy Impacts Summary of Fuel Switching Impacts Summary of Demand Impacts Summary of Net to Gross Ratios Summary of Portfolio Finances and Cost Effectiveness Summary of Cost Effectiveness by Program
• Program Details Program Updates Impact Evaluation Gross Savings

PECO PY 2016-2020 Act 129 - Phase III Energy Efficiency And Conservation Plan Page 107
Impact Evaluation Net Savings Process Evaluation Financial Reporting
3. Reporting Schedule – All Act 129 EE&C Phase III reports shall be filed with the Secretary,
with a copy provided to the Statewide Evaluator. Further, all reports shall be posted to the PECO website. Reporting for each program year of Phase III shall follow the schedule below:
Semi-Annual Report • January 15 – Semi-Annual Report (first six months of the program year)
Annual Report • November 15 - Final Annual Report including activity beginning June and
ending May
5.1.1 Data Submissions
Please refer to sections 5.2.1 and 5.2.2 for data that will be available to the Commission and its Statewide Evaluator.
5.2 Project Management Tracking Systems This section presents the EM&V Tracking System requirements that PECO anticipates will meet internal and external (Statewide Evaluator) needs.
5.2.1 Data Tracking System Overview
The EM&V Tracking System will provide a variety of standard reports as well as support an ad hoc query and report development process. The standard reports will support PECO’s tracking of incentive commitments, incentives paid, and kWh and kW achieved as well as other pertinent data.
Examples of standard reports include, but are not limited to:
» Incentives committed year-to-date and current reporting period » kWh and kW achieved year-to-date and current reporting period » Incentives paid out year-to-date and current reporting period » kWh and kW variance reports, by vendor, by program element, by measure » kWh and kW incentive forecast based on application completion dates » MW of demand reduction resources based on program performance
In addition to the report functions, it is expected that the system would also be capable of exporting data for use in other software (e.g. Microsoft Excel). The primary critical metric is that all financial components of the programs will be tracked. For this reason, tracking of incentives, paid during any Plan year, is a critical component for this system. All of PECO’s programs are subject to strict budgetary controls and oversight. The EM&V Tracking System will ensure adherence to parameters and specified protocols. In addition, implementation costs, administrative costs, and forecasts will be tracked to ensure all elements of the portfolio qualify for cost recovery treatment. The second critical metric that will be tracked is total kWh of energy conservation and kW of demand reductions achieved. PECO’s programs will use both deemed and partially deemed savings values and custom measure values. Deemed savings values will be provided by the Technical Reference Manual

PECO PY 2016-2020 Act 129 - Phase III Energy Efficiency And Conservation Plan Page 108
(TRM) in two ways: 1) table based pre-calculated savings and reductions that could be loaded into the database and updated periodically as the TRM is updated, and 2) formula based savings and reductions that will need a calculation to determine the savings and/or reductions based on variable inputs – the formulas would reside in the database and be updated periodically as the TRM is updated. Custom measures will all be formula based but the formulas will not be standardized so that the system would allow for direct entry of kWh savings and kW reductions for each measure.
5.2.2 Software Format, Data Exchange Format and Database Structure
The EM&V tracking system will receive data from PECO’s customer Billing and Data Management Systems, PECO’s Customer Information and Marketing System (CIMS) and Chronological Energy Demand Activity Repository (CEDAR). CIMS and CEDAR are customer information management systems that are Mainframe/MVS based. The data is stored in a DB2 (relational model database server) system. There are two standard interface methods with CIMS:
» File transfer o The CSP must have a file transfer protocol (FTP) server where a CIMS batch process can
either send to or receive files from. o The CSP must be able to support the following secure file transfer process:
Secure file transfer protocol (SFTP); or FTP with a Procedures Generation Package (PGP) encrypted file process.
o The files must be standard text files. » Extensible Mark-up Language (XML) communication.
PECO’s internal customer systems include: CIMS, CEDAR, and Customer Data Warehouse (CDW). It is anticipated that the EM&V Tracking System will need to track a number of items that facilitate effective project tracking and regulatory reporting. This data will also support PECO’s Quality Assurance process as well as Evaluation, Measurement and Verification requirements. PECO envisions data being collected at several levels including, but not limited to, the following:
» Customer » Class » Building or Premise » Program » Measure » Service Point » Interval Meter/Historical Usage » Meter Reading Types » CSP Invoices
It is expected that this hierarchy would interface with PECO’s existing CIMS, and must facilitate future data analyses. PECO will provide an initial population of customer, premise and account data that will be used to qualify customers for programs. Some of the fields in the initial data set are expected to include, but not be limited to, the following:
» Bill Account Number » Customer Number » Premise Number » Customer First Name

PECO PY 2016-2020 Act 129 - Phase III Energy Efficiency And Conservation Plan Page 109
» Customer Last Name » Customer Name Compressed (for Commercial Accounts) » Premise Address 1 » Premise Address 2 » Premise City » Premise State » Premise Zip Code » Customer Primary Phone Number » Customer Alternate Phone Number » County of Premise Address » Code for Type of Premise (Residential or Commercial Premise) » Code for Rate Information
Additional data would then be entered by the CSP or PECO to complete the application process. In addition to the pertinent data listed above, it is anticipated that the EM&V Tracking System would also track application status, such that PECO will be able to identify progress at each point from initiation to completion. PECO will provide a full set of customer data information in regular bases to update CSP records.
5.2.3 Access for Commission and Statewide Plan Evaluator
PECO’s energy efficiency and demand response program information will be available for review by the Commission and Statewide Evaluator upon request. PECO will provide select customer account data to the EM&V tracking system vendor as part of the customer validation process for application enrollment. This data must be considered highly confidential and must be protected against unauthorized access or disclosure. In addition, all of the data collected from CSPs related to PECO’s programs will be considered confidential and subject to the same protections. Security processes and protocols will be established to secure all data from unauthorized access. PECO and the EM&V tracking system vendor will jointly develop processes for data backup and disaster recovery. An anticipated key to the real-time data aspects of the EM&V tracking system will be a web-based interface for the CSP and/or third party vendors. PECO plans to provide linking between the tracking interface and its existing PECO websites. As such, the web CSP interface is expected to have a look and feel that is similar to PECO’s other websites. PECO will provide the specifications for this requirement to the selected EM&V tracking system vendor. PECO envisions integrating the user interface components of the EM&V tracking system website more fully into PECO’s website. While on-line data entry is the preferred method for this system, PECO acknowledges that there are situations where access to the web may be limited or non-existent. It is expected that the tracking system would be designed with consideration for limited use of off-line data entry. This may be accommodated via a software solution or by using off-line electronic forms (e.g., Adobe Acrobat forms). It is expected that the EM&V tracking system will offer an off-line solution for CSPs and users. Such a solution will include a process for ensuring timely updates of the on-line database from off-line tools. It is expected that CSPs and vendors will be capable of using this system to input projects and determine incentives on behalf of their customers. The interface would facilitate easy retrieval of project information by vendors. It would also facilitate vendor tracking of projects by status, giving the vendors a tool to manage multiple customer projects. It is possible that a single project may contain multiple measures, with more than one vendor fulfilling different measures. PECO and the EM&V tracking

PECO PY 2016-2020 Act 129 - Phase III Energy Efficiency And Conservation Plan Page 110
system vendor will address such situations so that a CSPs cannot arbitrarily access other CSP’s measures or projects.

PECO PY 2016-2020 Act 129 - Phase III Energy Efficiency And Conservation Plan Page 111
6. Quality Assurance and Evaluation, Measurement and Verification
6.1 Quality Assurance/Quality Control PECO will incorporate quality assurance/quality control (QA/QC) into the implementation of this Plan. The Plan proposes an infrastructure for monitoring program activity that identifies key components and explicitly identifies the relationships among them. The importance of this is to establish the role that each contributor will have and to facilitate communication between the implementation CSPs, the database vendor, program evaluators, and the Statewide Evaluator.
6.1.1 Overall Approach to Quality Assurance/Quality Control
PECO will leverage the experience of program implementation professionals by selecting CSPs to implement the programs and solutions in this Plan who have the following qualifications:
» Demonstrated experience in implementing programs for the specific target market associated with the program
» Demonstrated understanding of the measures and features of the program and solutions the CSP will implement
» Existing relationships and experience in establishing relationships with upstream equipment suppliers and contractors, as appropriate for the program
» Experience in providing and/or coordinating training by other qualified providers about the program, solutions and measures to delivery channels (e.g., equipment suppliers, contractors, auditors) and the target participant market
» Capabilities for processing incentives. PECO and the CSPs will develop specific protocols and procedures for the implementation of each program and solution. These will govern various aspects of the implementation, including:
» CSP representation of PECO » appropriate outreach methods » development and content of promotional messages » assessment of participant/project eligibility » procedures for site visits and audits » required documentation and reporting of activities » data collection, maintenance, and entry in PECO’s EM&V tracking system , for projects and
rebate applications » handling of incentive applications » addressing customer and equipment supplier/contractor satisfaction, problems, and complaints
Verification of project eligibility and proper installation, and operation of measures is important. Documentation of purchases and verification of completed projects will ensure that programs are implemented in top quality fashion and will provide the basis for defensible evaluations. Specific procedures for verification, documentation, and feedback from participants and upstream suppliers are described below. PECO will contract with an EM&V contractor before the programs are launched. PECO’s EM&V contractor shall conduct unbiased independent estimations of verified gross energy impacts on all programs. Estimations of verified gross energy impacts will be based on statistically significant verified savings measured as described in the EM&V contractor’s EM&V Plan to be developed prior to Phase III program implementation. The EM&V Plan will contain a detailed evaluation methodology for each
PECO PY 2016-2020 Act 129 - Phase III Energy Efficiency And Conservation Plan Page 112
program, including definition of the impact and process evaluation methods they will employ and the data needed to support them. Then, prior to the launch of each program, the implementation CSP will know what data PECO will need to be tracked and the Database Vendor will be able to accommodate housing of those data. Having the evaluation Plan completed and available to the PECO and CSP staff for each program will help ensure that the implementers will maintain appropriate and high quality records so that savings can be verified.
6.1.2 Procedures for Measure and Project Installation Verification, QA/QC and Savings Documentation
Although the procedures for measure and project installation verification, quality assurance and control, and savings documentation will vary by program, solutions and measures, it is anticipated that the general process outlined below will be applied to impact evaluations:
» A random sampling of customers for on-site evaluations will be determined utilizing statistical methods consistent with established state protocols.
» Pre-evaluation data gathering and preparation of field data forms will be performed. » On-site measure and project installation verifications will be performed, and equipment
nameplate data and other pertinent data will be collected. » Equipment data will be cross-referenced with customer application data contained in the
tracking system for accuracy. » Equipment operational tests will be observed and noted. » Quality of the equipment installation will be noted. » For prescriptive measures, data will be analyzed, and measure savings will be calculated using
the methodologies and algorithms detailed in the TRM. » For custom measures, energy simulation modeling (such as eQuest or DOE-2) or pre/post-
measure metering will be required to determine measure savings.
6.1.3 Process for Collecting and Addressing Participant, Contractor and Trade Ally Feedback
It is anticipated that the general process outlined below will be applied to process evaluations: » At a minimum, a sampling of participants, non-participants, contractors and trade ally staff will
be interviewed to support the process evaluation. » A random sampling of customers for surveys will be determined utilizing common statistical
methods. » Telephone, in-person or on-line surveys of participants will be conducted to understand their
satisfaction with the program, why they chose to participate, how the program could be improved and their views on the incentive levels.
» Similarly, non-participants will be surveyed to understand why they chose not to participate, their views on incentive levels (and at what level of incentive would be necessary to move them to participate), and recommendations on how to improve the program. This information is valuable in understanding market barriers that inhibit greater acceptance of the measures.
» Contractors and trade allies will be interviewed to gauge their understanding of how the program works and to get front-line assessment of the market. Suggestions on program improvement, staff motivation, contractor incentives and customer attitudes will provide valuable feedback in the evaluation.
» The data will be analyzed and process improvement recommendations will be outlined.

PECO PY 2016-2020 Act 129 - Phase III Energy Efficiency And Conservation Plan Page 113
6.2 Market and Process Evaluations Market and process evaluations will be conducted for each program throughout the life of the program. These will examine satisfaction with and the effectiveness of the:
» Program design and protocols for implementation » Market characteristics » Implementation of those protocols and procedures » Marketing materials and strategies » Outreach and recruitment activities » Documentation and compliance with incentive eligibility requirements » Processing and timely payment of incentives
The process evaluations conducted during the operation of the programs will be used to improve program design (e.g., modify measures offered, eligibility requirements) and implementation procedures (e.g., modify recruitment, advertising methods, monitoring, database maintenance) within this planning cycle. Final process evaluations will be used to revise the programs, as appropriate, for the next planning period. They will assess the effectiveness of using CSPs to implement programs, identify additional opportunities for CSPs to support program development and/or activities (e.g. provide technical expertise, contractors/auditor/staff training, marketing strategies and materials, specific promotional events). The frequency and schedule of the process evaluations will be determined for each program individually. Process evaluations will be conducted by the implementation CSP to help maintain best practices, and annually by the independent EM&V contractor that PECO hires and the Statewide Evaluator. Additionally, the EM&V contractor will annually conduct impact evaluations to document and verify net energy and demand savings associated with the programs. The EM&V contractor will interact with the Statewide Evaluator to make sure that the reporting protocols are in alignment with the state requirements.
6.3 Strategy for Coordinating with Statewide Evaluator PECO’s Manager of Evaluation, Measurement and Verification, along with its EM&V contractor will engage with the Statewide Evaluator through regularly scheduled working group meetings as well as through ad hoc meetings and communications as necessary. During the course of Phases I and II, PECO has worked productively with the statewide evaluator to ensure that its program evaluations align with PUC requirements, to clarify policy questions, and to contribute data and recommendations to assist the Statewide Evaluator and the PUC to establish policy. PECO anticipates extending this productive relationship in Phase III.
The program database will contain data on the prescriptive and custom measures as well as projects performed within each program in the Plan. To the extent feasible and appropriate, the Statewide Evaluator will be consulted to ensure that the database will contain information relevant and needed for evaluation of the programs.
The individual program descriptions contained in Section 3 of this report address the considerations associated with these evaluations. The EM&V vendor and the Statewide Evaluator will use the most appropriate methods for determining the impacts of the different programs in the Plan.
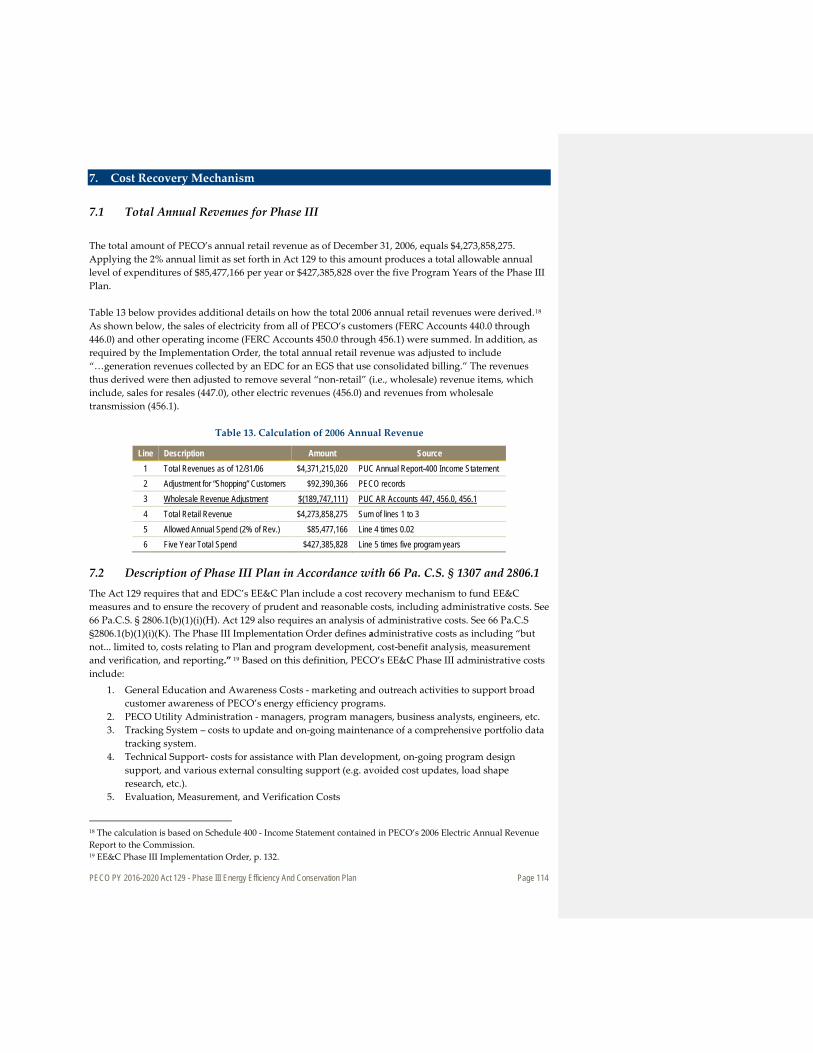
PECO PY 2016-2020 Act 129 - Phase III Energy Efficiency And Conservation Plan Page 114
7. Cost Recovery Mechanism
7.1 Total Annual Revenues for Phase III The total amount of PECO’s annual retail revenue as of December 31, 2006, equals $4,273,858,275. Applying the 2% annual limit as set forth in Act 129 to this amount produces a total allowable annual level of expenditures of $85,477,166 per year or $427,385,828 over the five Program Years of the Phase III Plan. Table 13 below provides additional details on how the total 2006 annual retail revenues were derived.18 As shown below, the sales of electricity from all of PECO’s customers (FERC Accounts 440.0 through 446.0) and other operating income (FERC Accounts 450.0 through 456.1) were summed. In addition, as required by the Implementation Order, the total annual retail revenue was adjusted to include “…generation revenues collected by an EDC for an EGS that use consolidated billing.” The revenues thus derived were then adjusted to remove several “non-retail” (i.e., wholesale) revenue items, which include, sales for resales (447.0), other electric revenues (456.0) and revenues from wholesale transmission (456.1).
Table 13. Calculation of 2006 Annual Revenue
Line Description Amount Source 1 Total Revenues as of 12/31/06 $4,371,215,020 PUC Annual Report-400 Income Statement 2 Adjustment for “Shopping” Customers $92,390,366 PECO records 3 Wholesale Revenue Adjustment $(189,747,111) PUC AR Accounts 447, 456.0, 456.1 4 Total Retail Revenue $4,273,858,275 Sum of lines 1 to 3 5 Allowed Annual Spend (2% of Rev.) $85,477,166 Line 4 times 0.02 6 Five Year Total Spend $427,385,828 Line 5 times five program years
7.2 Description of Phase III Plan in Accordance with 66 Pa. C.S. § 1307 and 2806.1 The Act 129 requires that and EDC’s EE&C Plan include a cost recovery mechanism to fund EE&C measures and to ensure the recovery of prudent and reasonable costs, including administrative costs. See 66 Pa.C.S. § 2806.1(b)(1)(i)(H). Act 129 also requires an analysis of administrative costs. See 66 Pa.C.S §2806.1(b)(1)(i)(K). The Phase III Implementation Order defines administrative costs as including “but not... limited to, costs relating to Plan and program development, cost-benefit analysis, measurement and verification, and reporting.” 19 Based on this definition, PECO’s EE&C Phase III administrative costs include:
1. General Education and Awareness Costs - marketing and outreach activities to support broad customer awareness of PECO’s energy efficiency programs.
2. PECO Utility Administration - managers, program managers, business analysts, engineers, etc. 3. Tracking System – costs to update and on-going maintenance of a comprehensive portfolio data
tracking system. 4. Technical Support- costs for assistance with Plan development, on-going program design
support, and various external consulting support (e.g. avoided cost updates, load shape research, etc.).
5. Evaluation, Measurement, and Verification Costs
18 The calculation is based on Schedule 400 - Income Statement contained in PECO’s 2006 Electric Annual Revenue Report to the Commission. 19 EE&C Phase III Implementation Order, p. 132.
PECO PY 2016-2020 Act 129 - Phase III Energy Efficiency And Conservation Plan Page 115
6. Research and Development Costs PECO’s administrative costs were previously described in Section 4.2.3.
7.3 Data Tables
Appendix C contains the following data tables as required by the Commission’s EE&C Plan template: » Table C-1: Portfolio Specific Assignment of EE&C Costs » Table C-2: Allocation of Common Costs to Applicable Customer Sectors » Table C-3: Summary of Portfolio EE&C Costs ($M) » Table C-4: Summary of Programs Cost by Year » Table C-5: Gross TRC Benefits Table » Table C-6: Net TRC Benefits Table » Table C-7: Residential Low Income TRC Benefit Table » Table C-8: Residential (Exclusive of Low-Income) TRC Benefits Table » Table C-9: Small C&I TRC Benefits Table » Table C-10: Large C&I TRC Benefits Table
7.4 Tariffs and Section 1307 Cost Recovery Mechanism for Phase III Plan
7.4.1 Tariffs
As part of the implementation of PECO’s Phase III EE&C Plan, PECO proposes to use a cost recovery mechanism similar to the one it used to recover the cost of its Phase II Plan. However, the Phase II Energy Efficiency Cost Recovery mechanism must be revised in accordance with the PUC’s Final Phase III Implementation Order. See PECO Statement No. 3, Exhibit RAS-1, for a copy of the proposed supplement to PECO’s Electric Service Tariff that contains the revised tariff provisions designed to implement the cost recovery mechanism for PECO’s proposed EE&C Phase III Plan. A high-level summary description of the Phase III cost recovery mechanism was provided in Section 1.8. Additional details on the Phase III cost recovery mechanism, calculations of the charge and supporting cost documentation are provided in this section.
7.4.2 Cost Recovery Mechanism
PECO proposes to recover the cost of its EE&C Phase III Plan through an Energy Efficiency & Conservation Program Charge (“EEPC”) similar to the one used in Phase II. The Phase II EEPC was designed to comply with Section 1307 of the Public Utility Code and, as the Commission required, was reconcilable and non-bypassable. As required by the Commission in PECO’s EE&C Phase I and Phase II Final Implementation Orders, Docket Nos. M-2009-2093215 and M-2012-2289411, the EEPC was not a separate line item on residential customers’ bills and was not included in the price to compare. Instead, residential customers’ distribution rates were adjusted by the amount of the charge calculated for each rate class. For small commercial customers, the EEPC was based on energy use or kWh. For large commercial customers, the charge was based on a PJM Peak Load Contribution (“PLC”). The EEPC was listed as a separate item on small and large commercial customers’ bills and was not included in the price to compare. For EE&C Phase III Plan, PECO proposes to follow the same format as used in Phases I and II. The revised cost recovery mechanism proposed for Phase III is shown at page 40E of the proposed supplement to PECO’s Electric Service Tariff submitted as PECO Exhibit RAS-1. The tariff language

PECO PY 2016-2020 Act 129 - Phase III Energy Efficiency And Conservation Plan Page 116
describes the cost recovery method, the formula for calculating the charge and the charges specific to each rate class. The Phase III EEPC will recover all of the fixed capital costs (depreciation and pre-tax return) and operating expenses, not otherwise recovered in base rates, to design and implement the EE&C programs incorporated in its Phase III EE&C Plan. These costs include, among others, the cost of information technology (“IT”) needed to design and implement the EE&C programs; the costs of customer outreach and program promotion; incremental labor costs incurred to manage and administer the EE&C programs on an ongoing basis; the cost to measure and verify EE&C program results; and the cost of incentives offered to customers to participate in the approved EE&C programs. PECO Exhibit RAS-2 contains a summary of the projected expenditures for each of the Programs across these rate classes. In the Final Phase III Implementation Order, the Commission requires EDCs to establish a transition plan for the transition from the cost recovery methodology used during Phase II to the cost recovery mechanism to be used for Phase III. In accordance with the Commission’s directive, PECO is required to establish a cost recovery methodology for Phase III that is designed to recover, on an annual basis, projected program costs that it anticipates will be incurred over each surcharge application year. In addition, PECO is required to reconcile actual expenses incurred with actual revenues received for the reconciliation period. For PY 2016, the cost recovery rates are being calculated based on the projected total program expenditures allocated to each rate class for that program year plus the reconciliation amount for PY 2015 and any costs remaining from previous periods.20 To develop the recovery charge for each rate class for PY 2016, the total expenditure for that class was divided by the appropriate projected class billing units for the period from June 1, 2016 through May 31, 2017. Subsequently, PECO will develop Phase III recovery rates annually based on the projected program expenditures for that program year plus reconciliation amounts for previous periods. The charge that was calculated per billing unit for each rate class was grossed up to provide for recovery of Pennsylvania Gross Receipts Tax. This calculation produces a charge that, net of Pennsylvania Gross Receipts Tax, will recover the projected total expenditures over the recovery period. The Phase III Implementation Order also requires PECO to remove the Statewide Evaluator (“SWE”) costs from the EE&C Phase III budget in the same manner as was done in Phase II. 21 PECO will, therefore, track the Phase III SWE costs separately from its EE&C costs but will still recover such costs through its Phase III EEPC. The Phase III SWE costs will be determined through an RFP bidding process. Until the final SWE costs are known, PECO has included an estimate. PECO Exhibit RAS-3 contains the detailed calculations for the development of the EEPC charges for each class as well as the SWE costs, which are reflected as a separate line item.
7.4.3 True-Up
As noted above, PECO’s Phase III EEPC will be reconciled on an annual basis to account for any under- or over-recovery from the prior year. As the Phase III Order specifies22, PECO will reconcile its total actual recoverable EE&C Plan expenditures incurred through March 31, 2016, with its actual EE&C Plan revenues received through March 31, 2016. The net over- or under-recovery shall be reflected (without
20 EE&C Phase III Implementation Order, p.146-149. 21 EE&C Phase II Implementation Order, pp. 69-70; EE&C Phase III Implementation Order, p. 95. 22 EE&C Phase III Implementation Order, pp. 146-150.

PECO PY 2016-2020 Act 129 - Phase III Energy Efficiency And Conservation Plan Page 117
interest) as a separate line item of the E factor calculation of the Phase III rates to become effective June 1, 2016. These rates will also include, as a separate line item, PECO’s projection of its expenses related to Phase II program implementation incurred in April and May 2016, including, projected expenses to finalize any measures installed and commercially operable on or before May 31, 2016; projected expenses to finalize any contracts; and other Phase II administrative obligations. The difference between PECO’s projected and actual expenses and EEPC revenue for the months of April and May 2016 will be presented as clearly identified, separate line items in the reconciliation statement for the period April 1, 2016 through March 31, 2017.
7.5 Cost Allocation and Recovery Period PECO’s cost recovery mechanism for its EE&C Plan is designed to ensure that measures are paid for by the same customer class(es) that receive the associated measures’ EE&C benefits. This is accomplished by creating separate EE&C charges for the residential class, the Small C&I class, the Large C&I class, and the Municipal Lighting class that are based on only the cost of the measures that apply to each class. See PECO Exhibits RAS-2 and RAS-3, which list the program costs by rate class and for the spreadsheet that shows how the EEPC was developed for each customer class according to the method just described. PECO proposes to start the recovery period for Phase III with bills sent to customers during July 2016 (June usage) and will continue through bills sent to customers in June 2021 (May usage).
7.6 Accounting for Phase III Costs versus Prior Phase Costs In accordance with the Phase III Filing Template provided with the Commission’s Secretarial Letter dated July 21, 2015 at Docket No. M-2014-2424864, PECO must provide a description of how it will account for Phase III costs separately from costs incurred in prior phases.23 In order to satisfy this requirement, PECO will do the following:
» Account for the Phase III costs and revenues on its books separately from prior phases, by setting up new general ledger accounts for Phase III costs and revenues so that there will be no comingling of prior phase costs and Phase III costs or funds in PECO’s accounting records; and
» Clearly and separately identify and track prior phase costs and revenues in the EEPC cost recovery and reconciliation mechanism so that Phase III costs will be reconciled against the Phase III funds collected. See the description of the cost recovery mechanism in the proposed supplement to PECO’s Electric Service Tariff provided as PECO Exhibit RAS-1.
23 EE&C Phase III Filing Template Secretarial Letter, issued September 22, 2015.
PECO PY 2016-2020 Act 129 - Phase III Energy Efficiency And Conservation Plan Page 118
8. Cost-Effectiveness
PECO’s portfolio of programs was evaluated for cost-effectiveness. Overall, the portfolio is cost-effective over the five year Phase III period. This section provides a detailed description of the cost-effectiveness criteria and analyses undertaken.
8.1 Description of Application of the TRC Analysis This sub-section describes how the PECO programs were evaluated for cost-effectiveness as well as the derivation of avoided energy and capacity costs, which represent the benefits to investing in energy efficiency and demand response programs and the Plan as a whole.
8.1.1 Cost-Effectiveness Analysis Approach
The cost-effectiveness results reported in this Plan adhere to the PUC specifications as defined in the 2016 Total Resource Cost Order issued on June 11, 2015. The most notable elements of the TRC Order which are applied include: a) Measure life is constrained to a maximum of 15 years; b) Net energy and demand savings are used as the basis for benefit-cost purposes; c) Quantifiable savings in fossil fuels and water consumption are included as benefits in the TRC calculation for the first time,24 in addition to energy and demand savings. PECO calculated the TRC result for each program and for the portfolio as a whole. The TRC test at the measure level compares the lifetime benefits of each applicable measure (avoided cost times savings) with each measure’s lifetime costs (incremental capital and installation costs and O&M costs). The lifetime benefits are obtained by multiplying the annual savings for each measure by the avoided cost for each year, and discounting the dollar savings to present value equivalent basis. The measure savings, costs and lifetimes are obtained as part of the measure characterization. The TRC test at the program level factors in the measure level cost/benefit components, plus the CSP and PECO common and delivery costs. The TRC test at the portfolio level includes the costs/benefits at the measure and program level, plus the added portfolio wide common costs. The total present value of benefits is then divided by the total present value of costs. Where the ratio is greater than or equal to 1, the measure, program, or portfolio is deemed cost-effective.
8.1.2 Avoided Costs
The sections below report on the avoided capacity and energy costs that were used as the basis for conducting the cost-effectiveness analysis. PECO developed the data inputs to support the avoided cost analysis based on direction from the PUC in the TRC Order. The methodology used to calculate energy and capacity price inputs to determine avoided costs is described below.
8.1.2.1 Energy Prices
Monthly energy prices for each of the program years during 2015-2036 were calculated using futures prices quoted by the New York Mercantile Exchange (“NYMEX”) as of June 30, 2015.25 These monthly prices were combined into four time periods corresponding to Winter On-Peak, Winter Off-Peak, Summer On-Peak and Summer Off-Peak, based on the data provided in draft versions of the
242016 Total Resource Cost (TRC) Test , Docket No. M-2015-2468992 (Order entered ,June 22, 2015) pp. 14-16 25 The data source for all prices quoted by NYMEX is the Ventyx Velocity Suite.
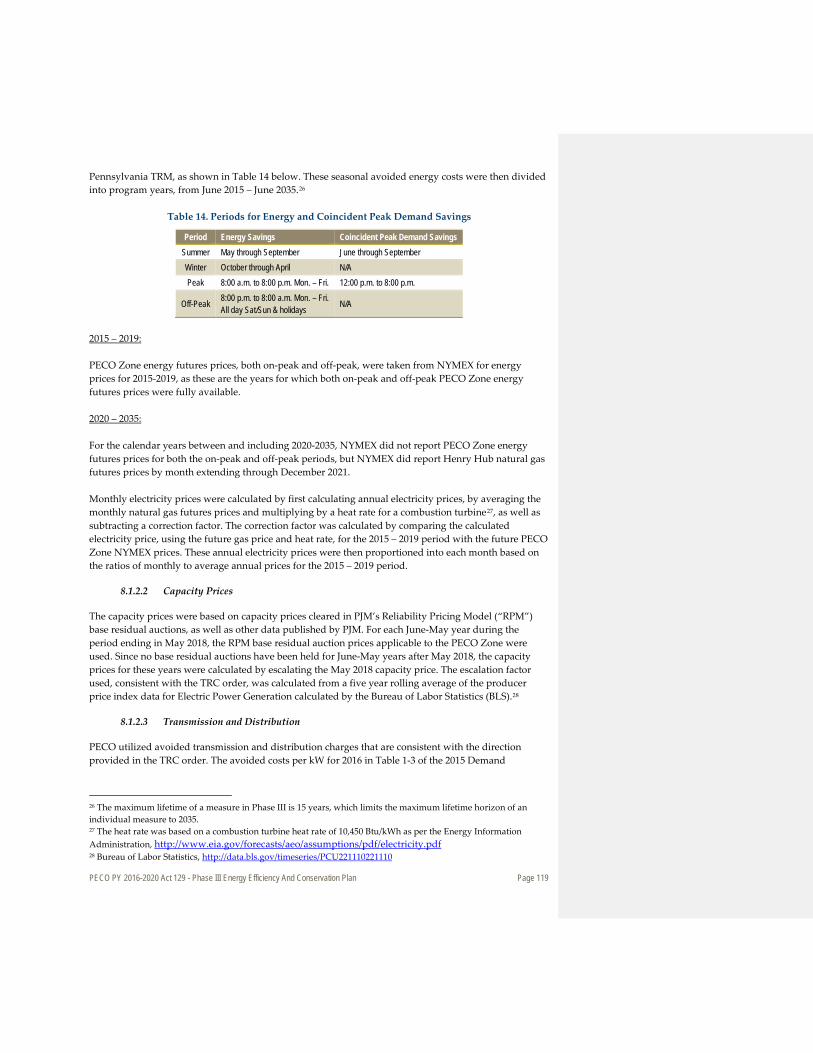
PECO PY 2016-2020 Act 129 - Phase III Energy Efficiency And Conservation Plan Page 119
Pennsylvania TRM, as shown in Table 14 below. These seasonal avoided energy costs were then divided into program years, from June 2015 – June 2035.26
Table 14. Periods for Energy and Coincident Peak Demand Savings
Period Energy Savings Coincident Peak Demand Savings Summer May through September June through September Winter October through April N/A Peak 8:00 a.m. to 8:00 p.m. Mon. – Fri. 12:00 p.m. to 8:00 p.m.
Off-Peak 8:00 p.m. to 8:00 a.m. Mon. – Fri. All day Sat/Sun & holidays N/A
2015 – 2019: PECO Zone energy futures prices, both on-peak and off-peak, were taken from NYMEX for energy prices for 2015-2019, as these are the years for which both on-peak and off-peak PECO Zone energy futures prices were fully available. 2020 – 2035: For the calendar years between and including 2020-2035, NYMEX did not report PECO Zone energy futures prices for both the on-peak and off-peak periods, but NYMEX did report Henry Hub natural gas futures prices by month extending through December 2021. Monthly electricity prices were calculated by first calculating annual electricity prices, by averaging the monthly natural gas futures prices and multiplying by a heat rate for a combustion turbine27, as well as subtracting a correction factor. The correction factor was calculated by comparing the calculated electricity price, using the future gas price and heat rate, for the 2015 – 2019 period with the future PECO Zone NYMEX prices. These annual electricity prices were then proportioned into each month based on the ratios of monthly to average annual prices for the 2015 – 2019 period.
8.1.2.2 Capacity Prices
The capacity prices were based on capacity prices cleared in PJM’s Reliability Pricing Model (“RPM”) base residual auctions, as well as other data published by PJM. For each June-May year during the period ending in May 2018, the RPM base residual auction prices applicable to the PECO Zone were used. Since no base residual auctions have been held for June-May years after May 2018, the capacity prices for these years were calculated by escalating the May 2018 capacity price. The escalation factor used, consistent with the TRC order, was calculated from a five year rolling average of the producer price index data for Electric Power Generation calculated by the Bureau of Labor Statistics (BLS).28
8.1.2.3 Transmission and Distribution
PECO utilized avoided transmission and distribution charges that are consistent with the direction provided in the TRC order. The avoided costs per kW for 2016 in Table 1-3 of the 2015 Demand
26 The maximum lifetime of a measure in Phase III is 15 years, which limits the maximum lifetime horizon of an individual measure to 2035. 27 The heat rate was based on a combustion turbine heat rate of 10,450 Btu/kWh as per the Energy Information Administration, http://www.eia.gov/forecasts/aeo/assumptions/pdf/electricity.pdf 28 Bureau of Labor Statistics, http://data.bls.gov/timeseries/PCU221110221110
PECO PY 2016-2020 Act 129 - Phase III Energy Efficiency And Conservation Plan Page 120
Response Potential Study were escalated using the BLS annual escalation rate for June 2010 through June 2015 (-0.15%).
8.2 Data Tables Appendix C contains data tables as required by the Commission’s EE&C Plan template.
PECO PY 2016-2020 Act 129 - Phase III Energy Efficiency And Conservation Plan Page 121
9. Plan Compliance Information and Other Key Issues
9.1 Plan Compliance
9.1.1 Description of Plan
As discussed in Section 3 of this document, PECO’s EE&C Plan provides energy efficiency and demand response programs to each of its customer classes, including a specific program for low-income households.29 The Plan also forecasts participation in each of the program and Solutions from G/E/NP entities. The Plan portfolio contains financial incentives for energy efficient Residential and Commercial and Industrial equipment and construction, and financial incentives to promote retrofitting government buildings, schools, hospitals and non-profits with energy efficiency measures. PECO believes that its programs are equitably provided across its customer classes consistent with the Commission’s Implementation Order.
9.1.2 Statement Delineating the EE&C Plan
PECO’s Plan, as set forth in Section 3, is projected to meet or exceed its 5.0% consumption reduction target by May 31, 2021, to be achieved through the energy efficiency programs. This represents a total savings of at least 1,962,659 MWh by the end of Phase III. The demand response programs are projected to achieve or exceed the annual demand savings target of 161 MW through the demand response programs. The demand savings will be calculated as an average over the final four implementation years, per the PUC Implementation Order. The Plan is projected to achieve these energy and demand savings requirements of the Act through the use of a broad array of financial incentives. These incentives will be provided to PECO’s customers through CSPs, installation companies, and trade allies (e.g., HVAC contractors and retail stores).
9.1.3 Low-Income requirements
PECO’s Plan will meet the requirements of this section by using and building upon its existing Low-Income Usage Reduction Program (“LIURP”). Specifically, as part of the Plan, PECO will increase the number of low-income customers receiving weatherization services (e.g., in-home energy audits and education) in its service territory, and will provide services to install CFLs for low-income customers, and install ENERGY STAR appliances for these customers, as applicable. PECO’s Plan is designed to exceed the minimum requirement that 5.5% of its consumption reduction requirements come from the Low-Income EE Program. 30
9.1.4 Government/Education/Non-Profit requirements
The Commission’s Phase III Implementation Order directs EDCs to obtain a minimum of 3.5% of their consumption reduction requirements from customers in the G/E/NP sectors. As specified in the tables in Section 2 of this Plan, PECO is targeting savings in the G/E/NP sector well in excess of this minimum level.
9.1.5 Spending on experimental equipment or devices limited to two percent
As noted in section 4.1.2., PECO developed its Plan by benchmarking proven programs and technologies from states such as California, Vermont and New York as well as its own experience in Phases I and II.
29 Consistent with Act 129, PECO’s reference to low-income households means households at or below 150% of the Federal poverty income guidelines. See 66 Pa.C.S. 2806.1(b)(1)(i)(B). 30 See PECO’s Discussion in Sections 3 and 4 of this document for a detailed description of its EE&C programs and its implementation strategy.
PECO PY 2016-2020 Act 129 - Phase III Energy Efficiency And Conservation Plan Page 122
However, technology is constantly changing and given the five year length of the phase, it is impossible to predict with 100% accuracy all the viable equipment and devices that may come to market during the phase. Further, new implementation offerings are being developed in the industry every year, some of which may be viable for PECO’s customers. Therefore the Plan reserves some funds under “Research and Development” (R&D) to enable inclusion of viable technologies or Solution offerings that may come to market during the phase. Spending on experimental equipment or devices will be limited to no more than two percent of the budget per the PUC Implementation Order. The remaining R&D funds may be used for adding Solutions or non-experimental measures to the Plan as appropriate.
9.1.6 Competitively neutral to all electric distribution customers
PECO's suite of energy efficiency and demand response programs will be available to all PECO electric distribution customers, regardless of whether they receive generation supply from PECO as a default service provider or from an EGS.
9.2 Other Key Issues
9.2.1 Describe how this EE&C Plan will lead to long-term, sustainable energy efficiency savings in the EDC’s service territory and in Pennsylvania
PECO’s EE&C Plan was developed to meet or exceed the requirements of Act 129 and the PUC Implementation Order. In developing the Phase III EE&C Plan, PECO combined its own experience implementing programs in Phases I and II with lessons learned from utility demand side management programs in other jurisdictions throughout the country, and selected measures and programs for inclusion in the Plan that have demonstrated a history of providing reliable, documented and sustainable energy and demand savings. The proposed Plan includes a variety of proven programs effective across all customer classes. PECO believes that providing programs along with comprehensive education will lead to long term sustainability through ongoing customer participation.
9.2.2 Describe how this EE&C Plan will leverage and utilize other financial resources, including funds from other public and private sector energy efficiency and solar energy programs
PECO’s website provides information and web links on a variety of third-party resources, such as Keystone HELP, Energy Works, the Database of State Incentives for Renewables & Efficiency, FHA and VA Energy Efficient Mortgage programs, and state and federal tax incentives for efficiency improvements and renewable energy projects.
9.2.3 Describe how the EDC will address customer education for its programs
PECO plans to prioritize comprehensive customer education in all elements of the EE&C Plan. PECO will engage consumers through direct interactions as part of our continuous participation in community events throughout the PECO service territory. PECO’s energy efficiency outreach team’s presence in the community builds general awareness of the programs as well as educates customers about how these programs can help them save on their energy bills. As part of the promotion of the various programs, PECO plans to include extensive education in all of its materials.
9.2.4 Indicate how the EDC will provide a list of all eligible federal and state funding programs available to ratepayers for energy efficiency and conservation
PECO currently, and will continue to provide in Phase III, includes information regarding all known federal and state funding programs that are available to ratepayers via the PECO company website.
PECO PY 2016-2020 Act 129 - Phase III Energy Efficiency And Conservation Plan Page 123
9.2.5 Describe how the EDC will provide the public with information about the results from the programs
After the Statewide Evaluator has completed its accepted annual reports, PECO will periodically issue press releases to inform the public of the progress of its EE&C Plan, and refer the public to where reports about PECO’s Act 129 results are posted on the PUC’s website.

PECO PY 2016-2020 Act 129 - Phase III Energy Efficiency And Conservation Plan Page 124
Appendix A. PECO Electricity Consumption Forecast
PECO’s electricity consumption forecast for the period of June 1, 2009 through May 31st, 2010 is 38,809,100 MWh.
PECO PY 2016-2020 Act 129 - Phase III Energy Efficiency And Conservation Plan Page 125
Appendix B. CSP Contract(s)
PECO has not bid out any of the CSP contracts yet. The bidding outline is demonstrated in Table 12 of the Plan. Each winning CSP resulting in a signed contract will be filed with the PUC as required.
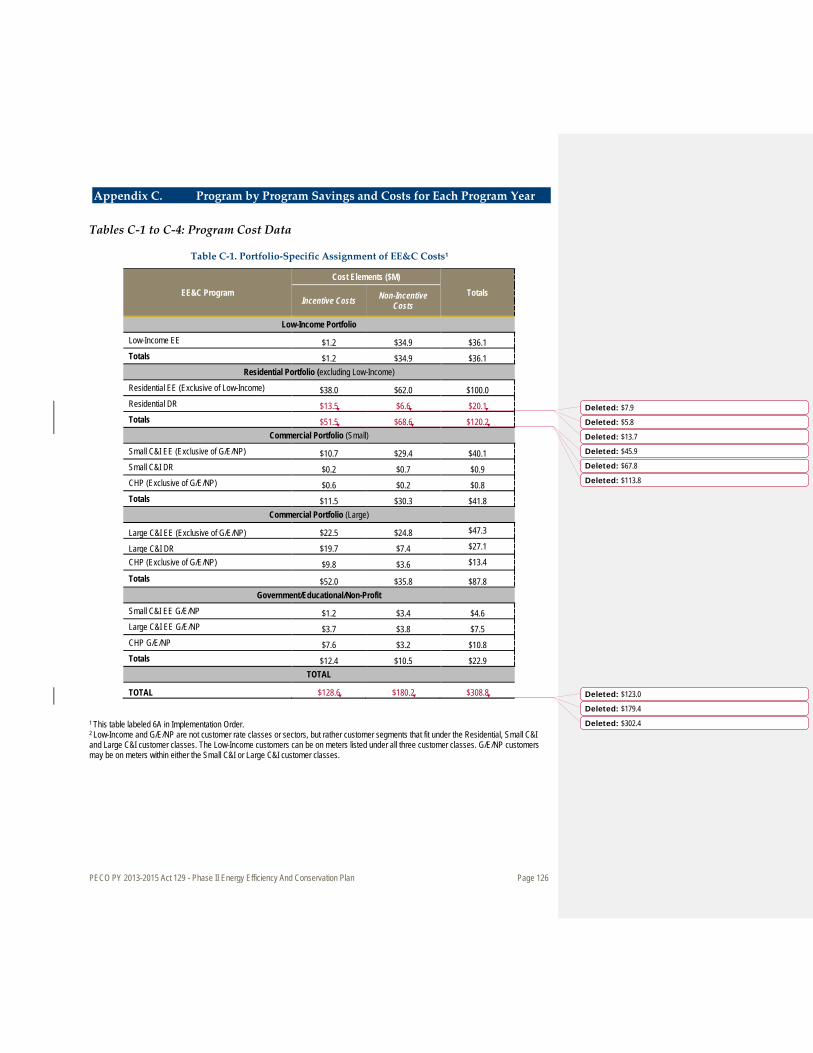
PECO PY 2013-2015 Act 129 - Phase II Energy Efficiency And Conservation Plan Page 126
Appendix C. Program by Program Savings and Costs for Each Program Year
Tables C-1 to C-4: Program Cost Data
Table C-1. Portfolio-Specific Assignment of EE&C Costs1
EE&C Program
Cost Elements ($M)
Totals Incentive Costs Non-Incentive
Costs
Low-Income Portfolio
Low-Income EE $1.2 $34.9 $36.1 Totals $1.2 $34.9 $36.1
Residential Portfolio (excluding Low-Income)
Residential EE (Exclusive of Low-Income) $38.0 $62.0 $100.0 Residential DR $13.5 $6.6 $20.1 Totals $51.5 $68.6 $120.2
Commercial Portfolio (Small)
Small C&I EE (Exclusive of G/E/NP) $10.7 $29.4 $40.1 Small C&I DR $0.2 $0.7 $0.9 CHP (Exclusive of G/E/NP) $0.6 $0.2 $0.8 Totals $11.5 $30.3 $41.8
Commercial Portfolio (Large)
Large C&I EE (Exclusive of G/E/NP) $22.5 $24.8 $47.3
Large C&I DR $19.7 $7.4 $27.1
CHP (Exclusive of G/E/NP) $9.8 $3.6 $13.4
Totals $52.0 $35.8 $87.8 Government/Educational/Non-Profit
Small C&I EE G/E/NP $1.2 $3.4 $4.6 Large C&I EE G/E/NP $3.7 $3.8 $7.5 CHP G/E/NP $7.6 $3.2 $10.8 Totals $12.4 $10.5 $22.9
TOTAL
TOTAL $128.6 $180.2 $308.8 1 This table labeled 6A in Implementation Order. 2 Low-Income and G/E/NP are not customer rate classes or sectors, but rather customer segments that fit under the Residential, Small C&I and Large C&I customer classes. The Low-Income customers can be on meters listed under all three customer classes. G/E/NP customers may be on meters within either the Small C&I or Large C&I customer classes.
Deleted: $7.9
Deleted: $5.8
Deleted: $13.7
Deleted: $45.9
Deleted: $67.8
Deleted: $113.8
Deleted: $123.0
Deleted: $179.4
Deleted: $302.4
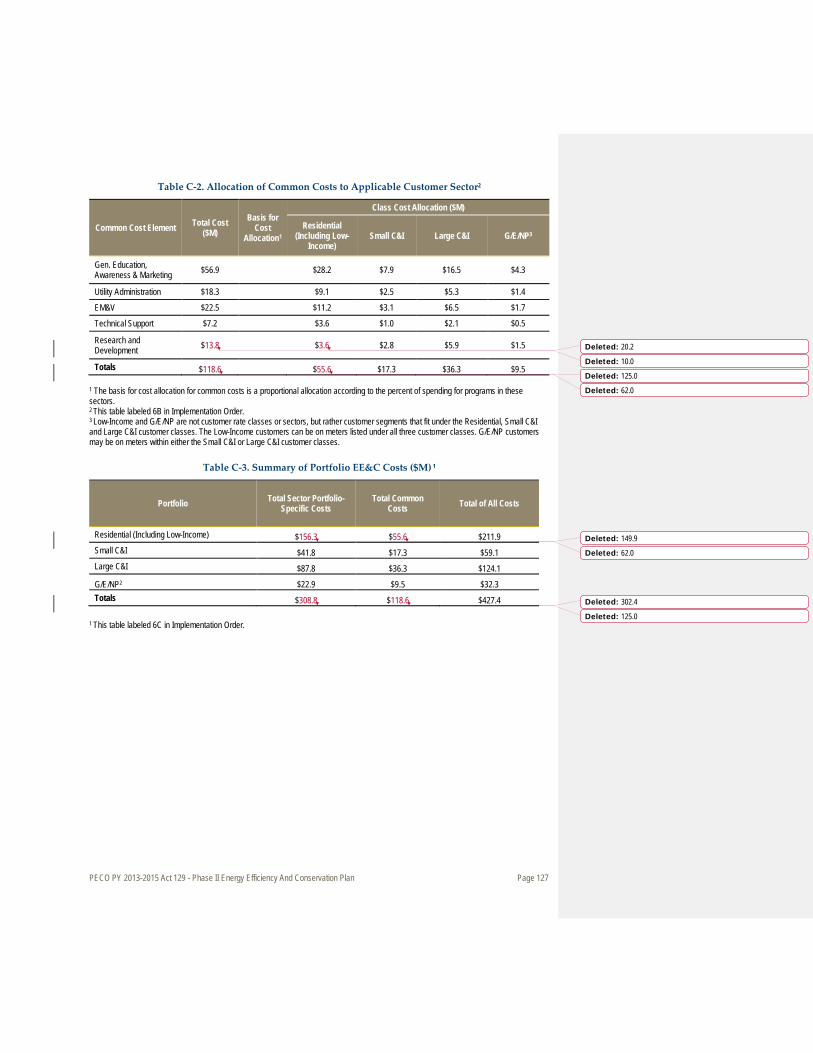
PECO PY 2013-2015 Act 129 - Phase II Energy Efficiency And Conservation Plan Page 127
Table C-2. Allocation of Common Costs to Applicable Customer Sector2
Common Cost Element Total Cost ($M)
Basis for Cost
Allocation1
Class Cost Allocation ($M)
Residential (Including Low-
Income) Small C&I Large C&I G/E/NP3
Gen. Education, Awareness & Marketing $56.9 $28.2 $7.9 $16.5 $4.3
Utility Administration $18.3 $9.1 $2.5 $5.3 $1.4
EM&V $22.5 $11.2 $3.1 $6.5 $1.7
Technical Support $7.2 $3.6 $1.0 $2.1 $0.5
Research and Development $13.8 $3.6 $2.8 $5.9 $1.5
Totals $118.6 $55.6 $17.3 $36.3 $9.5 1 The basis for cost allocation for common costs is a proportional allocation according to the percent of spending for programs in these sectors. 2 This table labeled 6B in Implementation Order. 3 Low-Income and G/E/NP are not customer rate classes or sectors, but rather customer segments that fit under the Residential, Small C&I and Large C&I customer classes. The Low-Income customers can be on meters listed under all three customer classes. G/E/NP customers may be on meters within either the Small C&I or Large C&I customer classes.
Table C-3. Summary of Portfolio EE&C Costs ($M) 1
Portfolio Total Sector Portfolio-Specific Costs
Total Common Costs Total of All Costs
Residential (Including Low-Income) $156.3 $55.6 $211.9 Small C&I $41.8 $17.3 $59.1 Large C&I $87.8 $36.3 $124.1
G/E/NP2 $22.9 $9.5 $32.3 Totals $308.8 $118.6 $427.4
1 This table labeled 6C in Implementation Order.
Deleted: 20.2
Deleted: 10.0
Deleted: 125.0
Deleted: 62.0
Deleted: 149.9
Deleted: 62.0
Deleted: 302.4
Deleted: 125.0
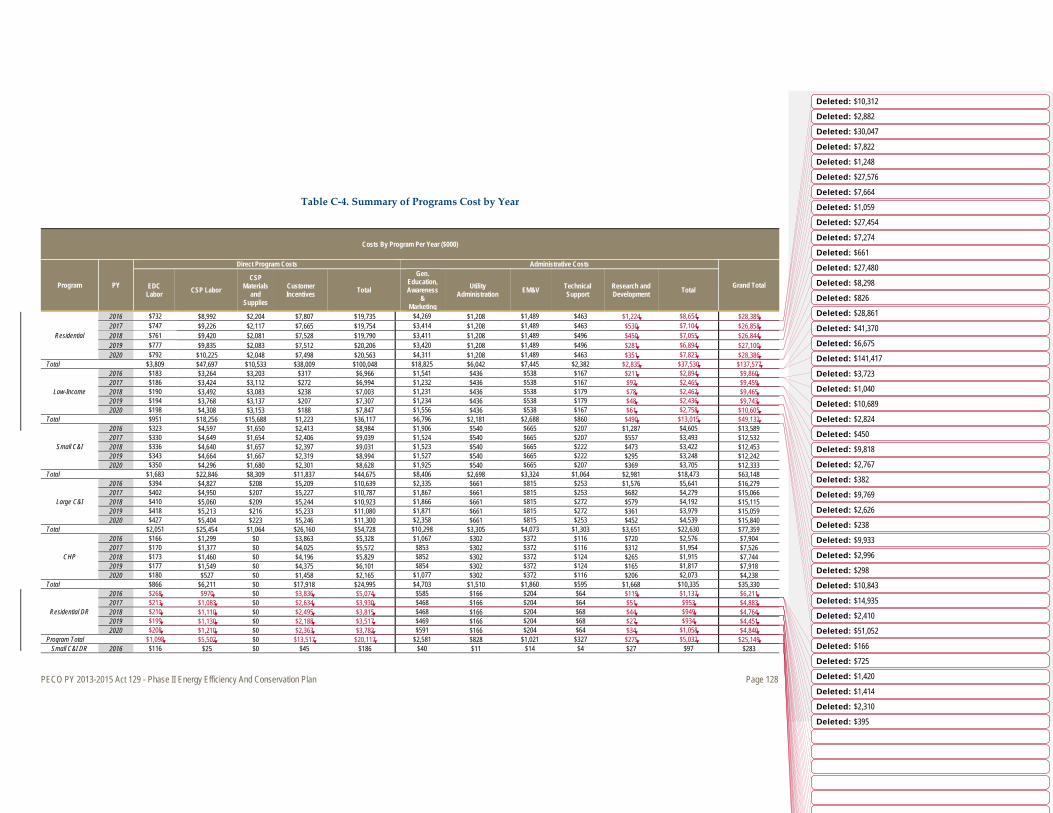
PECO PY 2013-2015 Act 129 - Phase II Energy Efficiency And Conservation Plan Page 128
Table C-4. Summary of Programs Cost by Year
Costs By Program Per Year ($000)
Program PY
Direct Program Costs Administrative Costs
Grand Total EDC Labor CSP Labor
CSP Materials
and Supplies
Customer Incentives Total
Gen. Education, Awareness
& Marketing
Utility Administration EM&V Technical
Support Research and Development Total
Residential
2016 $732 $8,992 $2,204 $7,807 $19,735 $4,269 $1,208 $1,489 $463 $1,224 $8,654 $28,389 2017 $747 $9,226 $2,117 $7,665 $19,754 $3,414 $1,208 $1,489 $463 $530 $7,104 $26,858 2018 $761 $9,420 $2,081 $7,528 $19,790 $3,411 $1,208 $1,489 $496 $450 $7,055 $26,844 2019 $777 $9,835 $2,083 $7,512 $20,206 $3,420 $1,208 $1,489 $496 $281 $6,894 $27,100 2020 $792 $10,225 $2,048 $7,498 $20,563 $4,311 $1,208 $1,489 $463 $351 $7,823 $28,386
Total $3,809 $47,697 $10,533 $38,009 $100,048 $18,825 $6,042 $7,445 $2,382 $2,835 $37,530 $137,577
Low-Income
2016 $183 $3,264 $3,203 $317 $6,966 $1,541 $436 $538 $167 $211 $2,894 $9,860 2017 $186 $3,424 $3,112 $272 $6,994 $1,232 $436 $538 $167 $92 $2,465 $9,459 2018 $190 $3,492 $3,083 $238 $7,003 $1,231 $436 $538 $179 $78 $2,462 $9,465 2019 $194 $3,768 $3,137 $207 $7,307 $1,234 $436 $538 $179 $48 $2,436 $9,743 2020 $198 $4,308 $3,153 $188 $7,847 $1,556 $436 $538 $167 $61 $2,758 $10,605
Total $951 $18,256 $15,688 $1,223 $36,117 $6,796 $2,181 $2,688 $860 $490 $13,015 $49,132
Small C&I
2016 $323 $4,597 $1,650 $2,413 $8,984 $1,906 $540 $665 $207 $1,287 $4,605 $13,589 2017 $330 $4,649 $1,654 $2,406 $9,039 $1,524 $540 $665 $207 $557 $3,493 $12,532 2018 $336 $4,640 $1,657 $2,397 $9,031 $1,523 $540 $665 $222 $473 $3,422 $12,453 2019 $343 $4,664 $1,667 $2,319 $8,994 $1,527 $540 $665 $222 $295 $3,248 $12,242 2020 $350 $4,296 $1,680 $2,301 $8,628 $1,925 $540 $665 $207 $369 $3,705 $12,333
Total $1,683 $22,846 $8,309 $11,837 $44,675 $8,406 $2,698 $3,324 $1,064 $2,981 $18,473 $63,148
Large C&I
2016 $394 $4,827 $208 $5,209 $10,639 $2,335 $661 $815 $253 $1,576 $5,641 $16,279 2017 $402 $4,950 $207 $5,227 $10,787 $1,867 $661 $815 $253 $682 $4,279 $15,066 2018 $410 $5,060 $209 $5,244 $10,923 $1,866 $661 $815 $272 $579 $4,192 $15,115 2019 $418 $5,213 $216 $5,233 $11,080 $1,871 $661 $815 $272 $361 $3,979 $15,059 2020 $427 $5,404 $223 $5,246 $11,300 $2,358 $661 $815 $253 $452 $4,539 $15,840
Total $2,051 $25,454 $1,064 $26,160 $54,728 $10,298 $3,305 $4,073 $1,303 $3,651 $22,630 $77,359
CHP
2016 $166 $1,299 $0 $3,863 $5,328 $1,067 $302 $372 $116 $720 $2,576 $7,904 2017 $170 $1,377 $0 $4,025 $5,572 $853 $302 $372 $116 $312 $1,954 $7,526 2018 $173 $1,460 $0 $4,196 $5,829 $852 $302 $372 $124 $265 $1,915 $7,744 2019 $177 $1,549 $0 $4,375 $6,101 $854 $302 $372 $124 $165 $1,817 $7,918 2020 $180 $527 $0 $1,458 $2,165 $1,077 $302 $372 $116 $206 $2,073 $4,238
Total $866 $6,211 $0 $17,918 $24,995 $4,703 $1,510 $1,860 $595 $1,668 $10,335 $35,330
Residential DR
2016 $268 $970 $0 $3,836 $5,074 $585 $166 $204 $64 $119 $1,137 $6,211 2017 $213 $1,083 $0 $2,634 $3,930 $468 $166 $204 $64 $51 $953 $4,883 2018 $210 $1,110 $0 $2,495 $3,815 $468 $166 $204 $68 $44 $949 $4,764 2019 $199 $1,130 $0 $2,188 $3,517 $469 $166 $204 $68 $27 $934 $4,451 2020 $208 $1,210 $0 $2,363 $3,782 $591 $166 $204 $64 $34 $1,058 $4,840
Program Total $1,098 $5,502 $0 $13,517 $20,117 $2,581 $828 $1,021 $327 $275 $5,032 $25,149 Small C&I DR 2016 $116 $25 $0 $45 $186 $40 $11 $14 $4 $27 $97 $283
Deleted: $2,882
Deleted: $10,312
Deleted: $30,047
Deleted: $1,248
Deleted: $7,822
Deleted: $27,576
Deleted: $1,059
Deleted: $7,664
Deleted: $27,454
Deleted: $661
Deleted: $7,274
Deleted: $27,480
Deleted: $826
Deleted: $8,298
Deleted: $28,861
Deleted: $6,675
Deleted: $41,370
Deleted: $141,417
Deleted: $1,040
Deleted: $3,723
Deleted: $10,689
Deleted: $450
Deleted: $2,824
Deleted: $9,818
Deleted: $382
Deleted: $2,767
Deleted: $9,769
Deleted: $238
Deleted: $2,626
Deleted: $9,933
Deleted: $298
Deleted: $2,996
Deleted: $10,843
Deleted: $2,410
Deleted: $14,935
Deleted: $51,052
Deleted: $166
Deleted: $725
Deleted: $1,420
Deleted: $2,310
Deleted: $395
Deleted: $1,414
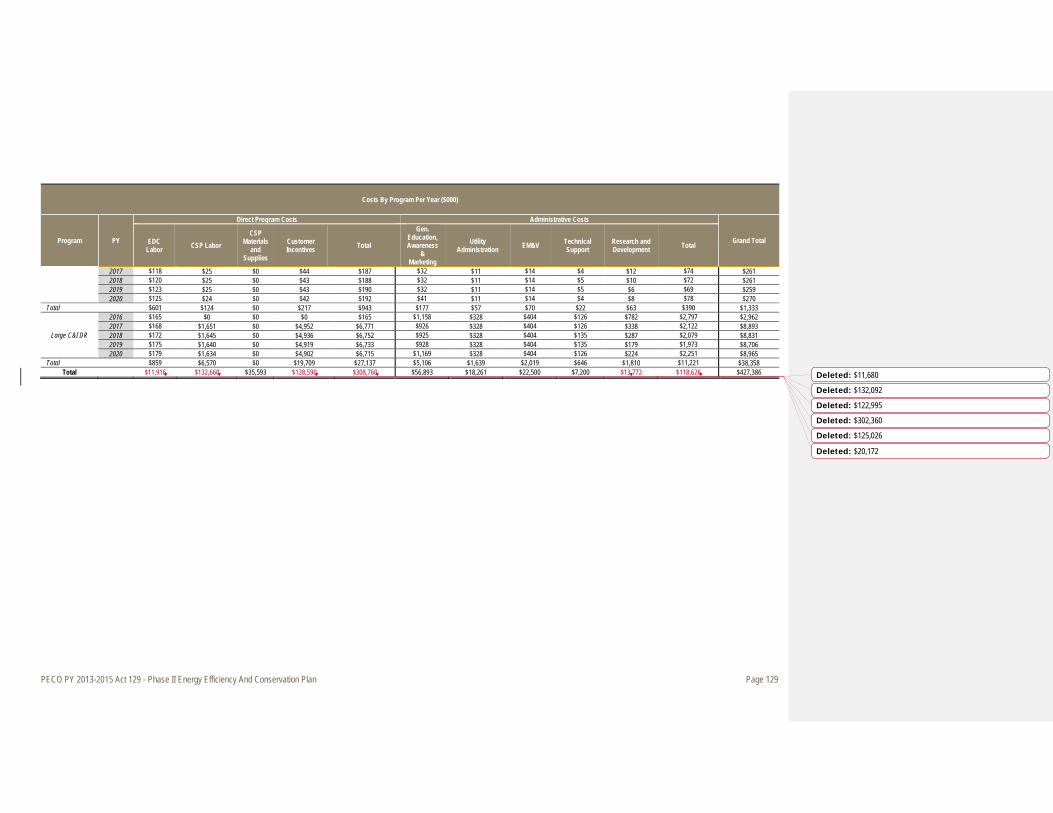
PECO PY 2013-2015 Act 129 - Phase II Energy Efficiency And Conservation Plan Page 129
Costs By Program Per Year ($000)
Program PY
Direct Program Costs Administrative Costs
Grand Total EDC Labor CSP Labor
CSP Materials
and Supplies
Customer Incentives Total
Gen. Education, Awareness
& Marketing
Utility Administration EM&V Technical
Support Research and Development Total
2017 $118 $25 $0 $44 $187 $32 $11 $14 $4 $12 $74 $261 2018 $120 $25 $0 $43 $188 $32 $11 $14 $5 $10 $72 $261 2019 $123 $25 $0 $43 $190 $32 $11 $14 $5 $6 $69 $259 2020 $125 $24 $0 $42 $192 $41 $11 $14 $4 $8 $78 $270
Total $601 $124 $0 $217 $943 $177 $57 $70 $22 $63 $390 $1,333
Large C&I DR
2016 $165 $0 $0 $0 $165 $1,158 $328 $404 $126 $782 $2,797 $2,962 2017 $168 $1,651 $0 $4,952 $6,771 $926 $328 $404 $126 $338 $2,122 $8,893 2018 $172 $1,645 $0 $4,936 $6,752 $925 $328 $404 $135 $287 $2,079 $8,831 2019 $175 $1,640 $0 $4,919 $6,733 $928 $328 $404 $135 $179 $1,973 $8,706 2020 $179 $1,634 $0 $4,902 $6,715 $1,169 $328 $404 $126 $224 $2,251 $8,965
Total $859 $6,570 $0 $19,709 $27,137 $5,106 $1,639 $2,019 $646 $1,810 $11,221 $38,358 Total $11,916 $132,660 $35,593 $128,590 $308,760 $56,893 $18,261 $22,500 $7,200 $13,772 $118,626 $427,386
Deleted: $11,680
Deleted: $132,092
Deleted: $122,995
Deleted: $302,360
Deleted: $20,172
Deleted: $125,026
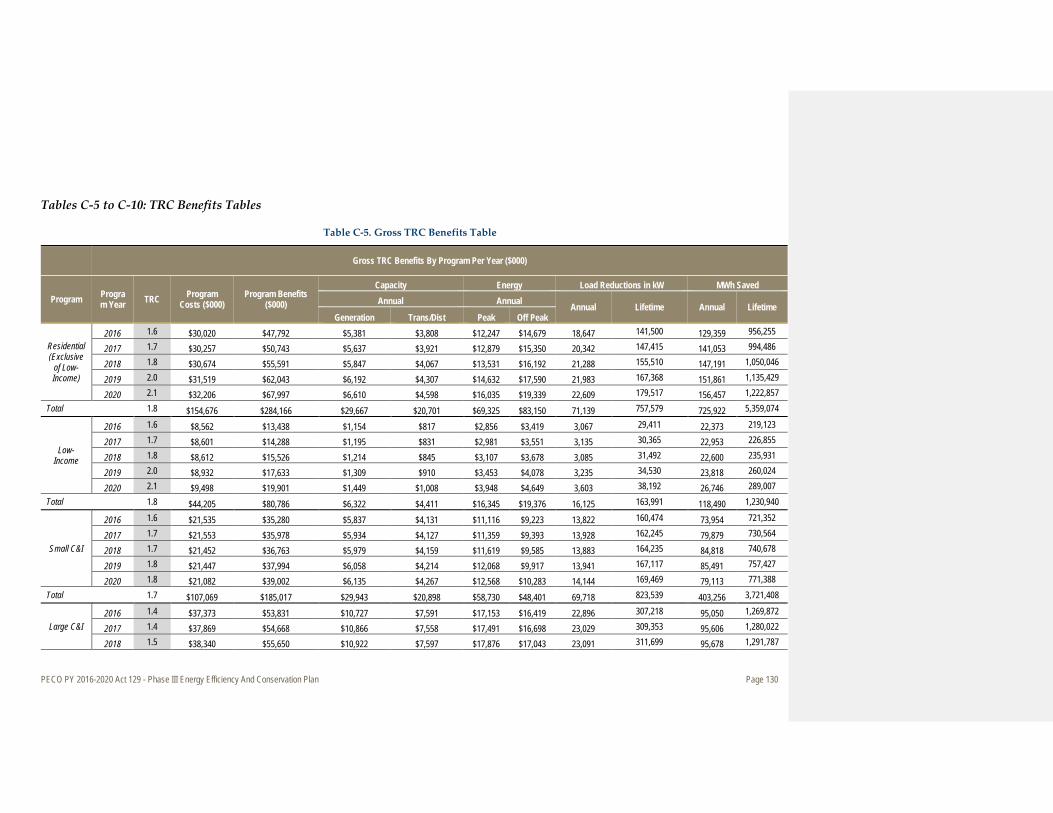
PECO PY 2016-2020 Act 129 - Phase III Energy Efficiency And Conservation Plan Page 130
Tables C-5 to C-10: TRC Benefits Tables
Table C-5. Gross TRC Benefits Table
Gross TRC Benefits By Program Per Year ($000)
Program Program Year TRC Program
Costs ($000) Program Benefits
($000)
Capacity Energy Load Reductions in kW MWh Saved Annual Annual Annual Lifetime Annual Lifetime
Generation Trans/Dist Peak Off Peak
Residential (Exclusive
of Low-Income)
2016 1.6 $30,020 $47,792 $5,381 $3,808 $12,247 $14,679 18,647 141,500 129,359 956,255
2017 1.7 $30,257 $50,743 $5,637 $3,921 $12,879 $15,350 20,342 147,415 141,053 994,486
2018 1.8 $30,674 $55,591 $5,847 $4,067 $13,531 $16,192 21,288 155,510 147,191 1,050,046
2019 2.0 $31,519 $62,043 $6,192 $4,307 $14,632 $17,590 21,983 167,368 151,861 1,135,429
2020 2.1 $32,206 $67,997 $6,610 $4,598 $16,035 $19,339 22,609 179,517 156,457 1,222,857 Total 1.8 $154,676 $284,166 $29,667 $20,701 $69,325 $83,150 71,139 757,579 725,922 5,359,074
Low-Income
2016 1.6 $8,562 $13,438 $1,154 $817 $2,856 $3,419 3,067 29,411 22,373 219,123
2017 1.7 $8,601 $14,288 $1,195 $831 $2,981 $3,551 3,135 30,365 22,953 226,855
2018 1.8 $8,612 $15,526 $1,214 $845 $3,107 $3,678 3,085 31,492 22,600 235,931
2019 2.0 $8,932 $17,633 $1,309 $910 $3,453 $4,078 3,235 34,530 23,818 260,024
2020 2.1 $9,498 $19,901 $1,449 $1,008 $3,948 $4,649 3,603 38,192 26,746 289,007 Total 1.8 $44,205 $80,786 $6,322 $4,411 $16,345 $19,376 16,125 163,991 118,490 1,230,940
Small C&I
2016 1.6 $21,535 $35,280 $5,837 $4,131 $11,116 $9,223 13,822 160,474 73,954 721,352
2017 1.7 $21,553 $35,978 $5,934 $4,127 $11,359 $9,393 13,928 162,245 79,879 730,564
2018 1.7 $21,452 $36,763 $5,979 $4,159 $11,619 $9,585 13,883 164,235 84,818 740,678
2019 1.8 $21,447 $37,994 $6,058 $4,214 $12,068 $9,917 13,941 167,117 85,491 757,427
2020 1.8 $21,082 $39,002 $6,135 $4,267 $12,568 $10,283 14,144 169,469 79,113 771,388 Total 1.7 $107,069 $185,017 $29,943 $20,898 $58,730 $48,401 69,718 823,539 403,256 3,721,408
Large C&I 2016 1.4 $37,373 $53,831 $10,727 $7,591 $17,153 $16,419 22,896 307,218 95,050 1,269,872
2017 1.4 $37,869 $54,668 $10,866 $7,558 $17,491 $16,698 23,029 309,353 95,606 1,280,022
2018 1.5 $38,340 $55,650 $10,922 $7,597 $17,876 $17,043 23,091 311,699 95,678 1,291,787
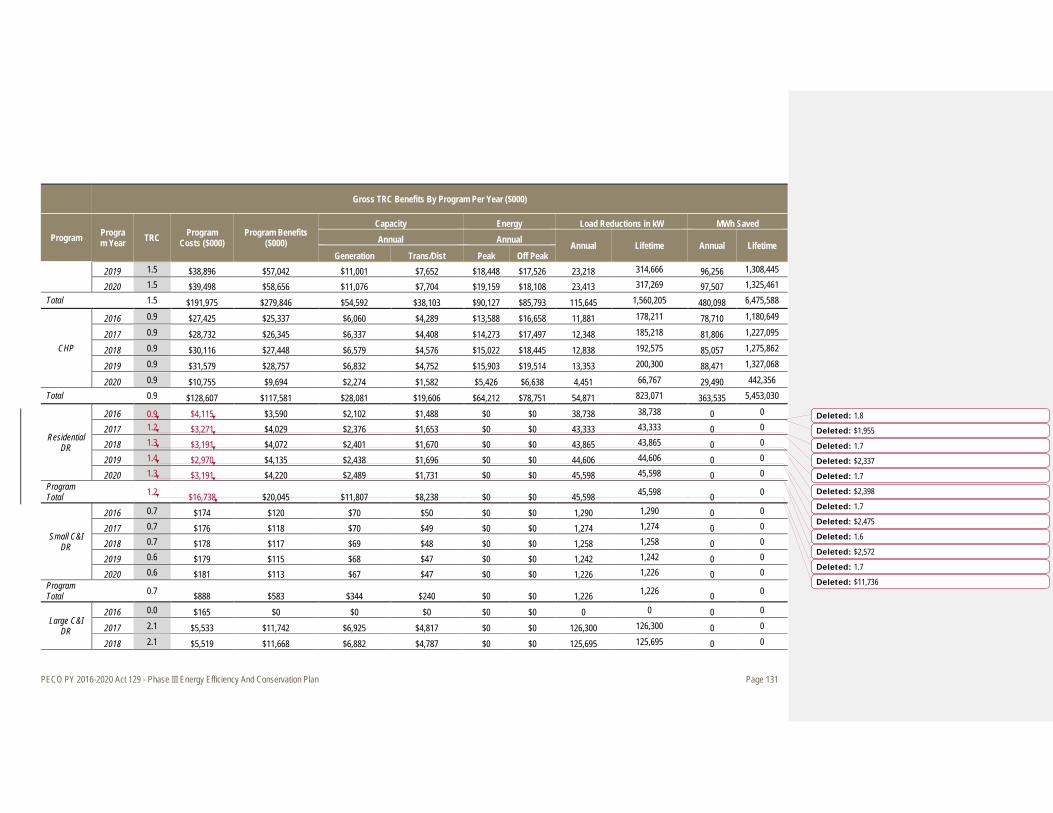
PECO PY 2016-2020 Act 129 - Phase III Energy Efficiency And Conservation Plan Page 131
Gross TRC Benefits By Program Per Year ($000)
Program Program Year TRC Program
Costs ($000) Program Benefits
($000)
Capacity Energy Load Reductions in kW MWh Saved Annual Annual Annual Lifetime Annual Lifetime
Generation Trans/Dist Peak Off Peak 2019 1.5 $38,896 $57,042 $11,001 $7,652 $18,448 $17,526 23,218 314,666 96,256 1,308,445
2020 1.5 $39,498 $58,656 $11,076 $7,704 $19,159 $18,108 23,413 317,269 97,507 1,325,461 Total 1.5 $191,975 $279,846 $54,592 $38,103 $90,127 $85,793 115,645 1,560,205 480,098 6,475,588
CHP
2016 0.9 $27,425 $25,337 $6,060 $4,289 $13,588 $16,658 11,881 178,211 78,710 1,180,649
2017 0.9 $28,732 $26,345 $6,337 $4,408 $14,273 $17,497 12,348 185,218 81,806 1,227,095
2018 0.9 $30,116 $27,448 $6,579 $4,576 $15,022 $18,445 12,838 192,575 85,057 1,275,862
2019 0.9 $31,579 $28,757 $6,832 $4,752 $15,903 $19,514 13,353 200,300 88,471 1,327,068
2020 0.9 $10,755 $9,694 $2,274 $1,582 $5,426 $6,638 4,451 66,767 29,490 442,356 Total 0.9 $128,607 $117,581 $28,081 $19,606 $64,212 $78,751 54,871 823,071 363,535 5,453,030
Residential DR
2016 0.9 $4,115 $3,590 $2,102 $1,488 $0 $0 38,738 38,738 0 0
2017 1.2 $3,271 $4,029 $2,376 $1,653 $0 $0 43,333 43,333 0 0
2018 1.3 $3,191 $4,072 $2,401 $1,670 $0 $0 43,865 43,865 0 0
2019 1.4 $2,970 $4,135 $2,438 $1,696 $0 $0 44,606 44,606 0 0
2020 1.3 $3,191 $4,220 $2,489 $1,731 $0 $0 45,598 45,598 0 0 Program Total 1.2 $16,738 $20,045 $11,807 $8,238 $0 $0 45,598 45,598 0 0
Small C&I DR
2016 0.7 $174 $120 $70 $50 $0 $0 1,290 1,290 0 0
2017 0.7 $176 $118 $70 $49 $0 $0 1,274 1,274 0 0
2018 0.7 $178 $117 $69 $48 $0 $0 1,258 1,258 0 0
2019 0.6 $179 $115 $68 $47 $0 $0 1,242 1,242 0 0
2020 0.6 $181 $113 $67 $47 $0 $0 1,226 1,226 0 0 Program Total 0.7 $888 $583 $344 $240 $0 $0 1,226 1,226 0 0
Large C&I DR
2016 0.0 $165 $0 $0 $0 $0 $0 0 0 0 0
2017 2.1 $5,533 $11,742 $6,925 $4,817 $0 $0 126,300 126,300 0 0
2018 2.1 $5,519 $11,668 $6,882 $4,787 $0 $0 125,695 125,695 0 0
Deleted: 1.8
Deleted: $1,955
Deleted: 1.7
Deleted: $2,337
Deleted: 1.7
Deleted: $2,398
Deleted: 1.7
Deleted: $2,475
Deleted: 1.6
Deleted: $2,572
Deleted: 1.7
Deleted: $11,736
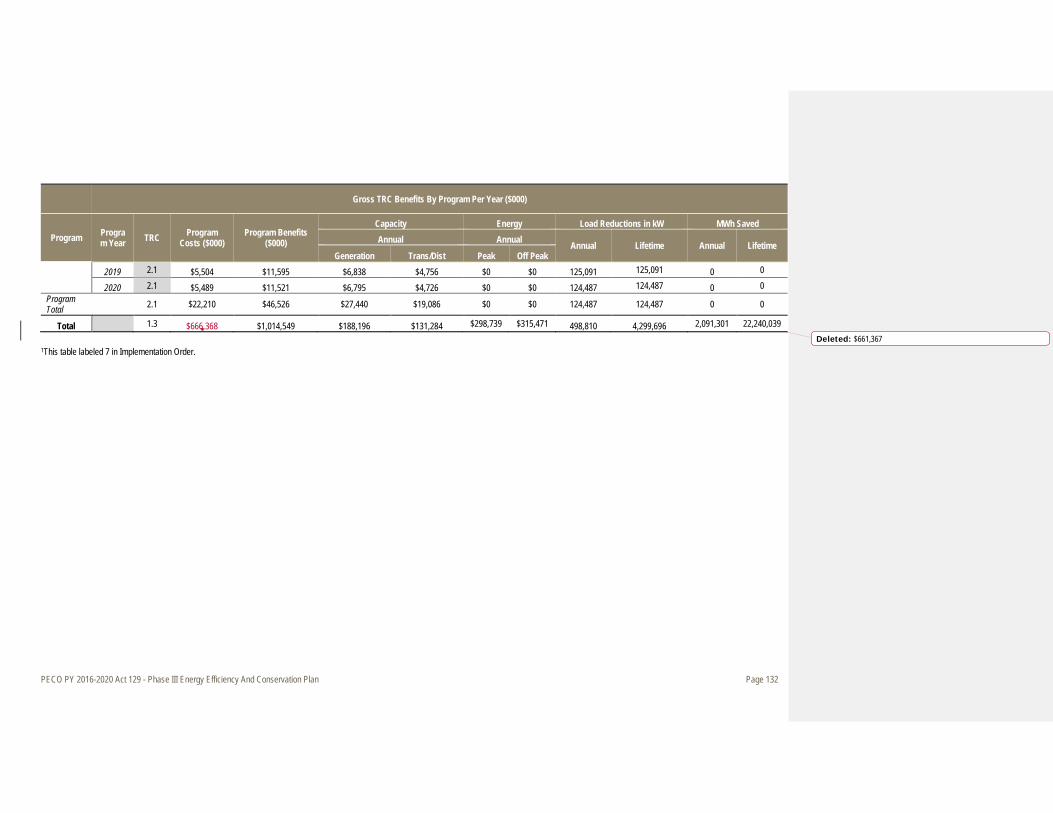
PECO PY 2016-2020 Act 129 - Phase III Energy Efficiency And Conservation Plan Page 132
Gross TRC Benefits By Program Per Year ($000)
Program Program Year TRC Program
Costs ($000) Program Benefits
($000)
Capacity Energy Load Reductions in kW MWh Saved Annual Annual Annual Lifetime Annual Lifetime
Generation Trans/Dist Peak Off Peak 2019 2.1 $5,504 $11,595 $6,838 $4,756 $0 $0 125,091 125,091 0 0
2020 2.1 $5,489 $11,521 $6,795 $4,726 $0 $0 124,487 124,487 0 0 Program Total 2.1 $22,210 $46,526 $27,440 $19,086 $0 $0 124,487 124,487 0 0
Total 1.3 $666,368 $1,014,549 $188,196 $131,284 $298,739 $315,471 498,810 4,299,696 2,091,301 22,240,039
1This table labeled 7 in Implementation Order.
Deleted: $661,367
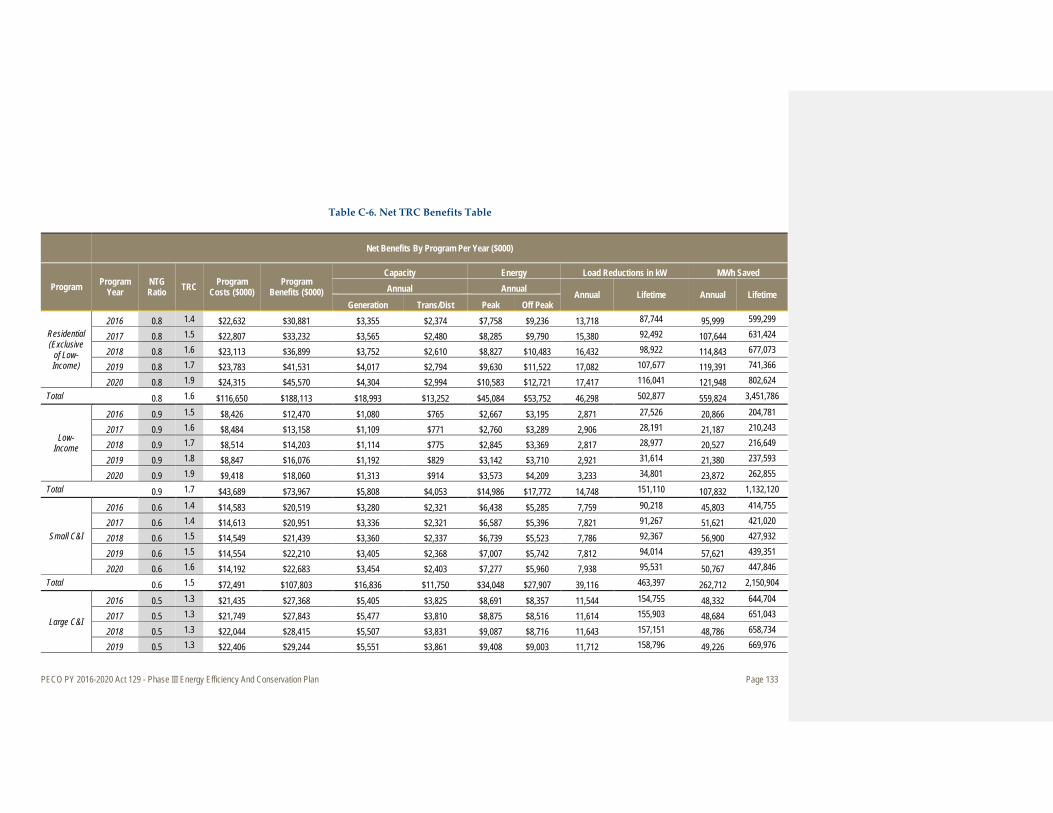
PECO PY 2016-2020 Act 129 - Phase III Energy Efficiency And Conservation Plan Page 133
Table C-6. Net TRC Benefits Table
Net Benefits By Program Per Year ($000)
Program Program Year
NTG Ratio TRC Program
Costs ($000) Program
Benefits ($000)
Capacity Energy Load Reductions in kW MWh Saved Annual Annual Annual Lifetime Annual Lifetime
Generation Trans/Dist Peak Off Peak
Residential (Exclusive
of Low-Income)
2016 0.8 1.4 $22,632 $30,881 $3,355 $2,374 $7,758 $9,236 13,718 87,744 95,999 599,299
2017 0.8 1.5 $22,807 $33,232 $3,565 $2,480 $8,285 $9,790 15,380 92,492 107,644 631,424
2018 0.8 1.6 $23,113 $36,899 $3,752 $2,610 $8,827 $10,483 16,432 98,922 114,843 677,073
2019 0.8 1.7 $23,783 $41,531 $4,017 $2,794 $9,630 $11,522 17,082 107,677 119,391 741,366
2020 0.8 1.9 $24,315 $45,570 $4,304 $2,994 $10,583 $12,721 17,417 116,041 121,948 802,624 Total 0.8 1.6 $116,650 $188,113 $18,993 $13,252 $45,084 $53,752 46,298 502,877 559,824 3,451,786
Low-Income
2016 0.9 1.5 $8,426 $12,470 $1,080 $765 $2,667 $3,195 2,871 27,526 20,866 204,781
2017 0.9 1.6 $8,484 $13,158 $1,109 $771 $2,760 $3,289 2,906 28,191 21,187 210,243
2018 0.9 1.7 $8,514 $14,203 $1,114 $775 $2,845 $3,369 2,817 28,977 20,527 216,649
2019 0.9 1.8 $8,847 $16,076 $1,192 $829 $3,142 $3,710 2,921 31,614 21,380 237,593
2020 0.9 1.9 $9,418 $18,060 $1,313 $914 $3,573 $4,209 3,233 34,801 23,872 262,855 Total 0.9 1.7 $43,689 $73,967 $5,808 $4,053 $14,986 $17,772 14,748 151,110 107,832 1,132,120
Small C&I
2016 0.6 1.4 $14,583 $20,519 $3,280 $2,321 $6,438 $5,285 7,759 90,218 45,803 414,755
2017 0.6 1.4 $14,613 $20,951 $3,336 $2,321 $6,587 $5,396 7,821 91,267 51,621 421,020
2018 0.6 1.5 $14,549 $21,439 $3,360 $2,337 $6,739 $5,523 7,786 92,367 56,900 427,932
2019 0.6 1.5 $14,554 $22,210 $3,405 $2,368 $7,007 $5,742 7,812 94,014 57,621 439,351
2020 0.6 1.6 $14,192 $22,683 $3,454 $2,403 $7,277 $5,960 7,938 95,531 50,767 447,846 Total 0.6 1.5 $72,491 $107,803 $16,836 $11,750 $34,048 $27,907 39,116 463,397 262,712 2,150,904
Large C&I
2016 0.5 1.3 $21,435 $27,368 $5,405 $3,825 $8,691 $8,357 11,544 154,755 48,332 644,704
2017 0.5 1.3 $21,749 $27,843 $5,477 $3,810 $8,875 $8,516 11,614 155,903 48,684 651,043
2018 0.5 1.3 $22,044 $28,415 $5,507 $3,831 $9,087 $8,716 11,643 157,151 48,786 658,734
2019 0.5 1.3 $22,406 $29,244 $5,551 $3,861 $9,408 $9,003 11,712 158,796 49,226 669,976
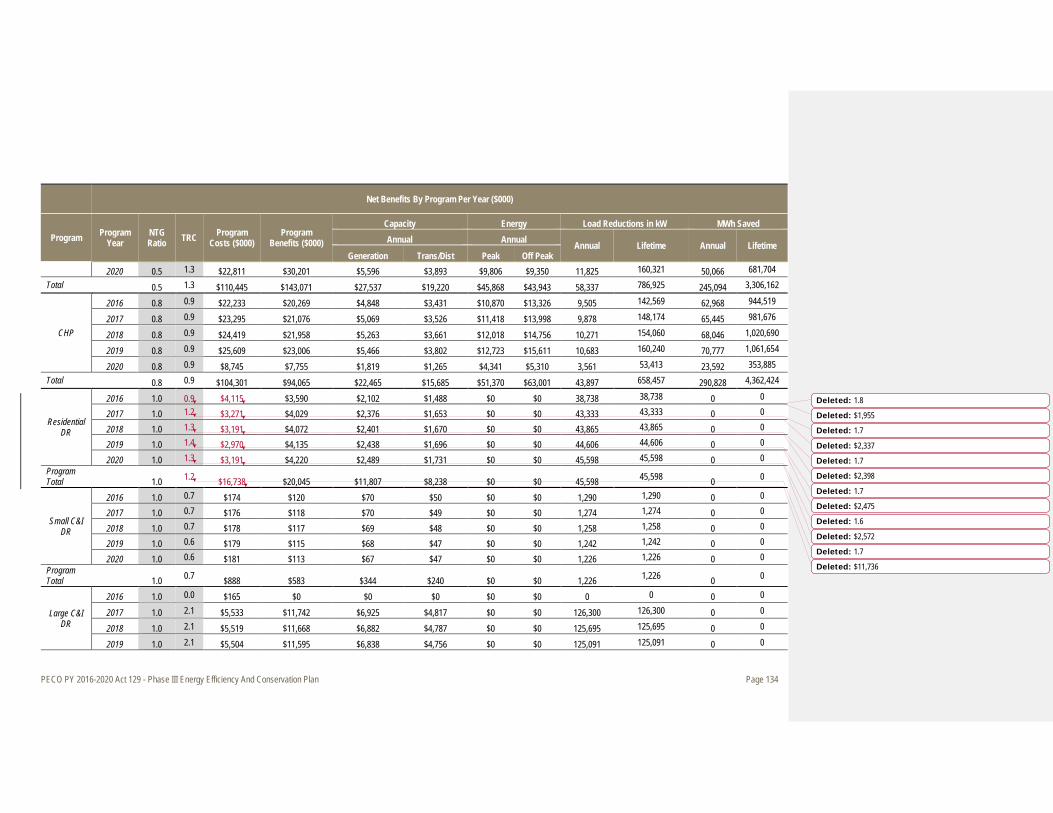
PECO PY 2016-2020 Act 129 - Phase III Energy Efficiency And Conservation Plan Page 134
Net Benefits By Program Per Year ($000)
Program Program Year
NTG Ratio TRC Program
Costs ($000) Program
Benefits ($000)
Capacity Energy Load Reductions in kW MWh Saved Annual Annual Annual Lifetime Annual Lifetime
Generation Trans/Dist Peak Off Peak 2020 0.5 1.3 $22,811 $30,201 $5,596 $3,893 $9,806 $9,350 11,825 160,321 50,066 681,704
Total 0.5 1.3 $110,445 $143,071 $27,537 $19,220 $45,868 $43,943 58,337 786,925 245,094 3,306,162
CHP
2016 0.8 0.9 $22,233 $20,269 $4,848 $3,431 $10,870 $13,326 9,505 142,569 62,968 944,519
2017 0.8 0.9 $23,295 $21,076 $5,069 $3,526 $11,418 $13,998 9,878 148,174 65,445 981,676
2018 0.8 0.9 $24,419 $21,958 $5,263 $3,661 $12,018 $14,756 10,271 154,060 68,046 1,020,690
2019 0.8 0.9 $25,609 $23,006 $5,466 $3,802 $12,723 $15,611 10,683 160,240 70,777 1,061,654
2020 0.8 0.9 $8,745 $7,755 $1,819 $1,265 $4,341 $5,310 3,561 53,413 23,592 353,885 Total 0.8 0.9 $104,301 $94,065 $22,465 $15,685 $51,370 $63,001 43,897 658,457 290,828 4,362,424
Residential DR
2016 1.0 0.9 $4,115 $3,590 $2,102 $1,488 $0 $0 38,738 38,738 0 0
2017 1.0 1.2 $3,271 $4,029 $2,376 $1,653 $0 $0 43,333 43,333 0 0
2018 1.0 1.3 $3,191 $4,072 $2,401 $1,670 $0 $0 43,865 43,865 0 0
2019 1.0 1.4 $2,970 $4,135 $2,438 $1,696 $0 $0 44,606 44,606 0 0
2020 1.0 1.3 $3,191 $4,220 $2,489 $1,731 $0 $0 45,598 45,598 0 0 Program Total 1.0 1.2 $16,738 $20,045 $11,807 $8,238 $0 $0 45,598 45,598 0 0
Small C&I DR
2016 1.0 0.7 $174 $120 $70 $50 $0 $0 1,290 1,290 0 0
2017 1.0 0.7 $176 $118 $70 $49 $0 $0 1,274 1,274 0 0
2018 1.0 0.7 $178 $117 $69 $48 $0 $0 1,258 1,258 0 0
2019 1.0 0.6 $179 $115 $68 $47 $0 $0 1,242 1,242 0 0
2020 1.0 0.6 $181 $113 $67 $47 $0 $0 1,226 1,226 0 0 Program Total 1.0 0.7 $888 $583 $344 $240 $0 $0 1,226 1,226 0 0
Large C&I DR
2016 1.0 0.0 $165 $0 $0 $0 $0 $0 0 0 0 0
2017 1.0 2.1 $5,533 $11,742 $6,925 $4,817 $0 $0 126,300 126,300 0 0
2018 1.0 2.1 $5,519 $11,668 $6,882 $4,787 $0 $0 125,695 125,695 0 0
2019 1.0 2.1 $5,504 $11,595 $6,838 $4,756 $0 $0 125,091 125,091 0 0
Deleted: 1.8
Deleted: $1,955
Deleted: 1.7
Deleted: $2,337
Deleted: 1.7
Deleted: $2,398
Deleted: 1.7
Deleted: $2,475
Deleted: 1.6
Deleted: $2,572
Deleted: 1.7
Deleted: $11,736

PECO PY 2016-2020 Act 129 - Phase III Energy Efficiency And Conservation Plan Page 135
Net Benefits By Program Per Year ($000)
Program Program Year
NTG Ratio TRC Program
Costs ($000) Program
Benefits ($000)
Capacity Energy Load Reductions in kW MWh Saved Annual Annual Annual Lifetime Annual Lifetime
Generation Trans/Dist Peak Off Peak 2020 1.0 2.1 $5,489 $11,521 $6,795 $4,726 $0 $0 124,487 124,487 0 0
Program Total 1.0 2.1 $22,210 $46,526 $27,440 $19,086 $0 $0 124,487 124,487 0 0
Total 1.1 $487,412 $674,172 $131,229 $91,524 $191,356 $206,375 373,708 2,734,077 1,466,291 14,403,397
Deleted: $482,411
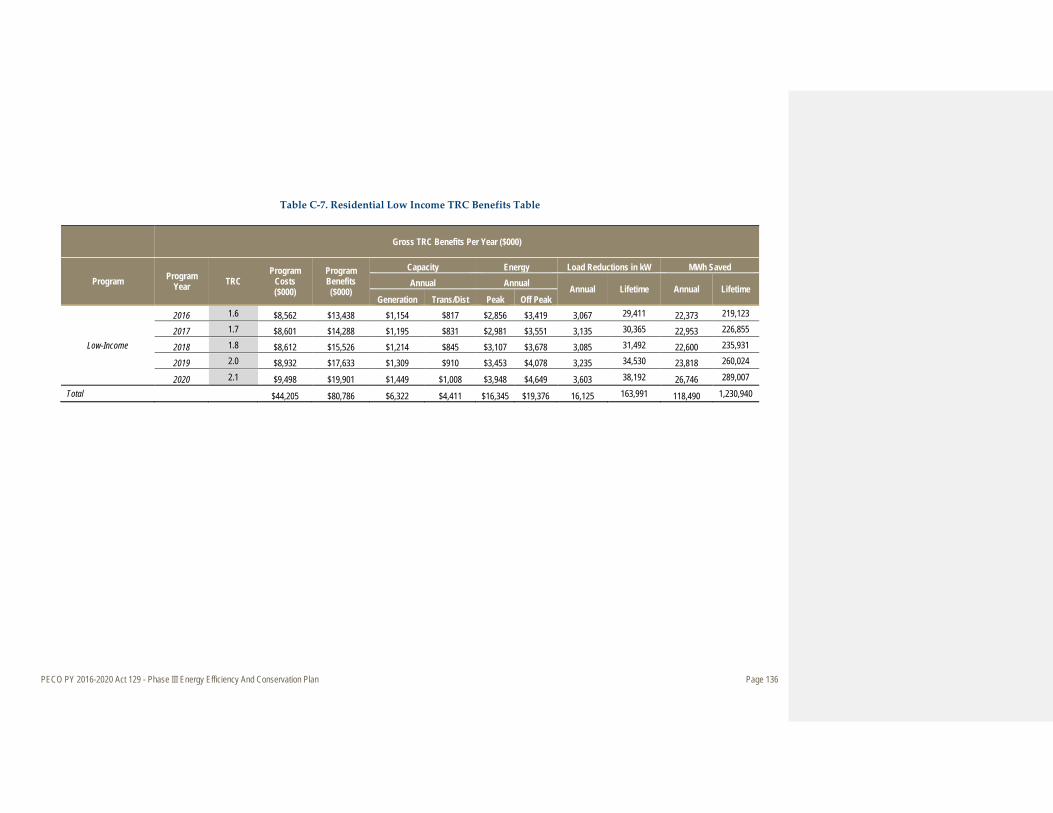
PECO PY 2016-2020 Act 129 - Phase III Energy Efficiency And Conservation Plan Page 136
Table C-7. Residential Low Income TRC Benefits Table
Gross TRC Benefits Per Year ($000)
Program Program Year TRC
Program Costs ($000)
Program Benefits ($000)
Capacity Energy Load Reductions in kW MWh Saved Annual Annual Annual Lifetime Annual Lifetime
Generation Trans/Dist Peak Off Peak
Low-Income
2016 1.6 $8,562 $13,438 $1,154 $817 $2,856 $3,419 3,067 29,411 22,373 219,123
2017 1.7 $8,601 $14,288 $1,195 $831 $2,981 $3,551 3,135 30,365 22,953 226,855
2018 1.8 $8,612 $15,526 $1,214 $845 $3,107 $3,678 3,085 31,492 22,600 235,931
2019 2.0 $8,932 $17,633 $1,309 $910 $3,453 $4,078 3,235 34,530 23,818 260,024
2020 2.1 $9,498 $19,901 $1,449 $1,008 $3,948 $4,649 3,603 38,192 26,746 289,007
Total $44,205 $80,786 $6,322 $4,411 $16,345 $19,376 16,125 163,991 118,490 1,230,940
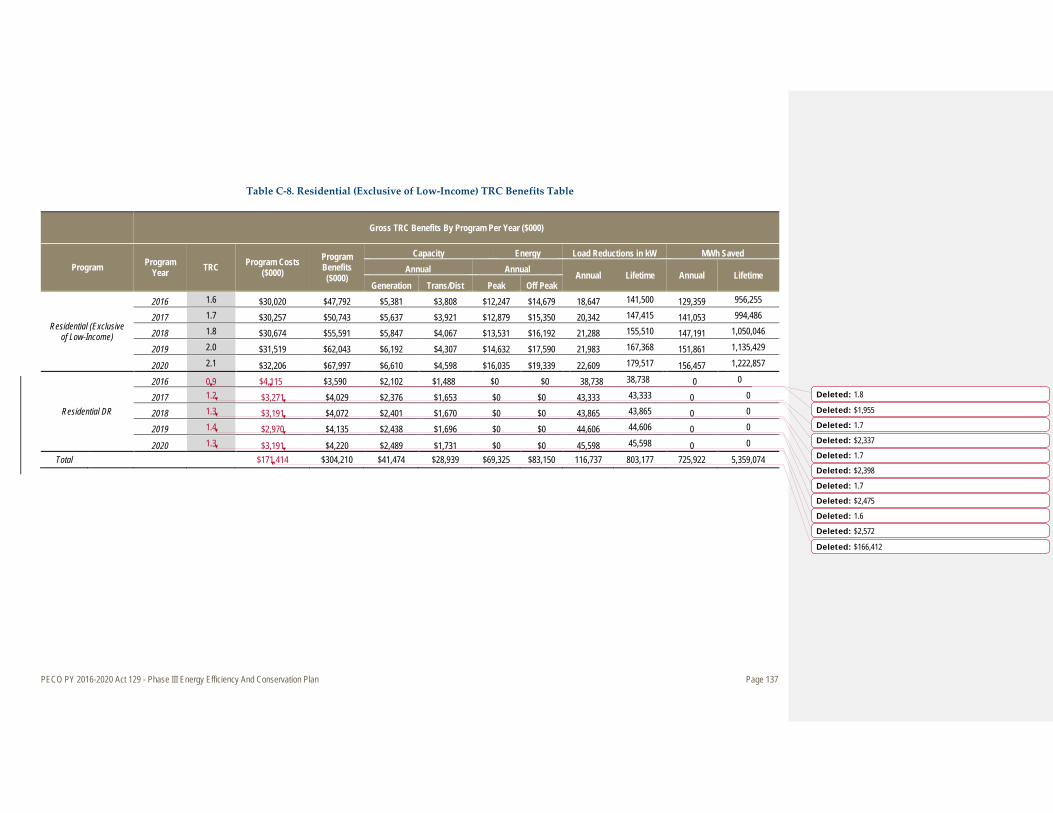
PECO PY 2016-2020 Act 129 - Phase III Energy Efficiency And Conservation Plan Page 137
Table C-8. Residential (Exclusive of Low-Income) TRC Benefits Table
Gross TRC Benefits By Program Per Year ($000)
Program Program Year TRC Program Costs
($000) Program Benefits ($000)
Capacity Energy Load Reductions in kW MWh Saved Annual Annual Annual Lifetime Annual Lifetime
Generation Trans/Dist Peak Off Peak
Residential (Exclusive of Low-Income)
2016 1.6 $30,020 $47,792 $5,381 $3,808 $12,247 $14,679 18,647 141,500 129,359 956,255
2017 1.7 $30,257 $50,743 $5,637 $3,921 $12,879 $15,350 20,342 147,415 141,053 994,486
2018 1.8 $30,674 $55,591 $5,847 $4,067 $13,531 $16,192 21,288 155,510 147,191 1,050,046
2019 2.0 $31,519 $62,043 $6,192 $4,307 $14,632 $17,590 21,983 167,368 151,861 1,135,429
2020 2.1 $32,206 $67,997 $6,610 $4,598 $16,035 $19,339 22,609 179,517 156,457 1,222,857
Residential DR
2016 0.9 $4,115 $3,590 $2,102 $1,488 $0 $0 38,738 38,738 0 0
2017 1.2 $3,271 $4,029 $2,376 $1,653 $0 $0 43,333 43,333 0 0
2018 1.3 $3,191 $4,072 $2,401 $1,670 $0 $0 43,865 43,865 0 0
2019 1.4 $2,970 $4,135 $2,438 $1,696 $0 $0 44,606 44,606 0 0
2020 1.3 $3,191 $4,220 $2,489 $1,731 $0 $0 45,598 45,598 0 0
Total $171,414 $304,210 $41,474 $28,939 $69,325 $83,150 116,737 803,177 725,922 5,359,074
Deleted: 1.8
Deleted: $1,955
Deleted: 1.7
Deleted: $2,337
Deleted: 1.7
Deleted: $2,398
Deleted: 1.7
Deleted: $2,475
Deleted: 1.6
Deleted: $2,572
Deleted: $166,412
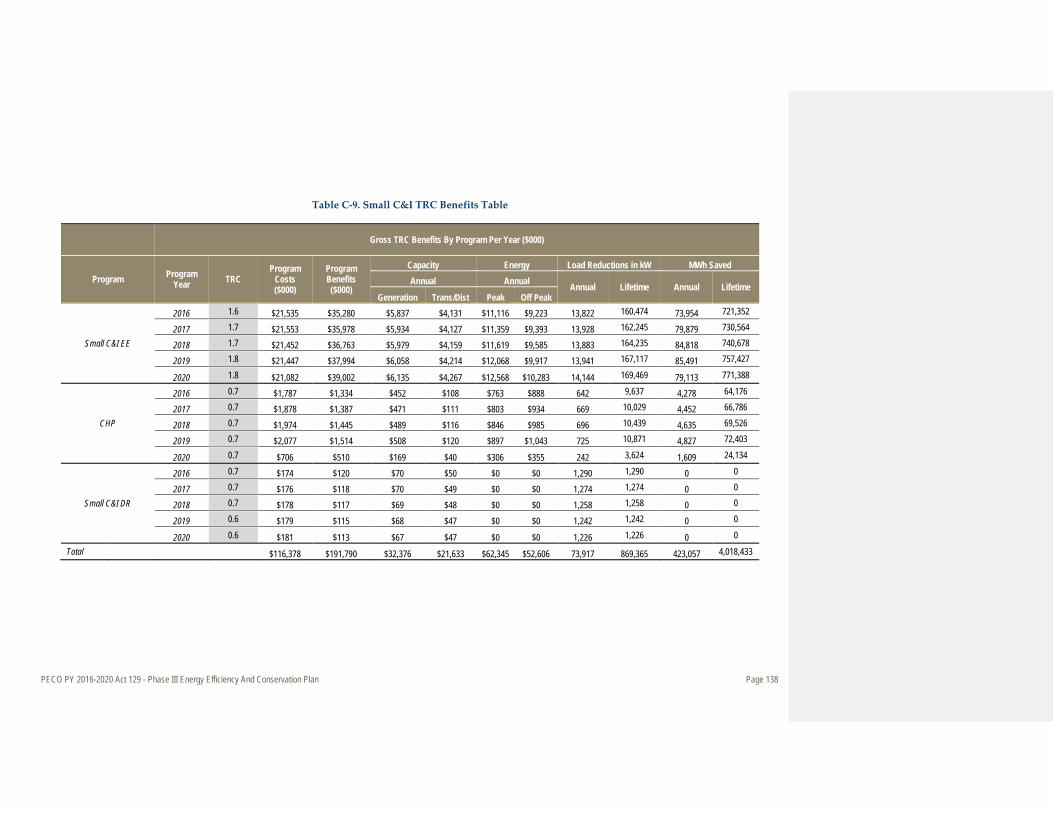
PECO PY 2016-2020 Act 129 - Phase III Energy Efficiency And Conservation Plan Page 138
Table C-9. Small C&I TRC Benefits Table
Gross TRC Benefits By Program Per Year ($000)
Program Program Year TRC
Program Costs ($000)
Program Benefits ($000)
Capacity Energy Load Reductions in kW MWh Saved Annual Annual Annual Lifetime Annual Lifetime
Generation Trans/Dist Peak Off Peak
Small C&I EE
2016 1.6 $21,535 $35,280 $5,837 $4,131 $11,116 $9,223 13,822 160,474 73,954 721,352
2017 1.7 $21,553 $35,978 $5,934 $4,127 $11,359 $9,393 13,928 162,245 79,879 730,564
2018 1.7 $21,452 $36,763 $5,979 $4,159 $11,619 $9,585 13,883 164,235 84,818 740,678
2019 1.8 $21,447 $37,994 $6,058 $4,214 $12,068 $9,917 13,941 167,117 85,491 757,427
2020 1.8 $21,082 $39,002 $6,135 $4,267 $12,568 $10,283 14,144 169,469 79,113 771,388
CHP
2016 0.7 $1,787 $1,334 $452 $108 $763 $888 642 9,637 4,278 64,176
2017 0.7 $1,878 $1,387 $471 $111 $803 $934 669 10,029 4,452 66,786
2018 0.7 $1,974 $1,445 $489 $116 $846 $985 696 10,439 4,635 69,526
2019 0.7 $2,077 $1,514 $508 $120 $897 $1,043 725 10,871 4,827 72,403
2020 0.7 $706 $510 $169 $40 $306 $355 242 3,624 1,609 24,134
Small C&I DR
2016 0.7 $174 $120 $70 $50 $0 $0 1,290 1,290 0 0
2017 0.7 $176 $118 $70 $49 $0 $0 1,274 1,274 0 0
2018 0.7 $178 $117 $69 $48 $0 $0 1,258 1,258 0 0
2019 0.6 $179 $115 $68 $47 $0 $0 1,242 1,242 0 0
2020 0.6 $181 $113 $67 $47 $0 $0 1,226 1,226 0 0
Total $116,378 $191,790 $32,376 $21,633 $62,345 $52,606 73,917 869,365 423,057 4,018,433
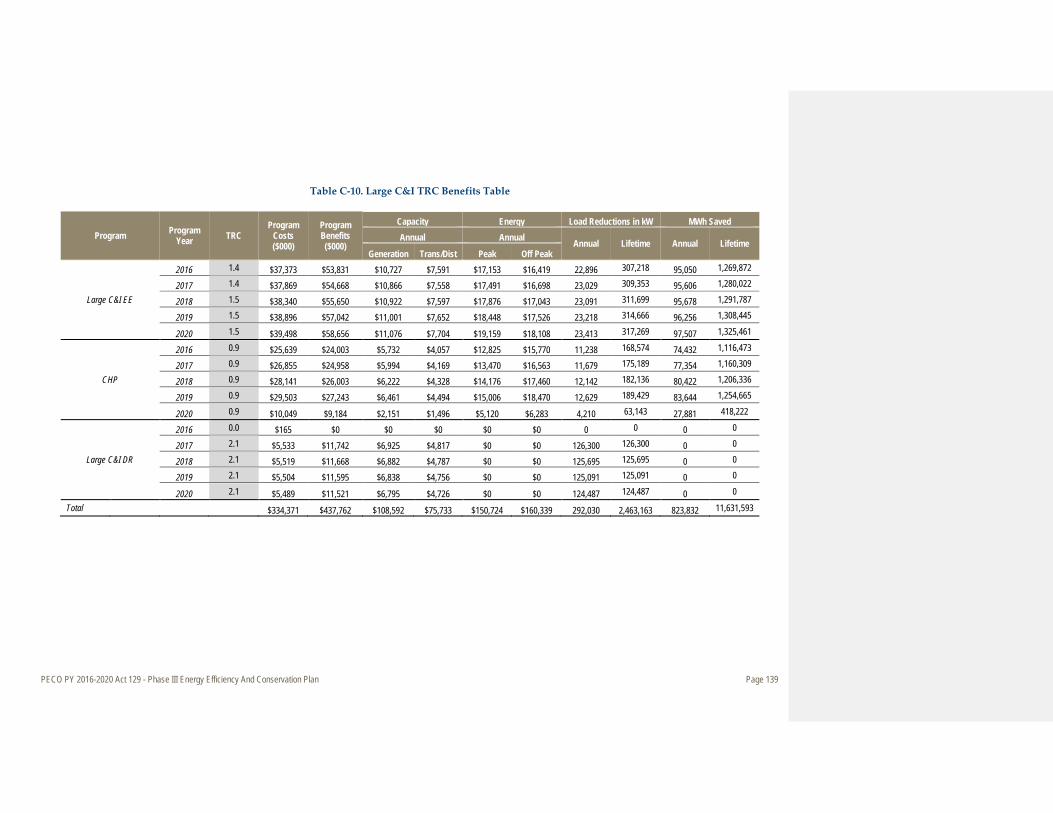
PECO PY 2016-2020 Act 129 - Phase III Energy Efficiency And Conservation Plan Page 139
Table C-10. Large C&I TRC Benefits Table
Program Program Year TRC
Program Costs ($000)
Program Benefits ($000)
Capacity Energy Load Reductions in kW MWh Saved Annual Annual Annual Lifetime Annual Lifetime
Generation Trans/Dist Peak Off Peak
Large C&I EE
2016 1.4 $37,373 $53,831 $10,727 $7,591 $17,153 $16,419 22,896 307,218 95,050 1,269,872
2017 1.4 $37,869 $54,668 $10,866 $7,558 $17,491 $16,698 23,029 309,353 95,606 1,280,022
2018 1.5 $38,340 $55,650 $10,922 $7,597 $17,876 $17,043 23,091 311,699 95,678 1,291,787
2019 1.5 $38,896 $57,042 $11,001 $7,652 $18,448 $17,526 23,218 314,666 96,256 1,308,445
2020 1.5 $39,498 $58,656 $11,076 $7,704 $19,159 $18,108 23,413 317,269 97,507 1,325,461
CHP
2016 0.9 $25,639 $24,003 $5,732 $4,057 $12,825 $15,770 11,238 168,574 74,432 1,116,473
2017 0.9 $26,855 $24,958 $5,994 $4,169 $13,470 $16,563 11,679 175,189 77,354 1,160,309
2018 0.9 $28,141 $26,003 $6,222 $4,328 $14,176 $17,460 12,142 182,136 80,422 1,206,336
2019 0.9 $29,503 $27,243 $6,461 $4,494 $15,006 $18,470 12,629 189,429 83,644 1,254,665
2020 0.9 $10,049 $9,184 $2,151 $1,496 $5,120 $6,283 4,210 63,143 27,881 418,222
Large C&I DR
2016 0.0 $165 $0 $0 $0 $0 $0 0 0 0 0
2017 2.1 $5,533 $11,742 $6,925 $4,817 $0 $0 126,300 126,300 0 0
2018 2.1 $5,519 $11,668 $6,882 $4,787 $0 $0 125,695 125,695 0 0
2019 2.1 $5,504 $11,595 $6,838 $4,756 $0 $0 125,091 125,091 0 0
2020 2.1 $5,489 $11,521 $6,795 $4,726 $0 $0 124,487 124,487 0 0
Total $334,371 $437,762 $108,592 $75,733 $150,724 $160,339 292,030 2,463,163 823,832 11,631,593
PECO PY 2016-2020 Act 129 - Phase III Energy Efficiency And Conservation Plan Page 140
Appendix D. Calculation Methods and Assumptions
D.1 Total Resource Cost Test Calculation Methods
Benefit-cost analysis of PECO’s portfolio of energy efficiency programs was conducted through the use of a comprehensive benefit-cost screening tool. The tool utilizes the most recent savings values and inputs from the Pennsylvania Technical Reference Manual (TRM) when available, supplemented by inputs gathered from other Technical Reference Manuals and industry literature as necessary for those measures that are not in the PA TRM. The tool uses inputs at the individual measure level (electric savings, incremental cost, participation levels, avoided costs, and energy costs) to calculate measure level savings and cost-effectiveness. The savings at the measure level are subtotaled for each program and sector and finally for the utility as a whole. At the program and sector level the model also calculates program level cost-effectiveness, program incentive and non-incentive costs, total program costs, and cost of conserved energy. The outputs are compared against target savings goals, spending caps, and cost-effectiveness limits. The Total Resource Cost (TRC) test was the primary test used to analyze the cost-effectiveness of PECO’s energy efficiency portfolio. The TRC test measures the total net resource expenditures of an energy efficiency program from the point of view of the utility and its ratepayers. Resource costs include changes in supply and participant costs. A program that passes this test (i.e., a ratio greater than 1) is viewed as beneficial to the utility and its customers because the savings in electric costs outweigh the costs incurred by the utility and its customers. Of particular note, per the PA PUC guidelines, measure lifetime is capped at 15 years, and non-electric benefits are excluded from the savings calculations (e.g. complementary natural gas savings from an electric efficiency measure are excluded from the analysis). The following section outlines Navigant’s methodology for conducting the cost-effectiveness analysis including an explanation of inputs and assumptions.
Incremental Measure costs Estimates of incremental measure costs were developed using the Pennsylvania TRM and a number of secondary sources including, DEER, Mid-Atlantic TRM, Efficiency Vermont TRM, other measure databases for other utilities and municipalities and databases of emerging technologies. Incentive Costs Incentive amounts for each measure were initially determined using industry standard benchmarks of portion of incremental measure cost covered by the incentive, typically in the range of 30%-50%, but at times up to 100%. These initial estimates were further refined based on careful consideration of the market for each measure or set of measures. Utility Administrative Costs Program administrative non-incentive costs were estimated for each program. Initial estimates were developed using industry standard benchmarks of admin costs per kWh saved and per incentive. These initial estimates were refined through discussion with implementation contractors, incorporating considerations of each programs’ unique market conditions. Common costs such as EM&V, technical support, and tracking system costs were estimated for the each program portfolio using industry standard benchmarks, supplemented by past experience. Measure Level Total Resource Cost Test Calculation = Measure Level TRC Benefits / Measure Level TRC Costs
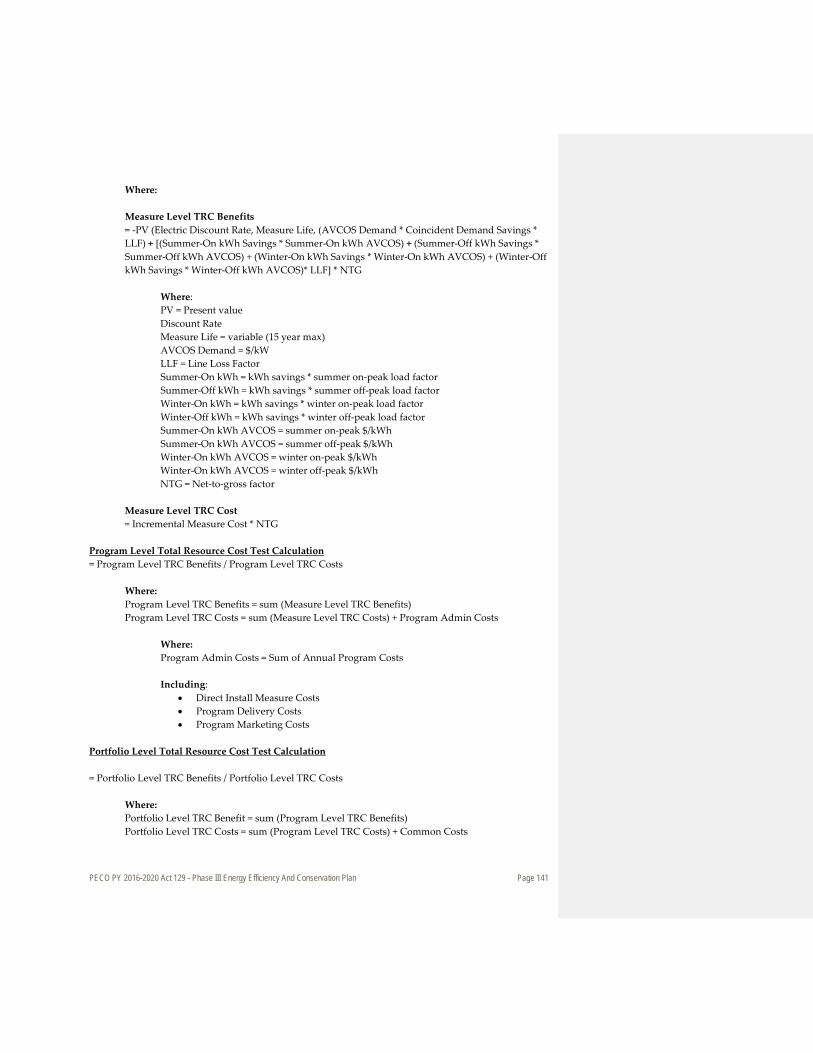
PECO PY 2016-2020 Act 129 - Phase III Energy Efficiency And Conservation Plan Page 141
Where:
Measure Level TRC Benefits = -PV (Electric Discount Rate, Measure Life, (AVCOS Demand * Coincident Demand Savings * LLF) + [(Summer-On kWh Savings * Summer-On kWh AVCOS) + (Summer-Off kWh Savings * Summer-Off kWh AVCOS) + (Winter-On kWh Savings * Winter-On kWh AVCOS) + (Winter-Off kWh Savings * Winter-Off kWh AVCOS)* LLF] * NTG
Where: PV = Present value Discount Rate Measure Life = variable (15 year max) AVCOS Demand = $/kW LLF = Line Loss Factor Summer-On kWh = kWh savings * summer on-peak load factor Summer-Off kWh = kWh savings * summer off-peak load factor Winter-On kWh = kWh savings * winter on-peak load factor Winter-Off kWh = kWh savings * winter off-peak load factor Summer-On kWh AVCOS = summer on-peak $/kWh Summer-On kWh AVCOS = summer off-peak $/kWh Winter-On kWh AVCOS = winter on-peak $/kWh Winter-On kWh AVCOS = winter off-peak $/kWh NTG = Net-to-gross factor
Measure Level TRC Cost = Incremental Measure Cost * NTG
Program Level Total Resource Cost Test Calculation = Program Level TRC Benefits / Program Level TRC Costs
Where: Program Level TRC Benefits = sum (Measure Level TRC Benefits) Program Level TRC Costs = sum (Measure Level TRC Costs) + Program Admin Costs
Where: Program Admin Costs = Sum of Annual Program Costs
Including:
• Direct Install Measure Costs • Program Delivery Costs • Program Marketing Costs
Portfolio Level Total Resource Cost Test Calculation = Portfolio Level TRC Benefits / Portfolio Level TRC Costs
Where: Portfolio Level TRC Benefit = sum (Program Level TRC Benefits) Portfolio Level TRC Costs = sum (Program Level TRC Costs) + Common Costs

PECO PY 2016-2020 Act 129 - Phase III Energy Efficiency And Conservation Plan Page 142
Where: Common Cost:
• General Ed & Awareness • Utility Administration • Technical Support • EM&V • Contingency

PECO PY 2016-2020 Act 129 - Phase III Energy Efficiency And Conservation Plan Page 143
D.2 Seasonal Avoided Costs for Electricity
Table D-1. Avoided Costs for Electricity ($/kWh)
$/kW $/kWh
Year Demand Summer On
Summer Off
Winter On
Winter Off
PY 2016 $92.66 $0.039 $0.026 $0.047 $0.036 PY 2017 $92.97 $0.042 $0.027 $0.045 $0.034 PY 2018 $92.83 $0.041 $0.026 $0.043 $0.034 PY 2019 $92.69 $0.040 $0.026 $0.042 $0.034 PY 2020 $92.55 $0.040 $0.026 $0.042 $0.034 PY 2021 $92.41 $0.042 $0.026 $0.043 $0.035 PY 2022 $92.27 $0.043 $0.027 $0.045 $0.036 PY 2023 $92.13 $0.044 $0.028 $0.046 $0.037 PY 2024 $92.00 $0.046 $0.029 $0.048 $0.038 PY 2025 $91.86 $0.048 $0.030 $0.050 $0.039 PY 2026 $91.72 $0.049 $0.031 $0.052 $0.041 PY 2027 $91.58 $0.051 $0.032 $0.053 $0.042 PY 2028 $91.45 $0.052 $0.032 $0.054 $0.042 PY 2029 $91.31 $0.052 $0.032 $0.053 $0.042 PY 2030 $91.17 $0.052 $0.032 $0.053 $0.042 PY 2031 $91.03 $0.052 $0.032 $0.054 $0.042 PY 2032 $90.90 $0.053 $0.033 $0.055 $0.043 PY 2033 $90.76 $0.054 $0.033 $0.057 $0.044 PY 2034 $90.63 $0.056 $0.034 $0.058 $0.045
PY 2035 $90.49 $0.058 $0.035 $0.061 $0.047
Source: Updated PECO avoided cost estimates for Phase III.
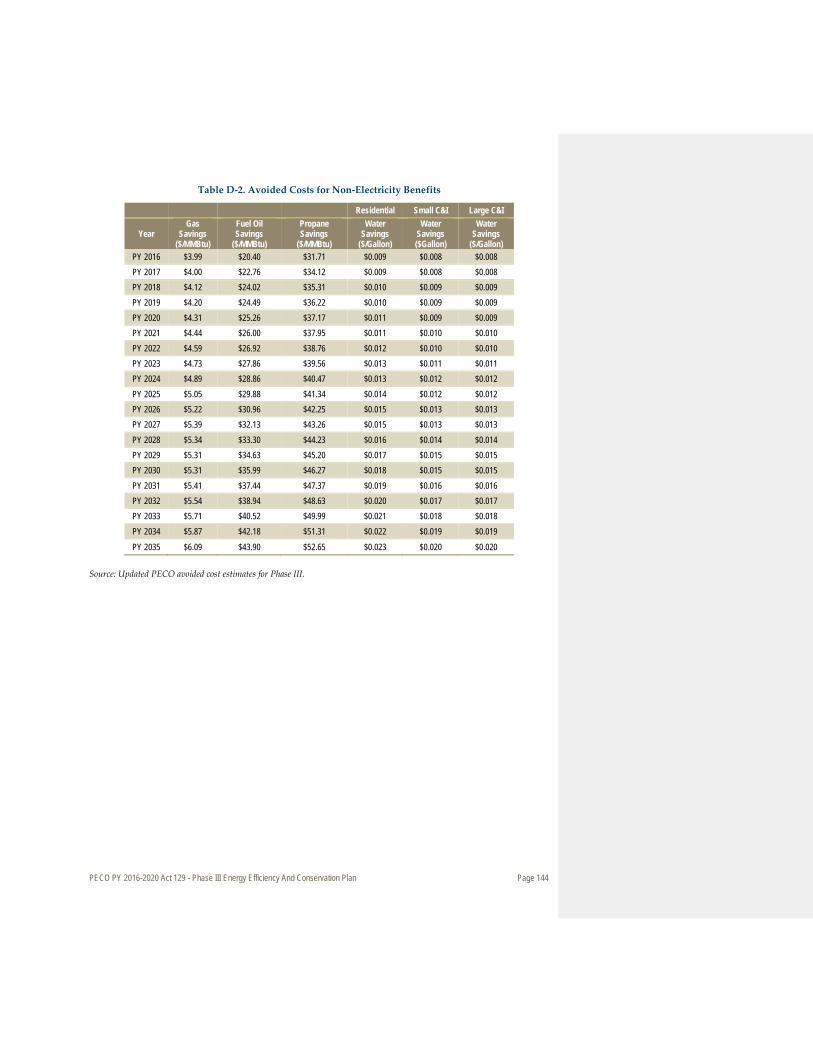
PECO PY 2016-2020 Act 129 - Phase III Energy Efficiency And Conservation Plan Page 144
Table D-2. Avoided Costs for Non-Electricity Benefits
Residential Small C&I Large C&I
Year Gas
Savings ($/MMBtu)
Fuel Oil Savings
($/MMBtu)
Propane Savings
($/MMBtu)
Water Savings
($/Gallon)
Water Savings ($Gallon)
Water Savings
($/Gallon) PY 2016 $3.99 $20.40 $31.71 $0.009 $0.008 $0.008 PY 2017 $4.00 $22.76 $34.12 $0.009 $0.008 $0.008 PY 2018 $4.12 $24.02 $35.31 $0.010 $0.009 $0.009 PY 2019 $4.20 $24.49 $36.22 $0.010 $0.009 $0.009 PY 2020 $4.31 $25.26 $37.17 $0.011 $0.009 $0.009 PY 2021 $4.44 $26.00 $37.95 $0.011 $0.010 $0.010 PY 2022 $4.59 $26.92 $38.76 $0.012 $0.010 $0.010 PY 2023 $4.73 $27.86 $39.56 $0.013 $0.011 $0.011 PY 2024 $4.89 $28.86 $40.47 $0.013 $0.012 $0.012 PY 2025 $5.05 $29.88 $41.34 $0.014 $0.012 $0.012 PY 2026 $5.22 $30.96 $42.25 $0.015 $0.013 $0.013 PY 2027 $5.39 $32.13 $43.26 $0.015 $0.013 $0.013 PY 2028 $5.34 $33.30 $44.23 $0.016 $0.014 $0.014 PY 2029 $5.31 $34.63 $45.20 $0.017 $0.015 $0.015 PY 2030 $5.31 $35.99 $46.27 $0.018 $0.015 $0.015 PY 2031 $5.41 $37.44 $47.37 $0.019 $0.016 $0.016 PY 2032 $5.54 $38.94 $48.63 $0.020 $0.017 $0.017 PY 2033 $5.71 $40.52 $49.99 $0.021 $0.018 $0.018 PY 2034 $5.87 $42.18 $51.31 $0.022 $0.019 $0.019
PY 2035 $6.09 $43.90 $52.65 $0.023 $0.020 $0.020 Source: Updated PECO avoided cost estimates for Phase III.
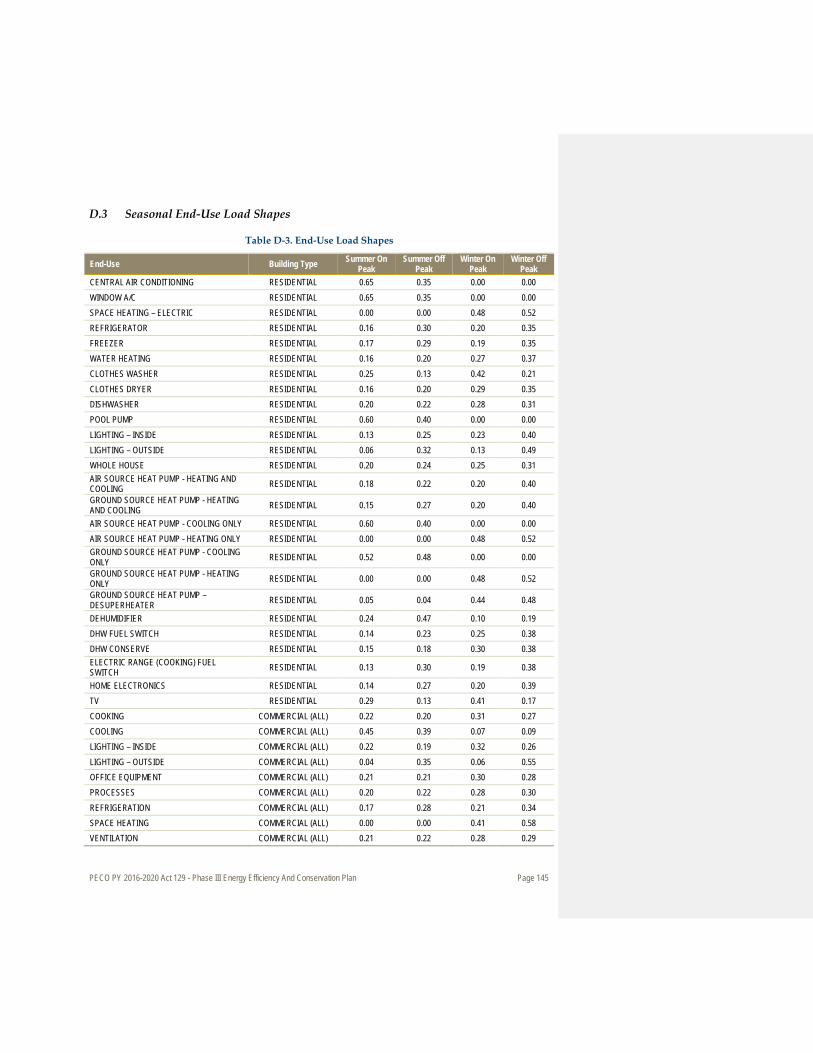
PECO PY 2016-2020 Act 129 - Phase III Energy Efficiency And Conservation Plan Page 145
D.3 Seasonal End-Use Load Shapes
Table D-3. End-Use Load Shapes
End-Use Building Type Summer On Peak
Summer Off Peak
Winter On Peak
Winter Off Peak
CENTRAL AIR CONDITIONING RESIDENTIAL 0.65 0.35 0.00 0.00 WINDOW A/C RESIDENTIAL 0.65 0.35 0.00 0.00 SPACE HEATING – ELECTRIC RESIDENTIAL 0.00 0.00 0.48 0.52 REFRIGERATOR RESIDENTIAL 0.16 0.30 0.20 0.35 FREEZER RESIDENTIAL 0.17 0.29 0.19 0.35 WATER HEATING RESIDENTIAL 0.16 0.20 0.27 0.37 CLOTHES WASHER RESIDENTIAL 0.25 0.13 0.42 0.21 CLOTHES DRYER RESIDENTIAL 0.16 0.20 0.29 0.35 DISHWASHER RESIDENTIAL 0.20 0.22 0.28 0.31 POOL PUMP RESIDENTIAL 0.60 0.40 0.00 0.00 LIGHTING – INSIDE RESIDENTIAL 0.13 0.25 0.23 0.40 LIGHTING – OUTSIDE RESIDENTIAL 0.06 0.32 0.13 0.49 WHOLE HOUSE RESIDENTIAL 0.20 0.24 0.25 0.31 AIR SOURCE HEAT PUMP - HEATING AND COOLING RESIDENTIAL 0.18 0.22 0.20 0.40
GROUND SOURCE HEAT PUMP - HEATING AND COOLING RESIDENTIAL 0.15 0.27 0.20 0.40
AIR SOURCE HEAT PUMP - COOLING ONLY RESIDENTIAL 0.60 0.40 0.00 0.00 AIR SOURCE HEAT PUMP - HEATING ONLY RESIDENTIAL 0.00 0.00 0.48 0.52 GROUND SOURCE HEAT PUMP - COOLING ONLY RESIDENTIAL 0.52 0.48 0.00 0.00
GROUND SOURCE HEAT PUMP - HEATING ONLY RESIDENTIAL 0.00 0.00 0.48 0.52
GROUND SOURCE HEAT PUMP – DESUPERHEATER RESIDENTIAL 0.05 0.04 0.44 0.48
DEHUMIDIFIER RESIDENTIAL 0.24 0.47 0.10 0.19 DHW FUEL SWITCH RESIDENTIAL 0.14 0.23 0.25 0.38 DHW CONSERVE RESIDENTIAL 0.15 0.18 0.30 0.38 ELECTRIC RANGE (COOKING) FUEL SWITCH RESIDENTIAL 0.13 0.30 0.19 0.38
HOME ELECTRONICS RESIDENTIAL 0.14 0.27 0.20 0.39 TV RESIDENTIAL 0.29 0.13 0.41 0.17 COOKING COMMERCIAL (ALL) 0.22 0.20 0.31 0.27 COOLING COMMERCIAL (ALL) 0.45 0.39 0.07 0.09 LIGHTING – INSIDE COMMERCIAL (ALL) 0.22 0.19 0.32 0.26 LIGHTING – OUTSIDE COMMERCIAL (ALL) 0.04 0.35 0.06 0.55 OFFICE EQUIPMENT COMMERCIAL (ALL) 0.21 0.21 0.30 0.28 PROCESSES COMMERCIAL (ALL) 0.20 0.22 0.28 0.30 REFRIGERATION COMMERCIAL (ALL) 0.17 0.28 0.21 0.34 SPACE HEATING COMMERCIAL (ALL) 0.00 0.00 0.41 0.58 VENTILATION COMMERCIAL (ALL) 0.21 0.22 0.28 0.29

PECO PY 2016-2020 Act 129 - Phase III Energy Efficiency And Conservation Plan Page 146
End-Use Building Type Summer On Peak
Summer Off Peak
Winter On Peak
Winter Off Peak
WATER HEATING OTHER COMMERCIAL (MISC) 0.19 0.16 0.37 0.27
ALL COMMERCIAL END-USES COMMERCIAL (ALL) 0.23 0.23 0.27 0.27 VENDING MACHINE CONTROLS COMMERCIAL 0.04 0.33 0.06 0.57 COMPRESSED AIR - 1-SHIFT (8/5) COMMERCIAL 0.30 0.12 0.41 0.17 COMPRESSED AIR - 2-SHIFT (16/5) COMMERCIAL 0.28 0.14 0.38 0.20 COMPRESSED AIR - 3-SHIFT (24/5) COMMERCIAL 0.20 0.22 0.27 0.31 COMPRESSED AIR- 4-SHIFT (24/7) COMMERCIAL 0.14 0.28 0.20 0.39 COMPRESSED AIR GENERAL COMMERCIAL 0.23 0.19 0.32 0.27 VFD SUPPLY FANS <10 HP COMMERCIAL 0.22 0.23 0.31 0.24 VFD RETURN FANS <10 HP COMMERCIAL 0.22 0.23 0.31 0.24 VFD EXHAUST FANS <10 HP COMMERCIAL 0.15 0.27 0.27 0.31 VFD BOILER FEEDWATER PUMPS <10 HP COMMERCIAL 0.05 0.08 0.33 0.54 VFD CHILLED WATER PUMPS <10 HP COMMERCIAL 0.31 0.52 0.09 0.08 VFD BOILER CIRCULATION PUMPS <10 HP COMMERCIAL 0.05 0.08 0.33 0.54 VFD HVAC PUMP COMMERCIAL 0.17 0.23 0.27 0.33 REFRIGERATION ECONOMIZER COMMERCIAL 0.04 0.09 0.27 0.60 EVAP FAN CONTROL COMMERCIAL 0.12 0.28 0.18 0.42 COMPUTER OFFICE COMMERCIAL 0.13 0.29 0.18 0.40 NIGHT COVERS FOR REFRIGERATION COMMERCIAL 0.03 0.39 0.04 0.55 DOOR HEATER CONTROL COMMERCIAL 0.04 0.09 0.29 0.58 FLOATING HEAD PRESSURE CONTROL COMMERCIAL 0.12 0.27 0.21 0.41 STANDBY LOSSES - COMMERCIAL OFFICE COMMERCIAL 0.03 0.39 0.04 0.54 HVAC ECONOMIZER COMMERCIAL 0.18 0.40 0.15 0.27 DATA CENTER COMMERCIAL 0.14 0.24 0.21 0.41 LIGHTING DAYLIGHT CONTROL OTHER 0.24 0.18 0.33 0.26 STAIRWAY/GARAGE LIGHTING CONTROL COMMERCIAL 0.00 0.42 0.00 0.58 TIME CLOCK CONTROL COMMERCIAL 0.00 0.42 0.00 0.58 HVAC GENERAL OR EMS COMMERCIAL 0.16 0.32 0.18 0.35 HOTEL OCCUPANCY CONTROL COMMERCIAL 0.11 0.27 0.22 0.40 AIR SOURCE HEAT PUMP COMMERCIAL 0.18 0.19 0.19 0.44 GEO THERMAL HEAT PUMP COMMERCIAL 0.18 0.19 0.19 0.44 WATER SOURCE HEAT PUMP COMMERCIAL 0.24 0.23 0.17 0.36 GENERIC INDUSTRIAL PROCESS OTHER 0.28 0.14 0.38 0.20 PHOTOVOLTAIC SOLAR POWER OTHER 0.24 0.18 0.33 0.26 TRAFFIC LIGHTS OTHER 0.15 0.27 0.21 0.38 EXIT SIGNS OTHER 0.15 0.27 0.21 0.38 Kit-B: LF-SH, 1-13W, 1-20W, LED NL OTHER 0.16 0.21 0.29 0.34 Kit-C: 2-13W, 1-20W CFLs, FW OTHER 0.22 0.12 0.38 0.29 Kit-D: 2-13W, 1-20W, 1-23W, 2-LED NL, 1-SS OTHER 0.28 0.14 0.40 0.19 SEP.1: 5-13W CFLs, 2-Lime Lights, FW OTHER 0.19 0.10 0.41 0.29 SEP.2&3: 3-13W, 1-20W, 1-23W, 2-Lime lite, FW OTHER 0.20 0.11 0.41 0.28
FLAT (8760) OTHER 0.15 0.27 0.21 0.38

PECO PY 2016-2020 Act 129 - Phase III Energy Efficiency And Conservation Plan Page 147
Source: Loadshapes sourced from several sources depending on availability of information. Primary source, for eligible measures was the PA TRM 2011, Table 2-1. Other necessary loadshape sources were modified to conform with PECO’s climate profile referencing Efficiency Vermont TRM, CA CEUS Statewide Profile, and Ontario Power Authority.
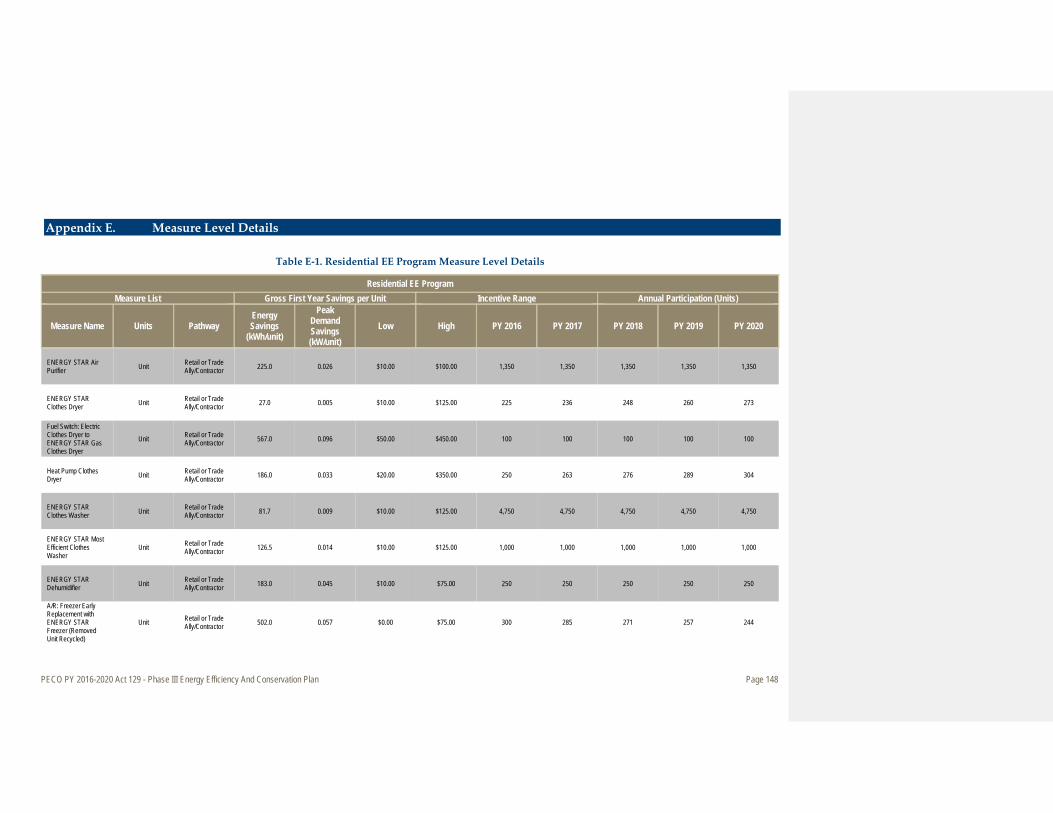
PECO PY 2016-2020 Act 129 - Phase III Energy Efficiency And Conservation Plan Page 148
Appendix E. Measure Level Details
Table E-1. Residential EE Program Measure Level Details
Residential EE Program Measure List Gross First Year Savings per Unit Incentive Range Annual Participation (Units)
Measure Name Units Pathway Energy Savings
(kWh/unit)
Peak Demand Savings (kW/unit)
Low High PY 2016 PY 2017 PY 2018 PY 2019 PY 2020
ENERGY STAR Air Purifier Unit Retail or Trade
Ally/Contractor 225.0 0.026 $10.00 $100.00 1,350 1,350 1,350 1,350 1,350
ENERGY STAR Clothes Dryer Unit Retail or Trade
Ally/Contractor 27.0 0.005 $10.00 $125.00 225 236 248 260 273
Fuel Switch: Electric Clothes Dryer to ENERGY STAR Gas Clothes Dryer
Unit Retail or Trade Ally/Contractor 567.0 0.096 $50.00 $450.00 100 100 100 100 100
Heat Pump Clothes Dryer Unit Retail or Trade
Ally/Contractor 186.0 0.033 $20.00 $350.00 250 263 276 289 304
ENERGY STAR Clothes Washer Unit Retail or Trade
Ally/Contractor 81.7 0.009 $10.00 $125.00 4,750 4,750 4,750 4,750 4,750
ENERGY STAR Most Efficient Clothes Washer
Unit Retail or Trade Ally/Contractor 126.5 0.014 $10.00 $125.00 1,000 1,000 1,000 1,000 1,000
ENERGY STAR Dehumidifier Unit Retail or Trade
Ally/Contractor 183.0 0.045 $10.00 $75.00 250 250 250 250 250
A/R: Freezer Early Replacement with ENERGY STAR Freezer (Removed Unit Recycled)
Unit Retail or Trade Ally/Contractor 502.0 0.057 $0.00 $75.00 300 285 271 257 244

PECO PY 2016-2020 Act 129 - Phase III Energy Efficiency And Conservation Plan Page 149
A/R: Freezer Early Replacement with non-ENERGY STAR Freezer (Removed Unit Recycled)
Unit Retail or Trade Ally/Contractor 450.0 0.051 $0.00 $75.00 75 71 68 64 61
A/R: Freezer Recycling Unit Retail or Trade Ally/Contractor 969.0 0.110 $0.00 $75.00 2,550 2,423 2,301 2,186 2,077
ENERGY STAR Freezer Unit Retail or Trade
Ally/Contractor 24.5 0.042 $10.00 $75.00 1,300 1,300 1,300 1,300 1,300
ENERGY STAR Most Efficient Freezer Unit Retail or Trade
Ally/Contractor 35.0 0.057 $10.00 $75.00 220 220 220 220 220
A/R: Refrigerator Early Replacement with ENERGY STAR Refrigerator (Removed Unit Recycled)
Unit Retail or Trade Ally/Contractor 549.0 0.063 $0.00 $75.00 1,400 1,330 1,264 1,200 1,140
A/R: Refrigerator Early Replacement with non-ENERGY STAR Refrigerator (Removed Unit Recycled)
Unit Retail or Trade Ally/Contractor 433.0 0.050 $0.00 $75.00 650 618 587 557 529
A/R: Refrigerator Recycling Unit Retail or Trade
Ally/Contractor 1016.0 0.117 $0.00 $75.00 13,000 12,350 11,733 11,146 10,589
ENERGY STAR Most Efficient Refrigerator Unit Retail or Trade
Ally/Contractor 91.0 0.010 $10.00 $125.00 1,500 1,500 1,500 1,500 1,500
ENERGY STAR Refrigerator Unit Retail or Trade
Ally/Contractor 38.5 0.004 $10.00 $75.00 5,600 5,600 5,600 5,600 5,600
A/R: Room AC Recycling Unit Retail or Trade
Ally/Contractor 159.0 0.260 $0.00 $50.00 500 475 451 429 407
ENERGY STAR Room Air Conditioner Unit Retail or Trade
Ally/Contractor 12.3 0.020 $10.00 $50.00 1,600 1,600 1,600 1,600 1,600
Fuel Switch: Electric Range to Gas Range Unit Retail or Trade
Ally/Contractor 261.0 0.000 $25.00 $350.00 50 50 50 50 50

PECO PY 2016-2020 Act 129 - Phase III Energy Efficiency And Conservation Plan Page 150
Comprehensive Home Energy Information Participant Direct Action 275.0 0.036 $0.00 $0.00 15,000 25,000 35,000 35,000 35,000
Home Energy Reports Participant Direct Action 121.1 0.016 $0.00 $0.00 181,467 201,321 211,189 215,070 193,563
Real Time AMI data portals Participant Direct Action 275.0 0.036 $0.00 $0.00 2,000 3,900 5,705 7,420 9,049
Advanced Power Strips Power Strip Direct Action 255.8 0.026 $0.00 $0.00 650 650 650 650 650
Smart Strip Power Strip Direct Action 61.1 0.007 $0.00 $0.00 250 250 250 250 250
Custom Unit Retail or Trade Ally/Contractor 250.0 0.025 $5.00 $5,000.00 250 250 250 250 250
Water Heater Temperature Setback
Water Heater Controlled Direct Action 165.9 0.013 $0.00 $0.00 500 500 500 500 500
Water Heater Timer Water Heater Controlled Direct Action 97.0 0.000 $0.00 $0.00 100 100 100 100 100
Insulation/Wrap for Hot Water Pipe
Foot of Insulated Pipe Direct Action 9.4 0.001 $0.00 $0.00 28,000 28,000 28,000 28,000 28,000
Insulation/Wrap for Water Heater Storage Tank
Insulated Water Heater
Retail or Trade Ally/Contractor 158.1 0.018 $0.00 $25.00 650 650 650 650 650
ENERGY STAR Heat Pump Water Heater Water Heater Retail or Trade
Ally/Contractor 1519.0 0.123 $75.00 $550.00 200 200 200 200 200
Fuel Switch: Electric Water Heater to ENERGY STAR Gas Water Heater
Water Heater Retail or Trade Ally/Contractor 3006.6 0.242 $150.00 $750.00 40 40 40 40 40
GSHP Desuperheater Water Heater Retail or Trade Ally/Contractor 534.0 0.043 $50.00 $450.00 100 100 100 100 100
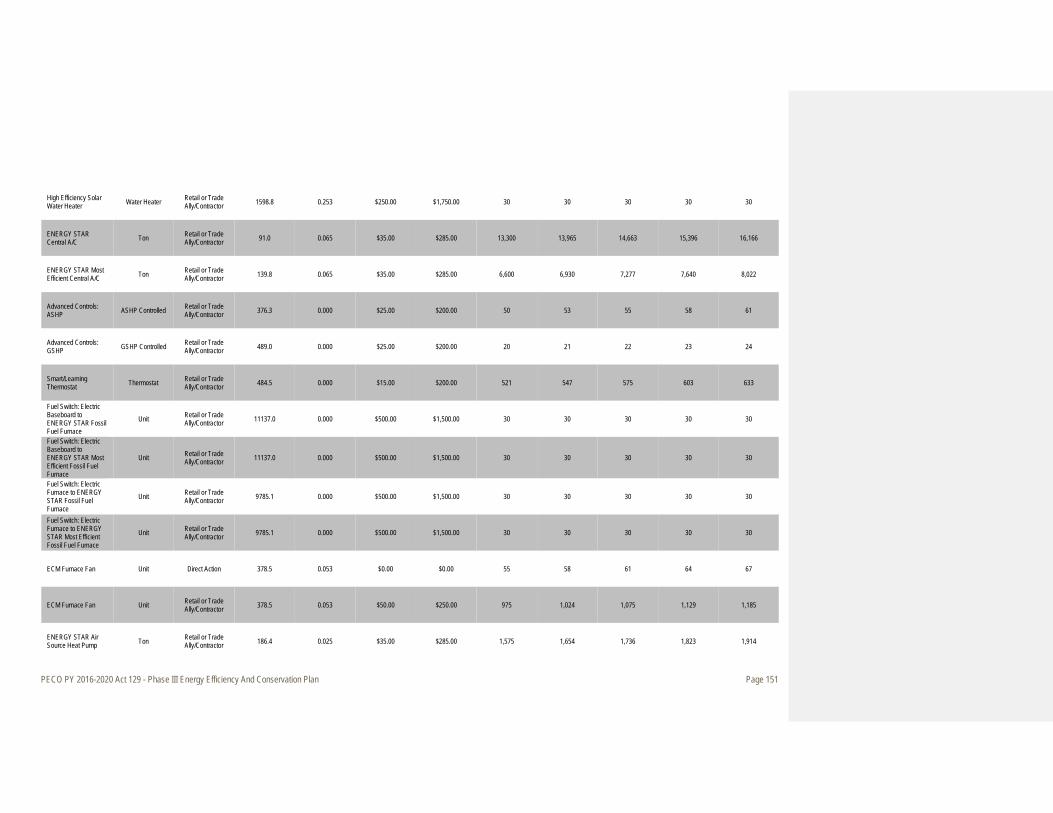
PECO PY 2016-2020 Act 129 - Phase III Energy Efficiency And Conservation Plan Page 151
High Efficiency Solar Water Heater Water Heater Retail or Trade
Ally/Contractor 1598.8 0.253 $250.00 $1,750.00 30 30 30 30 30
ENERGY STAR Central A/C Ton Retail or Trade
Ally/Contractor 91.0 0.065 $35.00 $285.00 13,300 13,965 14,663 15,396 16,166
ENERGY STAR Most Efficient Central A/C Ton Retail or Trade
Ally/Contractor 139.8 0.065 $35.00 $285.00 6,600 6,930 7,277 7,640 8,022
Advanced Controls: ASHP ASHP Controlled Retail or Trade
Ally/Contractor 376.3 0.000 $25.00 $200.00 50 53 55 58 61
Advanced Controls: GSHP GSHP Controlled Retail or Trade
Ally/Contractor 489.0 0.000 $25.00 $200.00 20 21 22 23 24
Smart/Learning Thermostat Thermostat Retail or Trade
Ally/Contractor 484.5 0.000 $15.00 $200.00 521 547 575 603 633
Fuel Switch: Electric Baseboard to ENERGY STAR Fossil Fuel Furnace
Unit Retail or Trade Ally/Contractor 11137.0 0.000 $500.00 $1,500.00 30 30 30 30 30
Fuel Switch: Electric Baseboard to ENERGY STAR Most Efficient Fossil Fuel Furnace
Unit Retail or Trade Ally/Contractor 11137.0 0.000 $500.00 $1,500.00 30 30 30 30 30
Fuel Switch: Electric Furnace to ENERGY STAR Fossil Fuel Furnace
Unit Retail or Trade Ally/Contractor 9785.1 0.000 $500.00 $1,500.00 30 30 30 30 30
Fuel Switch: Electric Furnace to ENERGY STAR Most Efficient Fossil Fuel Furnace
Unit Retail or Trade Ally/Contractor 9785.1 0.000 $500.00 $1,500.00 30 30 30 30 30
ECM Furnace Fan Unit Direct Action 378.5 0.053 $0.00 $0.00 55 58 61 64 67
ECM Furnace Fan Unit Retail or Trade Ally/Contractor 378.5 0.053 $50.00 $250.00 975 1,024 1,075 1,129 1,185
ENERGY STAR Air Source Heat Pump Ton Retail or Trade
Ally/Contractor 186.4 0.025 $35.00 $285.00 1,575 1,654 1,736 1,823 1,914
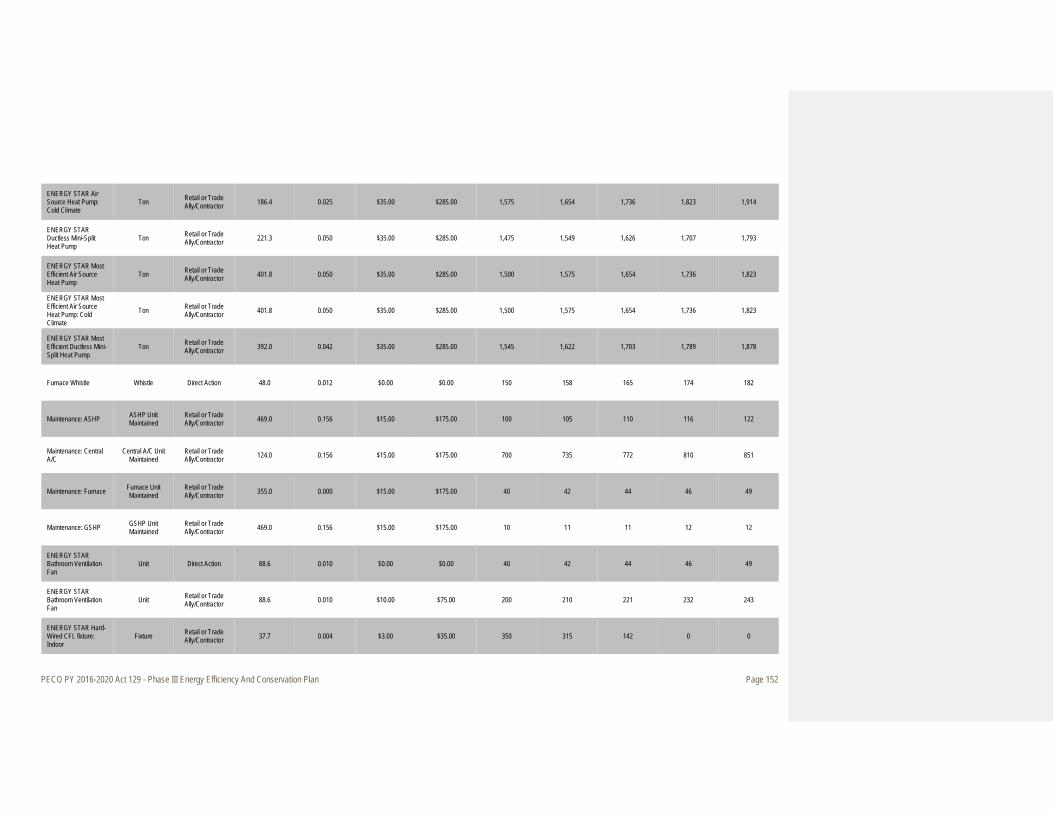
PECO PY 2016-2020 Act 129 - Phase III Energy Efficiency And Conservation Plan Page 152
ENERGY STAR Air Source Heat Pump: Cold Climate
Ton Retail or Trade Ally/Contractor 186.4 0.025 $35.00 $285.00 1,575 1,654 1,736 1,823 1,914
ENERGY STAR Ductless Mini-Split Heat Pump
Ton Retail or Trade Ally/Contractor 221.3 0.050 $35.00 $285.00 1,475 1,549 1,626 1,707 1,793
ENERGY STAR Most Efficient Air Source Heat Pump
Ton Retail or Trade Ally/Contractor 401.8 0.050 $35.00 $285.00 1,500 1,575 1,654 1,736 1,823
ENERGY STAR Most Efficient Air Source Heat Pump: Cold Climate
Ton Retail or Trade Ally/Contractor 401.8 0.050 $35.00 $285.00 1,500 1,575 1,654 1,736 1,823
ENERGY STAR Most Efficient Ductless Mini-Split Heat Pump
Ton Retail or Trade Ally/Contractor 392.0 0.042 $35.00 $285.00 1,545 1,622 1,703 1,789 1,878
Furnace Whistle Whistle Direct Action 48.0 0.012 $0.00 $0.00 150 158 165 174 182
Maintenance: ASHP ASHP Unit Maintained
Retail or Trade Ally/Contractor 469.0 0.156 $15.00 $175.00 100 105 110 116 122
Maintenance: Central A/C
Central A/C Unit Maintained
Retail or Trade Ally/Contractor 124.0 0.156 $15.00 $175.00 700 735 772 810 851
Maintenance: Furnace Furnace Unit Maintained
Retail or Trade Ally/Contractor 355.0 0.000 $15.00 $175.00 40 42 44 46 49
Maintenance: GSHP GSHP Unit Maintained
Retail or Trade Ally/Contractor 469.0 0.156 $15.00 $175.00 10 11 11 12 12
ENERGY STAR Bathroom Ventilation Fan
Unit Direct Action 88.6 0.010 $0.00 $0.00 40 42 44 46 49
ENERGY STAR Bathroom Ventilation Fan
Unit Retail or Trade Ally/Contractor 88.6 0.010 $10.00 $75.00 200 210 221 232 243
ENERGY STAR Hard-Wired CFL fixture: Indoor
Fixture Retail or Trade Ally/Contractor 37.7 0.004 $3.00 $35.00 350 315 142 0 0

PECO PY 2016-2020 Act 129 - Phase III Energy Efficiency And Conservation Plan Page 153
ENERGY STAR Hard-Wired CFL fixture: Outdoor
Fixture Retail or Trade Ally/Contractor 72.4 0.018 $3.00 $35.00 350 315 142 0 0
ENERGY STAR Screw-in CFL Bulb (Standard: Non-Dimmable)
Bulb Retail or Trade Ally/Contractor 34.6 0.004 $0.00 $2.50 586,480 527,832 237,524 0 0
ENERGY STAR Integral LED fixture: Indoor
Fixture Retail or Trade Ally/Contractor 49.1 0.005 $3.00 $35.00 1,400 1,400 1,505 1,645 1,645
ENERGY STAR Integral LED fixture: Indoor Recessed Downlight Retrofit Module
Fixture Retail or Trade Ally/Contractor 55.0 0.007 $0.00 $35.00 1,140 1,140 1,140 1,140 1,140
ENERGY STAR Integral LED fixture: Outdoor
Fixture Retail or Trade Ally/Contractor 72.4 0.000 $3.00 $35.00 1,000 1,000 1,110 1,260 1,260
ENERGY STAR Integral LED fixture: Outdoor Recessed Downlight Retrofit Module
Fixture Retail or Trade Ally/Contractor 55.0 0.000 $0.00 $35.00 1,855 1,855 1,855 1,855 1,855
ENERGY STAR Screw-in LED Bulb (Decorative: Globe)
Bulb Direct Action 47.5 0.006 $0.00 $0.00 1,300 1,365 1,433 1,505 1,580
ENERGY STAR Screw-in LED Bulb (Decorative: Globe)
Bulb Retail or Trade Ally/Contractor 47.5 0.006 $0.25 $7.50 86,250 90,563 95,091 99,845 104,837
ENERGY STAR Screw-in LED Bulb (Decorative: Globe; Smart Bulb)
Bulb Retail or Trade Ally/Contractor 47.5 0.006 $0.00 $10.00 650 683 717 752 790
ENERGY STAR Screw-in LED Bulb (Decorative: non-globe (e.g., candelabra))
Bulb Retail or Trade Ally/Contractor 34.2 0.004 $0.00 $7.50 77,625 81,506 85,582 89,861 94,354
ENERGY STAR Screw-in LED Bulb (Decorative: non-globe (e.g., candelabra); Smart Bulb)
Bulb Retail or Trade Ally/Contractor 34.2 0.004 $0.00 $10.00 650 683 717 752 790
ENERGY STAR Screw-in LED Bulb (Directional/Reflector)
Bulb Retail or Trade Ally/Contractor 40.8 0.005 $0.00 $7.50 176,760 185,598 194,878 204,622 214,853

PECO PY 2016-2020 Act 129 - Phase III Energy Efficiency And Conservation Plan Page 154
ENERGY STAR Screw-in LED Bulb (Directional/Reflector; Smart Bulb)
Bulb Retail or Trade Ally/Contractor 40.8 0.005 $0.00 $10.00 3,000 3,150 3,308 3,473 3,647
ENERGY STAR Screw-in LED Bulb (Standard)
Bulb Retail or Trade Ally/Contractor 43.2 0.005 $0.00 $7.50 266,500 293,150 440,465 604,787 665,265
ENERGY STAR Screw-in LED Bulb (Standard: 3-Way)
Bulb Retail or Trade Ally/Contractor 43.2 0.005 $0.25 $7.50 2,000 2,200 2,420 2,662 2,928
ENERGY STAR Screw-in LED Bulb (Standard: Smart Bulb)
Bulb Retail or Trade Ally/Contractor 43.2 0.005 $0.00 $10.00 13,000 14,300 15,730 17,303 19,033
Linear LED: New Fixture Fixture Retail or Trade
Ally/Contractor 71.3 0.007 $3.00 $35.00 1,800 1,800 1,800 1,800 1,800
Linear LED: Replacement Lamp Lamp Retail or Trade
Ally/Contractor 38.1 0.004 $0.00 $15.00 3,000 3,000 3,000 3,000 3,000
Linear LED: Retrofit Kit Kit Retail or Trade Ally/Contractor 71.3 0.007 $3.00 $35.00 1,800 1,800 1,800 1,800 1,800
Screw-in LED Bulb (Standard; EUL = 10,000 Hr)
Bulb Retail or Trade Ally/Contractor 43.2 0.005 $0.00 $5.00 136,500 177,450 230,685 299,891 389,858
Linear Fluorescent Lamp: HP T8 Lamp Lamp Direct Action 58.0 0.011 $0.00 $0.00 300 315 331 347 365
Linear Fluorescent Lamp: RW T8 Lamp Lamp Direct Action 20.8 0.004 $0.00 $0.00 300 315 331 347 365
Electroluminescent Nightlight Nightlight Direct Action 29.5 0.000 $0.00 $0.00 550 550 550 550 550
LED Nightlight Nightlight Direct Action 25.5 0.000 $0.00 $0.00 550 550 550 550 550
Variable Speed Pool Pump Pump Retail or Trade
Ally/Contractor 1409.1 0.417 $25.00 $300.00 200 200 200 200 200
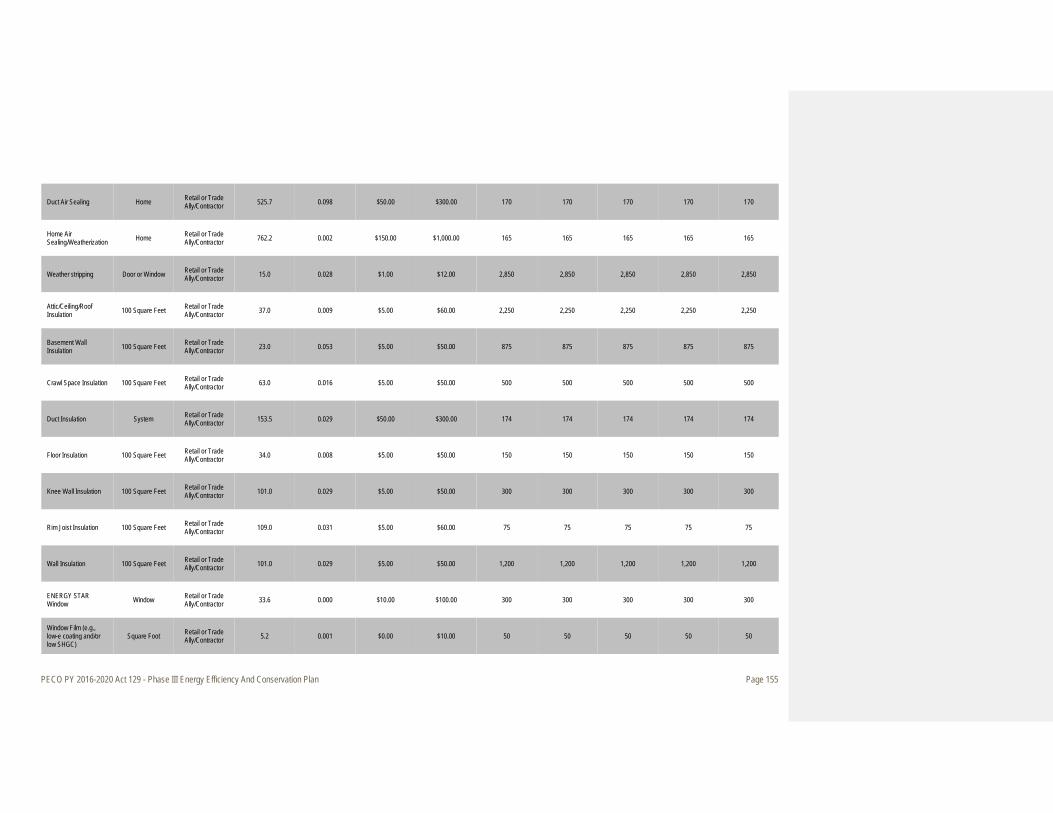
PECO PY 2016-2020 Act 129 - Phase III Energy Efficiency And Conservation Plan Page 155
Duct Air Sealing Home Retail or Trade Ally/Contractor 525.7 0.098 $50.00 $300.00 170 170 170 170 170
Home Air Sealing/Weatherization Home Retail or Trade
Ally/Contractor 762.2 0.002 $150.00 $1,000.00 165 165 165 165 165
Weather stripping Door or Window Retail or Trade Ally/Contractor 15.0 0.028 $1.00 $12.00 2,850 2,850 2,850 2,850 2,850
Attic/Ceiling/Roof Insulation 100 Square Feet Retail or Trade
Ally/Contractor 37.0 0.009 $5.00 $60.00 2,250 2,250 2,250 2,250 2,250
Basement Wall Insulation 100 Square Feet Retail or Trade
Ally/Contractor 23.0 0.053 $5.00 $50.00 875 875 875 875 875
Crawl Space Insulation 100 Square Feet Retail or Trade Ally/Contractor 63.0 0.016 $5.00 $50.00 500 500 500 500 500
Duct Insulation System Retail or Trade Ally/Contractor 153.5 0.029 $50.00 $300.00 174 174 174 174 174
Floor Insulation 100 Square Feet Retail or Trade Ally/Contractor 34.0 0.008 $5.00 $50.00 150 150 150 150 150
Knee Wall Insulation 100 Square Feet Retail or Trade Ally/Contractor 101.0 0.029 $5.00 $50.00 300 300 300 300 300
Rim Joist Insulation 100 Square Feet Retail or Trade Ally/Contractor 109.0 0.031 $5.00 $60.00 75 75 75 75 75
Wall Insulation 100 Square Feet Retail or Trade Ally/Contractor 101.0 0.029 $5.00 $50.00 1,200 1,200 1,200 1,200 1,200
ENERGY STAR Window Window Retail or Trade
Ally/Contractor 33.6 0.000 $10.00 $100.00 300 300 300 300 300
Window Film (e.g., low-e coating and/or low SHGC)
Square Foot Retail or Trade Ally/Contractor 5.2 0.001 $0.00 $10.00 50 50 50 50 50
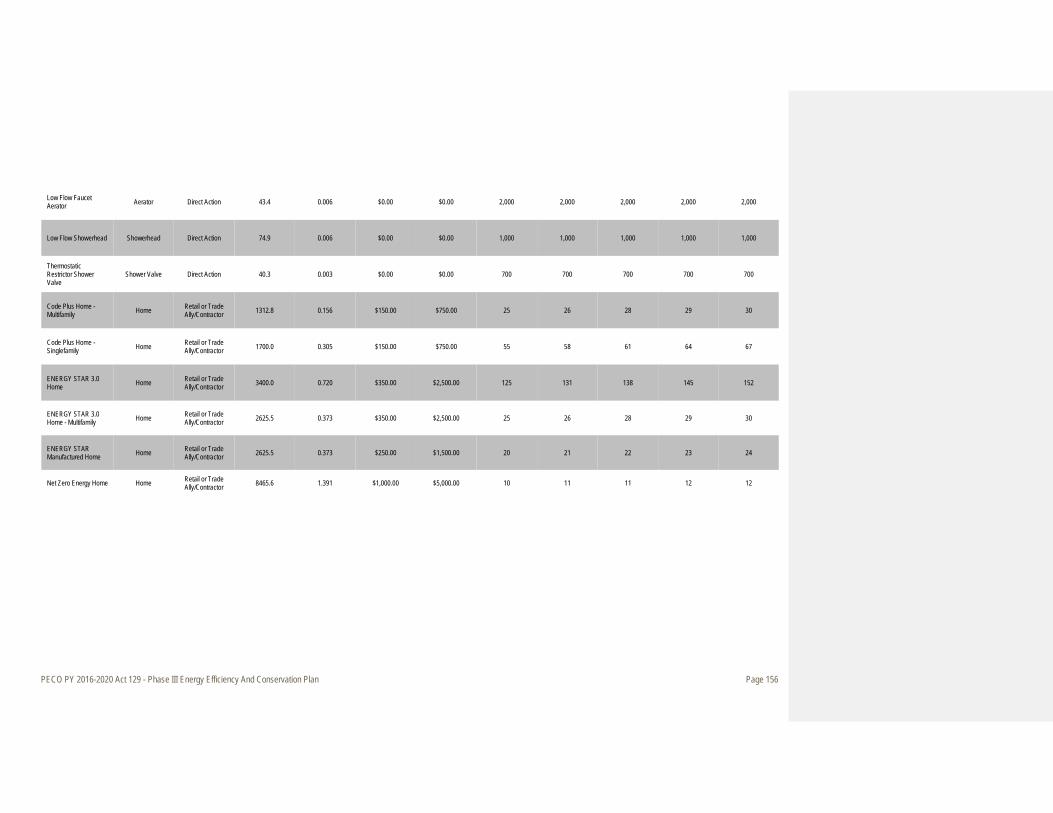
PECO PY 2016-2020 Act 129 - Phase III Energy Efficiency And Conservation Plan Page 156
Low Flow Faucet Aerator Aerator Direct Action 43.4 0.006 $0.00 $0.00 2,000 2,000 2,000 2,000 2,000
Low Flow Showerhead Showerhead Direct Action 74.9 0.006 $0.00 $0.00 1,000 1,000 1,000 1,000 1,000
Thermostatic Restrictor Shower Valve
Shower Valve Direct Action 40.3 0.003 $0.00 $0.00 700 700 700 700 700
Code Plus Home - Multifamily Home Retail or Trade
Ally/Contractor 1312.8 0.156 $150.00 $750.00 25 26 28 29 30
Code Plus Home - Singlefamily Home Retail or Trade
Ally/Contractor 1700.0 0.305 $150.00 $750.00 55 58 61 64 67
ENERGY STAR 3.0 Home Home Retail or Trade
Ally/Contractor 3400.0 0.720 $350.00 $2,500.00 125 131 138 145 152
ENERGY STAR 3.0 Home - Multifamily Home Retail or Trade
Ally/Contractor 2625.5 0.373 $350.00 $2,500.00 25 26 28 29 30
ENERGY STAR Manufactured Home Home Retail or Trade
Ally/Contractor 2625.5 0.373 $250.00 $1,500.00 20 21 22 23 24
Net Zero Energy Home Home Retail or Trade Ally/Contractor 8465.6 1.391 $1,000.00 $5,000.00 10 11 11 12 12
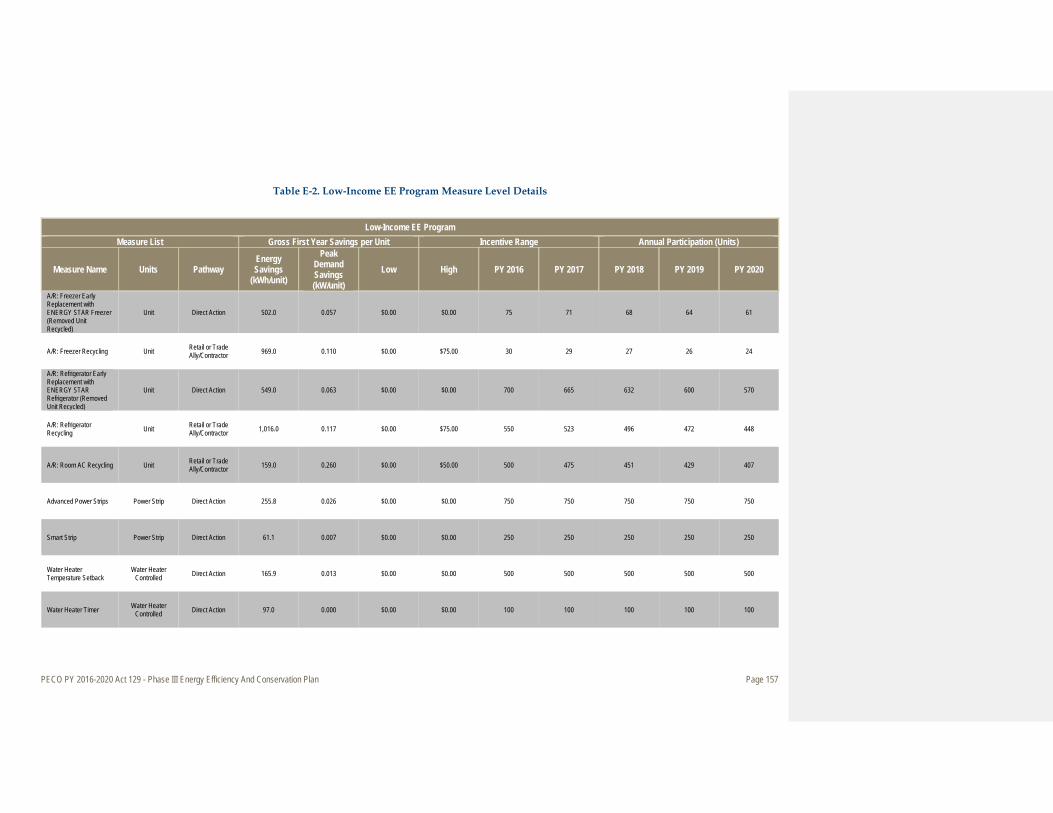
PECO PY 2016-2020 Act 129 - Phase III Energy Efficiency And Conservation Plan Page 157
Table E-2. Low-Income EE Program Measure Level Details
Low-Income EE Program
Measure List Gross First Year Savings per Unit Incentive Range Annual Participation (Units)
Measure Name Units Pathway Energy Savings
(kWh/unit)
Peak Demand Savings (kW/unit)
Low High PY 2016 PY 2017 PY 2018 PY 2019 PY 2020
A/R: Freezer Early Replacement with ENERGY STAR Freezer (Removed Unit Recycled)
Unit Direct Action 502.0 0.057 $0.00 $0.00 75 71 68 64 61
A/R: Freezer Recycling Unit Retail or Trade Ally/Contractor 969.0 0.110 $0.00 $75.00 30 29 27 26 24
A/R: Refrigerator Early Replacement with ENERGY STAR Refrigerator (Removed Unit Recycled)
Unit Direct Action 549.0 0.063 $0.00 $0.00 700 665 632 600 570
A/R: Refrigerator Recycling Unit Retail or Trade
Ally/Contractor 1,016.0 0.117 $0.00 $75.00 550 523 496 472 448
A/R: Room AC Recycling Unit Retail or Trade Ally/Contractor 159.0 0.260 $0.00 $50.00 500 475 451 429 407
Advanced Power Strips Power Strip Direct Action 255.8 0.026 $0.00 $0.00 750 750 750 750 750
Smart Strip Power Strip Direct Action 61.1 0.007 $0.00 $0.00 250 250 250 250 250
Water Heater Temperature Setback
Water Heater Controlled Direct Action 165.9 0.013 $0.00 $0.00 500 500 500 500 500
Water Heater Timer Water Heater Controlled Direct Action 97.0 0.000 $0.00 $0.00 100 100 100 100 100
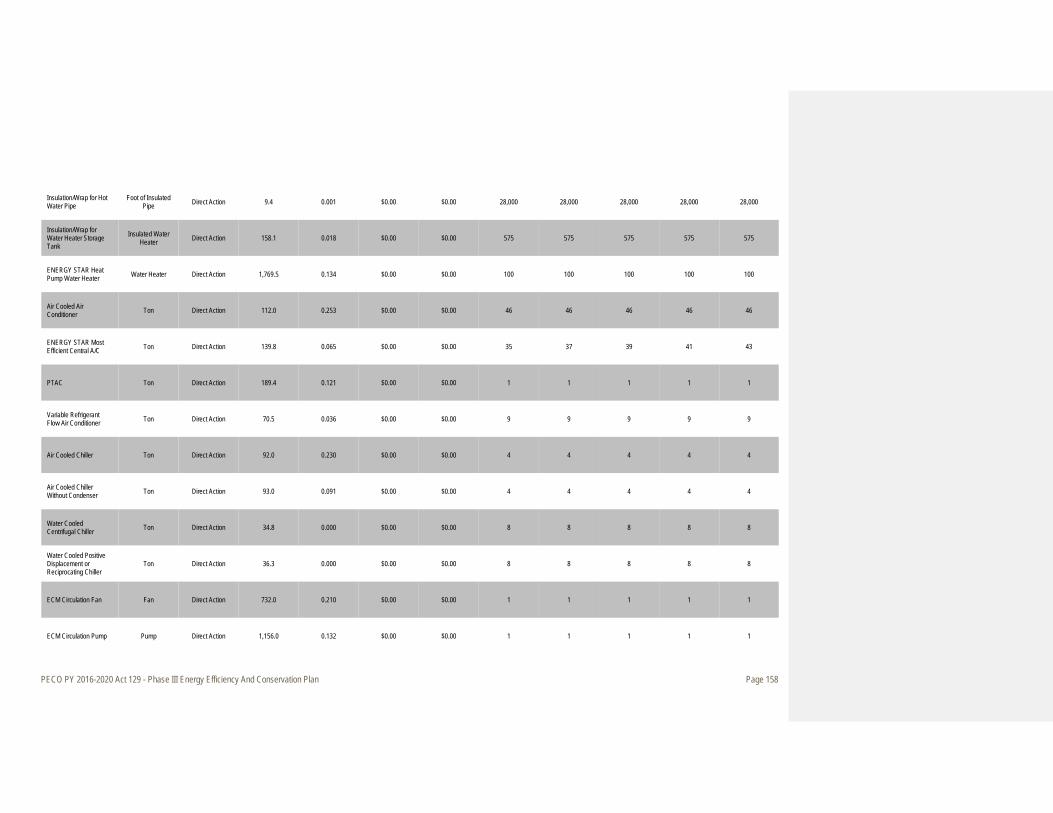
PECO PY 2016-2020 Act 129 - Phase III Energy Efficiency And Conservation Plan Page 158
Insulation/Wrap for Hot Water Pipe
Foot of Insulated Pipe Direct Action 9.4 0.001 $0.00 $0.00 28,000 28,000 28,000 28,000 28,000
Insulation/Wrap for Water Heater Storage Tank
Insulated Water Heater Direct Action 158.1 0.018 $0.00 $0.00 575 575 575 575 575
ENERGY STAR Heat Pump Water Heater Water Heater Direct Action 1,769.5 0.134 $0.00 $0.00 100 100 100 100 100
Air Cooled Air Conditioner Ton Direct Action 112.0 0.253 $0.00 $0.00 46 46 46 46 46
ENERGY STAR Most Efficient Central A/C Ton Direct Action 139.8 0.065 $0.00 $0.00 35 37 39 41 43
PTAC Ton Direct Action 189.4 0.121 $0.00 $0.00 1 1 1 1 1
Variable Refrigerant Flow Air Conditioner Ton Direct Action 70.5 0.036 $0.00 $0.00 9 9 9 9 9
Air Cooled Chiller Ton Direct Action 92.0 0.230 $0.00 $0.00 4 4 4 4 4
Air Cooled Chiller Without Condenser Ton Direct Action 93.0 0.091 $0.00 $0.00 4 4 4 4 4
Water Cooled Centrifugal Chiller Ton Direct Action 34.8 0.000 $0.00 $0.00 8 8 8 8 8
Water Cooled Positive Displacement or Reciprocating Chiller
Ton Direct Action 36.3 0.000 $0.00 $0.00 8 8 8 8 8
ECM Circulation Fan Fan Direct Action 732.0 0.210 $0.00 $0.00 1 1 1 1 1
ECM Circulation Pump Pump Direct Action 1,156.0 0.132 $0.00 $0.00 1 1 1 1 1
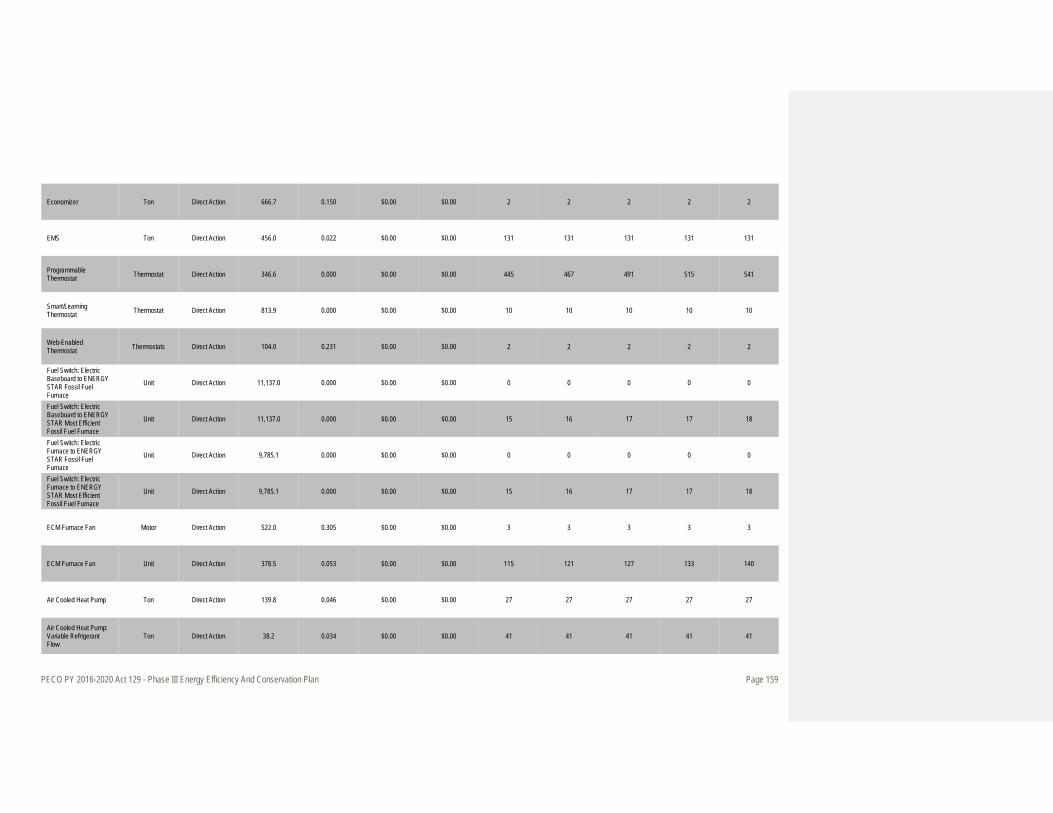
PECO PY 2016-2020 Act 129 - Phase III Energy Efficiency And Conservation Plan Page 159
Economizer Ton Direct Action 666.7 0.150 $0.00 $0.00 2 2 2 2 2
EMS Ton Direct Action 456.0 0.022 $0.00 $0.00 131 131 131 131 131
Programmable Thermostat Thermostat Direct Action 346.6 0.000 $0.00 $0.00 445 467 491 515 541
Smart/Learning Thermostat Thermostat Direct Action 813.9 0.000 $0.00 $0.00 10 10 10 10 10
Web-Enabled Thermostat Thermostats Direct Action 104.0 0.231 $0.00 $0.00 2 2 2 2 2
Fuel Switch: Electric Baseboard to ENERGY STAR Fossil Fuel Furnace
Unit Direct Action 11,137.0 0.000 $0.00 $0.00 0 0 0 0 0
Fuel Switch: Electric Baseboard to ENERGY STAR Most Efficient Fossil Fuel Furnace
Unit Direct Action 11,137.0 0.000 $0.00 $0.00 15 16 17 17 18
Fuel Switch: Electric Furnace to ENERGY STAR Fossil Fuel Furnace
Unit Direct Action 9,785.1 0.000 $0.00 $0.00 0 0 0 0 0
Fuel Switch: Electric Furnace to ENERGY STAR Most Efficient Fossil Fuel Furnace
Unit Direct Action 9,785.1 0.000 $0.00 $0.00 15 16 17 17 18
ECM Furnace Fan Motor Direct Action 522.0 0.305 $0.00 $0.00 3 3 3 3 3
ECM Furnace Fan Unit Direct Action 378.5 0.053 $0.00 $0.00 115 121 127 133 140
Air Cooled Heat Pump Ton Direct Action 139.8 0.046 $0.00 $0.00 27 27 27 27 27
Air Cooled Heat Pump: Variable Refrigerant Flow
Ton Direct Action 38.2 0.034 $0.00 $0.00 41 41 41 41 41
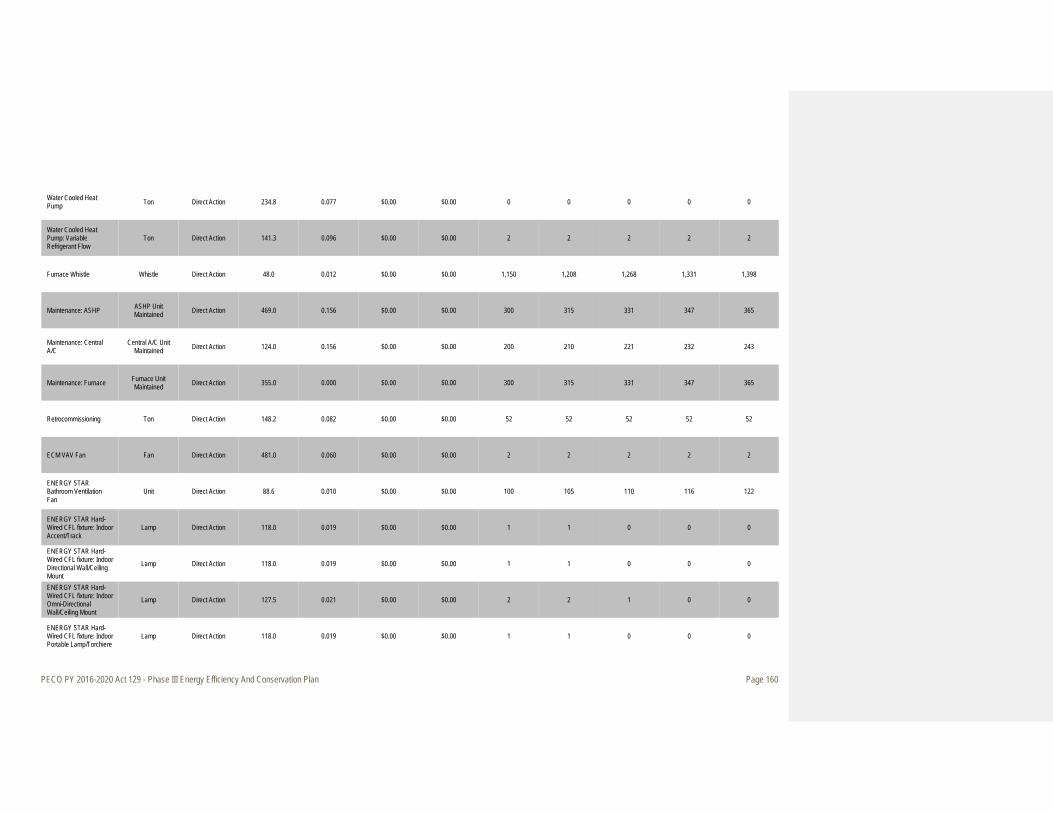
PECO PY 2016-2020 Act 129 - Phase III Energy Efficiency And Conservation Plan Page 160
Water Cooled Heat Pump Ton Direct Action 234.8 0.077 $0.00 $0.00 0 0 0 0 0
Water Cooled Heat Pump: Variable Refrigerant Flow
Ton Direct Action 141.3 0.096 $0.00 $0.00 2 2 2 2 2
Furnace Whistle Whistle Direct Action 48.0 0.012 $0.00 $0.00 1,150 1,208 1,268 1,331 1,398
Maintenance: ASHP ASHP Unit Maintained Direct Action 469.0 0.156 $0.00 $0.00 300 315 331 347 365
Maintenance: Central A/C
Central A/C Unit Maintained Direct Action 124.0 0.156 $0.00 $0.00 200 210 221 232 243
Maintenance: Furnace Furnace Unit Maintained Direct Action 355.0 0.000 $0.00 $0.00 300 315 331 347 365
Retrocommissioning Ton Direct Action 148.2 0.082 $0.00 $0.00 52 52 52 52 52
ECM VAV Fan Fan Direct Action 481.0 0.060 $0.00 $0.00 2 2 2 2 2
ENERGY STAR Bathroom Ventilation Fan
Unit Direct Action 88.6 0.010 $0.00 $0.00 100 105 110 116 122
ENERGY STAR Hard-Wired CFL fixture: Indoor Accent/Track
Lamp Direct Action 118.0 0.019 $0.00 $0.00 1 1 0 0 0
ENERGY STAR Hard-Wired CFL fixture: Indoor Directional Wall/Ceiling Mount
Lamp Direct Action 118.0 0.019 $0.00 $0.00 1 1 0 0 0
ENERGY STAR Hard-Wired CFL fixture: Indoor Omni-Directional Wall/Ceiling Mount
Lamp Direct Action 127.5 0.021 $0.00 $0.00 2 2 1 0 0
ENERGY STAR Hard-Wired CFL fixture: Indoor Portable Lamp/Torchiere
Lamp Direct Action 118.0 0.019 $0.00 $0.00 1 1 0 0 0
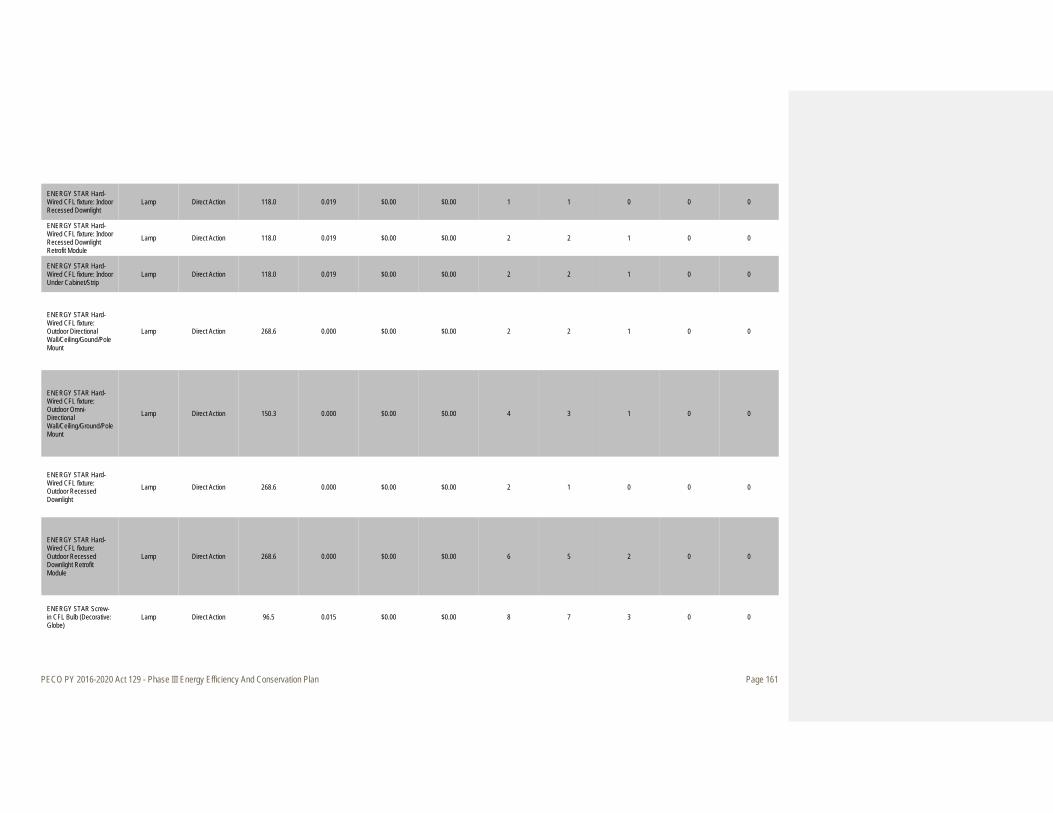
PECO PY 2016-2020 Act 129 - Phase III Energy Efficiency And Conservation Plan Page 161
ENERGY STAR Hard-Wired CFL fixture: Indoor Recessed Downlight
Lamp Direct Action 118.0 0.019 $0.00 $0.00 1 1 0 0 0
ENERGY STAR Hard-Wired CFL fixture: Indoor Recessed Downlight Retrofit Module
Lamp Direct Action 118.0 0.019 $0.00 $0.00 2 2 1 0 0
ENERGY STAR Hard-Wired CFL fixture: Indoor Under Cabinet/Strip
Lamp Direct Action 118.0 0.019 $0.00 $0.00 2 2 1 0 0
ENERGY STAR Hard-Wired CFL fixture: Outdoor Directional Wall/Ceiling/Gound/Pole Mount
Lamp Direct Action 268.6 0.000 $0.00 $0.00 2 2 1 0 0
ENERGY STAR Hard-Wired CFL fixture: Outdoor Omni-Directional Wall/Ceiling/Ground/Pole Mount
Lamp Direct Action 150.3 0.000 $0.00 $0.00 4 3 1 0 0
ENERGY STAR Hard-Wired CFL fixture: Outdoor Recessed Downlight
Lamp Direct Action 268.6 0.000 $0.00 $0.00 2 1 0 0 0
ENERGY STAR Hard-Wired CFL fixture: Outdoor Recessed Downlight Retrofit Module
Lamp Direct Action 268.6 0.000 $0.00 $0.00 6 5 2 0 0
ENERGY STAR Screw-in CFL Bulb (Decorative: Globe)
Lamp Direct Action 96.5 0.015 $0.00 $0.00 8 7 3 0 0
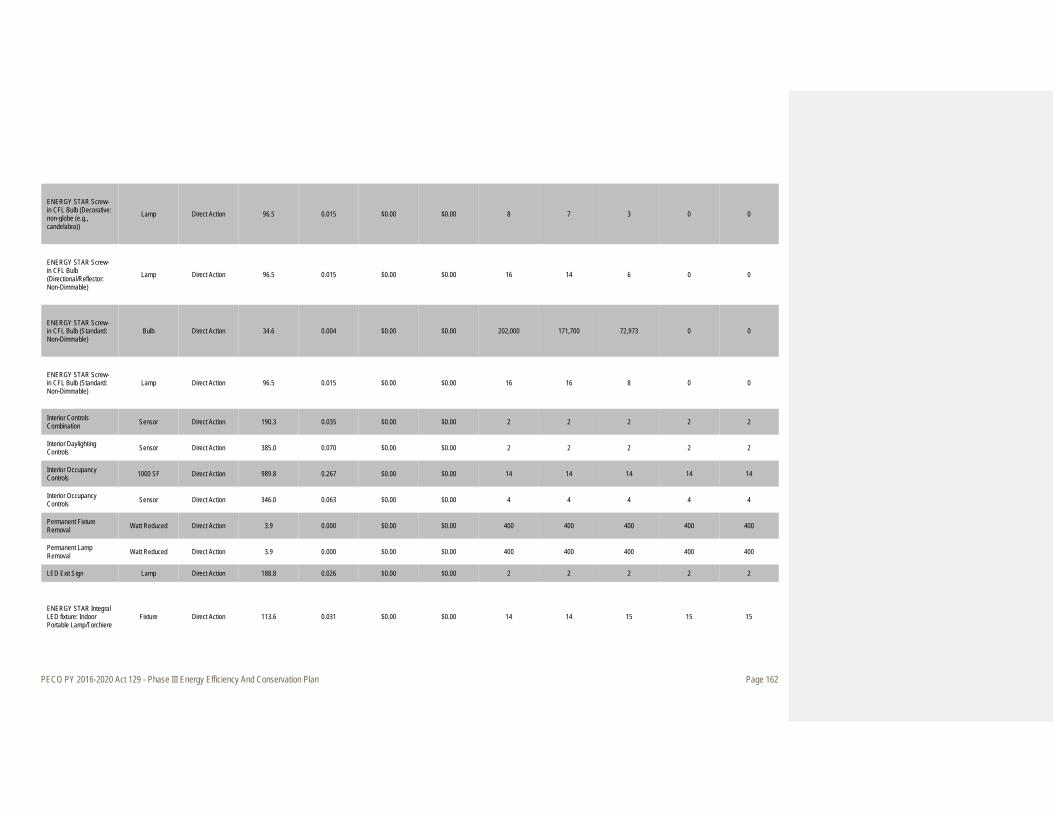
PECO PY 2016-2020 Act 129 - Phase III Energy Efficiency And Conservation Plan Page 162
ENERGY STAR Screw-in CFL Bulb (Decorative: non-globe (e.g., candelabra))
Lamp Direct Action 96.5 0.015 $0.00 $0.00 8 7 3 0 0
ENERGY STAR Screw-in CFL Bulb (Directional/Reflector: Non-Dimmable)
Lamp Direct Action 96.5 0.015 $0.00 $0.00 16 14 6 0 0
ENERGY STAR Screw-in CFL Bulb (Standard: Non-Dimmable)
Bulb Direct Action 34.6 0.004 $0.00 $0.00 202,000 171,700 72,973 0 0
ENERGY STAR Screw-in CFL Bulb (Standard: Non-Dimmable)
Lamp Direct Action 96.5 0.015 $0.00 $0.00 16 16 8 0 0
Interior Controls Combination Sensor Direct Action 190.3 0.035 $0.00 $0.00 2 2 2 2 2
Interior Daylighting Controls Sensor Direct Action 385.0 0.070 $0.00 $0.00 2 2 2 2 2
Interior Occupancy Controls 1000 SF Direct Action 989.8 0.267 $0.00 $0.00 14 14 14 14 14
Interior Occupancy Controls Sensor Direct Action 346.0 0.063 $0.00 $0.00 4 4 4 4 4
Permanent Fixture Removal Watt Reduced Direct Action 3.9 0.000 $0.00 $0.00 400 400 400 400 400
Permanent Lamp Removal Watt Reduced Direct Action 3.9 0.000 $0.00 $0.00 400 400 400 400 400
LED Exit Sign Lamp Direct Action 188.8 0.026 $0.00 $0.00 2 2 2 2 2
ENERGY STAR Integral LED fixture: Indoor Portable Lamp/Torchiere
Fixture Direct Action 113.6 0.031 $0.00 $0.00 14 14 15 15 15

PECO PY 2016-2020 Act 129 - Phase III Energy Efficiency And Conservation Plan Page 163
ENERGY STAR Integral LED fixture: Indoor Recessed Downlight
Fixture Direct Action 15.0 0.027 $0.00 $0.00 14 14 15 15 15
ENERGY STAR Integral LED fixture: Indoor Recessed Downlight Retrofit Module
Fixture Direct Action 80.2 0.016 $0.00 $0.00 174 174 175 175 175
ENERGY STAR Integral LED fixture: Outdoor Recessed Downlight
Fixture Direct Action 15.4 0.024 $0.00 $0.00 14 14 15 15 15
ENERGY STAR Integral LED fixture: Outdoor Recessed Downlight Retrofit Module
Fixture Direct Action 43.7 0.007 $0.00 $0.00 166 166 166 166 166
ENERGY STAR Screw-in LED Bulb (Decorative: Globe)
Bulb Direct Action 47.5 0.006 $0.00 $0.00 3,350 3,518 3,693 3,878 4,072
ENERGY STAR Screw-in LED Bulb (Decorative: Globe; Smart Bulb)
Lamp Direct Action 91.2 0.014 $0.00 $0.00 16 16 17 17 17
ENERGY STAR Screw-in LED Bulb (Decorative: non-globe (e.g., candelabra))
Bulb Direct Action 34.2 0.004 $0.00 $0.00 3,270 3,434 3,605 3,785 3,975

PECO PY 2016-2020 Act 129 - Phase III Energy Efficiency And Conservation Plan Page 164
ENERGY STAR Screw-in LED Bulb (Decorative: non-globe (e.g., candelabra))
Lamp Direct Action 91.2 0.014 $0.00 $0.00 16 16 17 17 17
ENERGY STAR Screw-in LED Bulb (Decorative: non-globe (e.g., candelabra); Smart Bulb)
Lamp Direct Action 91.2 0.014 $0.00 $0.00 16 16 17 17 17
ENERGY STAR Screw-in LED Bulb (Directional/Reflector)
Bulb Direct Action 40.8 0.005 $0.00 $0.00 1,125 1,181 1,240 1,302 1,367
ENERGY STAR Screw-in LED Bulb (Directional/Reflector)
Lamp Direct Action 73.3 0.012 $0.00 $0.00 16 16 17 17 17
ENERGY STAR Screw-in LED Bulb (Directional/Reflector; Smart Bulb)
Lamp Direct Action 91.2 0.014 $0.00 $0.00 16 16 17 17 17
ENERGY STAR Screw-in LED Bulb (Standard) Bulb Retail or Trade
Ally/Contractor 43.2 0.005 $0.00 $7.50 95,275 104,803 141,933 187,906 206,697
ENERGY STAR Screw-in LED Bulb (Standard) Lamp Direct Action 80.8 0.013 $0.00 $0.00 84 86 87 89 91
ENERGY STAR Screw-in LED Bulb (Standard: 3-Way)
Lamp Direct Action 91.2 0.014 $0.00 $0.00 84 86 87 89 91
ENERGY STAR Screw-in LED Bulb (Standard: Smart Bulb)
Lamp Direct Action 91.2 0.014 $0.00 $0.00 84 86 87 89 91
LED Accent/Track Lighting Fixtures Head Direct Action 118.6 0.033 $0.00 $0.00 2 2 2 2 2
LED Channel Signage per letter Direct Action 156.9 0.043 $0.00 $0.00 6 6 6 6 6
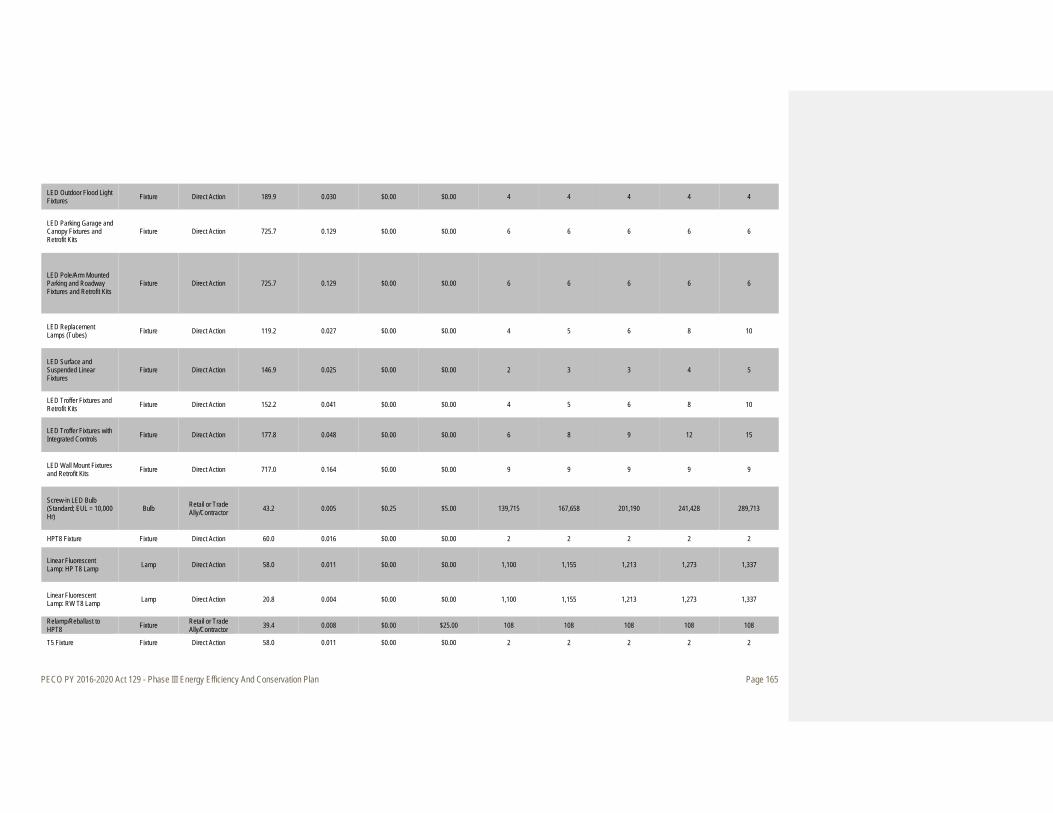
PECO PY 2016-2020 Act 129 - Phase III Energy Efficiency And Conservation Plan Page 165
LED Outdoor Flood Light Fixtures Fixture Direct Action 189.9 0.030 $0.00 $0.00 4 4 4 4 4
LED Parking Garage and Canopy Fixtures and Retrofit Kits
Fixture Direct Action 725.7 0.129 $0.00 $0.00 6 6 6 6 6
LED Pole/Arm Mounted Parking and Roadway Fixtures and Retrofit Kits
Fixture Direct Action 725.7 0.129 $0.00 $0.00 6 6 6 6 6
LED Replacement Lamps (Tubes) Fixture Direct Action 119.2 0.027 $0.00 $0.00 4 5 6 8 10
LED Surface and Suspended Linear Fixtures
Fixture Direct Action 146.9 0.025 $0.00 $0.00 2 3 3 4 5
LED Troffer Fixtures and Retrofit Kits Fixture Direct Action 152.2 0.041 $0.00 $0.00 4 5 6 8 10
LED Troffer Fixtures with Integrated Controls Fixture Direct Action 177.8 0.048 $0.00 $0.00 6 8 9 12 15
LED Wall Mount Fixtures and Retrofit Kits Fixture Direct Action 717.0 0.164 $0.00 $0.00 9 9 9 9 9
Screw-in LED Bulb (Standard; EUL = 10,000 Hr)
Bulb Retail or Trade Ally/Contractor 43.2 0.005 $0.25 $5.00 139,715 167,658 201,190 241,428 289,713
HPT8 Fixture Fixture Direct Action 60.0 0.016 $0.00 $0.00 2 2 2 2 2
Linear Fluorescent Lamp: HP T8 Lamp Lamp Direct Action 58.0 0.011 $0.00 $0.00 1,100 1,155 1,213 1,273 1,337
Linear Fluorescent Lamp: RW T8 Lamp Lamp Direct Action 20.8 0.004 $0.00 $0.00 1,100 1,155 1,213 1,273 1,337
Relamp/Reballast to HPT8 Fixture Retail or Trade
Ally/Contractor 39.4 0.008 $0.00 $25.00 108 108 108 108 108
T5 Fixture Fixture Direct Action 58.0 0.011 $0.00 $0.00 2 2 2 2 2
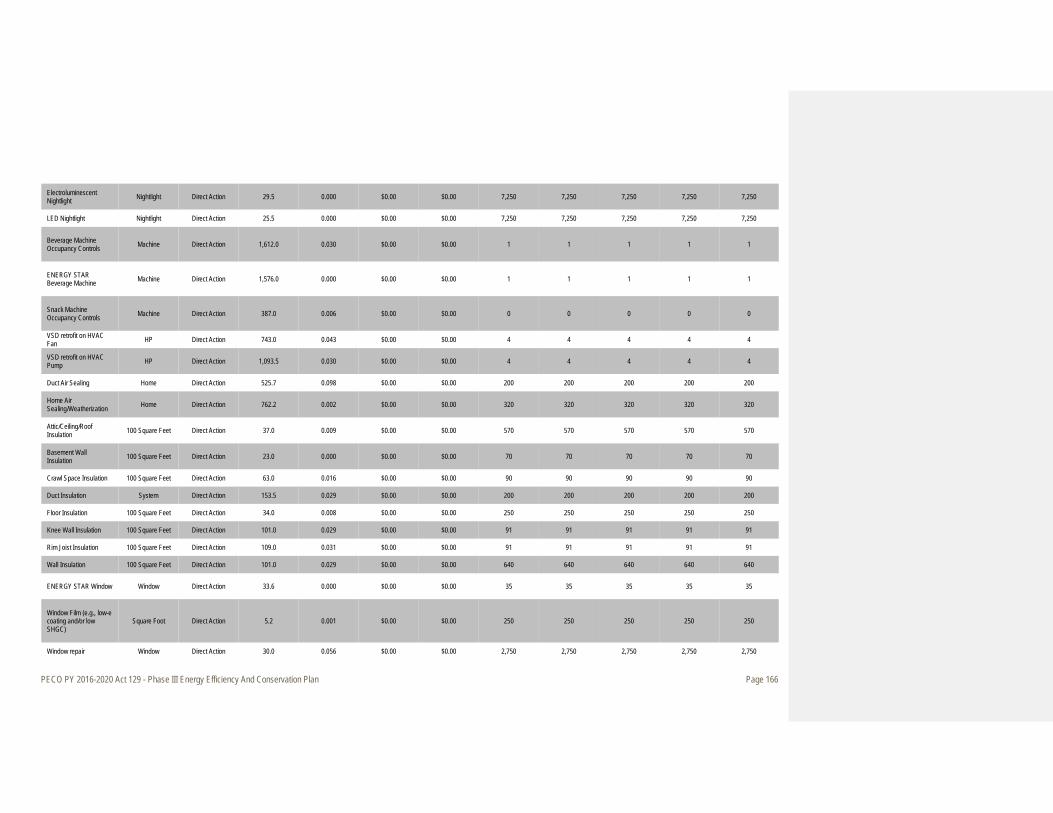
PECO PY 2016-2020 Act 129 - Phase III Energy Efficiency And Conservation Plan Page 166
Electroluminescent Nightlight Nightlight Direct Action 29.5 0.000 $0.00 $0.00 7,250 7,250 7,250 7,250 7,250
LED Nightlight Nightlight Direct Action 25.5 0.000 $0.00 $0.00 7,250 7,250 7,250 7,250 7,250
Beverage Machine Occupancy Controls Machine Direct Action 1,612.0 0.030 $0.00 $0.00 1 1 1 1 1
ENERGY STAR Beverage Machine Machine Direct Action 1,576.0 0.000 $0.00 $0.00 1 1 1 1 1
Snack Machine Occupancy Controls Machine Direct Action 387.0 0.006 $0.00 $0.00 0 0 0 0 0
VSD retrofit on HVAC Fan HP Direct Action 743.0 0.043 $0.00 $0.00 4 4 4 4 4
VSD retrofit on HVAC Pump HP Direct Action 1,093.5 0.030 $0.00 $0.00 4 4 4 4 4
Duct Air Sealing Home Direct Action 525.7 0.098 $0.00 $0.00 200 200 200 200 200
Home Air Sealing/Weatherization Home Direct Action 762.2 0.002 $0.00 $0.00 320 320 320 320 320
Attic/Ceiling/Roof Insulation 100 Square Feet Direct Action 37.0 0.009 $0.00 $0.00 570 570 570 570 570
Basement Wall Insulation 100 Square Feet Direct Action 23.0 0.000 $0.00 $0.00 70 70 70 70 70
Crawl Space Insulation 100 Square Feet Direct Action 63.0 0.016 $0.00 $0.00 90 90 90 90 90
Duct Insulation System Direct Action 153.5 0.029 $0.00 $0.00 200 200 200 200 200
Floor Insulation 100 Square Feet Direct Action 34.0 0.008 $0.00 $0.00 250 250 250 250 250
Knee Wall Insulation 100 Square Feet Direct Action 101.0 0.029 $0.00 $0.00 91 91 91 91 91
Rim Joist Insulation 100 Square Feet Direct Action 109.0 0.031 $0.00 $0.00 91 91 91 91 91
Wall Insulation 100 Square Feet Direct Action 101.0 0.029 $0.00 $0.00 640 640 640 640 640
ENERGY STAR Window Window Direct Action 33.6 0.000 $0.00 $0.00 35 35 35 35 35
Window Film (e.g., low-e coating and/or low SHGC)
Square Foot Direct Action 5.2 0.001 $0.00 $0.00 250 250 250 250 250
Window repair Window Direct Action 30.0 0.056 $0.00 $0.00 2,750 2,750 2,750 2,750 2,750
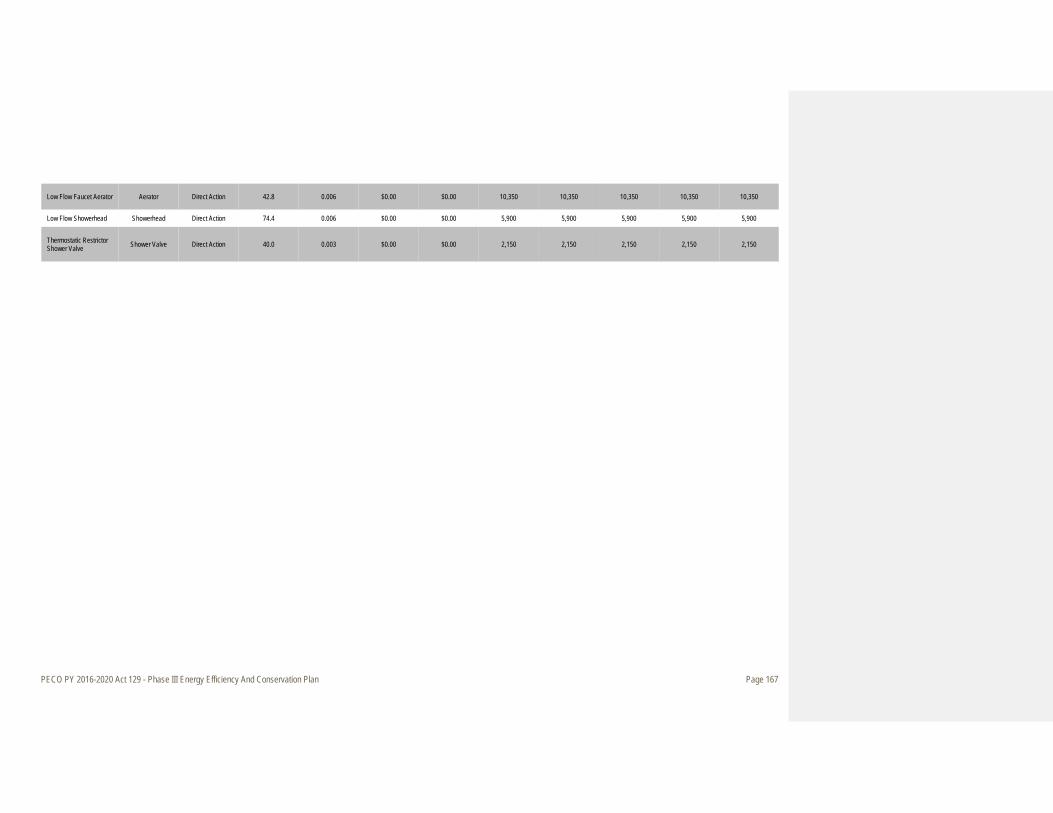
PECO PY 2016-2020 Act 129 - Phase III Energy Efficiency And Conservation Plan Page 167
Low Flow Faucet Aerator Aerator Direct Action 42.8 0.006 $0.00 $0.00 10,350 10,350 10,350 10,350 10,350
Low Flow Showerhead Showerhead Direct Action 74.4 0.006 $0.00 $0.00 5,900 5,900 5,900 5,900 5,900
Thermostatic Restrictor Shower Valve Shower Valve Direct Action 40.0 0.003 $0.00 $0.00 2,150 2,150 2,150 2,150 2,150
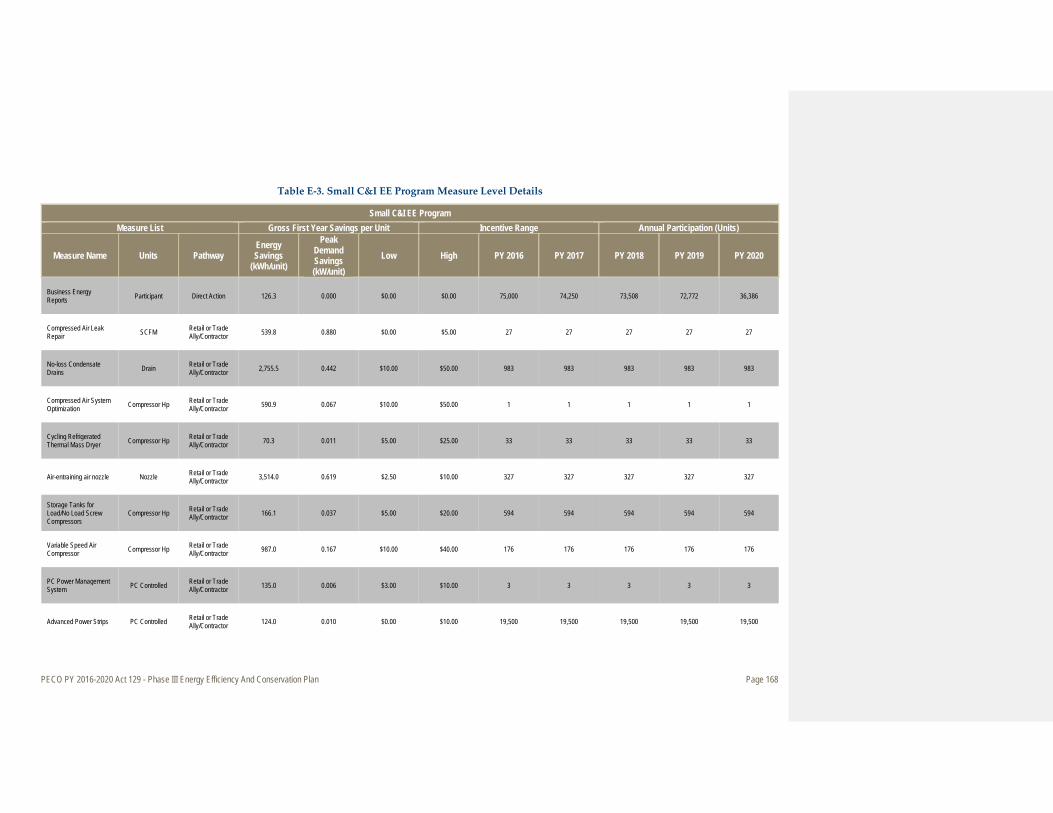
PECO PY 2016-2020 Act 129 - Phase III Energy Efficiency And Conservation Plan Page 168
Table E-3. Small C&I EE Program Measure Level Details
Small C&I EE Program Measure List Gross First Year Savings per Unit Incentive Range Annual Participation (Units)
Measure Name Units Pathway Energy Savings
(kWh/unit)
Peak Demand Savings (kW/unit)
Low High PY 2016 PY 2017 PY 2018 PY 2019 PY 2020
Business Energy Reports Participant Direct Action 126.3 0.000 $0.00 $0.00 75,000 74,250 73,508 72,772 36,386
Compressed Air Leak Repair SCFM Retail or Trade
Ally/Contractor 539.8 0.880 $0.00 $5.00 27 27 27 27 27
No-loss Condensate Drains Drain Retail or Trade
Ally/Contractor 2,755.5 0.442 $10.00 $50.00 983 983 983 983 983
Compressed Air System Optimization Compressor Hp Retail or Trade
Ally/Contractor 590.9 0.067 $10.00 $50.00 1 1 1 1 1
Cycling Refrigerated Thermal Mass Dryer Compressor Hp Retail or Trade
Ally/Contractor 70.3 0.011 $5.00 $25.00 33 33 33 33 33
Air-entraining air nozzle Nozzle Retail or Trade Ally/Contractor 3,514.0 0.619 $2.50 $10.00 327 327 327 327 327
Storage Tanks for Load/No Load Screw Compressors
Compressor Hp Retail or Trade Ally/Contractor 166.1 0.037 $5.00 $20.00 594 594 594 594 594
Variable Speed Air Compressor Compressor Hp Retail or Trade
Ally/Contractor 987.0 0.167 $10.00 $40.00 176 176 176 176 176
PC Power Management System PC Controlled Retail or Trade
Ally/Contractor 135.0 0.006 $3.00 $10.00 3 3 3 3 3
Advanced Power Strips PC Controlled Retail or Trade Ally/Contractor 124.0 0.010 $0.00 $10.00 19,500 19,500 19,500 19,500 19,500
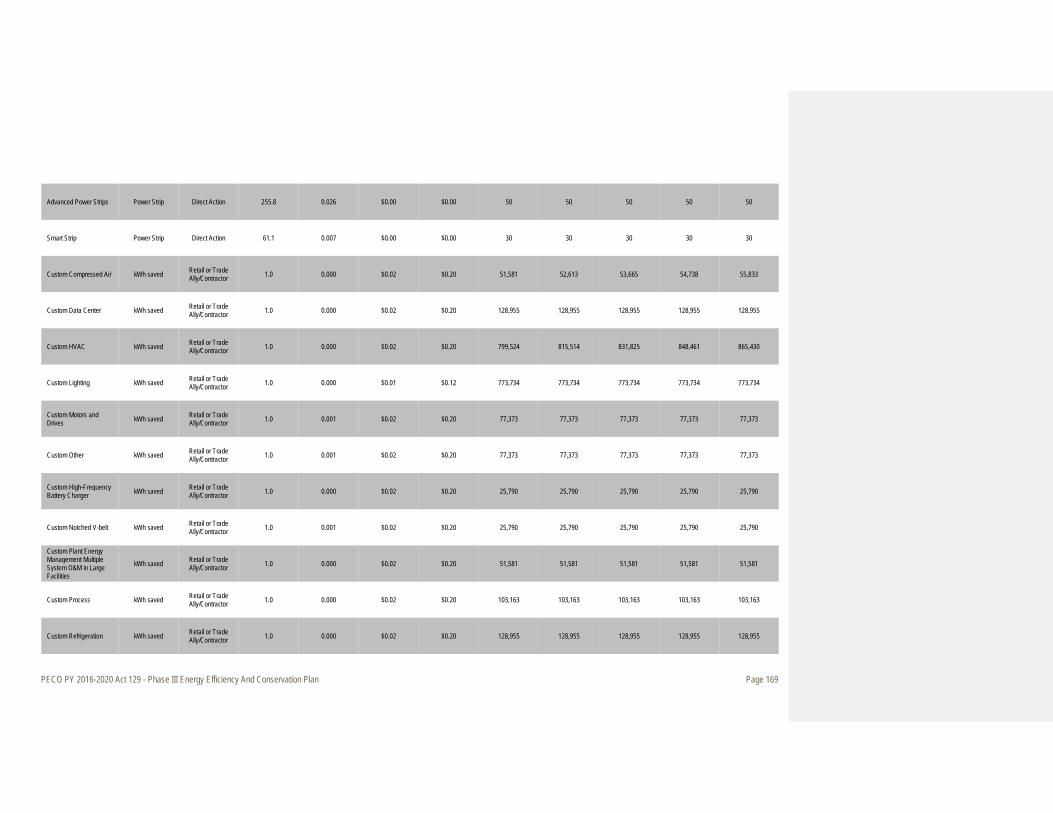
PECO PY 2016-2020 Act 129 - Phase III Energy Efficiency And Conservation Plan Page 169
Advanced Power Strips Power Strip Direct Action 255.8 0.026 $0.00 $0.00 50 50 50 50 50
Smart Strip Power Strip Direct Action 61.1 0.007 $0.00 $0.00 30 30 30 30 30
Custom Compressed Air kWh saved Retail or Trade Ally/Contractor 1.0 0.000 $0.02 $0.20 51,581 52,613 53,665 54,738 55,833
Custom Data Center kWh saved Retail or Trade Ally/Contractor 1.0 0.000 $0.02 $0.20 128,955 128,955 128,955 128,955 128,955
Custom HVAC kWh saved Retail or Trade Ally/Contractor 1.0 0.000 $0.02 $0.20 799,524 815,514 831,825 848,461 865,430
Custom Lighting kWh saved Retail or Trade Ally/Contractor 1.0 0.000 $0.01 $0.12 773,734 773,734 773,734 773,734 773,734
Custom Motors and Drives kWh saved Retail or Trade
Ally/Contractor 1.0 0.001 $0.02 $0.20 77,373 77,373 77,373 77,373 77,373
Custom Other kWh saved Retail or Trade Ally/Contractor 1.0 0.001 $0.02 $0.20 77,373 77,373 77,373 77,373 77,373
Custom High-Frequency Battery Charger kWh saved Retail or Trade
Ally/Contractor 1.0 0.000 $0.02 $0.20 25,790 25,790 25,790 25,790 25,790
Custom Notched V-belt kWh saved Retail or Trade Ally/Contractor 1.0 0.001 $0.02 $0.20 25,790 25,790 25,790 25,790 25,790
Custom Plant Energy Management Multiple System O&M in Large Facilities
kWh saved Retail or Trade Ally/Contractor 1.0 0.000 $0.02 $0.20 51,581 51,581 51,581 51,581 51,581
Custom Process kWh saved Retail or Trade Ally/Contractor 1.0 0.000 $0.02 $0.20 103,163 103,163 103,163 103,163 103,163
Custom Refrigeration kWh saved Retail or Trade Ally/Contractor 1.0 0.000 $0.02 $0.20 128,955 128,955 128,955 128,955 128,955
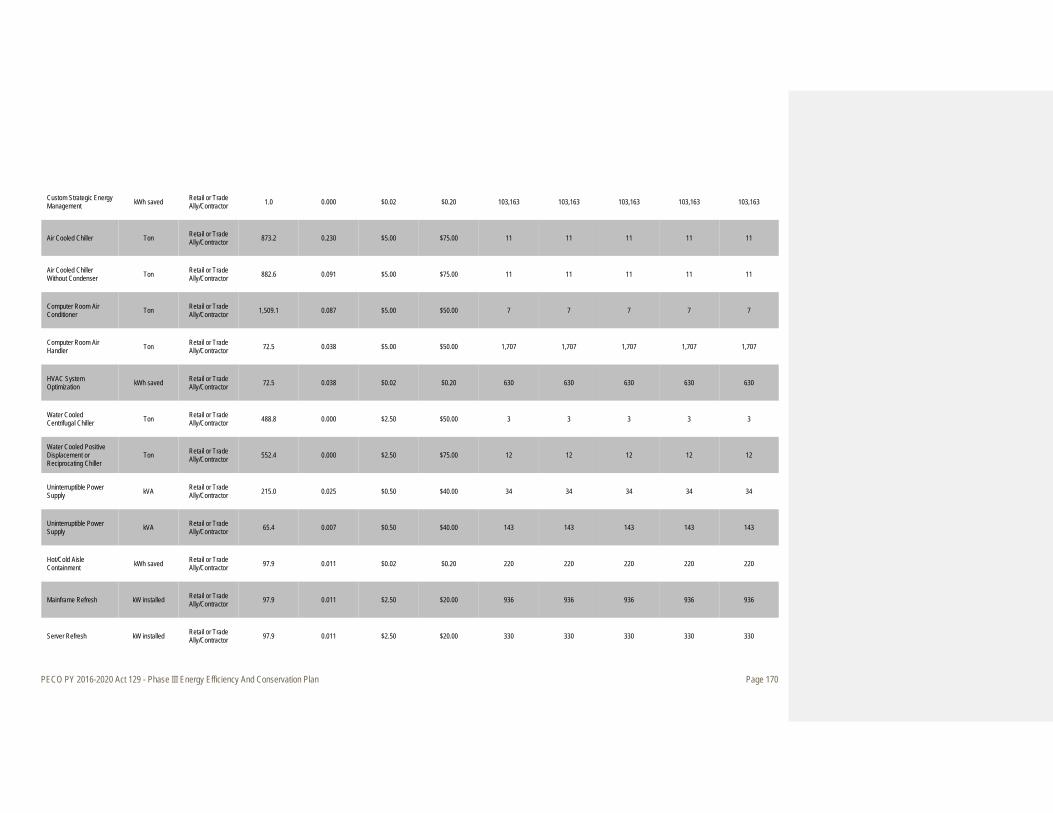
PECO PY 2016-2020 Act 129 - Phase III Energy Efficiency And Conservation Plan Page 170
Custom Strategic Energy Management kWh saved Retail or Trade
Ally/Contractor 1.0 0.000 $0.02 $0.20 103,163 103,163 103,163 103,163 103,163
Air Cooled Chiller Ton Retail or Trade Ally/Contractor 873.2 0.230 $5.00 $75.00 11 11 11 11 11
Air Cooled Chiller Without Condenser Ton Retail or Trade
Ally/Contractor 882.6 0.091 $5.00 $75.00 11 11 11 11 11
Computer Room Air Conditioner Ton Retail or Trade
Ally/Contractor 1,509.1 0.087 $5.00 $50.00 7 7 7 7 7
Computer Room Air Handler Ton Retail or Trade
Ally/Contractor 72.5 0.038 $5.00 $50.00 1,707 1,707 1,707 1,707 1,707
HVAC System Optimization kWh saved Retail or Trade
Ally/Contractor 72.5 0.038 $0.02 $0.20 630 630 630 630 630
Water Cooled Centrifugal Chiller Ton Retail or Trade
Ally/Contractor 488.8 0.000 $2.50 $50.00 3 3 3 3 3
Water Cooled Positive Displacement or Reciprocating Chiller
Ton Retail or Trade Ally/Contractor 552.4 0.000 $2.50 $75.00 12 12 12 12 12
Uninterruptible Power Supply kVA Retail or Trade
Ally/Contractor 215.0 0.025 $0.50 $40.00 34 34 34 34 34
Uninterruptible Power Supply kVA Retail or Trade
Ally/Contractor 65.4 0.007 $0.50 $40.00 143 143 143 143 143
Hot/Cold Aisle Containment kWh saved Retail or Trade
Ally/Contractor 97.9 0.011 $0.02 $0.20 220 220 220 220 220
Mainframe Refresh kW installed Retail or Trade Ally/Contractor 97.9 0.011 $2.50 $20.00 936 936 936 936 936
Server Refresh kW installed Retail or Trade Ally/Contractor 97.9 0.011 $2.50 $20.00 330 330 330 330 330
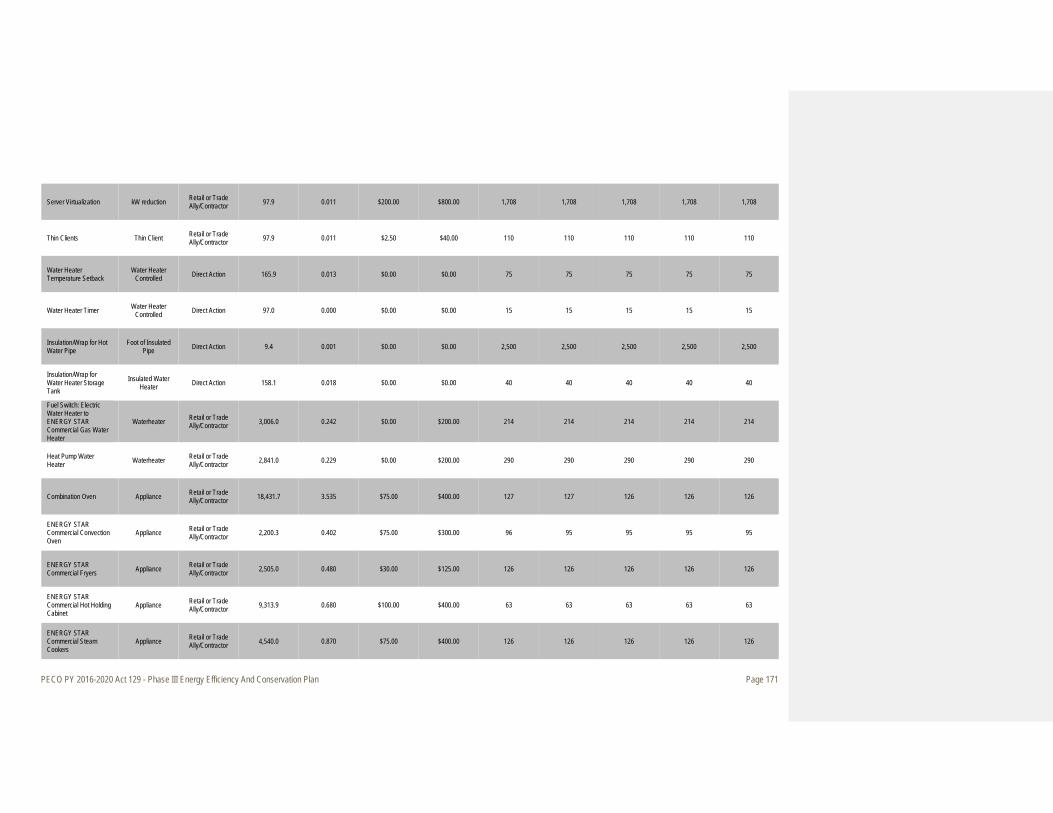
PECO PY 2016-2020 Act 129 - Phase III Energy Efficiency And Conservation Plan Page 171
Server Virtualization kW reduction Retail or Trade Ally/Contractor 97.9 0.011 $200.00 $800.00 1,708 1,708 1,708 1,708 1,708
Thin Clients Thin Client Retail or Trade Ally/Contractor 97.9 0.011 $2.50 $40.00 110 110 110 110 110
Water Heater Temperature Setback
Water Heater Controlled Direct Action 165.9 0.013 $0.00 $0.00 75 75 75 75 75
Water Heater Timer Water Heater Controlled Direct Action 97.0 0.000 $0.00 $0.00 15 15 15 15 15
Insulation/Wrap for Hot Water Pipe
Foot of Insulated Pipe Direct Action 9.4 0.001 $0.00 $0.00 2,500 2,500 2,500 2,500 2,500
Insulation/Wrap for Water Heater Storage Tank
Insulated Water Heater Direct Action 158.1 0.018 $0.00 $0.00 40 40 40 40 40
Fuel Switch: Electric Water Heater to ENERGY STAR Commercial Gas Water Heater
Waterheater Retail or Trade Ally/Contractor 3,006.0 0.242 $0.00 $200.00 214 214 214 214 214
Heat Pump Water Heater Waterheater Retail or Trade
Ally/Contractor 2,841.0 0.229 $0.00 $200.00 290 290 290 290 290
Combination Oven Appliance Retail or Trade Ally/Contractor 18,431.7 3.535 $75.00 $400.00 127 127 126 126 126
ENERGY STAR Commercial Convection Oven
Appliance Retail or Trade Ally/Contractor 2,200.3 0.402 $75.00 $300.00 96 95 95 95 95
ENERGY STAR Commercial Fryers Appliance Retail or Trade
Ally/Contractor 2,505.0 0.480 $30.00 $125.00 126 126 126 126 126
ENERGY STAR Commercial Hot Holding Cabinet
Appliance Retail or Trade Ally/Contractor 9,313.9 0.680 $100.00 $400.00 63 63 63 63 63
ENERGY STAR Commercial Steam Cookers
Appliance Retail or Trade Ally/Contractor 4,540.0 0.870 $75.00 $400.00 126 126 126 126 126
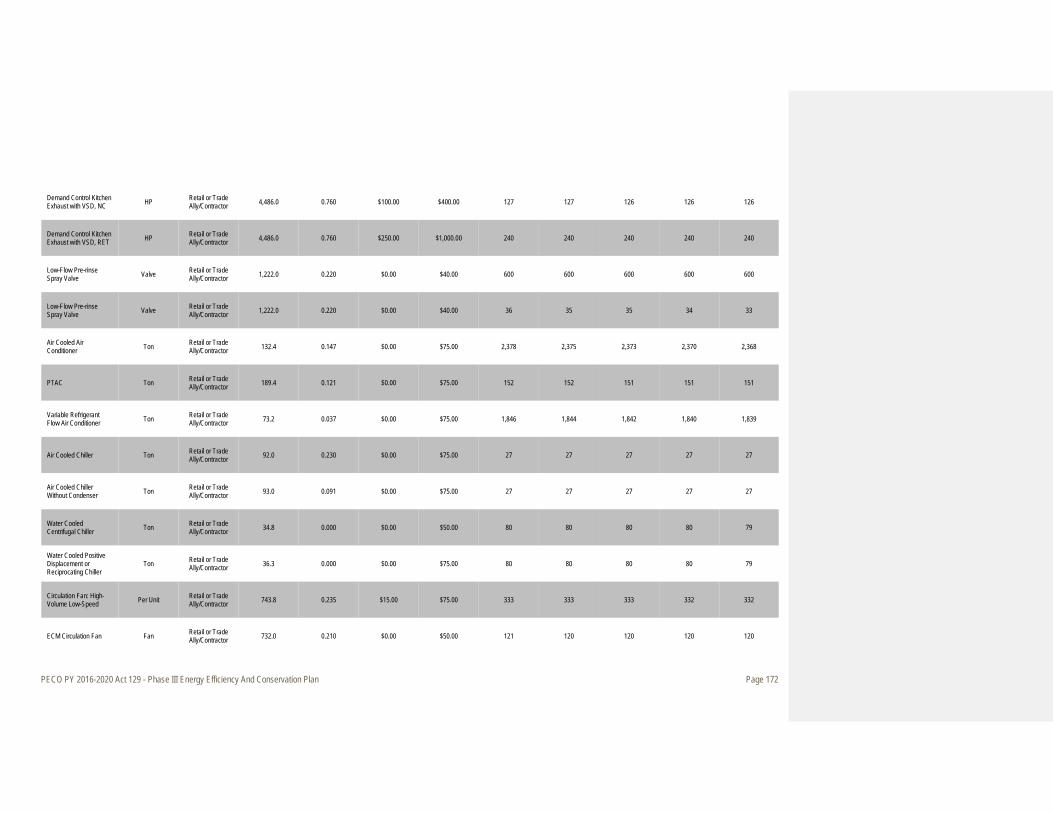
PECO PY 2016-2020 Act 129 - Phase III Energy Efficiency And Conservation Plan Page 172
Demand Control Kitchen Exhaust with VSD, NC HP Retail or Trade
Ally/Contractor 4,486.0 0.760 $100.00 $400.00 127 127 126 126 126
Demand Control Kitchen Exhaust with VSD, RET HP Retail or Trade
Ally/Contractor 4,486.0 0.760 $250.00 $1,000.00 240 240 240 240 240
Low-Flow Pre-rinse Spray Valve Valve Retail or Trade
Ally/Contractor 1,222.0 0.220 $0.00 $40.00 600 600 600 600 600
Low-Flow Pre-rinse Spray Valve Valve Retail or Trade
Ally/Contractor 1,222.0 0.220 $0.00 $40.00 36 35 35 34 33
Air Cooled Air Conditioner Ton Retail or Trade
Ally/Contractor 132.4 0.147 $0.00 $75.00 2,378 2,375 2,373 2,370 2,368
PTAC Ton Retail or Trade Ally/Contractor 189.4 0.121 $0.00 $75.00 152 152 151 151 151
Variable Refrigerant Flow Air Conditioner Ton Retail or Trade
Ally/Contractor 73.2 0.037 $0.00 $75.00 1,846 1,844 1,842 1,840 1,839
Air Cooled Chiller Ton Retail or Trade Ally/Contractor 92.0 0.230 $0.00 $75.00 27 27 27 27 27
Air Cooled Chiller Without Condenser Ton Retail or Trade
Ally/Contractor 93.0 0.091 $0.00 $75.00 27 27 27 27 27
Water Cooled Centrifugal Chiller Ton Retail or Trade
Ally/Contractor 34.8 0.000 $0.00 $50.00 80 80 80 80 79
Water Cooled Positive Displacement or Reciprocating Chiller
Ton Retail or Trade Ally/Contractor 36.3 0.000 $0.00 $75.00 80 80 80 80 79
Circulation Fan: High-Volume Low-Speed Per Unit Retail or Trade
Ally/Contractor 743.8 0.235 $15.00 $75.00 333 333 333 332 332
ECM Circulation Fan Fan Retail or Trade Ally/Contractor 732.0 0.210 $0.00 $50.00 121 120 120 120 120
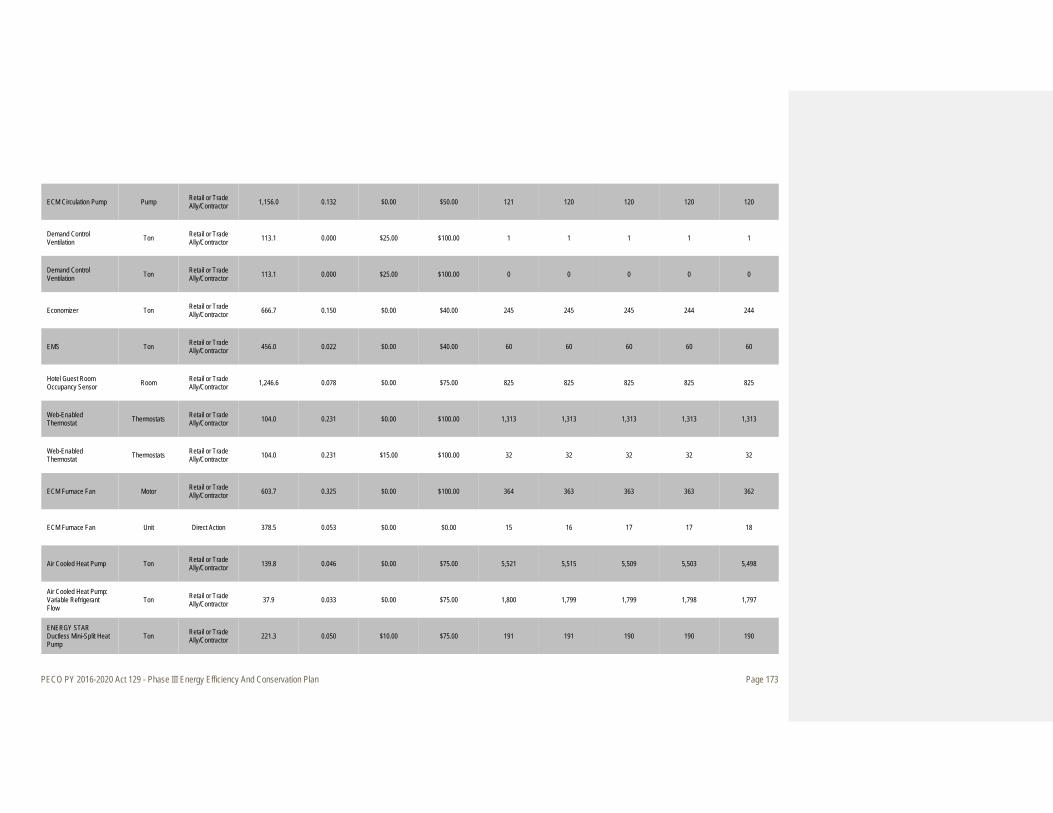
PECO PY 2016-2020 Act 129 - Phase III Energy Efficiency And Conservation Plan Page 173
ECM Circulation Pump Pump Retail or Trade Ally/Contractor 1,156.0 0.132 $0.00 $50.00 121 120 120 120 120
Demand Control Ventilation Ton Retail or Trade
Ally/Contractor 113.1 0.000 $25.00 $100.00 1 1 1 1 1
Demand Control Ventilation Ton Retail or Trade
Ally/Contractor 113.1 0.000 $25.00 $100.00 0 0 0 0 0
Economizer Ton Retail or Trade Ally/Contractor 666.7 0.150 $0.00 $40.00 245 245 245 244 244
EMS Ton Retail or Trade Ally/Contractor 456.0 0.022 $0.00 $40.00 60 60 60 60 60
Hotel Guest Room Occupancy Sensor Room Retail or Trade
Ally/Contractor 1,246.6 0.078 $0.00 $75.00 825 825 825 825 825
Web-Enabled Thermostat Thermostats Retail or Trade
Ally/Contractor 104.0 0.231 $0.00 $100.00 1,313 1,313 1,313 1,313 1,313
Web-Enabled Thermostat Thermostats Retail or Trade
Ally/Contractor 104.0 0.231 $15.00 $100.00 32 32 32 32 32
ECM Furnace Fan Motor Retail or Trade Ally/Contractor 603.7 0.325 $0.00 $100.00 364 363 363 363 362
ECM Furnace Fan Unit Direct Action 378.5 0.053 $0.00 $0.00 15 16 17 17 18
Air Cooled Heat Pump Ton Retail or Trade Ally/Contractor 139.8 0.046 $0.00 $75.00 5,521 5,515 5,509 5,503 5,498
Air Cooled Heat Pump: Variable Refrigerant Flow
Ton Retail or Trade Ally/Contractor 37.9 0.033 $0.00 $75.00 1,800 1,799 1,799 1,798 1,797
ENERGY STAR Ductless Mini-Split Heat Pump
Ton Retail or Trade Ally/Contractor 221.3 0.050 $10.00 $75.00 191 191 190 190 190

PECO PY 2016-2020 Act 129 - Phase III Energy Efficiency And Conservation Plan Page 174
Geothermal Heat Pump Ton Retail or Trade Ally/Contractor 252.5 0.111 $15.00 $75.00 1,244 1,242 1,241 1,239 619
Water Cooled Heat Pump Ton Retail or Trade
Ally/Contractor 234.8 0.077 $0.00 $75.00 61 61 61 61 61
Water Cooled Heat Pump: Variable Refrigerant Flow
Ton Retail or Trade Ally/Contractor 141.3 0.096 $0.00 $75.00 305 305 305 304 304
Retrocommissioning Ton Retail or Trade Ally/Contractor 148.2 0.082 $0.00 $10.00 5,918 5,918 5,918 5,918 5,918
ECM VAV Fan Fan Retail or Trade Ally/Contractor 481.0 0.060 $0.00 $75.00 491 491 490 490 489
ENERGY STAR Bathroom Ventilation Fan
Unit Direct Action 88.6 0.010 $0.00 $0.00 5 5 6 6 6
ENERGY STAR Hard-Wired CFL fixture: Indoor Accent/Track
Lamp Retail or Trade Ally/Contractor 118.0 0.019 $0.00 $15.00 248 223 100 0 0
ENERGY STAR Hard-Wired CFL fixture: Indoor Directional Wall/Ceiling Mount
Lamp Retail or Trade Ally/Contractor 118.0 0.019 $0.00 $15.00 248 223 100 0 0
ENERGY STAR Hard-Wired CFL fixture: Indoor Omni-Directional Wall/Ceiling Mount
Lamp Retail or Trade Ally/Contractor 127.5 0.021 $0.00 $20.00 249 224 101 0 0
ENERGY STAR Hard-Wired CFL fixture: Indoor Portable Lamp/Torchiere
Lamp Retail or Trade Ally/Contractor 118.0 0.019 $0.00 $15.00 248 223 100 0 0
ENERGY STAR Hard-Wired CFL fixture: Indoor Recessed Downlight
Lamp Retail or Trade Ally/Contractor 118.0 0.019 $0.00 $15.00 248 223 100 0 0
ENERGY STAR Hard-Wired CFL fixture: Indoor Recessed Downlight Retrofit Module
Lamp Retail or Trade Ally/Contractor 118.0 0.019 $0.00 $15.00 618 494 198 0 0
ENERGY STAR Hard-Wired CFL fixture: Indoor Under Cabinet/Strip
Lamp Retail or Trade Ally/Contractor 118.0 0.019 $0.00 $15.00 618 494 198 0 0
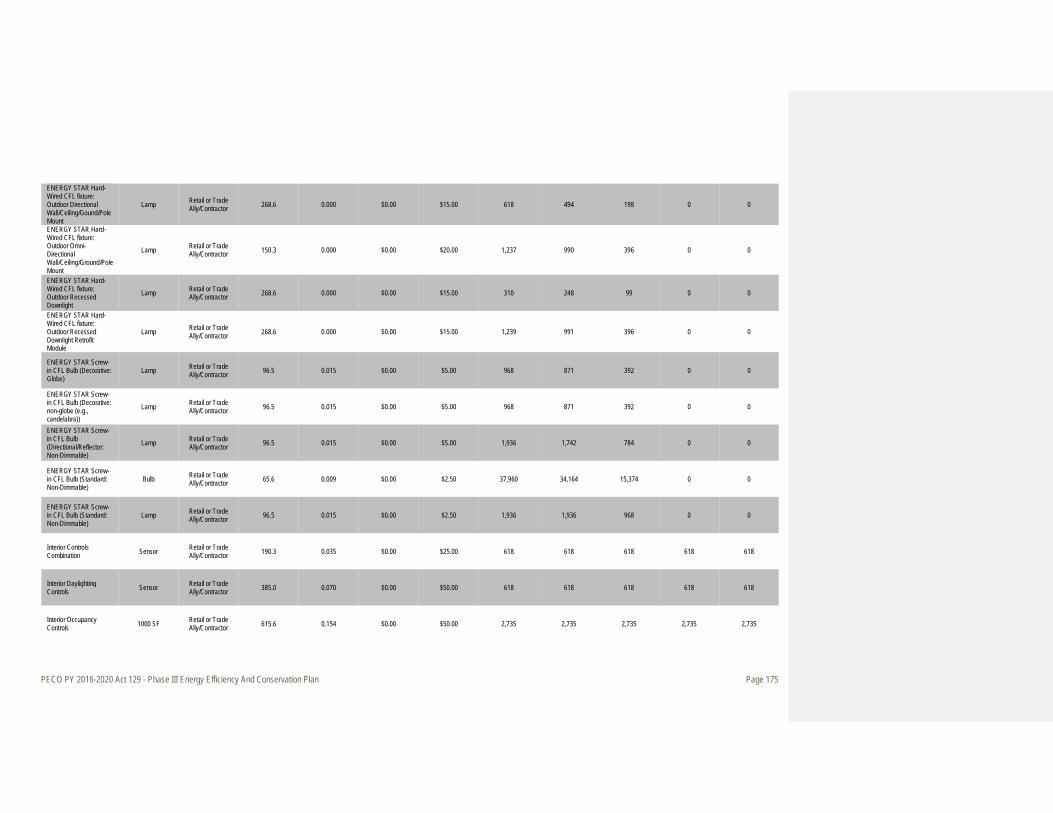
PECO PY 2016-2020 Act 129 - Phase III Energy Efficiency And Conservation Plan Page 175
ENERGY STAR Hard-Wired CFL fixture: Outdoor Directional Wall/Ceiling/Gound/Pole Mount
Lamp Retail or Trade Ally/Contractor 268.6 0.000 $0.00 $15.00 618 494 198 0 0
ENERGY STAR Hard-Wired CFL fixture: Outdoor Omni-Directional Wall/Ceiling/Ground/Pole Mount
Lamp Retail or Trade Ally/Contractor 150.3 0.000 $0.00 $20.00 1,237 990 396 0 0
ENERGY STAR Hard-Wired CFL fixture: Outdoor Recessed Downlight
Lamp Retail or Trade Ally/Contractor 268.6 0.000 $0.00 $15.00 310 248 99 0 0
ENERGY STAR Hard-Wired CFL fixture: Outdoor Recessed Downlight Retrofit Module
Lamp Retail or Trade Ally/Contractor 268.6 0.000 $0.00 $15.00 1,239 991 396 0 0
ENERGY STAR Screw-in CFL Bulb (Decorative: Globe)
Lamp Retail or Trade Ally/Contractor 96.5 0.015 $0.00 $5.00 968 871 392 0 0
ENERGY STAR Screw-in CFL Bulb (Decorative: non-globe (e.g., candelabra))
Lamp Retail or Trade Ally/Contractor 96.5 0.015 $0.00 $5.00 968 871 392 0 0
ENERGY STAR Screw-in CFL Bulb (Directional/Reflector: Non-Dimmable)
Lamp Retail or Trade Ally/Contractor 96.5 0.015 $0.00 $5.00 1,936 1,742 784 0 0
ENERGY STAR Screw-in CFL Bulb (Standard: Non-Dimmable)
Bulb Retail or Trade Ally/Contractor 65.6 0.009 $0.00 $2.50 37,960 34,164 15,374 0 0
ENERGY STAR Screw-in CFL Bulb (Standard: Non-Dimmable)
Lamp Retail or Trade Ally/Contractor 96.5 0.015 $0.00 $2.50 1,936 1,936 968 0 0
Interior Controls Combination Sensor Retail or Trade
Ally/Contractor 190.3 0.035 $0.00 $25.00 618 618 618 618 618
Interior Daylighting Controls Sensor Retail or Trade
Ally/Contractor 385.0 0.070 $0.00 $50.00 618 618 618 618 618
Interior Occupancy Controls 1000 SF Retail or Trade
Ally/Contractor 615.6 0.154 $0.00 $50.00 2,735 2,735 2,735 2,735 2,735

PECO PY 2016-2020 Act 129 - Phase III Energy Efficiency And Conservation Plan Page 176
Interior Occupancy Controls Sensor Direct Action 328.7 0.060 $0.00 $0.00 102 102 102 102 102
Permanent Fixture Removal Watt Reduced Retail or Trade
Ally/Contractor 3.9 0.000 $0.00 $0.25 28,400 28,400 28,400 28,400 28,400
Permanent Lamp Removal Watt Reduced Retail or Trade
Ally/Contractor 3.9 0.000 $0.00 $0.25 28,400 28,400 28,400 28,400 28,400
LED Exit Sign Lamp Retail or Trade Ally/Contractor 188.8 0.026 $0.00 $10.00 595 595 595 595 595
Ceramic HID Fixture Retail or Trade Ally/Contractor 511.4 0.140 $5.00 $40.00 5,248 5,248 5,248 5,248 5,248
Pulse Start HID Fixture Retail or Trade Ally/Contractor 928.2 0.197 $10.00 $100.00 1,965 1,965 1,965 1,965 1,965
ENERGY STAR Integral LED fixture: Indoor Portable Lamp/Torchiere
Fixture Retail or Trade Ally/Contractor 113.6 0.031 $0.00 $25.00 3,098 3,160 3,223 3,288 3,353
ENERGY STAR Integral LED fixture: Indoor Recessed Downlight
Fixture Retail or Trade Ally/Contractor 15.0 0.027 $0.00 $20.00 3,098 3,160 3,223 3,288 3,353
ENERGY STAR Integral LED fixture: Indoor Recessed Downlight Retrofit Module
Fixture Retail or Trade Ally/Contractor 119.9 0.031 $0.00 $35.00 3,638 3,700 3,763 3,828 3,893
ENERGY STAR Integral LED fixture: Outdoor Recessed Downlight
Fixture Retail or Trade Ally/Contractor 15.4 0.024 $0.00 $25.00 3,098 3,160 3,223 3,288 3,353
ENERGY STAR Integral LED fixture: Outdoor Recessed Downlight Retrofit Module
Fixture Retail or Trade Ally/Contractor 25.1 0.018 $0.00 $35.00 1,494 1,519 1,544 1,570 1,596
ENERGY STAR Screw-in LED Bulb (Decorative: Globe)
Bulb Direct Action 58.0 0.006 $0.00 $0.00 300 315 331 347 365
ENERGY STAR Screw-in LED Bulb (Decorative: Globe)
Bulb Retail or Trade Ally/Contractor 100.0 0.015 $0.25 $7.50 5,000 5,250 5,513 5,788 6,078
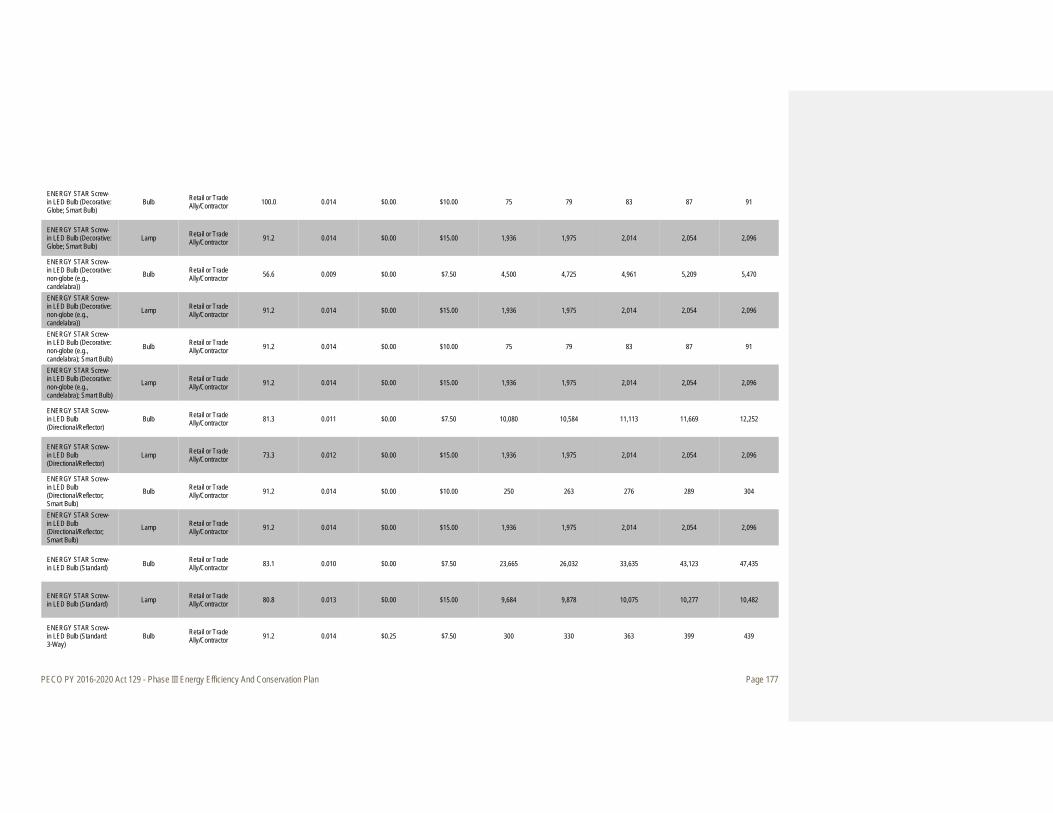
PECO PY 2016-2020 Act 129 - Phase III Energy Efficiency And Conservation Plan Page 177
ENERGY STAR Screw-in LED Bulb (Decorative: Globe; Smart Bulb)
Bulb Retail or Trade Ally/Contractor 100.0 0.014 $0.00 $10.00 75 79 83 87 91
ENERGY STAR Screw-in LED Bulb (Decorative: Globe; Smart Bulb)
Lamp Retail or Trade Ally/Contractor 91.2 0.014 $0.00 $15.00 1,936 1,975 2,014 2,054 2,096
ENERGY STAR Screw-in LED Bulb (Decorative: non-globe (e.g., candelabra))
Bulb Retail or Trade Ally/Contractor 56.6 0.009 $0.00 $7.50 4,500 4,725 4,961 5,209 5,470
ENERGY STAR Screw-in LED Bulb (Decorative: non-globe (e.g., candelabra))
Lamp Retail or Trade Ally/Contractor 91.2 0.014 $0.00 $15.00 1,936 1,975 2,014 2,054 2,096
ENERGY STAR Screw-in LED Bulb (Decorative: non-globe (e.g., candelabra); Smart Bulb)
Bulb Retail or Trade Ally/Contractor 91.2 0.014 $0.00 $10.00 75 79 83 87 91
ENERGY STAR Screw-in LED Bulb (Decorative: non-globe (e.g., candelabra); Smart Bulb)
Lamp Retail or Trade Ally/Contractor 91.2 0.014 $0.00 $15.00 1,936 1,975 2,014 2,054 2,096
ENERGY STAR Screw-in LED Bulb (Directional/Reflector)
Bulb Retail or Trade Ally/Contractor 81.3 0.011 $0.00 $7.50 10,080 10,584 11,113 11,669 12,252
ENERGY STAR Screw-in LED Bulb (Directional/Reflector)
Lamp Retail or Trade Ally/Contractor 73.3 0.012 $0.00 $15.00 1,936 1,975 2,014 2,054 2,096
ENERGY STAR Screw-in LED Bulb (Directional/Reflector; Smart Bulb)
Bulb Retail or Trade Ally/Contractor 91.2 0.014 $0.00 $10.00 250 263 276 289 304
ENERGY STAR Screw-in LED Bulb (Directional/Reflector; Smart Bulb)
Lamp Retail or Trade Ally/Contractor 91.2 0.014 $0.00 $15.00 1,936 1,975 2,014 2,054 2,096
ENERGY STAR Screw-in LED Bulb (Standard) Bulb Retail or Trade
Ally/Contractor 83.1 0.010 $0.00 $7.50 23,665 26,032 33,635 43,123 47,435
ENERGY STAR Screw-in LED Bulb (Standard) Lamp Retail or Trade
Ally/Contractor 80.8 0.013 $0.00 $15.00 9,684 9,878 10,075 10,277 10,482
ENERGY STAR Screw-in LED Bulb (Standard: 3-Way)
Bulb Retail or Trade Ally/Contractor 91.2 0.014 $0.25 $7.50 300 330 363 399 439
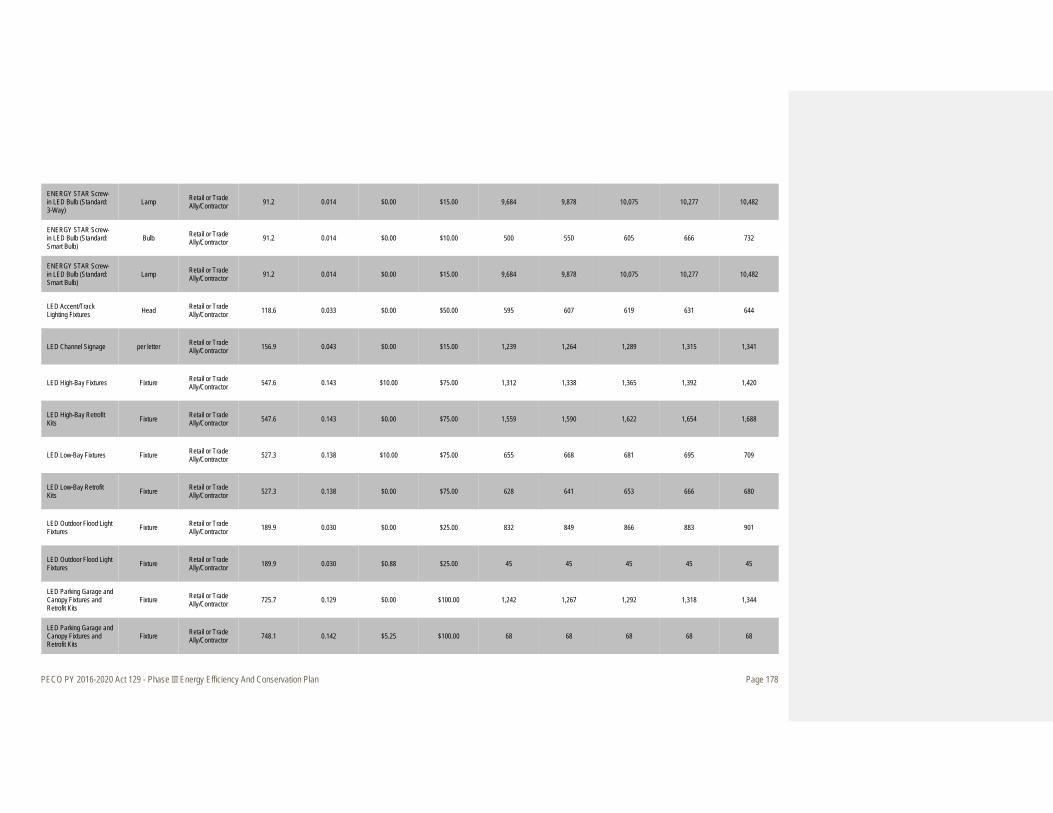
PECO PY 2016-2020 Act 129 - Phase III Energy Efficiency And Conservation Plan Page 178
ENERGY STAR Screw-in LED Bulb (Standard: 3-Way)
Lamp Retail or Trade Ally/Contractor 91.2 0.014 $0.00 $15.00 9,684 9,878 10,075 10,277 10,482
ENERGY STAR Screw-in LED Bulb (Standard: Smart Bulb)
Bulb Retail or Trade Ally/Contractor 91.2 0.014 $0.00 $10.00 500 550 605 666 732
ENERGY STAR Screw-in LED Bulb (Standard: Smart Bulb)
Lamp Retail or Trade Ally/Contractor 91.2 0.014 $0.00 $15.00 9,684 9,878 10,075 10,277 10,482
LED Accent/Track Lighting Fixtures Head Retail or Trade
Ally/Contractor 118.6 0.033 $0.00 $50.00 595 607 619 631 644
LED Channel Signage per letter Retail or Trade Ally/Contractor 156.9 0.043 $0.00 $15.00 1,239 1,264 1,289 1,315 1,341
LED High-Bay Fixtures Fixture Retail or Trade Ally/Contractor 547.6 0.143 $10.00 $75.00 1,312 1,338 1,365 1,392 1,420
LED High-Bay Retrofit Kits Fixture Retail or Trade
Ally/Contractor 547.6 0.143 $0.00 $75.00 1,559 1,590 1,622 1,654 1,688
LED Low-Bay Fixtures Fixture Retail or Trade Ally/Contractor 527.3 0.138 $10.00 $75.00 655 668 681 695 709
LED Low-Bay Retrofit Kits Fixture Retail or Trade
Ally/Contractor 527.3 0.138 $0.00 $75.00 628 641 653 666 680
LED Outdoor Flood Light Fixtures Fixture Retail or Trade
Ally/Contractor 189.9 0.030 $0.00 $25.00 832 849 866 883 901
LED Outdoor Flood Light Fixtures Fixture Retail or Trade
Ally/Contractor 189.9 0.030 $0.88 $25.00 45 45 45 45 45
LED Parking Garage and Canopy Fixtures and Retrofit Kits
Fixture Retail or Trade Ally/Contractor 725.7 0.129 $0.00 $100.00 1,242 1,267 1,292 1,318 1,344
LED Parking Garage and Canopy Fixtures and Retrofit Kits
Fixture Retail or Trade Ally/Contractor 748.1 0.142 $5.25 $100.00 68 68 68 68 68
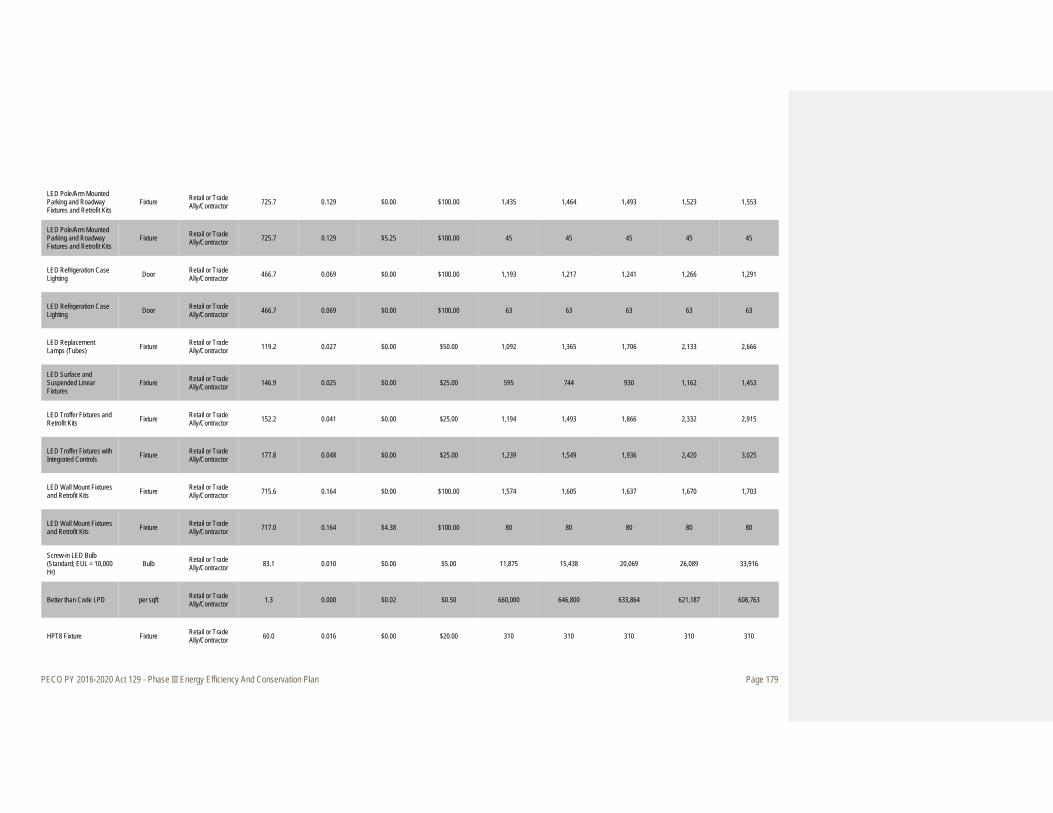
PECO PY 2016-2020 Act 129 - Phase III Energy Efficiency And Conservation Plan Page 179
LED Pole/Arm Mounted Parking and Roadway Fixtures and Retrofit Kits
Fixture Retail or Trade Ally/Contractor 725.7 0.129 $0.00 $100.00 1,435 1,464 1,493 1,523 1,553
LED Pole/Arm Mounted Parking and Roadway Fixtures and Retrofit Kits
Fixture Retail or Trade Ally/Contractor 725.7 0.129 $5.25 $100.00 45 45 45 45 45
LED Refrigeration Case Lighting Door Retail or Trade
Ally/Contractor 466.7 0.069 $0.00 $100.00 1,193 1,217 1,241 1,266 1,291
LED Refrigeration Case Lighting Door Retail or Trade
Ally/Contractor 466.7 0.069 $0.00 $100.00 63 63 63 63 63
LED Replacement Lamps (Tubes) Fixture Retail or Trade
Ally/Contractor 119.2 0.027 $0.00 $50.00 1,092 1,365 1,706 2,133 2,666
LED Surface and Suspended Linear Fixtures
Fixture Retail or Trade Ally/Contractor 146.9 0.025 $0.00 $25.00 595 744 930 1,162 1,453
LED Troffer Fixtures and Retrofit Kits Fixture Retail or Trade
Ally/Contractor 152.2 0.041 $0.00 $25.00 1,194 1,493 1,866 2,332 2,915
LED Troffer Fixtures with Integrated Controls Fixture Retail or Trade
Ally/Contractor 177.8 0.048 $0.00 $25.00 1,239 1,549 1,936 2,420 3,025
LED Wall Mount Fixtures and Retrofit Kits Fixture Retail or Trade
Ally/Contractor 715.6 0.164 $0.00 $100.00 1,574 1,605 1,637 1,670 1,703
LED Wall Mount Fixtures and Retrofit Kits Fixture Retail or Trade
Ally/Contractor 717.0 0.164 $4.38 $100.00 80 80 80 80 80
Screw-in LED Bulb (Standard; EUL = 10,000 Hr)
Bulb Retail or Trade Ally/Contractor 83.1 0.010 $0.00 $5.00 11,875 15,438 20,069 26,089 33,916
Better than Code LPD per sqft Retail or Trade Ally/Contractor 1.3 0.000 $0.02 $0.50 660,000 646,800 633,864 621,187 608,763
HPT8 Fixture Fixture Retail or Trade Ally/Contractor 60.0 0.016 $0.00 $20.00 310 310 310 310 310
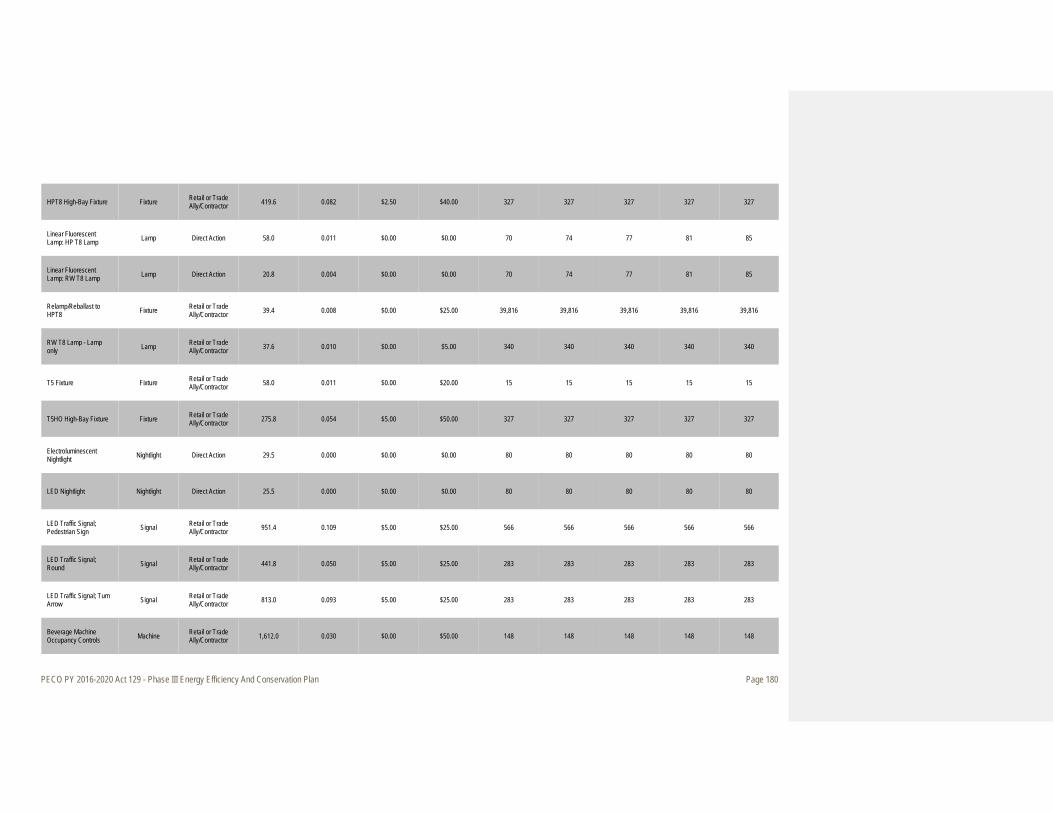
PECO PY 2016-2020 Act 129 - Phase III Energy Efficiency And Conservation Plan Page 180
HPT8 High-Bay Fixture Fixture Retail or Trade Ally/Contractor 419.6 0.082 $2.50 $40.00 327 327 327 327 327
Linear Fluorescent Lamp: HP T8 Lamp Lamp Direct Action 58.0 0.011 $0.00 $0.00 70 74 77 81 85
Linear Fluorescent Lamp: RW T8 Lamp Lamp Direct Action 20.8 0.004 $0.00 $0.00 70 74 77 81 85
Relamp/Reballast to HPT8 Fixture Retail or Trade
Ally/Contractor 39.4 0.008 $0.00 $25.00 39,816 39,816 39,816 39,816 39,816
RW T8 Lamp - Lamp only Lamp Retail or Trade
Ally/Contractor 37.6 0.010 $0.00 $5.00 340 340 340 340 340
T5 Fixture Fixture Retail or Trade Ally/Contractor 58.0 0.011 $0.00 $20.00 15 15 15 15 15
T5HO High-Bay Fixture Fixture Retail or Trade Ally/Contractor 275.8 0.054 $5.00 $50.00 327 327 327 327 327
Electroluminescent Nightlight Nightlight Direct Action 29.5 0.000 $0.00 $0.00 80 80 80 80 80
LED Nightlight Nightlight Direct Action 25.5 0.000 $0.00 $0.00 80 80 80 80 80
LED Traffic Signal; Pedestrian Sign Signal Retail or Trade
Ally/Contractor 951.4 0.109 $5.00 $25.00 566 566 566 566 566
LED Traffic Signal; Round Signal Retail or Trade
Ally/Contractor 441.8 0.050 $5.00 $25.00 283 283 283 283 283
LED Traffic Signal; Turn Arrow Signal Retail or Trade
Ally/Contractor 813.0 0.093 $5.00 $25.00 283 283 283 283 283
Beverage Machine Occupancy Controls Machine Retail or Trade
Ally/Contractor 1,612.0 0.030 $0.00 $50.00 148 148 148 148 148
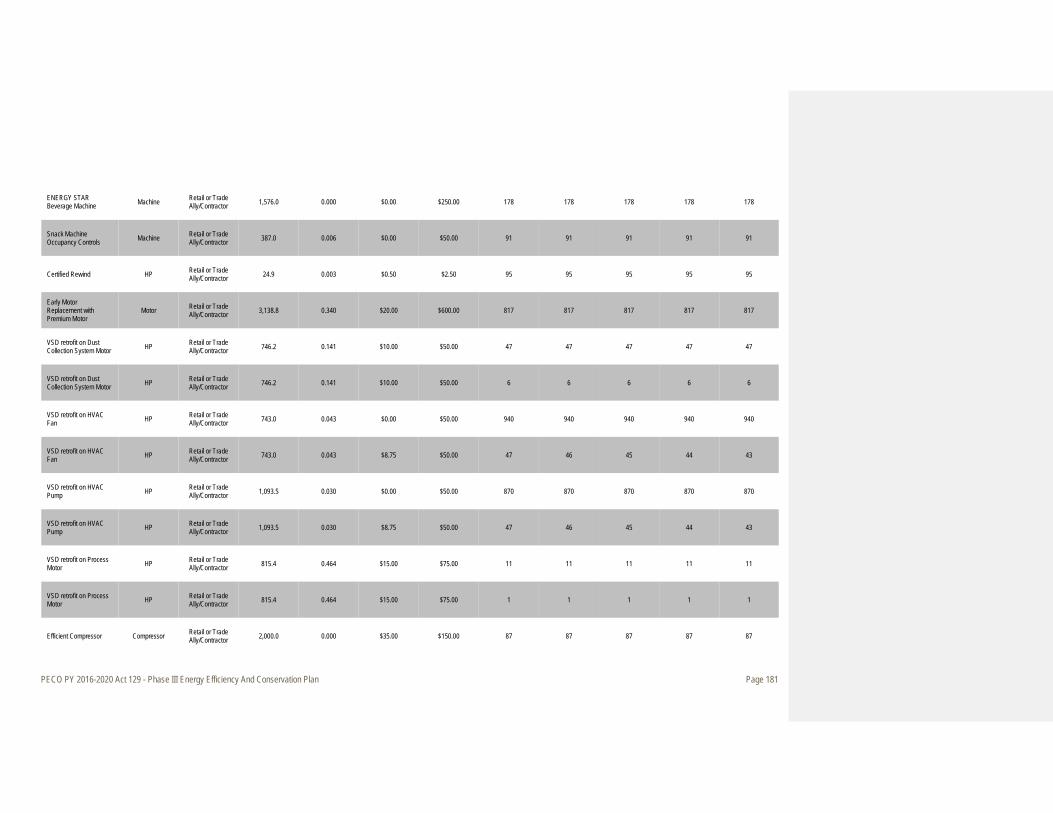
PECO PY 2016-2020 Act 129 - Phase III Energy Efficiency And Conservation Plan Page 181
ENERGY STAR Beverage Machine Machine Retail or Trade
Ally/Contractor 1,576.0 0.000 $0.00 $250.00 178 178 178 178 178
Snack Machine Occupancy Controls Machine Retail or Trade
Ally/Contractor 387.0 0.006 $0.00 $50.00 91 91 91 91 91
Certified Rewind HP Retail or Trade Ally/Contractor 24.9 0.003 $0.50 $2.50 95 95 95 95 95
Early Motor Replacement with Premium Motor
Motor Retail or Trade Ally/Contractor 3,138.8 0.340 $20.00 $600.00 817 817 817 817 817
VSD retrofit on Dust Collection System Motor HP Retail or Trade
Ally/Contractor 746.2 0.141 $10.00 $50.00 47 47 47 47 47
VSD retrofit on Dust Collection System Motor HP Retail or Trade
Ally/Contractor 746.2 0.141 $10.00 $50.00 6 6 6 6 6
VSD retrofit on HVAC Fan HP Retail or Trade
Ally/Contractor 743.0 0.043 $0.00 $50.00 940 940 940 940 940
VSD retrofit on HVAC Fan HP Retail or Trade
Ally/Contractor 743.0 0.043 $8.75 $50.00 47 46 45 44 43
VSD retrofit on HVAC Pump HP Retail or Trade
Ally/Contractor 1,093.5 0.030 $0.00 $50.00 870 870 870 870 870
VSD retrofit on HVAC Pump HP Retail or Trade
Ally/Contractor 1,093.5 0.030 $8.75 $50.00 47 46 45 44 43
VSD retrofit on Process Motor HP Retail or Trade
Ally/Contractor 815.4 0.464 $15.00 $75.00 11 11 11 11 11
VSD retrofit on Process Motor HP Retail or Trade
Ally/Contractor 815.4 0.464 $15.00 $75.00 1 1 1 1 1
Efficient Compressor Compressor Retail or Trade Ally/Contractor 2,000.0 0.000 $35.00 $150.00 87 87 87 87 87

PECO PY 2016-2020 Act 129 - Phase III Energy Efficiency And Conservation Plan Page 182
Efficient Compressor Compressor Retail or Trade Ally/Contractor 2,000.0 0.000 $35.00 $150.00 5 4 4 4 4
Air Cooled Refrigeration Condenser Ton Retail or Trade
Ally/Contractor 120.0 0.118 $10.00 $30.00 5,905 5,905 5,905 5,905 5,905
Oversized Condenser with VFD Ton Retail or Trade
Ally/Contractor 718.0 0.082 $5.00 $20.00 22 22 22 22 22
Anti-Sweat Heater Controls Door Retail or Trade
Ally/Contractor 631.7 0.012 $0.00 $50.00 178 178 178 178 178
Anti-Sweat Heater Controls Door Retail or Trade
Ally/Contractor 631.7 0.012 $5.25 $50.00 8 8 8 7 7
Case Light Occupancy Controls Door Retail or Trade
Ally/Contractor 109.6 0.018 $0.00 $20.00 177 177 177 177 177
Case Light Occupancy Controls Door Retail or Trade
Ally/Contractor 109.6 0.018 $3.50 $20.00 7 7 7 7 6
Door Heater Controls Door Retail or Trade Ally/Contractor 631.7 0.012 $0.00 $50.00 178 178 178 178 178
Door Heater Controls Door Retail or Trade Ally/Contractor 631.7 0.012 $7.50 $50.00 8 8 8 7 7
Evaporator Coil Defrost Controls Controller Retail or Trade
Ally/Contractor 600.0 1.232 $0.00 $300.00 134 134 134 134 134
Evaporator Coil Defrost Controls Controller Retail or Trade
Ally/Contractor 600.0 1.232 $52.00 $300.00 6 6 5 5 5
Evaporator Fan Controls Controller Retail or Trade Ally/Contractor 2,088.3 0.238 $0.00 $100.00 132 132 132 132 132
Evaporator Fan Controls Controller Retail or Trade Ally/Contractor 2,088.3 0.238 $7.00 $100.00 5 5 5 5 5
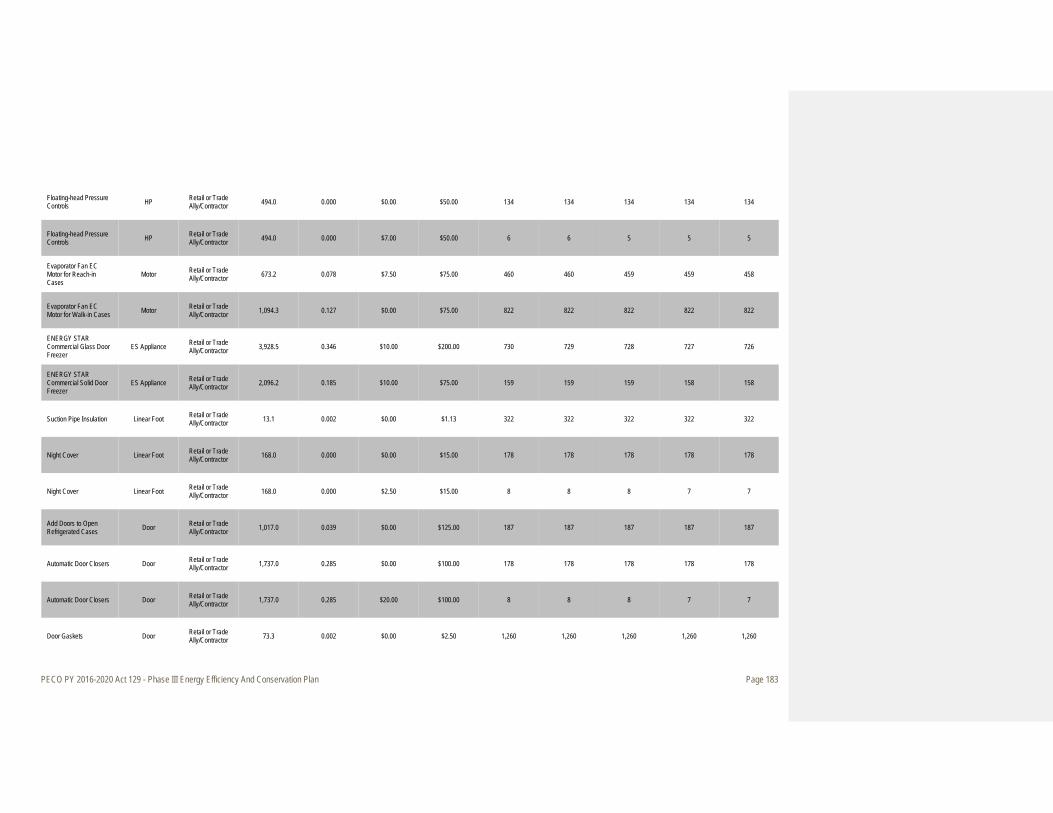
PECO PY 2016-2020 Act 129 - Phase III Energy Efficiency And Conservation Plan Page 183
Floating-head Pressure Controls HP Retail or Trade
Ally/Contractor 494.0 0.000 $0.00 $50.00 134 134 134 134 134
Floating-head Pressure Controls HP Retail or Trade
Ally/Contractor 494.0 0.000 $7.00 $50.00 6 6 5 5 5
Evaporator Fan EC Motor for Reach-in Cases
Motor Retail or Trade Ally/Contractor 673.2 0.078 $7.50 $75.00 460 460 459 459 458
Evaporator Fan EC Motor for Walk-in Cases Motor Retail or Trade
Ally/Contractor 1,094.3 0.127 $0.00 $75.00 822 822 822 822 822
ENERGY STAR Commercial Glass Door Freezer
ES Appliance Retail or Trade Ally/Contractor 3,928.5 0.346 $10.00 $200.00 730 729 728 727 726
ENERGY STAR Commercial Solid Door Freezer
ES Appliance Retail or Trade Ally/Contractor 2,096.2 0.185 $10.00 $75.00 159 159 159 158 158
Suction Pipe Insulation Linear Foot Retail or Trade Ally/Contractor 13.1 0.002 $0.00 $1.13 322 322 322 322 322
Night Cover Linear Foot Retail or Trade Ally/Contractor 168.0 0.000 $0.00 $15.00 178 178 178 178 178
Night Cover Linear Foot Retail or Trade Ally/Contractor 168.0 0.000 $2.50 $15.00 8 8 8 7 7
Add Doors to Open Refrigerated Cases Door Retail or Trade
Ally/Contractor 1,017.0 0.039 $0.00 $125.00 187 187 187 187 187
Automatic Door Closers Door Retail or Trade Ally/Contractor 1,737.0 0.285 $0.00 $100.00 178 178 178 178 178
Automatic Door Closers Door Retail or Trade Ally/Contractor 1,737.0 0.285 $20.00 $100.00 8 8 8 7 7
Door Gaskets Door Retail or Trade Ally/Contractor 73.3 0.002 $0.00 $2.50 1,260 1,260 1,260 1,260 1,260

PECO PY 2016-2020 Act 129 - Phase III Energy Efficiency And Conservation Plan Page 184
Zero Energy Doors Door Retail or Trade Ally/Contractor 1,400.0 0.053 $17.50 $100.00 217 217 217 217 217
Zero Energy Doors Door Retail or Trade Ally/Contractor 1,400.0 0.053 $17.50 $100.00 12 12 12 12 12
ENERGY STAR Commercial Glass Door Refrigerator
ES Appliance Retail or Trade Ally/Contractor 824.8 0.073 $15.00 $100.00 71 71 71 71 71
ENERGY STAR Commercial Solid Door Refrigerator
ES Appliance Retail or Trade Ally/Contractor 449.5 0.040 $10.00 $75.00 15 15 15 15 15
Strip Curtains Linear Foot Retail or Trade Ally/Contractor 93.8 0.011 $0.00 $3.50 485 485 485 485 485
Low Flow Faucet Aerator Aerator Retail or Trade Ally/Contractor 36.4 0.007 $0.00 $4.00 424 424 424 424 424
Low Flow Faucet Aerator Aerator Retail or Trade Ally/Contractor 32.8 0.008 $0.00 $4.00 30 29 29 28 28
Low Flow Showerhead Showerhead Retail or Trade Ally/Contractor 252.1 0.129 $0.00 $4.00 227 227 227 227 227
Low Flow Showerhead Showerhead Retail or Trade Ally/Contractor 171.0 0.096 $0.00 $4.00 28 27 27 26 26
Thermostatic Restrictor Shower Valve Showerhead Retail or Trade
Ally/Contractor 327.1 0.014 $0.00 $30.00 97 97 97 97 97
Thermostatic Restrictor Shower Valve Showerhead Retail or Trade
Ally/Contractor 327.1 0.014 $0.00 $30.00 28 27 27 26 26
Thermostatic Restrictor Shower Valve Shower Valve Direct Action 38.9 0.003 $0.00 $0.00 115 115 115 115 115
Code Plus Building SF Retail or Trade Ally/Contractor 6.0 0.002 $0.10 $1.50 222,750 218,295 213,929 209,651 205,458
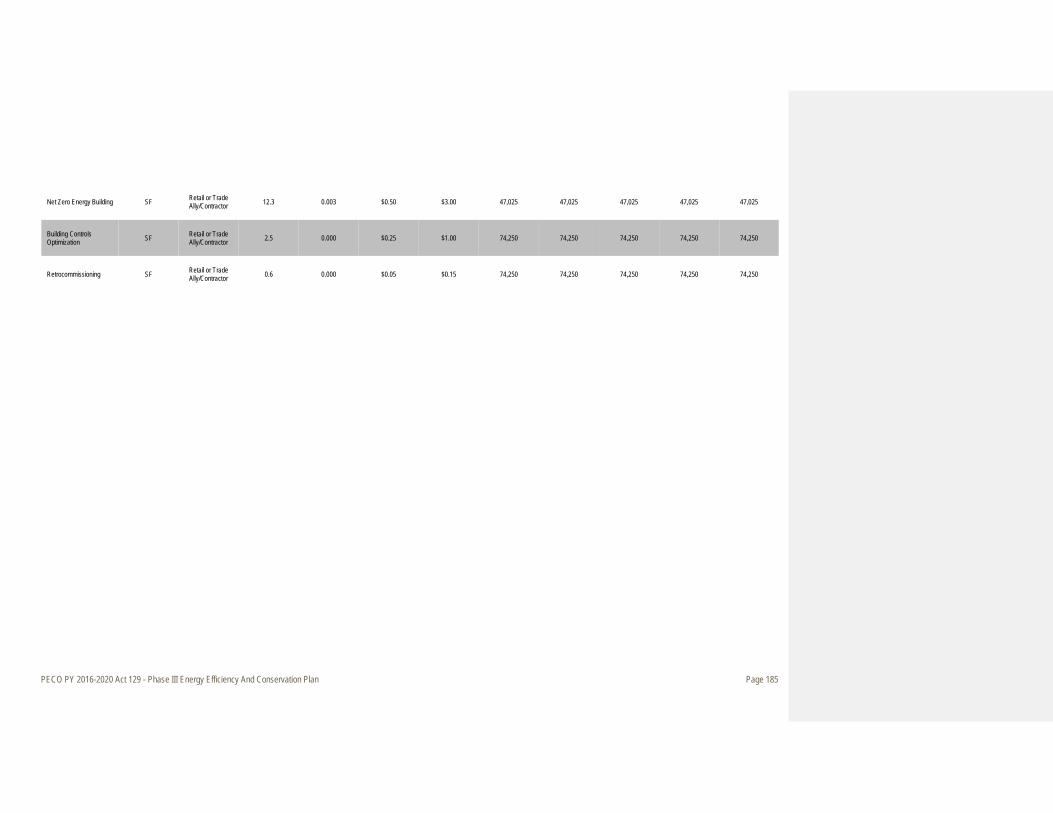
PECO PY 2016-2020 Act 129 - Phase III Energy Efficiency And Conservation Plan Page 185
Net Zero Energy Building SF Retail or Trade Ally/Contractor 12.3 0.003 $0.50 $3.00 47,025 47,025 47,025 47,025 47,025
Building Controls Optimization SF Retail or Trade
Ally/Contractor 2.5 0.000 $0.25 $1.00 74,250 74,250 74,250 74,250 74,250
Retrocommissioning SF Retail or Trade Ally/Contractor 0.6 0.000 $0.05 $0.15 74,250 74,250 74,250 74,250 74,250

PECO PY 2016-2020 Act 129 - Phase III Energy Efficiency And Conservation Plan Page 186
Table E-4. Large C&I EE Program Measure Level Details
Large C&I EE
Measure List Gross First Year Savings per Unit Incentive Range Annual Participation (Units)
Measure Name Units Pathway
Energy Savings
(kWh/unit)
Peak Demand Savings (kW/unit)
Low High PY 2016 PY 2017 PY 2018 PY 2019 PY 2020
Compressed Air Leak Repair SCFM Retail or Trade
Ally/Contractor 539.8 0.880 $0.00 $5.00 562 562 562 562 562
No-loss Condensate Drains
Drain Retail or Trade Ally/Contractor 2,755.5 0.442 $10.00 $50.00 443 443 443 443 443
Compressed Air System Optimization
Compressor Hp Retail or Trade Ally/Contractor 590.9 0.067 $10.00 $50.00 33 33 33 33 33
Cycling Refrigerated Thermal Mass Dryer
Compressor Hp Retail or Trade Ally/Contractor 70.3 0.011 $5.00 $25.00 709 709 709 709 709
Air-entraining air nozzle Nozzle Retail or Trade
Ally/Contractor 3,514.0 0.619 $2.50 $10.00 147 147 147 147 147
Storage Tanks for Load/No Load Screw Compressors
Compressor Hp Retail or Trade Ally/Contractor 166.1 0.037 $5.00 $20.00 11,908 11,909 11,909 11,910 11,910
Variable Speed Air Compressor Compressor Hp Retail or Trade
Ally/Contractor 987.0 0.167 $10.00 $40.00 3,554 3,554 3,554 3,554 3,554
PC Power Management System
PC Controlled Retail or Trade Ally/Contractor 135.0 0.006 $3.00 $10.00 80 80 80 80 80
Advanced Power Strips PC Controlled Retail or Trade
Ally/Contractor 124.0 0.010 $2.50 $10.00 6,400 6,400 6,400 6,400 6,400
Advanced Power Strips Power Strip Direct Action 255.8 0.026 $0.00 $0.00 50 50 50 50 50
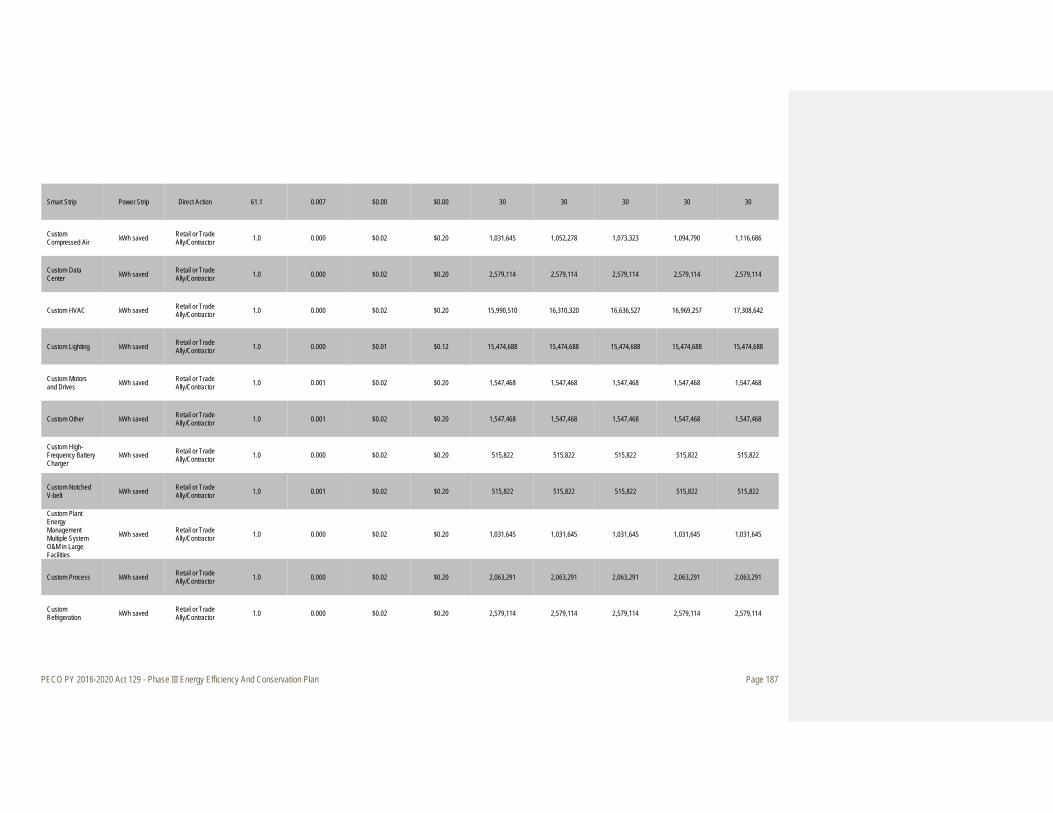
PECO PY 2016-2020 Act 129 - Phase III Energy Efficiency And Conservation Plan Page 187
Smart Strip Power Strip Direct Action 61.1 0.007 $0.00 $0.00 30 30 30 30 30
Custom Compressed Air kWh saved Retail or Trade
Ally/Contractor 1.0 0.000 $0.02 $0.20 1,031,645 1,052,278 1,073,323 1,094,790 1,116,686
Custom Data Center kWh saved Retail or Trade
Ally/Contractor 1.0 0.000 $0.02 $0.20 2,579,114 2,579,114 2,579,114 2,579,114 2,579,114
Custom HVAC kWh saved Retail or Trade Ally/Contractor 1.0 0.000 $0.02 $0.20 15,990,510 16,310,320 16,636,527 16,969,257 17,308,642
Custom Lighting kWh saved Retail or Trade Ally/Contractor 1.0 0.000 $0.01 $0.12 15,474,688 15,474,688 15,474,688 15,474,688 15,474,688
Custom Motors and Drives kWh saved Retail or Trade
Ally/Contractor 1.0 0.001 $0.02 $0.20 1,547,468 1,547,468 1,547,468 1,547,468 1,547,468
Custom Other kWh saved Retail or Trade Ally/Contractor 1.0 0.001 $0.02 $0.20 1,547,468 1,547,468 1,547,468 1,547,468 1,547,468
Custom High-Frequency Battery Charger
kWh saved Retail or Trade Ally/Contractor 1.0 0.000 $0.02 $0.20 515,822 515,822 515,822 515,822 515,822
Custom Notched V-belt kWh saved Retail or Trade
Ally/Contractor 1.0 0.001 $0.02 $0.20 515,822 515,822 515,822 515,822 515,822
Custom Plant Energy Management Multiple System O&M in Large Facilities
kWh saved Retail or Trade Ally/Contractor 1.0 0.000 $0.02 $0.20 1,031,645 1,031,645 1,031,645 1,031,645 1,031,645
Custom Process kWh saved Retail or Trade Ally/Contractor 1.0 0.000 $0.02 $0.20 2,063,291 2,063,291 2,063,291 2,063,291 2,063,291
Custom Refrigeration kWh saved Retail or Trade
Ally/Contractor 1.0 0.000 $0.02 $0.20 2,579,114 2,579,114 2,579,114 2,579,114 2,579,114

PECO PY 2016-2020 Act 129 - Phase III Energy Efficiency And Conservation Plan Page 188
Custom Strategic Energy Management
kWh saved Retail or Trade Ally/Contractor 1.0 0.000 $0.02 $0.20 2,063,291 2,063,291 2,063,291 2,063,291 2,063,291
Air Cooled Chiller Ton Retail or Trade Ally/Contractor 873.2 0.230 $5.00 $75.00 240 240 240 240 240
Air Cooled Chiller Without Condenser
Ton Retail or Trade Ally/Contractor 882.6 0.091 $5.00 $75.00 240 240 240 240 240
Computer Room Air Conditioner Ton Retail or Trade
Ally/Contractor 1,509.1 0.087 $5.00 $50.00 144 144 144 144 144
Computer Room Air Handler Ton Retail or Trade
Ally/Contractor 72.5 0.038 $5.00 $50.00 34,166 34,166 34,166 34,166 34,166
HVAC System Optimization kWh saved Retail or Trade
Ally/Contractor 72.5 0.038 $0.02 $0.20 12,611 12,611 12,611 12,611 12,611
Water Cooled Centrifugal Chiller Ton Retail or Trade
Ally/Contractor 488.8 0.000 $2.50 $50.00 80 80 80 80 80
Water Cooled Positive Displacement or Reciprocating Chiller
Ton Retail or Trade Ally/Contractor 552.4 0.000 $2.50 $75.00 240 240 240 240 240
Uninterruptible Power Supply kVA Retail or Trade
Ally/Contractor 215.0 0.025 $0.50 $40.00 735 735 735 735 735
Uninterruptible Power Supply kVA Retail or Trade
Ally/Contractor 65.4 0.007 $0.50 $40.00 2,895 2,895 2,895 2,895 2,895
Hot/Cold Aisle Containment kWh saved Retail or Trade
Ally/Contractor 97.9 0.011 $0.02 $0.20 4,410 4,410 4,410 4,410 4,410
Mainframe Refresh kW installed Retail or Trade Ally/Contractor 97.9 0.011 $2.50 $20.00 18,746 18,746 18,746 18,746 18,746
Server Refresh kW installed Retail or Trade Ally/Contractor 97.9 0.011 $2.50 $20.00 6,616 6,616 6,616 6,616 6,616
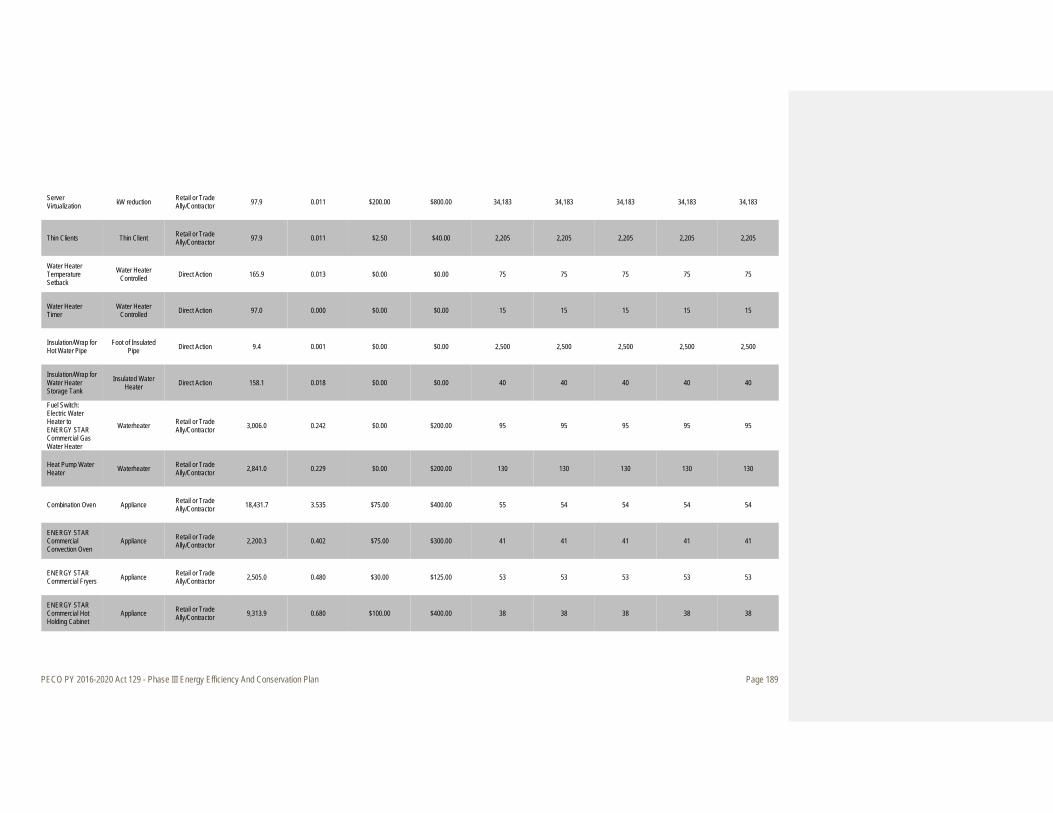
PECO PY 2016-2020 Act 129 - Phase III Energy Efficiency And Conservation Plan Page 189
Server Virtualization kW reduction Retail or Trade
Ally/Contractor 97.9 0.011 $200.00 $800.00 34,183 34,183 34,183 34,183 34,183
Thin Clients Thin Client Retail or Trade Ally/Contractor 97.9 0.011 $2.50 $40.00 2,205 2,205 2,205 2,205 2,205
Water Heater Temperature Setback
Water Heater Controlled Direct Action 165.9 0.013 $0.00 $0.00 75 75 75 75 75
Water Heater Timer
Water Heater Controlled Direct Action 97.0 0.000 $0.00 $0.00 15 15 15 15 15
Insulation/Wrap for Hot Water Pipe
Foot of Insulated Pipe Direct Action 9.4 0.001 $0.00 $0.00 2,500 2,500 2,500 2,500 2,500
Insulation/Wrap for Water Heater Storage Tank
Insulated Water Heater Direct Action 158.1 0.018 $0.00 $0.00 40 40 40 40 40
Fuel Switch: Electric Water Heater to ENERGY STAR Commercial Gas Water Heater
Waterheater Retail or Trade Ally/Contractor 3,006.0 0.242 $0.00 $200.00 95 95 95 95 95
Heat Pump Water Heater Waterheater Retail or Trade
Ally/Contractor 2,841.0 0.229 $0.00 $200.00 130 130 130 130 130
Combination Oven Appliance Retail or Trade Ally/Contractor 18,431.7 3.535 $75.00 $400.00 55 54 54 54 54
ENERGY STAR Commercial Convection Oven
Appliance Retail or Trade Ally/Contractor 2,200.3 0.402 $75.00 $300.00 41 41 41 41 41
ENERGY STAR Commercial Fryers Appliance Retail or Trade
Ally/Contractor 2,505.0 0.480 $30.00 $125.00 53 53 53 53 53
ENERGY STAR Commercial Hot Holding Cabinet
Appliance Retail or Trade Ally/Contractor 9,313.9 0.680 $100.00 $400.00 38 38 38 38 38
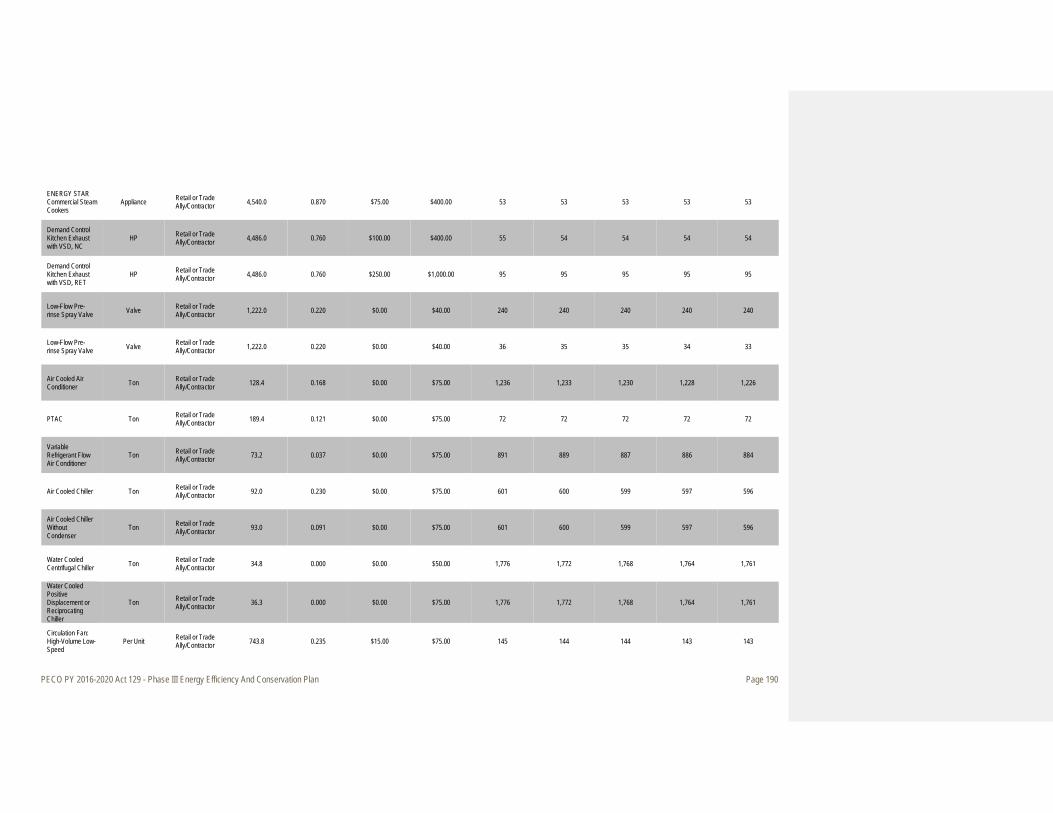
PECO PY 2016-2020 Act 129 - Phase III Energy Efficiency And Conservation Plan Page 190
ENERGY STAR Commercial Steam Cookers
Appliance Retail or Trade Ally/Contractor 4,540.0 0.870 $75.00 $400.00 53 53 53 53 53
Demand Control Kitchen Exhaust with VSD, NC
HP Retail or Trade Ally/Contractor 4,486.0 0.760 $100.00 $400.00 55 54 54 54 54
Demand Control Kitchen Exhaust with VSD, RET
HP Retail or Trade Ally/Contractor 4,486.0 0.760 $250.00 $1,000.00 95 95 95 95 95
Low-Flow Pre-rinse Spray Valve Valve Retail or Trade
Ally/Contractor 1,222.0 0.220 $0.00 $40.00 240 240 240 240 240
Low-Flow Pre-rinse Spray Valve Valve Retail or Trade
Ally/Contractor 1,222.0 0.220 $0.00 $40.00 36 35 35 34 33
Air Cooled Air Conditioner Ton Retail or Trade
Ally/Contractor 128.4 0.168 $0.00 $75.00 1,236 1,233 1,230 1,228 1,226
PTAC Ton Retail or Trade Ally/Contractor 189.4 0.121 $0.00 $75.00 72 72 72 72 72
Variable Refrigerant Flow Air Conditioner
Ton Retail or Trade Ally/Contractor 73.2 0.037 $0.00 $75.00 891 889 887 886 884
Air Cooled Chiller Ton Retail or Trade Ally/Contractor 92.0 0.230 $0.00 $75.00 601 600 599 597 596
Air Cooled Chiller Without Condenser
Ton Retail or Trade Ally/Contractor 93.0 0.091 $0.00 $75.00 601 600 599 597 596
Water Cooled Centrifugal Chiller Ton Retail or Trade
Ally/Contractor 34.8 0.000 $0.00 $50.00 1,776 1,772 1,768 1,764 1,761
Water Cooled Positive Displacement or Reciprocating Chiller
Ton Retail or Trade Ally/Contractor 36.3 0.000 $0.00 $75.00 1,776 1,772 1,768 1,764 1,761
Circulation Fan: High-Volume Low-Speed
Per Unit Retail or Trade Ally/Contractor 743.8 0.235 $15.00 $75.00 145 144 144 143 143
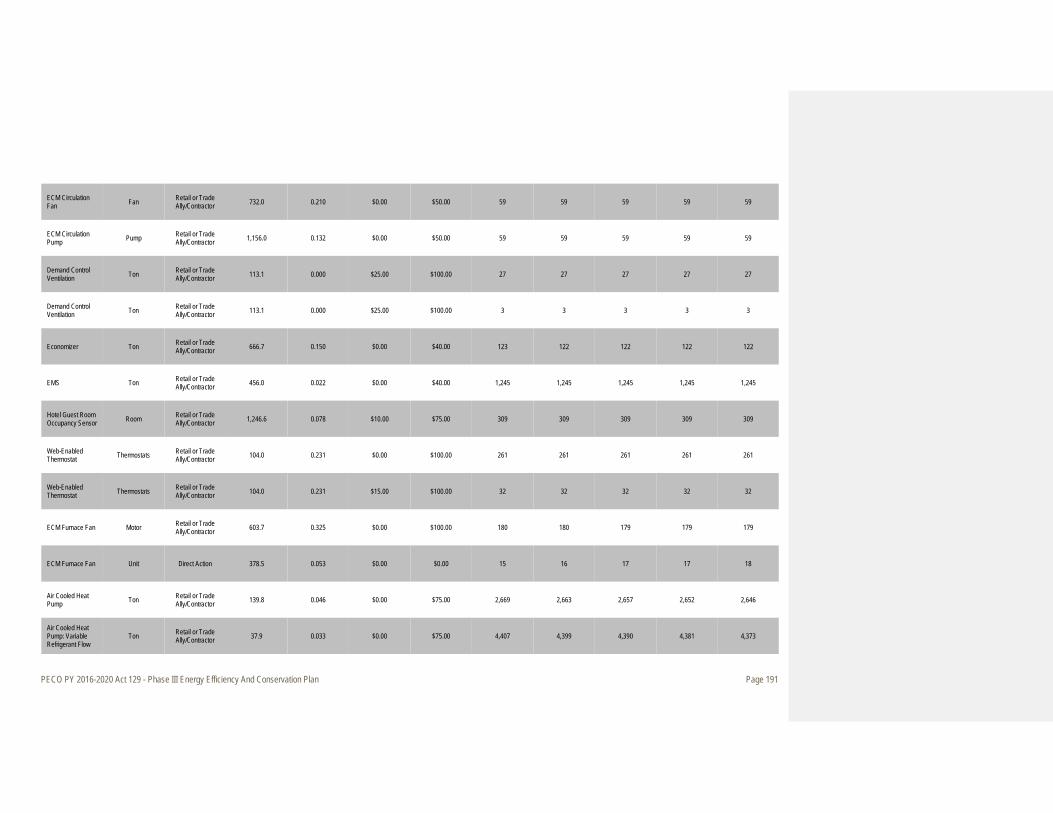
PECO PY 2016-2020 Act 129 - Phase III Energy Efficiency And Conservation Plan Page 191
ECM Circulation Fan Fan Retail or Trade
Ally/Contractor 732.0 0.210 $0.00 $50.00 59 59 59 59 59
ECM Circulation Pump Pump Retail or Trade
Ally/Contractor 1,156.0 0.132 $0.00 $50.00 59 59 59 59 59
Demand Control Ventilation Ton Retail or Trade
Ally/Contractor 113.1 0.000 $25.00 $100.00 27 27 27 27 27
Demand Control Ventilation Ton Retail or Trade
Ally/Contractor 113.1 0.000 $25.00 $100.00 3 3 3 3 3
Economizer Ton Retail or Trade Ally/Contractor 666.7 0.150 $0.00 $40.00 123 122 122 122 122
EMS Ton Retail or Trade Ally/Contractor 456.0 0.022 $0.00 $40.00 1,245 1,245 1,245 1,245 1,245
Hotel Guest Room Occupancy Sensor Room Retail or Trade
Ally/Contractor 1,246.6 0.078 $10.00 $75.00 309 309 309 309 309
Web-Enabled Thermostat Thermostats Retail or Trade
Ally/Contractor 104.0 0.231 $0.00 $100.00 261 261 261 261 261
Web-Enabled Thermostat Thermostats Retail or Trade
Ally/Contractor 104.0 0.231 $15.00 $100.00 32 32 32 32 32
ECM Furnace Fan Motor Retail or Trade Ally/Contractor 603.7 0.325 $0.00 $100.00 180 180 179 179 179
ECM Furnace Fan Unit Direct Action 378.5 0.053 $0.00 $0.00 15 16 17 17 18
Air Cooled Heat Pump Ton Retail or Trade
Ally/Contractor 139.8 0.046 $0.00 $75.00 2,669 2,663 2,657 2,652 2,646
Air Cooled Heat Pump: Variable Refrigerant Flow
Ton Retail or Trade Ally/Contractor 37.9 0.033 $0.00 $75.00 4,407 4,399 4,390 4,381 4,373
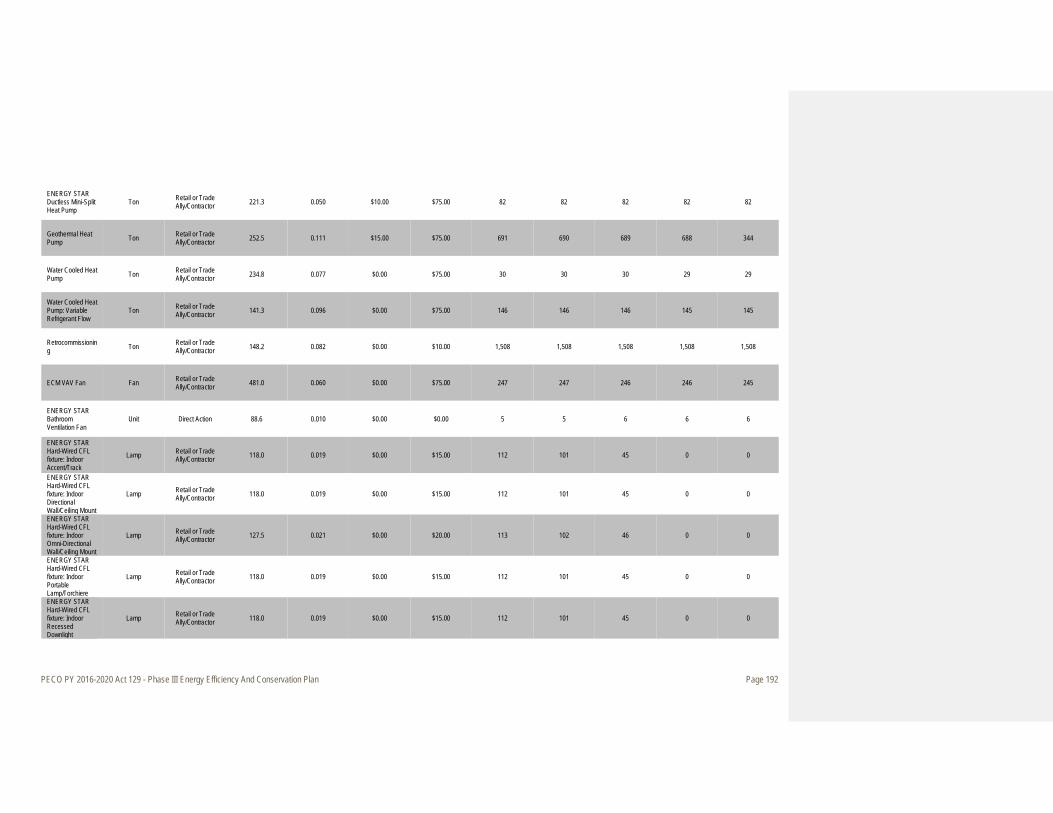
PECO PY 2016-2020 Act 129 - Phase III Energy Efficiency And Conservation Plan Page 192
ENERGY STAR Ductless Mini-Split Heat Pump
Ton Retail or Trade Ally/Contractor 221.3 0.050 $10.00 $75.00 82 82 82 82 82
Geothermal Heat Pump Ton Retail or Trade
Ally/Contractor 252.5 0.111 $15.00 $75.00 691 690 689 688 344
Water Cooled Heat Pump Ton Retail or Trade
Ally/Contractor 234.8 0.077 $0.00 $75.00 30 30 30 29 29
Water Cooled Heat Pump: Variable Refrigerant Flow
Ton Retail or Trade Ally/Contractor 141.3 0.096 $0.00 $75.00 146 146 146 145 145
Retrocommissioning Ton Retail or Trade
Ally/Contractor 148.2 0.082 $0.00 $10.00 1,508 1,508 1,508 1,508 1,508
ECM VAV Fan Fan Retail or Trade Ally/Contractor 481.0 0.060 $0.00 $75.00 247 247 246 246 245
ENERGY STAR Bathroom Ventilation Fan
Unit Direct Action 88.6 0.010 $0.00 $0.00 5 5 6 6 6
ENERGY STAR Hard-Wired CFL fixture: Indoor Accent/Track
Lamp Retail or Trade Ally/Contractor 118.0 0.019 $0.00 $15.00 112 101 45 0 0
ENERGY STAR Hard-Wired CFL fixture: Indoor Directional Wall/Ceiling Mount
Lamp Retail or Trade Ally/Contractor 118.0 0.019 $0.00 $15.00 112 101 45 0 0
ENERGY STAR Hard-Wired CFL fixture: Indoor Omni-Directional Wall/Ceiling Mount
Lamp Retail or Trade Ally/Contractor 127.5 0.021 $0.00 $20.00 113 102 46 0 0
ENERGY STAR Hard-Wired CFL fixture: Indoor Portable Lamp/Torchiere
Lamp Retail or Trade Ally/Contractor 118.0 0.019 $0.00 $15.00 112 101 45 0 0
ENERGY STAR Hard-Wired CFL fixture: Indoor Recessed Downlight
Lamp Retail or Trade Ally/Contractor 118.0 0.019 $0.00 $15.00 112 101 45 0 0
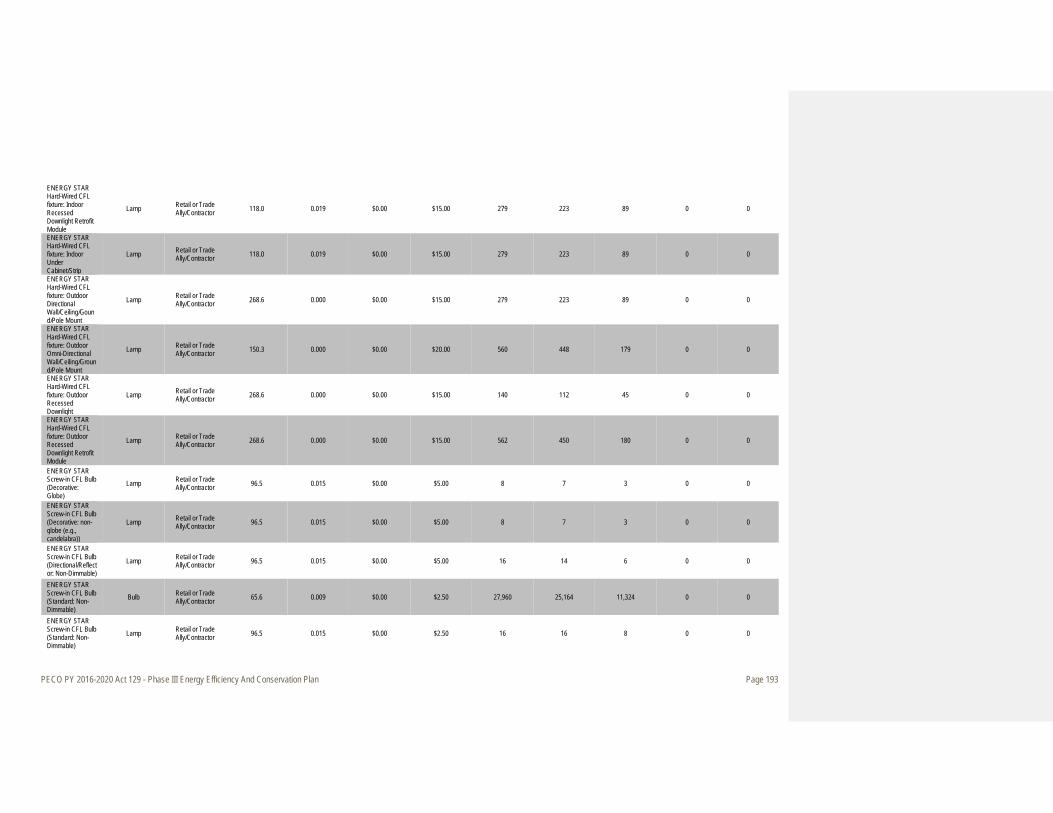
PECO PY 2016-2020 Act 129 - Phase III Energy Efficiency And Conservation Plan Page 193
ENERGY STAR Hard-Wired CFL fixture: Indoor Recessed Downlight Retrofit Module
Lamp Retail or Trade Ally/Contractor 118.0 0.019 $0.00 $15.00 279 223 89 0 0
ENERGY STAR Hard-Wired CFL fixture: Indoor Under Cabinet/Strip
Lamp Retail or Trade Ally/Contractor 118.0 0.019 $0.00 $15.00 279 223 89 0 0
ENERGY STAR Hard-Wired CFL fixture: Outdoor Directional Wall/Ceiling/Gound/Pole Mount
Lamp Retail or Trade Ally/Contractor 268.6 0.000 $0.00 $15.00 279 223 89 0 0
ENERGY STAR Hard-Wired CFL fixture: Outdoor Omni-Directional Wall/Ceiling/Ground/Pole Mount
Lamp Retail or Trade Ally/Contractor 150.3 0.000 $0.00 $20.00 560 448 179 0 0
ENERGY STAR Hard-Wired CFL fixture: Outdoor Recessed Downlight
Lamp Retail or Trade Ally/Contractor 268.6 0.000 $0.00 $15.00 140 112 45 0 0
ENERGY STAR Hard-Wired CFL fixture: Outdoor Recessed Downlight Retrofit Module
Lamp Retail or Trade Ally/Contractor 268.6 0.000 $0.00 $15.00 562 450 180 0 0
ENERGY STAR Screw-in CFL Bulb (Decorative: Globe)
Lamp Retail or Trade Ally/Contractor 96.5 0.015 $0.00 $5.00 8 7 3 0 0
ENERGY STAR Screw-in CFL Bulb (Decorative: non-globe (e.g., candelabra))
Lamp Retail or Trade Ally/Contractor 96.5 0.015 $0.00 $5.00 8 7 3 0 0
ENERGY STAR Screw-in CFL Bulb (Directional/Reflector: Non-Dimmable)
Lamp Retail or Trade Ally/Contractor 96.5 0.015 $0.00 $5.00 16 14 6 0 0
ENERGY STAR Screw-in CFL Bulb (Standard: Non-Dimmable)
Bulb Retail or Trade Ally/Contractor 65.6 0.009 $0.00 $2.50 27,960 25,164 11,324 0 0
ENERGY STAR Screw-in CFL Bulb (Standard: Non-Dimmable)
Lamp Retail or Trade Ally/Contractor 96.5 0.015 $0.00 $2.50 16 16 8 0 0
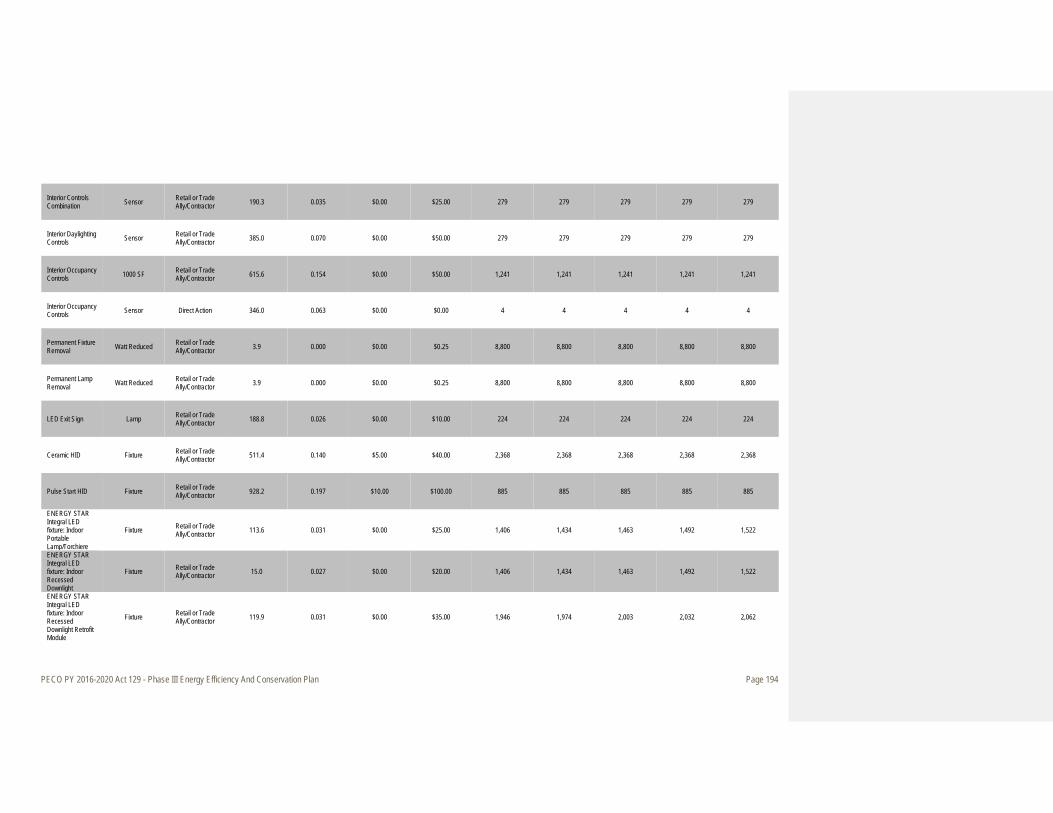
PECO PY 2016-2020 Act 129 - Phase III Energy Efficiency And Conservation Plan Page 194
Interior Controls Combination Sensor Retail or Trade
Ally/Contractor 190.3 0.035 $0.00 $25.00 279 279 279 279 279
Interior Daylighting Controls Sensor Retail or Trade
Ally/Contractor 385.0 0.070 $0.00 $50.00 279 279 279 279 279
Interior Occupancy Controls 1000 SF Retail or Trade
Ally/Contractor 615.6 0.154 $0.00 $50.00 1,241 1,241 1,241 1,241 1,241
Interior Occupancy Controls Sensor Direct Action 346.0 0.063 $0.00 $0.00 4 4 4 4 4
Permanent Fixture Removal Watt Reduced Retail or Trade
Ally/Contractor 3.9 0.000 $0.00 $0.25 8,800 8,800 8,800 8,800 8,800
Permanent Lamp Removal Watt Reduced Retail or Trade
Ally/Contractor 3.9 0.000 $0.00 $0.25 8,800 8,800 8,800 8,800 8,800
LED Exit Sign Lamp Retail or Trade Ally/Contractor 188.8 0.026 $0.00 $10.00 224 224 224 224 224
Ceramic HID Fixture Retail or Trade Ally/Contractor 511.4 0.140 $5.00 $40.00 2,368 2,368 2,368 2,368 2,368
Pulse Start HID Fixture Retail or Trade Ally/Contractor 928.2 0.197 $10.00 $100.00 885 885 885 885 885
ENERGY STAR Integral LED fixture: Indoor Portable Lamp/Torchiere
Fixture Retail or Trade Ally/Contractor 113.6 0.031 $0.00 $25.00 1,406 1,434 1,463 1,492 1,522
ENERGY STAR Integral LED fixture: Indoor Recessed Downlight
Fixture Retail or Trade Ally/Contractor 15.0 0.027 $0.00 $20.00 1,406 1,434 1,463 1,492 1,522
ENERGY STAR Integral LED fixture: Indoor Recessed Downlight Retrofit Module
Fixture Retail or Trade Ally/Contractor 119.9 0.031 $0.00 $35.00 1,946 1,974 2,003 2,032 2,062
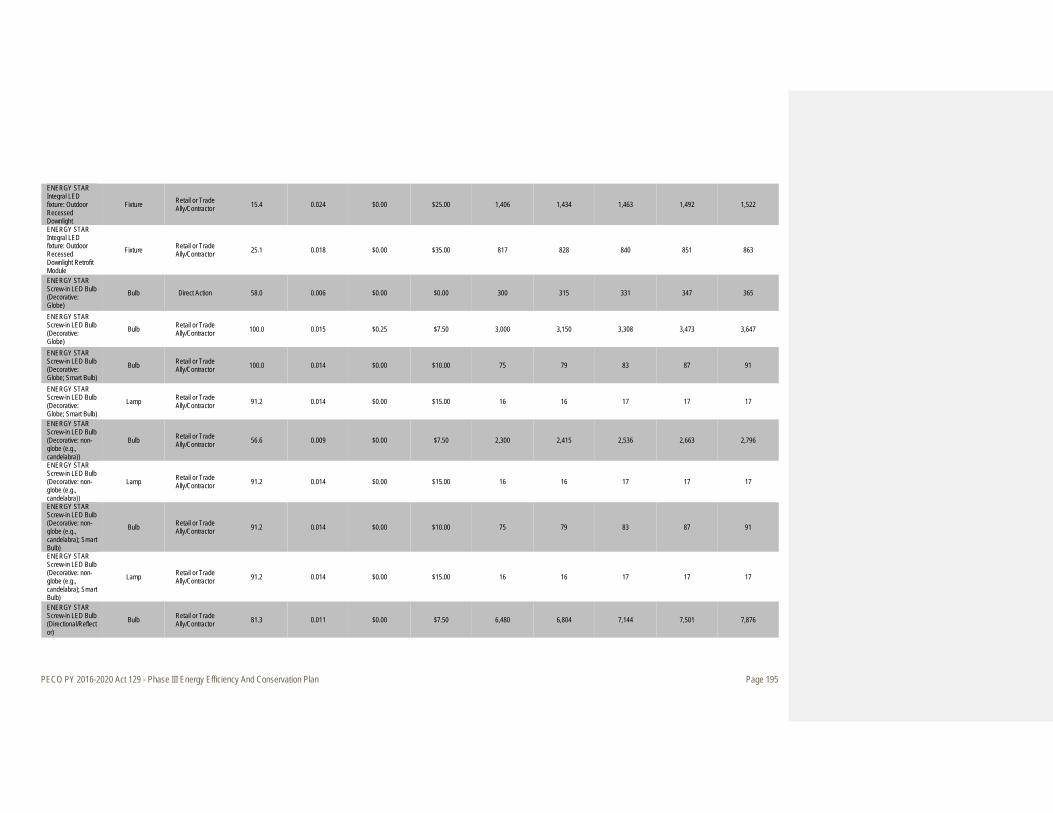
PECO PY 2016-2020 Act 129 - Phase III Energy Efficiency And Conservation Plan Page 195
ENERGY STAR Integral LED fixture: Outdoor Recessed Downlight
Fixture Retail or Trade Ally/Contractor 15.4 0.024 $0.00 $25.00 1,406 1,434 1,463 1,492 1,522
ENERGY STAR Integral LED fixture: Outdoor Recessed Downlight Retrofit Module
Fixture Retail or Trade Ally/Contractor 25.1 0.018 $0.00 $35.00 817 828 840 851 863
ENERGY STAR Screw-in LED Bulb (Decorative: Globe)
Bulb Direct Action 58.0 0.006 $0.00 $0.00 300 315 331 347 365
ENERGY STAR Screw-in LED Bulb (Decorative: Globe)
Bulb Retail or Trade Ally/Contractor 100.0 0.015 $0.25 $7.50 3,000 3,150 3,308 3,473 3,647
ENERGY STAR Screw-in LED Bulb (Decorative: Globe; Smart Bulb)
Bulb Retail or Trade Ally/Contractor 100.0 0.014 $0.00 $10.00 75 79 83 87 91
ENERGY STAR Screw-in LED Bulb (Decorative: Globe; Smart Bulb)
Lamp Retail or Trade Ally/Contractor 91.2 0.014 $0.00 $15.00 16 16 17 17 17
ENERGY STAR Screw-in LED Bulb (Decorative: non-globe (e.g., candelabra))
Bulb Retail or Trade Ally/Contractor 56.6 0.009 $0.00 $7.50 2,300 2,415 2,536 2,663 2,796
ENERGY STAR Screw-in LED Bulb (Decorative: non-globe (e.g., candelabra))
Lamp Retail or Trade Ally/Contractor 91.2 0.014 $0.00 $15.00 16 16 17 17 17
ENERGY STAR Screw-in LED Bulb (Decorative: non-globe (e.g., candelabra); Smart Bulb)
Bulb Retail or Trade Ally/Contractor 91.2 0.014 $0.00 $10.00 75 79 83 87 91
ENERGY STAR Screw-in LED Bulb (Decorative: non-globe (e.g., candelabra); Smart Bulb)
Lamp Retail or Trade Ally/Contractor 91.2 0.014 $0.00 $15.00 16 16 17 17 17
ENERGY STAR Screw-in LED Bulb (Directional/Reflector)
Bulb Retail or Trade Ally/Contractor 81.3 0.011 $0.00 $7.50 6,480 6,804 7,144 7,501 7,876
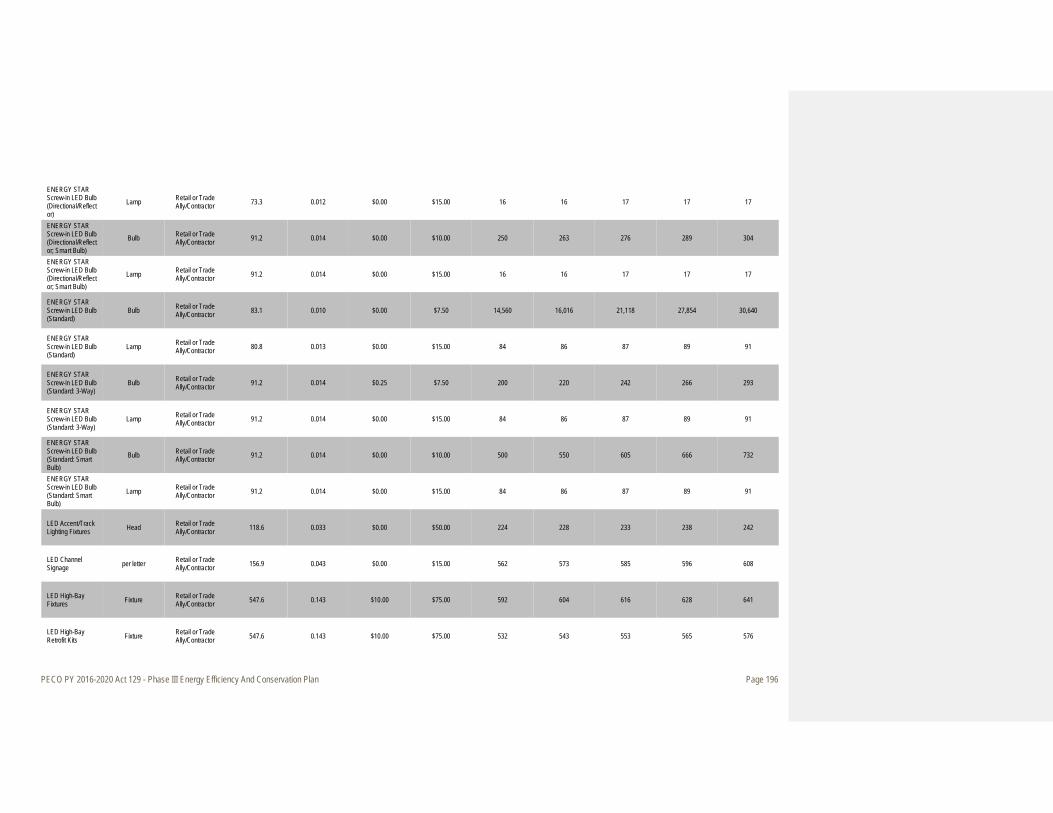
PECO PY 2016-2020 Act 129 - Phase III Energy Efficiency And Conservation Plan Page 196
ENERGY STAR Screw-in LED Bulb (Directional/Reflector)
Lamp Retail or Trade Ally/Contractor 73.3 0.012 $0.00 $15.00 16 16 17 17 17
ENERGY STAR Screw-in LED Bulb (Directional/Reflector; Smart Bulb)
Bulb Retail or Trade Ally/Contractor 91.2 0.014 $0.00 $10.00 250 263 276 289 304
ENERGY STAR Screw-in LED Bulb (Directional/Reflector; Smart Bulb)
Lamp Retail or Trade Ally/Contractor 91.2 0.014 $0.00 $15.00 16 16 17 17 17
ENERGY STAR Screw-in LED Bulb (Standard)
Bulb Retail or Trade Ally/Contractor 83.1 0.010 $0.00 $7.50 14,560 16,016 21,118 27,854 30,640
ENERGY STAR Screw-in LED Bulb (Standard)
Lamp Retail or Trade Ally/Contractor 80.8 0.013 $0.00 $15.00 84 86 87 89 91
ENERGY STAR Screw-in LED Bulb (Standard: 3-Way)
Bulb Retail or Trade Ally/Contractor 91.2 0.014 $0.25 $7.50 200 220 242 266 293
ENERGY STAR Screw-in LED Bulb (Standard: 3-Way)
Lamp Retail or Trade Ally/Contractor 91.2 0.014 $0.00 $15.00 84 86 87 89 91
ENERGY STAR Screw-in LED Bulb (Standard: Smart Bulb)
Bulb Retail or Trade Ally/Contractor 91.2 0.014 $0.00 $10.00 500 550 605 666 732
ENERGY STAR Screw-in LED Bulb (Standard: Smart Bulb)
Lamp Retail or Trade Ally/Contractor 91.2 0.014 $0.00 $15.00 84 86 87 89 91
LED Accent/Track Lighting Fixtures Head Retail or Trade
Ally/Contractor 118.6 0.033 $0.00 $50.00 224 228 233 238 242
LED Channel Signage per letter Retail or Trade
Ally/Contractor 156.9 0.043 $0.00 $15.00 562 573 585 596 608
LED High-Bay Fixtures Fixture Retail or Trade
Ally/Contractor 547.6 0.143 $10.00 $75.00 592 604 616 628 641
LED High-Bay Retrofit Kits Fixture Retail or Trade
Ally/Contractor 547.6 0.143 $10.00 $75.00 532 543 553 565 576
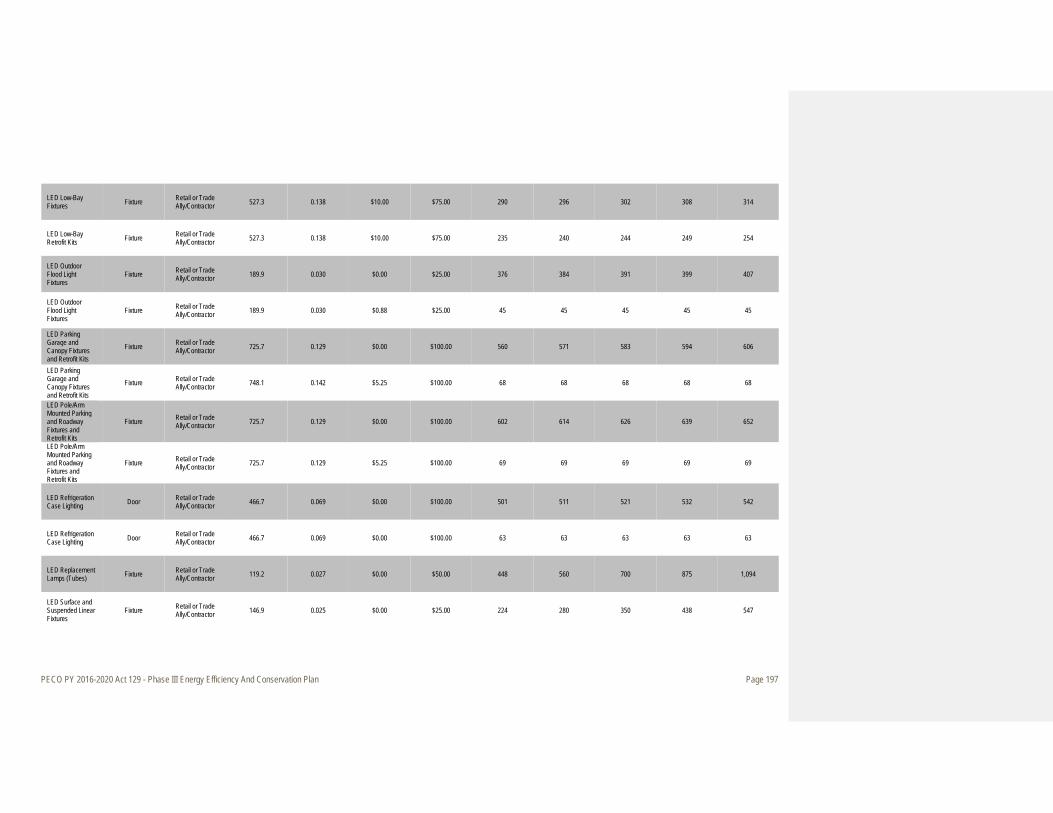
PECO PY 2016-2020 Act 129 - Phase III Energy Efficiency And Conservation Plan Page 197
LED Low-Bay Fixtures Fixture Retail or Trade
Ally/Contractor 527.3 0.138 $10.00 $75.00 290 296 302 308 314
LED Low-Bay Retrofit Kits Fixture Retail or Trade
Ally/Contractor 527.3 0.138 $10.00 $75.00 235 240 244 249 254
LED Outdoor Flood Light Fixtures
Fixture Retail or Trade Ally/Contractor 189.9 0.030 $0.00 $25.00 376 384 391 399 407
LED Outdoor Flood Light Fixtures
Fixture Retail or Trade Ally/Contractor 189.9 0.030 $0.88 $25.00 45 45 45 45 45
LED Parking Garage and Canopy Fixtures and Retrofit Kits
Fixture Retail or Trade Ally/Contractor 725.7 0.129 $0.00 $100.00 560 571 583 594 606
LED Parking Garage and Canopy Fixtures and Retrofit Kits
Fixture Retail or Trade Ally/Contractor 748.1 0.142 $5.25 $100.00 68 68 68 68 68
LED Pole/Arm Mounted Parking and Roadway Fixtures and Retrofit Kits
Fixture Retail or Trade Ally/Contractor 725.7 0.129 $0.00 $100.00 602 614 626 639 652
LED Pole/Arm Mounted Parking and Roadway Fixtures and Retrofit Kits
Fixture Retail or Trade Ally/Contractor 725.7 0.129 $5.25 $100.00 69 69 69 69 69
LED Refrigeration Case Lighting Door Retail or Trade
Ally/Contractor 466.7 0.069 $0.00 $100.00 501 511 521 532 542
LED Refrigeration Case Lighting Door Retail or Trade
Ally/Contractor 466.7 0.069 $0.00 $100.00 63 63 63 63 63
LED Replacement Lamps (Tubes) Fixture Retail or Trade
Ally/Contractor 119.2 0.027 $0.00 $50.00 448 560 700 875 1,094
LED Surface and Suspended Linear Fixtures
Fixture Retail or Trade Ally/Contractor 146.9 0.025 $0.00 $25.00 224 280 350 438 547

PECO PY 2016-2020 Act 129 - Phase III Energy Efficiency And Conservation Plan Page 198
LED Troffer Fixtures and Retrofit Kits
Fixture Retail or Trade Ally/Contractor 152.2 0.041 $0.00 $25.00 451 564 705 881 1,101
LED Troffer Fixtures with Integrated Controls
Fixture Retail or Trade Ally/Contractor 177.8 0.048 $0.00 $25.00 562 703 878 1,098 1,372
LED Wall Mount Fixtures and Retrofit Kits
Fixture Retail or Trade Ally/Contractor 717.0 0.164 $0.00 $100.00 649 662 675 688 702
LED Wall Mount Fixtures and Retrofit Kits
Fixture Retail or Trade Ally/Contractor 717.0 0.164 $4.38 $100.00 80 80 80 80 80
Screw-in LED Bulb (Standard; EUL = 10,000 Hr)
Bulb Retail or Trade Ally/Contractor 83.1 0.010 $0.00 $5.00 10,125 13,163 17,111 22,245 28,918
Better than Code LPD per sqft Retail or Trade
Ally/Contractor 1.3 0.000 $0.02 $0.50 660,000 646,800 633,864 621,187 608,763
HPT8 Fixture Fixture Retail or Trade Ally/Contractor 60.0 0.016 $0.00 $20.00 141 141 141 141 141
HPT8 High-Bay Fixture Fixture Retail or Trade
Ally/Contractor 419.6 0.082 $2.50 $40.00 147 147 147 147 147
Linear Fluorescent Lamp: HP T8 Lamp
Lamp Direct Action 58.0 0.011 $0.00 $0.00 70 74 77 81 85
Linear Fluorescent Lamp: RW T8 Lamp
Lamp Direct Action 20.8 0.004 $0.00 $0.00 70 74 77 81 85
Relamp/Reballast to HPT8 Fixture Retail or Trade
Ally/Contractor 39.4 0.008 $0.00 $25.00 599 599 599 599 599
RW T8 Lamp - Lamp only Lamp Retail or Trade
Ally/Contractor 37.6 0.010 $1.00 $5.00 166 166 166 166 166
T5 Fixture Fixture Retail or Trade Ally/Contractor 58.0 0.011 $0.00 $20.00 7 7 7 7 7
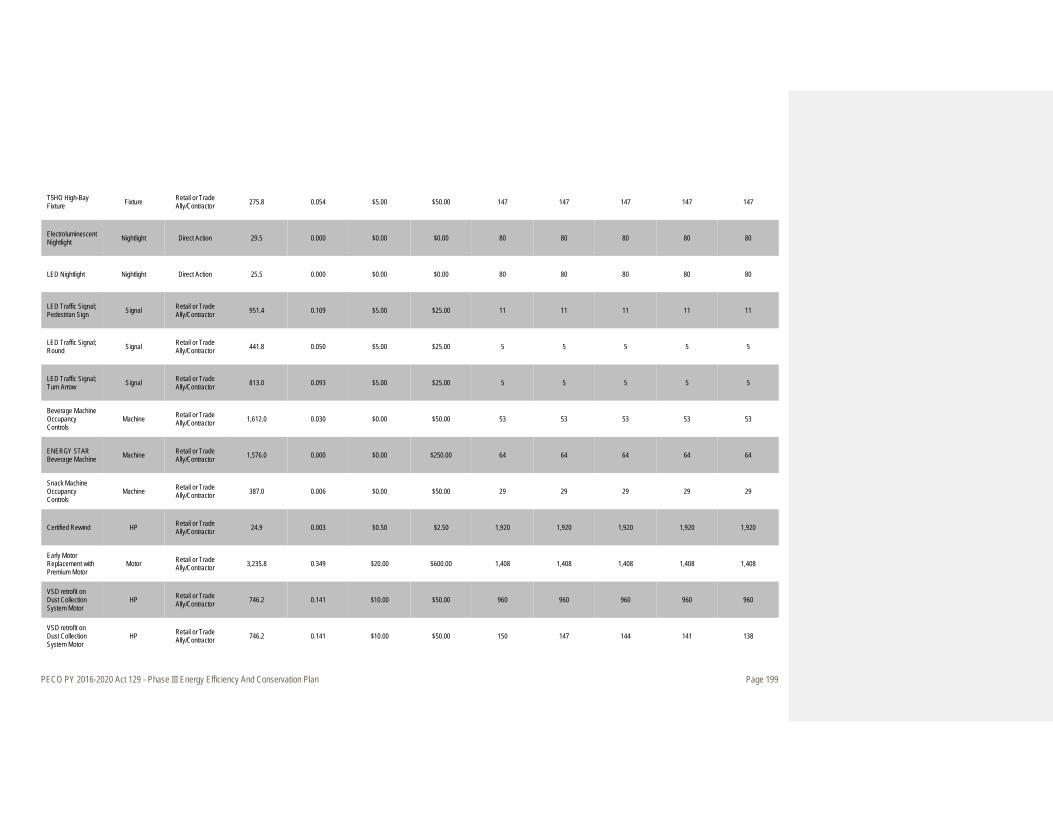
PECO PY 2016-2020 Act 129 - Phase III Energy Efficiency And Conservation Plan Page 199
T5HO High-Bay Fixture Fixture Retail or Trade
Ally/Contractor 275.8 0.054 $5.00 $50.00 147 147 147 147 147
Electroluminescent Nightlight Nightlight Direct Action 29.5 0.000 $0.00 $0.00 80 80 80 80 80
LED Nightlight Nightlight Direct Action 25.5 0.000 $0.00 $0.00 80 80 80 80 80
LED Traffic Signal; Pedestrian Sign Signal Retail or Trade
Ally/Contractor 951.4 0.109 $5.00 $25.00 11 11 11 11 11
LED Traffic Signal; Round Signal Retail or Trade
Ally/Contractor 441.8 0.050 $5.00 $25.00 5 5 5 5 5
LED Traffic Signal; Turn Arrow Signal Retail or Trade
Ally/Contractor 813.0 0.093 $5.00 $25.00 5 5 5 5 5
Beverage Machine Occupancy Controls
Machine Retail or Trade Ally/Contractor 1,612.0 0.030 $0.00 $50.00 53 53 53 53 53
ENERGY STAR Beverage Machine Machine Retail or Trade
Ally/Contractor 1,576.0 0.000 $0.00 $250.00 64 64 64 64 64
Snack Machine Occupancy Controls
Machine Retail or Trade Ally/Contractor 387.0 0.006 $0.00 $50.00 29 29 29 29 29
Certified Rewind HP Retail or Trade Ally/Contractor 24.9 0.003 $0.50 $2.50 1,920 1,920 1,920 1,920 1,920
Early Motor Replacement with Premium Motor
Motor Retail or Trade Ally/Contractor 3,235.8 0.349 $20.00 $600.00 1,408 1,408 1,408 1,408 1,408
VSD retrofit on Dust Collection System Motor
HP Retail or Trade Ally/Contractor 746.2 0.141 $10.00 $50.00 960 960 960 960 960
VSD retrofit on Dust Collection System Motor
HP Retail or Trade Ally/Contractor 746.2 0.141 $10.00 $50.00 150 147 144 141 138
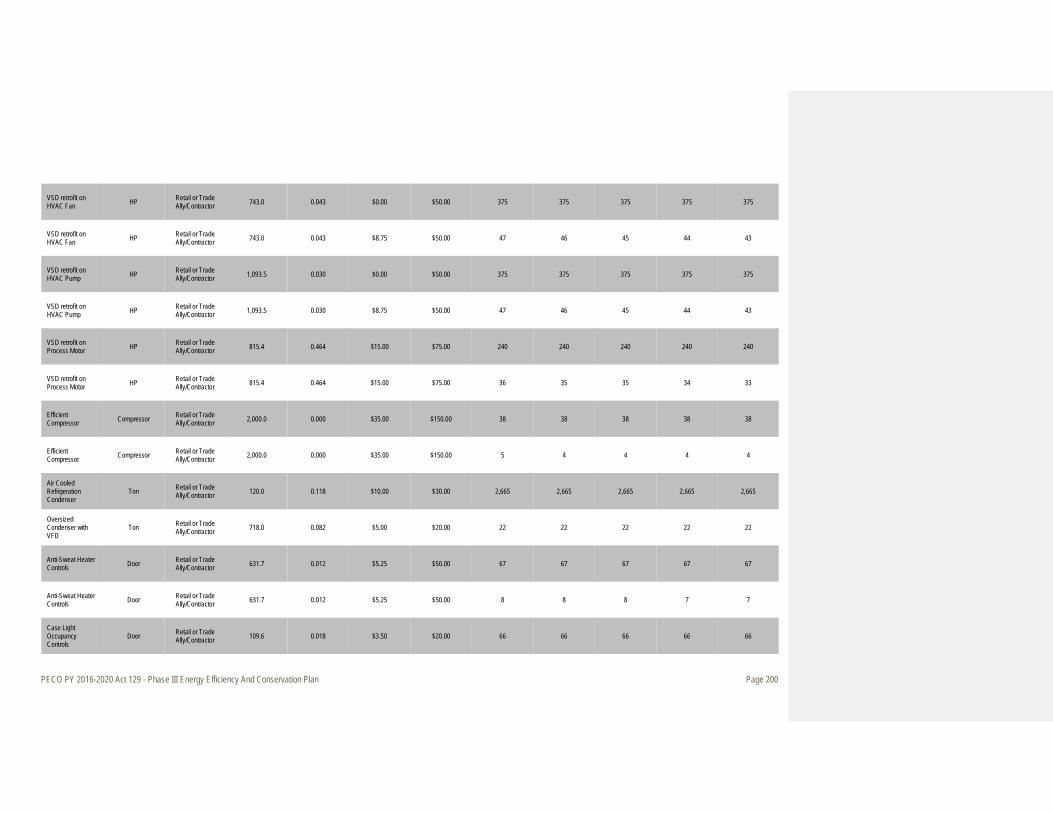
PECO PY 2016-2020 Act 129 - Phase III Energy Efficiency And Conservation Plan Page 200
VSD retrofit on HVAC Fan HP Retail or Trade
Ally/Contractor 743.0 0.043 $0.00 $50.00 375 375 375 375 375
VSD retrofit on HVAC Fan HP Retail or Trade
Ally/Contractor 743.0 0.043 $8.75 $50.00 47 46 45 44 43
VSD retrofit on HVAC Pump HP Retail or Trade
Ally/Contractor 1,093.5 0.030 $0.00 $50.00 375 375 375 375 375
VSD retrofit on HVAC Pump HP Retail or Trade
Ally/Contractor 1,093.5 0.030 $8.75 $50.00 47 46 45 44 43
VSD retrofit on Process Motor HP Retail or Trade
Ally/Contractor 815.4 0.464 $15.00 $75.00 240 240 240 240 240
VSD retrofit on Process Motor HP Retail or Trade
Ally/Contractor 815.4 0.464 $15.00 $75.00 36 35 35 34 33
Efficient Compressor Compressor Retail or Trade
Ally/Contractor 2,000.0 0.000 $35.00 $150.00 38 38 38 38 38
Efficient Compressor Compressor Retail or Trade
Ally/Contractor 2,000.0 0.000 $35.00 $150.00 5 4 4 4 4
Air Cooled Refrigeration Condenser
Ton Retail or Trade Ally/Contractor 120.0 0.118 $10.00 $30.00 2,665 2,665 2,665 2,665 2,665
Oversized Condenser with VFD
Ton Retail or Trade Ally/Contractor 718.0 0.082 $5.00 $20.00 22 22 22 22 22
Anti-Sweat Heater Controls Door Retail or Trade
Ally/Contractor 631.7 0.012 $5.25 $50.00 67 67 67 67 67
Anti-Sweat Heater Controls Door Retail or Trade
Ally/Contractor 631.7 0.012 $5.25 $50.00 8 8 8 7 7
Case Light Occupancy Controls
Door Retail or Trade Ally/Contractor 109.6 0.018 $3.50 $20.00 66 66 66 66 66
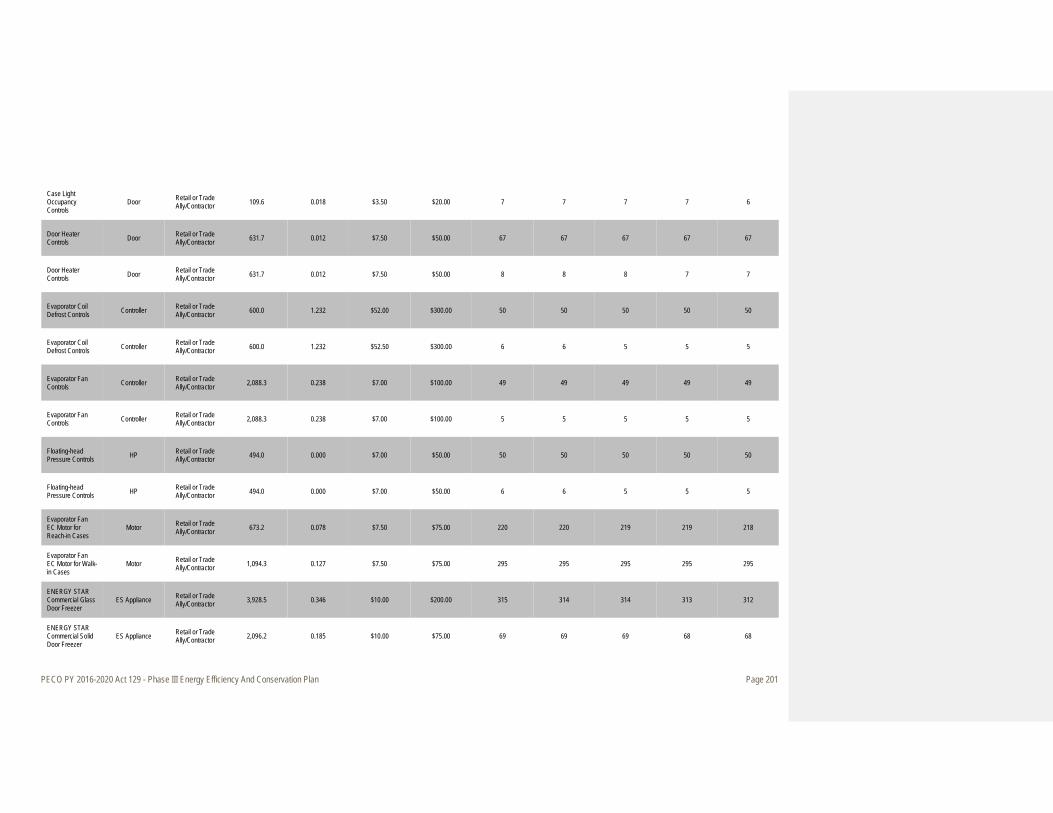
PECO PY 2016-2020 Act 129 - Phase III Energy Efficiency And Conservation Plan Page 201
Case Light Occupancy Controls
Door Retail or Trade Ally/Contractor 109.6 0.018 $3.50 $20.00 7 7 7 7 6
Door Heater Controls Door Retail or Trade
Ally/Contractor 631.7 0.012 $7.50 $50.00 67 67 67 67 67
Door Heater Controls Door Retail or Trade
Ally/Contractor 631.7 0.012 $7.50 $50.00 8 8 8 7 7
Evaporator Coil Defrost Controls Controller Retail or Trade
Ally/Contractor 600.0 1.232 $52.00 $300.00 50 50 50 50 50
Evaporator Coil Defrost Controls Controller Retail or Trade
Ally/Contractor 600.0 1.232 $52.50 $300.00 6 6 5 5 5
Evaporator Fan Controls Controller Retail or Trade
Ally/Contractor 2,088.3 0.238 $7.00 $100.00 49 49 49 49 49
Evaporator Fan Controls Controller Retail or Trade
Ally/Contractor 2,088.3 0.238 $7.00 $100.00 5 5 5 5 5
Floating-head Pressure Controls HP Retail or Trade
Ally/Contractor 494.0 0.000 $7.00 $50.00 50 50 50 50 50
Floating-head Pressure Controls HP Retail or Trade
Ally/Contractor 494.0 0.000 $7.00 $50.00 6 6 5 5 5
Evaporator Fan EC Motor for Reach-in Cases
Motor Retail or Trade Ally/Contractor 673.2 0.078 $7.50 $75.00 220 220 219 219 218
Evaporator Fan EC Motor for Walk-in Cases
Motor Retail or Trade Ally/Contractor 1,094.3 0.127 $7.50 $75.00 295 295 295 295 295
ENERGY STAR Commercial Glass Door Freezer
ES Appliance Retail or Trade Ally/Contractor 3,928.5 0.346 $10.00 $200.00 315 314 314 313 312
ENERGY STAR Commercial Solid Door Freezer
ES Appliance Retail or Trade Ally/Contractor 2,096.2 0.185 $10.00 $75.00 69 69 69 68 68

PECO PY 2016-2020 Act 129 - Phase III Energy Efficiency And Conservation Plan Page 202
Suction Pipe Insulation Linear Foot Retail or Trade
Ally/Contractor 13.1 0.002 $0.20 $1.13 148 148 148 148 148
Night Cover Linear Foot Retail or Trade Ally/Contractor 168.0 0.000 $2.50 $15.00 67 67 67 67 67
Night Cover Linear Foot Retail or Trade Ally/Contractor 168.0 0.000 $2.50 $15.00 8 8 8 7 7
Add Doors to Open Refrigerated Cases
Door Retail or Trade Ally/Contractor 1,017.0 0.039 $15.00 $125.00 69 69 69 69 69
Automatic Door Closers Door Retail or Trade
Ally/Contractor 1,737.0 0.285 $20.00 $100.00 67 67 67 67 67
Automatic Door Closers Door Retail or Trade
Ally/Contractor 1,737.0 0.285 $20.00 $100.00 8 8 8 7 7
Door Gaskets Door Retail or Trade Ally/Contractor 73.3 0.002 $1.00 $2.50 473 473 473 473 473
Zero Energy Doors Door Retail or Trade Ally/Contractor 1,400.0 0.053 $17.50 $100.00 97 97 97 97 97
Zero Energy Doors Door Retail or Trade Ally/Contractor 1,400.0 0.053 $17.50 $100.00 12 12 12 12 12
ENERGY STAR Commercial Glass Door Refrigerator
ES Appliance Retail or Trade Ally/Contractor 824.8 0.073 $15.00 $100.00 71 71 71 71 71
ENERGY STAR Commercial Solid Door Refrigerator
ES Appliance Retail or Trade Ally/Contractor 829.4 0.073 $10.00 $75.00 22 22 22 22 22
Strip Curtains Linear Foot Retail or Trade Ally/Contractor 93.8 0.011 $1.00 $3.50 159 159 159 159 159
Low Flow Faucet Aerator Aerator Direct Action 40.1 0.005 $0.00 $0.00 320 320 320 320 320

PECO PY 2016-2020 Act 129 - Phase III Energy Efficiency And Conservation Plan Page 203
Low Flow Faucet Aerator Aerator Retail or Trade
Ally/Contractor 32.8 0.008 $0.00 $4.00 30 29 29 28 28
Low Flow Showerhead Showerhead Direct Action 72.4 0.006 $0.00 $0.00 175 175 175 175 175
Low Flow Showerhead Showerhead Retail or Trade
Ally/Contractor 342.0 0.191 $0.00 $4.00 14 14 13 13 13
Thermostatic Restrictor Shower Valve
Showerhead Retail or Trade Ally/Contractor 327.1 0.014 $0.00 $30.00 2 2 2 2 2
Thermostatic Restrictor Shower Valve
Shower Valve Direct Action 38.9 0.003 $0.00 $0.00 115 115 115 115 115
Code Plus Building SF Retail or Trade Ally/Contractor 6.0 0.002 $0.10 $1.50 222,750 218,295 213,929 209,651 205,458
Net Zero Energy Building SF Retail or Trade
Ally/Contractor 12.3 0.003 $0.50 $3.00 24,750 24,750 24,750 24,750 24,750
Building Controls Optimization SF Retail or Trade
Ally/Contractor 2.5 0.000 $0.25 $1.00 74,250 74,250 74,250 74,250 74,250
Retrocommissioning SF Retail or Trade
Ally/Contractor 0.6 0.000 $0.05 $0.20 74,250 74,250 74,250 74,250 74,250

PECO PY 2016-2020 Act 129 - Phase III Energy Efficiency And Conservation Plan Page 204
Table E-5. CHP Program Measure Level Details CHP Program
Measure List Gross First Year Savings per Unit Incentive Range Annual Participation (Units)
Measure Name Units Pathway Energy Savings (kWh/unit)
Peak Demand Savings (kW/unit) Low High PY 2016 PY 2017 PY 2018 PY 2019 PY 2020
Bottoming Cycle CHP MW Capacity Retail or Trade Ally/Contractor 5,317,752.0 776.000 $40,000.00 $1,000,000.00 1 1 1 1 0
Fuel Cell MW Capacity Retail or Trade Ally/Contractor 4,266,217.3 653.125 $40,000.00 $1,000,000.00 0 0 0 0 0
Gas Turbine MW Capacity Retail or Trade Ally/Contractor 5,418,864.3 752.000 $40,000.00 $1,000,000.00 2 2 2 2 1
Micro-Turbine MW Capacity Retail or Trade Ally/Contractor 5,984,761.2 611.000 $40,000.00 $1,000,000.00 0 0 0 0 0
Other CHP kWh saved Retail or Trade Ally/Contractor 5,400,000.0 750.000 $40,000.00 $1,000,000.00 0 0 0 0 0
Other CHP MW Capacity Retail or Trade Ally/Contractor 5,400,000.0 750.000 $40,000.00 $1,000,000.00 0 0 0 0 0
Recip Engine MW Capacity Retail or Trade Ally/Contractor 5,358,042.4 752.000 $40,000.00 $1,000,000.00 10 10 11 12 4
Steam Turbine MW Capacity Retail or Trade Ally/Contractor 6,244,128.0 891.000 $40,000.00 $1,000,000.00 1 1 1 1 0
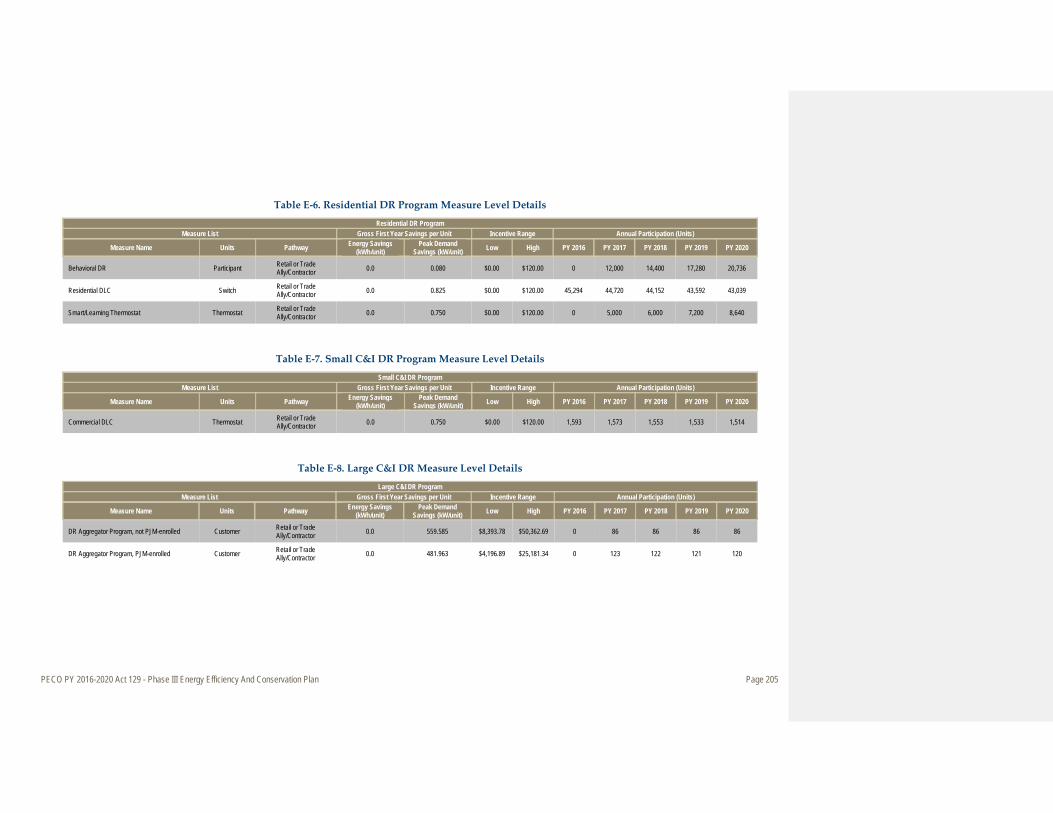
PECO PY 2016-2020 Act 129 - Phase III Energy Efficiency And Conservation Plan Page 205
Table E-6. Residential DR Program Measure Level Details
Residential DR Program Measure List Gross First Year Savings per Unit Incentive Range Annual Participation (Units)
Measure Name Units Pathway Energy Savings (kWh/unit)
Peak Demand Savings (kW/unit) Low High PY 2016 PY 2017 PY 2018 PY 2019 PY 2020
Behavioral DR Participant Retail or Trade Ally/Contractor 0.0 0.080 $0.00 $120.00 0 12,000 14,400 17,280 20,736
Residential DLC Switch Retail or Trade Ally/Contractor 0.0 0.825 $0.00 $120.00 45,294 44,720 44,152 43,592 43,039
Smart/Learning Thermostat Thermostat Retail or Trade Ally/Contractor 0.0 0.750 $0.00 $120.00 0 5,000 6,000 7,200 8,640
Table E-7. Small C&I DR Program Measure Level Details
Small C&I DR Program Measure List Gross First Year Savings per Unit Incentive Range Annual Participation (Units)
Measure Name Units Pathway Energy Savings (kWh/unit)
Peak Demand Savings (kW/unit) Low High PY 2016 PY 2017 PY 2018 PY 2019 PY 2020
Commercial DLC Thermostat Retail or Trade Ally/Contractor 0.0 0.750 $0.00 $120.00 1,593 1,573 1,553 1,533 1,514
Table E-8. Large C&I DR Measure Level Details
Large C&I DR Program Measure List Gross First Year Savings per Unit Incentive Range Annual Participation (Units)
Measure Name Units Pathway Energy Savings (kWh/unit)
Peak Demand Savings (kW/unit) Low High PY 2016 PY 2017 PY 2018 PY 2019 PY 2020
DR Aggregator Program, not PJM-enrolled Customer Retail or Trade Ally/Contractor 0.0 559.585 $8,393.78 $50,362.69 0 86 86 86 86
DR Aggregator Program, PJM-enrolled Customer Retail or Trade Ally/Contractor 0.0 481.963 $4,196.89 $25,181.34 0 123 122 121 120

PECO PY 2016-2020 Act 129 - Phase III Energy Efficiency And Conservation Plan Page 206
Appendix F. Exhibits RAS
Exhibits RAS-1, RAS-2, RAS-3 and RAS-4 are attached to the Direct Testimony of Richard A. Schlesinger.
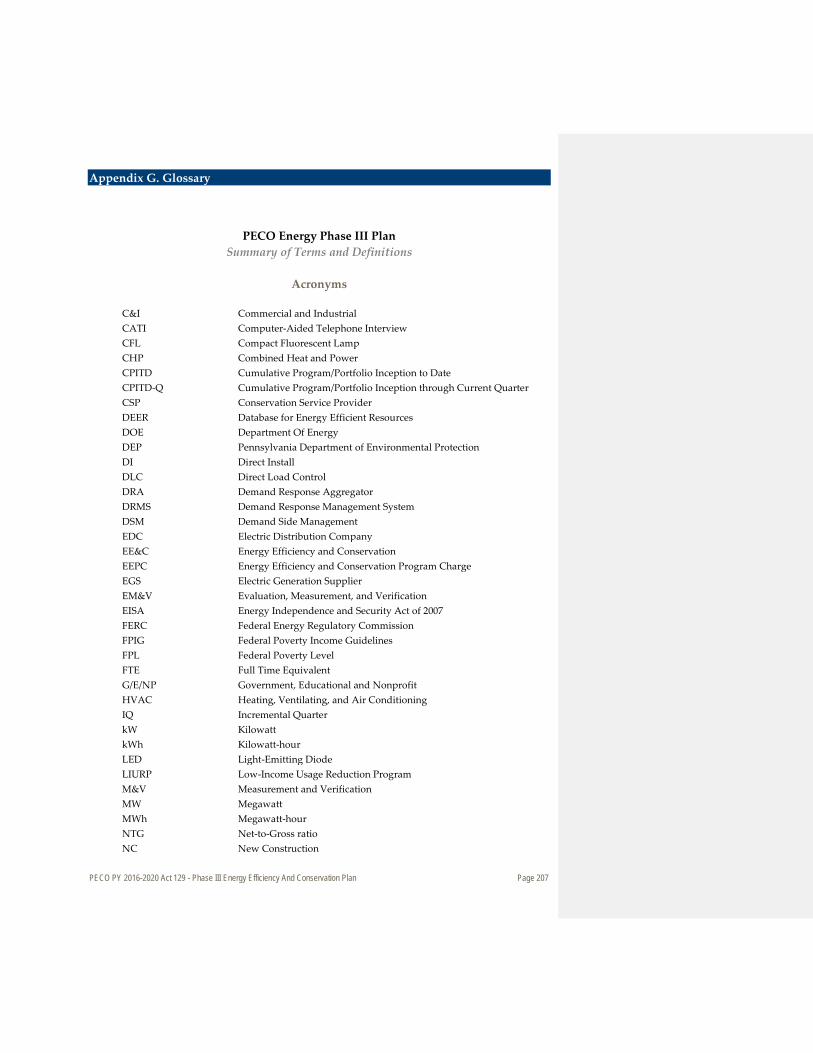
PECO PY 2016-2020 Act 129 - Phase III Energy Efficiency And Conservation Plan Page 207
Appendix G. Glossary
PECO Energy Phase III Plan
Summary of Terms and Definitions
Acronyms
C&I Commercial and Industrial CATI Computer-Aided Telephone Interview CFL Compact Fluorescent Lamp CHP Combined Heat and Power CPITD Cumulative Program/Portfolio Inception to Date CPITD-Q Cumulative Program/Portfolio Inception through Current Quarter CSP Conservation Service Provider DEER Database for Energy Efficient Resources DOE Department Of Energy DEP Pennsylvania Department of Environmental Protection DI Direct Install DLC Direct Load Control DRA Demand Response Aggregator DRMS Demand Response Management System DSM Demand Side Management EDC Electric Distribution Company EE&C Energy Efficiency and Conservation EEPC Energy Efficiency and Conservation Program Charge EGS Electric Generation Supplier EM&V Evaluation, Measurement, and Verification EISA Energy Independence and Security Act of 2007 FERC Federal Energy Regulatory Commission FPIG Federal Poverty Income Guidelines FPL Federal Poverty Level FTE Full Time Equivalent G/E/NP Government, Educational and Nonprofit HVAC Heating, Ventilating, and Air Conditioning IQ Incremental Quarter kW Kilowatt kWh Kilowatt-hour LED Light-Emitting Diode LIURP Low-Income Usage Reduction Program M&V Measurement and Verification MW Megawatt MWh Megawatt-hour NTG Net-to-Gross ratio NC New Construction
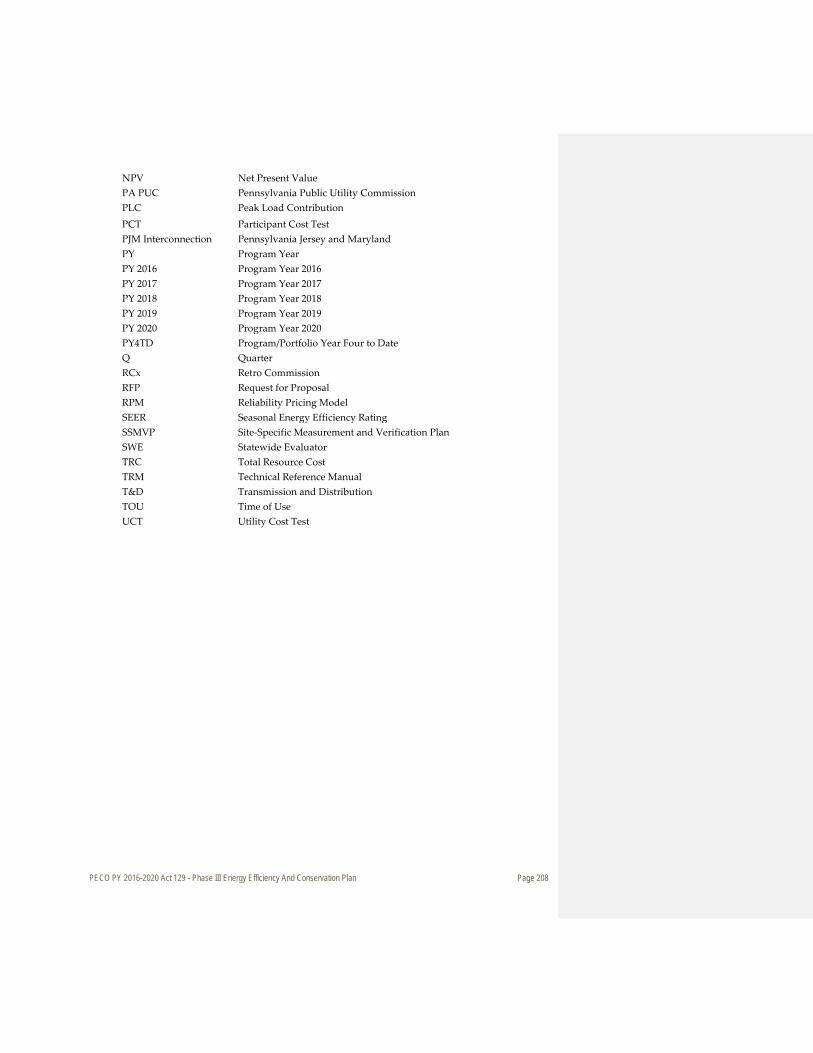
PECO PY 2016-2020 Act 129 - Phase III Energy Efficiency And Conservation Plan Page 208
NPV Net Present Value PA PUC Pennsylvania Public Utility Commission PLC Peak Load Contribution PCT Participant Cost Test PJM Interconnection Pennsylvania Jersey and Maryland PY Program Year PY 2016 Program Year 2016 PY 2017 Program Year 2017 PY 2018 Program Year 2018 PY 2019 Program Year 2019 PY 2020 Program Year 2020 PY4TD Program/Portfolio Year Four to Date Q Quarter RCx Retro Commission RFP Request for Proposal RPM Reliability Pricing Model SEER Seasonal Energy Efficiency Rating SSMVP Site-Specific Measurement and Verification Plan SWE Statewide Evaluator TRC Total Resource Cost TRM Technical Reference Manual T&D Transmission and Distribution TOU Time of Use UCT Utility Cost Test

PECO PY 2016-2020 Act 129 - Phase III Energy Efficiency And Conservation Plan Page 209
Glossary of Terms and Definitions
ACT 129: House Bill 2200 signed into law by Governor Rendell which created an Energy Efficiency and Conservation program requiring utilities with at least 100,000 customers to reduce their electric consumption and demand in their service territories. Achievable Potential: the amount of energy use that efficiency can realistically be expected to displace assuming the most aggressive program scenario possible (such as providing end-users with payments for the entire incremental cost of more efficient equipment). This is often referred to as maximum achievable potential. Achievable potential takes into account real-world barriers to convincing end-users to adopt efficiency measures, the non-measure costs of delivering programs (for administration, marketing, tracking systems, monitoring and evaluation, etc.), and the capability of programs and administrators to ramp up program activity over time. Administrative Expenses: expenses incurred at the program level and include estimated PECO staff and procurement costs as well as costs associated with third parties. Applicability Factor: the fraction of the applicable dwelling units that are technically feasible for conversion to the efficient technology from an engineering perspective (e.g., it may not be possible to install CFL bulbs in all light sockets in a home because the CFL bulbs may not fit in every socket in a home). Annual Report: the Annual report includes all activity associated with EE and DR energy reduction programs for a given year and is filed no later than November 15th, following the last day of a full program year. Base Case Equipment End-Use Intensity: the electricity used per customer per year by each base-case technology in each market segment. This is the consumption of the electric energy using equipment that the efficient technology replaces or affects. For example purposes only, if the efficient measure were a high efficiency lamp (CFL), the base end-use intensity would be the annual kWh use per bulb per household associated with an incandescent light bulb that provides equivalent lumens to the CFL. Base Case Factor: the fraction of the end-use electric energy that is applicable for the efficient technology in a given market segment. For example, for residential lighting, this would be the fraction of all residential electric customers that have electric lighting in their household. Baseline: condition that would have occurred without implementation of the subject project or program. Common Costs: overhead costs shared by all programs associated with plan implementation such as IT, legal, mass marketing, etc. Coincidence Factor: the fraction of connected load expected to be “on” and using electricity coincident with the system peak period. Cost-Effectiveness: a measure of the relevant economic effects resulting from the implementation of an energy efficiency measure. If the benefits outweigh the cost, the measure is said to be cost-effective. Cumulative Annual: refers to the overall savings occurring in a given year from both new participants and savings continuing to result from past participation with measures that are still in place. Cumulative

PECO PY 2016-2020 Act 129 - Phase III Energy Efficiency And Conservation Plan Page 210
annual does not always equal the sum of all prior year incremental values as some measures have relatively short measure lives and, as a result, their savings drop off over time. Conservation Service Provider (CSP): is an entity that provides services to PECO on behalf of its Energy Efficiency and Conservation Plan and will have an overall responsibility for the implementation of the contracted programs. Demand Response: the ability to provide peak load capacity through demand management (load control) programs. This methodology focuses on curtailment of loads during peak demand times thus avoiding the requirement to find new sources of generation capacity. Deemed Savings: an estimate of an energy savings or energy-demand savings outcome (gross savings) for a single unit of an installed energy efficiency measure Early Replacement: refers to an efficiency measure or efficiency program that seeks to encourage the replacement of functional equipment before the end of its operating life with higher-efficiency units Economic Potential: the subset of the technical potential screen that is economically cost-effective as compared to conventional supply-side energy resources. Both technical and economic potential screens are theoretical numbers that assume immediate implementation of efficiency measures, with no regard for the gradual “ramping up” process of real-life programs. In addition, they ignore market barriers to ensuring actual implementation of efficiency. Finally, they only consider the costs of efficiency measures themselves, ignoring any programmatic costs (such as marketing, analysis, administration) that would be necessary to capture them. End-Use: a category of equipment or service that consumes energy (e.g., lighting, refrigeration, heating, process heat). Evaluation Measurement & Verification Contractor: qualified energy efficiency program evaluation entity that provides evaluation services to PECO’s Energy Efficiency and Conservation Plan. Energy Efficiency & Conservation Plan: a collection of similar programs addressing the same market, technology, or mechanisms; or the set of all programs conducted by one organization. Energy Efficiency: using less energy to provide the same or an improved level of service to the energy consumer in an economically efficient way. Sometimes “conservation” is used as a synonym, but that term is usually taken to mean using less of a resource even if this results in a lower service level (e.g., setting a thermostat lower or reducing lighting levels). This recognizes that energy efficiency includes using less energy at any time, including at times of peak demand through demand response and peak shaving efforts. Eligible Measures: types of measures that qualify for program incentives and include a summary of efficiency specifications (e.g., ENERGY STAR qualified products). Energy Star: a minimum standard for high quality and efficiency measures such as lighting and equipment. Free Driver: individuals or businesses that adopt an energy efficient product or service because of an EE/DR program, but are difficult to identify either because they do not receive an incentive or are not aware of exposure to the program.

PECO PY 2016-2020 Act 129 - Phase III Energy Efficiency And Conservation Plan Page 211
Free Rider: participants in an EE/PDR program who would have adopted an EE/PDR technology or improvement in the absence of a program of financial incentive. Incremental: savings or costs in a given year associated only with new installations happening in year. Impact Evaluation: is the estimation of effects from the implementation of one or more EE/PDR programs. Most program impact projections contain ex-ante estimates of savings. These estimates are what the program is expected to save as a result of its implementation efforts and are often used for program planning and contracting purposes and for prioritizing program funding choices. In contrast, the impact evaluation focuses on identifying and estimating the amount of energy and demand the program actually provides. Implementation Strategy: activities involved in program delivery education and training. Some programs primarily work downstream at the customer level, where others involve upstream partnerships with trade allies. Incentives: rebates offered to program participants, CSPs and trade allies to deliver the program. Incremental Costs: non-incentive costs that are associated with delivering savings Lost-Opportunity: refers to an efficiency measure or efficiency program that seeks to encourage the selection of higher-efficiency equipment or building practices than would typically be chosen at the time of a purchase or design decision. Load Shapes: energy forecasting in effort to understand how more efficient products like air conditioning and lighting can help control overall and peak demand. Market Transformation: an approach in which a program attempts to influence “upstream” service and equipment provider market channels and what they offer end customers, along with educating and informing end customers directly. The emphasis is on influencing market channels and key market factors other than end customers. Marketing Strategy: identifies the way a program will be marketed to customers; via a trade ally outreach component targeting retailers/contractors/home builders. Measure: any action taken to increase efficiency, whether through changes in equipment, control strategies, or behavior. Examples are higher-efficiency central air conditioners, occupancy sensor control of lighting, and retro-commissioning. In some cases, bundles of technologies or practices may be modeled as single measures. For example, an ENERGY STAR™ home package may be treated as a single measure. Measure Life: the number of years (or hours) that the new energy efficient equipment is expected to function. Measure life is also commonly referred to as useful life. Megawatt (MW): a unit of electrical output, equal to one million watts or one thousand kilowatts. It is typically used to refer to the output of a power plant. Megawatt-hour (MWh): one thousand kilowatt-hours, or one million watt-hours. One MWh is equal to the use of 1,000,000 watts of power in one hour.

PECO PY 2016-2020 Act 129 - Phase III Energy Efficiency And Conservation Plan Page 212
Net-to-gross (NTG) Ratio: a factor representing net program savings divided by gross program savings that is applied to gross program impacts to convert them into net program load impacts Non-Incentive Costs: administrative costs associated with program delivery and overhead. Quarterly Report: reports that capture program activity for the quarter and are filed 45 days after the close of each quarter. Portfolio: a combination of programs among all customer classes targeted for EE and Demand reduction plans by a utility. Process Evaluation: is a systematic assessment of an EE/PDR program for the purposes of documenting program operations at the time of the examination and identifying improvements that can be made to increase the program’s efficiency or effectiveness for acquiring energy resources. Program: a mechanism for encouraging EE/DR. May be funded by a variety of sources and pursued by a wide range of approaches. Typically includes multiple measures. Program Year: defined as a year commencing June 1 of the named year and concluding on May 31st of the following year. For example, Program Year 2016 commences on June 1, 2016 and concludes on May 31, 2017. Program Potential: the efficiency potential possible given specific program funding levels and designs. Often, program potential studies are referred to as “achievable” in contrast to “maximum achievable.” Program Budget: annual budget and allocations for major budget categories (e.g., incentives, administration, marketing, delivery, evaluation). Persistence: is the measure still in place; are the savings persisting/continuing. Remaining Factor: the fraction of applicable units that have not yet been converted to the electric EE/PDR measure; that is, one minus the fraction of units that already have the EE/PDR measure installed. Replace on Burnout (ROB): an EE/PDR measure is not implemented until the existing technology it is replacing fails. An example would be an energy efficient water heater being purchased after the failure of the existing water heater. Realization Rate: ratio of evaluated to forecasted savings. Resource Acquisition: an approach in which end customers are the primary target of program offerings (e.g., using rebates to influence customers’ purchases of end-use equipment). Retrofit: refers to an efficiency measure or efficiency program that seeks to encourage the replacement of functional equipment before the end of its operating life with higher-efficiency units (also called “early retirement”) or the installation of additional controls, equipment, or materials in existing facilities for purposes of reducing energy consumption (e.g., increased insulation, low flow devices, lighting occupancy controls, economizer ventilation systems). Recovery Mechanism: recovering Act 129 costs via ratepayer surcharges.

PECO PY 2016-2020 Act 129 - Phase III Energy Efficiency And Conservation Plan Page 213
Savings Factor: the percentage reduction in electricity consumption resulting from application of the efficient technology used in the formulas for technical potential screens. Statewide Evaluator: a state appointed evaluation agency that performs measurement and verification analysis of cost-effectiveness on the work done by and with the contracted EM&V provider on behalf of the utility as well as develops measurement and evaluation protocol. Spillover: types of actions participants and non-participants have taken on their own. Target Market: types of customers the program is looking to reach. The target market can be defined broadly (e.g., residential/C&I) or narrowly (e.g., single family homes at least 20 years old) depending on the scope of the program. Technical Potential: the theoretical maximum amount of energy use that could be displaced by efficiency, disregarding all non-engineering constraints such as cost-effectiveness and the willingness of end-users to adopt the efficiency measures. It is often estimated as a “snapshot” in time assuming immediate implementation of all technologically feasible energy saving measures, with additional efficiency opportunities assumed as they arise from activities such as new construction.
Technical Reference Manual (TRM): standards used to measure and verify applicable Demand Side Management/Energy Efficiency measures used by the utility to meet the ACT 129 consumption and peak demand reduction targets.
Total Resource Test (TRC): is the cost-effectiveness test defined by the PUC in order to evaluate the effectiveness of all programs that are part of PECO’s Energy Efficiency and Conservation Plan.
Trade Ally: any third-party who promotes the sale of and/or installs qualifying high-efficiency equipment for the customer is considered a trade ally. Participating trade allies include equipment contractors, equipment trade allies, equipment manufacturers and distributors, energy service companies, and engineering or architectural firms.
Tracking System: is defined as a database system that tracks a number of items that facilitate effective project tracking and regulatory reporting. The data also supports PECO’s Quality Assurance process as well as EM&V requirements as part of the EE&C Plan. Utility Cost Test: compares the utility costs and benefits of energy efficiency.