Embed Size (px)
Citation preview
1
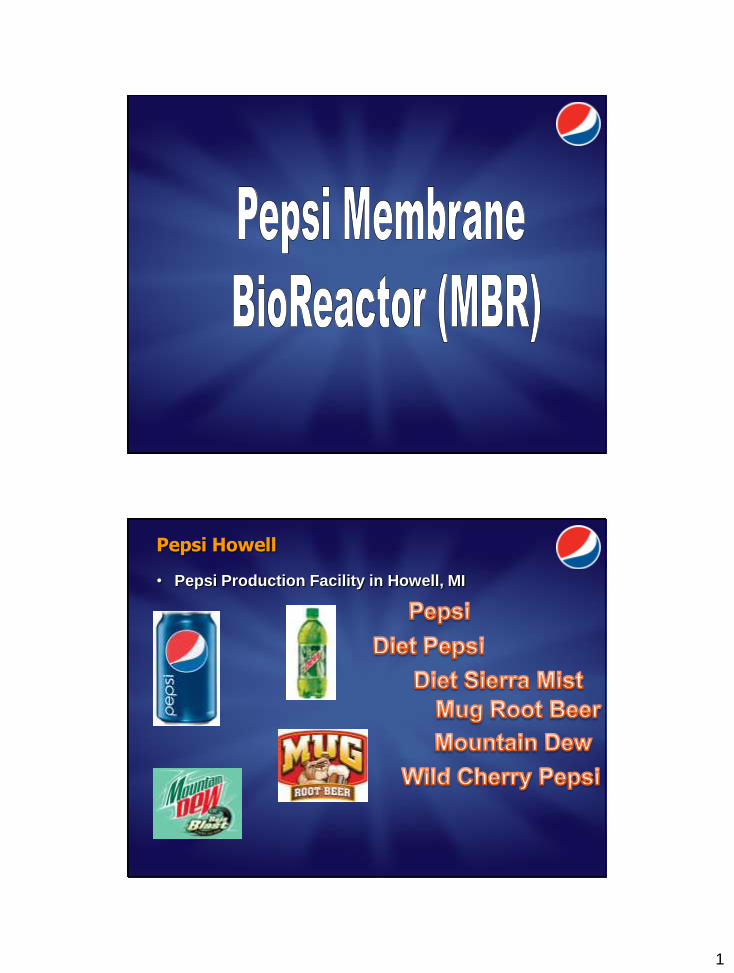
Pepsi Howell
• Pepsi Production Facility in Howell, MI
2
Pepsi Howell
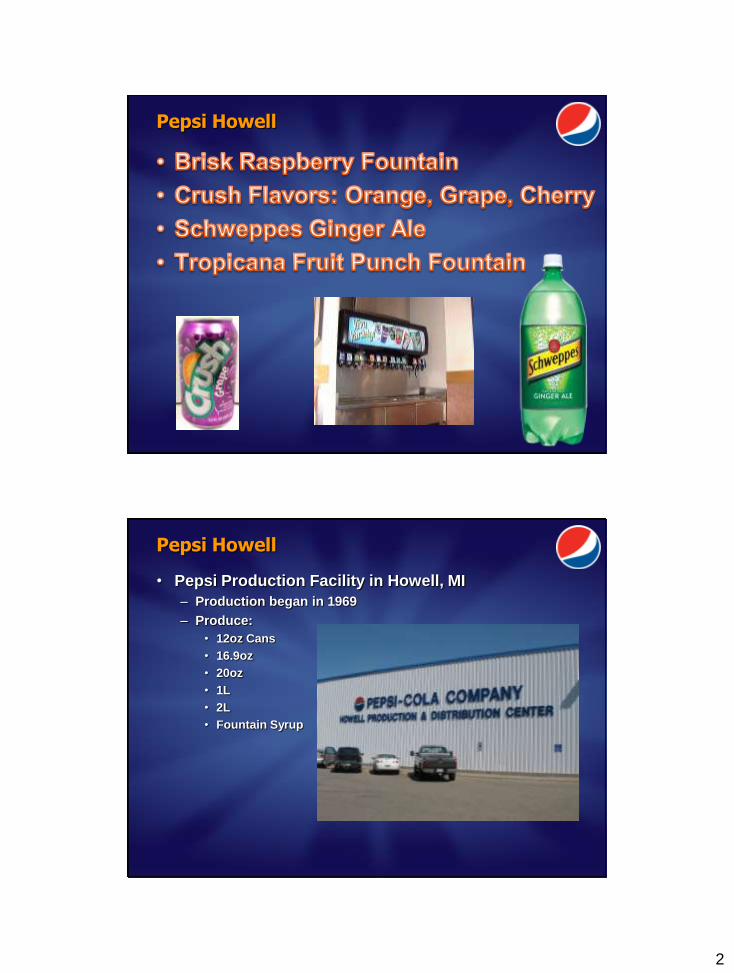
Pepsi Howell
• Pepsi Production Facility in Howell, MI
– Production began in 1969
– Produce:
• 12oz Cans
• 16.9oz
• 20oz
• 1L
• 2L
• Fountain Syrup
3
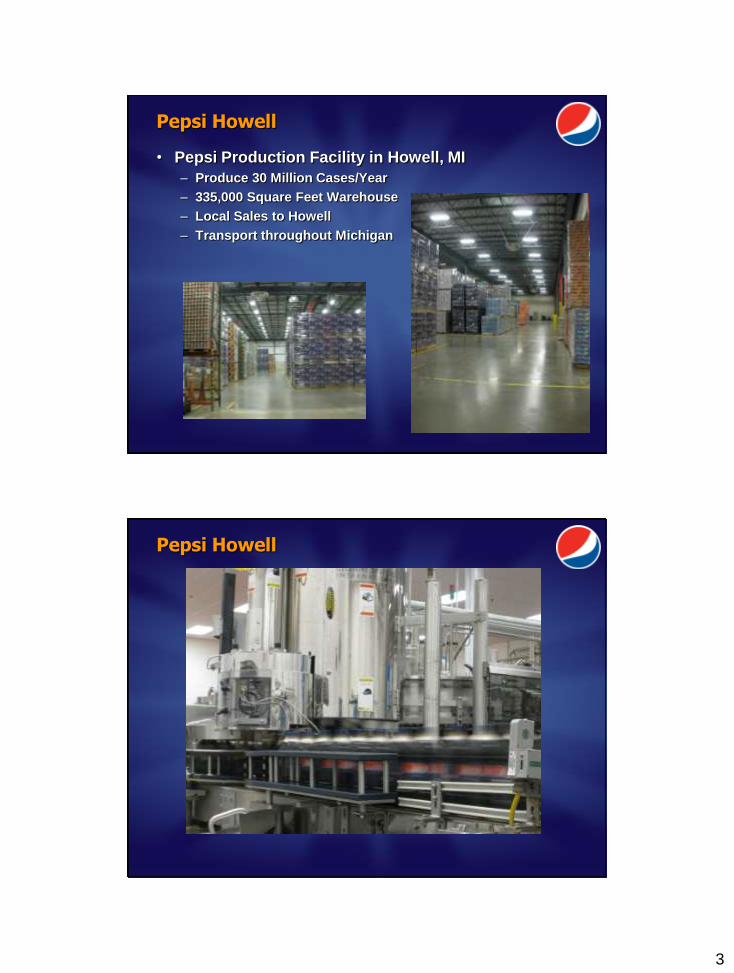
Pepsi Howell
• Pepsi Production Facility in Howell, MI
– Produce 30 Million Cases/Year
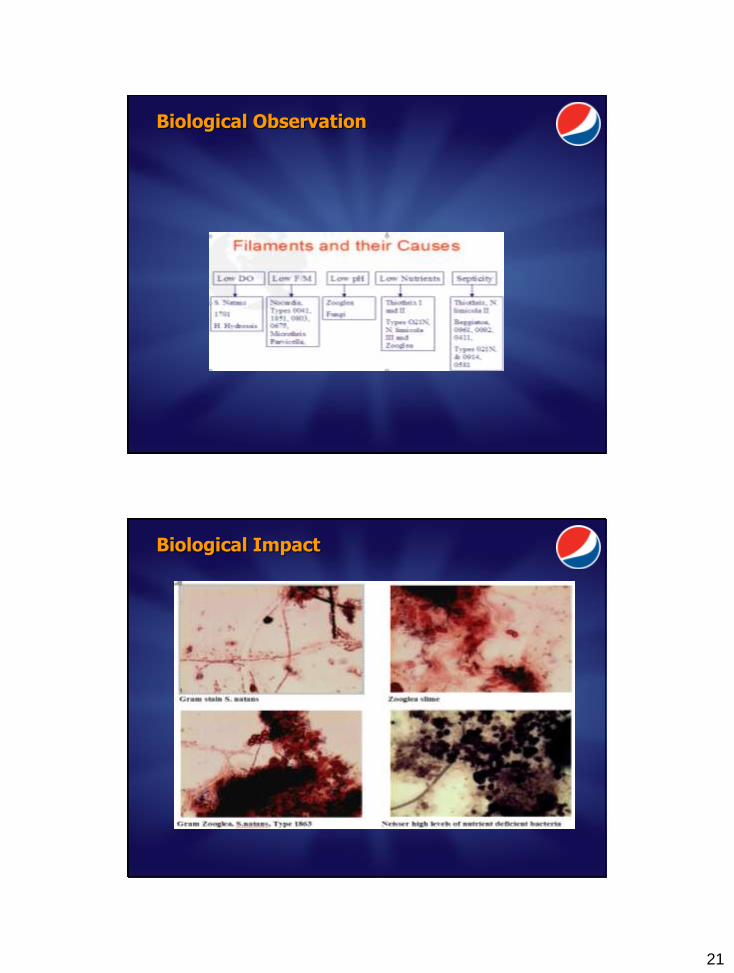
– 335,000 Square Feet Warehouse
– Local Sales to Howell
– Transport throughout Michigan
Pepsi Howell
4
Pepsi Howell
Show Desktop.scf
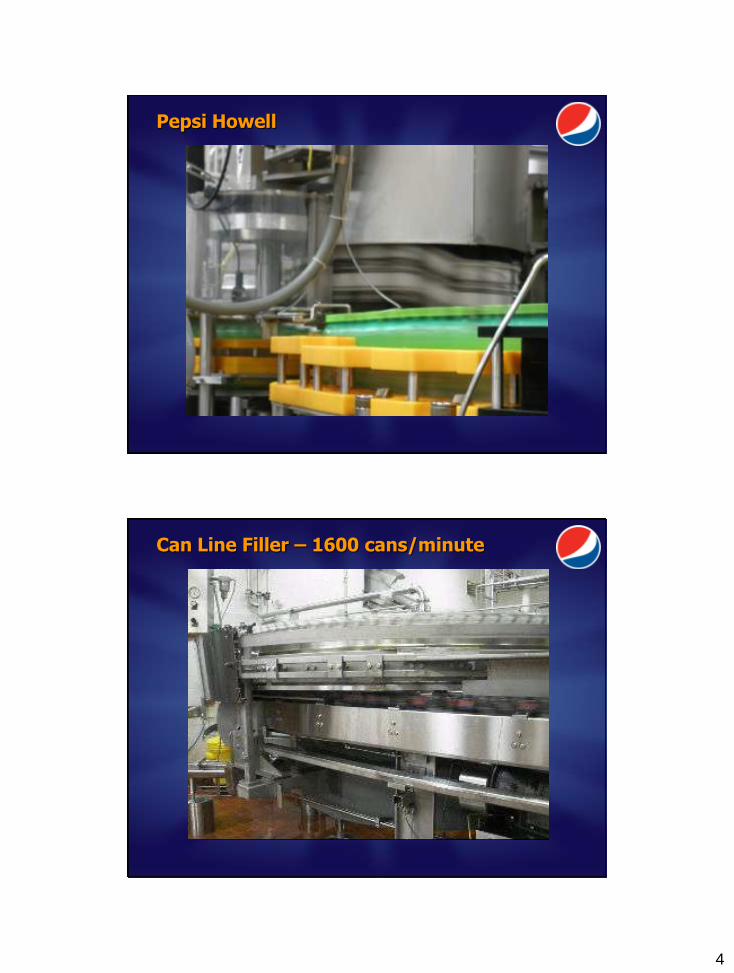
Can Line Filler – 1600 cans/minute
5
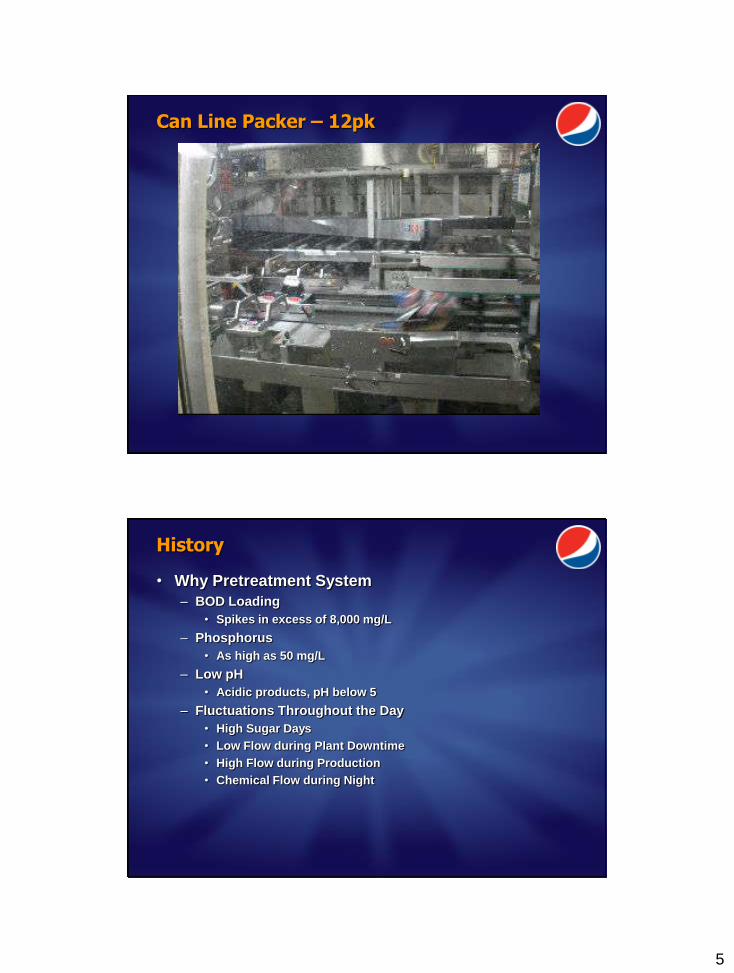
Can Line Packer – 12pk
History
• Why Pretreatment System
– BOD Loading
• Spikes in excess of 8,000 mg/L
– Phosphorus
• As high as 50 mg/L
– Low pH
• Acidic products, pH below 5
– Fluctuations Throughout the Day
• High Sugar Days
• Low Flow during Plant Downtime
• High Flow during Production
• Chemical Flow during Night
6
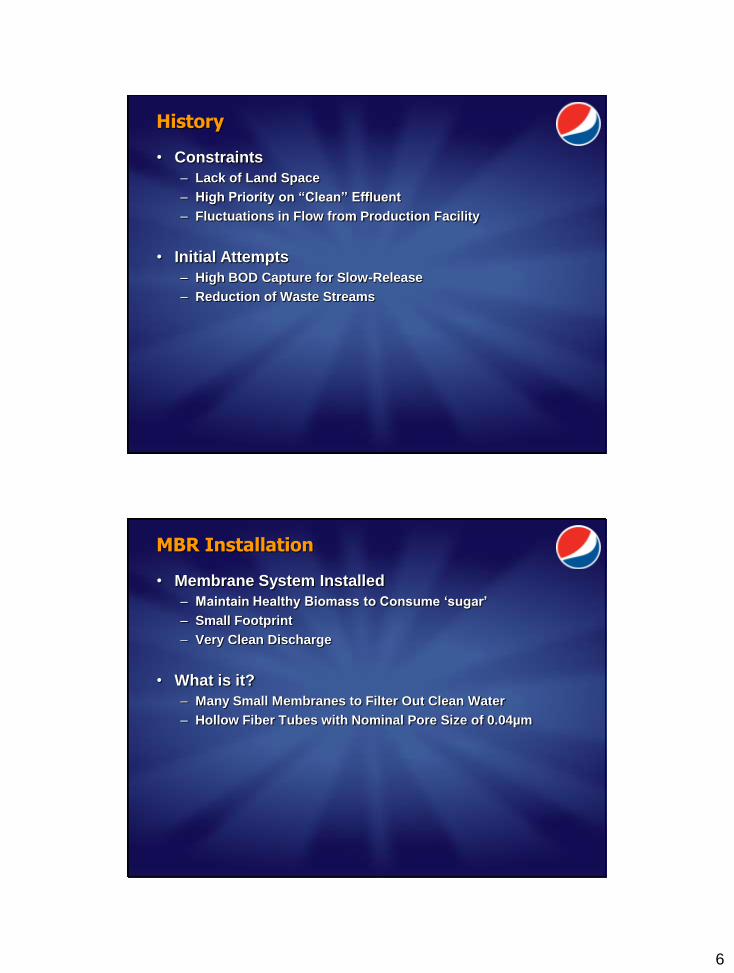
History
• Constraints
– Lack of Land Space
– High Priority on “Clean” Effluent
– Fluctuations in Flow from Production Facility
• Initial Attempts
– High BOD Capture for Slow-Release
– Reduction of Waste Streams
MBR Installation
• Membrane System Installed
– Maintain Healthy Biomass to Consume ‘sugar’
– Small Footprint
– Very Clean Discharge
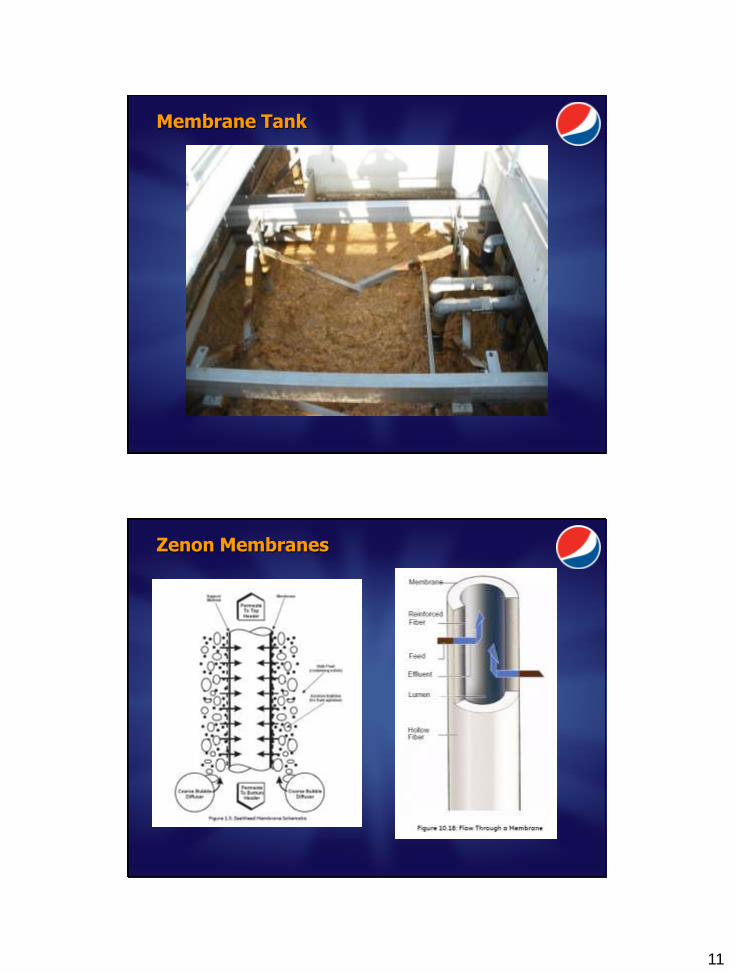
• What is it?
– Many Small Membranes to Filter Out Clean Water
– Hollow Fiber Tubes with Nominal Pore Size of 0.04µm
7
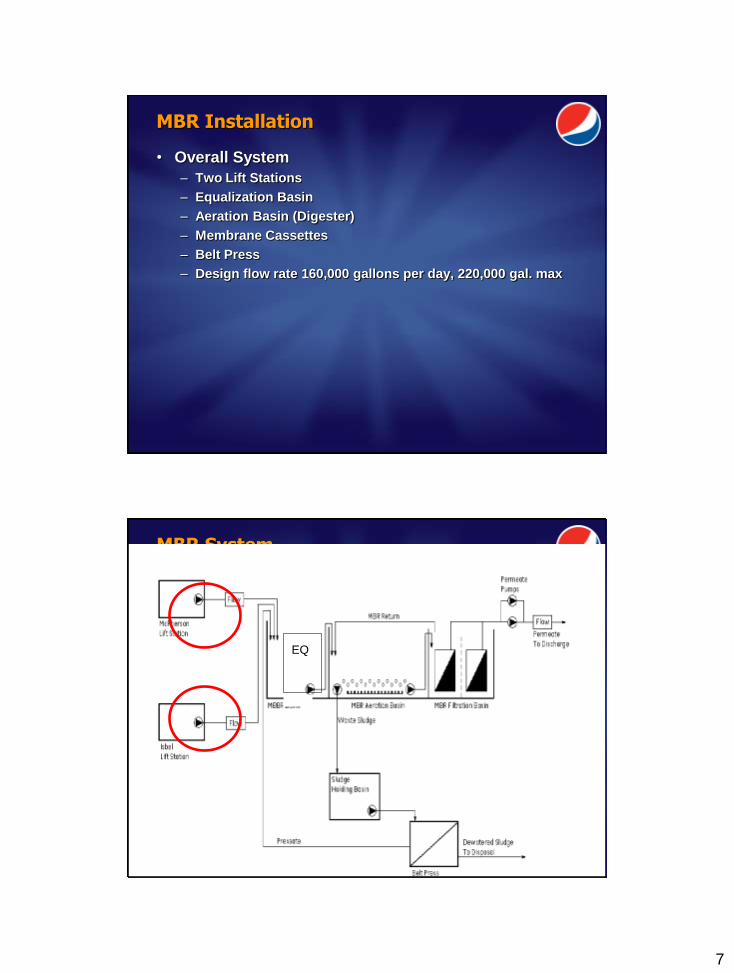
MBR Installation
• Overall System
– Two Lift Stations
– Equalization Basin
– Aeration Basin (Digester)
– Membrane Cassettes
– Belt Press
– Design flow rate 160,000 gallons per day, 220,000 gal. max
MBR System
EQ
8
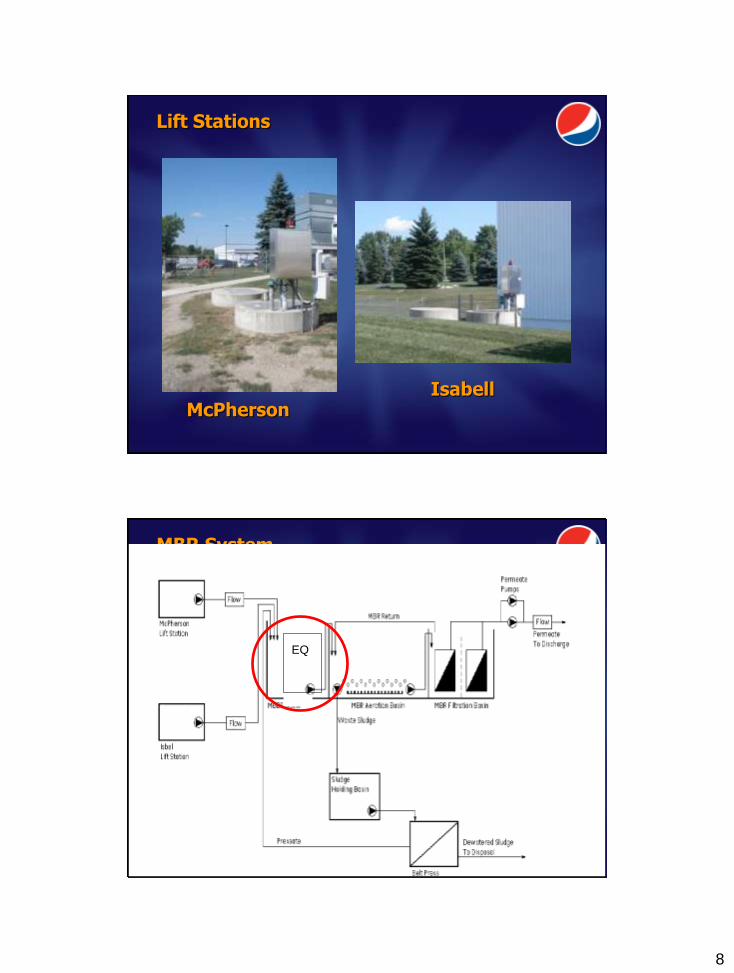
Lift Stations
McPherson Isabell
MBR System
EQ
9
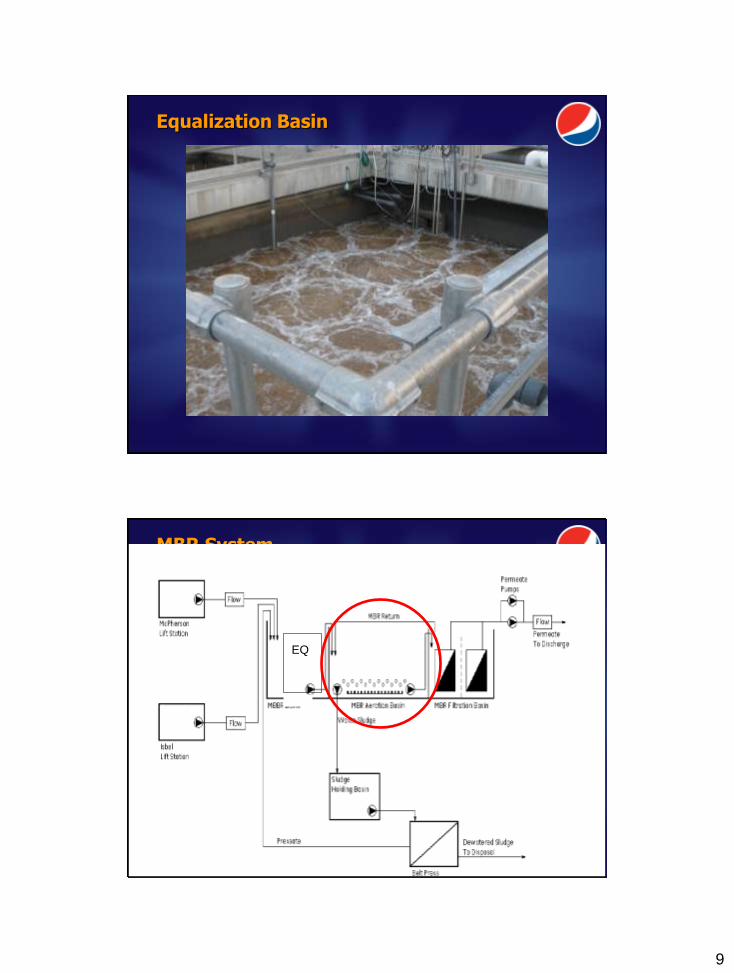
Equalization Basin
MBR System
EQ
10
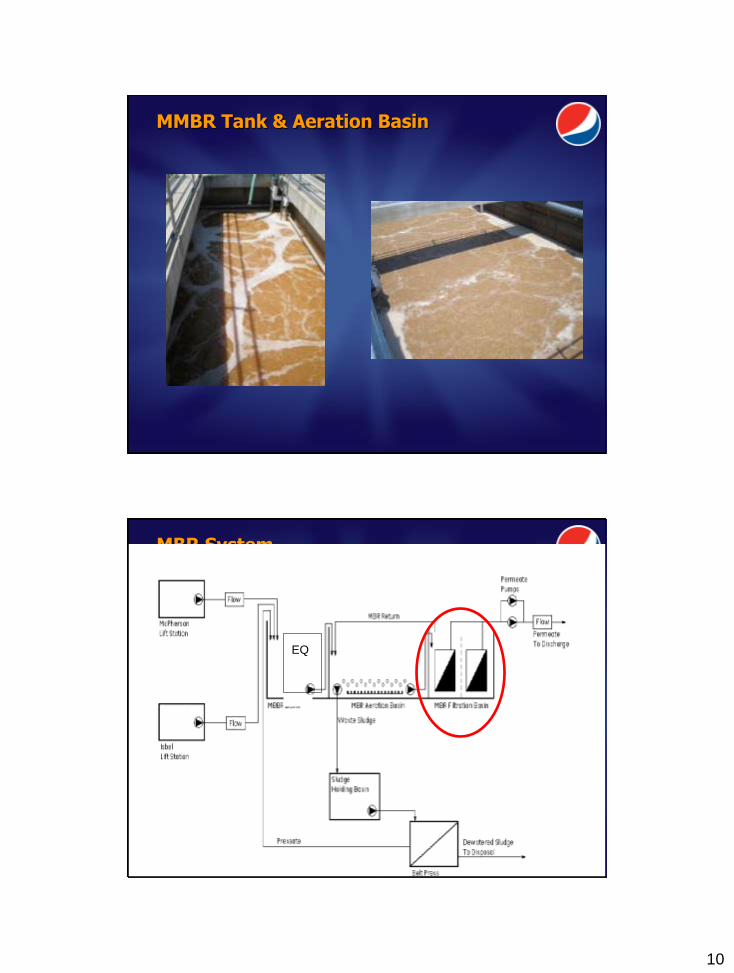
MMBR Tank & Aeration Basin
MBR System
EQ
11
Membrane Tank
Zenon Membranes
12
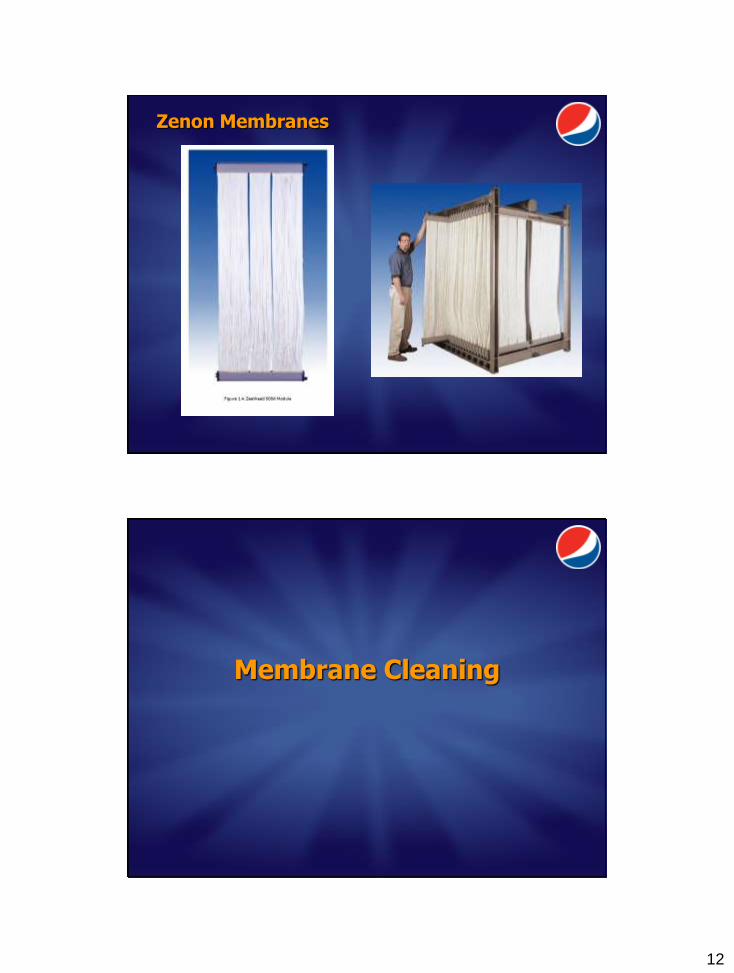
Zenon Membranes
Membrane Cleaning
13
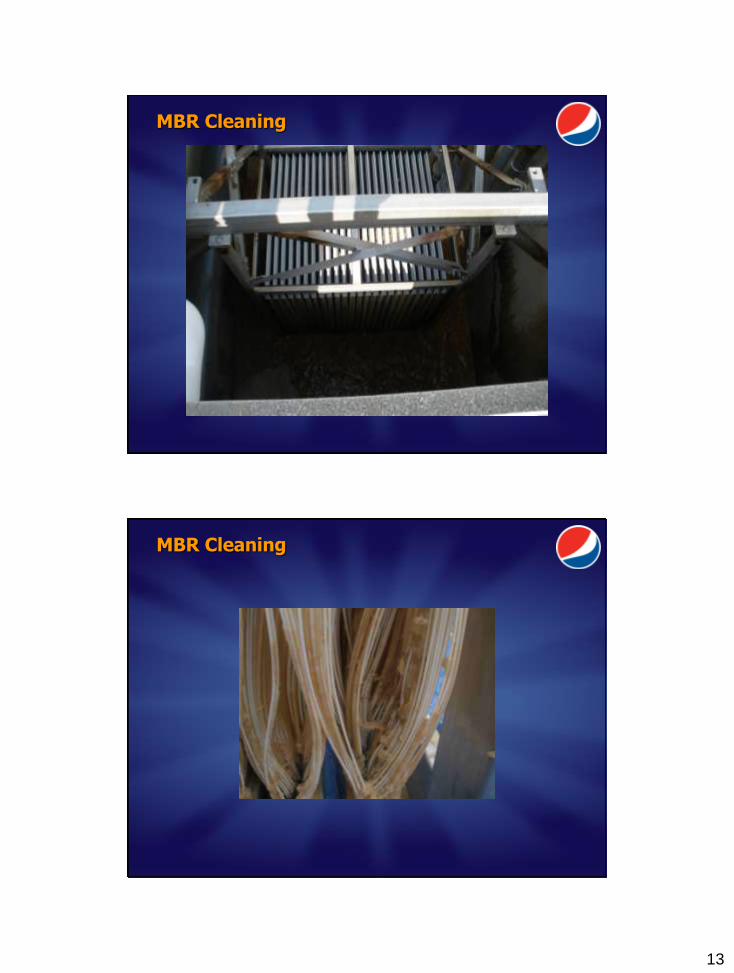
MBR Cleaning
MBR Cleaning
14
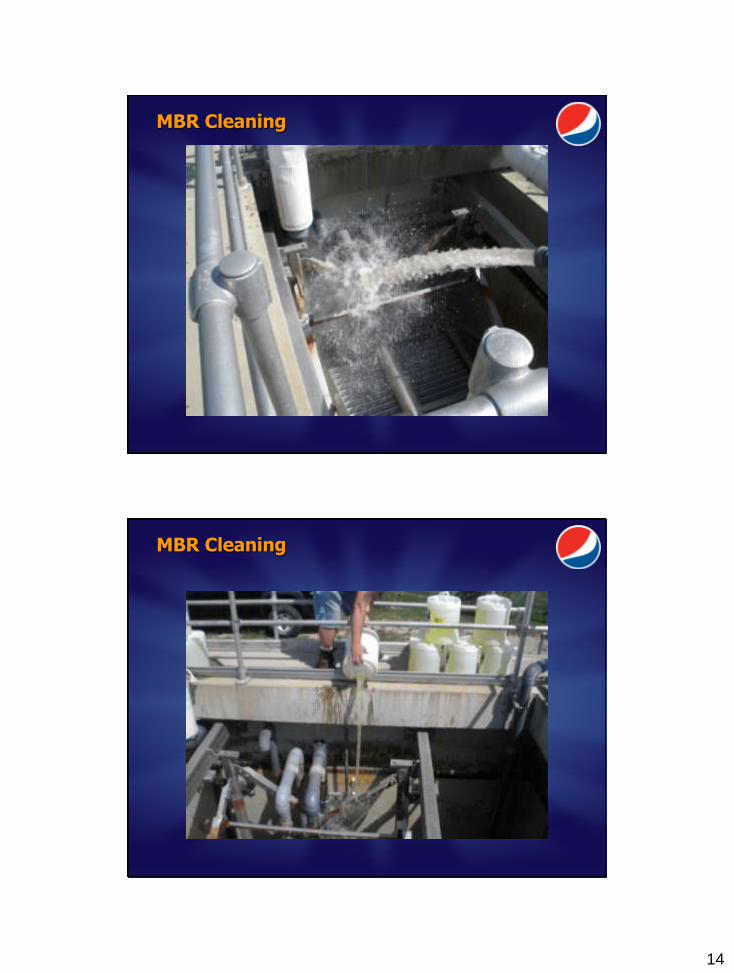
MBR Cleaning
MBR Cleaning
15
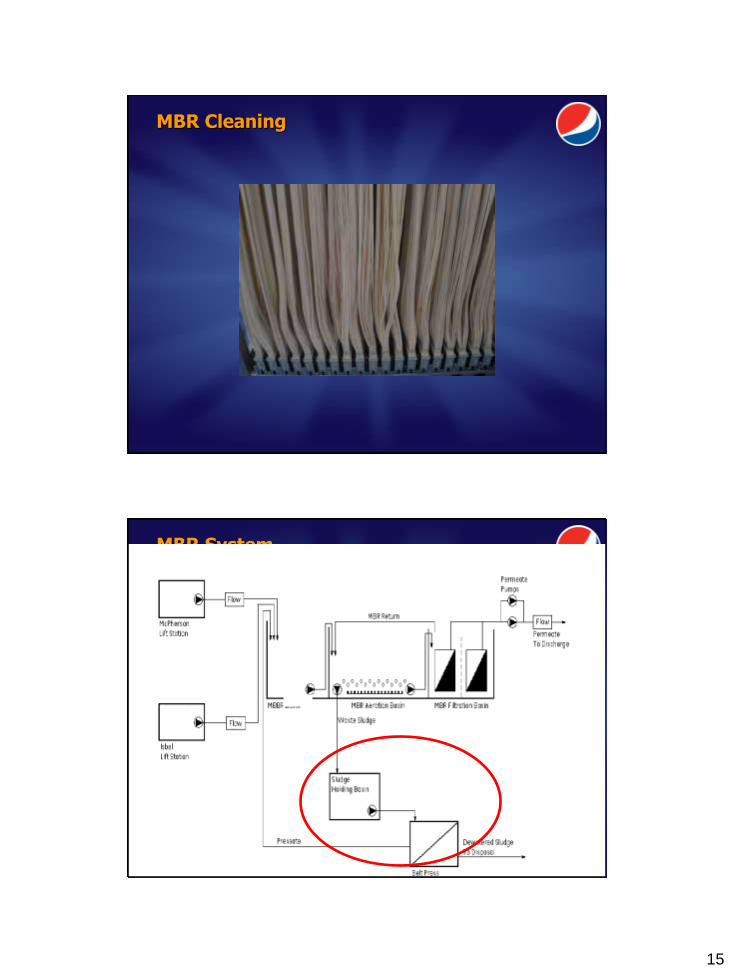
MBR Cleaning
MBR System
EQ
16
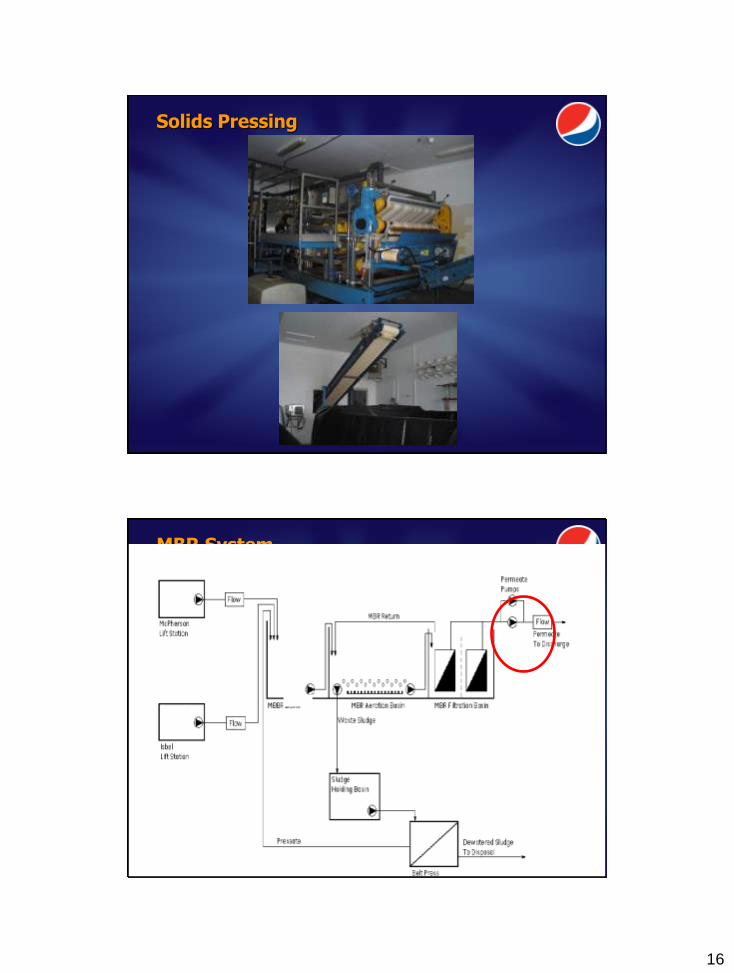
Solids Pressing
MBR System
EQ
17
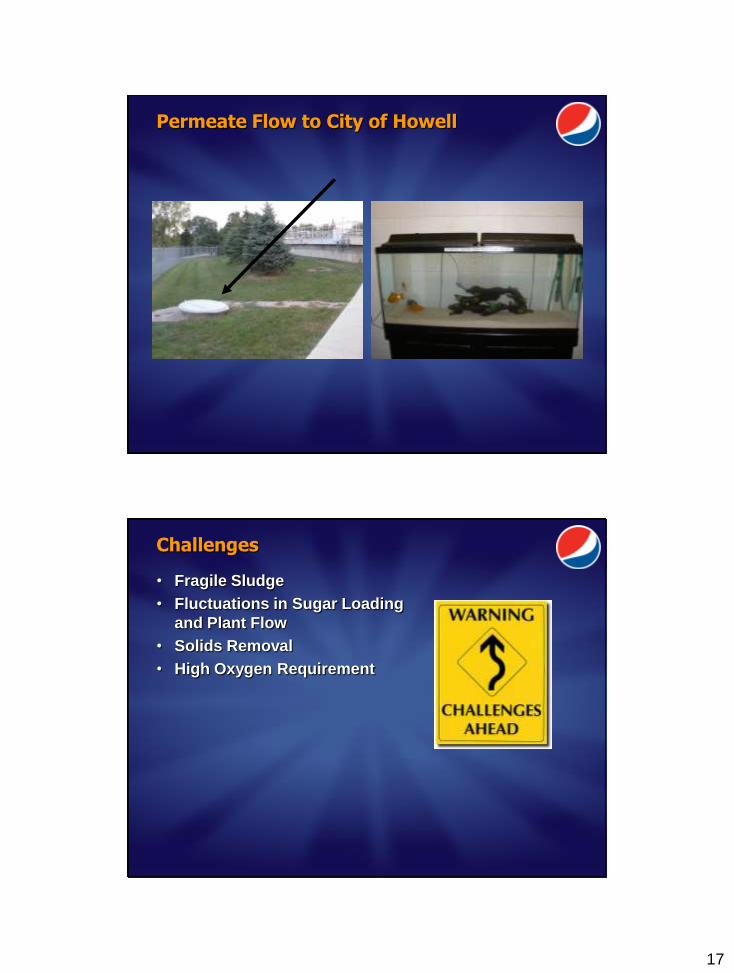
Permeate Flow to City of Howell
Challenges
• Fragile Sludge
• Fluctuations in Sugar Loading
and Plant Flow
• Solids Removal
• High Oxygen Requirement
18
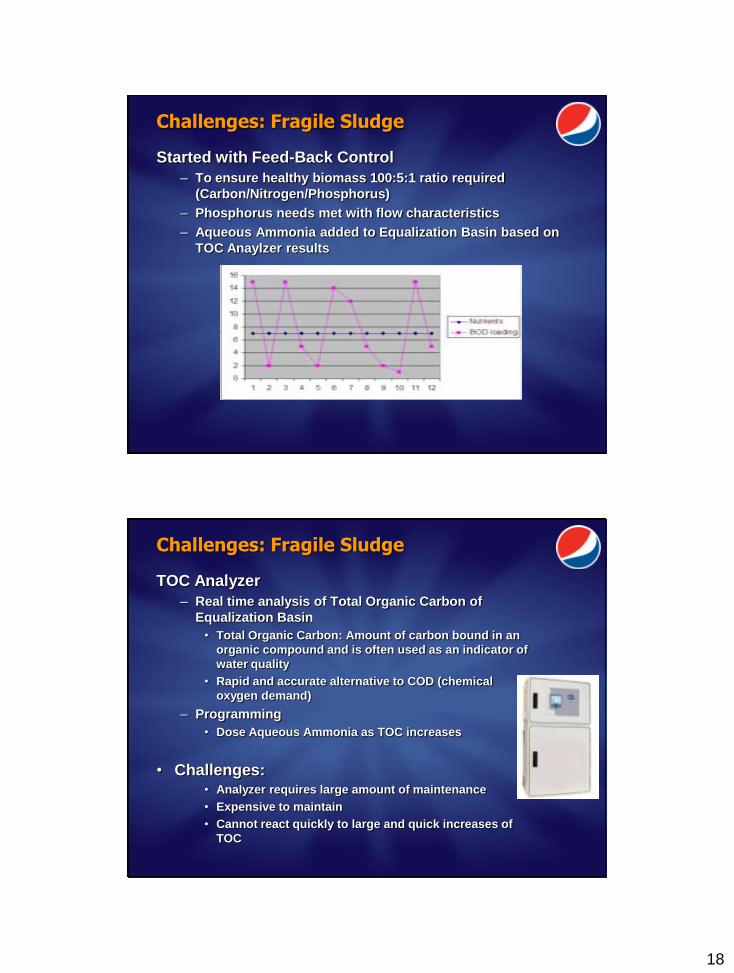
Challenges: Fragile Sludge
Started with Feed-Back Control
– To ensure healthy biomass 100:5:1 ratio required
(Carbon/Nitrogen/Phosphorus)
– Phosphorus needs met with flow characteristics
– Aqueous Ammonia added to Equalization Basin based on
TOC Anaylzer results
Challenges: Fragile Sludge
TOC Analyzer
– Real time analysis of Total Organic Carbon of
Equalization Basin
• Total Organic Carbon: Amount of carbon bound in an
organic compound and is often used as an indicator of
water quality
• Rapid and accurate alternative to COD (chemical
oxygen demand)
– Programming
• Dose Aqueous Ammonia as TOC increases
• Challenges: • Analyzer requires large amount of maintenance
• Expensive to maintain
• Cannot react quickly to large and quick increases of
TOC
19
Challenges: Fluctuations in Sugar Loading and Plant Flow
Fluctuations
– Plant runs 16-20 hours per day of various sugar and
non sugar products
– During off hours, cleaning is completed with large
amounts of water and chemicals
– Weekends with no plant production = no sugar for
biology for 2+ days
• Challenges: • Constant awareness of sugar loading
• Addition of sugar during periods of plant downtime
• Minimal sugar = death of biology
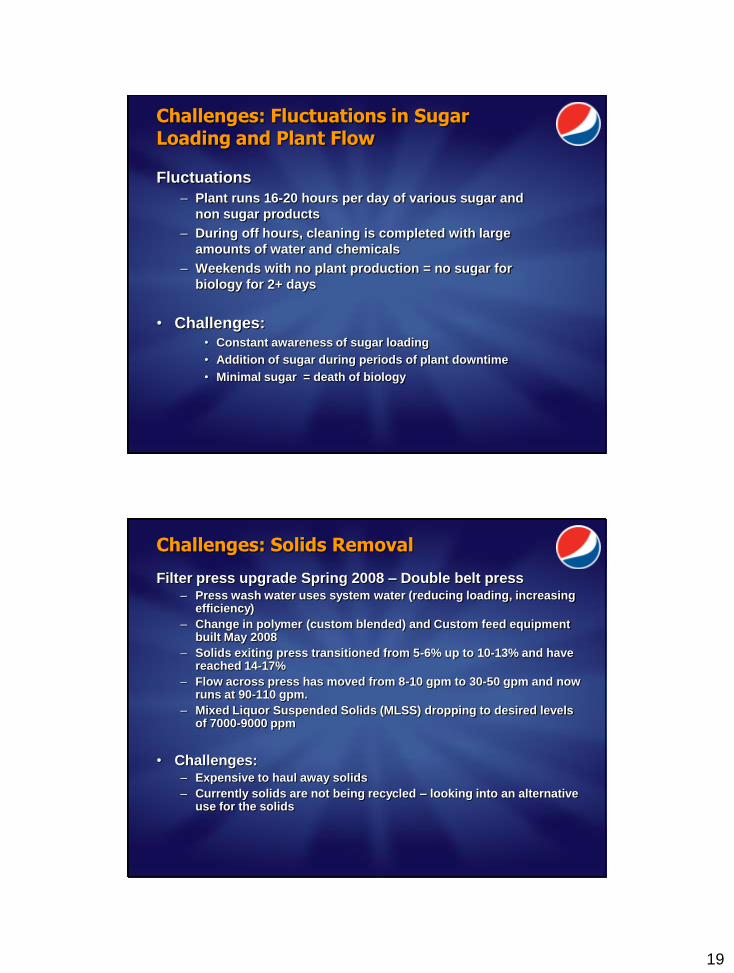
Challenges: Solids Removal
Filter press upgrade Spring 2008 – Double belt press – Press wash water uses system water (reducing loading, increasing
efficiency)
– Change in polymer (custom blended) and Custom feed equipment built May 2008
– Solids exiting press transitioned from 5-6% up to 10-13% and have reached 14-17%
– Flow across press has moved from 8-10 gpm to 30-50 gpm and now runs at 90-110 gpm.
– Mixed Liquor Suspended Solids (MLSS) dropping to desired levels of 7000-9000 ppm
• Challenges: – Expensive to haul away solids
– Currently solids are not being recycled – looking into an alternative use for the solids
20
Challenges: High Oxygen Requirement
Aeration Upgrade
– Two 150 HP blower motors running continuously (previously one
100HP blower)
– Electrical upgrade to support blowers
Increased Testing
– TOC/COD, NH3, permeate testing
– Automatic pH control
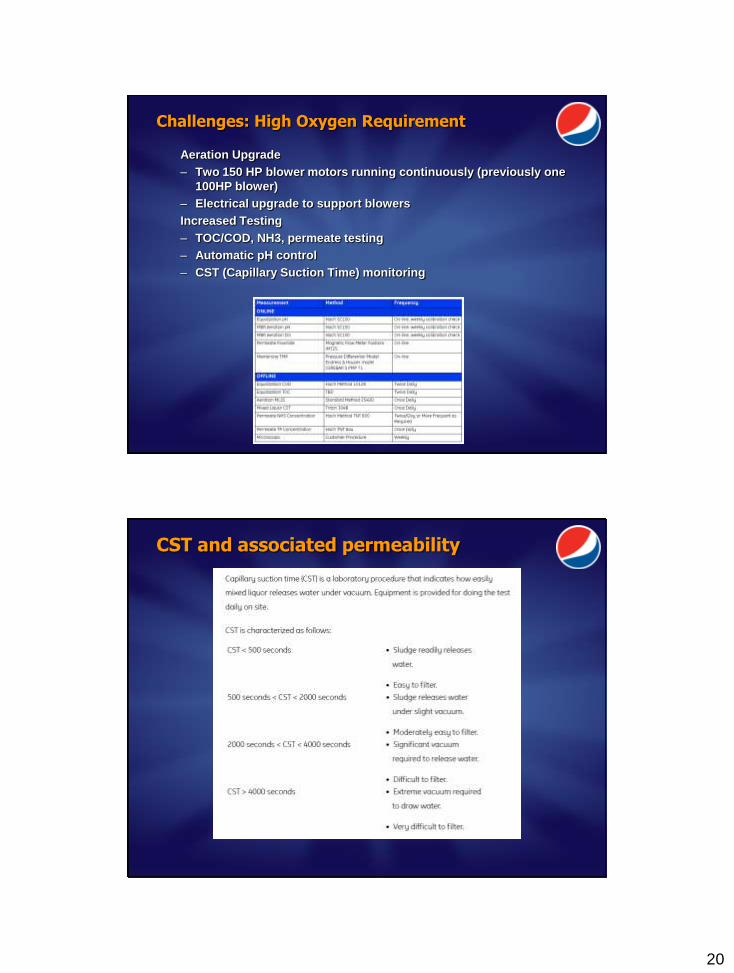
– CST (Capillary Suction Time) monitoring
CST and associated permeability
21
Biological Observation
Biological Impact
22
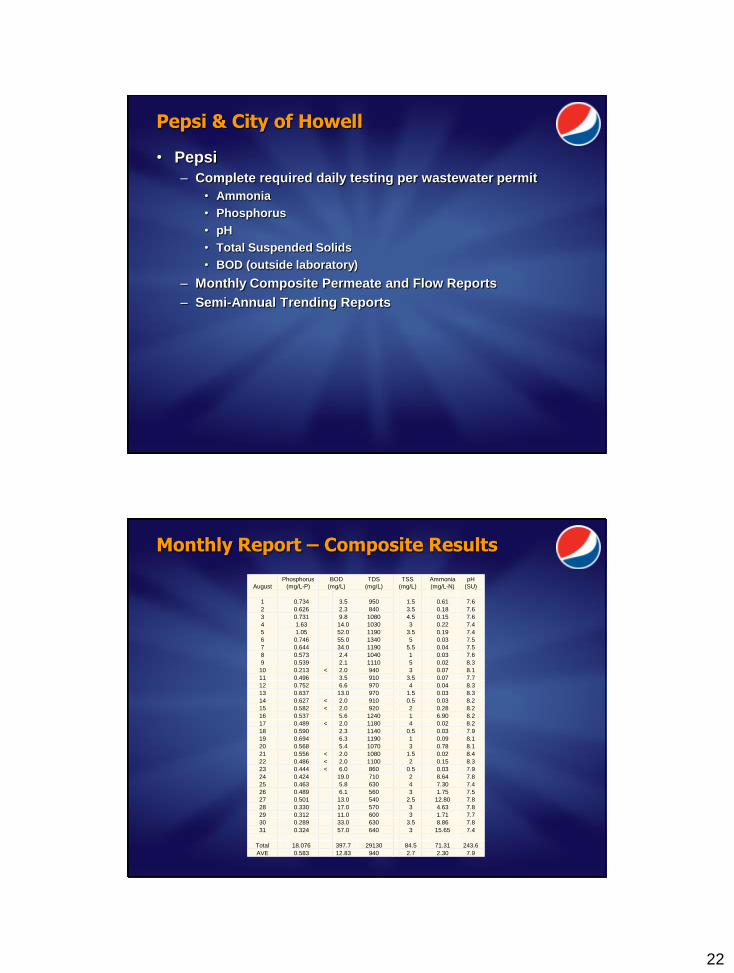
Pepsi & City of Howell
• Pepsi
– Complete required daily testing per wastewater permit
• Ammonia
• Phosphorus
• pH
• Total Suspended Solids
• BOD (outside laboratory)
– Monthly Composite Permeate and Flow Reports
– Semi-Annual Trending Reports
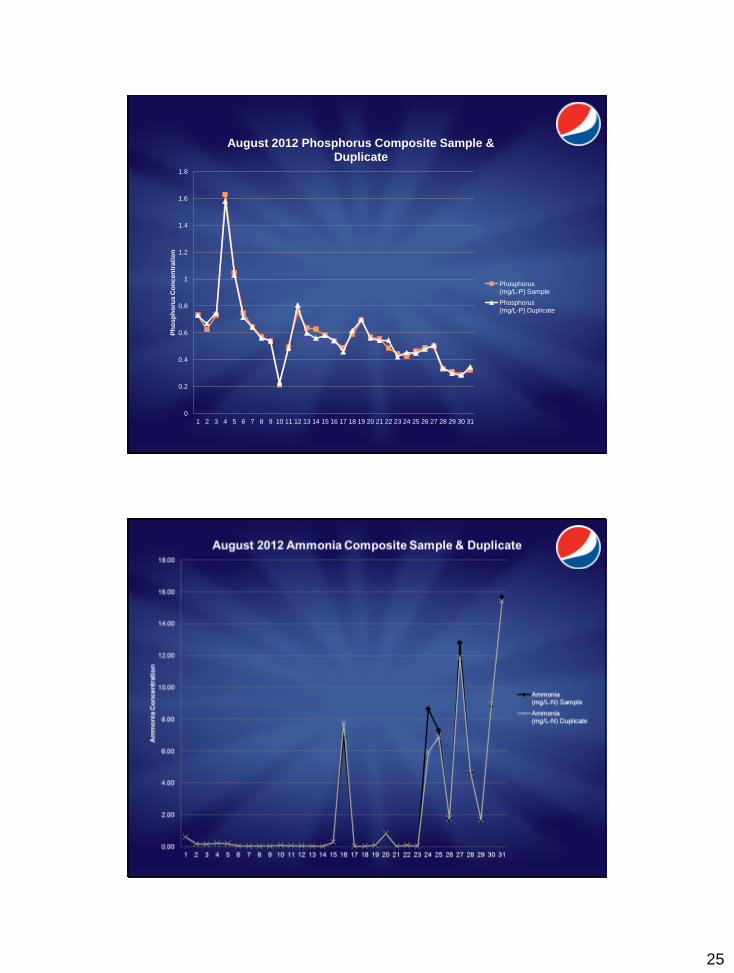
Monthly Report – Composite Results
August
Phosphorus
(mg/L-P)
BOD
(mg/L)
TDS
(mg/L)
TSS
(mg/L)
Ammonia
(mg/L-N)
pH
(SU)
1 0.734 3.5 950 1.5 0.61 7.6
2 0.626 2.3 840 3.5 0.18 7.6
3 0.731 9.8 1080 4.5 0.15 7.6
4 1.63 14.0 1030 3 0.22 7.4
5 1.05 52.0 1190 3.5 0.19 7.4
6 0.746 55.0 1340 5 0.03 7.5
7 0.644 34.0 1190 5.5 0.04 7.5
8 0.573 2.4 1040 1 0.03 7.6
9 0.539 2.1 1110 5 0.02 8.3
10 0.213 < 2.0 940 3 0.07 8.1
11 0.496 3.5 910 3.5 0.07 7.7
12 0.752 6.6 970 4 0.04 8.3
13 0.637 13.0 970 1.5 0.03 8.3
14 0.627 < 2.0 910 0.5 0.03 8.2
15 0.582 < 2.0 920 2 0.28 8.2
16 0.537 5.6 1240 1 6.90 8.2
17 0.489 < 2.0 1180 4 0.02 8.2
18 0.590 2.3 1140 0.5 0.03 7.9
19 0.694 6.3 1190 1 0.09 8.1
20 0.568 5.4 1070 3 0.78 8.1
21 0.556 < 2.0 1080 1.5 0.02 8.4
22 0.486 < 2.0 1100 2 0.15 8.3
23 0.444 < 6.0 860 0.5 0.03 7.9
24 0.424 19.0 710 2 8.64 7.8
25 0.463 5.8 630 4 7.30 7.4
26 0.489 6.1 560 3 1.75 7.5
27 0.501 13.0 540 2.5 12.80 7.8
28 0.330 17.0 570 3 4.63 7.8
29 0.312 11.0 600 3 1.71 7.7
30 0.289 33.0 630 3.5 8.86 7.8
31 0.324 57.0 640 3 15.65 7.4
Total 18.076 397.7 29130 84.5 71.31 243.6
AVE 0.583 12.83 940 2.7 2.30 7.9
23
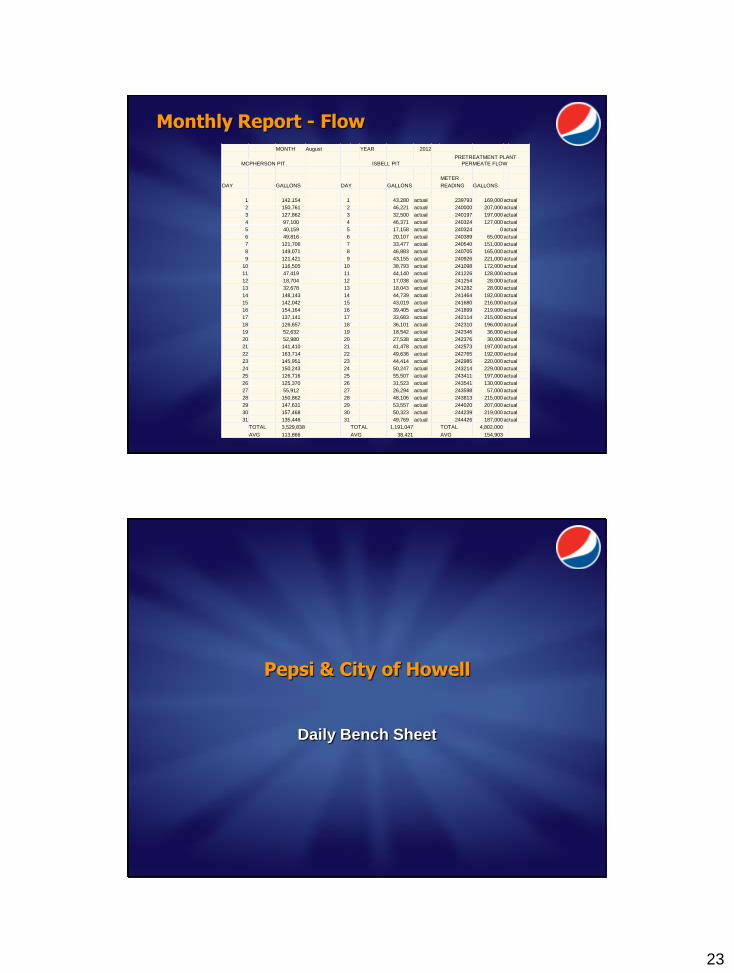
Monthly Report - Flow
MONTH August YEAR 2012
PRETREATMENT PLANT
PERMEATE FLOW MCPHERSON PIT ISBELL PIT
METER
DAY GALLONS DAY GALLONS READING GALLONS
1 142,154 1 43,280 actual 239793 169,000 actual
2 150,761 2 46,221 actual 240000 207,000 actual
3 127,862 3 32,500 actual 240197 197,000 actual
4 97,100 4 46,371 actual 240324 127,000 actual
5 40,159 5 17,158 actual 240324 0 actual
6 49,816 6 20,107 actual 240389 65,000 actual
7 121,706 7 33,477 actual 240540 151,000 actual
8 149,071 8 46,883 actual 240705 165,000 actual
9 121,421 9 43,155 actual 240926 221,000 actual
10 116,505 10 38,793 actual 241098 172,000 actual
11 47,419 11 44,140 actual 241226 128,000 actual
12 18,704 12 17,038 actual 241254 28,000 actual
13 32,678 13 18,043 actual 241282 28,000 actual
14 148,143 14 44,739 actual 241464 182,000 actual
15 142,042 15 43,019 actual 241680 216,000 actual
16 154,164 16 39,405 actual 241899 219,000 actual
17 137,141 17 33,683 actual 242114 215,000 actual
18 126,657 18 36,101 actual 242310 196,000 actual
19 52,632 19 18,542 actual 242346 36,000 actual
20 52,980 20 27,538 actual 242376 30,000 actual
21 141,410 21 41,478 actual 242573 197,000 actual
22 163,714 22 49,636 actual 242765 192,000 actual
23 145,951 23 44,414 actual 242985 220,000 actual
24 150,243 24 50,247 actual 243214 229,000 actual
25 126,716 25 55,507 actual 243411 197,000 actual
26 125,370 26 31,523 actual 243541 130,000 actual
27 55,912 27 26,294 actual 243598 57,000 actual
28 150,862 28 48,106 actual 243813 215,000 actual
29 147,631 29 53,557 actual 244020 207,000 actual
30 157,468 30 50,323 actual 244239 219,000 actual
31 135,446 31 49,769 actual 244426 187,000 actual
TOTAL 3,529,838 TOTAL 1,191,047 TOTAL 4,802,000
AVG 113,866 AVG 38,421 AVG 154,903
Pepsi & City of Howell
Daily Bench Sheet
24
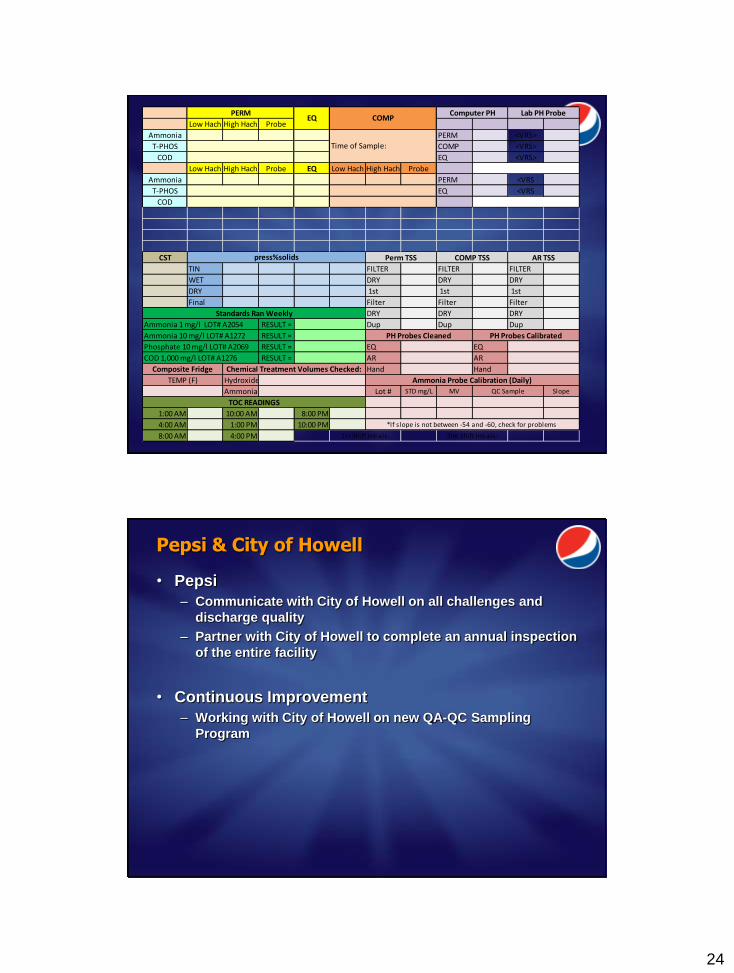
Low Hach High Hach Probe
Ammonia PERM <VRS>
T-PHOS COMP <VRS>
COD EQ <VRS>
Low Hach High Hach Probe EQ Low Hach High Hach Probe
Ammonia PERM <VRS
T-PHOS EQ <VRS
COD
CST
TIN FILTER FILTER FILTER
WET DRY DRY DRY
DRY 1st 1st 1st
Final Filter Filter Filter
DRY DRY DRY
Ammonia 1 mg/l LOT# A2054 RESULT = Dup Dup Dup
Ammonia 10 mg/l LOT# A1272 RESULT =
Phosphate 10 mg/l LOT# A2069 RESULT = EQ EQ
COD 1,000 mg/l LOT# A1276 RESULT = AR AR
Hand Hand
Hydroxide
Ammonia Lot # STD mg/L MV Slope
1:00 AM 10:00 AM 8:00 PM
4:00 AM 1:00 PM 10:00 PM
8:00 AM 4:00 PM
Time of Sample:
PERMEQ COMP
Computer PH Lab PH Probe
press%solids Perm TSS COMP TSS AR TSS
Standards Ran Weekly
PH Probes Cleaned PH Probes Calibrated
Composite Fridge Chemical Treatment Volumes Checked:
TEMP (F) Ammonia Probe Calibration (Daily)
QC Sample
TOC READINGS
*If slope is not between -54 and -60, check for problems
1st Shift Intials: 2nd Shift Intials:
Pepsi & City of Howell
• Pepsi
– Communicate with City of Howell on all challenges and
discharge quality
– Partner with City of Howell to complete an annual inspection
of the entire facility
• Continuous Improvement
– Working with City of Howell on new QA-QC Sampling
Program
25
0
0.2
0.4
0.6
0.8
1
1.2
1.4
1.6
1.8
1 2 3 4 5 6 7 8 9 10 11 12 13 14 15 16 17 18 19 20 21 22 23 24 25 26 27 28 29 30 31
Ph
osp
ho
rus C
on
cen
trati
on
August 2012 Phosphorus Composite Sample & Duplicate
Phosphorus (mg/L-P) Sample
Phosphorus (mg/L-P) Duplicate
26
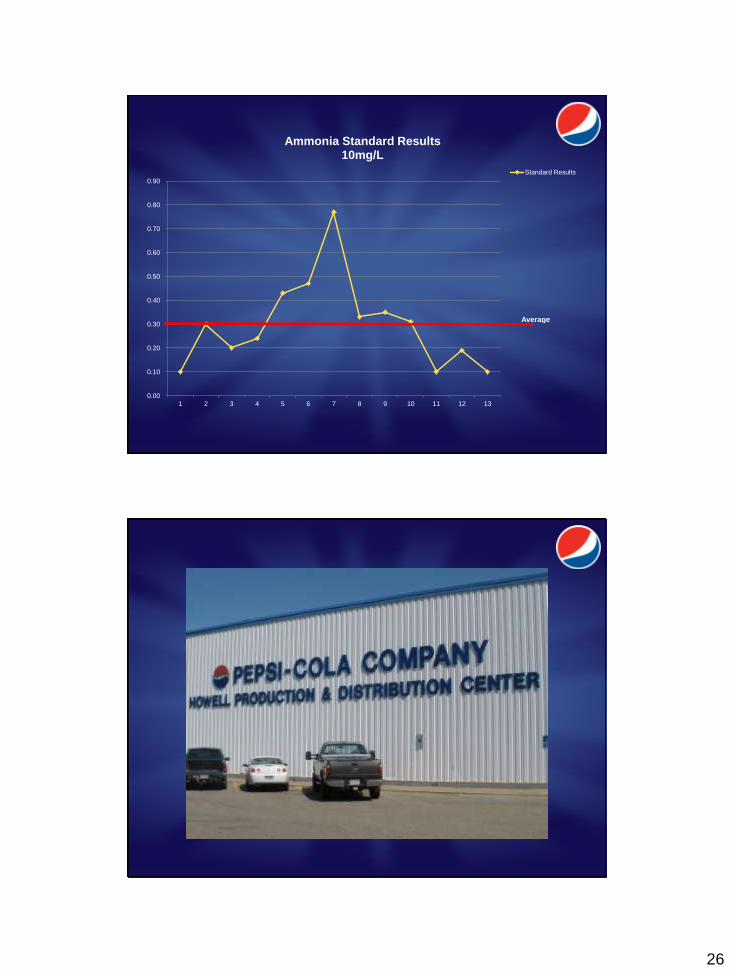
0.00
0.10
0.20
0.30
0.40
0.50
0.60
0.70
0.80
0.90
1 2 3 4 5 6 7 8 9 10 11 12 13
Ammonia Standard Results 10mg/L
Standard Results
Average