Embed Size (px)
Citation preview
Transportation Research Record 869 77
Performance Characteristics of Coal-Hauling
Trucks in Mountainous Terrain RONALD W. ECK, ABISHAI POLUS, AND KAI-CHU TSOU
Objectives of the study were to analyze and evaluate speed characteristics of coal trucks on two-lane mountain highways and to identify and quantify traffic performance limitations related to heavy trucks. To accomplish these objectives, spot speed data were collected on three coal-haul roads in West Virginia and a simulation analysis was performed by using the geometric characteristics of the same three sites as input. Upgrade and downgrade speed profiles were plotted for passenger cars and three classes of trucks. Truck speeds were significantly lower than passenger-car speeds on upgrades. On downgrades, the speed difference was not so pronounced and depended on whether trucks used braking or lower gears to reduce speed. Although simulated truck speeds showed good agreement with field data, simulated passenger-car speeds were uniformly higher than field speeds. This was attributed to the narrow roadway and rough pavement condition of the study sites. Geometric delay was significantly greater than traffic delay. Both types of delay were q11antified for a variety of geometric am. flow conditions. Acceleration noise, another traffic-flow parameter, was used as a measure of accident potential and stability of flows. Acceleration noise increased as volume increased on both upgrades and downgrades. Upgrade acceleration noise was greater than downgrade noise. Several practical applications of the results and directions for future research were presented.
The flow of traffic on mountain two-lane rural highways is adversely affected by the nonuniform performance capabilities of vehicles, These performance differences, particularly between loaded trucks and passenger vehicles, are most pronounced on steep upgrades and downgrades. The influence on flow is twofold, First, the reduction of highway capacity is significant on grades since, in effect, trucks take up the space of a larger number of passenger cars on grades than they do on level sections. second, because of poorer truck performance on grades, there is increased likelihood for traffic instabilities, accident potential, and delays. This becomes even more noticeable with an increase in the proportion of low-performance cars, which in turn increases the variability both between and within vehicle groups.
.lobst highways in West Virginia and throughout Appalachia are narrow two-lane roads carrying significant amounts of large coal-hauling trucks, which cause the effects mentioned above. As coal assumes a greater role as an energy source, local citizens, planners, and engineers are devoting increased attention to evaluating the impacts of the growing number of coal trucks on the highway system. The study described in this paper examined the impact of coal trucks on traffic flow character is tics of two-lane rural highways.
Two primary objectives, or stages, were established for the study, The first objective was to analyze and evaluate speed characteristics of coal trucks on upgrades and downgrades and to compare the findings with those from previous research. The second objective was to identify and quantify other traffic performance limitations caused by or related to heavy trucks and to suggest possible measures to reduce these adverse effects,
In order to accomplish the first objective, speed data were collected on sections of three coal-haul roads in West Virginia. For the second stage of the research, a simulation analysis was performed, the input for which was collected during the first stage,
PREVIOUS STUDIES
A few previous studies have been conducted on per-
formance limitations of coal or other heavy trucks on grades, although these limitations are widely accepted. Upgrade performance is primarily influenced by engine capabilities, specifically the ratio of weight to horsepower. This is suggested by the Policy on Geometric Design of Rural Highways (1) of the American Association of State Highway Officials (AASHO), which presents some speed-distance curves for upgrades based on an earlier flow study conducted by Huff and Scrivner (2). The Arizona Highway Department conducted another early study (3) on congestion caused by trucks on mountainous uPhill grades. It was concluded that the total delay was dependent on the topographical features of the individual hill, the alignment, sight distance, roadway width, and percentage of grade. Walton and Lee (4) presented findings of a study in Texas where speed-distance curves were developed for a range of grade profiles: these were applicable to the evaluation of the need for and design of climbing lanes for trucks.
Downgrade performance is affected by a complexity of components, which may include the length and steepness of the grade as well as the previous and the following grades, sight distance, and driver skill and attitude. The AASHO guide (1) suggests that, compared with level operation, heavy vehicles on downgrades show an increase in speed for grades up to about 5 percent and a decrease in speed for grades of about 7 percent or steeper. A California study <2l dealt with downhill speeds of heavy vehicles: no distinction was made between loaded and empty trucks. Analysis of field observations showed a distinct difference in the behavior of trucks on long downgrades as compared with that on shorter downgrades. For long grades, trucks were observed to slow down to a crawl and maintain that speed until not far from the bottom of the grade. For short, steep grades, truck speeds were slower near the summit but increased uniformly down the grade. A more recent study (6) analyzed speed characteristics of heavy vehicles on downgrades. It was found that loaded trucks reduce their speed considerably at the beginning of a downgrade. The amount of reduction was shown to be related to the length and slope of the downgrade: the second variable contributed exponentially to the increase in speed gradient.
Some studies have developed simulation models to study traffic flows. One such study on two-lane mountain highways conducted by the Midwest Research Institute <2> suggested a measure for rating grades by analyzing truck performance on grades with a simulation technique. st. John and Kobett (8) improved and adjusted the simulation model to -duplicate the characteristics of mixed (cars and trucks) flows on grades. Botha and May (9) used this same model to determine an optimum length and location of a climbing lane on a specific upgrade and to determine general guidelines for the most cost-effective location of climbing lanes when several upgrades are considered. It was determined that the travel-time benefit obtained from a climbing lane is most sensitive to gradient.
St. John's detailed model was adopted for use in the second stage of this study to examine the impacts of coal trucks on flow on mountain two-lane
78
Table 1. Characteristics of three study sites in Preston County, West Virginia. Site
No.
I
Average Site Slope• Location (%)
WV-7, Cascade 5.10
Transportation Research Record 869
Overall Peak- Trucks(%) Length Hour (m) Volume T1 Ti T3
866 380 5.5 3.3 3.0 2 WV-7, Kane's Creek 6.41 970 280 4.8 6.1 2.5 3 WV-26, Kingwood 4.98 1150 250 3.2 6.9 1.6
acomputed as weighted (by length) average of individual subsection slopes on each grade.
Table 2. Truck characteristics used in study.
Manufacturers' Suggested Avg Weight-
Avg to-Horsepower Avg Vehicle GVW Ratio Length Type Description (kg) (kg/hp) (m)
T1 Single-unit truck, 21 000 95 10.7 three axles or less
Ti Single-unit truck, 28 000 165 10.7 four axles
T3 Trucks with five axles 36 000 170 16.7 or more, including semi~ trailer combinations
highway sections. The simulation model is described in detaii elsewhere 1,.§.i.
DATA COLLECTION
By using a radar device, spot speed observations were taken at five points on each of three sections of mountain roads in Preston County, West Virginia. Characteristics of the three study sections are presented in Table 11 the truck types shown will be described below. These three sites were selected to be two-lane rural grades on a tangent section, where the approach roadway was approximately level. This was to permit study of traffic characteristics on upgrades and downgrades where speed was not limited by horizontal curvature. Other criteria in the selection of sites were the presence of a significant number of coal trucks, proximity to West Virginia University, and close physical resemblance to one another in terms of design speed, pavement width, and shoulder width.
Since heavily loaded trucks have significantly lower performance character is tics compared with empty trucks, they have the most severe impacts on traffic flow both in the upgrade and downgrade directions. For the purpose of this study, it was decided to examine mainly the loaded trucks, although comparisons were made with performance of other vehicles, particularly passenger cars. The loaded trucks were primarily hauling coal, although some were carrying limestone and some were tank trucks transporting petroleum products. All trucks were classified according to number of axles, while the average gross vehicle weight (GVW), ratio of weight to horsepower, and average length were obtained from the literature , since time and resource constrain ts precluded field determination of these quantities. A summary of truck characteristics is presented in Table 2.
FIELD SPEED CHARACTERISTICS
The speed data collected were sorted by the three truck types described above in addition to passenger cars. Based on visual observations, it was concluded that most of the fourand five-axle trucks (types T2 and T3) were coal-hauling vehicles originating at coal mines near the study sites and
Figure 1. Field data collected at site 1, WV-7 near Cascade.
so A
40 . " ~ .
30 ~ z ;:
20 .... < ,.. "' "' "' 10
0%
100
90
BO
"' 70 0.
~
" "' 60 "' e; ~
50 SJ
40
30
C D
4 .5%
6. 7%
10. 0%
7.1
Average Grade "' 5, U 5%
100 200 300 400 500 600 700 BOO 900
DISTANCE (in meters. from bottom of grade)
(a) Geometric Profile
c
• p
--Up!!,rade O Ti
--- Downgrade O T2 o r3
---- ----
E
100 200 300 400 500 600 700 BOO 900
DISTANCE (in meters, from bottom of grade)
(b) Speed Profiles
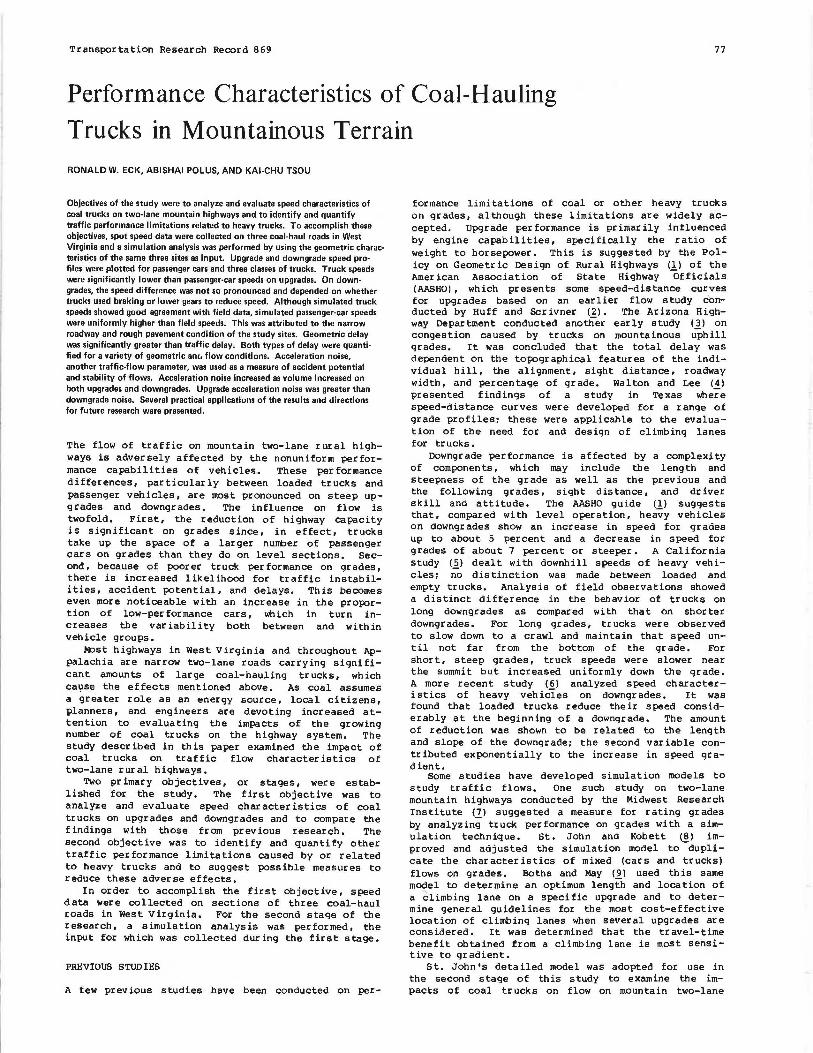
destined for a power plant or rail-loading facility. Figure l presents the mean spot speed profiles of
the four types of vehicles for site l for upgrade and downgrade directions. At the foot of the grade (station A) the mean speed of the passenger car (P) was about 16 .1 km/h higher than those of all three classes of loaded trucks. There was no significant difference between truck speeds at station A, Table 3 presents an analysis of speed differences for different vehicle types for the five stations at site 1. A continuous decrease in speeds was noted for station C, from which a slight increase in speed was noted, At station E, located at the top of the upgrade, the relative speed difference remained the same, although the single-unit four-axle trucks (T2l had the lowest mean speed. T2 speeds were significantly lower than those of passenger vehicles and five-axle trucks (T3l, as shown in Table 3. The four-axle trucks were found to have the lowest speed at the top of the grade on all three sites. The vast majority ot these trucks were coal-hauling trucks, and it is suspected that overloading was a prime reason for their relatively poor performance.
Figure l also presents the mean speed profiles for downgrade vehicles at site l. For trucks, there
Transportation Research Req:>rd 869
Table 3. Comparison of mean spaeds for different vehicle typas on site 1 upgrade.
Station
A B c Vehicle Type !-Statistic Significance• t-Statistic Significance• !-Statistic
P1 vs T1 -4.867 + -4.085 + -5.927 P1 vs T2 -12.315 + -13.010 + -11.821 P1 vs Tl -6.695 + -4.268 + -8 .729 T1 vs T2 0.900 0.445 1.866 T2 vs Tl 0.951 0.347 0.120
D
Significance• !-Statistic
+ -7.031 + -9.882 + -5.703 + 0.223
0.742
Significance•
+ + +
E
!-Statistic
--5.198 -11.037 -5 .816
1.895 1.655
79
Significance"
+ + + +
8The plus sign means significant at the S percent leveli the minus sign means not significant at the s percent level.
Figure 2. CDF of upgrade and downgrade mean spot spaeds at 181ected points on site 2, WV·7, Kane's Creek.
llPGRADE VEHICLES
100 STATION A - BOTTOM
10 ST IOH E - TOP
.. BO
ti z ~ 60 0
i:! ... 40
~ i:::
i 20
u
Tl I I ,......,,.
~ 8 SU Tz: /...
I ti r Tl
i z "' 60 :> CY
40 I . I i:!
/i,,,.JT2
... ~
§ '. 20 / / j ,' i I :>
' u
0 50 60 70 BO 90 100 20 JO 40 50 60 70 BO 90 100
SPEED (kph) SPEED (kph)
100
8 BO
ti 60 z
~
~ 40
~ ... 20 j
i! :> u
0 40
was relatively little acceleration proceeding downgrade. By the time the steepest part of the grade (station C) was reached, loaded-truck speeds were only about 3.2 knVh greater than speeds at the top of the grade. Passenger-car speeds, on the other hand, increased until the grade steepened significantly. Prior to entrance of the -10 percent section, braking reduoed vehicle speed slightly. At the bottom, loaded-truck speeds were essentially equal but about 11. 3 kll\/h slower than those of passenger cars. The widest variation between passenger-car and loaded-truck speeds occurred at this point. An analysis of speed differences similar to the one performed for the upqrade direction found that the differences between passenger cars and all types of loaded trucks were significant at the 5 percent level. Difference s between T2 and the other two loaded-truck types were not significant for this downgrade or for site·s 2 and 3.
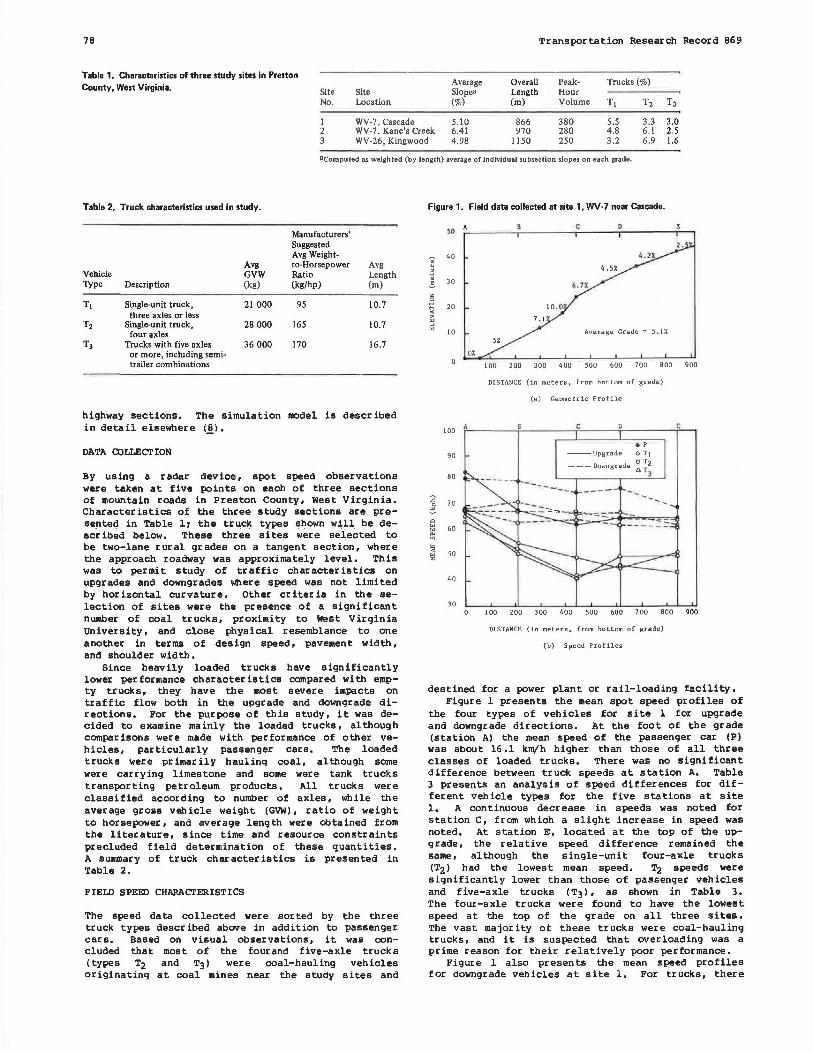
Cumuiative density functions (CDFsl of mean spot speed for all three sites were examined. Figure 2 presents typical examples of the CDFs for site 2, upgrade and downgrade directions, at stations A and E. It can be seen that the cumulative distributions followed the typical s-shaped curve. Slopes of the
50
DCMNGRADE V!HICLES
STATION E - TOP
60 70 BO 90 100
SPEED (kph)
t; z ~ CY
i:! ... "' ;: ... :l ~ u
STATION A - BOTTO!lf
60
40
20
0 60 70 BO 90 100
SPEED (kph)
curves were very steep at the entrances to the grades, which indicated uniform speeds within each vehicle category. However, on the grades themselves, the curves were flatter, which indicated more variable speeds as the grades affected vehicle performance.
The downgrade CDFs portrayed relatively low variability in speeds between truck types. At most observation stations, loaded-truck curves tracked one another very closely. Passenger-car curves demonstrated slightly higher speeds at all observation stations. This is what one would expect intuitively: i.e., passenger cars are fastest, followed by loaded trucks where drivers use both gears and brakes on relatively long and steep downgrades.
SIMULATION SPEED RESULTS
For further evaluation of coal-truck performance and impacts, a previously developed simulation model, which has been documented (81 and tested in I<ansas, was used. However, it was- necessary to check the validity of the model when applied to the narrow mountain roads of West Virginia.
A preliminary validity test had been conducted in

80
a previous study in West Virginia (10), The study determined that the model's space mean speeds closely resemble actual space mean speeds. Further checks were made by using a sensitivity analysis, a procedure in which the input data are altered to see what effect they have on the results. Changing model input data did in fact produce simulated traffic situations that agreed with what would be expected intuitively. Since the model proved satisfactory for further analysis, the previously collected geometric and flow data were used as an input to the simulation model. Output from the model contained several prominent results, These results are discussed in the next two sections of this paper.
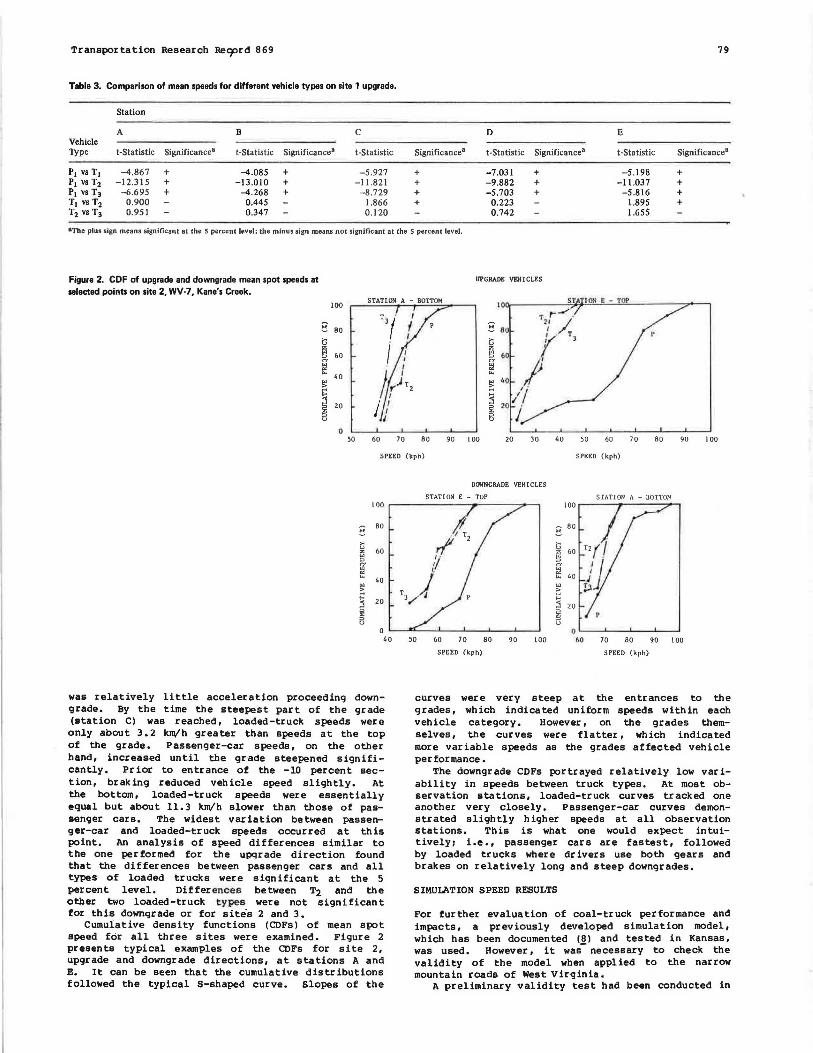
Figure 3 presents a typical example of mean field spot speeds versus mean simulation spot speeds as obtained for site 3. Two striking features may be observed. Simulation truck speeds and field truck speeds tended to be relatively similar without any major observable differences. This statement was valid for the other sites as well. Field and simulation performances of passenger cars, however, were statistically different; the simulation results were significantly higher. There are at least two possible reasons for the phenomenon, The study-site roadways were narrow (about 2. 7-m lanes with almost no shoulders) and had rough surface& (due to frequent patching). Both these factors could cause passenger-car speeds to be reduced below those predicted by the simulation model. However, truck speeds, since they were lower, were not so sensitive to these adverse geometric conditions.
It is also possible that, due to downsizing, passenger-car characteristics have changed since the simulation model was written in the late 1970s. The researchers observed a substantial number of four-cylinder subcompact cars on the study sections. These vehicles would be expected to perform more poorly than standard passenger cars on upgrades. However, this does not explain the fact that field speeds were lower than simulated speeds on the downgrade.
The second noticeable feature was the reduction in truck speeds versus the increase in passenger-car speeds, Th is phenomenon was attributed to a long horizontal curve located near the beginning of the grade. When the upgrade was encountered, truck speeds dropped off rapidly; loaded coal trucks (T2l were most affected, since their speeds dropped about 24 k"1/h. Passenger cars, however, displayed some acceleration ability, which in fact increased the instability in terms of rear-end collision hazard between passenger vehicles and trucks, Similar situations, in which a horizontal curve precedes a steep upgrade, may call for certain geometric measures such as provision of climbing lanes that will attract trucks and reduce flow hazard and friction between heavy vehicles and passenger cars.
Findings of simulated speeds versus field speeds on downgrades for site 3 are also presented in Figure 3. Again, except for passenger vehicles, the similarities between the simulation model and the field data were noticeable. The reasoning here is similar to that discussed above where the narrow lanes and shoulders reduced passenger-car speeds considerably.
TRAVEL-TIME DELAY
When a passenger vehicle approaches a slower, heavier vehicle on an upgrade, it may or may not encounter some travel delay, depending on the geometric conditions and volume and speed of opposing traffic. When there is no opposing traffic in the adjacent lane and when the geometrics of the site, such as sight distance, are satisfactory, usually no
TransPqrtation Research Record 869
Figure 3. Field versus simulated mean speed profiles for different vehicle types at site 3, WV-26, Kingwood.
70 A
60
50
. " •+O !I ! s 30
!;; > 20 "' ... "'
10
100
90
80
2 0. 70 ~
" "' "' 60 ::; ~ !l! 50
40
30 0
70
30
70
2 60 ~
" "' 50 "' :;; ~ 40 !l!
30
D II
o~
G. 7%
5. 07.
6.3%
Av.er age Grade • 4, 9%
B.0%
100 200 300 400 500 600 700 BOO 900 1000 1100 DISTANCE (in meters, from bottom of grade)
(a) Geometric Profile
P - SJ.l:ll\l l o ted, Downgrade
- - - - - -=-=-:-=II=:-=-= - -
100 200 300 400 500 600 700 800 900 1000 1100
DISTANCE (in meters, from bottom of grade)
(b) Speed Profiles for P and T 1 Vehicles.
r2
- Simulated , Downgrade
--==:::::&:::::=
100 200 300 400 500 600 700 800 900 1000
DISTANCE (in meters, from bottom of grade)
(c) Speed Profiles for r2
Vehicles.
TJ - S imulated, _ _.....,,.__ ·--. Doi.mgrade
T -Fj-3 ~hf . 00'oJ1'ii:tr4d'e
Tl - Field, Upgrade
- ---T 3 - Simulated, Upgrade
100 200 300 400 500 600 700 800 900 1000
DISTANCE (in meters, from bottom of grade)
(d) Speed Profiles for T3
Vehicles .
1100
1100
Transportation Research Record 869
Figure 4. Speed profiles of simulated passenger cars delayed on site-1 upgrade.
Table 4. Geometric and travel-delay rates for site 1.
Avg Traffic Delay Geometric Delay (s/km)
Direction (s/km)
.g_ :".', Q
"' "' ::;
of Hourly All Passenger Travel T, T2 TJ Volume Trucks Cars
Upgrade 47.0 55.9 59.3 150 10.6 6.3 200 12.0 8.2 250 1.7 9.9 300 1.0 12.0
Downgrade I.I 0.3 0.1 150 2.8 2.2 200 3.9 l.6 250 2.1 2.2 300 2.7 2.8
110
100
90
BO
70
60
so
40
30
20
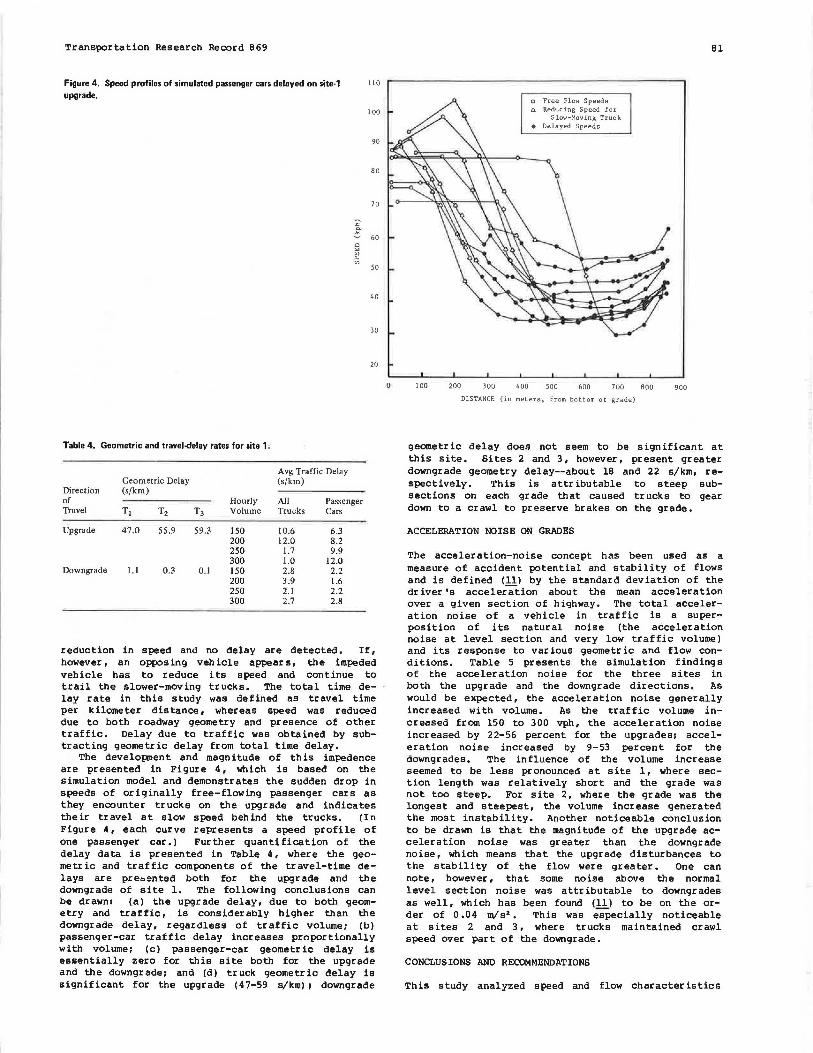
reduction in speed and no delay are detected. If, however, an opposing vehicle appears, the impeded vehicle has to reduce its speed and continue to trail the slower-moving trucks. The total time delay rate in this study was defined as travel time per kilometer distance, whereas speed was reduced due to both roadway geometry and presence of other traffic. Delay due to traffic was obtained by subtracting geometric delay from total time delay.
The developnent and magnitude of this impedence are presented in Figure 4, which is based on the simulation model and demonstrates the sudden drop in speeds of originally free-flowing passenger cars as they encounter trucks on the upgrade and indicates their travel at slow speed behind the trucks. (In Figure 4, each curve represents a speed profile of one passenger car.) Further quantification of the delay data is presented in Table 4, where the geometric and traffic components of the travel-time delays are prebented both for the upgrade and the downgrade of site 1. The following conclusions can be drawn: (a) the upgrade delay, due to both geometry and traffic, is considerably higher than the downgrade delay, regardless of traffic volume; (b) passenger-car traffic delay increases proportionally with volume; (c) passenger-car geometric delay is essentially zero for this site both for the upgrade and the downgrade; and (d) truck geometric delay is significant for the upgrade (47-59 s/km); downgrade
100 200 300
o Free Flow Speeds ~ Reducing Speed for
Slow-Moving Truck • Delayed Speeds
500 600 700
DISTANCE (in meters, from bottom of grade)
Bl
BOO 900
geometric delay does not seem to be significant at this site. Sites 2 and 3, however, present greater downgrade geometry delay--about 18 and 22 s/km, respectively. This is attributable to steep subsections on each grade that caused trucks to gear down to a crawl to preserve brakes on the grade.
ACCELERATION NOISE ON GRADES
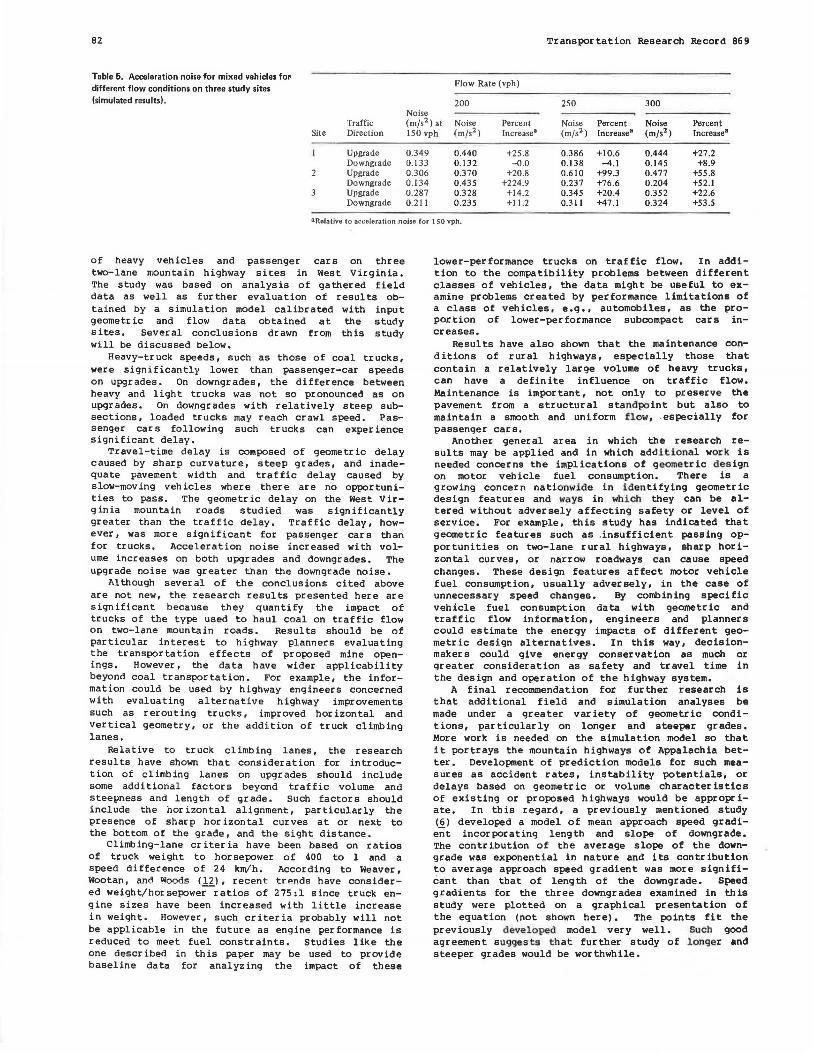
The acceleration-noise concept has been used as a measure of accident potential and stability of flows and is defined (11) by the standard deviation of the driver •s acceleration about the mean acceleration over a given section of highway. The total acceleration noise of a vehicle in traffic is a superposition of its natural noise (the acceleration noise at level section and very low traffic volume) and its response to various geometric and flow conditions. Table 5 presents the simulation findings of the acceleration noise for the three sites in both the upgrade and the downgrade directions. As would be expected, the acceleration noise generally increased with volume. As the traffic volume increased from 150 to 300 vph, the acceleration noise increased by 22-56 percent for the upgrades; acceleration noise increased by 9-53 percent for the downgrades. The influence of the volume increase seemed to be less pronounced at site 1, where section length was relatively short and the grade was not too steep. For site 2, where the grade was the longest and steepest, the volume increase generated the most instability. Another noticeable conclusion to be drawn is that the magnitude of the upgrade acceleration noise was greater than the downgrade noise, which means that the upgrade disturbances to the stability of the flow were greater. One can note, however, that some noise above the normal level section noise was attributable to downgrades as well, which has been found (11 l to be on the order of 0 .04 m/s2 • This was especially noticeable at sites 2 and 3, where trucks maintained crawl speed over part of the downgrade.
CONCLUSIONS AND RECOMMENDATIONS
This study analyzed speed and flow characteristics
82
Table 5. Acceleration noise for mixed vehicles for different flow conditions on three study sites (simulated resultsl.
Site
2
3
Noise Traffic (m/s2 )at Direction ISO vph
Upgrade 0.349 Downgrade 0.133 Upgrade 0.306 Downgrade 0.134 Upgrade 0.287 Downgrade 0.211
Flow Rate (vph)
200
Noise Percent (m/s2 ) Increase3
0.440 +25.8 0.132 -0.0 0.370 +20.8 0 .435 +224.9 0.328 +14.2 0.235 +11.2
Transportation Research Record 869
250 300
Noise Percent Noise Percent (m/s2 ) Increase8 (m/s2 ) lncrease8
0.386 +10.6 0.444 +27.2 0.138 -4.1 0.145 +8.9 0.610 +99.3 0.477 +55 .8 0.237 +76.6 0.204 +52 .I 0.345 +20.4 0.352 +22.6 0.311 +47.1 0.324 +53.5
a Relative to acceleration noise for 150 vph.
of heavy vehicles and passenger cars on three two-lane mountain highway sites in West Virginia. The study was based on analysis of gathered field data as well as further evaluation of results obtained by a simulation model calibrated with input geometric and flow data obtained at the study sites. Several conclusions drawn from this study will be discussed below.
Heavy-truck speeds, such as those of coal trucks, were significantly lower than passenger-car speeds on upgrades. On down9r ades, the di ff er ence between heavy and li9ht trucks was not so pronounced as on upgrades. On downgrades with relatively steep subsections, loaded trucks may reach crawl speed. Passenger cars following such trucks can experience significant delay.
Travel-time delay is composed of geometric delay caused by sharp curvature, steep grades, and inadequate pavement width and traffic delay caused by slow-moving vehicles where there are no opportunities to pass. The geometric delay on the West V irg in ia mountain roads studied was significantly greater than the traffic delay. Traffic delay, however, was more significant for passenger cars than for trucks. Acceleration noise increased with volume increases on both upgrades and downgrades. The upgrade noise was greater than the downgrade noise.
Al though sever al of the conclusions cited above are not new, the research results presented here are significant because they quantify the impact of trucks of the type used to haul coal on traffic flow on two-lane mountain roads. Results should be of particular interest to highway planners evaluating the transportation effects of proposed mine openings, However, the data have wider applicability beyond coal transportation. For example, the information could be used by highway engineers concerned with evaluating alternative highway improvements such as rerouting trucks, improved horizontal and vertical geometry, or the addition of ti::uck climbing lanes.
Relative to truck climbing lanes, the research results have shown that consideration for introduction of climbing lanes on upgrades should include some additional factors beyond traffic volume and steepness and length of grade. such factors should include the horizontal alignment, particularly the presence of shai::p horizontal curves at or next to the bottom of the grade, and the sight distance .
Climbing-lane er i ter ia have been based on ratios of truck weight to horsepower of 400 to l and a speed difference of 24 knv'h. According to weaver, Wootan, and Woods (1 2}, recent t r ends have considered weight/horsepowe;-ratios of 275 :l since truck engine sizes have been increased with little increase in weight. However, such criteria probabiy will not be applicable in the future as engine performance is reduced to meet fuel constraints. studies like the one described in th is paper may be used to provide baseline data for analyzing the impact of these
lower-performance trucks on traffic flow. In addition to the compatibility problems between different classes of vehicles, the data might be useful to examine problems created by performance limitations of a class of vehicles, e.g., automobiles, as the proportion of lower-performance subcompact cars increases.
Results have also shown that the maintenance conditions of rural highways, especially those that contain a relatively large volume of heavy trucks, can have a definite influence on traffic flow. Maintenance is important, not only to preserve the pavement from a structural standpoint but also to maintain a smooth and uniform flow, especially for passenger cars.
Another general area in which the research results may be applied and in which addit i onal work is needed concerns the implications of geometric design on motor vehicle fuel consumption. There is a growing concern nationwide in identifying geometric design features and ways in which they can be altered without adversely affecting safety or level of service. For example, this study bas indicated that geometric features such as .insufficient passing opportunities on two-lane rural highways, sharp horizontal curves, or narrow roadways can cause speed changes. These design features affect motor vehicle fuel consumption, usually adversely, in the case of unnecessary speed changes. By combining specific vehicle fuel consumption data with geometric and traffic flow information, engineers and planners could estimate the energy impacts of different geometric design alternatives. In this way, decisionmakers could give energy conservation as much or greater consideration as safety and travel time in the design and operation of the highway system.
A final recommendation for further research is that additional field and simulation analyses be made under a greater variety of geometric conditions, particularly on longer and steeper grades. More work is needed on the simulation model so that it portrays the mountain highways of Appalachia better. Development of prediction models for such measures as accident rates, instability potentials, or delays based on geometric or volume character is tics of existing or proposed highways would be appropr fate. In this regard, a previously mentioned study (6) developed a model of mean approach speed gradient incorporating length and slope of downgrade. The contribution of the average slope of the downgrade was exponential in nature and its contribution to average approach speed gradient was more significant than that of length of the downgrade. Speed gradients for the three downgrades examined in this study were plotted on a graphical presentation of the equation (not shown here). The points fit the previously developed model very well. Such good agreement suggests that further study of longer and steeper grades would be worthwhile.

Transportation Research Record 869
ACKN()'lLEDGMENT
The research described in this paper was s upported in part by the West Virginia University Energy Research Center. Special thanks are extended to John Halkias for his assistance in running the simulation model and to Abel Dede for his efforts in data reduction.
REFERENCES
1. A Policy on Geometric Design of Rural Highways. AASHO, Washington, DC, 1965,
2. J.S. Huff and F.H. Scrivner. Simplified Climbing Lane Design: Theory and Road Test Results. HRB, Bull. 104, 1955.
3. Arizona Highway Department. Report on Congestion Caused by Trucks on Uphill Mountain Grades. Division of Economics, U.S. Bureau of Public Roads, Oct. 1953,
4. C.N. Walton and E.C. Lee. Characteristics of Trucks Operating on Grades. TRB, Transportation Research Record 631, 1977, pp. 23-30,
5. G.H. Webb, Downhill Truck Speeds. California Division of Highways, Sacramento, Traffic Bull. 1, July 1961.
6, A. Polus, J. Craus, and I. Grinberg. Downgrade Speed Characteristics of Heavy Vehicles. Transportation Engineering Journal of ASCE, Vol. 107, No. TE 2, March 1981, pp. 143-152.
83
7. D.R. Kobett and others. Traffic Simulation for Design of Uniform Service Roads in Mountainous Terrain--Volume 2: oescr iption and Validation of the Simulation, Midwest Research Institute, Kansas City, MO, 1970.
8. A.O. St. John and D.R. Kobett. Grade Effects on Traffic Flow Stability and Capacity. NCHRP, Rept. 185, 1978.
9. J.L. Botha and A.O. May. A Decision-Making Framework for the Evaluation of Climbinq Lanes on Two-Way Rural Roads. Univ. of California, Berkeley, Res, Rept. UCB-ITS-RR-80-8, July 1980, 29 pp.
10. J, Halkias. Impact of Coal Trucks on Delay and Safety of Other Highway Users. Department of Civil Engineering, West Virginia Univ., Morgantown, M.S. thesis, 1980, 149 pp.
11. D.L. Gerlough and M.J. Huber. Traffic Flow Theory. TRB, Special Rept. 165, 1975.
12. G.D. Weaver, c.v. Wootan, and D.L. woods. Highway Design Criteria: Problems and Project ions. Proc., Specialty Conference Implementing Highway Safety Improvements, American Society of Civil Engineers, San Diego, CA, March 12-14, 1980, pp. 38-53.
P11blicatlo11 of this paper sponsored by Committee on 'Traffic Flow Theory n11d 0 1nr11G·terlsrlcs.