Embed Size (px)
Citation preview

Performance of the LHCb muon system
This article has been downloaded from IOPscience. Please scroll down to see the full text article.
2013 JINST 8 P02022
(http://iopscience.iop.org/1748-0221/8/02/P02022)
Download details:
IP Address: 137.138.125.164
The article was downloaded on 10/06/2013 at 10:08
Please note that terms and conditions apply.
View the table of contents for this issue, or go to the journal homepage for more
Home Search Collections Journals About Contact us My IOPscience
2013 JINST 8 P02022
PUBLISHED BY IOP PUBLISHING FOR SISSA MEDIALAB
RECEIVED: November 6, 2012REVISED: December 21, 2012ACCEPTED: January 25, 2013
PUBLISHED: February 27, 2013
Performance of the LHCb muon system
A.A. Alves Jr,a L. Anderlini,b M. Anelli,c R. Antunes Nobrega,a,1 G. Auriemma,a,d
W. Baldini,e G. Bencivenni,c R. Berutti, f ,2 A. Bizzeti,b V. Bocci,a N. Bondar,g
W. Bonivento, f B. Botchin,g S. Cadeddu, f P. Campana,c G. Carboni,h,i A. Cardini, f
M. Carletti,c P. Ciambrone,c E. Dane,c S. De Capua,h V. De Leo, f ,3 C. Deplano, f
P. De Simone,c F. Dettori, f , j A. Falabella,k,l F. Ferreira Rodriguez,m M. Frosini,b,n
S. Furcas,c,4 E. Furfaro,a G. Graziani,b L. Gruber,o,p G. Haefeli,q A. Kashchuk,g
F. Iacoangeli,a A. Lai, f G. Lanfranchi,c M. Lenzi,b O. Levitskaya,g K. Mair,o O. Maev,g
G. Manca, f M. Mara, f G. Martellotti,a,5 A. Massafferri Rodrigues,r R. Messi,h,i
F. Murtas,c P. Neustroev,g R.G.C. Oldeman, f , j M. Palutan,c G. Passaleva,b
G. Penso,a,s D. Pinci,a E. Polycarpo,m D. Raspino, f ,6 G. Sabatino,h,i B. Saitta, f , j
A. Salamon,h R. Santacesaria,a E. Santovetti,h,i A. Saputi,c A. Sarti,c,s C. Satriano,a,d
A. Satta,h M. Savrie,e,l B. Schmidt,o T. Schneider,o B. Sciascia,c A. Sciubba,a,s
N. Serra, f ,7 P. Shatalov,t S. Vecchi,e M. Veltri,b,u S. Volkovg and A. Vorobyevg
aSezione INFN di Roma, Roma, ItalybSezione INFN di Firenze, Firenze, ItalycLaboratori Nazionali di Frascati dell’INFN, Frascati, ItalydUniversita della Basilicata, Potenza, ItalyeSezione INFN di Ferrara, Ferrara, Italyf Sezione INFN di Cagliari, Cagliari, ItalygPetersburg Nuclear Physics Institute, Gatchina, St-Petersburg, RussiahSezione INFN di Roma Tor Vergata, Roma, ItalyiUniversita di Roma Tor Vergata, Roma, ItalyjUniversita di Cagliari, Cagliari, ItalykSezione INFN di Bologna, Bologna, ItalylUniversita di Ferrara, Ferrara, Italy
1Now at Universidade de Juiz de Fora, Juiz de Fora, Brazil.2Now at CRS4 , Parco Scientifico e Tecnologico della Sardegna, Pula (Cagliari), Italy.3Now at Linkalab, Complex Systems Computational Laboratory, Cagliari, Italy.4Now at Sezione INFN di Milano, Milano, Italy.5Corresponding author.6Now at ISIS-STFC, Rutherford Appleton Laboratory, U.K.7Now at Physik-Institut, Universitat Zurich, Zurich, Switzerland.
c© CERN 2013, published under the terms of the Creative Commons Attribution 3.0licence by IOP Publishing Ltd and Sissa Medialab srl. Any further distribution of this
work must maintain attribution to the author(s) and the published article’s title, journal citation and DOI.doi:10.1088/1748-0221/8/02/P02022

2013 JINST 8 P02022
mInstituto de Fısica - Universidade Federal do Rio de Janeiro (IF-UFRJ), Rio de Janeiro, BrazilnUniversita di Firenze, Firenze, ItalyoEuropean Organisation for Nuclear Research (CERN), Geneva, SwitzerlandpTechnische Universitat Wien, AustriaqEcole Polytechnique Federale de Lausanne (EPFL), Lausanne, SwitzerlandrCentro Brasileiro de Pesquisas Fısicas (CBPF), Rio de Janeiro, BrazilsSapienza, Universita di Roma, Roma, Italyt ITEP, Moscow, RussiauUniversita di Urbino, Urbino, Italy
E-mail: [email protected]
ABSTRACT: The performance of the LHCb Muon system and its stability across the full 2010 datataking with LHC running at
√s = 7 TeV energy is studied. The optimization of the detector setting
and the time calibration performed with the first collisions delivered by LHC is described. Particlerates, measured for the wide range of luminosities and beam operation conditions experienced dur-ing the run, are compared with the values expected from simulation. The space and time alignmentof the detectors, chamber efficiency, time resolution and cluster size are evaluated. The detectorperformance is found to be as expected from specifications or better. Notably the overall efficiencyis well above the design requirements.
KEYWORDS: Muon spectrometers; Trigger detectors; Wire chambers(MWPC, Thin-gap cham-bers, drift chambers, drift tubes, proportional chambers etc); Particle tracking detectors
ARXIV EPRINT: 1211.1346

2013 JINST 8 P02022
Contents
1 Introduction 1
2 The LHCb muon system 2
3 Detector setting 5
4 Detector operation performance in 2010 6
5 Data samples and track reconstruction 8
6 Rates 9
7 Cluster size 13
8 Timing 158.1 Time performance 168.2 Stability of the time response 18
9 Spatial alignment 209.1 Space alignment measured with muon tracks 20
10 Detector efficiency 2210.1 Muon samples and track selection 2310.2 Background subtraction 2410.3 Check of the procedure with simulation 2610.4 Measured efficiencies 27
11 Conclusions 29
1 Introduction
LHCb is an experiment dedicated to heavy flavour physics at the LHC pp collider. Its primary goalis to look for indirect evidence of new physics in CP violation and rare decays of beauty and charmhadrons.
The LHCb apparatus [1] is a single-arm forward spectrometer, consisting of a series of sub-detectors aligned along the beam axis. A silicon-strip Vertex Locator (VELO) centered on theinteraction point allows for precise vertex reconstruction. A dipole magnet with an integrated fieldof 4 Tm provides the bending for momentum measurement. Four multi-layer stations, one placedupstream and three downstream the magnet, ensure the tracking. Silicon strips are used in theupstream station (TT) and in the downstream inner tracker (IT) while straw tubes are used in the
– 1 –

2013 JINST 8 P02022
downstream outer tracker (OT). Particle identification is provided by two ring imaging Cherenkov(RICH) detectors, by an electromagnetic and hadron calorimeter system (ECAL and HCAL) andby the Muon Detector.
The calorimeters and the muon detector with their readout electronics are designed to sendinformation to the first level hardware trigger (L0) unambiguously identifying collision events ofan LHC bunch crossing in a time window of 25 ns. A second level software trigger (HLT) performsan almost complete event reconstruction using the information of the tracking detectors and selectsspecific channels of interest for the LHCb physics program [2].
The muon system consists of 5 detector stations with a total area of 435 m2, 1380 chambersof 20 different types for a total of 122k channels [1]. In 2009 a first setting of the detector wasperformed using cosmic rays [3]. In 2010 the large data sample made available by the first LHCpp collisions at
√s = 7 TeV, allowed for a rapid improvement of the detector working conditions
and events were collected for a total of ∼ 37 pb−1.In this paper we describe the actions taken to optimize the detector performance, in particular
the time calibration. We then report a detailed study of the detector behaviour through the widerange of beam operation conditions spanned during the 2010 data taking. Due to the continuousprogress of the LHC, the luminosity spanned from 1027 to 1.5× 1032 s−1 cm−2 with an averagenumber µ of interactions per bunch crossing increasing up to µ∼ 2, while the nominal design val-ues of LHCb were a luminosity of 2×1032 s−1 cm−2 and a µ∼ 0.4. Particle rates were measuredacross the five orders of magnitude of the experienced luminosities. The detector performance interms of space and time alignment of the detectors, chamber efficiency, time resolution, noise leveland cluster size was evaluated and compared with expectations. The system behaviour resultedto be in agreement with the design specifications or better as in the case of the muon detectionefficiency in the required 25 ns time window.
Since the end of the 2010 run period considered here, LHCb has taken almost two orders ofmagnitude more data, with even higher instantaneous luminosities. The detector performance hasremained very similar.
2 The LHCb muon system
The muon detector system is designed to send binary information to the data acquisition (DAQ)and to the hardware processors of the muon trigger (L0MU) which, together with the calorimetertrigger, constitutes the bulk of the first level trigger.
The detector is composed of five stations (M1–M5) of rectangular shape, placed along thebeam axis as shown in figure 1. Each station is equipped with 276 multi-wire proportional cham-bers (MWPCs) with the exception of the inner part of the first station, subject to the highest radi-ation, which is equipped with 12 GEM detectors [4]. Each station consists of two mechanicallyindependent halves, called A and C sides, that can be horizontally moved to access the beam pipeand the detector chambers for installation and maintenance. Stations M2 to M5 are placed down-stream the calorimeters and are interleaved with 80 cm thick iron absorbers. Their information isused to identify and trace penetrating muons both in the online and offline analysis. Station M1 isinstead located in front of the calorimeters and it is only used in the first level trigger.
– 2 –

2013 JINST 8 P02022
16m
rad
258 mrad
Muon filter 1
R2
R3
R4
R1
Muon filter 4
Muon filter 3
Muon filter 2
CALO
RIM
ETERS
M1 M2 M3 M4 M5
y
z1m
1m
beam
pip
e
side C side Ay
xR4 R2R3 R1 R4R3R2
(a) (b)
R1
Figure 1. (a) Side view of the LHCb Muon Detector. (b) Station layout with the four regions R1–R4.
The L0MU trigger processors [5] perform a stand-alone muon track reconstruction which re-quires to find hits in all the 5 stations and calculate the transverse momentum pT of the tracks.Muon candidates are accepted if their pT is above a given threshold.1 The hit alignment along atrack is first verified in the four stations M2–M5 searching for hits inside suitable fields of interest(FOI) projective to the interaction point. If this alignment is found, the hits of M2 and M3 stationsare used to predict the track hit position in M1. If the M1 hit nearest to the prediction is found insidea suitable FOI, this hit and the one in M2 are used to define the track after the magnet deflection.The direction of such a track, its impact point at the magnet centre and the average pp interactionpoint, provide a rough fast measurement of the magnet deflection and the pT used by L0MU. Theinformation of M1 station, placed in front of the calorimeter material, improves the pT resolutionfrom ∼ 35 % to ∼ 25 %, with respect to what could be obtained using only the 4 downstreamstations. The M1 information is however not helpful in the high level trigger or offline where adirect matching of the tracks reconstructed making use of the full spectrometer (T-tracks) with themuon track segment detected in M2–M5 can be performed. The momentum of the matched T-track,having a typical resolution ranging from 0.35 to 0.55 %, is assigned to the muon.
The geometry of the five stations is projective. The transverse dimensions of the stations scalewith their distance from the interaction point. The chambers are positioned to form, across thestations, adjacent projective towers pointing to the beam crossing position.
The chambers are partitioned into physical channels whose size is constrained by construc-tional reasons, or by requirements on their electrical capacitance and rate capability that influencethe noise level and dead time of the front end (FE) electronics. Appropriate combinations of phys-
1The L0MU trigger is the logical “or” of a single-muon trigger with a pT threshold of 1.5 Gev/c and a di-muontrigger where a minimal value of 1.3 Gev/c is required for the geometrical mean of the first largest and the second largestmuon pT found in the event.
– 3 –

2013 JINST 8 P02022
BEAM PIPE
M1R1 M1R2
M1R3
M1R4
R1 R2 R3 R4 x
y3.85 m
3.20 m
Figure 2. Left: a quadrant of M1 station. Each rectangle represents one chamber. Right: division intological pads of four chambers belonging to the four regions of station M1. In stations M2, M3 (M4, M5) thenumber of pad columns per chamber is double (half) the number in the corresponding region of station M1,while the number of pad rows is the same.
ical channels are performed to build up rectangular logical pads having the x and y sizes requiredto obtain the desired performance of muon trigger and offline muon identification.
Each station is divided into four regions with increasing distance from the beam axis as shownin figure 1(b). The linear dimensions of the regions R1, R2, R3, R4, and the size of their logicalpads, scale in the ratio 1:2:4:8 (see figure 2). Since the dipole magnet provides bending in the hor-izontal plane, the logical pad segmentation of muon chambers is finer in the horizontal directionx than in the vertical direction y, to allow a good estimate of the momentum. Stations M1, M2and M3, used by the trigger to determine the track direction and the pT of the candidate muon,have a higher x granularity than stations M4 and M5, whose main purpose is the identification ofpenetrating particles. In the inner region of the first station M1, the logical pad size is 1 cm in xand 2.5 cm in y. In the other stations the vertical size y just scales projectively with their distancefrom the interaction point; the x granularity instead is two times finer in stations M2, M3 and twotimes larger in M4, M5. The total number of logical pads is 55296.
Since the L0MU trigger requires a five-fold coincidence among all the stations, the efficiencyof each station must be ≥ 99%, within a time window smaller than 25 ns, to obtain a trigger ef-ficiency of at least 95%. To comply with this stringent requirement, excellent time resolution andredundancy of the detector are needed. The desired performance is obtained with an optimizedcharge-collection geometry and using a fast gas mixture.2 Moreover the chambers are multi-gapdetectors. In stations M2 to M5 the MWPCs consist of two coupled bi-gap detectors with two inde-pendent readouts. In station M1, R2 to R4 the MWPC’s have only two gas gaps with independentreadout to minimize the material in front of the electromagnetic calorimeter. In region M1R1 two
2The gas mixture is Ar/CO2/CF4 ' 40/55/5 for MWPCs and ' 45/15/40 for GEM chambers.
– 4 –

2013 JINST 8 P02022
superimposed triple-GEM chambers are used. In all cases, in standard running conditions, the twoindependent readout layers are connected to a logical “or” in the FE.
Since constructional constraints, as well as requirements on spatial resolution and rate capabil-ity, strongly vary in different stations and regions of the detector, different readout techniques wereemployed. In the high granularity regions M2/3 R1/2 a double readout was adopted for the cham-bers: the physical channels are narrow vertical anode strips defining the x resolution and largercathode pads defining the y resolution. Both signals are readout via FE channels and directly sentto the trigger and DAQ through optical links. Logical pads are then obtained as a logical “and” be-tween anode and cathode pads. In all the other stations and regions a single readout was adopted:the chambers are segmented into anode or into cathode pads generally smaller than the requiredlogical pad. These pads are subsequently combined to build larger logical channels that are sentto the trigger and DAQ. In the large low resolution external regions R4, anode pads are formedby soldering an appropriate number of adjacent wires. In the other regions, both in MWPCs andin GEM chambers, cathode pads are obtained with a segmented printed circuit board. A total of122112 physical channels enter the front end electronics.
The FE boards house two custom made 8-channels ASICs called CARIOCA [6] that can pro-cess both the negative and positive polarity signals from wires and cathode pads. Each channelconsists of a fast low-impedance charge-sensitive preamplifier, a main amplifier-shaper with base-line restorer and single-threshold discriminator. The response has a peaking time of 10 ns and awidth not exceeding 60 ns to minimize the dead time. The CARIOCA output channels are routedto flexible logical units performing the logical “or” of a variable number of channels. Up to fouradjacent physical pads are connected to build a logical pad. In the M1 station, where the channeloccupancy is high, the signals from the logical pads are directly sent to the trigger and DAQ. Inmost of the other low occupancy regions, M2/3 R3/4 and M4/5 R2/3/4, several contiguous logicalpads are further connected to build larger logical channels in the form of vertical and horizontalstrips, with the aim of reducing the number of optical links to the trigger and DAQ. The logical“or” is fully performed by logic units (DIALOG [7]) sitting on the FE boards only in part of thedetector, while is completed on special intermediate boards in regions where the logical channelspans more than one FE board.
A total of 25920 logical channels are built and finally routed to the Off Detector Electronics(ODE) [8], where signals are tagged with the identification number of the bunch crossing (BXID)and sent to the trigger processors via optical links without zero suppression. In the ODE boardsthe fine time information inside the 25 ns gate, measured by a 4-bit TDC ASIC [9], is added to thedata to be sent to the DAQ. The trasmission from the ODE to the acquisition system goes throughthe TELL1 boards [10] where the data are zero suppressed and suitably packed.
A distributed system, based on a CAN-bus network and 600 microcontrollers accessing sin-gle physical channels, performs the setting of the operating conditions and the monitoring of thedetector [11]
3 Detector setting
The operating conditions of the chambers were optimized through a procedure described else-where [12, 13] which aims at reaching a low and stable noise rate while minimizing ageing effects
– 5 –

2013 JINST 8 P02022
and cluster size. These conditions were satisfied by setting the thresholds to 6 noise r.m.s. and bychoosing the minimal high voltage value allowing to obtain the required 99% efficiency.
Although all the MWPCs have the same gas gap of 5 mm, different HV (from 2.53 to 2.65 kV)were required in different regions, depending on the pad size and the readout technique. The cham-ber setting was kept constant during the whole 2010 run, except for region M5R2 were voltage wasreduced by 90 V when a large increase in luminosity produced a jump of the HV trip rate. Thresh-olds were lowered correspondingly to maintain high efficiency at the price of a slight increase ofthe noise level.
The triple GEM detectors of M1R1 were operated with voltages of 435/425/415 V for the firstpart of the run. Voltages were later reduced twice by 5 V per gap for safer operations following theincreasing luminosity.
4 Detector operation performance in 2010
During 2010 the detector was operated to acquire some special calibration runs and many physicsruns with pp collisions events at
√s = 7 TeV. Due to the continuous progress of the LHC, the 2010
data span a wide range of luminosity values, from 1027 to 1.5×1032 s−1 cm−2. The machine op-erations were accordingly evolving with time, from the single colliding bunch per orbit of the firstruns, to the 150 ns spaced bunch trains of the highest intensity runs with 344 colliding bunches perorbit, equivalent to a 3.9 MHz collision rate, and the first tests with 50 ns spaced bunches. Overallan integrated luminosity of ∼ 37 pb−1 was collected.
As a first illustration of the muon detector operation performance, we show in figure 3 a typicalhit map of the five stations during a physics run. The few holes present on the maps correspondto dead channels. Most of them were due to hardware problems in the readout chain known sincethe beginning of the data taking.3 They affected only 129 of the 55296 logical pads (0.2%). Thedetector failures occurred during the run, were mostly due to HV trips of single detector gaps andwere recovered after some conditioning procedure.
The overall effect of dead channels on the muon tracking efficiency over the full 2010 run hasbeen estimated [14] by counting the fraction of muon tracks with momentum larger than 6 GeV/ccrossing one of the dead channels in Monte Carlo minimum bias events. It resulted to be below1%. For the stations M2–M5, due to the large redundancy given by the four independent gaps perchamber, the effect of gap failures on the overall system efficiency was negligible (< 0.1%). In thecase of M1, gap failures are more dangerous since there are only 2 gaps per chamber. However, asit has been explained in section 2, this station is only used by the L0MU trigger and not by the highlevel trigger and offline reconstruction. If a detector of M1 is faulty, the L0MU trigger can be setto ignore the information of the trigger sector4 containing the M1 dead channels and calculate pT
with M2 and M3 hits. This results in a poorer resolution of the pT measurement and consequentlya slight degradation of the trigger performance in the small affected region. This procedure wasused only in one case for a chamber in M1R1, when both its triple GEM detectors became very
3Almost all of them have been cured in the LHC shutdown after the 2010 data taking.4A Trigger Sector is the small detector zone which is the basic unit where L0MU operates. In the case of M1 it
directly contains the logical pads. In most of the detector it contains horizontal and vertical strips and the fired logicalpads are identified by crossing the x and y strips.
– 6 –

2013 JINST 8 P02022
Figure 3. Illumination map of the five detector stations in a typical 2010 physics run. The log color scalesgive the average number of hits per cm2 per trigger for all the 55296 logical pads. Faulty channels giving nohits and a few noisy spots can be noticed.
inefficient. This resulted in a negligible trigger efficiency loss at the Pt threshold, while this deadzone would have otherwise generated an overall inefficiency of the order of 3% in the stand alonetrigger tracking.
The noise in the detector should be below 1 kHz per physical channel in order to have a neg-ligible rate (below 1 Hz) of fake muon triggers [15]. Even lower rates are desirable to suppressthe noise contribution to muon misidentification in the offline reconstruction. The level of detectornoise was checked regularly with dedicated runs of random triggers in absence of beam and thenoise rate per physical channel was computed for each detector region from the multiplicity offiring logical channels or logical pads. The fraction of channels having a noise rate larger than 10kHz is typically lower than 0.1%. Such values are well below the noise level causing a measurablerate of accidental triggers.
– 7 –

2013 JINST 8 P02022
5 Data samples and track reconstruction
In order to test the muon detector response in the wide range of conditions experienced during2010, an appropriate set of sample runs over the full period was chosen and analysed.
For time calibration and time performance study, some special runs were taken:
• events for time alignment (TAE) were recorded in a larger time gate of 125 ns, instead of thestandard 25 ns, around the triggered bunch crossing.
For the measurement of particle rates, cluster size and time resolution, events triggered bysome minimum bias condition, independently of the muon detector response, were used:
• minimum bias trigger (L0MB), requiring the total energy released in the HCAL to be morethan 320 MeV;
• “microbias” single track trigger (microbias), requiring some hits compatible with a track inthe VELO or first tracking stations.
For spatial alignment studies (section 9) and detector efficiency measurements (section 10),when the statistics of muon tracks in the minimum bias samples was not adequate, events collectedwith standard physics triggers were used. The samples chosen and the procedures adopted to avoidthe bias introduced by the trigger will be described there.
Monte Carlo simulation was used to compare the observed detector performance with the ex-pectation, and to verify the analysis procedures. Standard samples of LHCb Monte Carlo eventssimulating minimum bias pp interactions and production of prompt J/ψ decaying to µ+µ− wereused. Other special samples used for particular needs will be described on the next sections. Theevents were generated using PYTHIA 6.4 [16] to describe the pp collisions and GEANT4 [17] forthe LHCb detector simulation.
Regarding track reconstruction, in the present analysis, standalone muon tracks (M-tracks) arereconstructed with an algorithm similar to the one used in the muon high level trigger [18]. Tracksare reconstructed starting from the firing logical pads. If adjacent fired pads are found, they areclusterized, both in x and y, to obtain track hits. Clusters are allowed to extend across adjacentchambers even belonging to different regions. The x and y of the cluster barycenter and the z of thestation midplane are assumed as the track hit coordinates. Hits aligned with the average position ofthe pp collision point are selected by a combinatorial algorithm. Track hits are fitted to a straightline and quality cuts are applied depending on the measured quantities. M-tracks are usually re-constructed using the information of all the stations unless required by the specific analysis.
M-tracks are required to match with one track reconstructed in the tracking detectors (T-track)only when this is needed to reduce background or to have a good muon momentum measurement.The matching is performed on the basis of the comparison, in one or more muon stations, of the M-track hit coordinates with the T-track extrapolations at the corresponding z positions. The compati-bility of the M-track and T-track slopes is also required. This procedure is similar to the one used inHLT and offline. In all cases the muon momentum is measured from the matched T-track, forgettingthe poor resolution momentum that could be extracted from the M-track as in the L0MU trigger.
– 8 –

2013 JINST 8 P02022
6 Rates
The rate capability was one of the key request for the choice of the technology and the design of themuon detector. Detailed simulations were developed [19] to evaluate the particle rates and radiationdoses expected for the nominal LHCb operations at an energy of
√s = 14 TeV and a luminosity
of 2× 1032 s−1 cm−2. With respect to the radiation hardness, the detector was designed to stand,for the 10 years of planned LHCb operation, rates larger than a factor 3 in stations M2–M5 and afactor 2 in station M1 as compared with these simulations. The main reasons for the large safetyfactors were the uncertainies on the track multiplicity in pp collisions predicted by PYTHIA [16],and the uncertainties on the simulation of low energy particles from showers around the beam pipeand particle backscattering from the material surrounding the detector.
From 2010 data we measured the actual rates at√
s = 7 TeV for a wide range of luminositiesand compared them with expectations [14]. From the number of hits seen by triggered events wecan extract the average number of hits per visible interaction and evaluate the contribution due tothe current interactions and the one not due to the triggered collision. The first contribution is bydefinition independent of luminosity. The second one is expected to be dependent on the beam op-eration conditions. It can be due to beam background, residual detector noise or, more importantly,to late hits originating from collisions in previous bunches (spillover). Particle back scatteringfrom the cavern or from heavy objects surrounding the beam pipe is expected to give a significantcontribution to spillover. Also detector effects like late cross-talk or afterpulses can contribute.
Let’s consider the firing logical pads, also called hits in this study, no matter if they clusterizeor not. Given an unbiased trigger T , the number of hits per unit surface and per triggered event
rT = dNh/dSdNT (6.1)
was computed for each chamber, and the average number of hits in each detector region was cal-culated after removing the few chambers with channels affected by some pathology.
The microbias trigger provided the least biased trigger suitable for the measurement. For eachsample, the average number µ of interactions visible in the LHCb detector per beam crossing wasevaluated from the fraction f0 of beam crossing events not producing a trigger
f0 = P(0; µ) = e−µ (6.2)
where P is the Poisson distribution. The pile-up factor, i.e. the average number of interactions intriggered events, is
p =µ
1− f0(6.3)
and the rate of microbias triggered events at a luminosity L is
dNmicrobias
dt= σ ×L
p(6.4)
where σ is the cross-section evaluated to be 65 mb with 10% uncertainty, from the first luminos-ity studies. Starting from the measured values of the number of firing pads per triggered event(equation (6.1) for microbias triggers), the hit rates for each sample are extrapolated to the nominalluminosity of 2×1032 Hz/cm2, obtaining the normalized rates
R = rmicrobias×dNmicrobias
dt×Lnominal
L(6.5)
– 9 –

2013 JINST 8 P02022
Figure 4. Normalized rates R, extrapolated to the nominal luminosity (equation (6.5)), in the 20 muondetector regions, for the 2010 sample runs acquired in different beam operation conditions. The rates referto the in-time hits (within the trigger 25 ns gate).
Figure 5. Comparison of the normalized rates R (6.5) seen in the 20 muon detector regions for a highluminosity run, with the MC data produced in the 2010 configuration at
√s = 7 TeV. The rates refer to the
in-time hits (within the trigger 25 ns gate).
The result is shown in figure 4.A satisfactory scaling of the rates is verified across five order of magnitudes in luminosity, indi-
cating that contributions not due to the triggered collisions are small with the only important excep-tion of the outer regions of the last station M5 where a significant effect from back scattering is ex-pected due to the limited shielding behind the detector. The contribution of back scattering dependson the beam conditions (µ and bunch spacing) and will be further discussed later in this section.
– 10 –

2013 JINST 8 P02022
Figure 6. Time distribution of the M5R2 hits for L0MB events acquired in TAE mode. The red verticallines separate the consecutive 25 ns gates assigned with progressive BXID numbers. The structures at thegate boundaries are due to a known feature of the TDC giving an incorrect fine time measurement at thegate edges.
In figure 5 the values of the normalized rates R, measured in each region for a high luminosityrun are compared with the Monte Carlo data sample produced in the 2010 configuration at
√s =
7 TeV. It must be however taken into account that spillover was not simulated in this sample. TheMonte Carlo reproduces the rates of the large outer regions R4 for M2, M3, M4 stations while alower rate predicted for the outer region of M5 can be attributed to the missing spillover simula-tion (see later for a further discussion). On the contrary the Monte Carlo rates for M1 and all theinner regions are lower by up to a factor 2. This indicates that the track multiplicity predicted byPYTHIA [16], and the contribution of low energy particles from showers around the beam pipewere underestimated in the simulation. The highest rates measured are however within the safetyfactor assumed in the detector design phase.
The spillover contribution was estimated from TAE data by using the bunch crossing identi-fication number (BXID) and the fine time information of the 4-bit TDC in the ODE boards. TheL0MB events were used, since the microbias triggers were not available in the TAE mode. Atypical time distribution showing spillover is reported in figure 6.
The space distribution of any-time signals (125 ns gate) normalized to the in-time (within thestandard 25 ns gate) signal distribution, is shown in figure 7. The plots show excess of late hits,clearly not related to the amount of the in-time ones, notably in the up and down edges of the moredownstream stations. The effect is impressive in the last station M5 where the too small iron wallbehind the detector (see figure 1) provides insufficient shielding from backscattered particles. It isworth to note that the effect of late hits is enhanced in regions where the rate of in-time hits is smalland is suppressed where the in-time particle flux is large. This effect is visible for instance in theleft and right edges of M5, not fully shielded from in-time particles by calorimeters and upstreammuon stations.
In the M5R4 region the total rate of hits in TAE events increases by a factor 10 with respectto the in-time hit rate (from 1.5 to 15 Hz/cm2). The increase for the other regions can be seen in
– 11 –

2013 JINST 8 P02022
Figure 7. Space distribution of the ratio between the hit rates measured in 125 ns and 25 ns. The contributionof late hits from backscattering is evident in the outer regions, notably for station M5.
figure 8. The large effect measured for the downstream stations is essentially due to late backscat-tered particles. The smaller increase seen for station M1, instead, is mostly due to late cross-talksignals from in-time particles.5 The overall spillover effect is somewhat large in terms of relativerate increase, but not worrying in terms of absolute occupancy level. It must be added that spilloverhits, being mostly seen in the 25 ns following the bunch crossing, do not affect significantly themeasured rates when beams are operated with 50 ns bunch crossing spacing.
Finally, a check for possible sources of particles outside collision events was performed com-paring the rates measured in events randomly triggered by the machine 40 MHz clock, in time orout of time with passing beams. In figure 9 the number of hits per unit surface (equation (6.1))measured in a run with 150 ns spaced bunch trains, is reported. Events triggered in coincidencewith beam-beam collisions (bb) are compared with empty-beam (eb) and empty-empty (ee) events.
5This will be clarified in section 7 where the time behaviour of cross-talk is studied. The effect of rate increase dueto late cross-talk hits meaured for clusters associated to a track is reported in figure 8.
– 12 –

2013 JINST 8 P02022
Figure 8. Dots in red: ratio of the hit rate in 125 ns time window to the hit rate in 25 ns; the out of scale valuefor M5R4 is about 10. Continuous line in blue: ratio of total cluster size to in-time cluster size for track hits.
Figure 9. Comparison of the average number of hits per cm2 (equation (6.1)) measured in a colliding beamsrun for random triggers in coincidence with beam-beam collisions (bb), non-colliding bunches (eb) and nobeams (ee) - see text for details.
The hit rate seen in empty-beam events, triggered in coincidence with the passage of non-collidingbunches, is due to beam-gas interactions and receives little contribution from beam-beam collisionsthat are at least 150 ns away. The hit rate of empty-empty events, triggered out of time with passingbeams, is instead dominated by the delayed hits from collisions occurring 25 or 50 ns before thetriggered clock. Except for the low-rate external regions of M5, rates outside collisions are lessthan 10% of the collision rates. The hit rate measured far from LHC bunch trains is compatiblewith the residual detector noise.
7 Cluster size
The average cluster size of muon track hits is an essential parameter of the detector response, sinceit monitors the correct operation conditions of the chambers and affects the muon trigger perfor-mance. In section 5 it has been described how the firing logical pads are clusterized and the trackhits defined. The cluster size can be measured in terms of the average number of firing adjacent
– 13 –

2013 JINST 8 P02022
Figure 10. Average cluster size along x in a low luminosity run for each detector region. Events are triggeredby microbias or L0MB triggers. Cluster selections are described in the text.
pads. A cross-talk between adjacent pads due to charge signal induction and to some capacitivecoupling is expected. The cluster size values for standard operating conditions were in the pastmeasured on test benches, for particles impinging perpendicularly to the chamber plane, and usedto feed Monte Carlo simulations.
The average cluster size in the y coordinate is near to 1, while in x, due to the finer segmentationof chambers in the bending coordinate, is significantly larger than 1. The cluster size along x, andits dependence on the detector geometry of each region, was studied.
It is worth to note that the average cluster size of muon track hits is smaller than the one forall the hits in the detector, as can be seen in figure 10. This effect is large in regions where mostof the radiation is due to low energy particles. If clusters associated to a track are also requiredto be isolated,6 the cluster size is further reduced demonstrating an effect of hit coalescence. Thiseffect is run dependent, being correlated with event pile-up. The isolation cut reduces the effectof pile-up though not fully suppressing it [14]. For this reason a run with a small µ value must beused to make a comparison with the cluster size measured on test benches.
The purely geometrical effect due to the muon trajectory inside chambers was measured byplotting the average x cluster size as a function of the angle between the track projection on thebending plane and the perpendicular to the chamber plane. A correction for this effect was per-formed by extrapolating to 0 angle, as shown in figure 11. The resulting average cluster sizes are re-ported in figure 12 and compared with the values obtained in the simulation. The relative behaviourin the different regions is quite well reproduced and the cluster size in the real data is in severalcases smaller, indicating a better tuning of the chamber working conditions since the time of the testbenches. The cluster sizes never exceed 1.35, a value well within the L0 trigger requirements [15].
The time behaviour of cross-talk hits was studied using TAE data. While the time distributionof the first pad in time in a cluster is almost fully contained in a 25 ns time window, so ensuring ahigh trigger efficiency, the other pads in the cluster can arrive significantly later as it is shown in
6The isolation condition requires non-adjacent firing pads in the non-bending direction (y cluster size =1) and noother firing channels in the same station within 7 logical pads in x and 2 in y.
– 14 –

2013 JINST 8 P02022
Figure 11. Average x cluster size for isolated track hits as a function of the track angle (in rad) for M2R1(smallest logical pad region) and M5R4 (largest logical pad region). A linear fit is used to evaluate the clustersize for perpendicularly impinging tracks.
Figure 12. Average x cluster size at 0 angle in experimental data and simulation (MC 2010). To suppressthe effect of pile-up, only isolated clusters and low-luminosity data are used.
figure 13. As a consequence, the cluster size (as the hit rate) measured in a 125 ns time windowis larger with respect to the one measured in the 25 ns window. The importance of the effect isregion dependent and is quantified in figure 8 for clusters associated to muon tracks. The latecross-talk signals are not normally acquired and thus do not affect the trigger performance, thoughcontributing to background for future beam operations with 25 ns bunch spacing.
8 Timing
The L0MU trigger requires muon hits to be recorded in each of the five stations within the 25 nsLHC gate associated to a beam-beam crossing. This timing constraint is the most stringent require-ment for achieving the design 95% muon detection efficiency. In fact the tails in the chamber time
– 15 –

2013 JINST 8 P02022
Figure 13. Time delay distribution of pads in track clusters with respect to the first pad in time: (a) for thesmall cathod pad region M1R1; (b) for the large anode pad region M5R4.
response are expected to be one of the main sources of detector inefficiency. To reach the goal, thedetectors were conceived to have a time resolution better than 4 ns at their nominal settings, whilethe 122k readout channels have to be time-aligned at the 1 ns r.m.s. level.
The time alignment of the detector has been achieved in several steps. Test signals produced bya custom pulser system [11] were used for a first timing. Cosmic data collected in 2009 allowed torefine the channel equalization using physical signals. These two steps are described in detail in [3]and [20]. After the calibration with cosmic data, a satisfactory time resolution was already reachedfor all regions except the most inner ones where the statistics was a limit. The precise timingof the first beam particles allowed to quickly intercalibrate the channels of the highly illuminatedinner regions. For the other regions, only a few channels exhibiting an anomalous shift in the timeresponse, due to some hardware interventions, were identified and fixed.
The detector efficiency could then be optimized by a fine tuning of the channels time offsetwith respect to the 40 MHz LHCb clock. The single channel time distribution exhibits an asymmet-ric shape, with a longer tail for late times. This is due to the intrinsic chamber response (dependenton drift time and time walk with pulse height), to the effect of delayed cross-talk hits and to theeffect of the longer path of low momentum tracks. This implies that, in order to minimize the frac-tion of signals falling outside the 25 ns gate, the average time should not be centered on the middleof the DAQ gate, but slightly before. The optimal offset is region dependent as is the shape of thetime spectrum. Moreover, small shifts among regions were already introduced by the optimizationof the HV and threshold settings
The offset optimization was then independently performed for each detector region. Specialruns were acquired with L0MB triggered events in TAE mode, varying the global time offset insteps of 1 ns. For each data sample, standalone muon tracks were reconstructed requiring hits inall five stations. The optimal offset was chosen by maximizing the timing efficiency, defined as theprobability that at least one of the track hits in a given station is found within the central 25 ns gate.
8.1 Time performance
The detector time performance for each detector region was estimated [14] by analysing two TAEevent samples:
– 16 –

2013 JINST 8 P02022
Figure 14. Time distribution of the most time centered hit, measured in M5R2 for L0MB events acquired inTAE mode, reported in linear (left) and logarithmic (right) scale. The vertical lines at ± 12.5 ns delimit the“efficient” hits assigned with the BXID number of the trigger. The result of a gaussian fit performed aroundthe maximum of the distribution to evaluate the core time resolution is also shown.
• the first sample was acquired at the beginning of the physics data taking (before applying thefinal intercalibration for region M1R1) with events triggered by L0MB;
• the second sample was acquired at the very end of physics data taking. At that time the L0MBtriggers were downscaled by a factor 100 and the need of an adequate statistics required theuse of the physics L0 triggers based on calorimeters (electron, photon, hadron triggers).
TAE events were fully reconstructed so that M-tracks could be required to have a good matchingwith a T-track having a momentum larger than 8 GeV/c to ensure muons to reach the M5 station.Ttracks were required to cross the muon detector at a safety distance from the inner and outer edgesto avoid border effects. Clusters inside the few chambers with pathologic behaviour mentioned insection 4, were not considered for the timing efficiency calculation.
The time resolution and, most importantly, the timing efficiency is evaluated from the distri-butions obtained with the BXID and the 4-bit TDC mesurement for the most time centered hit inthe track clusters. If such hit is not assigned with the correct BXID , even if the detector is firing,we have an inefficiency due to the timing. As an example, the distribution obtained with the secondTAE sample for the M5R2 region is reported in figure 14. From these distributions, the core timeresolution was also evaluated from a gaussian fit in the interval (-6, +4) ns around the maximumand its error estimated by shifting the fit interval by ± 2ns.
The average timing efficiency of the five stations and each of the 20 regions, obtained for theTAE sample acquired at the end of data taking, is reported in table 1.
It can be noted that efficiency values in M1 are lower than in the other stations. This is ex-pected considering that M1 is equipped with bi-gap instead of quadri-gap MWPCs and the GEMdetectors in the inner region M1R1 have an intrinsic poorer time resolution. Also in the highgranularity regions M2/3 R1/2 larger inefficiencies can be expected due to the presence of doublereadout chambers where the logical “and” of two signals is required. Nevertheless the probabilityfor a muon track reconstructed in TAE events to have hits “in time” in all the 5 stations (over-all timing efficiency) is measured to be 98.83 ± 0.09%, a value well beyond requirements. The
– 17 –

2013 JINST 8 P02022
Table 1. Average timing efficiency, in percent, for the five stations and for each region, obtained from theTAE sample acquired at the end of data taking. Statistical errors have been evaluated with an approximatedbinomial 68% confidence interval.
Station R1 R2 R3 R4 Station efficiency
M1 98.42 +0.19−0.39 99.50 +0.05
−0.10 99.78 +0.03−0.10 99.77 +0.03
−0.26 99.51 +0.04−0.06
M2 99.56 +0.06−0.35 99.72 +0.04
−0.09 99.91 +0.01−0.07 99.89 +0.02
−0.21 99.80 +0.02−0.04
M3 99.48 +0.07−0.41 99.72 +0.04
−0.09 99.91 +0.01−0.06 100.00 +0.00
−0.17 99.83 +0.02−0.04
M4 99.80 +0.04−0.40 99.96 +0.01
−0.06 99.88 +0.02−0.07 99.95 +0.02
−0.18 99.92 +0.01−0.03
M5 99.67 +0.05−0.47 99.67 +0.04
−0.10 99.84 +0.02−0.07 99.86 +0.02
−0.20 99.77 +0.03−0.05
measured values exhibit a sensitivity to the quality cuts suggesting that the efficiency could besystematically underestimated, by a few per mill, in the regions most affected by combinatorialbackground, namely region R1 and stations M1 and M5. On the other hand, the statistics of theavailable data samples does not allow to tighten the cuts, further improving the muon track samplepurity. This is particularly evident for the crowded regions R1 where the statistics of tracks in TAEevents, essentially containing low momentum muons from π decays, is limited. Moreover a furtherreduction of the sample is due to a fiducial volume cut removing tracks near the beam pipe. Thiscut is needed to reduce the probability of reconstructing tracks with accidental background hits thatare characterized by a much wider time distribution.
The core resolutions and the timing efficiencies obtained for the two TAE samples are com-pared in figure 15. Despite the different triggers used in the two samples, resulting in a differentmomentum spectrum and space distribution of the tracks, the results were found to be in very goodagreement, the hint of difference for region M1R1 can be attributed to a more accurate time cal-ibration used for the second sample. This result demonstrates the excellent stability of the muonsystem along the 2010 run.
8.2 Stability of the time response
The stability of the absolute time scale in the long term is expected to be limited by two effects:
• the LHCb clock drifts with temperature; variations were compensated manually during therun in order to be stable within ± 0.5 ns;
• the variations of temperature and atmospheric pressure affect the chamber gain and varia-tions of signal pulse height produce time walk effects. The largest effect is expected frompressure variations, and is estimated to be equivalent to a ∼ ± 20 V change in HV [21],corresponding to ∼± 0.4 ns.
The average time of track hits, measured in the sample runs acquired across the 2010, is shown infigure 16 for various detector regions as a function of the data taking time. The behaviour is con-sistent with the mentioned effects. Variations are at the level of ± 1 ns and are clearly correlated
– 18 –

2013 JINST 8 P02022
Figure 15. Core time resolution (upper plot) and timing efficiency (lower plot) measured for each region inthe two TAE samples acquired before and after the bulk of 2010 LHCb physics data.
Figure 16. Average time of the most time-centered track hit for different stations and regions, measuredin the sample runs as a function of their data-taking time. The values for optimal efficiency depend on thedetector region and have been fixed at the start of data taking. Variations along the 7 months of operation donot exceed the ± 1 ns range.
among regions. Residual uncorrelated variations are compatible with zero. There is no evidencefor a dependence of the time drift on the detector illumination, that could be a hint for an ageingeffect on the chamber gain.
– 19 –

2013 JINST 8 P02022
9 Spatial alignment
The spatial alignment of the muon detector must guarantee the design performance of trigger andoffline muon identification. As explained in section 2, the L0MU trigger requires hits in all the5 stations aligned on a muon track-segment having a pT above a given threshold. Offline muonidentification is more flexible in the reconstruction of the muon track-segment but requires thematching with a track reconstructed in the tracking system through the whole spectrometer.
The alignment accuracy needed in the system is driven by the trigger requirements in the sta-tions M1, M2 and M3. For these three stations the FOI of the hit search window in the non-bendingvertical coordinate, is defined by 1 pad only. As a consequence, a relative y misalignment betweenthe stations would directly contribute to trigger inefficiency (∼2% for 1mm misalignment). In thebending coordinate x, the FOIs are composed of several pads and the main effect of a misalignmentis a bias in the pT calculation, at the percent level for 1mm misalignment. However the bias can beremoved if the trigger algorithms are suitably corrected using the true x positions. The alignment ofstations M4 and M5 is less important because in their case the y FOI is as large as 3 pads and theirhits are not used to calculate pT . The detector mechanics was designed with the aim of reaching aprecision of the order of 1 mm in x and y directions. The alignment requirements along z are muchless demanding due to the forward geometry of the experiment.
During the installation, the supporting walls were kept in the open position and the muonchambers mounted with an accuracy of∼1 mm along x and y coordinates, centred on their nominalpositions, relative to reference targets placed on top of each half station. The measured rotationswere zero within the precision of 1 mrad. After chamber installation, the half stations were closedaround the beam pipe leaving a small safety distance between the A and C side; the two half stationsbeing ideally positioned left-right symmetric and projective to the interaction point. The closedstations were then surveyed with respect to the LHCb cavern using four reference targets on eachside, and the values stored in the geometry database used by the offline reconstruction program todefine the absolute hit coordinates. The values measured by the survey for the 2010 collision run arereported in figure 17. They show non negligible though small misalignments from the ideal positionfor the M1C half station. The misalignments of the other stations are negligible or unimportant.
9.1 Space alignment measured with muon tracks
A study of the muon system alignment was performed using muon tracks with the first purpose ofchecking the mechanical positioning and the survey measurements. In the same time a tool wasprepared for alignment monitoring after each intervention requiring the opening of the stations, andeventually for correcting the geometry data base.
In this analysis M-tracks are defined by at least four clusters in four different stations thatare compatible with a straight line. Candidates with too large clusters (number of pads>6) areeliminated to avoid mis-reconstruction problems. Moreover stations with more than 300 hitsare excluded. The M-tracks are required to match a good quality T-track having a momentump >6 GeV/c. The matching condition requires a good χ2 between the parameters of M-track andT-track extrapolated to the M2 position. Matching segments are then merged together in a uniquetrack that is required to have a good χ2.
– 20 –

2013 JINST 8 P02022
Figure 17. Alignments of the ten muon half stations for the 2010 run. The average value x of the inneredges (left) and the median y (right), are shown as a function of the station z position. The empty dotsrepresent the survey measurements whose errors are negligible. The full dots are the positions found by thesoftware global alignment described in section 9.1; the error bars correspond to the statistical and systematicuncertainties, summed in quadrature. The dashed lines in the left plot represent the ideal alignment.
Table 2. Misalignments of muon half stations M1–M5, relative to the survey measurements, calculated inthe LHCb reference system with the Kalman fit iterative method. The quoted uncertainties are the fit errors(first) and the systematic uncertainties (second) on the relative positions determined repeating the analysiswith different track selections.
C-side A-side∆x (mm) ∆y (mm) ∆x (mm) ∆y (mm)
M1 0.92±0.14±0.15 0.11±0.28±0.24 1.04±0.14±0.24 0.68±0.27±0.20M2 –1.56±0.05±0.04 –0.89±0.12±0.13 –0.42±0.05±0.07 0.76±0.12±0.17M3 –2.41±0.08±0.05 –1.53±0.14±0.14 –1.19±0.08±0.06 0.45±0.14±0.08M4 –0.33±0.15±0.11 –1.59±0.17±0.09 –1.44±0.14±0.20 0.28±0.17±0.15M5 –2.14±0.18±0.12 0.18±0.20±0.11 –0.07±0.18±0.20 0.16±0.20±0.15
The alignment is performed following the standard procedure used in LHCb [22]. It makesuse of the Kalman fit iterative method, that performs a minimization of the total χ2 of an ensembleof tracks while adjusting the detector positions. Only the positions of the muon half stations wereallowed to vary since the tracking detectors were previously independently aligned using the sameprocedure. The iterative process starts assuming the muon detector in the positions measured bythe survey and stops when the convergence is reached (total χ2 doesn’t improve significantly) usu-ally after 4-5 iterations. In table 2 are reported the misalignments relative to the survey, measuredon a sample of ∼ 7000 tracks, with an analysis performed fitting only the translational degrees offreedom along x and y of each half station. The absolute positions in the LHCb reference systemare shown in figure 17 together with the survey measurements.
– 21 –

2013 JINST 8 P02022
The systematic errors have been estimated repeating the analysis with samples of tracks hav-ing different momenta, comparing subsamples of tracks hitting different detector regions, and usingslightly different alignments for the tracking system. While the absolute positions of the stationsshow variations of the order of 1 mm both in x and y, their relative positions are more stable. Theresults obtained with the Kalman fit iterative method show significant, even though small, mis-alignments relative to the survey measurements (in particular for side C). The geometry data basewas consequently updated. Studies on the additional degrees of freedom like rotations around yor x directions give results compatible with the survey. Due to the forward geometry of the exper-imental apparatus, shifts in z direction are as difficult to measure as unimportant, therefore the zvalues measured by the survey were assumed.
10 Detector efficiency
The overall performance of the muon detector is quantified by the detection efficiency of muontracks when the system is operated in the standard data taking conditions. The inefficiency intro-duced by dead channels, or other hardware failures occurred in the 2010 detector operation, hasbeen quantified in section 4. Here the intrinsic efficiency of the system is evaluated after applyingstrict fiducial volume cuts and eliminating the few small zones where known problems are present.An important contribution to inefficiency is expected to come from the time resolution and the timegate of 25 ns. These effects were already studied in section 8.1 and will be further discussed at theend of section 10.4. Other contributions can come from intrinsic chamber inefficiencies, or smallgeometrical losses due to the chamber-wise discrete structure of the muon detector.
The used procedure is described in detail in reference [14] and is here summarized:
• different data sets are used for M1 and M2–M5 stations to select appropriate samples oftrigger unbiased standalone muon tracks. To reach the needed purity of the sample, M-tracks are matched with a good quality, high momentum T-track and required to fulfill tightselection criteria (section 10.1).
• The presence of background hits affects the results and requires different procedures to cor-rectly evaluate the true efficiency for M2–M5 stations and for M1 station where the occu-pancy is much higher (section 10.2).
• The efficiency for each station is estimated by searching clusters around the prediction de-fined by the M-track reconstructed using only the other 4 stations. The search of clustersaround the prediction is repeated increasing the opening window from 1 up to 8 standarddeviations, both in x and y. The value of σ being determined, region by region, by a gaussianfit to the central part of the distribution of the distance between the position predicted by theM-track and all clusters in that region. For M1 the prediction is defined by the T-track asso-ciated to the M-track in order to improve its quality. The values of σ for the twenty regionsare reported in table 3.
If the full procedure is correct, the efficiency measured as a function of the search openingwindow will show a saturation behaviour permitting a reliable estimate of the detector efficiency.
– 22 –

2013 JINST 8 P02022
Table 3. Resolution along x and y of the distance between the muon track and the muon cluster in eachregion of the muon detector. The muon track is reconstructed skipping the station whose resolution must beevaluated.
M1 M2 M3 M4 M5
R1 σx×σy (mm2) 4×10 15×30 10×12 15×16 33×40
R2 σx×σy (mm2) 8×18 25×50 15×24 27×32 50×60
R3 σx×σy (mm2) 16×40 35×70 25×48 48×64 100×110
R4 σx×σy (mm2) 32×80 60×100 40×96 97×128 150×180
Particular care is required in the background subtraction that must be a stable and reliable procedureeven when a search area as large as 16 σx×16 σy is considered.
10.1 Muon samples and track selection
Different data samples are used for M1 and for M2–M5 stations:
• for the efficiency of M2–M5 stations, data acquired in two fills, corresponding to an in-tegrated luminosity of 1.2 nb−1, were used. The first level trigger L0 required a high pT
hadron or lepton detected in the calorimeter or in the muon system; the software trigger HLTrequired the logical “or” of several independent algorithms. To remove the bias introducedby the trigger in the efficiency calculation, events where both L0 and HLT were fired irre-spectively of the muon system information were selected. With this data sample, the majorityof the muons reaching the muon stations and used for the analysis, originate from decays inflight of π’s or K’s.
• For the M1 efficiency measurement, kaons decaying at the end of the tracking system cangenerate a good T-track giving a poor quality M1 prediction, not adequate to the largeoccupancy of the station. To have a sample of true muons, events with a reconstructedJ/ψ → µ+µ− were used. This sample corresponds to almost all data acquired in 2010(∼ 37 pb−1). To remove the L0 bias on the efficiency evaluation, in each µ+µ− pair from aJ/ψ , the muon which fired the L0 trigger was not considered in the analysis. Notice that theuse of the J/ψ sample for the analysis of the M1 station is possible because its informationis not used in HLT and reconstruction, while it would not be possible for stations M2–M5since their information is used to identifie and reconstruct both muons.
A tight selection is required to reach the purity of the M-track sample needed for a precise efficiencymeasurement and different conditions are required for the different stations.
For every station, when its efficiency is being evaluated, the M-track is validated by requiringthe matching with a T-track in the other four stations used for the fit. The matching requires thatthe distance from the T-track extrapolated to the station and the clusters associated to the M-trackis within one standard deviation in both x and y projections. Such standard deviations are estimatedby a gaussian fit to the central peak of the distance distributions.
– 23 –

2013 JINST 8 P02022
A momentum cut of 12 GeV/c (15 GeV/c) is applied to the T-track when M2 (M3, M4, M5)station is analysed. If more than one T-track matches the M-track candidate and at least one ofthem has a momentum below the cut, the candidate is rejected. When evaluating the efficiency ofM2 and M3, where the occupancy is relatively high and the fired hits are identified by crossingvertical and horizontal strips, further cuts on the local hit multiplicity are applied to avoid ghostcombinations. Moreover, when analyzing the efficiency of M3 where the prediction resolution ispoor due to the lower granularity of M4, a cluster size of 1 is required on M2 station. For theanalysis of M1 station, the M-track sample selection starts from the T-track associated to a muoncandidate from the J/ψ and a cut on momentum of 12 GeV/c is applied.
10.2 Background subtraction
The presence of background clusters affects the search results. The necessary background subtrac-tion requires different procedures for M2–M5 and for M1 station where the occupancy is higher.
Assuming a Poissonian nature of the background, the average number of clusters due to thebackground and the efficiency in a given search window can be extracted by a fit to the distributionof the number of clusters found. If this method works, the background estimate in the neighbour-ing of the muon track takes automatically into account any possible correlation between muons andbackground, as in the case of delta rays or punch through in the calorimeter.
For stations M2–M5, a fully satisfactory result is obtained assuming a background with twoPoissonian components; the probability of finding n clusters in the search window being
P(n)=ε ·[
r ·Bn−1
1 · e−B1
(n−1)!+(1−r) ·
Bn−12 · e−B2
(n−1)!
]+(1−ε) ·
[r ·
Bn1 · e−B1
n!+(1−r) ·
Bn2 · e−B2
n!
](10.1)
where ε is the efficiency to be measured, B1 and B2 are the two Poissonian components of thebackground and r their ratio.
As an example, in figure 18 are reported the results of the fit in the case of an opening windowof 8σx and 8σy for the station M3. It is worth to add that a fit with only one Poissonian componentfor the background does not give an equally good representation of the high multiplicity bins, butthe fitted values of the efficiency do not show significant differences.
In the case of the more crowded station M1 where the J/ψ muon sample is used, the clustermultiplicities are not very well fitted assuming a background with two Poissonian components.Thus another fully independent method is also used to evaluate the background and the efficiency.It exploits the φ rotation invariance of the primary interactions and assumes that the backgroundcorrelated with the muon track is negligible. The background is estimated by counting the averagenumber of clusters in the same search window but in the opposite quadrant, with respect to thetrack prediction. The soundness of the method is confirmed by comparing the number of clustersfound in the opposite quadrant with the number of clusters in the track prediction quadrant havingsubtracted one cluster attributed to the muon track, as shown in figure 19.
The true efficiency εt is then estimated by the formula:
εa = εt +(1− εt) ·Pbg (10.2)
where εa is the apparent efficiency calculated as NNclus>0/NPreds, being NNclus>0 the number oftracks where at least one cluster has been found and NPreds the total number of tracks predicted to
– 24 –

2013 JINST 8 P02022
Figure 18. Multiplicity of clusters found in the 8σ search window for the four M3 regions. The thick lineshows the results of the fit with the two components background described in equation (10.1).
Figure 19. The cluster multiplicity in the 8σ search window diminished by 1 (histogram) and the clustermultiplicity in the corresponding window in the opposite quadrant (dots), for J/ψ muons in the four regionsof M1 station.
fall in the search window; Pbg = NNclusOQ>0/NPreds is the probability to find at least one cluster inthe search window in the opposite quadrant (OQ).
– 25 –

2013 JINST 8 P02022
Table 4. M5 Monte Carlo efficiency (%) for Minimum Bias (L0MB) events with and without 6 GeV/cmomentum cut compared to Particle Gun (PG) muons. Statistical errors have been evaluated with an ap-proximated binomial 68% confidence interval.
R1 R2 R3 R4
PG 99.50 +0.14−0.58 99.73 +0.04
−0.16 99.69 +0.03−0.09 99.88 +0.02
−0.05
L0MB 99.58 +0.05−0.10 99.46 +0.04
−0.05 99.14 +0.06−0.08 99.00 +0.16
−0.25
L0MB (p > 6 GeV/c) 99.77 +0.03−0.12 99.63 +0.03
−0.05 99.51 +0.06−0.10 99.80 +0.02
−0.22
The efficiency values obtained with this method do not show any significant difference withthe values obtained with the previous one.
10.3 Check of the procedure with simulation
To evaluate if the whole procedure of track selection, background subtraction and efficiency deter-mination is robust and unbiased, a test has been made using events simulated with a Monte Carlowhere all background components, like spillover hits and detector noise, are described and detectoreffects, such as cross-talk and chamber time jitter, are included.
The efficiency values computed on Monte Carlo events are well in agreement with the sim-ulation parameters assumed and close to the results obtained with real data. However, to test thevalidity of the method, it is not so important to reproduce the absolute values found in data as tocompare the efficiencies measured with Minimum Bias (for M2–M5) and J/ψ (for M1) MonteCarlo events with the ones obtained applying the same procedure to another Monte Carlo sampleof ideal muon tracks, the so-called Particle Gun (PG) muons. These muons are generated as start-ing from the interaction point with a predefined momentum and angular distribution. Since thoseevents are practically background free and do not suffer from fakes in track reconstruction andselection, they allow to cleanly extract the detector efficiency with the present method. Then, inde-pendently of the absolute values found, a satisfactory agreement between the two samples wouldbe an overall check of the correctness of the procedure. The efficiency values were found to agreewithin the errors for the stations M1–M4, while for R3 and R4 regions of the M5 station the effi-ciency extracted from the Minimum Bias is lower than the corresponding PG efficiency as shown intable 4. This difference is explained with a lack of purity of the Minimum Bias track sample: partof the selected tracks are muons produced in the showers inside the calorimeter that are aligned andmatched with the hadron track initiating the shower. These muons have sometimes low momentumand are absorbed between M4 and M5. This effect is region dependent7 and can cause an artificialinefficiency in M5. Removing the muons with momentum below 6 GeV/c, the efficiencies reachvalues in agreement with the PG sample as can be seen in table 4. To take into account such effect,the real data results will be corrected for the ratio between the efficiencies with and without the6 GeV/c cut, as extracted by the Minimum Bias Monte Carlo sample.
7Tracks crossing outer regions have, on average, lower momentum than those crossing inner regions.
– 26 –

2013 JINST 8 P02022
Figure 20. The measured efficiency of M2 station as a function of the number of σ of the search window.The four regions are shown: R1 (red circles), R2 (green squares), R3 (black triangles), R4 (pink crosses). Azoom of the high efficiency region is shown in the insert.
10.4 Measured efficiencies
The behaviour of the efficiency as a function of the number of σ ’s of the opening window has beenanalysed for each region of the muon system. In all cases a correct saturation is observed at 3-4σ
demonstrating the reliability of the method. However the final value taken for the efficiency is theone at 8σ to allow for the presence of non gaussian tails in the prediction point.
Figure 20 shows the behaviour of the efficiency as a function of the number of σ for the fourregions of M2 station.
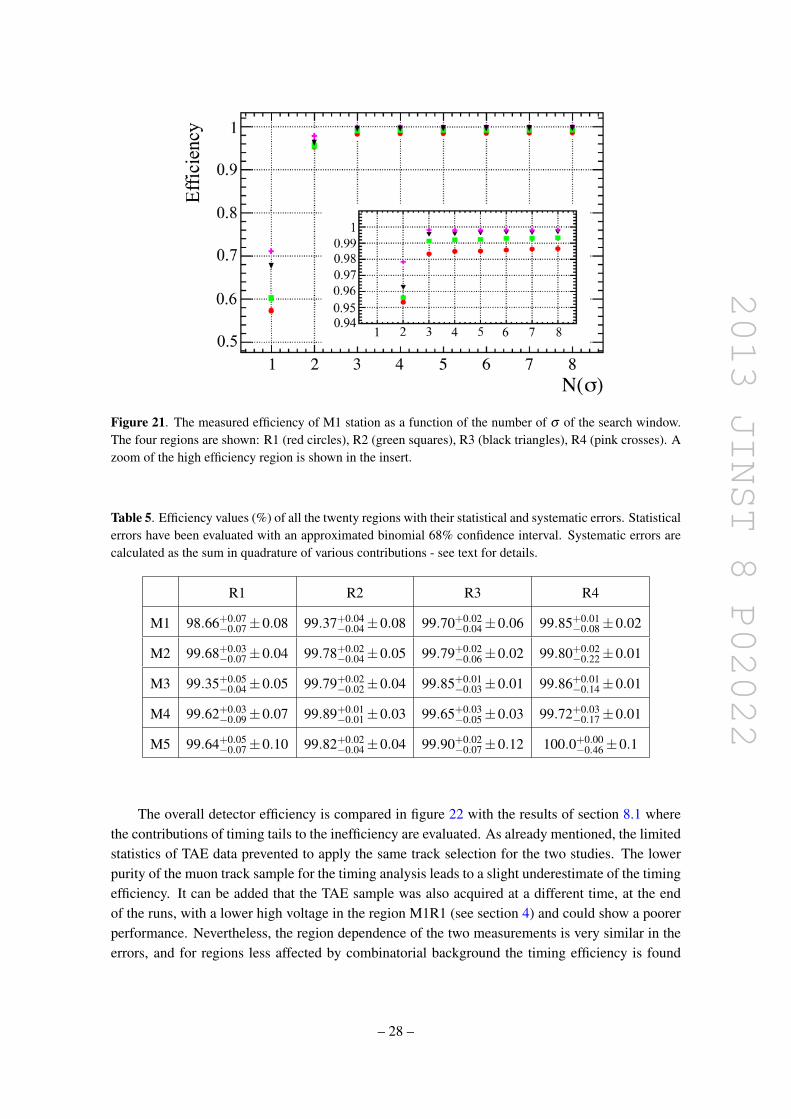
In figure 21 the same quantity is shown for the station M1, with the efficiencies obtained withequation (10.2).
The efficiency for M1 was at the end evaluated as the average of the efficiencies obtained withthe two methods corresponding to equations (10.1) and (10.2), which turn out to be in excellentagreement.
In table 5 the measured efficiencies with the statistical and systematic errors are reported. ForM2–M5 the systematic errors due to background modeling have been estimated by changing the fitfunction from two poissonians to a single one. The efficiency varies less than 0.01% in all regionsof M2–M5. For M1 where two independent methods of estimating the background have been used,a systematic uncertainty of half the difference between the two results has been assumed. Sincethe choice of evaluating the final efficiency at 8σ has a certain degree of arbitrariness, a systematicerror of half the difference between the efficiency value calculated at 4σ and 8σ has been assumed.The uncertainty, due to MC limited statistics, of the correction applied on the M5 efficiency to takeinto account the absorption of muons between M4 and M5, is included in the systematics. Thedifferent sources give comparable systematic uncertainties that have been added in quadrature.
– 27 –
2013 JINST 8 P02022
Figure 21. The measured efficiency of M1 station as a function of the number of σ of the search window.The four regions are shown: R1 (red circles), R2 (green squares), R3 (black triangles), R4 (pink crosses). Azoom of the high efficiency region is shown in the insert.
Table 5. Efficiency values (%) of all the twenty regions with their statistical and systematic errors. Statisticalerrors have been evaluated with an approximated binomial 68% confidence interval. Systematic errors arecalculated as the sum in quadrature of various contributions - see text for details.
R1 R2 R3 R4
M1 98.66+0.07−0.07±0.08 99.37+0.04
−0.04±0.08 99.70+0.02−0.04±0.06 99.85+0.01
−0.08±0.02
M2 99.68+0.03−0.07±0.04 99.78+0.02
−0.04±0.05 99.79+0.02−0.06±0.02 99.80+0.02
−0.22±0.01
M3 99.35+0.05−0.04±0.05 99.79+0.02
−0.02±0.04 99.85+0.01−0.03±0.01 99.86+0.01
−0.14±0.01
M4 99.62+0.03−0.09±0.07 99.89+0.01
−0.01±0.03 99.65+0.03−0.05±0.03 99.72+0.03
−0.17±0.01
M5 99.64+0.05−0.07±0.10 99.82+0.02
−0.04±0.04 99.90+0.02−0.07±0.12 100.0+0.00
−0.46±0.1
The overall detector efficiency is compared in figure 22 with the results of section 8.1 wherethe contributions of timing tails to the inefficiency are evaluated. As already mentioned, the limitedstatistics of TAE data prevented to apply the same track selection for the two studies. The lowerpurity of the muon track sample for the timing analysis leads to a slight underestimate of the timingefficiency. It can be added that the TAE sample was also acquired at a different time, at the endof the runs, with a lower high voltage in the region M1R1 (see section 4) and could show a poorerperformance. Nevertheless, the region dependence of the two measurements is very similar in theerrors, and for regions less affected by combinatorial background the timing efficiency is found
– 28 –

2013 JINST 8 P02022
Figure 22. The results for total efficiency are compared with the estimates of timing efficiency from sec-tion 8.1. Errors are statistical only. For the regions more affected by combinatorial background, a systematicunderestimation of the timing efficiency by a few per mill is present.
to be compatible or only slightly better than the overall efficiency. This indicates that the bulk ofthe detector inefficiency comes from signals falling outside the 25 ns LHC gate and the intrinsicchamber inefficiencies, or the small geometrical losses give minor contributions.
11 Conclusions
The muon detector was successfully operated since the first year of LHC physics. Its performancehas been studied across the five orders of magnitude of luminosity experienced during 2010 andcompared with expectation. The whole system demonstrated an excellent reliability and stability.Detector requirements in terms of cluster size, time resolution and efficiency are fullfilled.
During 2010 a small number of dead channels accounted for an overall inefficiency in themuon detection . 1%. Most of these channels were cured in the LHC shutdown after the 2010data taking. Thanks to a good monitoring system and maintenance work, temporary failures oc-curring during the run, mainly HV trips of single chamber gaps, accounted for per mil effects inthe efficiency. A careful setting of the chamber working point and a precise timing intercalibrationallowed to reach a muon detection efficiency, mainly determined by the chamber time resolution,well above the design requirement of 99% in all the 5 muon stations.
Acknowledgments
We express our gratitude to our colleagues in the CERN accelerator departments for the excellentperformance of the LHC. We thank the technical and administrative staff at the LHCb institutes.
We acknowledge support from CERN and from the National Agencies: CAPES, CNPq,FAPERJ and FINEP (Brazil); NSFC (China); CNRS/IN2P3 and Region Auvergne (France);BMBF, DFG, HGF and MPG (Germany); SFI (Ireland); INFN (Italy); FOM and NWO (TheNetherlands); SCSR (Poland); ANCS/IFA (Romania); MinES, Rosatom, RFBR and NRC “Kur-chatov Institute” (Russia); MinECo, XuntaGal and GENCAT (Spain); SNSF and SER (Switzer-
– 29 –

2013 JINST 8 P02022
land); NAS (Ukraine); STFC (United Kingdom); NSF (U.S.A.). We also acknowledge the supportreceived from the ERC under FP7.
The Tier1 computing centers are supported by IN2P3 (France), KIT and BMBF (Germany),INFN (Italy), NWO and SURF (The Netherlands), CIEMAT, IFAE and UAB (Spain), GridPP(United Kingdom). We are thankful for the computing resources put at our disposal by YandexLLC (Russia), as well as to the communities behind the multiple open source software packagesthat we depend on.
References
[1] LHCb collaboration, The LHCb detector at the LHC, 2008 JINST 3 S08005.
[2] R. Aaij et al., The LHCb trigger and its performance, CERN-LHCb-DP-2012-004, CERN, GenevaSwitzerland (2012) [LHCb-DP-2012-004] [arXiv:1211.3055].
[3] LHCb collaboration, Performance of the LHCb muon system with cosmic rays, 2010 JINST 5 P10003[arXiv:1009.1963].
[4] G. Bencivenni et al., Advances in triple-GEM detector operation for high-rate particle triggering,Nucl. Instrum. Meth. A 513 (2003) 264;LHCb collaboration, LHCb muon system: second addendum to the technical design report,CERN-LHCC-2005-012, CERN, Geneva Switzerland (2005).
[5] E. Aslanides et al., The level-0 muon trigger for the LHCb experiment, Nucl. Instrum. Meth. A 579(2007) 989 [arXiv:0705.0310].
[6] W. Bonivento, P. Jarron, D. Moraes, W. Riegler and F. dos Santos, Development of the CARIOCAfront-end chip for the LHCb muon detector, Nucl. Instrum. Meth. A 491 (2002) 233.
[7] S. Cadeddu, A. Lai and C. Deplano, The DIALOG chip in the front-end electronics of the LHCb muondetector, IEEE Trans. Nucl. Sci. 52 (2005) 2726.
[8] A. Balla et al., The off detector electronics of the LHCb muon detector, IEEE Proc. Nucl. Sci. Symp.(2006) 1296, San Diego U.S.A. (2006).
[9] S. Cadeddu, V. De Leo, C. Deplano and A. Lai, DIALOG and SYNC: a VLSI chip set for timing of theLHCb muon detector, IEEE Trans. Nucl. Sci. 51 (2004) 1961.
[10] G. Haefeli et al., The LHCb DAQ interface board TELL1, Nucl. Instrum. Meth. A 560 (2006) 494.
[11] V. Bocci, G. Chiodi, F. Iacoangeli, F. Messi and R.A. Nobrega, The muon front-end controlelectronics of the LHCb experiment, IEEE Trans. Nucl. Sci. 57 (2010) 3807.
[12] A. Kashchuk and O.V. Levitskaya, From noise to signal — a new approach to LHCb muonoptimization, CERN-LHCb-PUB-2009-018, CERN, Geneva Switzerland (2010).
[13] A. Kashchuk, R. Nobrega and A. Sarti, Procedure for determination and setting of thresholdsimplemented in the LHCb muon system, CERN-LHCb-2008-052, CERN, Geneva Switzerland (2008).
[14] G. Graziani, R. Santacesaria and A. Satta, Study of the LHCb muon detector performance using 2010beam data, CERN-LHCb-PUB-2011-027, CERN, Geneva Switzerland (2011).
[15] E. Aslanides et al., Performance of the muon trigger with a realistic simulation,CERN-LHCb-2002-041, CERN, Geneva Switzerland (2002).
[16] T. Sjostrand, S. Mrenna and P.Z. Skands, PYTHIA 6.4 physics and manual, JHEP 05 (2006) 026[hep-ph/0603175].
– 30 –

2013 JINST 8 P02022
[17] GEANT4 collaboration, S. Agostinelli et al., GEANT4: a simulation toolkit, Nucl. Instrum. Meth. A506 (2003) 250.
[18] A. Satta, Muon identification in the LHCb high level trigger, CERN-LHCb-2005-071, CERN,Geneva Switzerland (2005).
[19] G. Martellotti, R. Santacesaria and A. Satta, Particle rates in the LHCb muon detector,CERN-LHCb-2005-075, CERN, Geneva Switzerland (2005).
[20] W. Bonivento et al., Measurement of the time resolution of the installed muon chambers with the 2008cosmic runs, CERN-LHCb-PUB-2009-016, CERN, Geneva Switzerland (2009).
[21] E. Dane, A. Sarti, G. Penso and D. Pinci, Detailed study of the gain of the MWPCs for the LHCbmuon system, Nucl. Instrum. Meth. A 572 (2007) 682.
[22] J. Amoraal, Alignment of the LHCb detector with Kalman filter fitted tracks, LHCb-CONF-2009-026,CERN, Geneva Switzerland (2009) [CERN-LHCb-CONF-2009-026].
– 31 –