Embed Size (px)
Citation preview
1
Performing Configurational Analyses in Management Research: A Fuzzy Set Approach
Competitive paper submitted to the 30th IMP Conference 2014, Bordeaux
Alexander Leischnig, Stephan C. Henneberg, Sabrina C. Thornton
University of Bamberg
Queen Mary, University of London
University of Huddersfield
Abstract
This article introduces fuzzy set qualitative comparative analysis (fsQCA) as an innovative
analytical approach to build causal theories in the area of management studies. Although
fsQCA has received considerable attention in many disciplines, such as social and political
sciences, its application in management research is still in its infancy. We show how fsQCA
as a set-theoretical approach can be used to help improve our understanding of causal
relationships between important aspects of management. This is done by providing a
framework, which outlines the steps taken in a fuzzy set analysis in order to determine causal
conditions, and more importantly configurations of such conditions, and how these contribute
to relevant outcomes. In addition, this article illustrates fsQCA by providing an empirical
example in the area of management studies, particularly sales growth strategy. The present
research contributes to the extant literature by highlighting fsQCA as a novel approach to
analyse complex causality, and by discussing options regarding how this approach can be
used to complement findings from conventional causal data analysis procedures.
Keywords
Causal research, fuzzy set, fsQCA, qualitative comparative analysis, sales growth
2
INTRODUCTION
One of the most predominant and enduring notions emphasized in management research is
that of causality, i.e. cause and effect mechanisms. This causal logic in research is mirrored in
management practice by a focus on ‘drivers’ of certain outcomes. Analyses of causal
relationships (as well as causal ambiguity) represent an important approach used to
understand the linkages between strategic decisions, organizational structures, management
activities, and business performance measures (e.g. King, 2007; Fiss, 2011). Manifold studies
have examined causal relationships between different types of constructs, such as strategy
implementation, customer retention, or firm financial performance (e.g. Bozec et al., 2009;
Calantone et al., 2002). Although these studies have greatly contributed to our understanding
of linear causation (and to a lesser extent of non-linear causation) and the ‘net effects’
between the constructs of interest, little is known about what is called complex causation and
how it can be analysed (Ragin and Fiss, 2008). Complex causation is defined as a situation
“… in which an outcome may follow from several different combinations of causal
conditions” (Ragin, 2008a, pp. 23). Examination of complex causation mirrors managerial
practice, which is usually based on making holistic decisions, which include trade-off
considerations between several organizational aspects. Managerial decisions therefore are
about whole ‘recipes’ and not just about ‘single ingredients’ (Meyer et al., 1993). Complex
causation entails consideration of all theoretically possible configurations of causal
conditions that may influence an outcome in question and represents a major methodological
challenge (Davis et al., 2007; Ragin, 2008a; Wagemann and Schneider, 2010).
Previous studies indicate that the analysis of configurations plays a crucial role in
organization theory and management research (Meyer et al., 1993; Doty and Glick 1994).
Considerable parts of current organization and management research understand firms as
complex systems that comprise interconnected structures and practices (Clegg et al., 1996;
Fiss, 2007; 2011). Such configurational research is based on Gestalt-theory and involves a
holistic approach in which a social entity takes its meaning from the interaction and
interdependencies between its elements as a whole and cannot be understood in isolation
(Short et al., 2008; Hult et al., 2006). However, conventional statistical methods used to test
configuration theories and complex causality are often less proficient at handling such multi-
faceted interdependencies. Configurations represent “nonlinear synergistic effects and high-
order interactions” between a broad set of variables (Delery and Doty, 1996, p. 808).
Frequently employed data analysis methods, such as regression analysis or structural equation
modeling, are based on linear and symmetric relationships between constructs of interest.
These constructs are treated as competing in explaining variance in the outcomes rather than
concentrating on ways in which causal conditions may combine (to form configurations, or
‘recipes’) to contribute to desired outcomes (Greckhamer et al., 2008; Ragin, 2008a). Thus,
the mismatch between management theory (Fiss, 2007) and the limitations of general linear
methods (Greckhamer et al., 2008; Ragin, 2008a) underscore the need to explore further
approaches that complement existing research methods and in turn may help management
researchers analyse complex causation.
The overall purpose of this article is to introduce fuzzy set qualitative comparative analysis
(fsQCA; Ragin 1987, 2000, 2008a) as a relatively novel data analysis approach to examine
complex causality and by doing so improve management researchers’ diagnostic toolkit. The
contributions of this article to the literature are threefold. First, we outline the utility of fuzzy
set approaches and provide a framework of how to run these analyses. Secondly, we provide
the state of the art on management research using fsQCA by reviewing and summarising
existing studies using fsQCA to analyse management issues and phenomena. Thirdly, we
illustrate a fsQCA by performing an empirical analysis within the context of general

3
management, particularly sales growth strategy. More specifically, we run a fsQCA to
explore configurations of different firm orientations, firm characteristics and industry
characteristics and their contributions to achieving sales growth. We then compare these
fsQCA results to a traditional regression analysis and discuss the complementarity of
traditional variable-based and set-theoretic methods.
FUNDAMENTALS AND APPLICATION OF FSQCA
Initially, we briefly discuss the key basics of fsQCA and outline important distinctions
between set-theoretic methods, such as fsQCA, and general linear data analysis approaches,
such as regression analysis and structural equation modeling. Table I summarises key
characteristics of fsQCA and shows major differences between set-theoretic and linear data
analysis methods.
Table I. Differences between set-theoretic and correlational methods
Set-theoretic methods
(e.g. fsQCA)
Correlational methods
(e.g. regression, SEM)
Approach to explanation
Causes-to-effects approach: Explain
cases by identifying configurations of
causal conditions
Effects-to-causes approach: Estimate
average effect of one (or more)
independent constructs over all cases
Concept of
causality
Analysis of complex causation:
Examination of combinations of causal
conditions
Analysis of linear causation:
Examination of net effects of
independent variables on dependent
variables
Basic
assumption
Equifinality:
Several solutions can be equally effective
in achieving a final effect state
Unifinality:
One optimal model best represents the
empirical data and explains the effects
Analytic
approach Boolean algebra Linear arithmetics
Based on Mahoney and Goertz (2006) and complemented by Fiss (2007) and Ragin (2008).
Notes: SEM = structural equation modeling.
One of the major differences between fsQCA and conventional data analysis methods
refers to the approach of explanation. Central to fsQCA is the so-called causes-to-effects
approach (Mahoney and Goertz, 2006), which means that fsQCA describes cases as
combinations of attributes (i.e. configurations of causal conditions) as well as the outcome in
question (Fiss, 2007). For example, firms with superior market performance (outcome in
question) may be characterised by a combination of excellent market knowledge, a clear
management strategy, and effective strategy implementation (configuration of causal
conditions). FsQCA thus focuses on whether or not a case shows specific attributes or
combinations of these attributes and the outcome in question. In contrast, standard linear
methods pursue an effects-to-causes approach (Mahoney and Goertz, 2006), which means
that the primary objective is to estimate the average effect of one (or more) variables in a set
of cases. For instance, a researcher might be interested in exploring the effect of strategy
implementation on firms’ market performance across a sample of cases. Linear methods thus
primarily focus on detecting and analysing the ‘net-effect’ that one (or more) independent
variable has on a dependent variable by estimating one optimal model that fits with the
empirical data.
To do so, variable-oriented standard linear methods require at least medium to large-N
samples. FsQCA as a case-oriented research approach was originally designed for, and is still
4
mostly applied with, small- or medium-N samples. However, prior research indicates that set-
theoretic approaches are well suited to analyse large-N empirical data, as this is often the
situation in management research (Rihoux, 2006; Woodside et al., 2012).
Because fsQCA considers configurations of causal conditions, it represents a valuable
analytic tool to examine situations of complex causality. FsQCA takes into account that
outcomes of interest seldom have a single cause (multi-causality), that causes rarely operate
independent from each other (interdependence), and that a specific cause may have different
(i.e., positive and negative) effects depending on context (asymmetry) (Greckhamer et al.,
2008; Leischnig et al., 2013; Rihoux, 2006). Thus, fsQCA is particularly useful for
examining equifinality (Fiss, 2007, 2011), that is, situations in which “a system can reach the
same final state from different initial conditions and by a variety of different paths” (Katz and
Kahn, 1978, pp. 30). Equifinal solutions are generally understood as alternative pathways to
achieve an outcome of interest, they are referred to as different ‘recipes of success’. They are
treated as logically equivalent and thus substitutable (Ragin, 2008a). Identification of
equifinal solutions for specific issues has evolved as an important area of management
studies (e.g. Marlin et al., 2007; Payne, 2006), because it provides firms with a variety of
optional design choices for a desired outcome, thus fostering the potential for efficiency gains
(Fiss, 2011).
In order to examine which combinations of attributes lead to the outcome in question,
fsQCA, relies on Boolean algebra rather than linear arithmetics. FsQCA builds upon the
premise that relationships among different variables are best understood in terms of set
membership (Fiss, 2007). Conventional methods of QCA, such as crisp sets, define
membership in sets using binary values (1 = membership, and 0 = non-membership), that is, a
specific case either shows or does not show a particular causal condition. With fsQCA,
however, membership in sets is not restricted to binary values of 1 and 0, but may instead be
defined using membership scores ranging from ordinal up to continuous values (Ragin,
2008a). A fuzzy set can be viewed as “a continuous variable that has been purposefully
calibrated to indicate degree of membership in a well-defined and specified set” (Ragin,
2008a, pp. 30). Therefore, fsQCA allows researchers to specify their constructs not only in
kind, but also with regard to the degree to which certain attributes are present (Fiss, 2007). In
order to assess set relationships with fsQCA, both causal conditions as well as the outcome in
question are represented in terms of fuzzy set membership scores. The primary objective is to
explain cases that show desired values for the outcome in question by describing the degree
to which causal conditions or combinations of these conditions are present. Thus, fsQCA
explores how the membership of cases in causal conditions is linked to membership in the
outcome (Ragin, 2008a). These set relationships are interpreted in terms of necessity and/or
sufficiency. A causal condition is defined as necessary if it must be present for an outcome to
occur, and as sufficient if by itself it can produce a certain outcome (Ragin, 1987, 2000,
2008a).
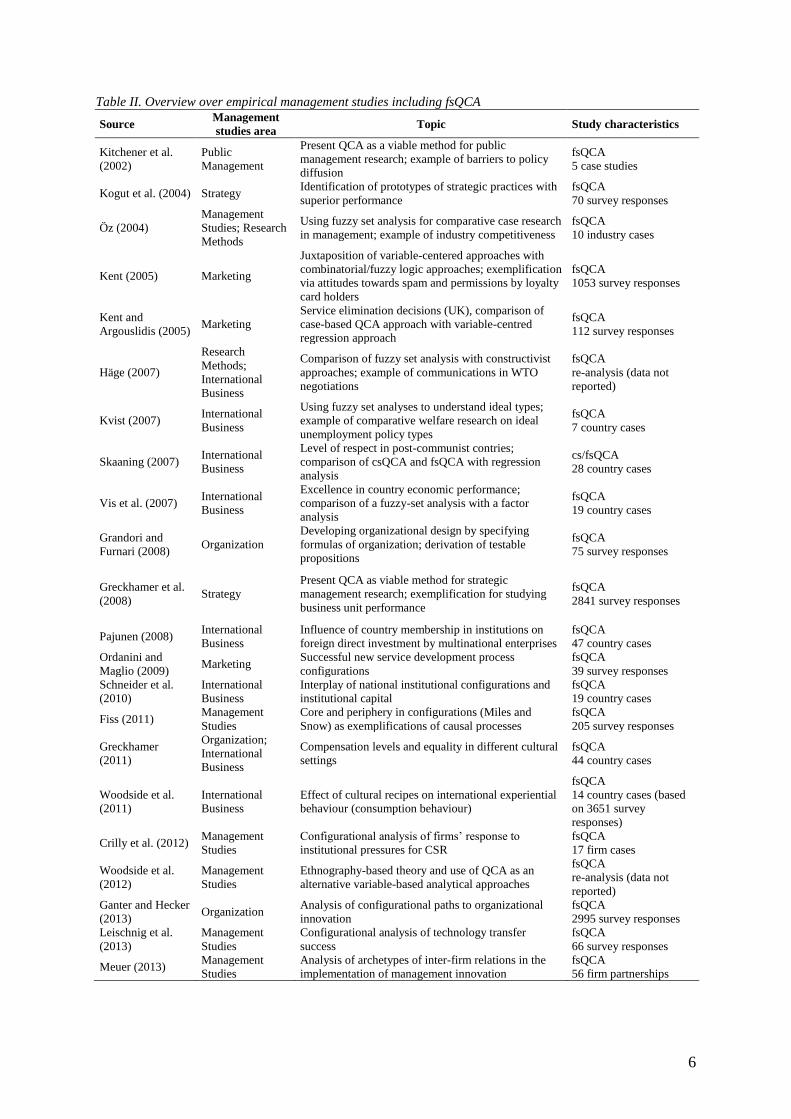
Although fsQCA has been widely employed in other disciplines such as political and social
sciences, its use in the management studies is still in its infancy. Table II provides an
overview of empirical studies published in academic journals using fsQCA since 2000 (i.e.
since the fs/QCA software program has become available). In sum, this review includes 23
studies. The majority of these studies use fsQCA within the setting of Strategy, Organization,
and International Business research. More specifically, the majority of the studies focus on
macro-level analyses that involve examinations of country- and industry-related management
phenomena. Other areas of management studies, such as HRM, production, supply chain
management, or marketing, have not yet embraced this method to the same extent. This is
noteworthy, as there exist communities of research practice that are using multiple case
studies routinely (for which a systematic small-N comparison technique such as fsQCA is

5
useful), for example business relationships and business network studies within the Industrial
Network Approach (INA) (e.g. Abrahamsen et al., 2012). However, as yet only limited cross-
fertilization has happened in these research areas when it comes to set-theoretic analysis
approaches.
In summary, the literature review reveals that although there exist some articles, which
introduce the fsQCA approach to different sub-disciplines of management, such as
organization studies (Fiss, 2011; Greckhamer et al., 2008), or to management studies in
general (Leischnig et al., 2013; Öz, 2004; Woodside et al., 2012), its use is currently
restricted to (only) a few areas of management studies and focused on a limited number of
potential outlets.
6
Table II. Overview over empirical management studies including fsQCA
Source Management
studies area Topic Study characteristics
Kitchener et al.
(2002)
Public
Management
Present QCA as a viable method for public
management research; example of barriers to policy
diffusion
fsQCA
5 case studies
Kogut et al. (2004) Strategy Identification of prototypes of strategic practices with
superior performance
fsQCA
70 survey responses
Öz (2004)
Management
Studies; Research
Methods
Using fuzzy set analysis for comparative case research
in management; example of industry competitiveness
fsQCA
10 industry cases
Kent (2005) Marketing
Juxtaposition of variable-centered approaches with
combinatorial/fuzzy logic approaches; exemplification
via attitudes towards spam and permissions by loyalty
card holders
fsQCA
1053 survey responses
Kent and
Argouslidis (2005) Marketing
Service elimination decisions (UK), comparison of
case-based QCA approach with variable-centred
regression approach
fsQCA
112 survey responses
Häge (2007)
Research
Methods;
International
Business
Comparison of fuzzy set analysis with constructivist
approaches; example of communications in WTO
negotiations
fsQCA
re-analysis (data not
reported)
Kvist (2007) International
Business
Using fuzzy set analyses to understand ideal types;
example of comparative welfare research on ideal
unemployment policy types
fsQCA
7 country cases
Skaaning (2007) International
Business
Level of respect in post-communist contries;
comparison of csQCA and fsQCA with regression
analysis
cs/fsQCA
28 country cases
Vis et al. (2007) International
Business
Excellence in country economic performance;
comparison of a fuzzy-set analysis with a factor
analysis
fsQCA
19 country cases
Grandori and
Furnari (2008) Organization
Developing organizational design by specifying
formulas of organization; derivation of testable
propositions
fsQCA
75 survey responses
Greckhamer et al.
(2008) Strategy
Present QCA as viable method for strategic
management research; exemplification for studying
business unit performance
fsQCA
2841 survey responses
Pajunen (2008) International
Business
Influence of country membership in institutions on
foreign direct investment by multinational enterprises
fsQCA
47 country cases
Ordanini and
Maglio (2009) Marketing
Successful new service development process
configurations
fsQCA
39 survey responses
Schneider et al.
(2010)
International
Business
Interplay of national institutional configurations and
institutional capital
fsQCA
19 country cases
Fiss (2011) Management
Studies
Core and periphery in configurations (Miles and
Snow) as exemplifications of causal processes
fsQCA
205 survey responses
Greckhamer
(2011)
Organization;
International
Business
Compensation levels and equality in different cultural
settings
fsQCA
44 country cases
Woodside et al.
(2011)
International
Business
Effect of cultural recipes on international experiential
behaviour (consumption behaviour)
fsQCA
14 country cases (based
on 3651 survey
responses)
Crilly et al. (2012) Management
Studies
Configurational analysis of firms’ response to
institutional pressures for CSR
fsQCA
17 firm cases
Woodside et al.
(2012)
Management
Studies
Ethnography-based theory and use of QCA as an
alternative variable-based analytical approaches
fsQCA
re-analysis (data not
reported)
Ganter and Hecker
(2013) Organization
Analysis of configurational paths to organizational
innovation
fsQCA
2995 survey responses
Leischnig et al.
(2013)
Management
Studies
Configurational analysis of technology transfer
success
fsQCA
66 survey responses
Meuer (2013) Management
Studies
Analysis of archetypes of inter-firm relations in the
implementation of management innovation
fsQCA
56 firm partnerships
7
FRAMEWORK FOR CONDUCTING FSQCA
Based on the research presented above and recommendations by Ragin (1987, 2000,
2008a), we suggest a multiple-step approach to perform fsQCA. This approach involves five
stages including (1) modeling of causal configurations and potential outcome effects, (2)
calibration of causal conditions and the outcome in question, (3) construction and refinement
of the truth table, (4) analysis of the truth table, and (5) evaluation and interpretation of
results. In the next subsections, we describe each of these steps in more detail.
MODELING OF CAUSAL CONFIGURATIONS AND POTENTIAL OUTCOME EFFECTS
The most pivotal part of a fsQCA is the development of the model, which includes
specification of causal conditions and the outcome in question. As with other causal
approaches, such as structural equation modeling, fsQCA does not prove causality itself; this
is merely posited based on theoretical reasoning as part of the modeling step. FsQCA seeks to
identify the causal conditions underlying an outcome by investigating the attributes of cases
exhibiting that outcome (Greckhamer et al., 2008; Ragin, 2000, 2008a). Note that fsQCA
refers to a single outcome (e.g. ‘superior product innovation compared to industry’); if
several outcomes are relevant, separate fsQCAs need to be performed. Both specifications of
relevant causal conditions as well as selection of cases (i.e. the empirical data) are important
issues in this first stage of a fsQCA (Greckhamer et al., 2008). Theory and previous empirical
research may guide researchers identifying relevant causal conditions and developing
hypotheses about how these causal conditions contribute to the outcome in question. Central
to fsQCA is the analysis of all logically possible combinations of causal conditions, which
can be calculated by the formula 2k
where k denotes the number of causal conditions
considered. As this formula indicates, even a relatively small number of causal conditions
(e.g. 6) may lead to a high number of logically possible combinations (e.g., 26 = 64).
However, empirical observations almost never represent all of these logically possible
configurations. Thus, limited diversity may become a relevant issue (Ragin, 2008b), which
occurs because “the potential variety is limited by the attributes’ tendency to fall into
coherent patterns” (Meyer et al., 1993, p. 1176). To overcome this issue, researchers should
deliberately select, those causal conditions relevant to an outcome in question. The selection
of the causal conditions to be examined should be guided by theory and researchers’
knowledge of the topic as well as by managerial relevance.
CALIBRATION OF CAUSAL CONDITIONS AND THE OUTCOME IN QUESTION
After relevant causal conditions and the outcome in question have been specified, a key
stage of fsQCA is the generation of well-constructed fuzzy sets, which raises the issue of
calibration. Calibration refers to transforming construct measures into fuzzy set membership
scores. In several scientific disciplines, researchers calibrate their measurement instruments
and the readings these instruments generate by adjusting them so that they match or conform
to known standards (Fiss, 2011; Ragin, 2008a). In management studies the external criteria
that are used to calibrate measures and transform them into fuzzy set membership scores may
reflect standards based on substantive, i.e. theoretical and extant empirical knowledge (Ragin,
2008a). This knowledge specifies what constitutes full membership, full non-membership,
and the cross-over point (Ragin, 2000). Full membership (i.e. value 1) and full non-
membership (i.e. value 0) represent qualitative states. The continuum between these two
states reflects varying degrees of membership in a fuzzy set ranging from ‘more out’ (i.e.
values closer to 0) to ‘more in’ (i.e. values closer to 1) (Ragin, 2000, 2008a). The cross-over
point (i.e. value 0.5) reflects the degree of most ambiguity with regard to fuzzy set
membership.
8
To calibrate measures and translate them into fuzzy set membership scores, researchers
may employ an indirect or a direct method (Ragin, 2008a). The indirect method relies on the
researcher’s allocating of cases into groups according to their degree of membership in the
target set (Ragin, 2000). Using the indirect method of calibration, the researcher initially
groups cases with different levels of membership, assigns these different levels of
preliminary membership scores, and then refines these membership scores using the observed
measures (Ragin, 2000). In contrast to the indirect approach, the direct method uses three
qualitative anchors to structure calibration: the threshold for full membership, the threshold
for full non-membership, and the cross-over point (Ragin, 2000). The basic notion underlying
this calibration technique is that it rescales a construct using the cross-over point as an anchor
from which deviation scores are calculated based on the values of full membership and full
non-membership (e.g. Fiss, 2011; Ragin, 2008a). Based on substantive knowledge the
researcher selects the three thresholds and measures are translated into fuzzy set membership
scores using the metrics of log odds. Calibration of measures using the direct method can be
conducted by means of the fs/QCA software program (Ragin et al., 2007), which includes
commands to automatically run this transformation of variables.
CONSTRUCTION AND REFINEMENT OF THE TRUTH TABLE
Once measures of the causal conditions and the outcome in question have been
transformed into fuzzy set membership scores, the so-called truth table needs to be
constructed and prepared for subsequent analysis. The truth table is a data matrix that consists
of 2k rows, where k denotes the number of causal conditions selected. Each row of the truth
table displays a specific combination of causal conditions as well as the number of cases high
on these conditions (i.e. with fuzzy set membership scores greater 0.5). The full truth table
lists all possible combinations of causal conditions with some rows showing many, some only
a few, and some no empirical cases (Fiss, 2011). To perform a fuzzy set analysis, the truth
table needs preliminary refinement based on two criteria: frequency and consistency (Ragin,
2008a). Frequency indicates the extent to which the combinations of causal conditions as
expressed in the rows of the truth table are empirically represented. The definition of a
frequency cut-off ensures that the assessment of the fuzzy subset relations occurs only for
those configurations exceeding a specific minimum number of cases. Low-frequency
configurations are designated as logical remainders since their empirical evidence is
considered not substantial enough. Previous research using fsQCA does not suggest fixed
threshold values for frequency. However, researchers need to take into account the overall
number of cases in the data set. While in small- (e.g. 10 cases) and medium-sized (e.g. 50
cases) samples frequency thresholds of 1 or 2 are appropriate, for large-scale samples (e.g. >
200 cases) frequency cut-offs should be set higher.
Consistency assesses to the degree to which the cases sharing a given causal condition or
combinations of causal conditions agree in exhibiting the outcome in question (Fiss, 2011;
Ragin, 2006). Thus, consistency refers to the extent to which cases correspond to the set
relationships expressed in a solution (Fiss, 2011). Consistency is calculated by dividing the
number of cases sharing a given combination of causal conditions and the outcome from the
number of cases that exhibit the same combination but do not show the outcome. Previous
research recommends that the minimum acceptable consistency level should be set at 0.80
(Ragin, 2008a). Based on the aforementioned conditions, the initial truth table is prepared for
further analysis.
ANALYSIS OF THE TRUTH TABLE AND EXAMINATION OF (COMBINATIONS) OF CAUSAL
CONDITIONS FOR AN OUTCOME TO OCCUR
9
In the fourth step, the truth table is examined. FsQCA investigates complex causal
relationships based on set-subset relationships and using the Quine-McCluskey algorithm
which allows logical reduction of complex configurations of causal conditions into a reduced
number of configurations that lead to the outcome in question (Fiss, 2011; Ragin, 2008a).
The algorithm identifies configurations of conditions that consistently lead to an outcome by
stripping away those causal conditions that are sometimes present and sometimes absent, thus
indicating that these factors are not essential parts of a sufficient configuration for the
outcome in question (Fiss, 2011). As previously mentioned, limited diversity (i.e. a situation
where not all logically possible configurations are represented by empirical manifestations) is
an important issue to consider in fsQCA. To address this issue, the algorithm conducts a
counterfactual analysis of causal conditions (Fiss, 2011; Ragin, 2008a). Counterfactual
analysis takes into account the absent combinations of causal conditions and treats them as
logical remainders. By so doing, it offers a pathway to overcome the issue of limited diversity
and helps researchers deal with deficiency of empirical manifestations (Fiss, 2011). Analysis
of the truth table can be performed with the fs/QCA software program (Ragin et al., 2007),
which includes commands to run the analysis and examine configurations of causal
conditions that contribute to the outcome of interest.
EVALUATION AND INTERPRETATION OF RESULTS
The final step when performing a fsQCA refers to the evaluation and interpretation of the
results. The fsQCA reports three types of solutions: a complex, a parsimonious, and an
intermediate solution. Each of these solutions displays configurations of causal conditions
leading to the outcome in question. However, the three types of solutions differ to the extent
in which logical remainders have been considered in the counterfactual analysis (Ragin,
2008b). The complex solution does not consider any logical remainder. It thus produces the
most complicated result and plays a minor role when it comes to interpretation of findings
(Fiss, 2011). The parsimonious solution considers any logical remainder that will help
generate a logically simpler solution. Therefore, the parsimonious solution produces the most
concise result. Finally, the intermediate solution considers those logical remainders that
represent ‘easy counterfactuals’. The distinction between ‘easy’ and ‘difficult’
counterfactuals is based on information regarding the connection between each causal
condition and the outcome (Ragin, 2008a): While ‘easy’ counterfactuals refer to situations in
which a redundant causal condition is added to a combination of causal conditions that by
themselves already lead to the outcome in question, ‘difficult’ counterfactuals relate to
situations in which a causal condition is eliminated from a configuration leading to the
outcome in question, based upon the premise that this causal condition is redundant (Fiss,
2011). The intermediate solution disregards fewer causal conditions than the parsimonious
solution but more causal conditions than the complex solution. The intermediate solution thus
reports results that represent a compromise between inclusions of no or any logical reminder
in the counterfactual analysis.
To interpret the results from a fsQCA, researchers should focus on both the parsimonious
and the intermediate solutions. Inspection of both solutions may help researchers detect core
and peripheral causal conditions that contribute to the outcome in question. As Fiss (2011, p.
403) points out, “… core conditions are those that are part of both parsimonious and
intermediate solutions, and peripheral conditions are those that are eliminated in the
parsimonious solution and thus only appear in the intermediate solution”. Thus, inspection of
the parsimonious and intermediate solutions allows researchers to draw conclusions regarding
the causal essentiality of specific combinations of causal conditions (Fiss, 2011).
In order to assess the relative importance of configurations of causal conditions for an
outcome, researchers should inspect coverage values. Coverage indicates the percentage of
10
cases that take a given pathway to the outcome in question (Fiss, 2011; Ragin, 2000, 2008a).
The fsQCA reports two coverage scores—the raw coverage and the unique coverage— to
assess the empirical importance of the solutions. Raw coverage refers to the size of the
overlap between the size of the causal combination set and the outcome set relative to the size
of the outcome set; unique coverage controls for overlapping explanations by partitioning the
raw coverage (Ragin 2008). By inspecting the coverage scores for the particular solutions,
researcher can assess the extent to which a solution ‘explains’ the outcome.
EMPIRICAL ILLUSTRATION OF FSQCA
An important objective of this article is to introduce fsQCA by performing an illustrative
analysis. We outline an fsQCA using individual-level data within the setting of general
management and strategy research. By doing so, we not only illustrate the necessary steps to
be taken, but also demonstrate that fsQCA is an appropriate diagnostic tool to examine
micro-level management issues using a large-N empirical basis (Fiss et al., 2013). We will
structure our analysis according to the steps outlined previously.
The first step of a fuzzy set analysis concerns the modeling of causal configurations and
potential outcome effects. In our analysis we explore which combinations of strategic
orientations of the firm (i.e. customer orientation, competitor orientation, and relationship
orientation), firm characteristics (i.e. firm size, and market presence), and industry
characteristics (i.e. industry growth) contribute to sales growth of the focal company. Thus,
this analysis examines not how individual variables drive sales growth but how the interplay
of six causal conditions contributes to the outcome in question. By so doing, we offer insights
into the causal pattern underlying strategic, operational, and environmental factors to
generate sales growth. The selection of the constructs that are presumed to be relevant in the
context of this study was guided by both theory and previous empirical research. First,
organization theory suggests that firm-internal strategic orientations interact with
characteristics of the firms and the environment (Short et al., 2008). Secondly, business
relationship and marketing orientation research suggests that a strategic orientation towards
different stakeholders in the embedded business network represent important antecedents of
sustainable competitive advantage (Achrol and Kotler, 1999). Research on market orientation
has identified customer orientation as well as competitor orientation as pivotal concepts in
this context (Narver et al., 2004; Jaworski and Kohli, 1993; Narver and Slater, 1990).
Customer orientation refers to firms’ tendency to continuously create superior value for their
customers based on an appropriate understanding of customers’ business needs, while
competitor orientation is defined as firms’ tendency to continuously seek to sense competitive
actions and respond to them timely and appropriately (Narver and Slater, 1990).
Furthermore, these two focal firm-centred strategic orientations need to be matched by
building relationships based on collaboration and coordination with key stakeholders (Gulati
et al., 2000; Morgan and Hunt, 1994; Palmatier et al., 2008). Such an orientation goes beyond
just being internally oriented by responding appropriately to environmental changes (Morgan
and Hunt, 1994; Palmatier et al., 2008). The resulting relationship orientation is defined as
firms’ tendency to coordinate and collaborate with its counterparts based on mutual goals
(Walter et al., 2006). Additionally, characteristics of the firm and the business environment
impact on a firm’s orientation and the degree to which a firm’s orientation may translate into
sales growth. For the purpose of this research, we selected firm size and market presence as
relevant firm characteristics, and industry growth as a critical environmental factor.
The primary question underlying this study is: What combinations of firm strategic
orientations contribute to sales growth given diverse firm characteristics and environmental
conditions? To detect and analyse these configurations, we conducted an empirical survey
11
with a sample of managers from multiple industries and analyse the data using fsQCA. The
sampling frame consisted of 3,500 managers from a proprietary international database. Data
were collected through a web-based survey, using the Qualtrics software. An invitation was
initially sent to all 3,500 potential respondents in November 2012 by e-mail, followed by
three reminders at one-week intervals (i.e. four-wave data collection). A total number of 789
complete responses were recorded, resulting in a response rate of 23%. However, to ensure
the quality of the dataset, we further eliminated 186 responses completed in less than 15
minutes. The threshold of 15 minutes was decided as the cut-off point of a ‘valid’ response
based on a pre-test which showed that faster results indicated ‘pattern responses’ (Fricker et
al., 2005). After eliminating further 7 responses with missing values, the final data set
consisted of 596 responses from a variety of industry sectors (i.e. services: 45.1%;
manufacturing: 30.7%; public sector: 3.8%; others: 20.4%, mostly consisting of agricultural,
mining, and construction). In terms of firm size, the three largest groups by number of
employees were ≥ 5001 (32.7%), 51-250 (15.4%), and 751-2500 (14.9%). The majority of
the respondents were at a position of either middle to higher management (67.1%) or top-
level directors (15.3%) in their organizations. In addition, 40.2% of the respondents have 6-
10 years of managerial experience, followed by 3-5 years (31.6%), and 11-15 (12.3%) years.
We controlled for non-response bias through two analyses suggested by Armstrong and
Overton (1977). First, we compared the responses collected in the first (early respondents)
and fourth waves (late respondents) of the data collection. A series of χ2-tests were performed
between these two groups regarding the used constructs and variables. The results showed
that there exist no significant differences. Secondly, we compared observed values such as
industry sectors, hierarchy levels, and work experience, with known values for the population
via χ2-tests. Non-significant Pearson’s χ
2-values indicated that the survey respondents
represent the population. Therefore, we conclude that non-response bias is not a concern for
our subsequent analyses.
We tested common method bias by performing Harman’s single factor test using
exploratory (EFA) and confirmatory factor analysis (CFA) (Malhotra et al., 2006). In the
EFA approach, common method bias is assumed to exist if a single factor emerges from the
unrotated factor solutions or if the first factor explains the majority of the variance in the
variables (Podsakoff and Organ 1986). The results of the EFA revealed that this is not the
case in this study. The CFA approach relies on comparing the postulated multi-factor
measurement model with a single-factor model in which all indicators load on a single factor,
using a χ2-difference test. Here, the results indicated that the hypothesized measurement
model fits the data significantly better than the single-factor model (Δχ2 = 1471.68; Δdf = 4, p
< 0.001). Based on the results of these tests, common method bias does not constitute a
problem for this study.
The second step of the fsQCA refers to the transformation of construct measures into
fuzzy set membership scores by calibrating causal conditions and the outcome in question. In
this study, we used two types of construct measures: single-item measures and reflective
multiple-item measures. The single-item measures captured firm size, market presence, and
industry growth. For all other constructs, we used reflective multiple-item measures. We
measured firms’ customer orientation and competitor orientation using four items for each
construct based on previous scales by Narver and Slater (1990). To capture relationship
orientation, we adapted four items from Walter et al. (2006), covering the extent to which a
firm coordinates and matches its own activities with that of business partners. We captured
sales growth using two items based on prior research by Venkatraman (1989). All multi-item
constructs were presented on 7-point Likert-type rating scales ranging from 1 = “completely
disagree” to 7 = “completely agree”, unless otherwise stated. We measured firm size based on
the number of full-time employees using a scale from 1 = “1-10 employees” to 8 = “more
12
than 5000 employees.” Industry growth is measured by asking respondents about the overall
growth of their industry, using scale from 1 = “poor” to 7 = “excellent.” Market presence is
measured by the number of years a firm has been established.
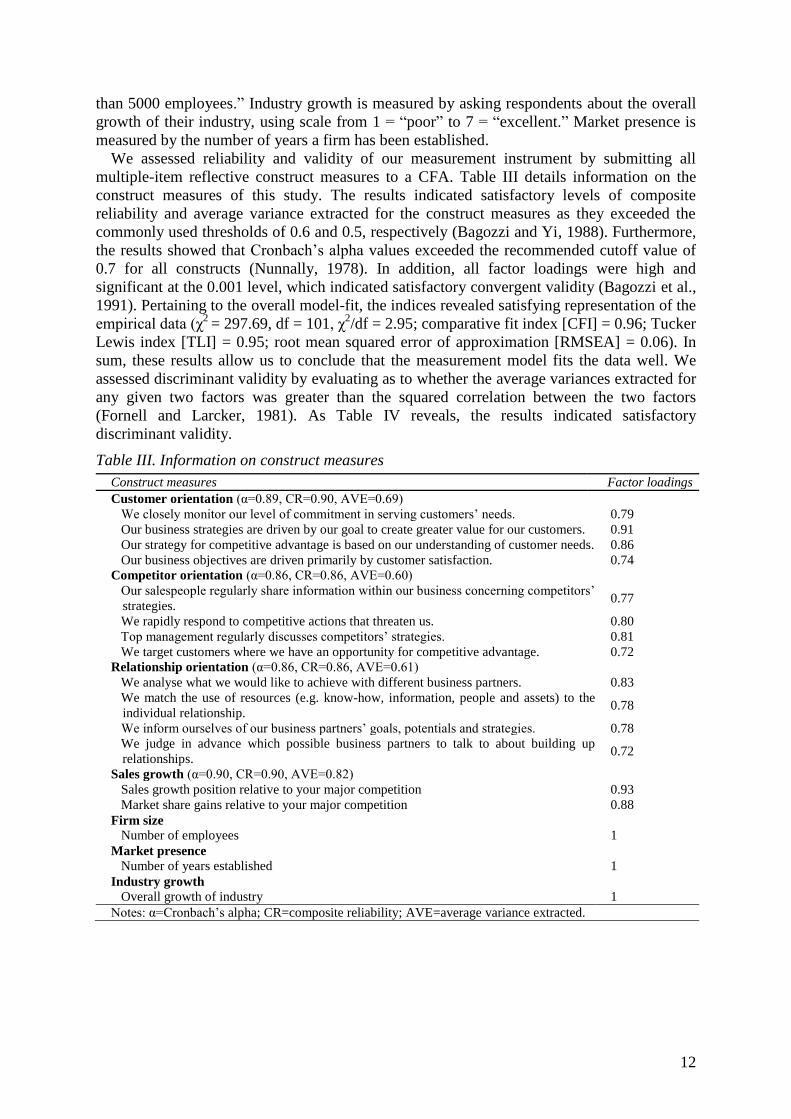
We assessed reliability and validity of our measurement instrument by submitting all
multiple-item reflective construct measures to a CFA. Table III details information on the
construct measures of this study. The results indicated satisfactory levels of composite
reliability and average variance extracted for the construct measures as they exceeded the
commonly used thresholds of 0.6 and 0.5, respectively (Bagozzi and Yi, 1988). Furthermore,
the results showed that Cronbach’s alpha values exceeded the recommended cutoff value of
0.7 for all constructs (Nunnally, 1978). In addition, all factor loadings were high and
significant at the 0.001 level, which indicated satisfactory convergent validity (Bagozzi et al.,
1991). Pertaining to the overall model-fit, the indices revealed satisfying representation of the
empirical data (χ2
= 297.69, df = 101, χ2/df = 2.95; comparative fit index [CFI] = 0.96; Tucker
Lewis index [TLI] = 0.95; root mean squared error of approximation [RMSEA] = 0.06). In
sum, these results allow us to conclude that the measurement model fits the data well. We
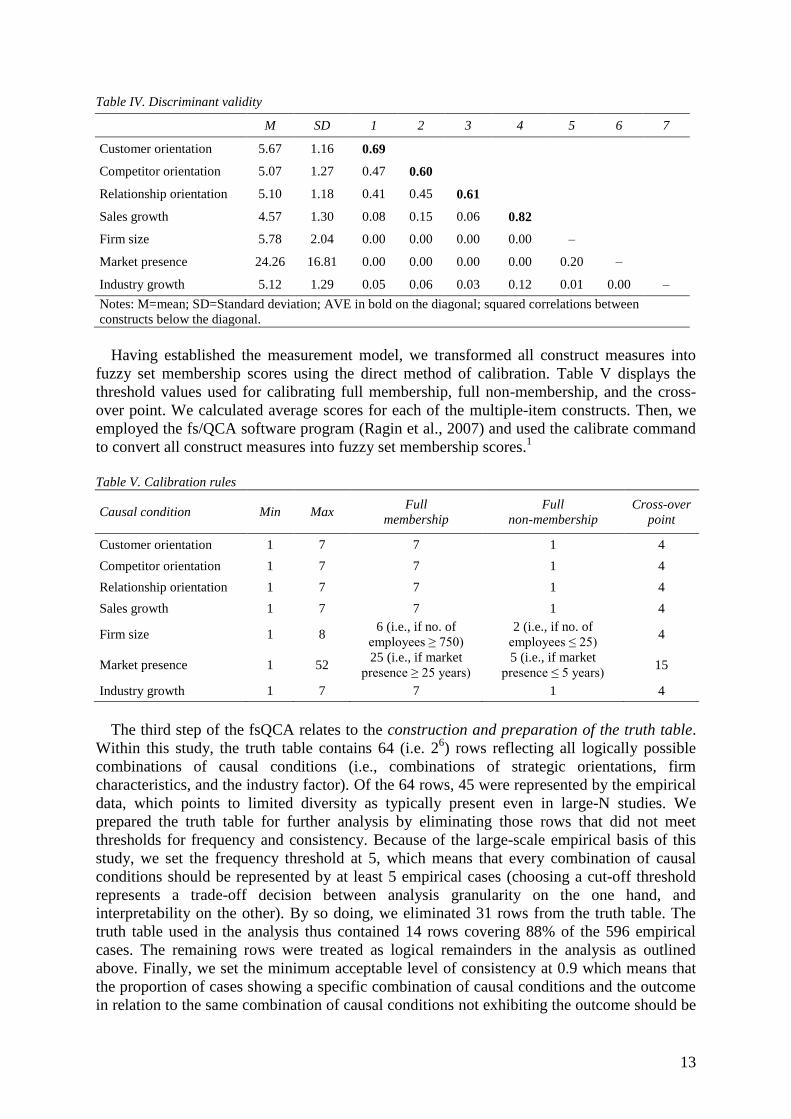
assessed discriminant validity by evaluating as to whether the average variances extracted for
any given two factors was greater than the squared correlation between the two factors
(Fornell and Larcker, 1981). As Table IV reveals, the results indicated satisfactory
discriminant validity.
Table III. Information on construct measures
Construct measures Factor loadings
Customer orientation (α=0.89, CR=0.90, AVE=0.69)
We closely monitor our level of commitment in serving customers’ needs. 0.79
Our business strategies are driven by our goal to create greater value for our customers. 0.91
Our strategy for competitive advantage is based on our understanding of customer needs. 0.86
Our business objectives are driven primarily by customer satisfaction. 0.74
Competitor orientation (α=0.86, CR=0.86, AVE=0.60)
Our salespeople regularly share information within our business concerning competitors’
strategies. 0.77
We rapidly respond to competitive actions that threaten us. 0.80
Top management regularly discusses competitors’ strategies. 0.81
We target customers where we have an opportunity for competitive advantage. 0.72
Relationship orientation (α=0.86, CR=0.86, AVE=0.61)
We analyse what we would like to achieve with different business partners. 0.83
We match the use of resources (e.g. know-how, information, people and assets) to the
individual relationship. 0.78
We inform ourselves of our business partners’ goals, potentials and strategies. 0.78
We judge in advance which possible business partners to talk to about building up
relationships. 0.72
Sales growth (α=0.90, CR=0.90, AVE=0.82)
Sales growth position relative to your major competition 0.93
Market share gains relative to your major competition 0.88
Firm size
Number of employees 1
Market presence
Number of years established 1
Industry growth
Overall growth of industry 1
Notes: α=Cronbach’s alpha; CR=composite reliability; AVE=average variance extracted.
13
Table IV. Discriminant validity
M SD 1 2 3 4 5 6 7
Customer orientation 5.67 1.16 0.69
Competitor orientation 5.07 1.27 0.47 0.60
Relationship orientation 5.10 1.18 0.41 0.45 0.61
Sales growth 4.57 1.30 0.08 0.15 0.06 0.82
Firm size 5.78 2.04 0.00 0.00 0.00 0.00 –
Market presence 24.26 16.81 0.00 0.00 0.00 0.00 0.20 –
Industry growth 5.12 1.29 0.05 0.06 0.03 0.12 0.01 0.00 –
Notes: M=mean; SD=Standard deviation; AVE in bold on the diagonal; squared correlations between
constructs below the diagonal.
Having established the measurement model, we transformed all construct measures into
fuzzy set membership scores using the direct method of calibration. Table V displays the
threshold values used for calibrating full membership, full non-membership, and the cross-
over point. We calculated average scores for each of the multiple-item constructs. Then, we
employed the fs/QCA software program (Ragin et al., 2007) and used the calibrate command
to convert all construct measures into fuzzy set membership scores.1
Table V. Calibration rules
Causal condition Min Max Full
membership
Full
non-membership
Cross-over
point
Customer orientation 1 7 7 1 4
Competitor orientation 1 7 7 1 4
Relationship orientation 1 7 7 1 4
Sales growth 1 7 7 1 4
Firm size 1 8 6 (i.e., if no. of
employees ≥ 750)
2 (i.e., if no. of
employees ≤ 25) 4
Market presence 1 52 25 (i.e., if market
presence ≥ 25 years)
5 (i.e., if market
presence ≤ 5 years) 15
Industry growth 1 7 7 1 4
The third step of the fsQCA relates to the construction and preparation of the truth table.
Within this study, the truth table contains 64 (i.e. 26) rows reflecting all logically possible
combinations of causal conditions (i.e., combinations of strategic orientations, firm
characteristics, and the industry factor). Of the 64 rows, 45 were represented by the empirical
data, which points to limited diversity as typically present even in large-N studies. We
prepared the truth table for further analysis by eliminating those rows that did not meet
thresholds for frequency and consistency. Because of the large-scale empirical basis of this
study, we set the frequency threshold at 5, which means that every combination of causal
conditions should be represented by at least 5 empirical cases (choosing a cut-off threshold
represents a trade-off decision between analysis granularity on the one hand, and
interpretability on the other). By so doing, we eliminated 31 rows from the truth table. The
truth table used in the analysis thus contained 14 rows covering 88% of the 596 empirical
cases. The remaining rows were treated as logical remainders in the analysis as outlined
above. Finally, we set the minimum acceptable level of consistency at 0.9 which means that
the proportion of cases showing a specific combination of causal conditions and the outcome
in relation to the same combination of causal conditions not exhibiting the outcome should be
14
at least 90%. This conservative threshold implies a relatively high level of consistency
required for solutions.
The fourth step of the fsQCA encompasses the analysis of the refined truth table. To do so,
we used the truth table algorithm as implemented in the fs/QCA software program. We
specified sales growth as the outcome of interest and firms’ strategic orientations, firms’
characteristics, and the industry factor as the causal conditions to predict this outcome. We
then run the analysis to identify how the causal conditions combine to form configurations for
achieving sales growth.
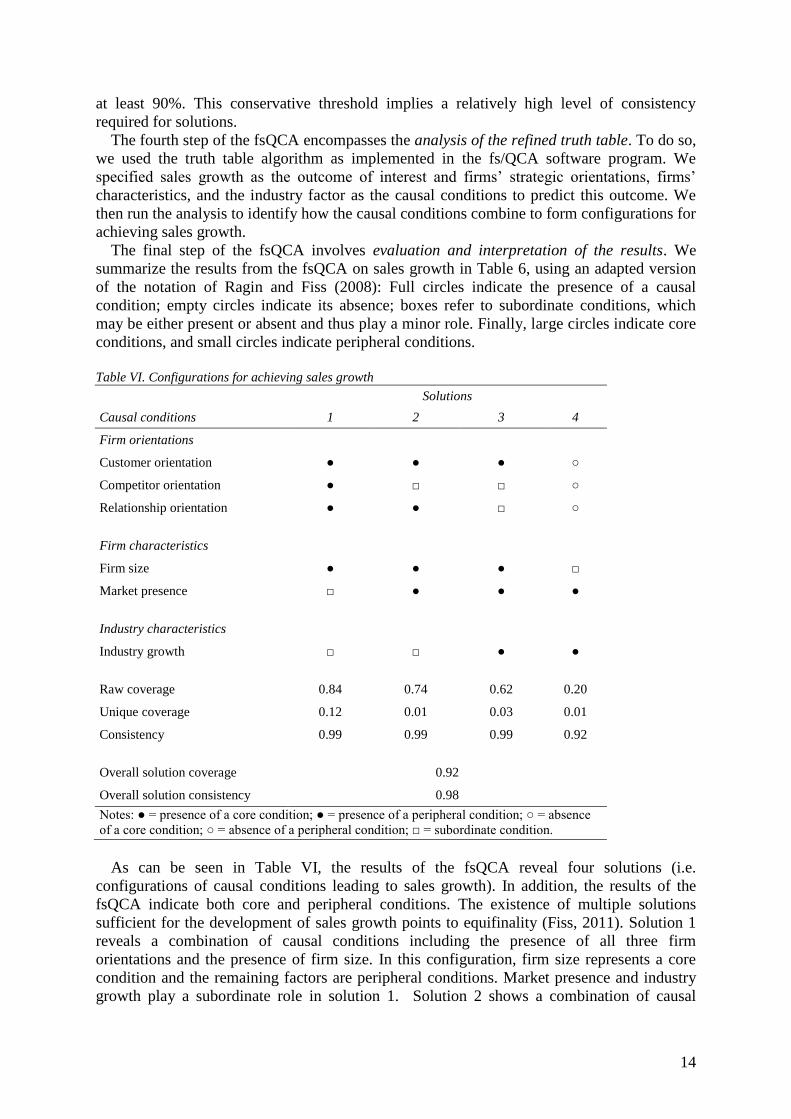
The final step of the fsQCA involves evaluation and interpretation of the results. We
summarize the results from the fsQCA on sales growth in Table 6, using an adapted version
of the notation of Ragin and Fiss (2008): Full circles indicate the presence of a causal
condition; empty circles indicate its absence; boxes refer to subordinate conditions, which
may be either present or absent and thus play a minor role. Finally, large circles indicate core
conditions, and small circles indicate peripheral conditions.
Table VI. Configurations for achieving sales growth
Solutions
Causal conditions 1 2 3 4
Firm orientations
Customer orientation ● ● ● ○
Competitor orientation ● □ □ ○
Relationship orientation ● ● □ ○
Firm characteristics
Firm size ● ● ● □
Market presence □ ● ● ●
Industry characteristics
Industry growth □ □ ● ●
Raw coverage 0.84 0.74 0.62 0.20
Unique coverage 0.12 0.01 0.03 0.01
Consistency 0.99 0.99 0.99 0.92
Overall solution coverage 0.92
Overall solution consistency 0.98
Notes: ● = presence of a core condition; ● = presence of a peripheral condition; ○ = absence
of a core condition; ○ = absence of a peripheral condition; □ = subordinate condition.
As can be seen in Table VI, the results of the fsQCA reveal four solutions (i.e.
configurations of causal conditions leading to sales growth). In addition, the results of the
fsQCA indicate both core and peripheral conditions. The existence of multiple solutions
sufficient for the development of sales growth points to equifinality (Fiss, 2011). Solution 1
reveals a combination of causal conditions including the presence of all three firm
orientations and the presence of firm size. In this configuration, firm size represents a core
condition and the remaining factors are peripheral conditions. Market presence and industry
growth play a subordinate role in solution 1. Solution 2 shows a combination of causal
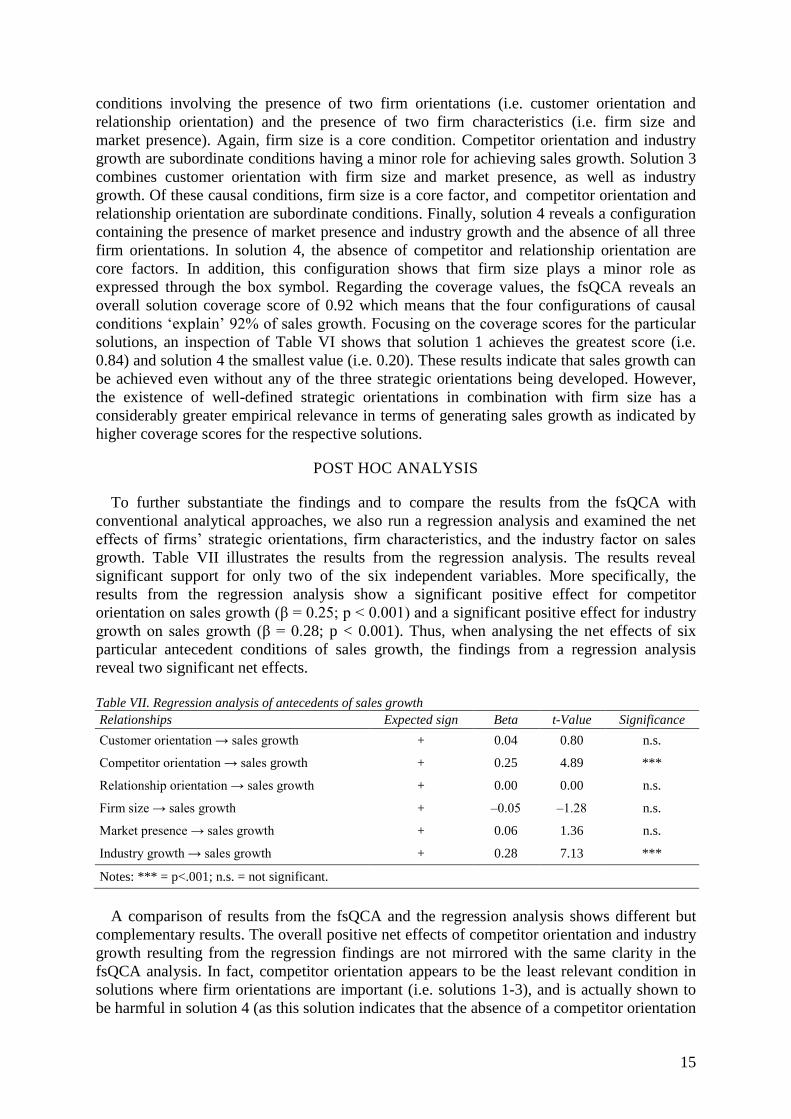
15
conditions involving the presence of two firm orientations (i.e. customer orientation and
relationship orientation) and the presence of two firm characteristics (i.e. firm size and
market presence). Again, firm size is a core condition. Competitor orientation and industry
growth are subordinate conditions having a minor role for achieving sales growth. Solution 3
combines customer orientation with firm size and market presence, as well as industry
growth. Of these causal conditions, firm size is a core factor, and competitor orientation and
relationship orientation are subordinate conditions. Finally, solution 4 reveals a configuration
containing the presence of market presence and industry growth and the absence of all three
firm orientations. In solution 4, the absence of competitor and relationship orientation are
core factors. In addition, this configuration shows that firm size plays a minor role as
expressed through the box symbol. Regarding the coverage values, the fsQCA reveals an
overall solution coverage score of 0.92 which means that the four configurations of causal
conditions ‘explain’ 92% of sales growth. Focusing on the coverage scores for the particular
solutions, an inspection of Table VI shows that solution 1 achieves the greatest score (i.e.
0.84) and solution 4 the smallest value (i.e. 0.20). These results indicate that sales growth can
be achieved even without any of the three strategic orientations being developed. However,
the existence of well-defined strategic orientations in combination with firm size has a
considerably greater empirical relevance in terms of generating sales growth as indicated by
higher coverage scores for the respective solutions.
POST HOC ANALYSIS
To further substantiate the findings and to compare the results from the fsQCA with
conventional analytical approaches, we also run a regression analysis and examined the net
effects of firms’ strategic orientations, firm characteristics, and the industry factor on sales
growth. Table VII illustrates the results from the regression analysis. The results reveal
significant support for only two of the six independent variables. More specifically, the
results from the regression analysis show a significant positive effect for competitor
orientation on sales growth (β = 0.25; p < 0.001) and a significant positive effect for industry
growth on sales growth (β = 0.28; p < 0.001). Thus, when analysing the net effects of six
particular antecedent conditions of sales growth, the findings from a regression analysis
reveal two significant net effects.
Table VII. Regression analysis of antecedents of sales growth
Relationships Expected sign Beta t-Value Significance
Customer orientation → sales growth + 0.04 0.80 n.s.
Competitor orientation → sales growth + 0.25 4.89 ***
Relationship orientation → sales growth + 0.00 0.00 n.s.
Firm size → sales growth + ‒0.05 ‒1.28 n.s.
Market presence → sales growth + 0.06 1.36 n.s.
Industry growth → sales growth + 0.28 7.13 ***
Notes: *** = p<.001; n.s. = not significant.
A comparison of results from the fsQCA and the regression analysis shows different but
complementary results. The overall positive net effects of competitor orientation and industry
growth resulting from the regression findings are not mirrored with the same clarity in the
fsQCA analysis. In fact, competitor orientation appears to be the least relevant condition in
solutions where firm orientations are important (i.e. solutions 1-3), and is actually shown to
be harmful in solution 4 (as this solution indicates that the absence of a competitor orientation
16
is core for achieving sales growth). Thus, fsQCA provides a finer-grained understanding of
the ambiguous effects of competitor orientation (which may point to an explanation for the
fact that existing research on market orientation sometimes shows positive performance
results as a consequence of market orientation, sometimes neutral, and sometimes negative
results) (Grewal and Tanshuhaj, 2001; Cadogan et al., 2009). Industry growth is less
prominent in the fsQCA, it shows no relevance for the two solutions with the highest
coverage, while it is identified as the most important net driver in the regression analysis.
SUMMARY AND DISCUSSION
The primary objective of this article was to introduce fsQCA as a novel analytic approach
to examine management problems characterised by complex causality. In this article, we
present key differences between set-theoretic and general correlational methods and show
that fsQCA represents a useful diagnostic tool that overcomes limitations of conventional
statistical methods. In addition, we show that although fsQCA has been repeatedly employed
in disciplines such as political and social sciences, its use in management studies is still in its
infancy and primarily restricted to macro-level issues. In this article, we suggest a multiple
step approach to conduct a fsQCA. This approach involves five stages and is illustrated in an
exemplary analysis with the setting of general management. As the exemplary analysis
reveals, fsQCA is especially useful in situations, in which an outcome may follow from
several different combinations of causal conditions (Ragin, 2008a): the regression analysis
does not provide the same detailed understanding of different ‘recipes for success’ as does
fsQCA. Therefore, fsQCA provides valuable insights into the nature of causal patterns and
complements findings of conventional statistical procedures such as regression analysis. Our
results illustrate this regarding the conditions of sales growth, which are assumed to include
some strategic firm orientations (regarding customers, competitors, and relationships) and
firm characteristics (such as firm size and market presence) and environmental factors (such
as industry growth). Complex causality allows for an understanding of the importance of the
interplay of these conditions and, for example, clearly indicates the importance of firm size as
a core condition which, together with especially customer orientation as a peripheral
condition effects sales growth. Contrariwise the regression analysis only points to the overall
importance of competitor orientation and industry growth for achieving sales growth.
However, rather than being a competing research approach, fsQCA should be understood
as a complementary method of analysis that supplements findings from general correlation-
based approaches. The additional insights obtained through fsQCA contribute to a richer and
more profound understanding of management phenomena and provide managers with more
accurate diagnostics, especially in research areas where complex causality is likely. Based on
equifinal solutions, managers now have choices between different ‘recipes’ and can make
decisions about which of these successful recipes fits best with their firm’s capabilities and
strategic outlook. This article encourages researchers to examine further such issues of multi-
causality and equifinality inherent in many management issues by means of fsQCA.

17
NOTES
[1] Because cases with fuzzy set memberships scores of precisely 0.5 (i.e. the cross-over
point) cause difficulties when intersecting fuzzy sets, Ragin (2008) recommends
avoiding the use of a precise 0.5 fuzzy set membership score for causal conditions. To
address this issue, we added a constant of 0.001 to all causal conditions with fuzzy set
membership scores smaller 1 (Fiss, 2011).
18
REFERENCES
Abrahamsen, M. H., Henneberg, S. C. and Naudé, P. (2012). ‘Using actors’ perceptions of
network roles and positions to understand network dynamics’. Industrial Marketing
Management, 41, 259‒69.
Achrol, R. S. and Kotler, P. (1999). ‘Marketing in the network economy’. Journal of
Marketing, 63, 146‒63.
Armstrong, J. S. and Overton, T. S. (1977). ‘Estimating nonresponse bias in mail surveys’.
Journal of Marketing Research, 14, 396‒402.
Bagozzi, R. P. and Yi, Y. (1988). ‘On the evaluation of structural equation models’. Journal
of the Academy of Marketing Science, 16, 74‒94.
Bagozzi, R. P., Yi, Y. and Phillips, L. W. (1991). ‘Assessing construct validity in
organizational research’. Administrative Science Quarterly, 36, 421‒58.
Bozec, R., Dia, M. and Bozec Y. (2009). ‘Governance–performance relationship: A re-
examination using technical efficiency measures’. British Journal of Management, 21,
684‒700.
Cadogan, J. W., Kuivalainen, O. and Sundquist, S. (2009). ‘Export market-oriented behavior
and export performance: Quadratic and moderating effects under differing degrees of
market dynamism and internationalization’. Journal of International Marketing, 17, 71-
89.
Calantone, R., S. T. Cavusgil and Y. Zhao (2002). ‘Learning orientation, firm innovation
capability, and firm performance’. Industrial Marketing Management, 31, 515‒24.
Clegg, S., Hardy, C. and Nord, W. R. (1996). Handbook of Organization Studies. London:
Sage.
Crilly, D., Zollo, M., & Hansen, M. T. (2012). ‘Faking it or muddling through?
Understanding decoupling in response to stakeholder pressures’. Academy of
Management Journal, 55, 1429‒48.
Davis, J. P., Eisenhardt, K. M. and Bingham, C. B. (2007). ‘Developing theory through
simulation methods’. Academy of Management Review, 32, 480‒99.
Delery, J. E. and Doty, D. H. (1996). ‘Modes of theorizing in strategic human resource
management: Tests of universalistic, contingency, and configurational performance
predictions’. Academy of Management Journal, 39, 802‒35.
Doty, D. H. and Glick, W. H. (1994). ‘Typologies as a unique form of theory building:
Toward improved understanding and modeling’. Academy of Management Review, 19,
230‒51.
Fiss, P. C. (2007). ‘A set-theoretic approach to organizational configurations’. Academy of
Management Review, 32, 1180‒98.
Fiss, P. C. (2011). ‘Building better causal theories: A fuzzy set approach to typologies in
organization research’. Academy of Management Journal, 54, pp. 393‒420.
Fiss, P., Sharapov, D. and Cronqvist, L. (2013). ‘Opposites attract? Opportunities and
challenges for integrating large-N QCA and econometric analysis’. Political Research
Quarterly, 66, 191‒97.
Fornell, C. and Larcker, D. F. (1981). ‘Evaluating structural equation models with
unobservable variables and measurement error’. Journal of Marketing Research, 18,
39‒50.
Fricker, S., Galesic, M., Tourangeau, R. and Ting, Y. (2005). ‘An experimental comparison
of web and telephone surveys’. Public Opinion Quarterly, 69, 370‒92.
Ganter, A. and Hecker, A. (2013). ‚Configurational paths to organizational innovation:
qualitative comparative analyses of antecedents and contingencies’. Journal of
Business Research, forthcoming.
Gulati, R., Nohria, N. and Zaheer, A. (2000). ‘Strategic networks’. Strategic Management
19
Journal, 21, 203‒15.
Grandori, A. and Furnari, S. (2008). ‘A chemistry of organization: Combinatory analysis and
design’. Organization Studies, 29, 459‒85.
Greckhamer, T. (2011). ‘Cross-cultural differences in compensation level and inequality
across occupations: A set-theoretic analysis’. Organization Studies, 32, 85‒115.
Greckhamer, T., Misangyi, V. F., Elms, H. and Lacey, R. (2008). ‘Using qualitative
comparative analysis in strategic management research’. Organizational Research
Methods, 11, 695‒726.
Grewal, R. and Tansuhaj, P. (2001). ‘Building organizational capabilities for managing
economic crisis: The role of market orientation and strategic flexibility’. Journal of
Marketing, 65, 67-80.
Häge, F. M. (2007). ‘Constructivism, fuzzy set and (very) small-N: Revisiting the conditions
for communicative action’. Journal of Business Research, 60, 512‒21.
Hult, G. T. M., Ketchen, D. J., Cavusgil, T. S. and Calantone, R. J. (2006). ‘Knowledge as a
strategic resource in supply chains’. Journal of Operations Management, 24, 458‒75.
Jaworski, B. J. and Kohli, A. K. (1993). ‘Market orientation: Antecedents and consequences’.
Journal of Marketing, 57, 53‒70.
Katz, D. and Kahn, R. L. (1978). The Social Psychology of Organizations. 2nd
edition, New
York: Wiley.
Kent, R. A. (2005). ‘Cases as configurations: Using combinatorial and fuzzy logic to analyse
marketing data’. International Journal of Market Research, 47, 205‒28.
Kent, R. A. and Argouslidis, P. C. (2005). ‘Shaping business decisions using fuzzy-set
analysis: Service elimination decisions’. Journal of Marketing Management, 21, 641‒
58.
King, A. W. (2007). ‘Disentangling intrafirm and interfirm causal ambiguity’. Academy of
Management Review, 32, 156‒78.
Kitchener, M., Beynon, M. and Harrington, C. (2002). ‘Qualitative comparative analysis and
public services research’. Public Management Review, 4, 485‒504.
Kogut, B., MacDuffie, J. P. and Ragin, C. C. (2004). ‘Prototypes and strategy: Assigning
causal credit using fuzzy sets’. European Management Review, 1, 114‒31.
Kvist, J. (2007). ‘Fuzzy set ideal type analysis’. Journal of Business Research, 60, 474‒81.
Leischnig, A., Geigenmueller, A. and Lohmann, S. (2013). ‘On the role of alliance
management capability, organizational compatibility, and interaction quality in
interorganizational technology transfer’. Journal of Business Research, forthcoming.
Mahoney, J. and Goertz, G. (2006). ‘A tale of two cultures: Contrasting qualitative and
quantitative research’. Political Analysis, 14, 227‒49.
Malhotra, N. K., Kim, S. S. and Patil, A. (2006). ‘Common method variance in IS research: A
comparison of alternative approaches and a reanalysis of past research’. Management
Science, 52, 1865‒83.
Marlin, D., Ketchen, D. J. and Lamont, B. (2007). ‘Equifinality and the strategic group-
performance relationship’. Journal of Managerial Issues, 19, 208‒32.
Meuer, J. (2013). ‘Archetypes of Inter-firm Relations in the Implementation of Management
Innovation: A Set-theoretic Study in China’s Biopharmaceutical Industry’.
Organization Studies, forthcoming.
Meyer, A. D., Tsui, A. S. and Hinings, C. R. (1993). ‘Configurational approaches to
organizational analysis’. Academy of Management Journal, 36, 1175‒95.
Morgan, R. M. and Hunt, S. D. (1994). ‘The commitment-trust theory of relationship
marketing’. Journal of Marketing, 58, 20‒38.
Narver, J. C. and Slater, S. F. (1990). ‘The effect of a market orientation on business
profitability’. Journal of Marketing, 54, 20‒35.
20
Narver, J. C., Slater, S. F. and MacLachlan, D. L. (2004). ‘Responsive and proactive market
orientation and new-product success’. Journal of Product Innovation Management, 21,
334‒47.
Nunnally, J. C. (1978). Psychometric Theory. New York: McGraw-Hill.
Ordanini, A. and Maglio, P. P. (2009). ‘Market orientation, internal process, and external
network: A qualitative comparative analysis of key decisional alternatives in the new
service development’. Decision Sciences, 40, 601‒25.
Öz, Ö. (2004). ‘Using Boolean- and fuzzy-logic-based methods to analyze multiple case
study evidence in management research’. Journal of Management Inquiry, 13, 166‒79.
Pajunen, K. (2008). ‘Institutions and inflows of foreign direct investment: A fuzzy-set
analysis’. Journal of International Business Studies, 39, 652‒69.
Palmatier, R. W., Scheer, L. K., Evans, K. R. and Arnold, T. J. (2008). ‘Achieving
relationship marketing effectiveness in business-to-business exchanges’. Journal of the
Academy of Marketing Science, 36, 174‒90.
Payne, G. T. (2006). ‘Examining configurations and firm performance in a suboptimal
equifinality context’. Organization Science, 17, 756‒70.
Podsakoff, P. M. and Organ, D. W. (1986). ‘Self-reports in organizational research: Problems
and prospects’. Journal of Management, 12, 531‒44.
Ragin, C. C. (1987). The Comparative Method: Moving Beyond Qualitative and Quantitative
Strategies. Berkeley: University of California Press.
Ragin, C. C. (2000). Fuzzy Set Social Science. Chicago: University of Chicago Press.
Ragin, C. C. (2008a). Redesigning Social Inquiry: Fuzzy Sets and Beyond. Chicago:
University of Chicago Press.
Ragin, C. C. (2008b). Users Guide to Fuzzy-Set / Qualitative Comparative Analysis. Working
Paper, University of Arizona, Arizona.
Ragin C. C., Drass, K. A., and Davey, S. (2007). Fuzzy set/qualitative comparative analysis.
www.fsqca.com.
Ragin, C. C. and Fiss, P. C. (2008). ‘Net effects analysis versus configurational analysis: An
empirical demonstration’, in Ragin, C. C. (Ed), Redesigning Social Inquiry: Fuzzy Sets
and Beyond. Chicago: University of Chicago Press.
Rihoux, B. (2006). ‘Qualitative comparative analysis (QCA) and related systematic
comparative methods’. International Sociology, 21, 679‒706.
Schneider, M. R., Schulze-Bentrop, C. and Paunescu, M. (2010). ‘Mapping the institutional
capital of high-tech firms: A fuzzy-set analysis of capitalist variety and export
performance’. Journal of International Business Studies, 41, 246‒66.
Short, J. C., Payne, G. T. and Ketchen, D. J. (2008). ‘Research on organizational
configurations: Past accomplishments and future challenges’. Journal of
Management, 34, 1053‒79.
Skaaning, S.-E. (2007). ‘Explaining post-communist respect for civil liberty: A multi-
methods test’. Journal of Business Research, 60, 493‒500.
Venkatraman, N. (1989). ‘Strategic orientation of business enterprises: The construct,
dimensionality, and measurement’. Management Science, 35, 942‒62.
Vis, B., Woldendorp, J. and Keman, H. (2007). ‘Do miracles exist? Analyzing economic
performance comparatively’. Journal of Business Research, 60, 531‒38.
Wagemann, C. and Schneider, C. Q. (2010). ‘Qualitative comparative analysis (QCA) and
fuzzy-sets: Agenda for a research approach and a data analysis technique’.
Comparative Sociology, 9, 376‒96.
Walter, A., Auer, M. and Ritter, T. (2006). ‘The impact of network capabilities and
entrepreneurial orientation on university spin-off performance’. Journal of Business
Venturing, 21, 541‒67.

21
Woodside, A. G., Hsu, S.-Y. and Marshall, R. (2011). ‘General theory of cultures’
consequences on international tourism behavior’. Journal of Business Research, 64,
785‒99.
Woodside, A. G., Ko, E. and Huan, T.-C. (2012). ‘The new logic in building isomorphic
theory of management decision realities’. Management Decision, 50, 765‒77.