Embed Size (px)
Citation preview
Phenology and plant / insect
interactions in a changing climate
Dan Herms
Department of Entomology
The Ohio State University
Ohio Agricultural Research and Development Center
Wooster, OH
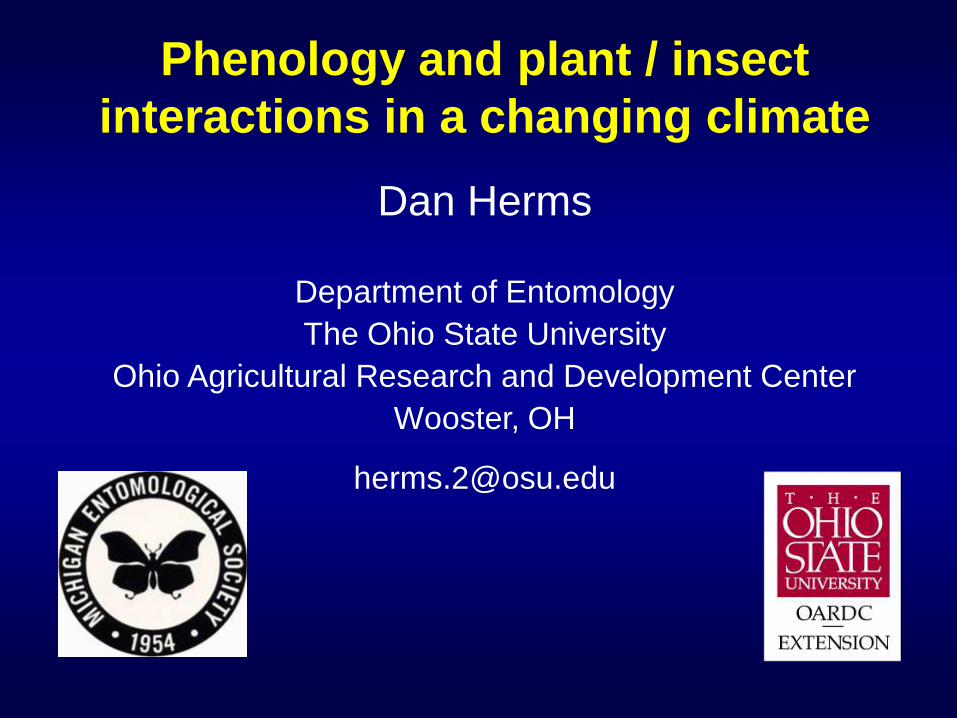
Climate change and phenology:
• Phenological change as evidence of global warming.
• Global warming and the distribution of species.
• Changes in insect life cycles: physiological and evolutionary.
• Phenological asynchrony and decoupling of species
interactions.
• Atmospheric CO2, plant quality, and herbivores.
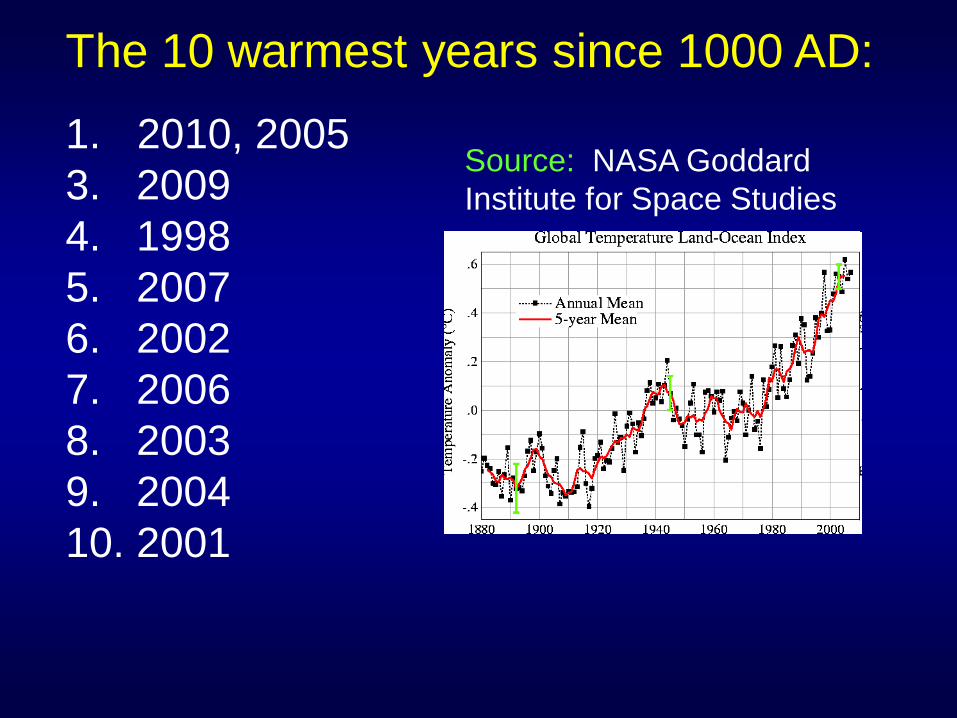
Source: NASA Goddard
Institute for Space Studies
The 10 warmest years since 1000 AD:
1. 2010, 2005
3. 2009
4. 1998
5. 2007
6. 2002
7. 2006
8. 2003
9. 2004
10. 2001
Consilience: convergence of evidence
3 independent surface temperature records:
NASA, NOAA, Hadley Climate Research Unit
Corroborated by:
• 2 satellite records of upper and lower troposphere
• Weather balloons
• Proxy reconstructions (e.g. tree rings, boreholes, ice cores,
glaciers, coral, etc.)
• Changes in Earth’s physical and biological systems.
NOAA climate indicators: 30 year trends
1. Increasing air temperature in lower atmosphere.
2. Increasing temperature over land.
3. Increasing temperature over oceans.
4. Increasing sea-surface temperature.
5. Increasing ocean heat content.
6. Increasing humidity.
7. Increasing sea level.
8. Decreasing glacier cover.
9. Decreasing sea ice cover.
10. Decreasing snow cover.
NOAA National Climatic Data Center, 2010
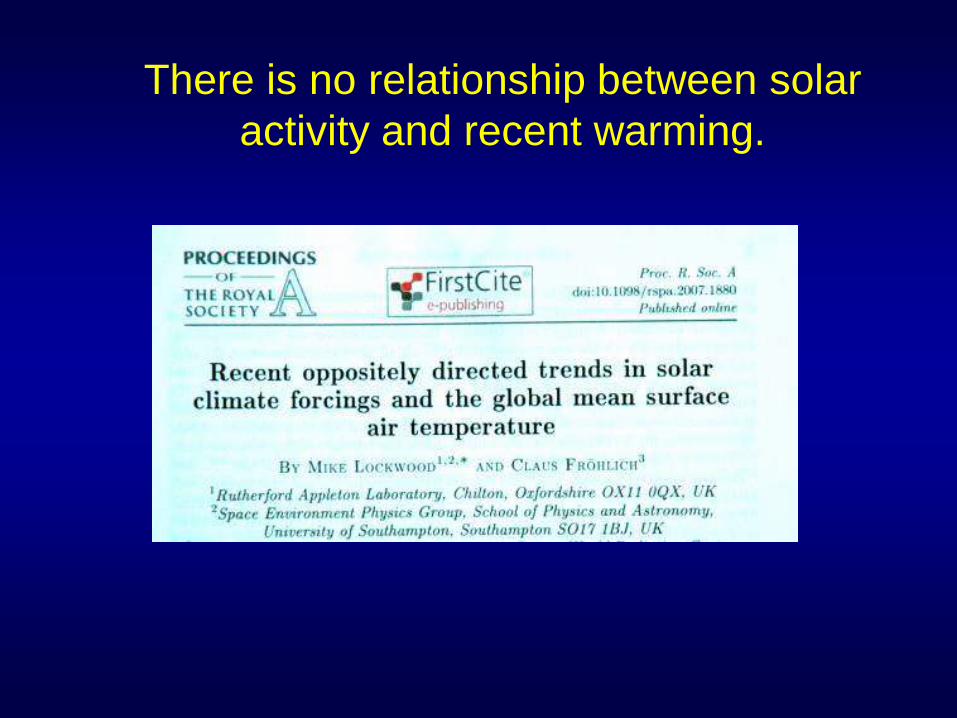
There is no relationship between solar
activity and recent warming.
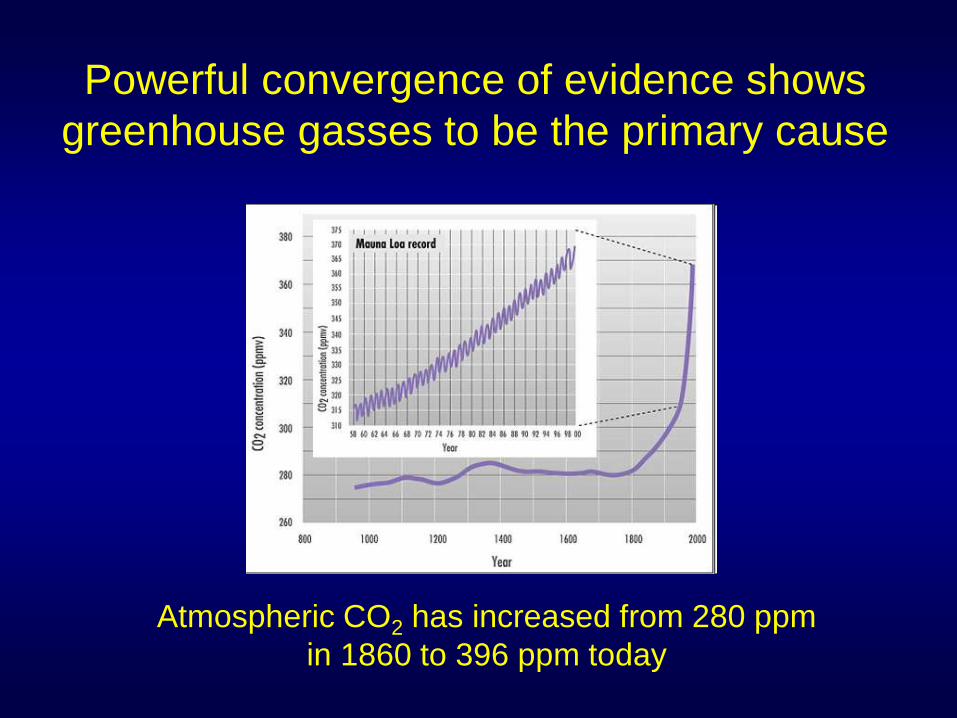
Powerful convergence of evidence shows
greenhouse gasses to be the primary cause
Atmospheric CO2 has increased from 280 ppm
in 1860 to 396 ppm today
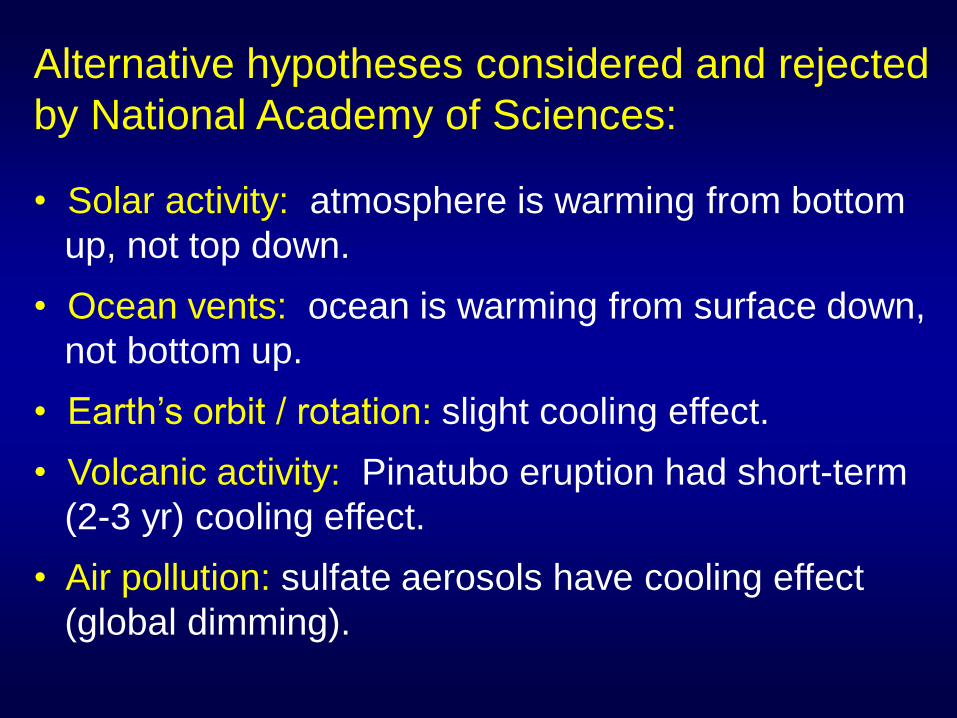
Alternative hypotheses considered and rejected
by National Academy of Sciences:
• Solar activity: atmosphere is warming from bottom
up, not top down.
• Ocean vents: ocean is warming from surface down,
not bottom up.
• Earth’s orbit / rotation: slight cooling effect.
• Volcanic activity: Pinatubo eruption had short-term
(2-3 yr) cooling effect.
• Air pollution: sulfate aerosols have cooling effect
(global dimming).
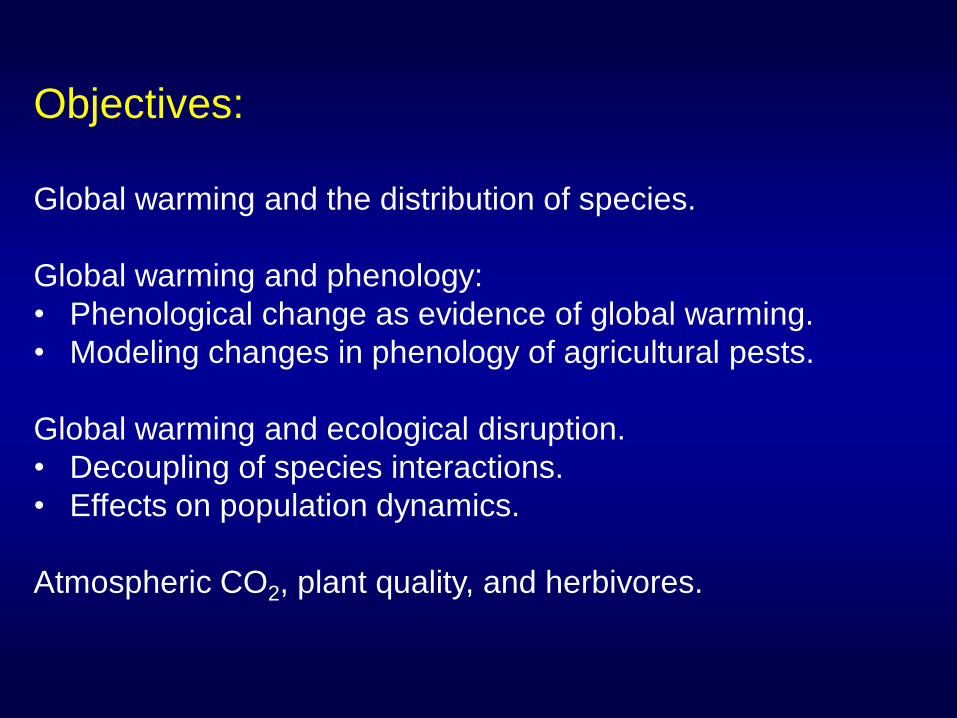
Objectives:
Global warming and the distribution of species.
Global warming and phenology:
• Phenological change as evidence of global warming.
• Modeling changes in phenology of agricultural pests.
Global warming and ecological disruption.
• Decoupling of species interactions.
• Effects on population dynamics.
Atmospheric CO2, plant quality, and herbivores.
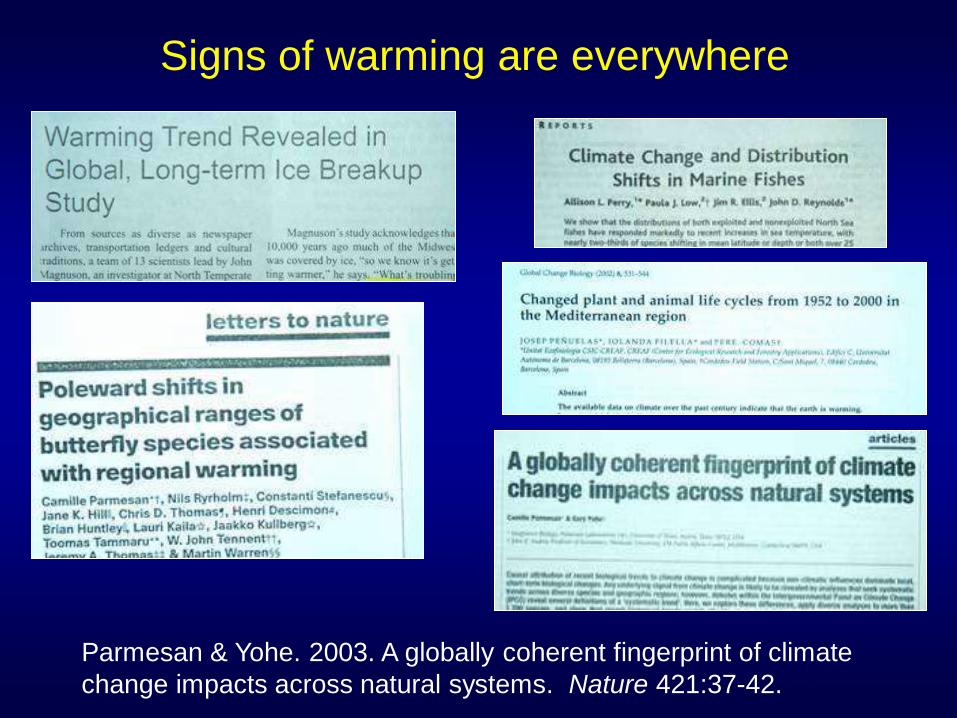
Signs of warming are everywhere
Parmesan & Yohe. 2003. A globally coherent fingerprint of climate
change impacts across natural systems. Nature 421:37-42.
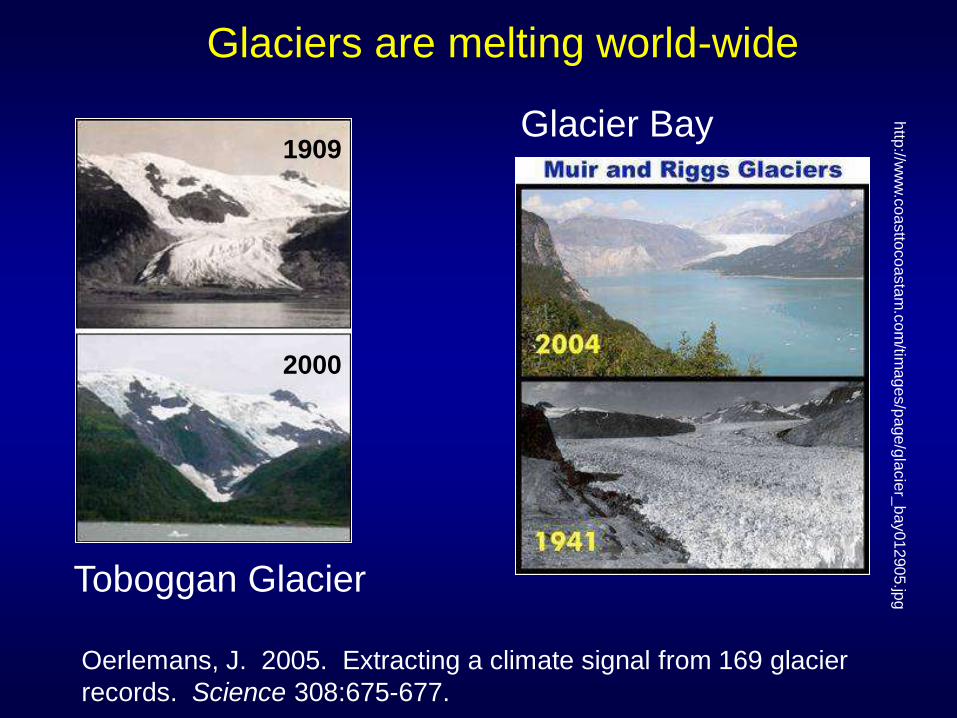
Glaciers are melting world-wide
Toboggan Glacier
http
://ww
w.c
oa
stto
co
asta
m.c
om
/tima
ge
s/p
ag
e/g
lacie
r_b
ay01
290
5.jp
g
Glacier Bay 1909
2000
Oerlemans, J. 2005. Extracting a climate signal from 169 glacier
records. Science 308:675-677.
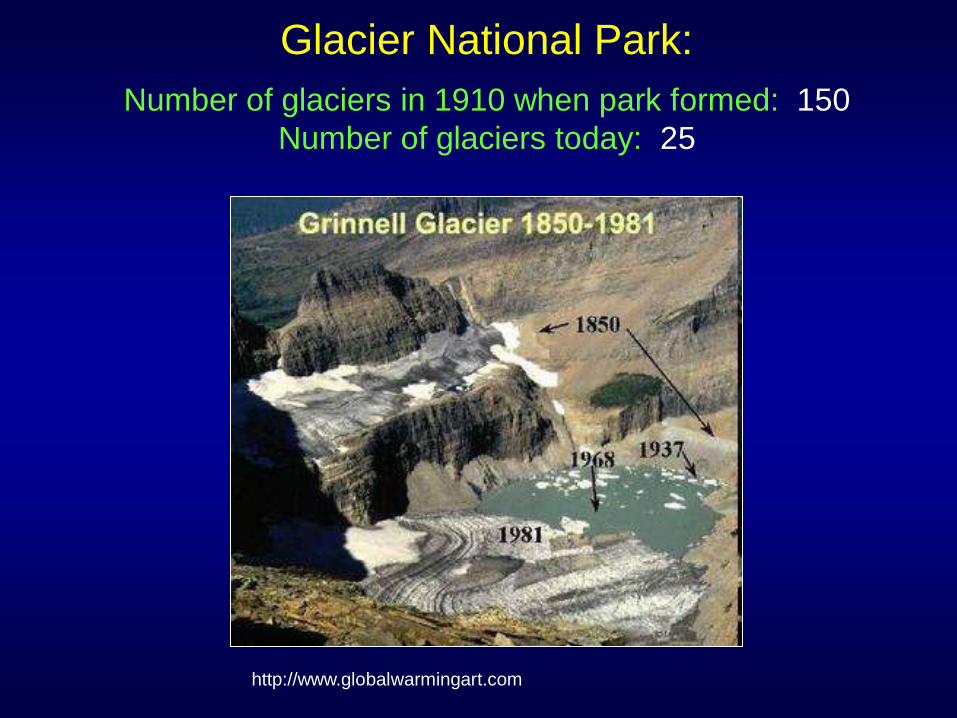
Glacier National Park:
Number of glaciers in 1910 when park formed: 150
Number of glaciers today: 25
http://www.globalwarmingart.com
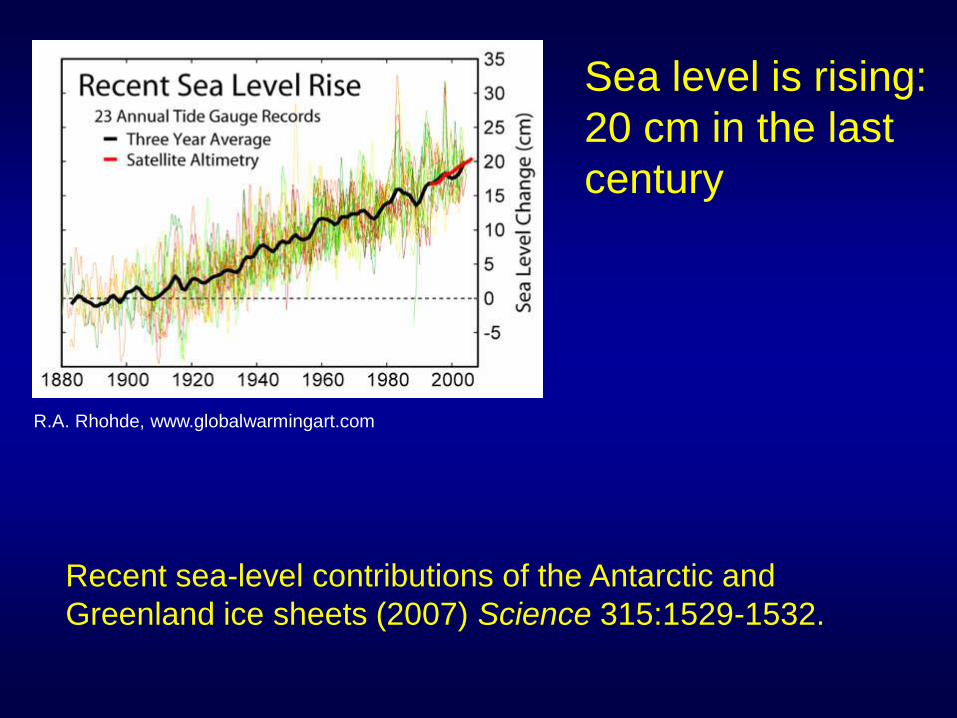
Sea level is rising:
20 cm in the last
century
R.A. Rhohde, www.globalwarmingart.com
Recent sea-level contributions of the Antarctic and
Greenland ice sheets (2007) Science 315:1529-1532.
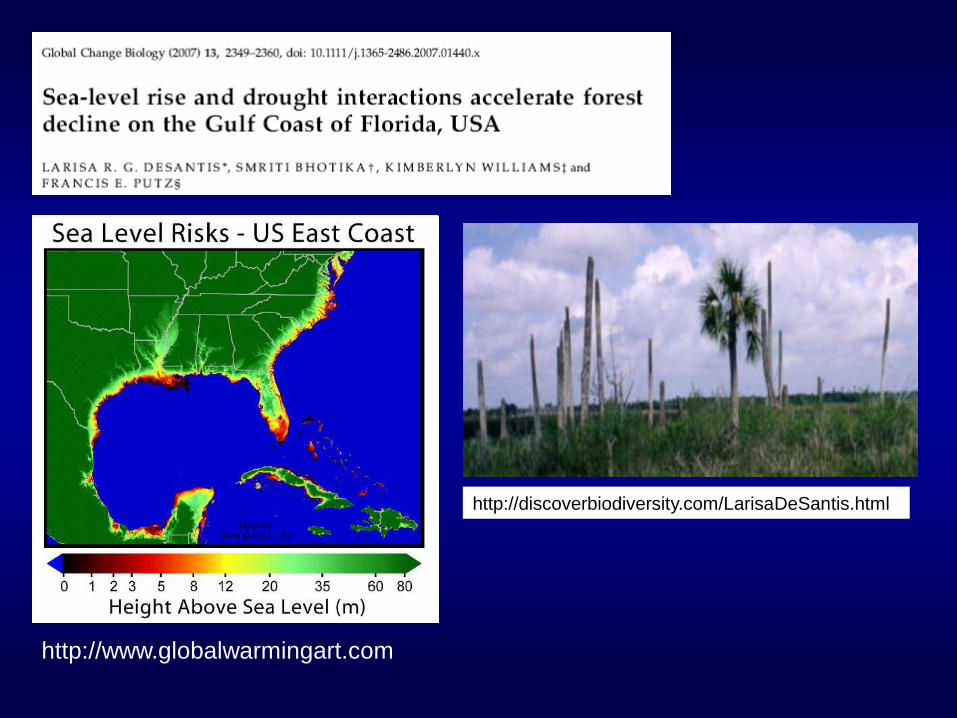
http://www.globalwarmingart.com
http://discoverbiodiversity.com/LarisaDeSantis.html
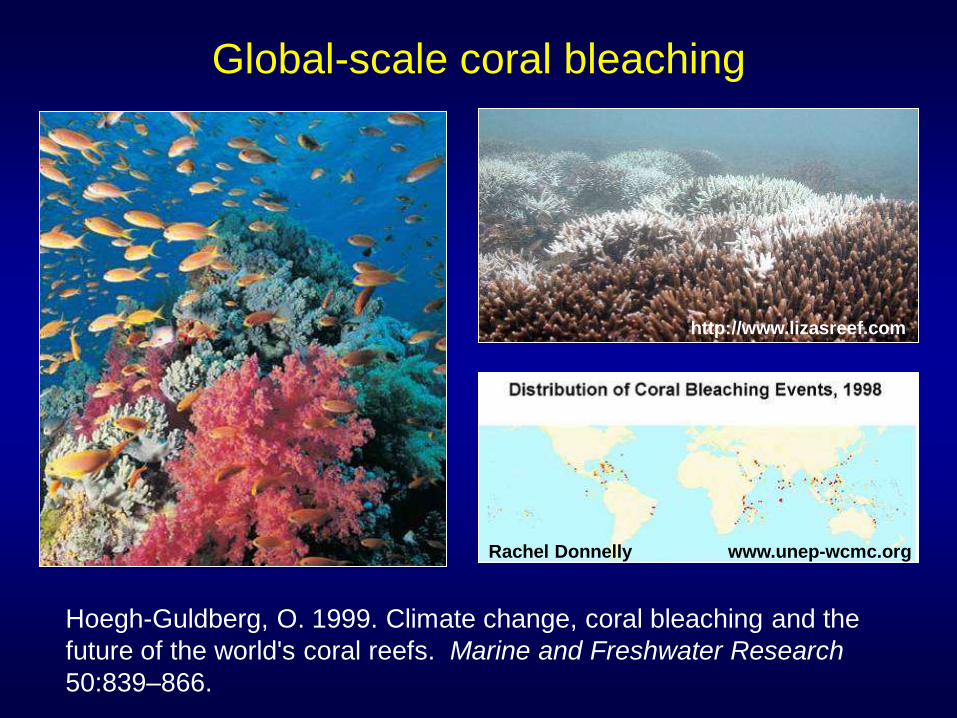
Global-scale coral bleaching
Hoegh-Guldberg, O. 1999. Climate change, coral bleaching and the
future of the world's coral reefs. Marine and Freshwater Research
50:839–866.
Rachel Donnelly
http://www.lizasreef.com
www.unep-wcmc.org
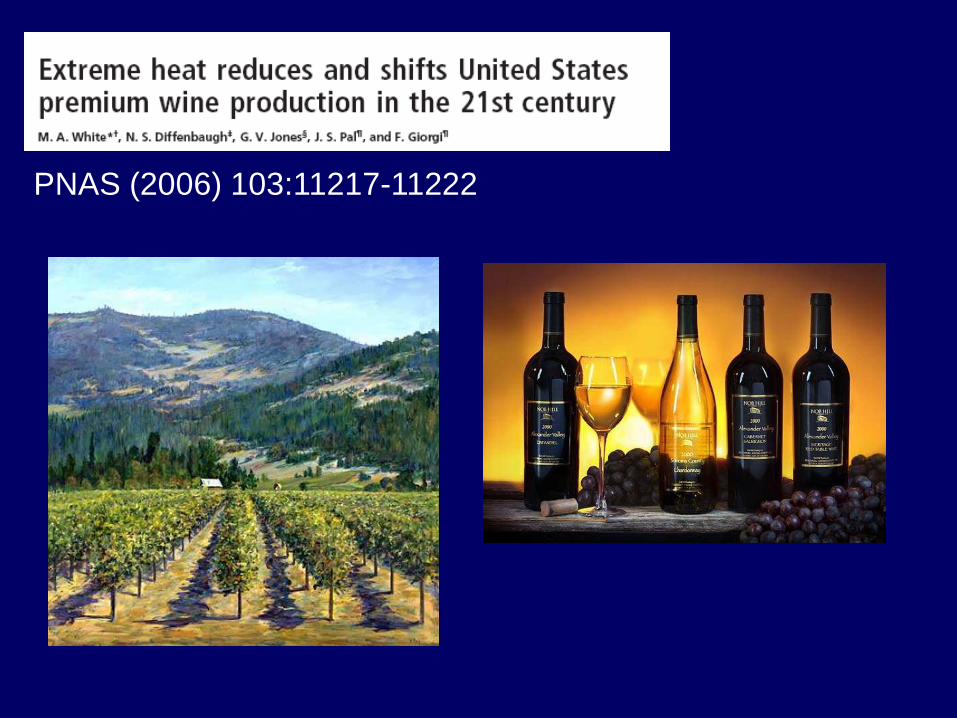
PNAS (2006) 103:11217-11222
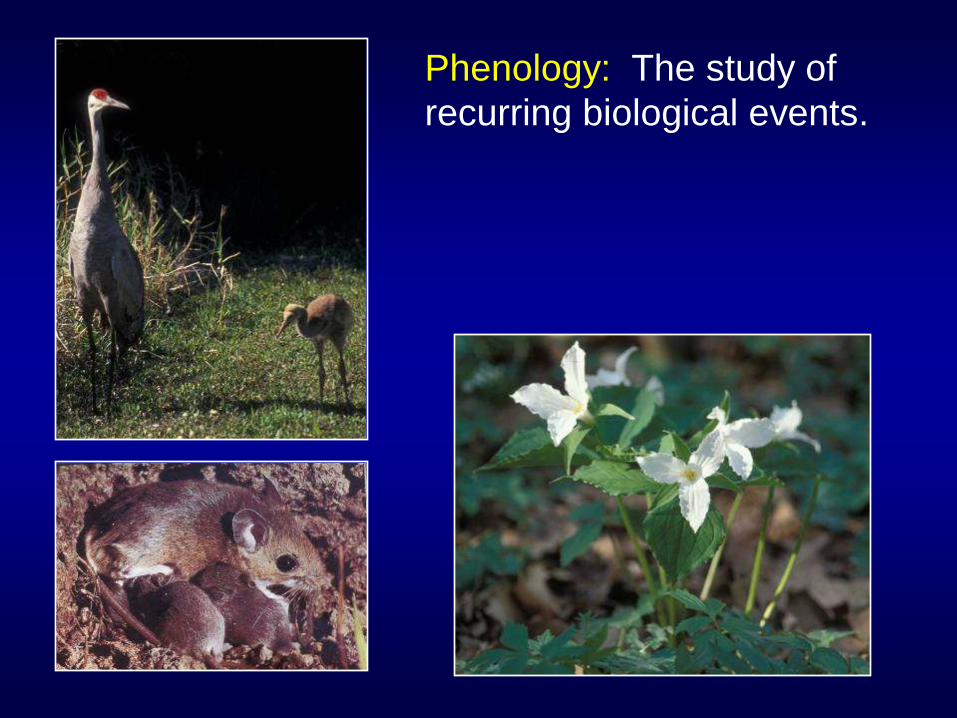
Phenology: The study of
recurring biological events.
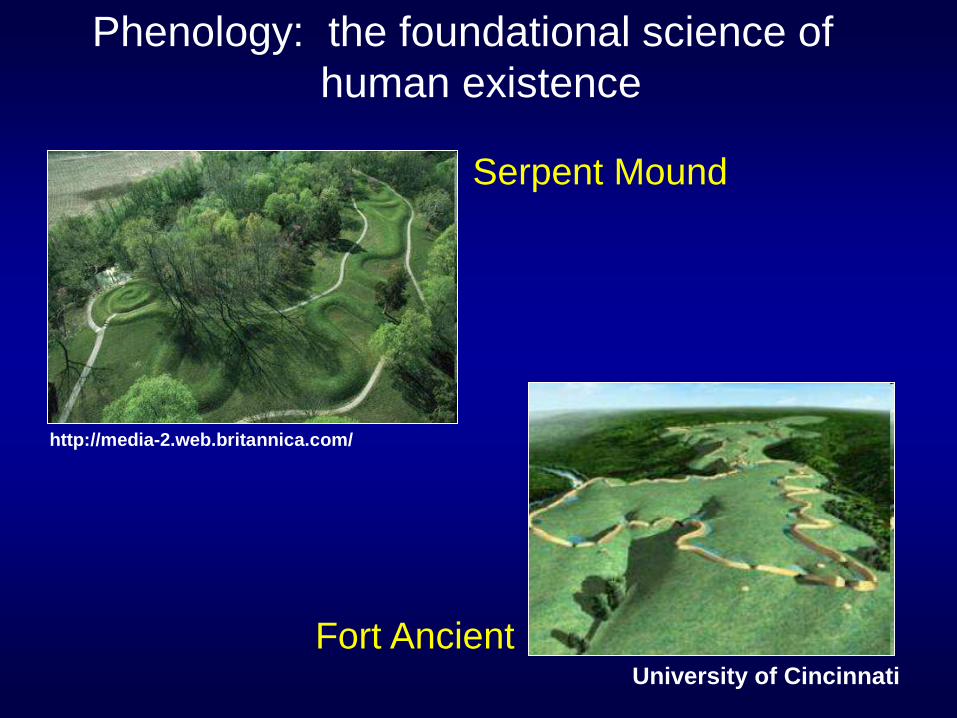
Phenology: the foundational science of
human existence
Serpent Mound
Fort Ancient
http://media-2.web.britannica.com/
University of Cincinnati
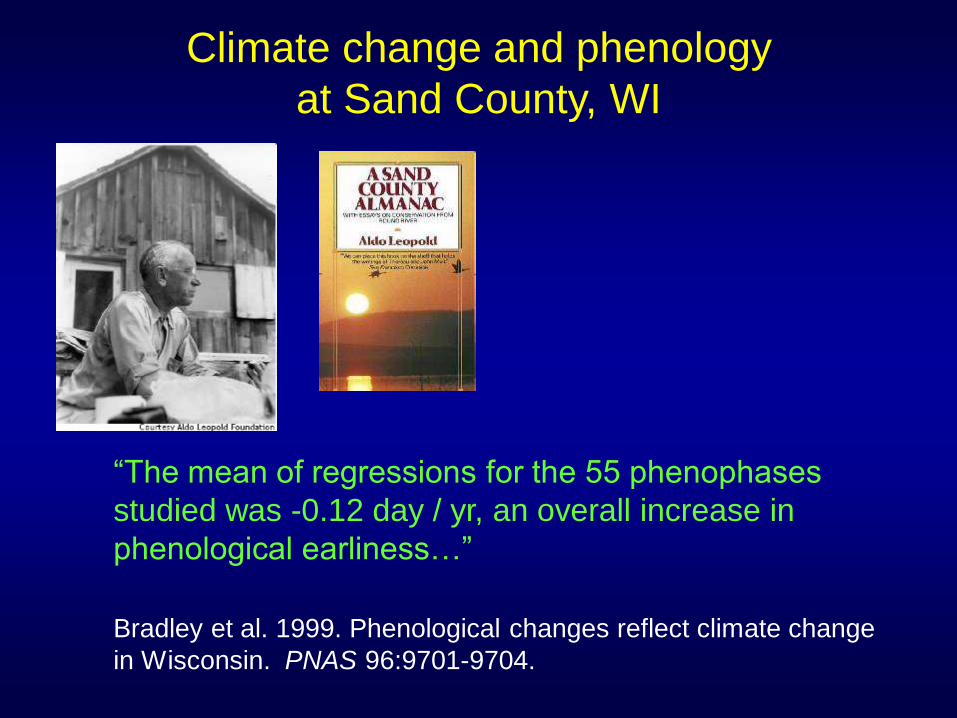
Climate change and phenology
at Sand County, WI
Bradley et al. 1999. Phenological changes reflect climate change
in Wisconsin. PNAS 96:9701-9704.
“The mean of regressions for the 55 phenophases
studied was -0.12 day / yr, an overall increase in
phenological earliness…”
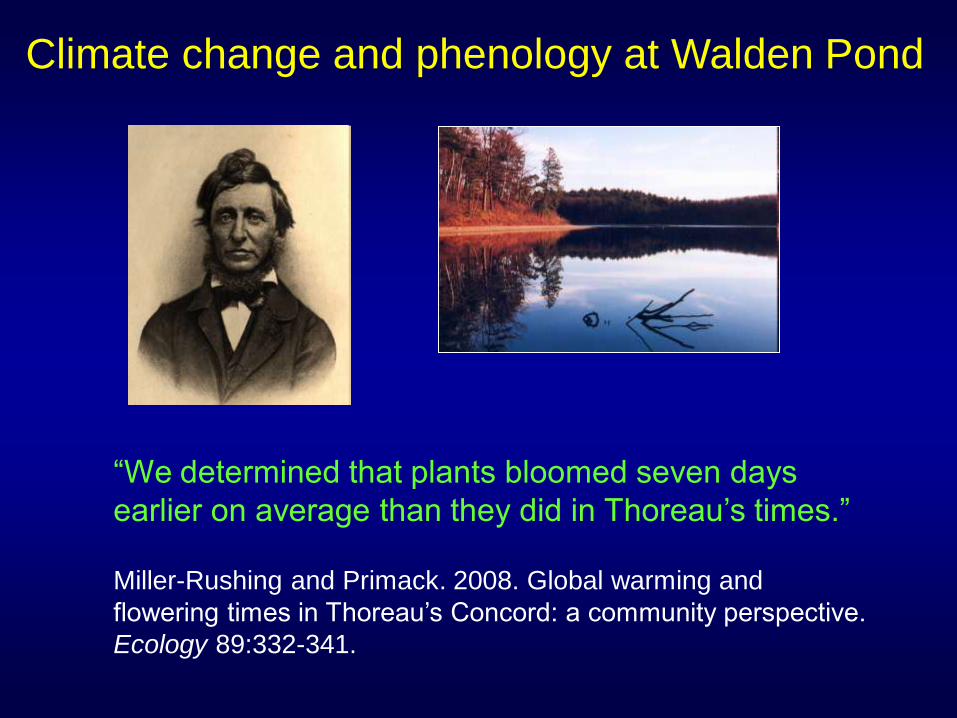
Climate change and phenology at Walden Pond
Miller-Rushing and Primack. 2008. Global warming and
flowering times in Thoreau’s Concord: a community perspective.
Ecology 89:332-341.
“We determined that plants bloomed seven days
earlier on average than they did in Thoreau’s times.”
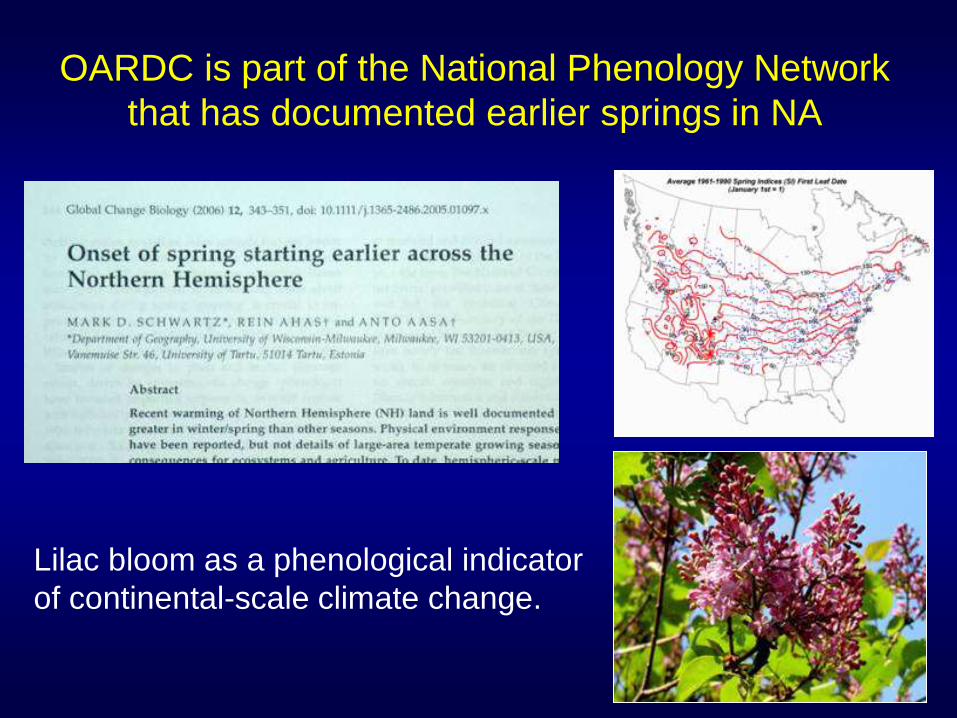
Lilac bloom as a phenological indicator
of continental-scale climate change.
OARDC is part of the National Phenology Network
that has documented earlier springs in NA
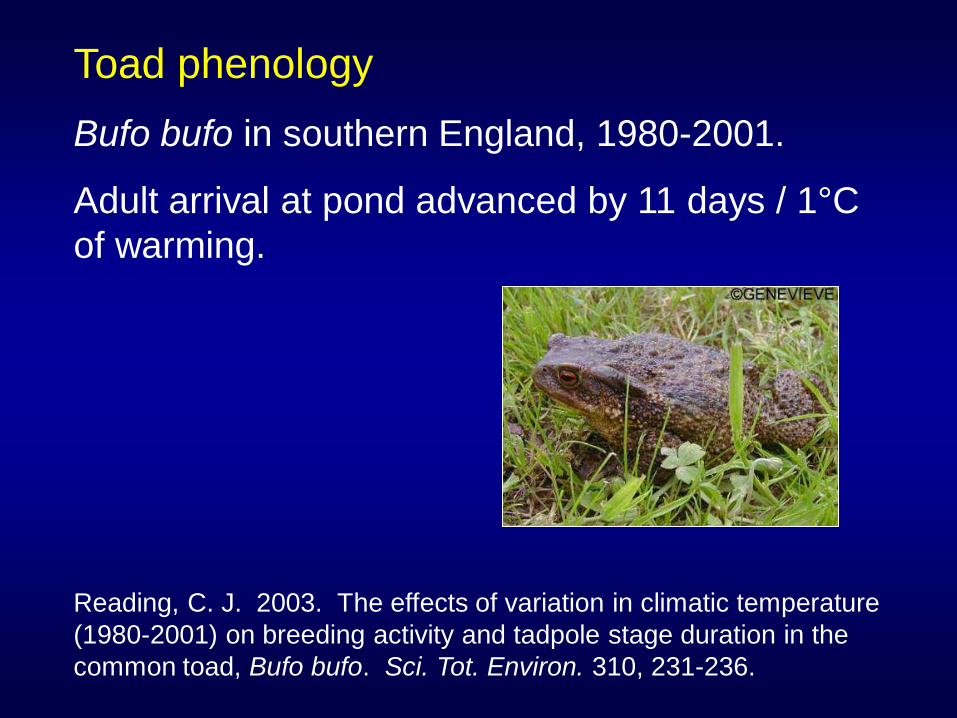
Reading, C. J. 2003. The effects of variation in climatic temperature
(1980-2001) on breeding activity and tadpole stage duration in the
common toad, Bufo bufo. Sci. Tot. Environ. 310, 231-236.
Toad phenology
Bufo bufo in southern England, 1980-2001.
Adult arrival at pond advanced by 11 days / 1°C
of warming.
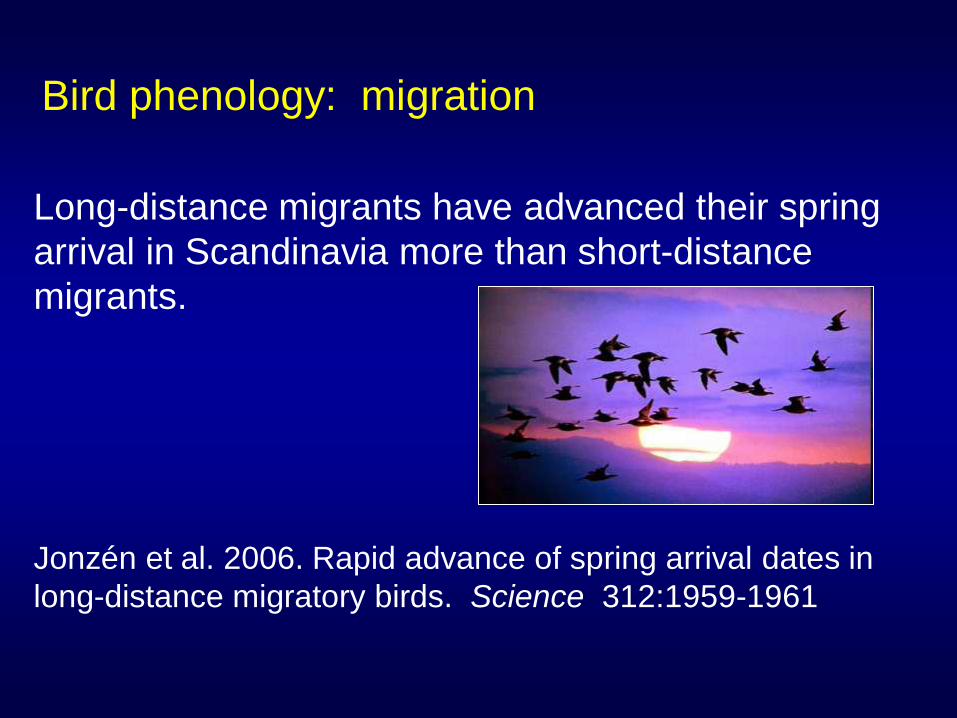
Bird phenology: migration
Long-distance migrants have advanced their spring
arrival in Scandinavia more than short-distance
migrants.
Jonzén et al. 2006. Rapid advance of spring arrival dates in
long-distance migratory birds. Science 312:1959-1961
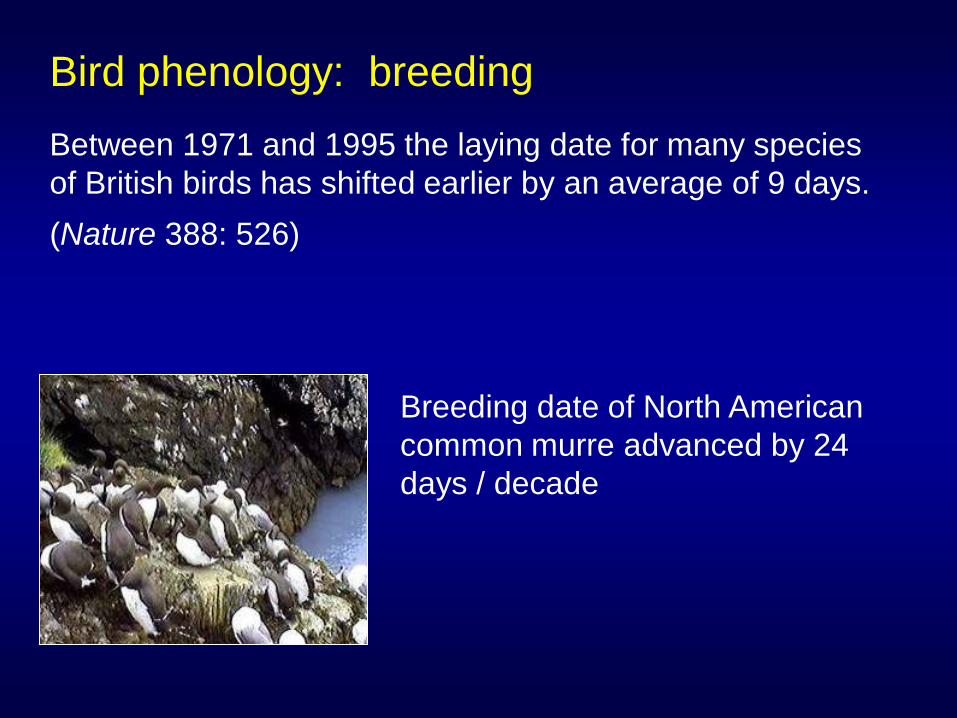
Bird phenology: breeding
Between 1971 and 1995 the laying date for many species
of British birds has shifted earlier by an average of 9 days.
(Nature 388: 526)
Breeding date of North American
common murre advanced by 24
days / decade
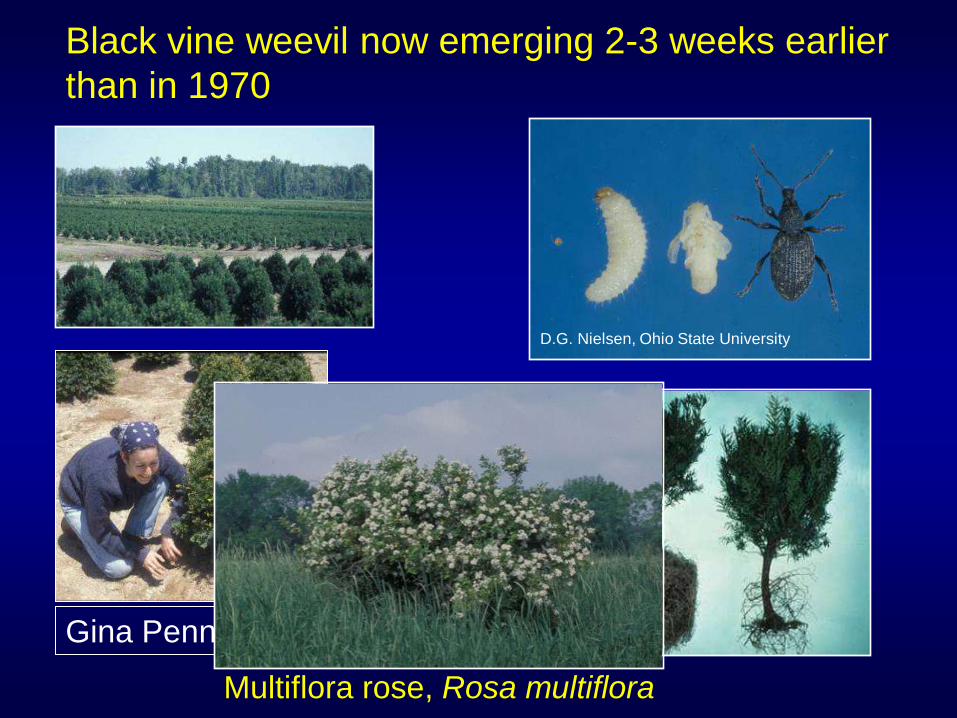
Black vine weevil now emerging 2-3 weeks earlier
than in 1970
D.G. Nielsen, Ohio State University
D.G
. N
iels
en
, O
hio
Sta
te
Univ
ers
ity
Gina Penny
Multiflora rose, Rosa multiflora
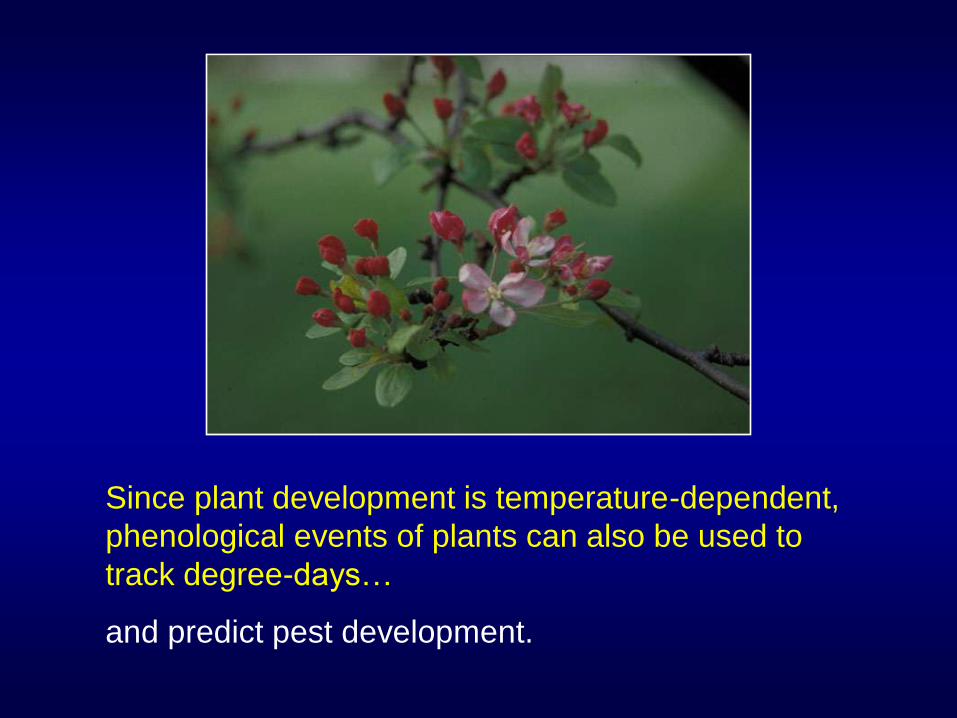
Since plant development is temperature-dependent,
phenological events of plants can also be used to
track degree-days…
and predict pest development.
Hypothesis: the flowering sequence of
ornamental plants can be used as a
biological calendar to predict pest activity
and schedule pest management
appointments.
The hypothesis was tested in Secrest Arboretum by
monitoring over the past 7 years:
1. The phenology of 45 key arthropod pests of
ornamental plants (e.g. egg hatch, adult emergence).
2. The flowering sequence of 75 taxa of woody
ornamental plants.
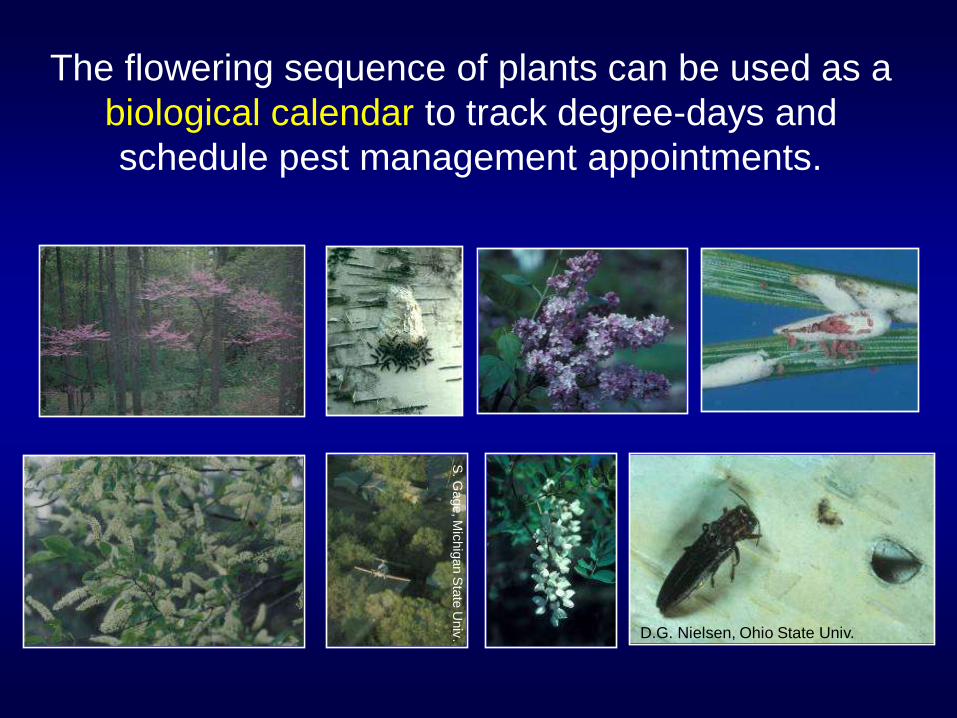
The flowering sequence of plants can be used as a
biological calendar to track degree-days and
schedule pest management appointments.
S. G
age, M
ichig
an S
tate
Univ
. D.G. Nielsen, Ohio State Univ.
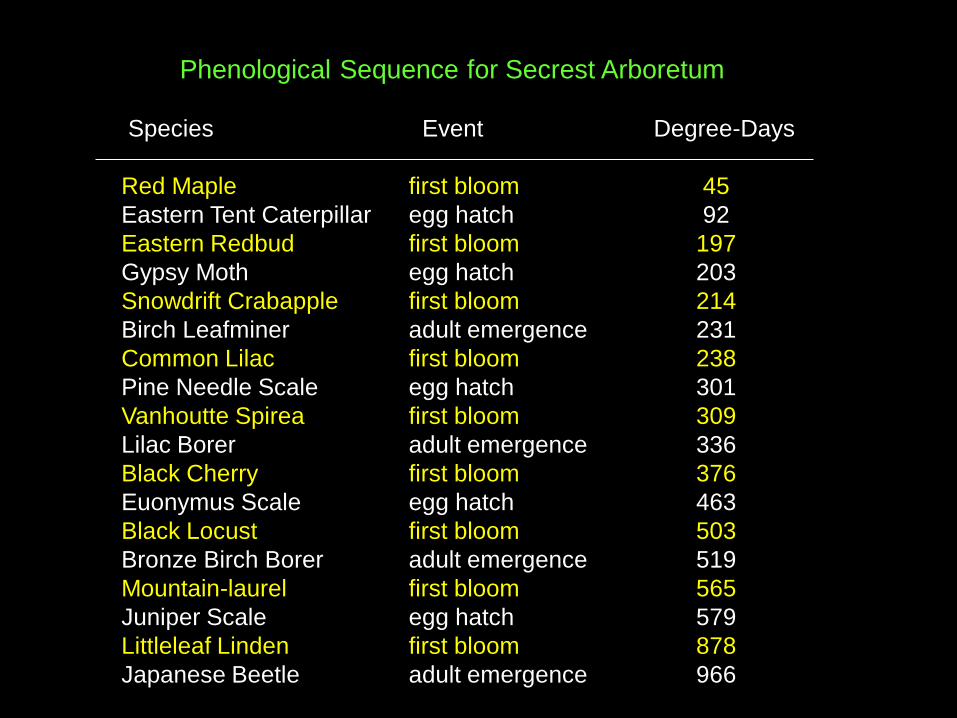
Phenological Sequence for Secrest Arboretum
Species Event Degree-Days
Red Maple first bloom 45
Eastern Tent Caterpillar egg hatch 92
Eastern Redbud first bloom 197
Gypsy Moth egg hatch 203
Snowdrift Crabapple first bloom 214
Birch Leafminer adult emergence 231
Common Lilac first bloom 238
Pine Needle Scale egg hatch 301
Vanhoutte Spirea first bloom 309
Lilac Borer adult emergence 336
Black Cherry first bloom 376
Euonymus Scale egg hatch 463
Black Locust first bloom 503
Bronze Birch Borer adult emergence 519
Mountain-laurel first bloom 565
Juniper Scale egg hatch 579
Littleleaf Linden first bloom 878
Japanese Beetle adult emergence 966

http://oardc.osu.edu/gdd

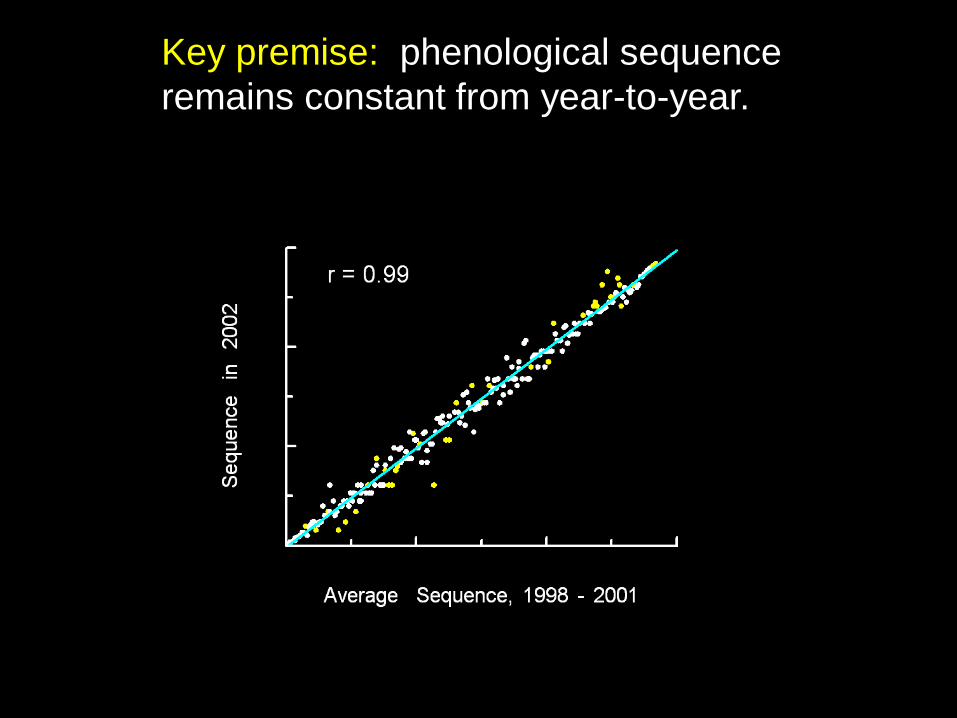
Key premise: phenological sequence
remains constant from year-to-year.
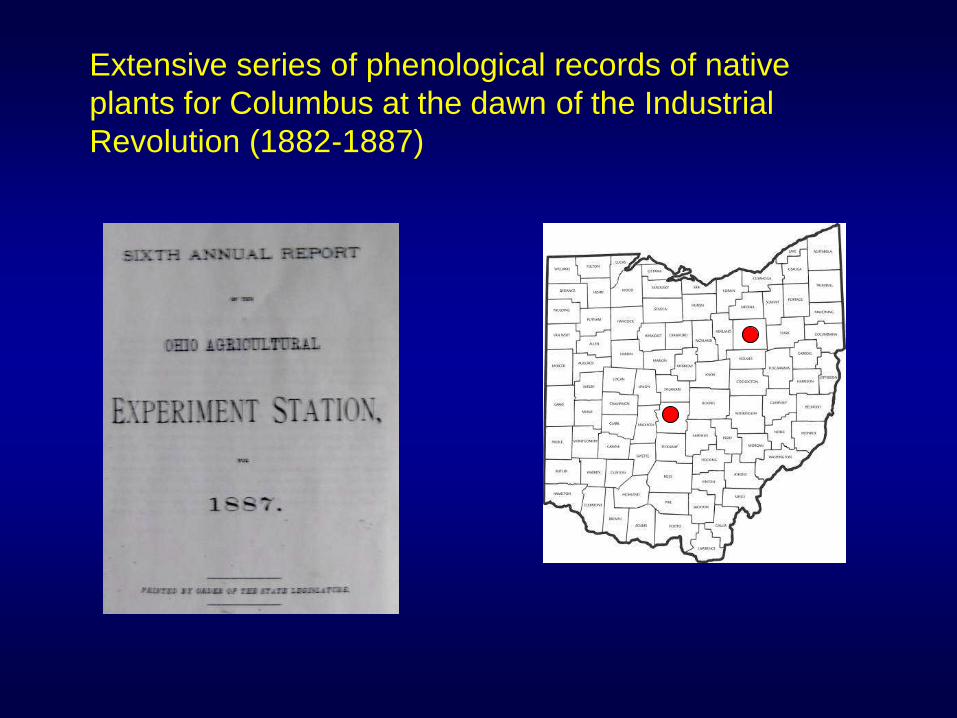
Extensive series of phenological records of native
plants for Columbus at the dawn of the Industrial
Revolution (1882-1887)
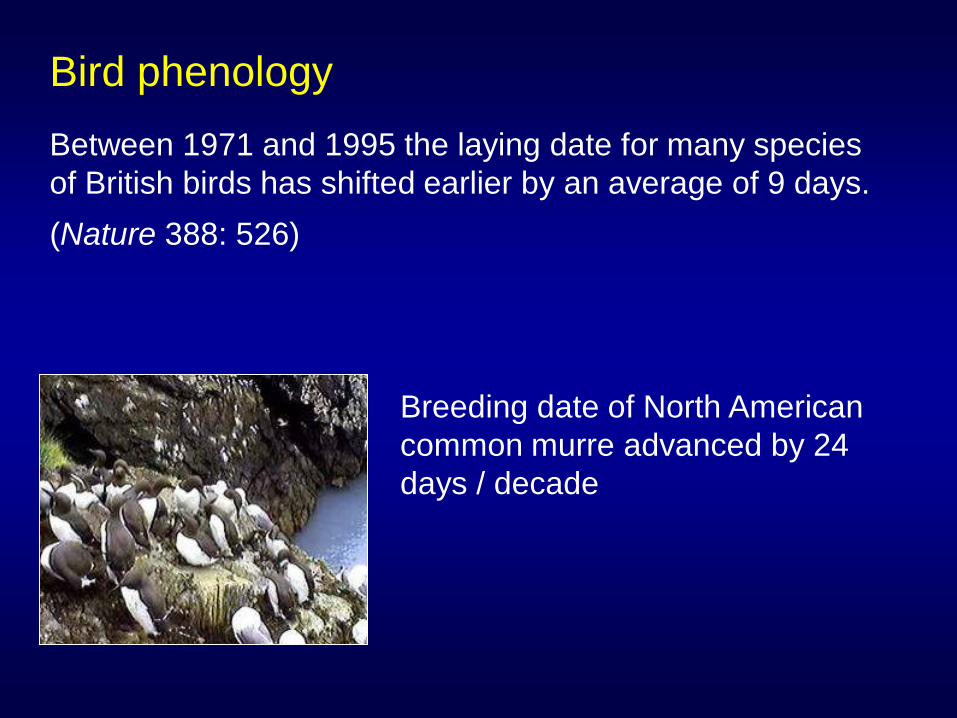
Bird phenology
Between 1971 and 1995 the laying date for many species
of British birds has shifted earlier by an average of 9 days.
(Nature 388: 526)
Breeding date of North American
common murre advanced by 24
days / decade
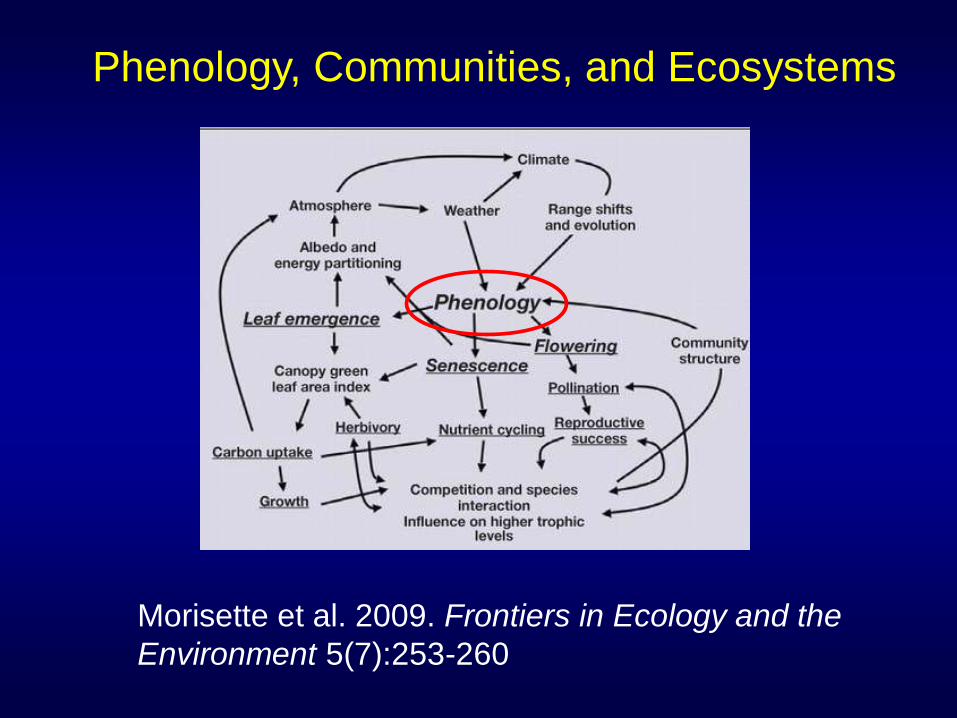
Morisette et al. 2009. Frontiers in Ecology and the
Environment 5(7):253-260
Phenology, Communities, and Ecosystems
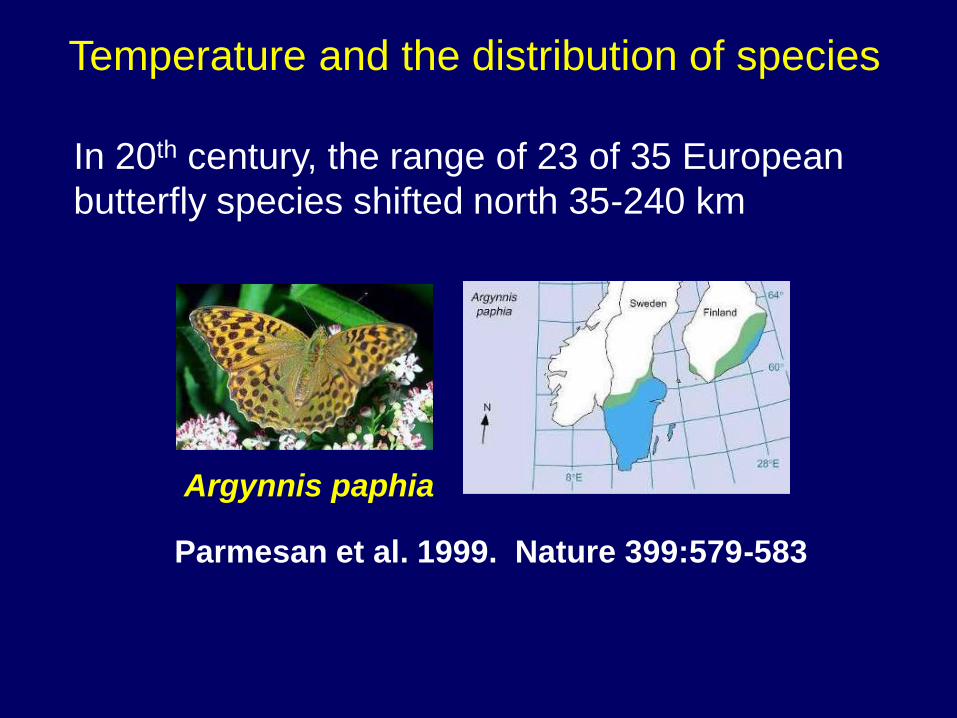
Parmesan et al. 1999. Nature 399:579-583
In 20th century, the range of 23 of 35 European
butterfly species shifted north 35-240 km
Argynnis paphia
Temperature and the distribution of species
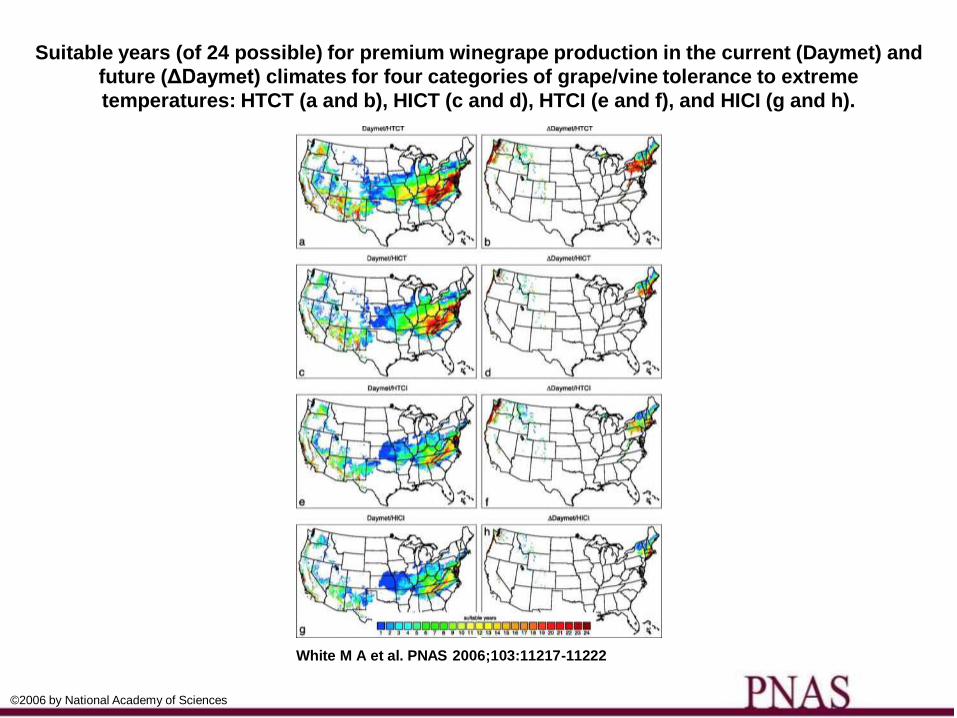
Suitable years (of 24 possible) for premium winegrape production in the current (Daymet) and
future (ΔDaymet) climates for four categories of grape/vine tolerance to extreme
temperatures: HTCT (a and b), HICT (c and d), HTCI (e and f), and HICI (g and h).
White M A et al. PNAS 2006;103:11217-11222
©2006 by National Academy of Sciences
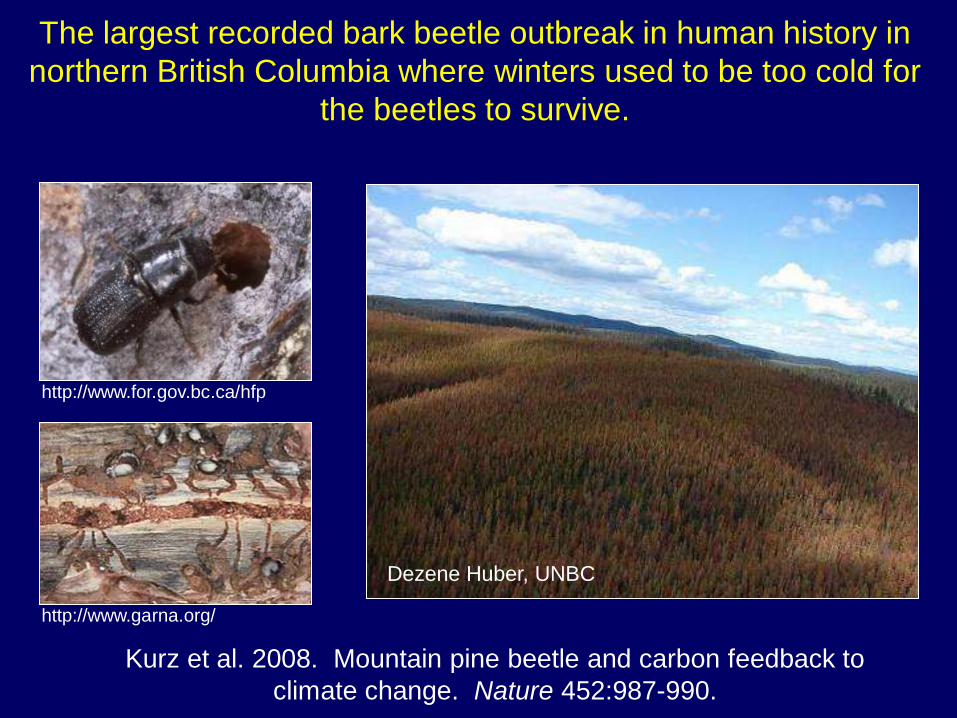
The largest recorded bark beetle outbreak in human history in
northern British Columbia where winters used to be too cold for
the beetles to survive.
Dezene Huber, UNBC
Kurz et al. 2008. Mountain pine beetle and carbon feedback to
climate change. Nature 452:987-990.
http://www.garna.org/
http://www.for.gov.bc.ca/hfp
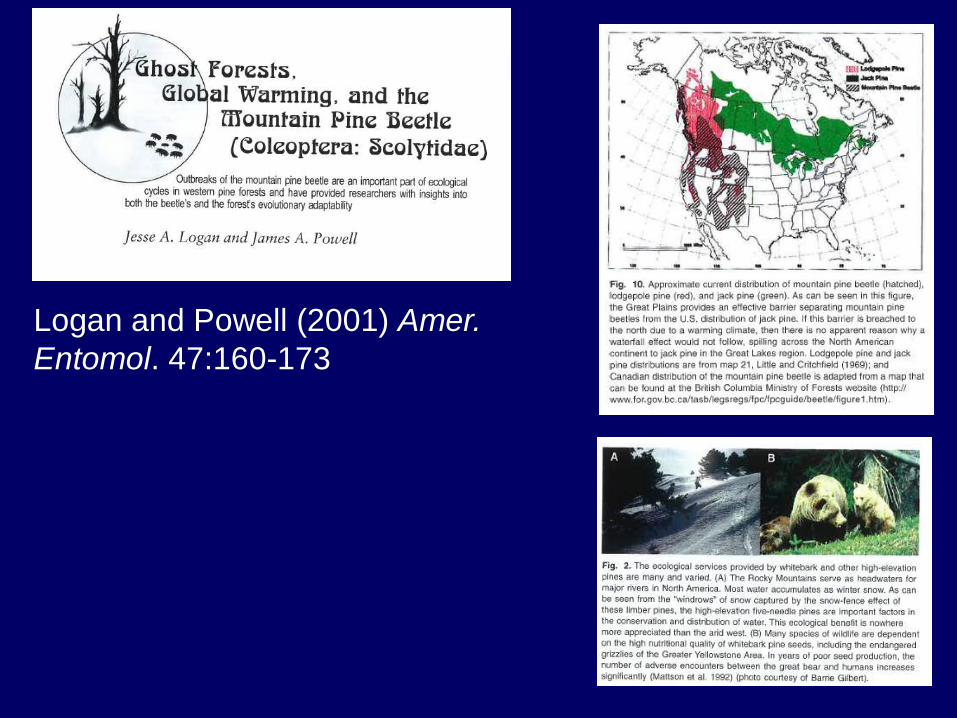
Logan and Powell (2001) Amer.
Entomol. 47:160-173
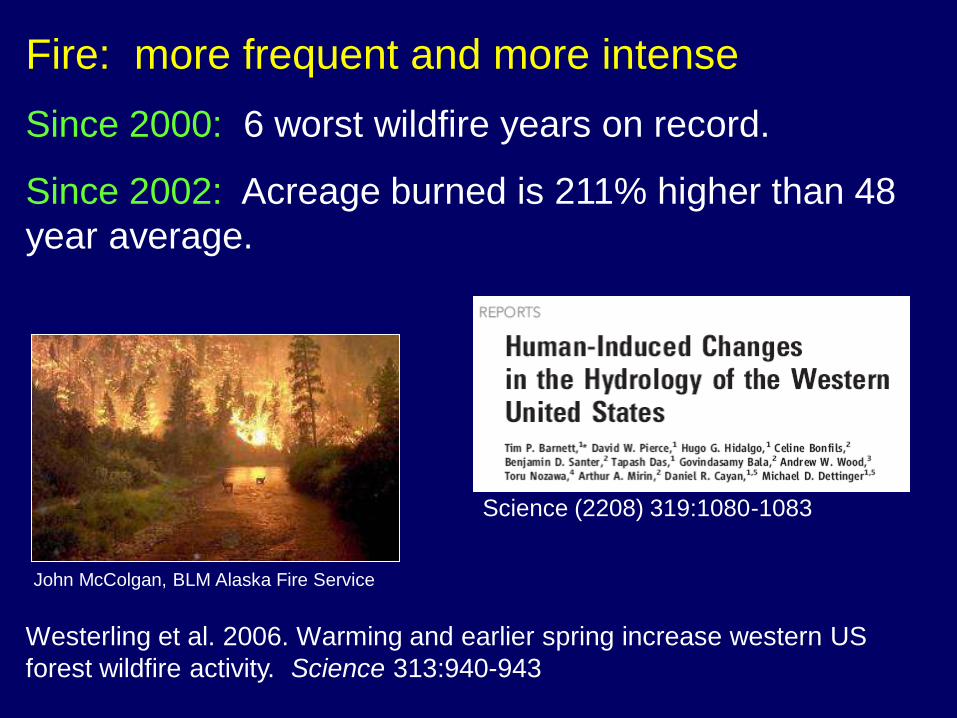
Fire: more frequent and more intense
Since 2000: 6 worst wildfire years on record.
Since 2002: Acreage burned is 211% higher than 48
year average.
John McColgan, BLM Alaska Fire Service
Westerling et al. 2006. Warming and earlier spring increase western US
forest wildfire activity. Science 313:940-943
Science (2208) 319:1080-1083
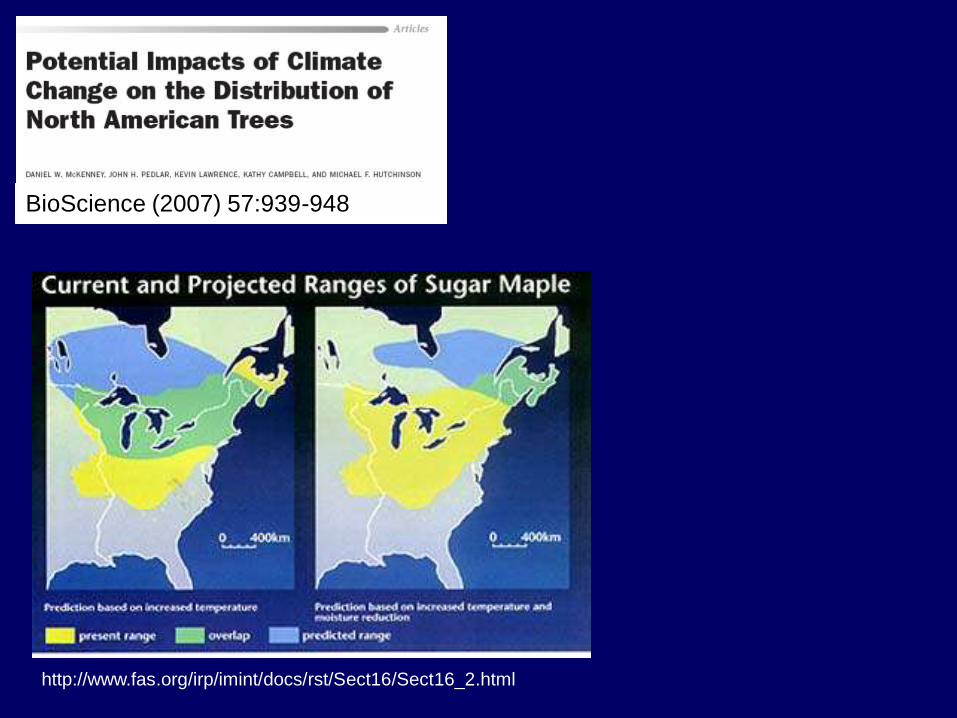
BioScience (2007) 57:939-948
http://www.fas.org/irp/imint/docs/rst/Sect16/Sect16_2.html
Implications of Climate
Change for Agricultural
Pest Management
OARDC SEEDS
Interdisciplinary Project
Robin A. J. Taylor John Cardina Department of Entomology Department of Horticulture & Crop Science Daniel A. Herms Richard H. Moore Department of Entomology Human and Community Resource Development
Phenological Modeling
1. Based on GFDL (NOAA) global circulation
model CM2-SRES-B1 scenario developed
for IPCC-4A
2. Assumes political will exists to stabilize
climate warming by 2050
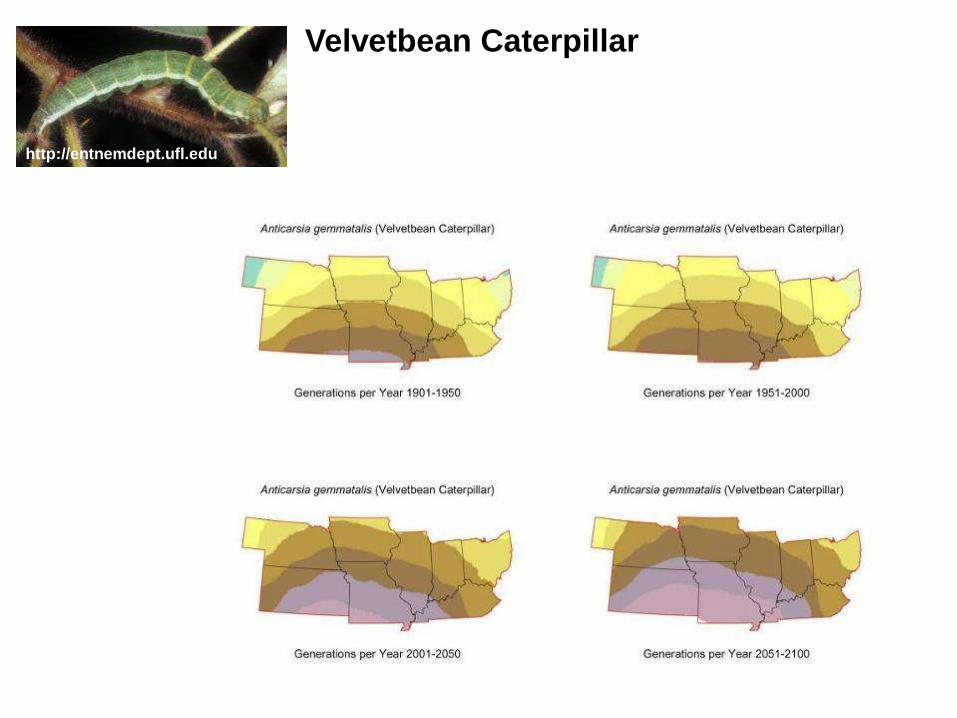
Velvetbean Caterpillar
http://entnemdept.ufl.edu
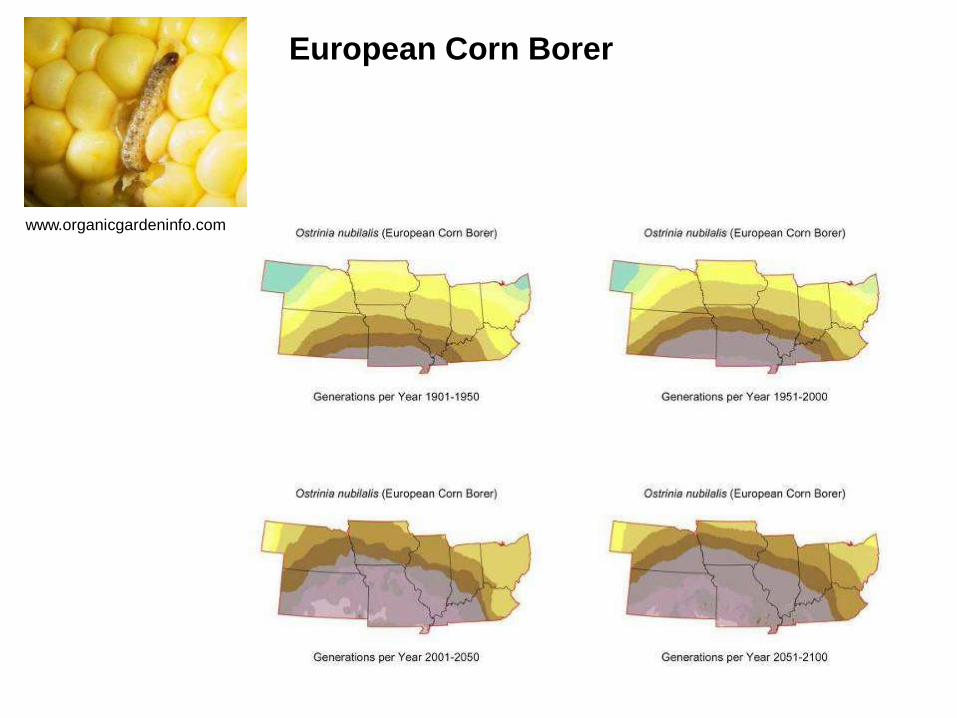
European Corn Borer
www.organicgardeninfo.com
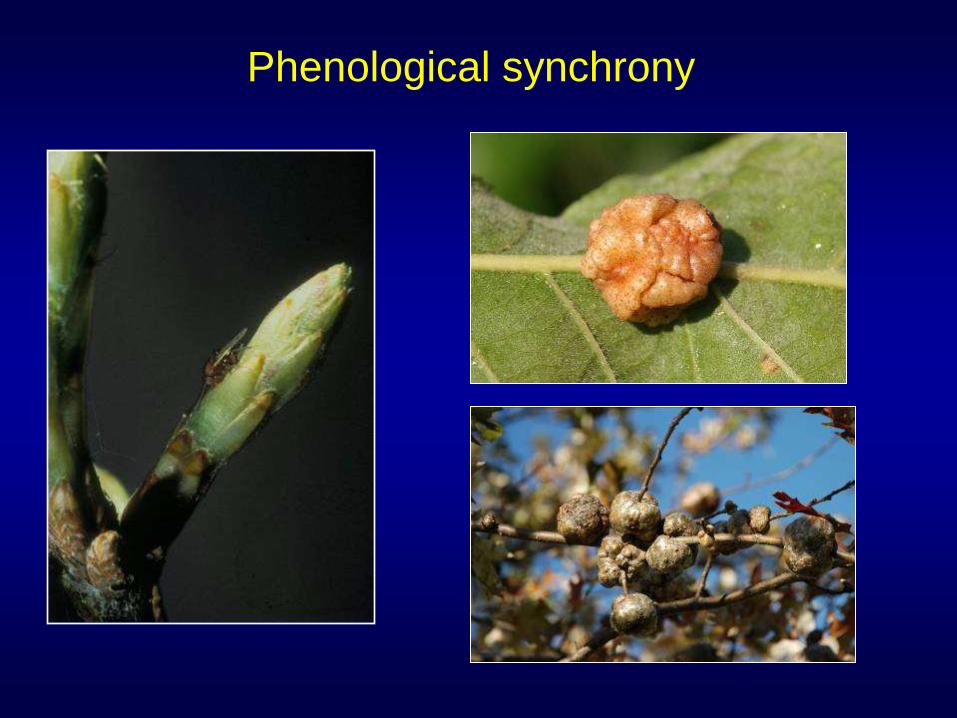
Phenological synchrony
Global warming and phenological
asynchrony
Interacting species with differential responses to
increased temperature. For example:
Plant - herbivore interactions
Plant - pollinator interactions
Predator-prey interactions
Bird migration and prey availability
Phenological Window Hypothesis
(Feeny 1976, Mattson et al. 1982)
- A “window” of time when host traits are
most suitable for the insect
- Predicts that insect growth and survival will decline as host-insect synchronicity is modified
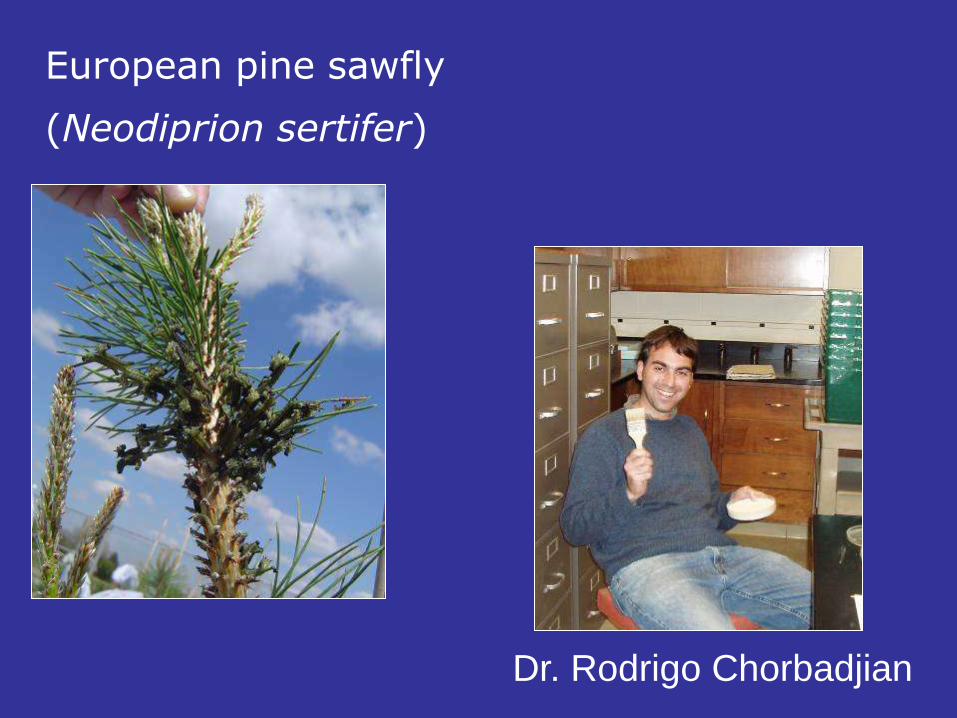
European pine sawfly
(Neodiprion sertifer)
Dr. Rodrigo Chorbadjian
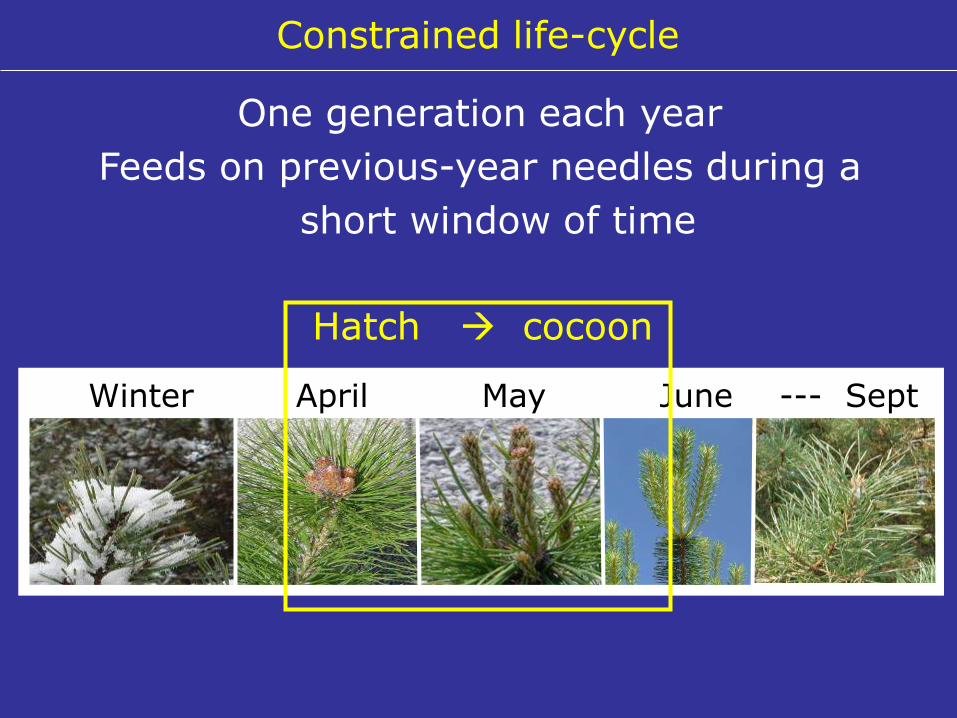
One generation each year
Feeds on previous-year needles during a
short window of time
Constrained life-cycle
Winter April May June --- Sept
Hatch cocoon
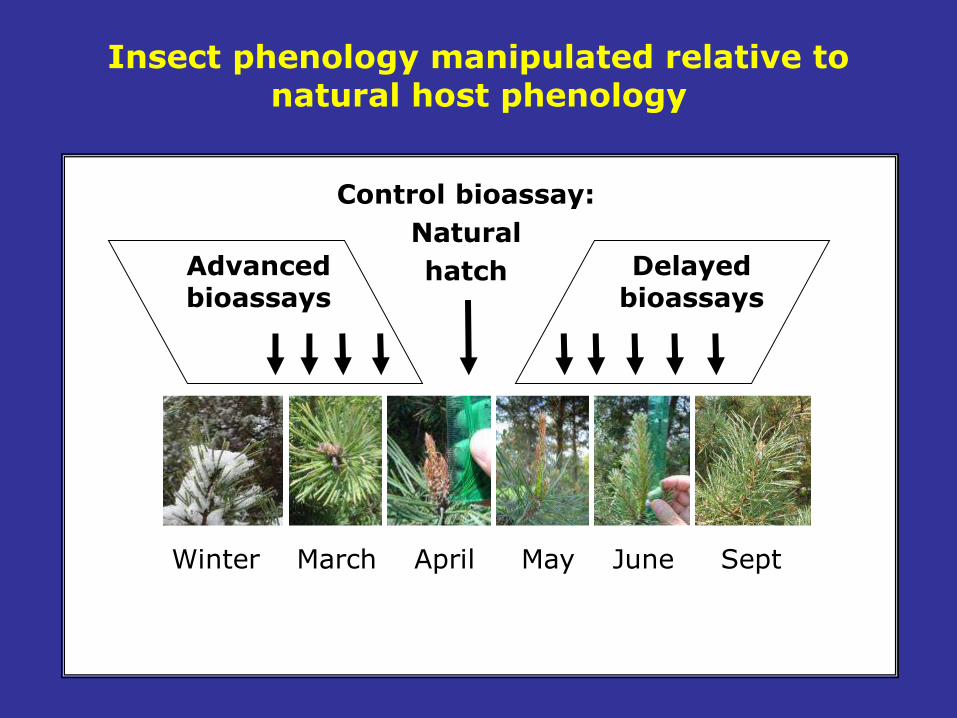
Insect phenology manipulated relative to natural host phenology
Delayed bioassays
Advanced bioassays
Control bioassay:
Natural
hatch
Winter March April May June Sept
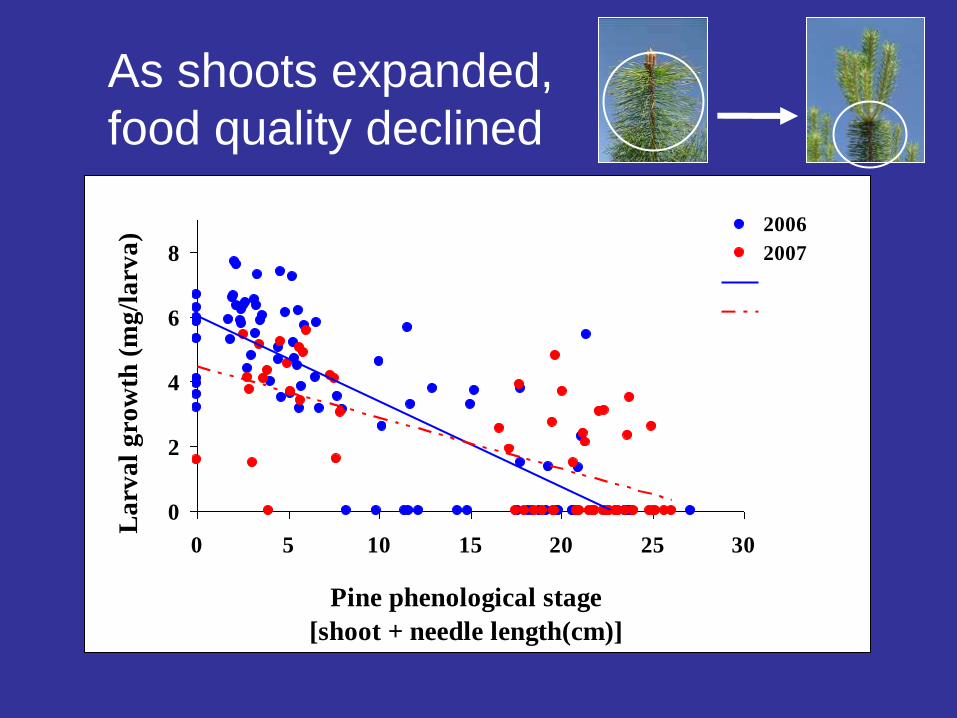
0
2
4
6
8
0 5 10 15 20 25 30
Pine phenological stage
[shoot + needle length(cm)]
La
rva
l g
row
th (
mg
/la
rva
) . 2006
2007
As shoots expanded,
food quality declined
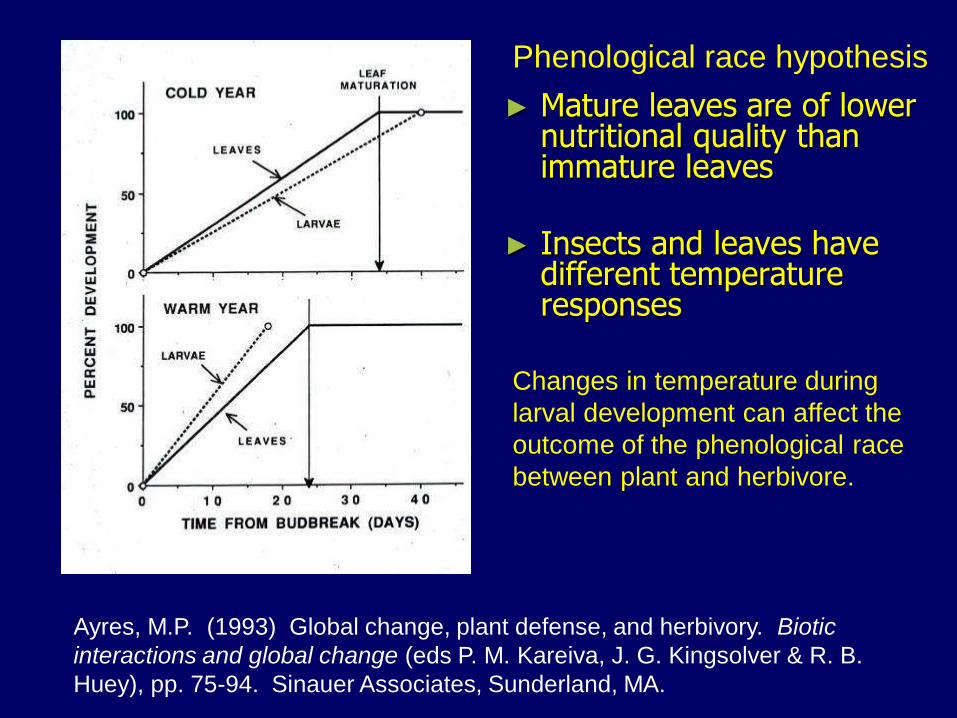
Ayres, M.P. (1993) Global change, plant defense, and herbivory. Biotic
interactions and global change (eds P. M. Kareiva, J. G. Kingsolver & R. B.
Huey), pp. 75-94. Sinauer Associates, Sunderland, MA.
Changes in temperature during
larval development can affect the
outcome of the phenological race
between plant and herbivore.
► Mature leaves are of lower nutritional quality than immature leaves
► Insects and leaves have different temperature responses
Phenological race hypothesis
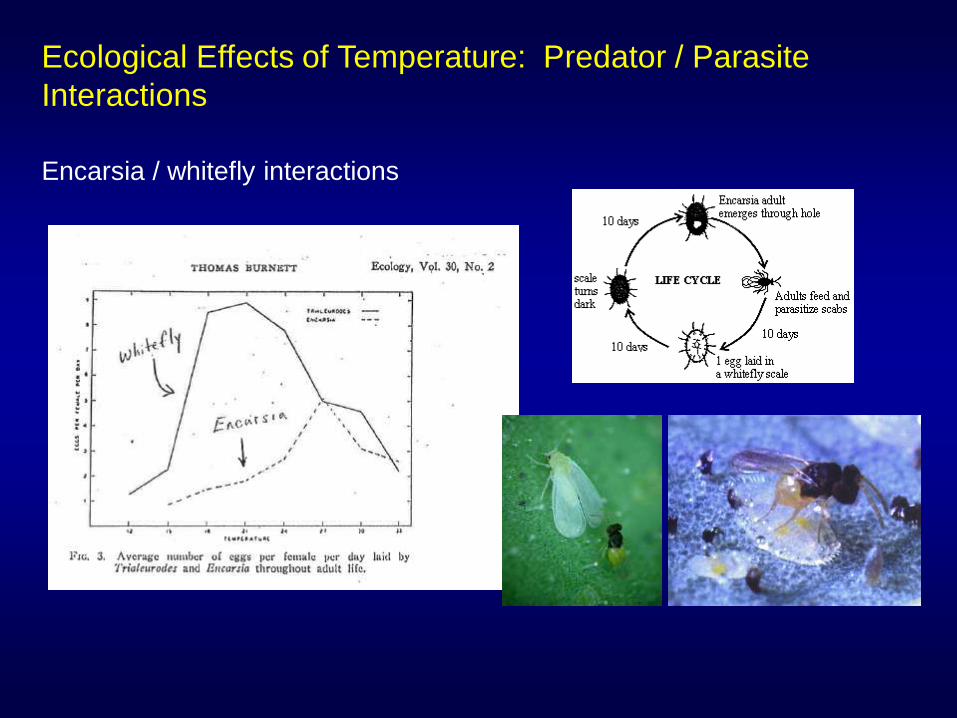
Ecological Effects of Temperature: Predator / Parasite
Interactions
Encarsia / whitefly interactions
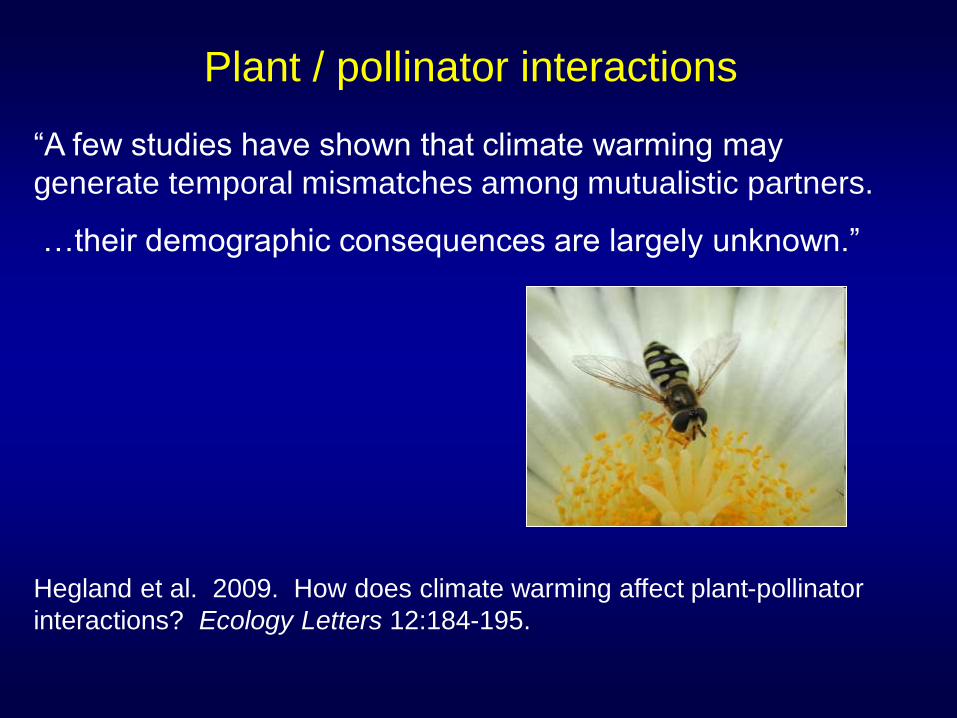
Plant / pollinator interactions
“A few studies have shown that climate warming may
generate temporal mismatches among mutualistic partners.
…their demographic consequences are largely unknown.”
Hegland et al. 2009. How does climate warming affect plant-pollinator
interactions? Ecology Letters 12:184-195.
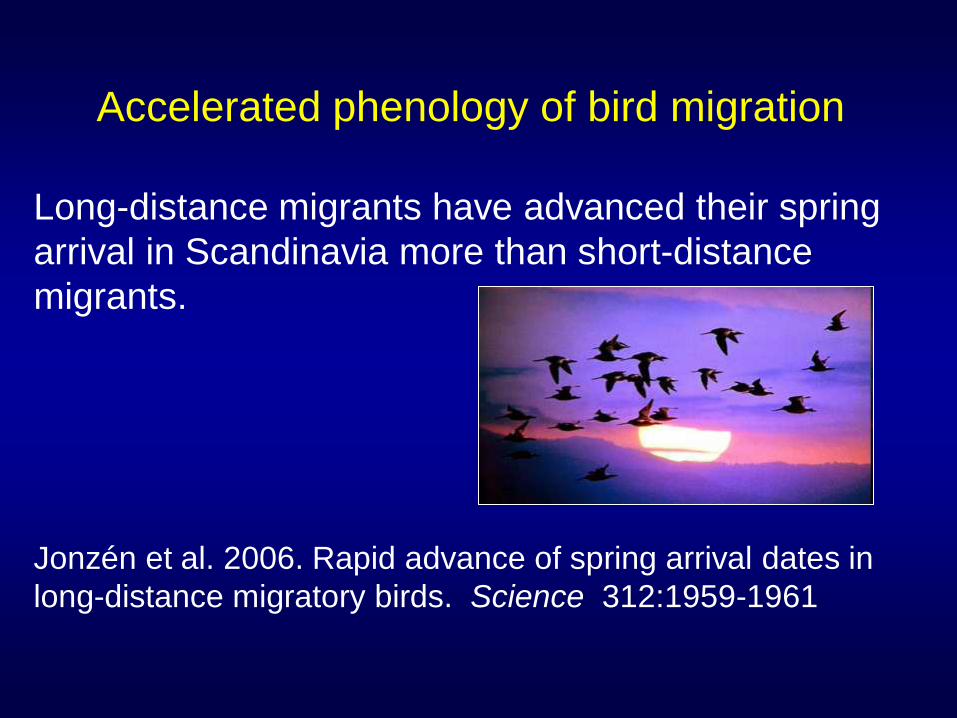
Accelerated phenology of bird migration
Long-distance migrants have advanced their spring
arrival in Scandinavia more than short-distance
migrants.
Jonzén et al. 2006. Rapid advance of spring arrival dates in
long-distance migratory birds. Science 312:1959-1961
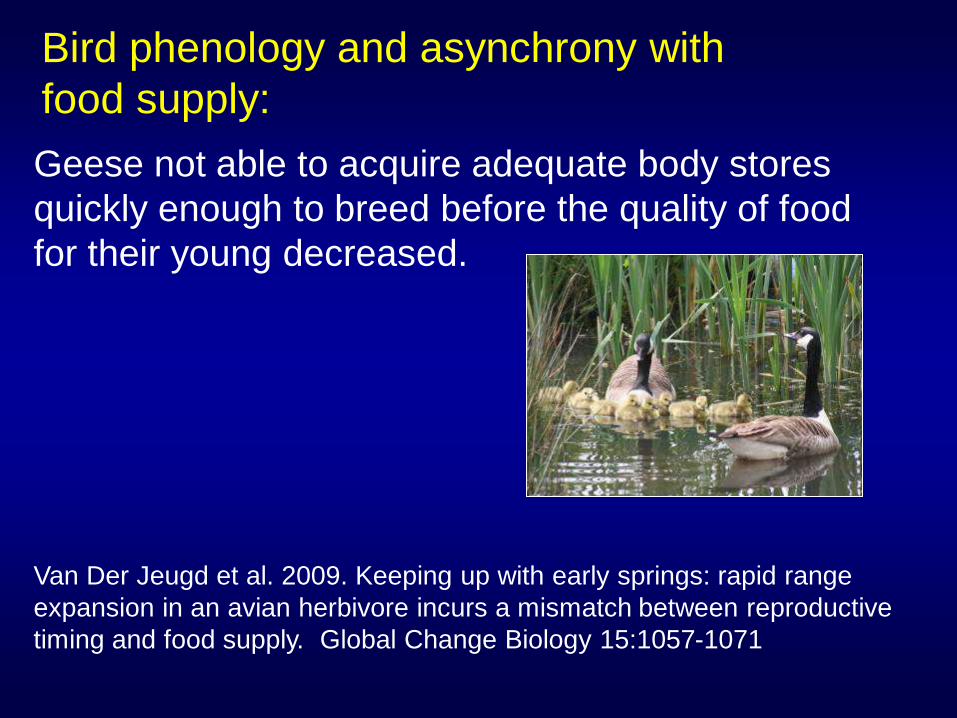
Bird phenology and asynchrony with
food supply:
Geese not able to acquire adequate body stores
quickly enough to breed before the quality of food
for their young decreased.
Van Der Jeugd et al. 2009. Keeping up with early springs: rapid range
expansion in an avian herbivore incurs a mismatch between reproductive
timing and food supply. Global Change Biology 15:1057-1071

Key premise: phenological sequence
remains constant from year-to-year.
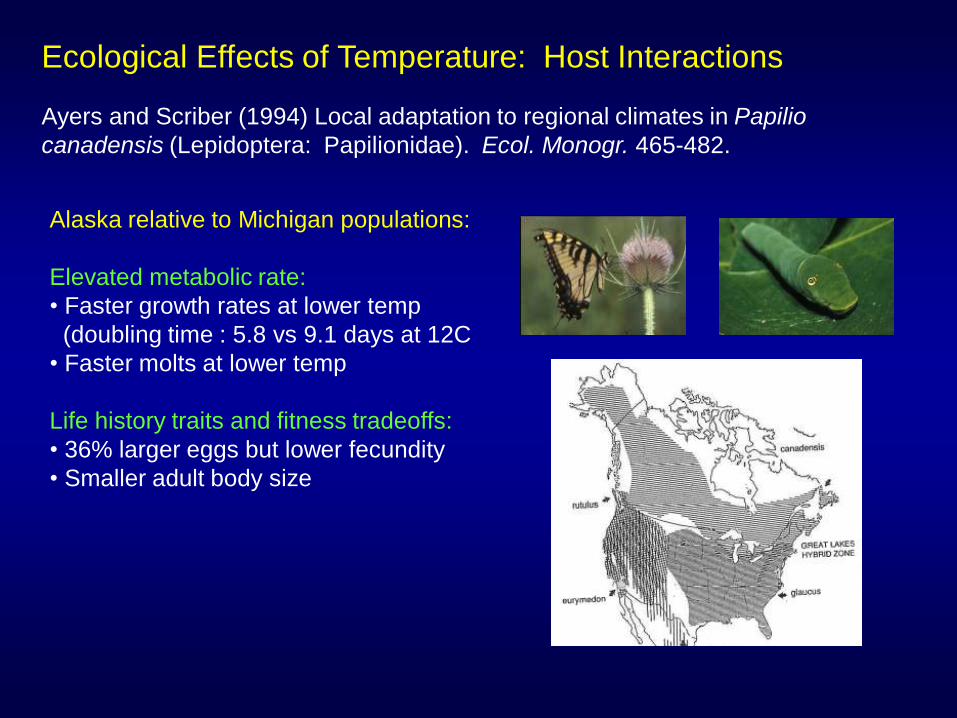
Ecological Effects of Temperature: Host Interactions
Ayers and Scriber (1994) Local adaptation to regional climates in Papilio
canadensis (Lepidoptera: Papilionidae). Ecol. Monogr. 465-482.
Alaska relative to Michigan populations:
Elevated metabolic rate:
• Faster growth rates at lower temp
(doubling time : 5.8 vs 9.1 days at 12C
• Faster molts at lower temp
Life history traits and fitness tradeoffs:
• 36% larger eggs but lower fecundity
• Smaller adult body size
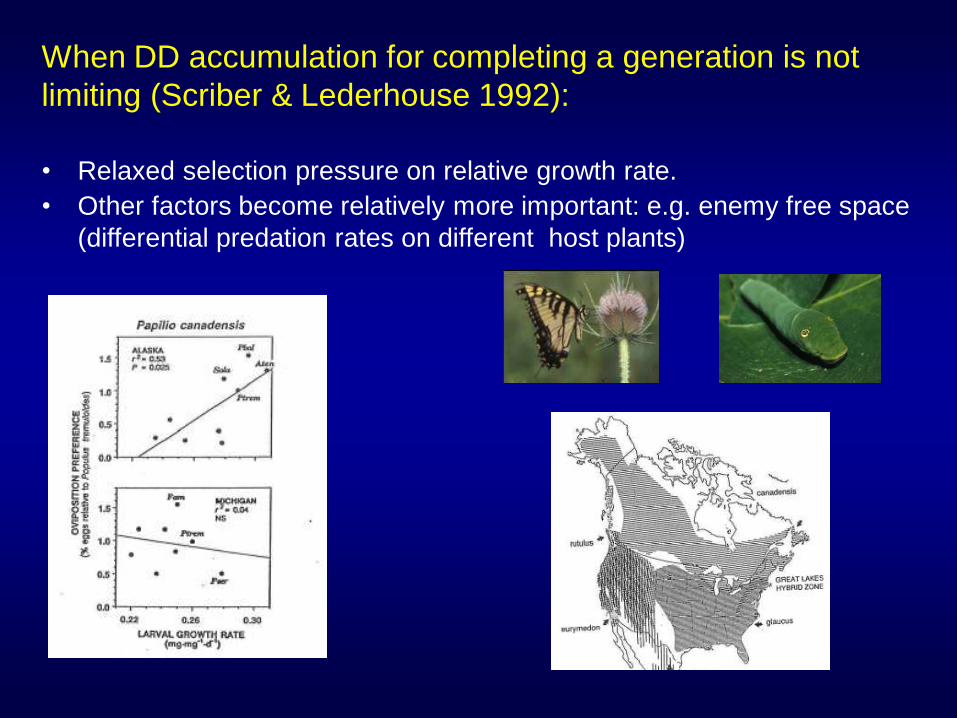
When DD accumulation for completing a generation is not
limiting (Scriber & Lederhouse 1992):
• Relaxed selection pressure on relative growth rate.
• Other factors become relatively more important: e.g. enemy free space
(differential predation rates on different host plants)
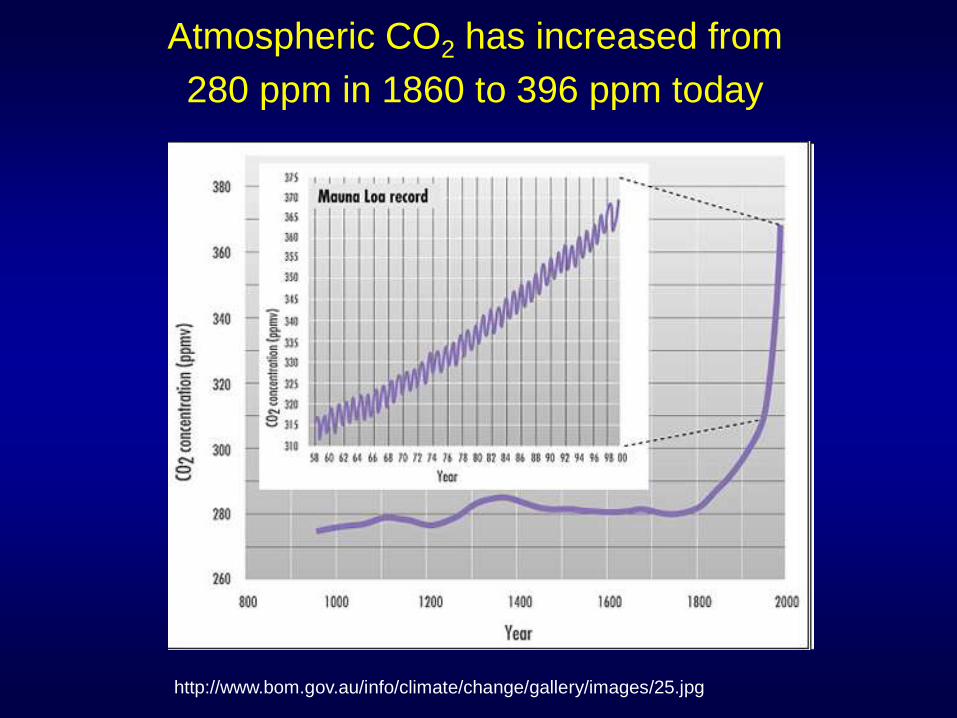
Atmospheric CO2 has increased from
280 ppm in 1860 to 396 ppm today
http://www.bom.gov.au/info/climate/change/gallery/images/25.jpg
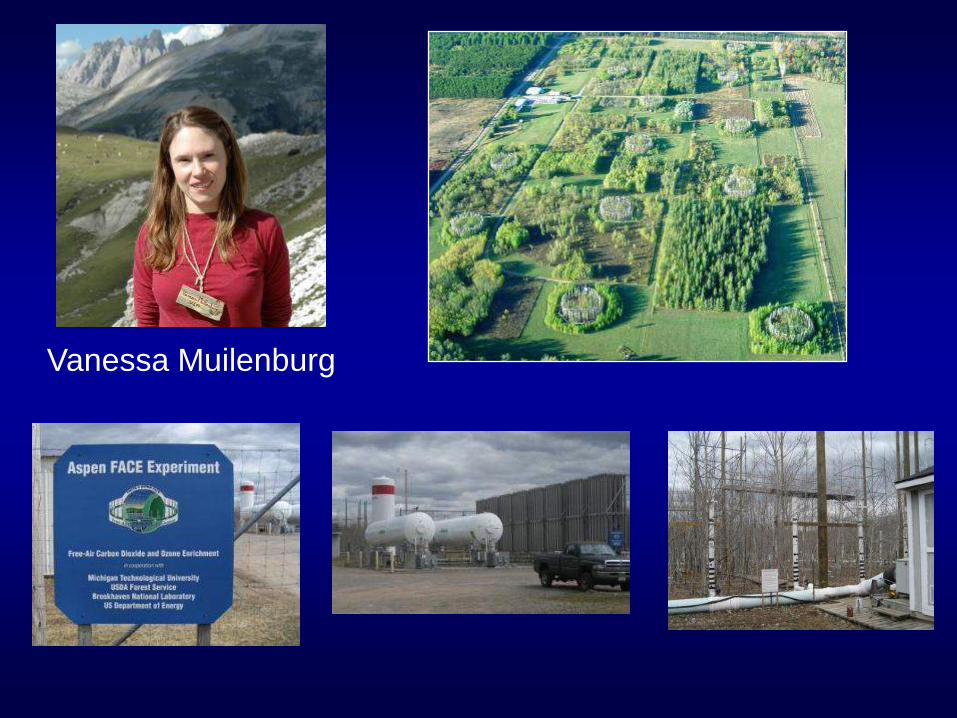
Vanessa Muilenburg
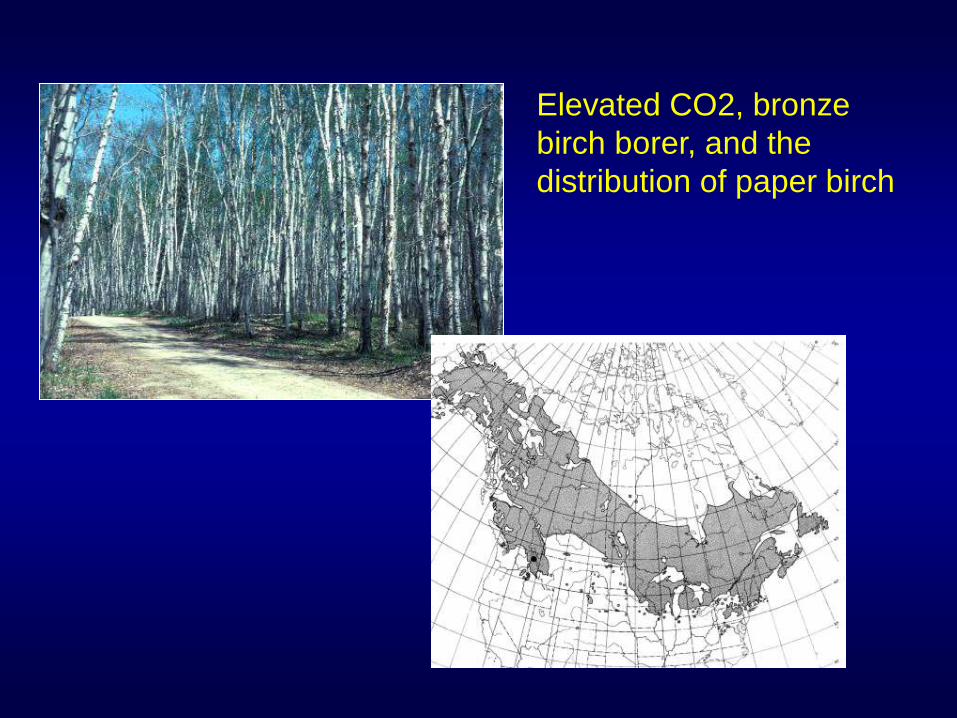
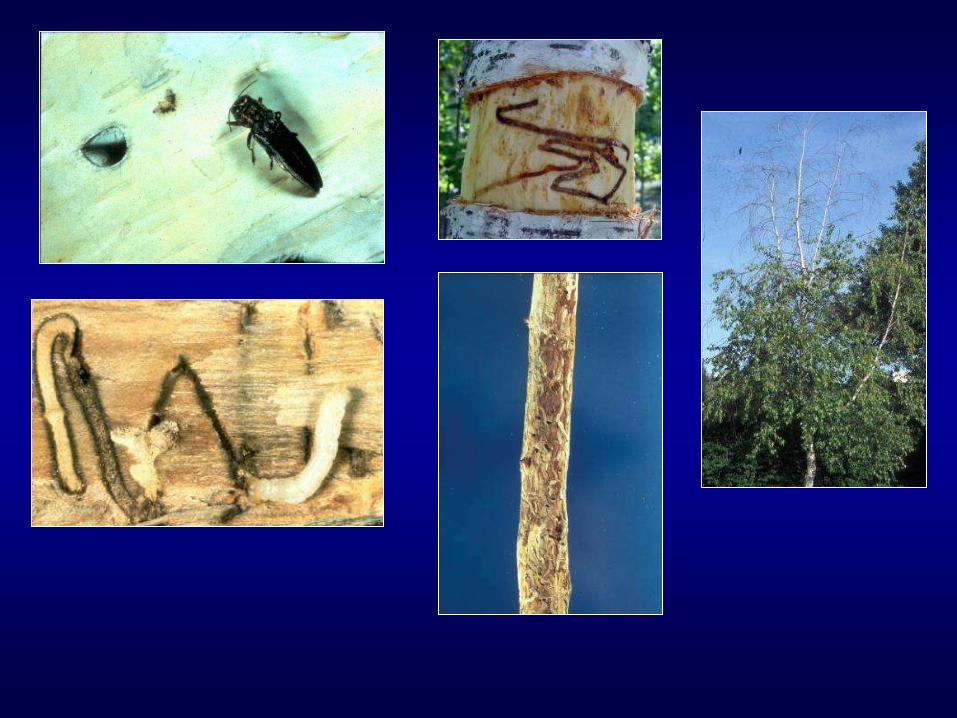
Elevated CO2, bronze
birch borer, and the
distribution of paper birch
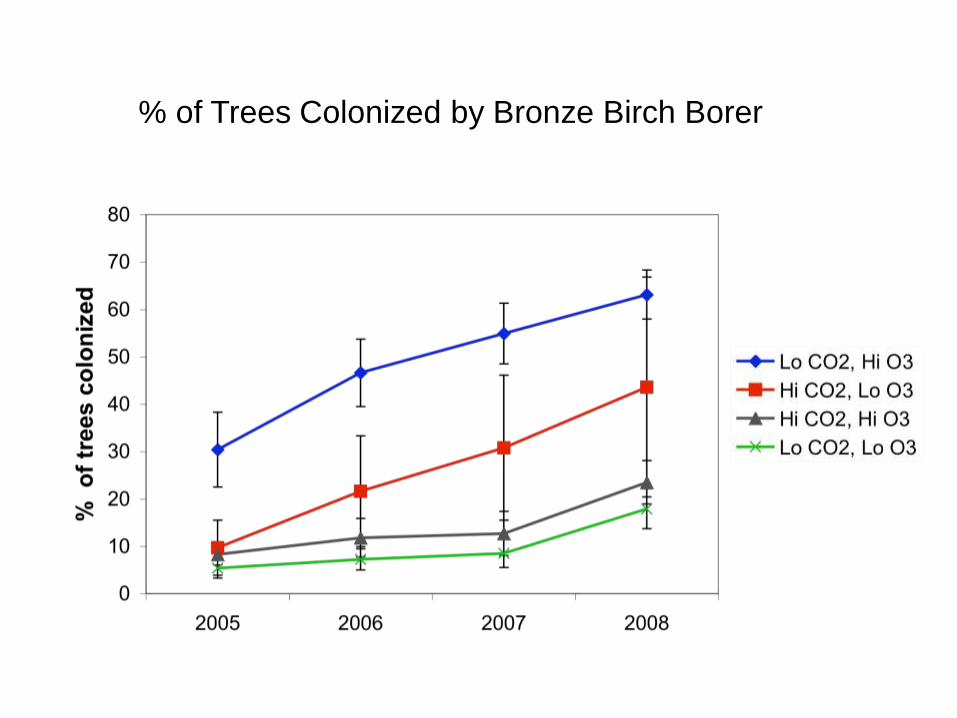
% of Trees Colonized by Bronze Birch Borer

Elevated CO2, bronze
birch borer, and the
distribution of paper birch
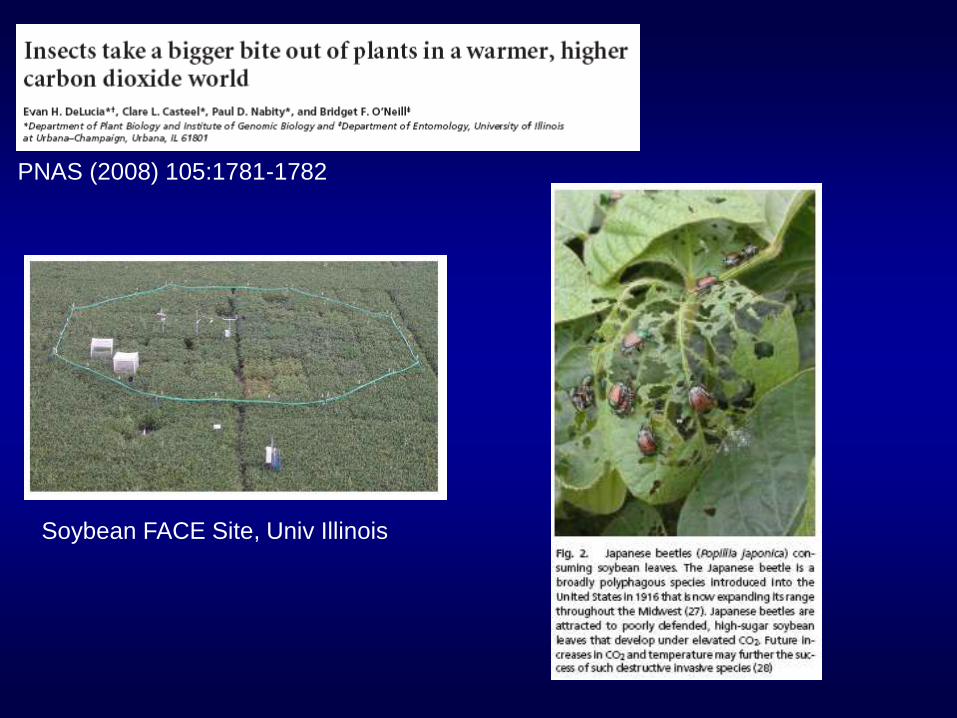
PNAS (2008) 105:1781-1782
Soybean FACE Site, Univ Illinois
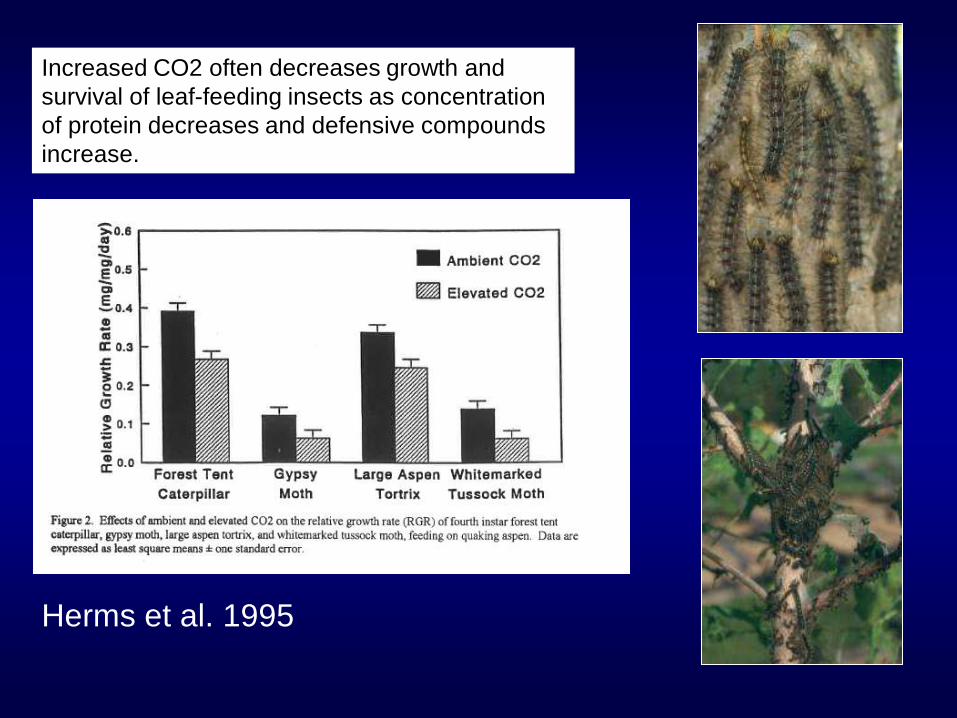
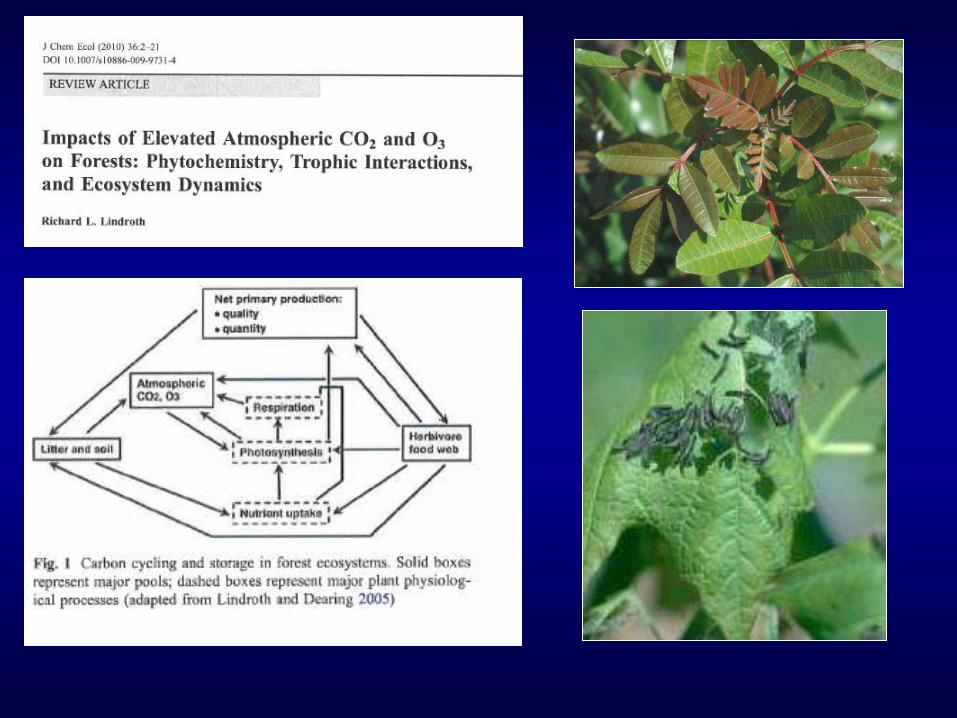
Increased CO2 often decreases growth and
survival of leaf-feeding insects as concentration
of protein decreases and defensive compounds
increase.
Herms et al. 1995
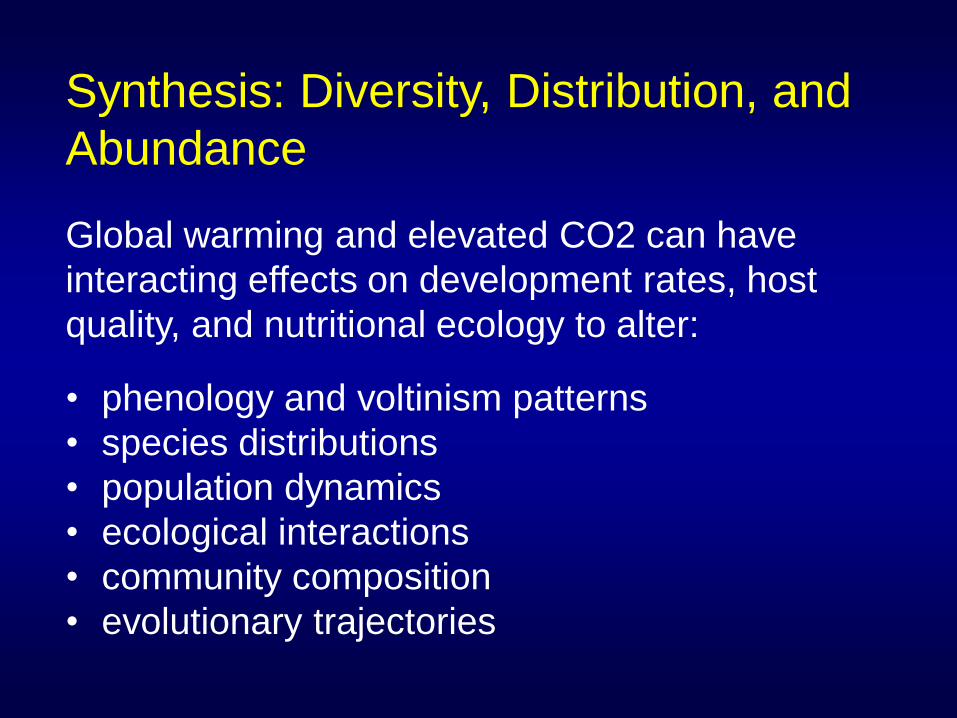
Synthesis: Diversity, Distribution, and
Abundance
Global warming and elevated CO2 can have
interacting effects on development rates, host
quality, and nutritional ecology to alter:
• phenology and voltinism patterns
• species distributions
• population dynamics
• ecological interactions
• community composition
• evolutionary trajectories
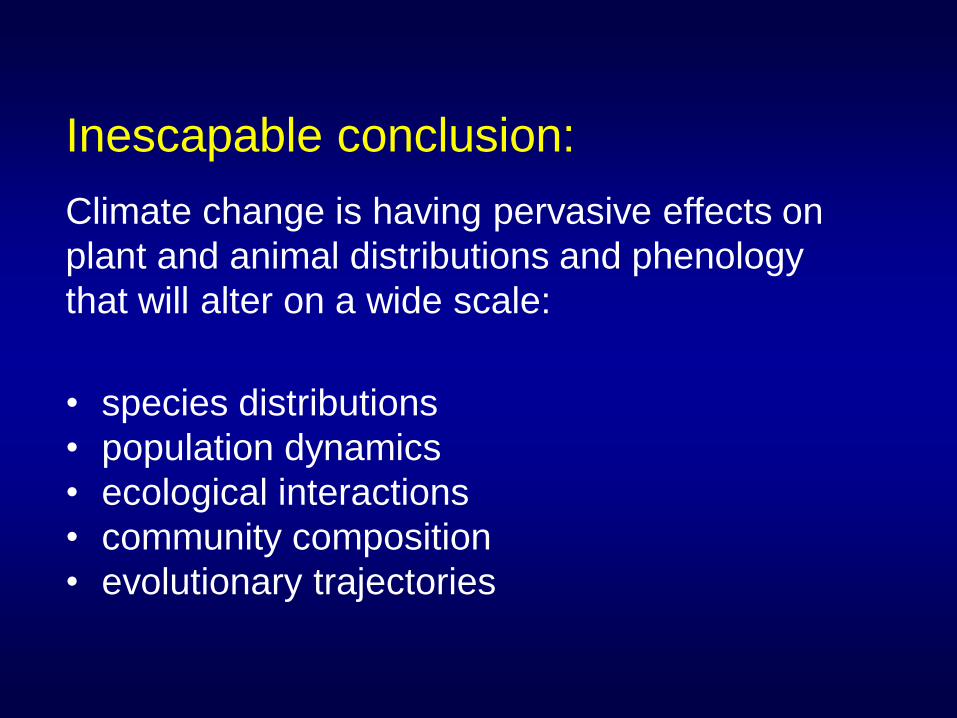
Inescapable conclusion:
Climate change is having pervasive effects on
plant and animal distributions and phenology
that will alter on a wide scale:
• species distributions
• population dynamics
• ecological interactions
• community composition
• evolutionary trajectories
Acknowledgements:
Dr. Matthew Ayres, Dartmouth College
Dr. Lyn Loveless, College of Wooster