Embed Size (px)
Citation preview
PHEV BATTERY COST ASSESSMENT
es_02_barnett
Brian BarnettDavid OferYong YangBookeun OhJane Rempel
TIAX LLCMay 19, 2009
Chris McCoyTodd RhodesMildred HastbackaSuresh Sririramulu
This presentation does not contain any proprietary, confidential, or otherwise restricted information
2009 DOE Merit Review
1
Objective
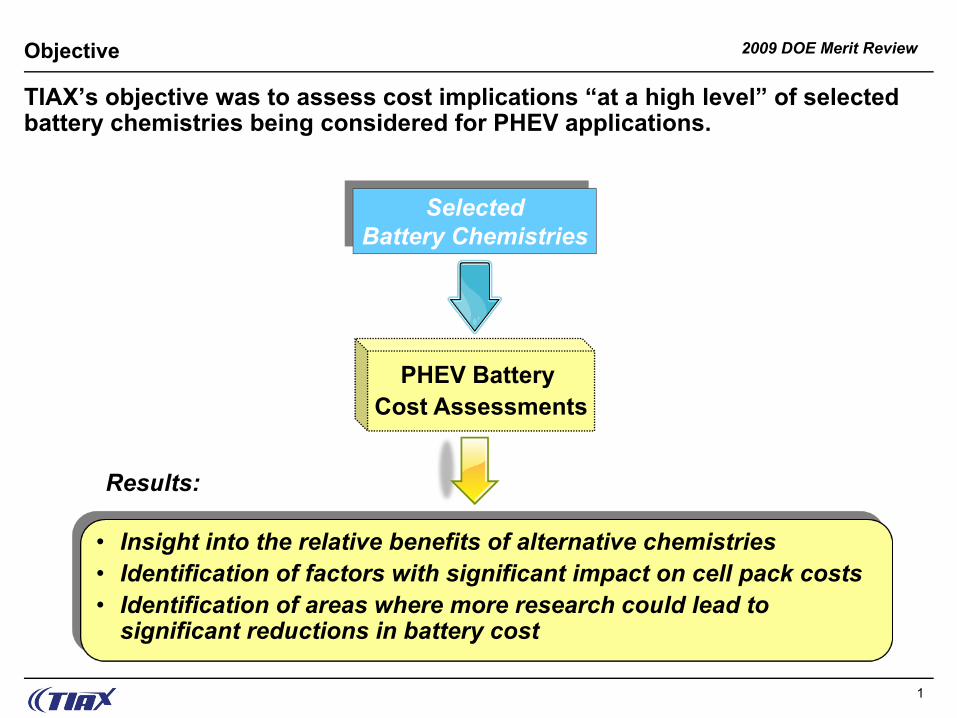
TIAX’s objective was to assess cost implications “at a high level” of selected battery chemistries being considered for PHEV applications.
PHEV Battery Cost Assessments
SelectedBattery Chemistries
• Insight into the relative benefits of alternative chemistries• Identification of factors with significant impact on cell pack costs• Identification of areas where more research could lead to
significant reductions in battery cost
Results:
2009 DOE Merit Review
2
Approach
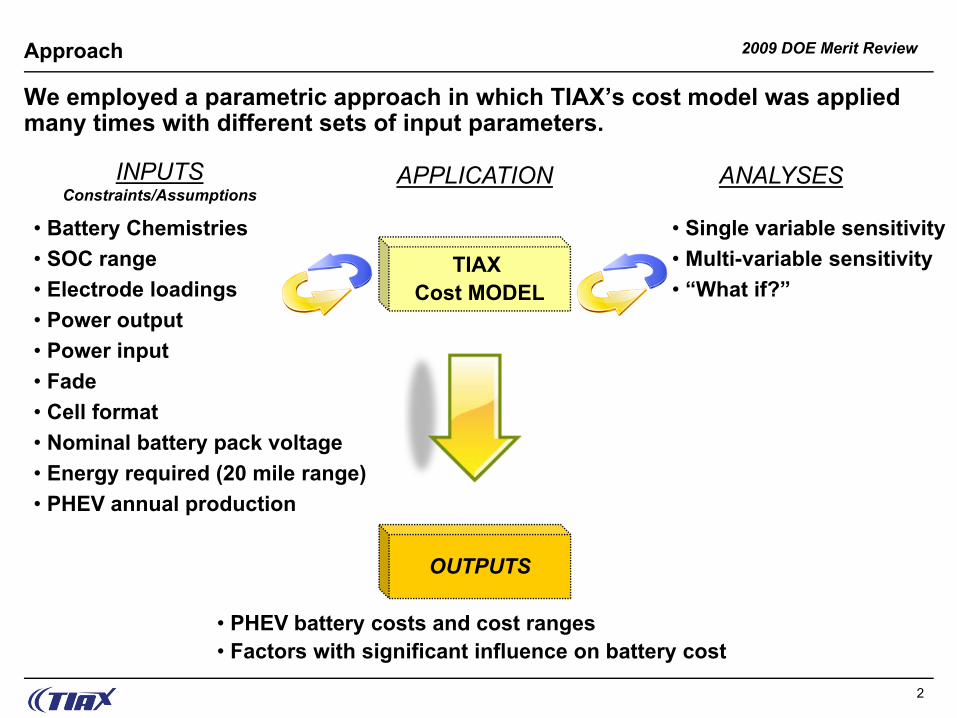
We employed a parametric approach in which TIAX’s cost model was applied many times with different sets of input parameters.
TIAX Cost MODEL
INPUTSConstraints/Assumptions
APPLICATION ANALYSES
• Battery Chemistries• SOC range• Electrode loadings• Power output• Power input• Fade• Cell format• Nominal battery pack voltage• Energy required (20 mile range)• PHEV annual production
• Single variable sensitivity• Multi-variable sensitivity• “What if?”
• PHEV battery costs and cost ranges• Factors with significant influence on battery cost
OUTPUTS
2009 DOE Merit Review
3
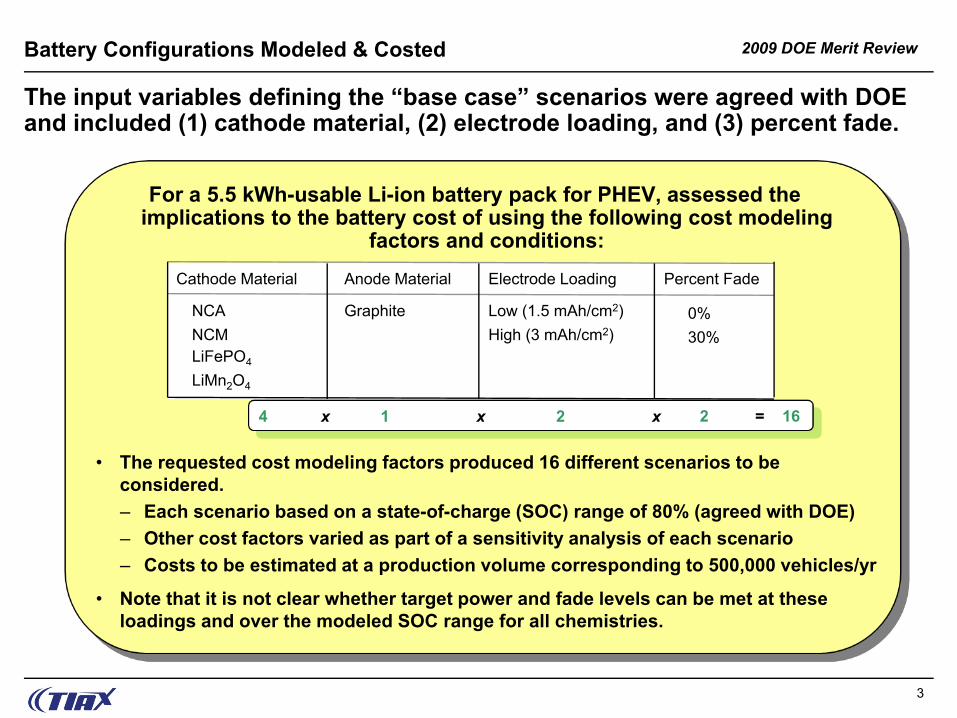
The input variables defining the “base case” scenarios were agreed with DOE and included (1) cathode material, (2) electrode loading, and (3) percent fade.
4 x 1 x 2 x 2 = 16
• The requested cost modeling factors produced 16 different scenarios to be considered.– Each scenario based on a state-of-charge (SOC) range of 80% (agreed with DOE)– Other cost factors varied as part of a sensitivity analysis of each scenario– Costs to be estimated at a production volume corresponding to 500,000 vehicles/yr
• Note that it is not clear whether target power and fade levels can be met at these loadings and over the modeled SOC range for all chemistries.
For a 5.5 kWh-usable Li-ion battery pack for PHEV, assessed the implications to the battery cost of using the following cost modeling
factors and conditions:
Battery Configurations Modeled & Costed
Cathode Material Anode Material Electrode Loading Percent Fade
Graphite Low (1.5 mAh/cm2) 0%30%High (3 mAh/cm2)
NCANCMLiFePO4
LiMn2O4
2009 DOE Merit Review
4
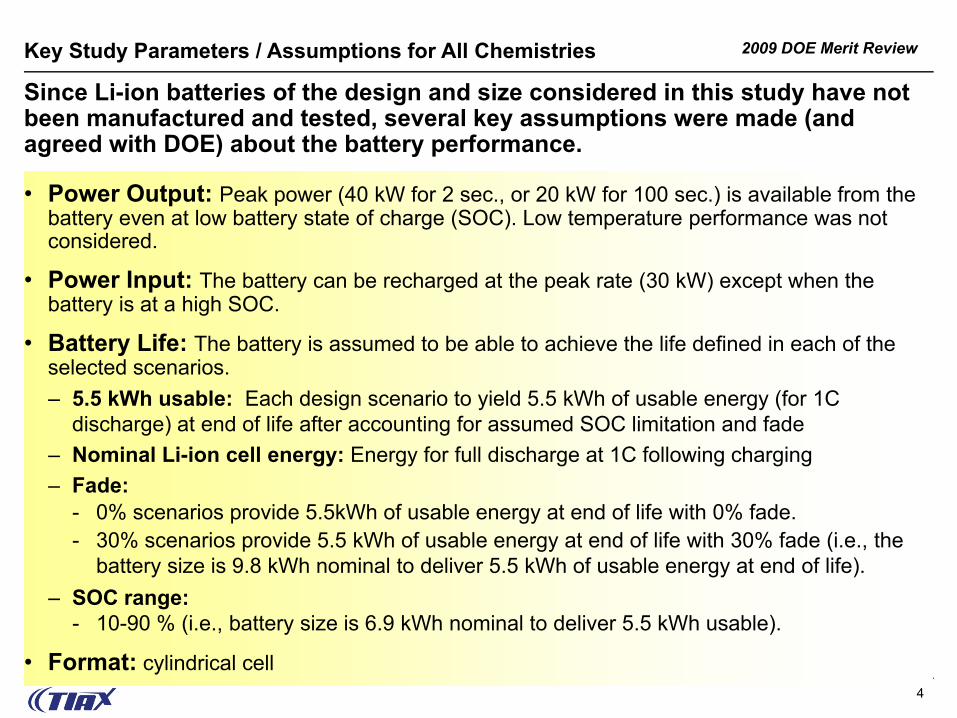
Since Li-ion batteries of the design and size considered in this study have not been manufactured and tested, several key assumptions were made (and agreed with DOE) about the battery performance.
• Power Output: Peak power (40 kW for 2 sec., or 20 kW for 100 sec.) is available from the battery even at low battery state of charge (SOC). Low temperature performance was not considered.
• Power Input: The battery can be recharged at the peak rate (30 kW) except when the battery is at a high SOC.
• Battery Life: The battery is assumed to be able to achieve the life defined in each of the selected scenarios.– 5.5 kWh usable: Each design scenario to yield 5.5 kWh of usable energy (for 1C
discharge) at end of life after accounting for assumed SOC limitation and fade– Nominal Li-ion cell energy: Energy for full discharge at 1C following charging– Fade:
- 0% scenarios provide 5.5kWh of usable energy at end of life with 0% fade.- 30% scenarios provide 5.5 kWh of usable energy at end of life with 30% fade (i.e., the
battery size is 9.8 kWh nominal to deliver 5.5 kWh of usable energy at end of life). – SOC range:
- 10-90 % (i.e., battery size is 6.9 kWh nominal to deliver 5.5 kWh usable).
• Format: cylindrical cell
Key Study Parameters / Assumptions for All Chemistries
2009 DOE Merit Review
5
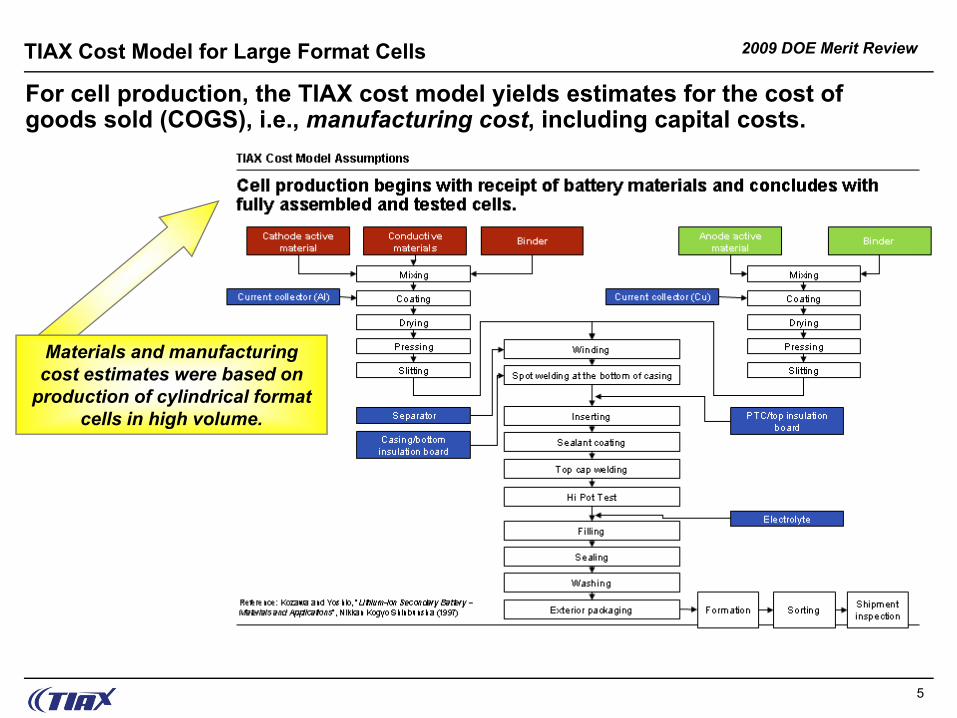
For cell production, the TIAX cost model yields estimates for the cost of goods sold (COGS), i.e., manufacturing cost, including capital costs.
TIAX Cost Model for Large Format Cells
Materials and manufacturing cost estimates were based on
production of cylindrical format cells in high volume.
2009 DOE Merit Review
6
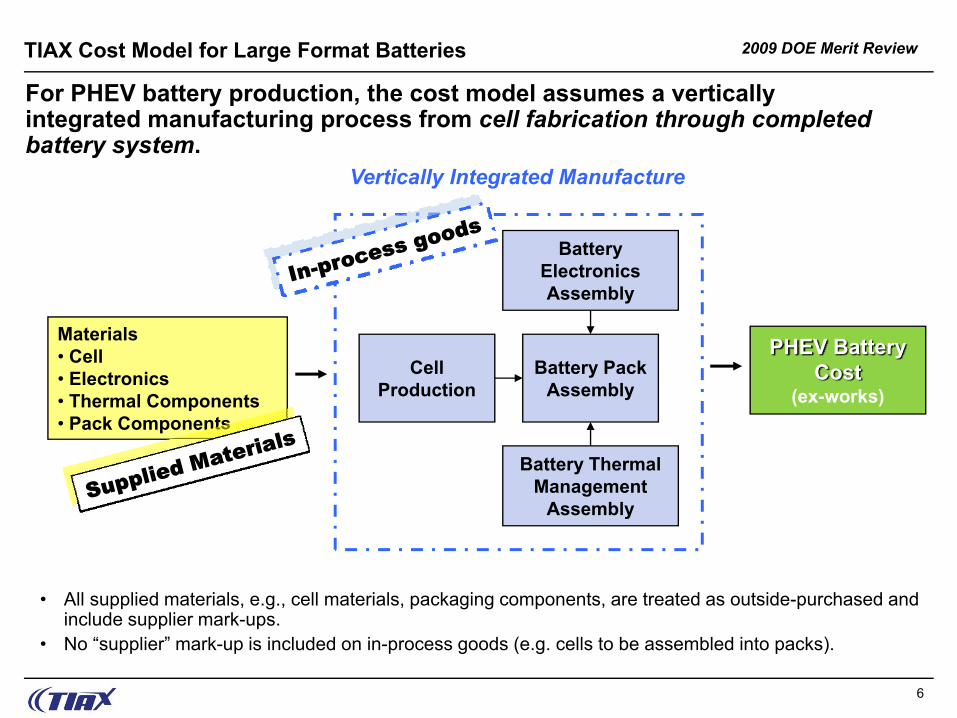
For PHEV battery production, the cost model assumes a vertically integrated manufacturing process from cell fabrication through completed battery system.
Cell Production
Battery Pack Assembly
Battery Electronics Assembly
Vertically Integrated Manufacture
PHEV Battery Cost
(ex-works)
Materials• Cell • Electronics• Thermal Components• Pack Components
Battery Thermal Management
Assembly
• All supplied materials, e.g., cell materials, packaging components, are treated as outside-purchased and include supplier mark-ups.
• No “supplier” mark-up is included on in-process goods (e.g. cells to be assembled into packs).
TIAX Cost Model for Large Format Batteries
2009 DOE Merit Review
7
Note:
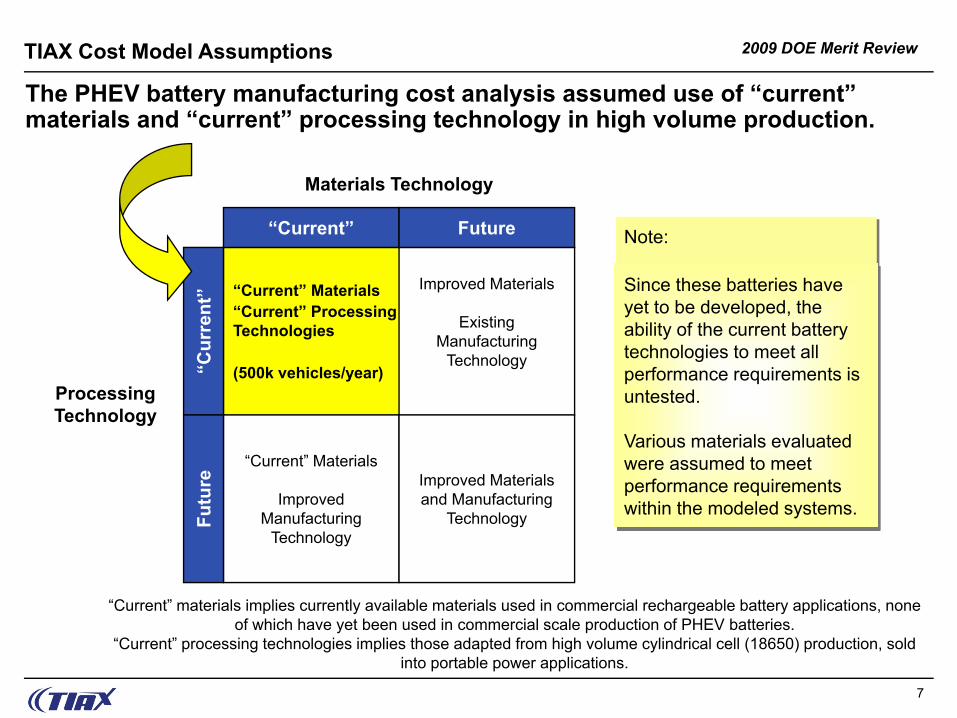
The PHEV battery manufacturing cost analysis assumed use of “current” materials and “current” processing technology in high volume production.
“Current” Materials“Current” Processing Technologies
(500k vehicles/year)
Improved Materials
Existing Manufacturing
Technology
“Current” Materials
Improved Manufacturing
Technology
Improved Materials and Manufacturing
Technology
“Current” Future“C
urre
nt”
Futu
re
Processing Technology
Materials Technology
TIAX Cost Model Assumptions
“Current” materials implies currently available materials used in commercial rechargeable battery applications, none of which have yet been used in commercial scale production of PHEV batteries.
“Current” processing technologies implies those adapted from high volume cylindrical cell (18650) production, sold into portable power applications.
Since these batteries have yet to be developed, the ability of the current battery technologies to meet all performance requirements is untested.
Various materials evaluated were assumed to meet performance requirements within the modeled systems.
2009 DOE Merit Review
8
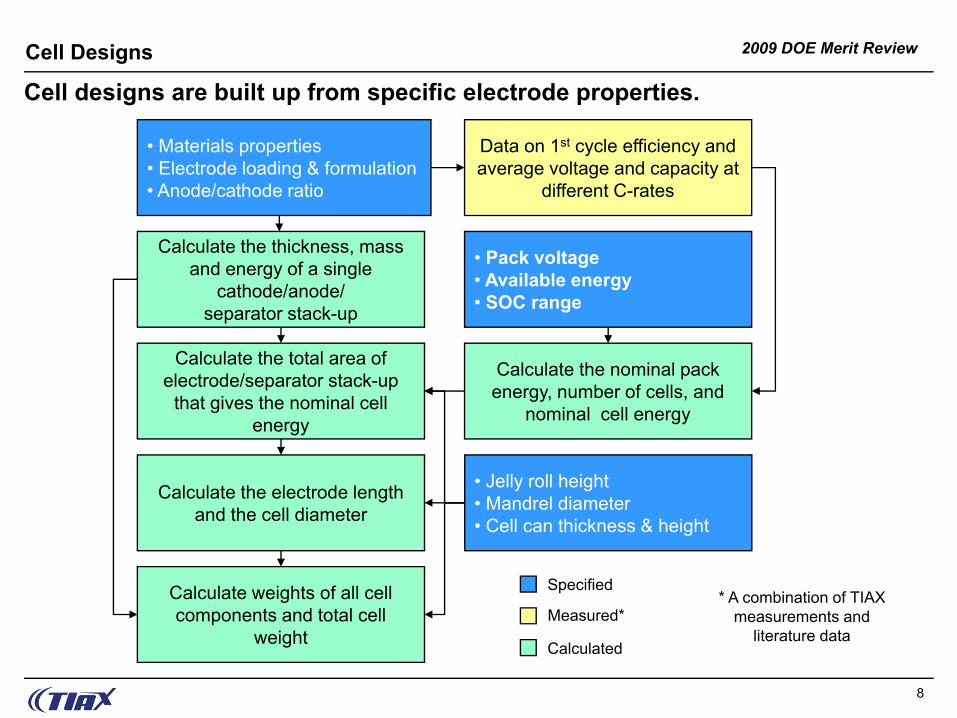
Cell designs are built up from specific electrode properties.
• Materials properties • Electrode loading & formulation• Anode/cathode ratio
Calculate the total area of electrode/separator stack-up
that gives the nominal cell energy
Calculate the electrode length and the cell diameter
• Jelly roll height• Mandrel diameter • Cell can thickness & height
Calculate weights of all cell components and total cell
weight
Data on 1st cycle efficiency and average voltage and capacity at
different C-rates
Specified
Measured*
Calculated
Calculate the thickness, mass and energy of a single
cathode/anode/separator stack-up
Calculate the nominal pack energy, number of cells, and
nominal cell energy
• Pack voltage• Available energy• SOC range
* A combination of TIAX measurements and
literature data
Cell Designs
2009 DOE Merit Review
9
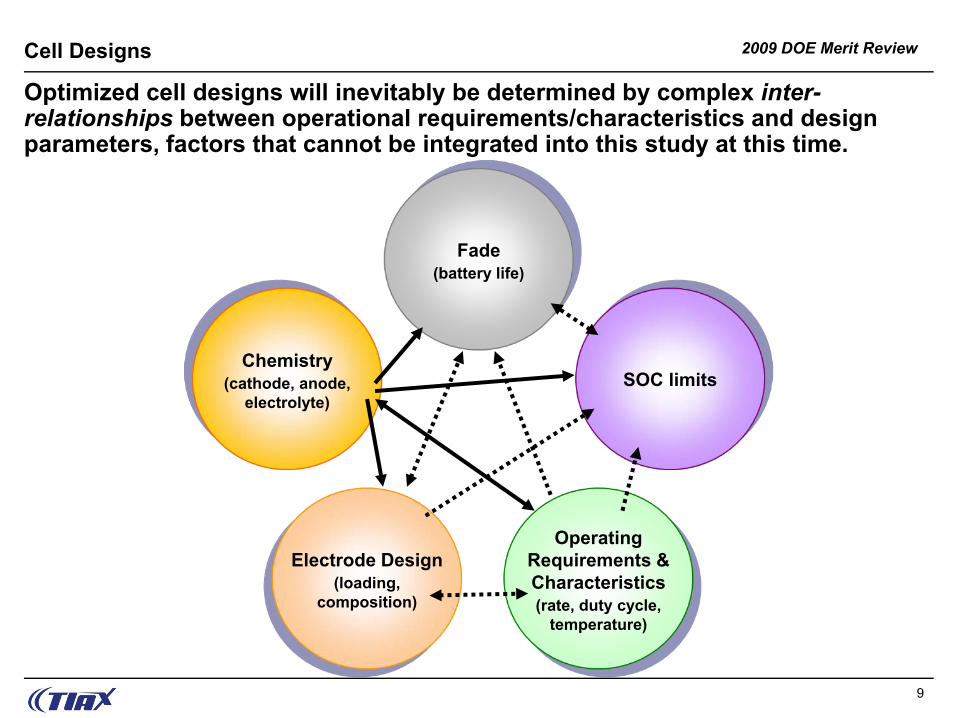
Optimized cell designs will inevitably be determined by complex inter-relationships between operational requirements/characteristics and design parameters, factors that cannot be integrated into this study at this time.
Chemistry(cathode, anode,
electrolyte)
Fade(battery life)
SOC limits
Electrode Design(loading,
composition)
Operating Requirements & Characteristics(rate, duty cycle,
temperature)
Cell Designs
2009 DOE Merit Review
10
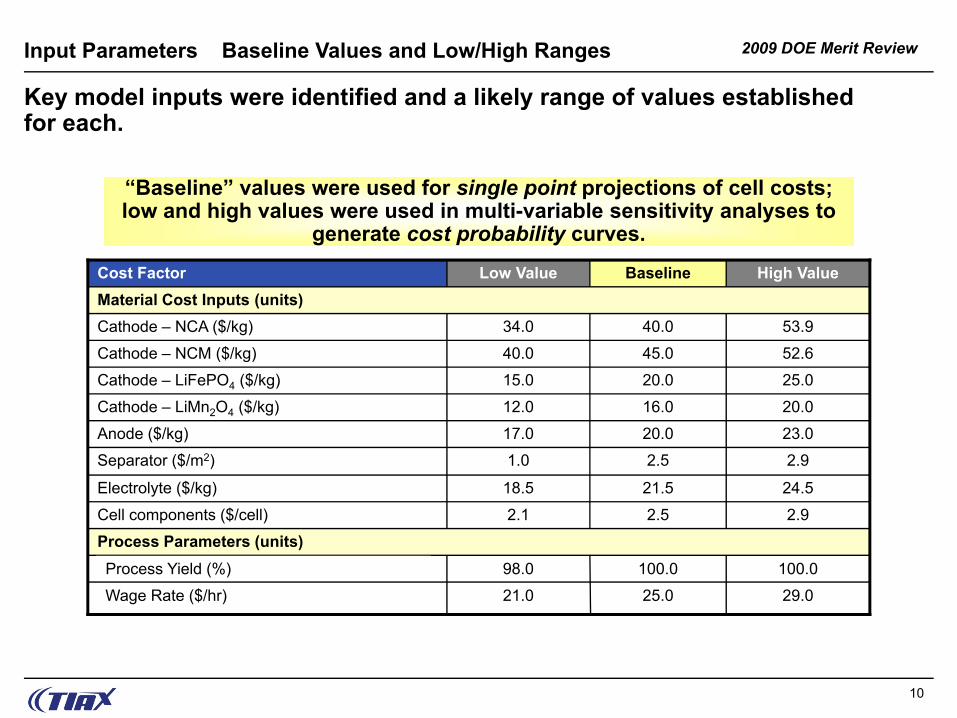
Key model inputs were identified and a likely range of values established for each.
20.016.012.0Cathode – LiMn2O4 ($/kg)
25.020.015.0Cathode – LiFePO4 ($/kg)
29.025.021.0Wage Rate ($/hr)
100.0100.098.0
Process Parameters (units)
2.92.51.0Separator ($/m2)
23.020.017.0Anode ($/kg)
52.645.040.0Cathode – NCM ($/kg)
53.940.034.0Cathode – NCA ($/kg)
Material Cost Inputs (units)
2.92.52.1Cell components ($/cell)
24.521.518.5Electrolyte ($/kg)
High ValueBaselineLow ValueCost Factor
Input Parameters Baseline Values and Low/High Ranges
“Baseline” values were used for single point projections of cell costs; low and high values were used in multi-variable sensitivity analyses to
generate cost probability curves.
Process Yield (%)
2009 DOE Merit Review
11
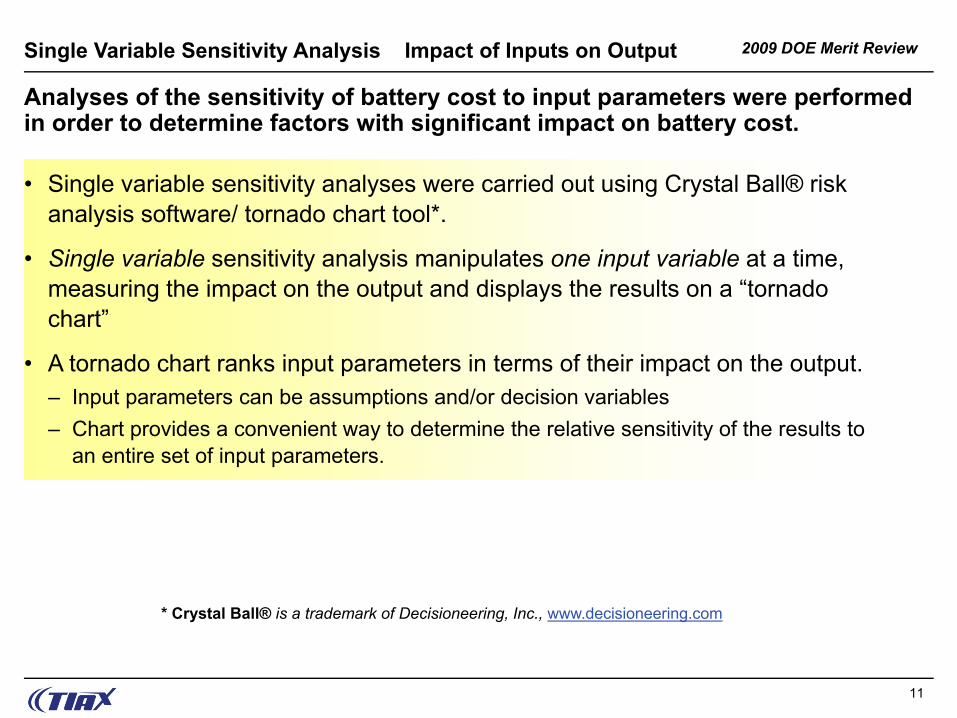
Analyses of the sensitivity of battery cost to input parameters were performed in order to determine factors with significant impact on battery cost.
• Single variable sensitivity analyses were carried out using Crystal Ball® risk analysis software/ tornado chart tool*.
• Single variable sensitivity analysis manipulates one input variable at a time, measuring the impact on the output and displays the results on a “tornado chart”
• A tornado chart ranks input parameters in terms of their impact on the output.– Input parameters can be assumptions and/or decision variables– Chart provides a convenient way to determine the relative sensitivity of the results to
an entire set of input parameters.
* Crystal Ball® is a trademark of Decisioneering, Inc., www.decisioneering.com
Single Variable Sensitivity Analysis Impact of Inputs on Output
2009 DOE Merit Review
12
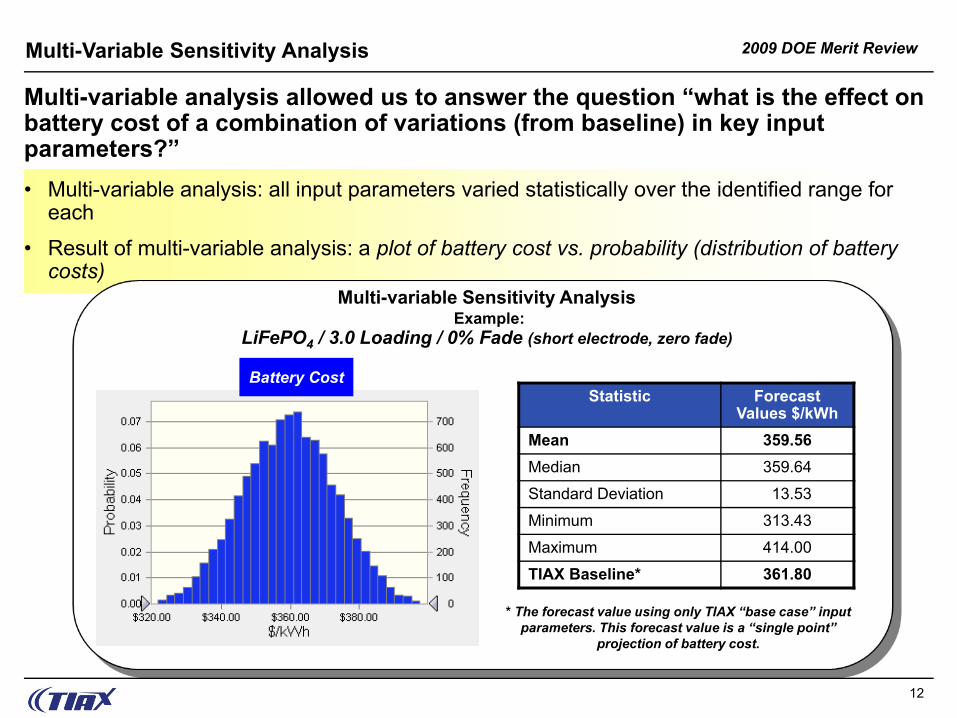
• Multi-variable analysis: all input parameters varied statistically over the identified range for each
• Result of multi-variable analysis: a plot of battery cost vs. probability (distribution of battery costs)
Multi-variable analysis allowed us to answer the question “what is the effect on battery cost of a combination of variations (from baseline) in key input parameters?”
Statistic Forecast Values $/kWh
Mean 359.56Median 359.64
Standard Deviation 13.53
Minimum 313.43
Maximum 414.00
TIAX Baseline* 361.80
Multi-variable Sensitivity AnalysisExample:
LiFePO4 / 3.0 Loading / 0% Fade (short electrode, zero fade)
* The forecast value using only TIAX “base case” input parameters. This forecast value is a “single point”
projection of battery cost.
Battery Cost
Multi-Variable Sensitivity Analysis
2009 DOE Merit Review
13
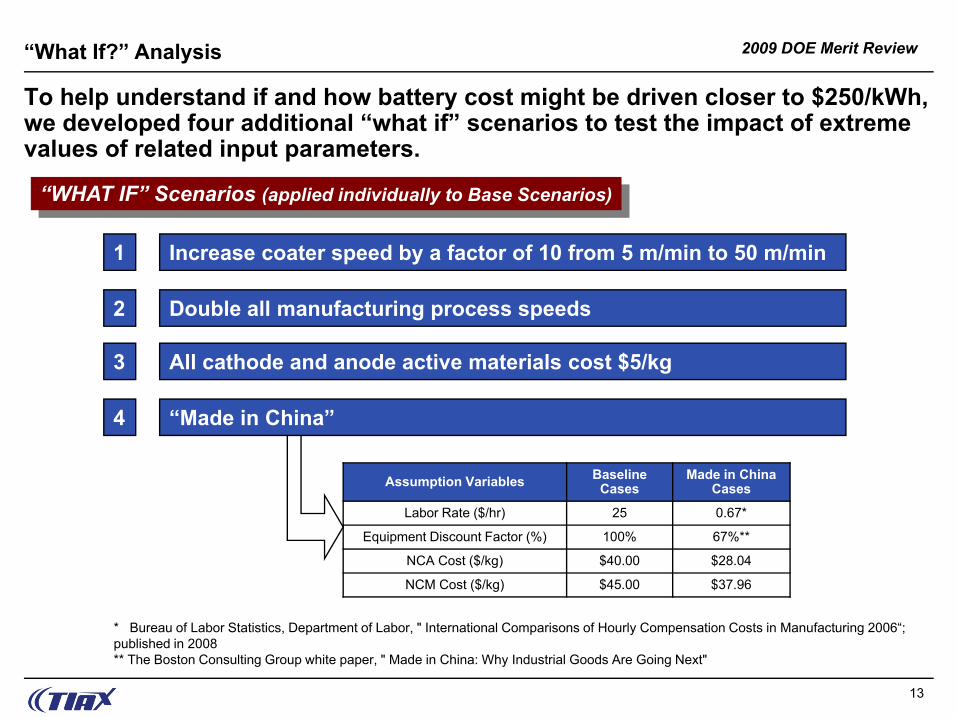
To help understand if and how battery cost might be driven closer to $250/kWh, we developed four additional “what if” scenarios to test the impact of extreme values of related input parameters.
Increase coater speed by a factor of 10 from 5 m/min to 50 m/min
Double all manufacturing process speeds
All cathode and anode active materials cost $5/kg
Assumption Variables Baseline Cases
Made in China Cases
Labor Rate ($/hr) 25 0.67*
Equipment Discount Factor (%) 100% 67%**
NCA Cost ($/kg) $40.00 $28.04
NCM Cost ($/kg) $45.00 $37.96
“Made in China”
1
2
3
4
“WHAT IF” Scenarios (applied individually to Base Scenarios)
* Bureau of Labor Statistics, Department of Labor, " International Comparisons of Hourly Compensation Costs in Manufacturing 2006“; published in 2008 ** The Boston Consulting Group white paper, " Made in China: Why Industrial Goods Are Going Next"
“What If?” Analysis
2009 DOE Merit Review
14
Cost of cathode active material is a somewhat less important factor in battery system cost than might have been thought.
• Upfront cell design is a critical factor in battery cost.– Electrode loading (i.e., electrode length) seems to be more significant than
cathode active material cost, within the ranges evaluated– Active materials’ influence on cell design has greater impact on battery cost than
does the (cathode) active materials’ cost itself.
• Manufacturing processing speed matters
Results
PHEV battery configurations modeled in this study resulted in battery costs (COGS) ranging from $264/kWh to $710/kWh, or $1452 to $3905 for 5.5 kWh usable power.*
* These cost ranges were the output from the statistical, multi-variable sensitivity analysis.
2009 DOE Merit Review
15
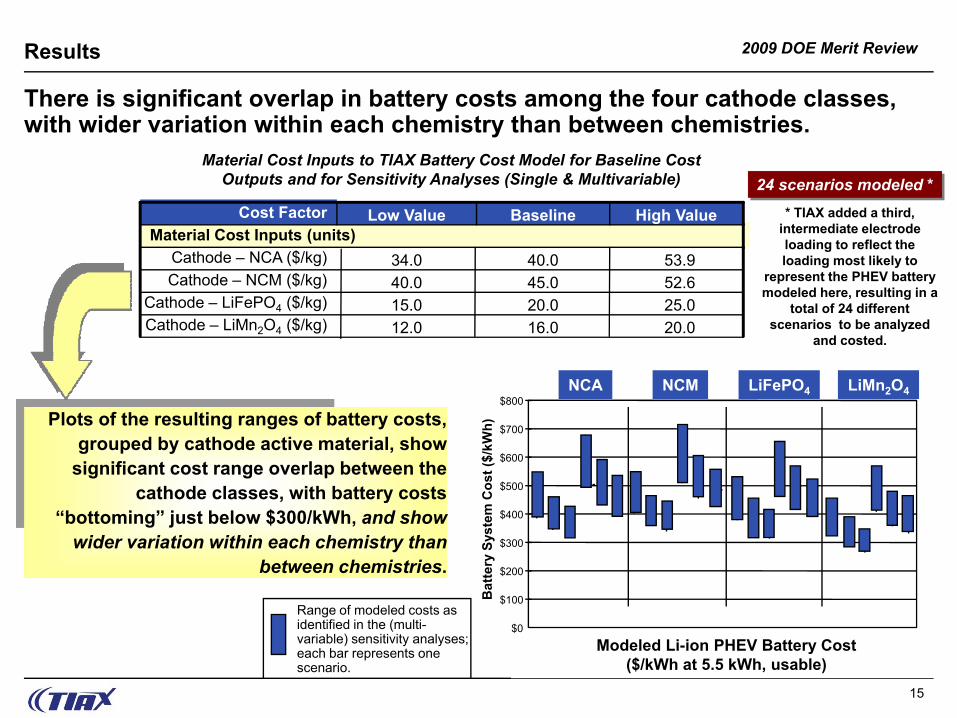
There is significant overlap in battery costs among the four cathode classes, with wider variation within each chemistry than between chemistries.
Plots of the resulting ranges of battery costs, grouped by cathode active material, show
significant cost range overlap between the cathode classes, with battery costs
“bottoming” just below $300/kWh, and show wider variation within each chemistry than
between chemistries.
Range of modeled costs as identified in the (multi-variable) sensitivity analyses; each bar represents one scenario.
Modeled Li-ion PHEV Battery Cost ($/kWh at 5.5 kWh, usable)
NCA NCM LiFePO4 LiMn2O4
Results
$0
$100
$200
$300
$400
$500
$600
$700
$800
Bat
tery
Sys
tem
Cos
t ($/
kWh)
Cathode – LiMn2O4 ($/kg)Cathode – LiFePO4 ($/kg)
Cathode – NCM ($/kg)Cathode – NCA ($/kg)
20.016.012.025.020.015.052.645.040.053.940.034.0
Material Cost Inputs (units)High ValueBaselineLow ValueCost Factor
Material Cost Inputs to TIAX Battery Cost Model for Baseline Cost Outputs and for Sensitivity Analyses (Single & Multivariable) 24 scenarios modeled *
* TIAX added a third, intermediate electrode loading to reflect the loading most likely to
represent the PHEV battery modeled here, resulting in a
total of 24 different scenarios to be analyzed
and costed.
2009 DOE Merit Review
16
The projected costs for PHEV batteries in this study conform with what might be expected from consideration of 18650-based Li-ion battery costs.
• 18650 cells are a standardized Li-ion design currently produced in volumes approaching 1 billion cells/year worldwide, using the most highly automated processes currently available in the industry.– This production volume corresponds to about 10GWh/year, or enough
volume in terms of materials and electrode area to yield about 1 million PHEVs/year.
• Current Li-ion OEM 18650 cell costs are in the $200-$250/kWh range, of which about 60% are the materials costs as supplied to battery manufacturers, i.e., powders, metal foils, separators, etc.
• 18650 cells are primarily used in battery packs for laptops, for which OEM costs range from $400/kWh to more than $700/kWh.
Results
2009 DOE Merit Review
17
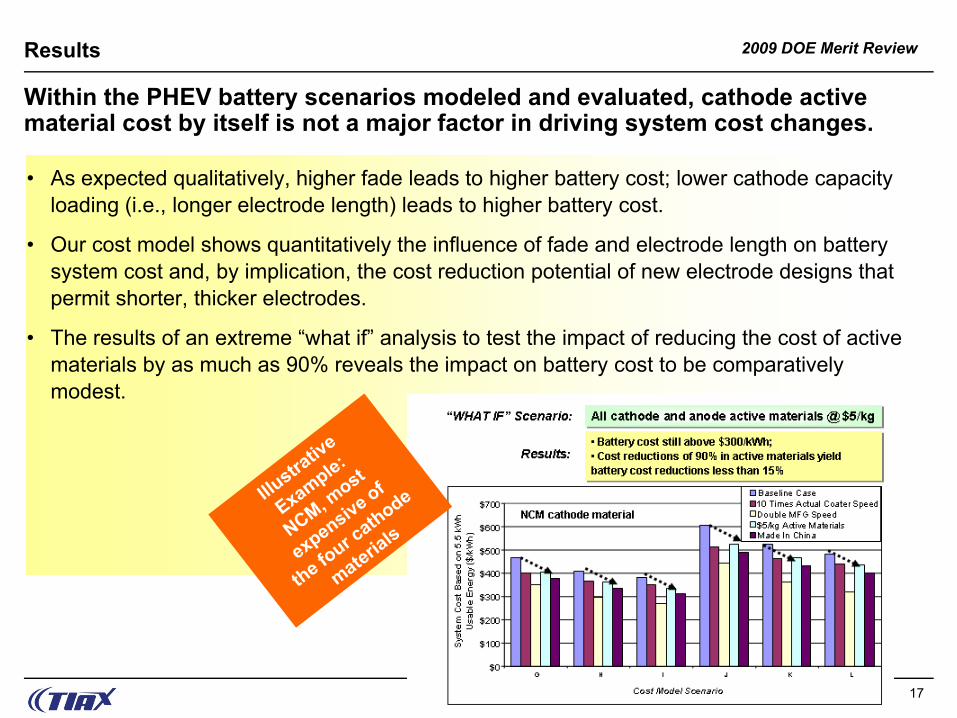
Within the PHEV battery scenarios modeled and evaluated, cathode active material cost by itself is not a major factor in driving system cost changes.
• As expected qualitatively, higher fade leads to higher battery cost; lower cathode capacity loading (i.e., longer electrode length) leads to higher battery cost.
• Our cost model shows quantitatively the influence of fade and electrode length on battery system cost and, by implication, the cost reduction potential of new electrode designs that permit shorter, thicker electrodes.
• The results of an extreme “what if” analysis to test the impact of reducing the cost of active materials by as much as 90% reveals the impact on battery cost to be comparatively modest.
Results
2009 DOE Merit Review
18
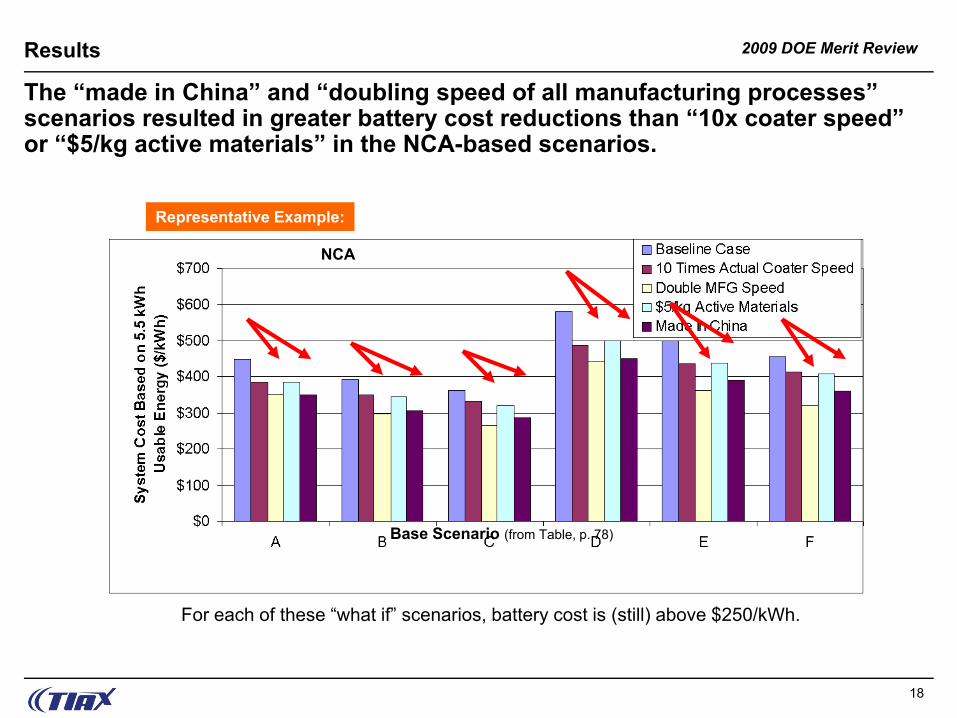
The “made in China” and “doubling speed of all manufacturing processes” scenarios resulted in greater battery cost reductions than “10x coater speed” or “$5/kg active materials” in the NCA-based scenarios.
NCA
For each of these “what if” scenarios, battery cost is (still) above $250/kWh.
Base Scenario (from Table, p. 78)
Representative Example:
Results
2009 DOE Merit Review
19
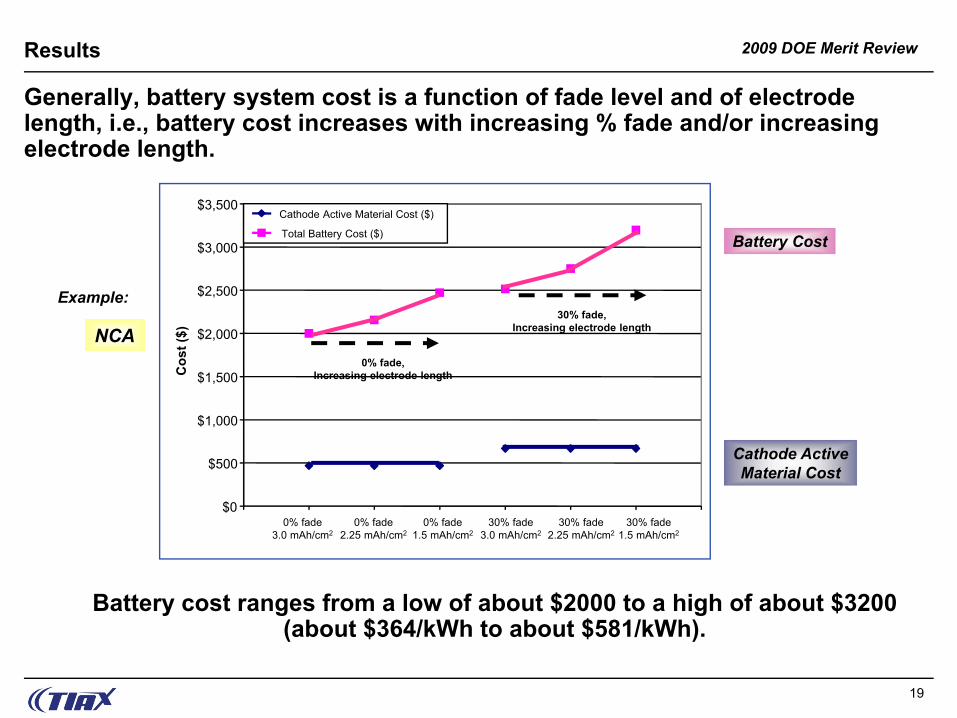
Generally, battery system cost is a function of fade level and of electrode length, i.e., battery cost increases with increasing % fade and/or increasing electrode length.
0% fade3.0 mAh/cm2
0% fade2.25 mAh/cm2
0% fade1.5 mAh/cm2
30% fade3.0 mAh/cm2
30% fade2.25 mAh/cm2
30% fade1.5 mAh/cm2
NCA
Battery Cost
Cathode ActiveMaterial Cost
0% fade,Increasing electrode length
30% fade,Increasing electrode length
Battery cost ranges from a low of about $2000 to a high of about $3200 (about $364/kWh to about $581/kWh).
$0
$500
$1,000
$1,500
$2,000
$2,500
$3,000
$3,500
Cos
t ($)
Cathode Active Material Cost ($)
Total Battery Cost ($)
Example:
Results
2009 DOE Merit Review
20
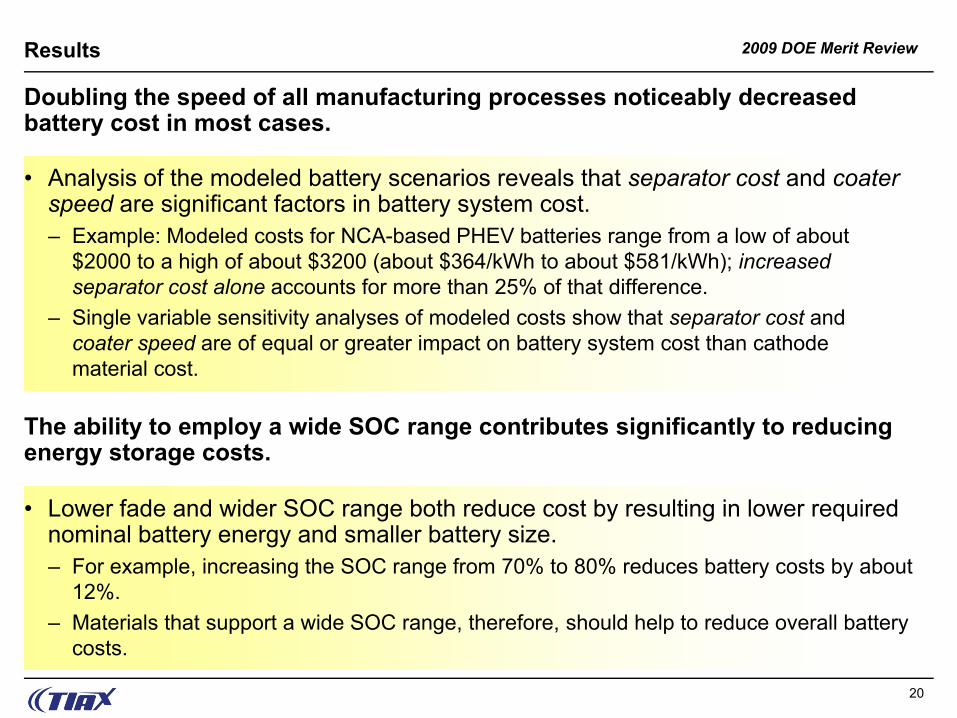
Doubling the speed of all manufacturing processes noticeably decreased battery cost in most cases.
• Analysis of the modeled battery scenarios reveals that separator cost and coaterspeed are significant factors in battery system cost.– Example: Modeled costs for NCA-based PHEV batteries range from a low of about
$2000 to a high of about $3200 (about $364/kWh to about $581/kWh); increased separator cost alone accounts for more than 25% of that difference.
– Single variable sensitivity analyses of modeled costs show that separator cost and coater speed are of equal or greater impact on battery system cost than cathode material cost.
The ability to employ a wide SOC range contributes significantly to reducing energy storage costs.
• Lower fade and wider SOC range both reduce cost by resulting in lower required nominal battery energy and smaller battery size.– For example, increasing the SOC range from 70% to 80% reduces battery costs by about
12%.– Materials that support a wide SOC range, therefore, should help to reduce overall battery
costs.
Results
2009 DOE Merit Review
21
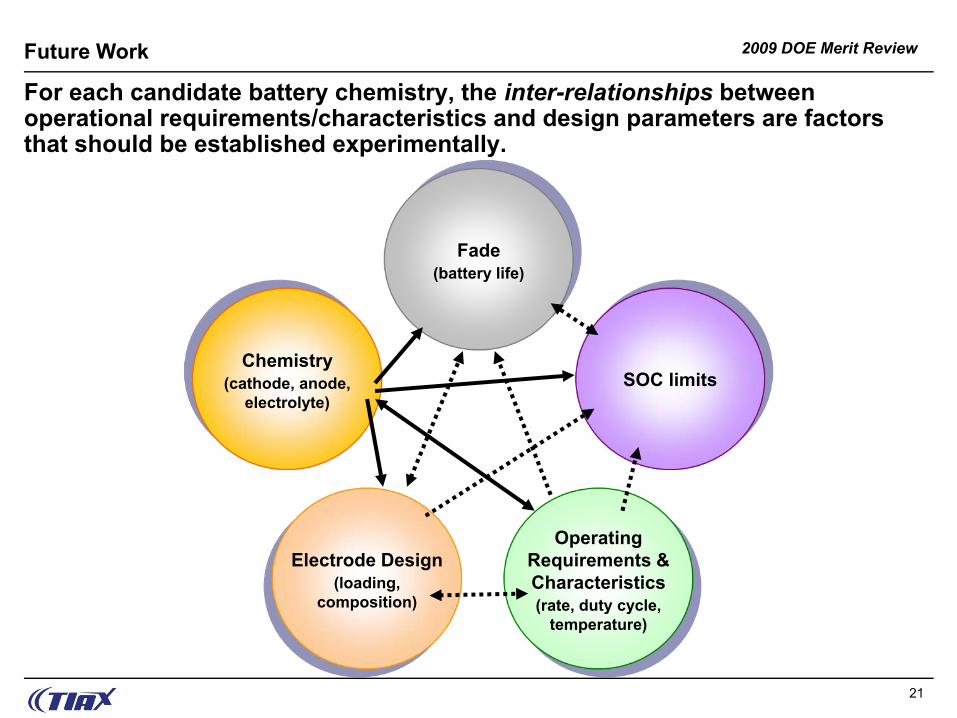
For each candidate battery chemistry, the inter-relationships between operational requirements/characteristics and design parameters are factors that should be established experimentally.
Chemistry(cathode, anode,
electrolyte)
Fade(battery life)
SOC limits
Electrode Design(loading,
composition)
Operating Requirements & Characteristics(rate, duty cycle,
temperature)
Future Work
2009 DOE Merit Review
22
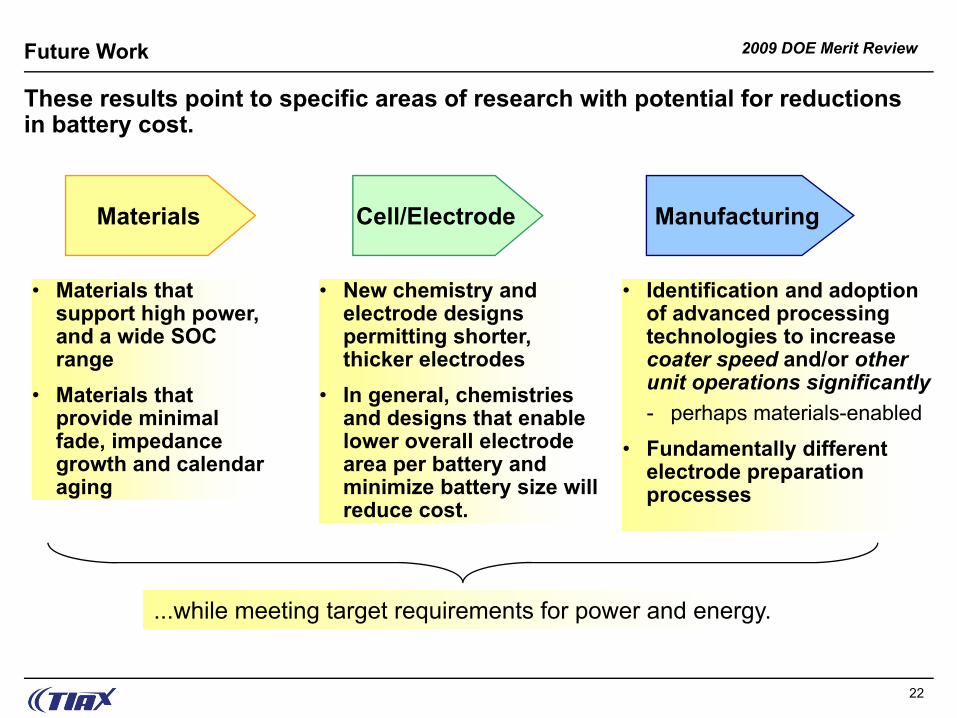
These results point to specific areas of research with potential for reductions in battery cost.
Future Work
Materials Cell/Electrode Manufacturing
• Materials that support high power, and a wide SOC range
• Materials that provide minimal fade, impedance growth and calendar aging
• New chemistry and electrode designs permitting shorter, thicker electrodes
• In general, chemistries and designs that enable lower overall electrode area per battery and minimize battery size will reduce cost.
• Identification and adoption of advanced processing technologies to increase coater speed and/or other unit operations significantly- perhaps materials-enabled
• Fundamentally different electrode preparation processes
...while meeting target requirements for power and energy.