Embed Size (px)
Citation preview
UNITED STATES SECURITIES AND EXCHANGE COMMISSION
Washington, D.C. 20549
FORM 10-Q
(Mark One)☑ QUARTERLY REPORT PURSUANT TO SECTION 13 OR 15(d) OF THE SECURITIES EXCHANGE ACT OF 1934
For the quarterly period ended September 30, 2021 OR
☐ TRANSITION REPORT PURSUANT TO SECTION 13 OR 15(d) OF THE SECURITIES EXCHANGE ACT OF 1934
For the transition period from _____ to _____Commission File Number: 000-54691
PHILLIPS EDISON & COMPANY, INC.(Exact name of registrant as specified in its charter)
Maryland 27-1106076(State or other jurisdiction of incorporation or organization) (I.R.S. Employer Identification No.)
11501 Northlake Drive, Cincinnati, Ohio 45249(Address of principal executive offices) (Zip code)
(513) 554-1110(Registrant’s telephone number,
including area code)
Securities registered pursuant to Section 12(b) of the Act:
Title of each class Trading Symbol(s) Name of each exchange on which registeredCommon stock, par value $0.01 per share PECO Nasdaq Global Select Market
Indicate by check mark whether the registrant (1) has filed all reports required to be filed by Section 13 or 15(d) of the Securities Exchange Act of 1934 during the preceding 12 months (or for such shorter period that the registrant was required to file such reports), and (2) has been subject to such filing requirements for the past 90 days. Yes ☑ No ☐ Indicate by check mark whether the registrant has submitted electronically every Interactive Data File required to be submitted pursuant to Rule 405 of Regulation S-T (§232.405 of this chapter) during the preceding 12 months (or for such shorter period that the registrant was required to submit such files). Yes ☑ No ☐
Indicate by check mark whether the registrant is a large accelerated filer, an accelerated filer, a non-accelerated filer, a smaller reporting company, or an emerging growth company. See the definitions of “large accelerated filer,” “accelerated filer,” “smaller reporting company,” and “emerging growth company” in Rule 12b-2 of the Exchange Act.
Large accelerated filer Accelerated filer Non-accelerated filer Smaller reporting company Emerging growth company
☐ ☐ ☑ ☐ ☐
If an emerging growth company, indicate by check mark if the registrant has elected not to use the extended transition period for complying with any new or revised financial accounting standards provided pursuant to Section 13(a) of the Exchange Act. ☐
Indicate by check mark whether the registrant is a shell company (as defined in Rule 12b-2 of the Exchange Act). Yes ☐ No ☑
There were 19.6 million shares of the registrant’s Common Stock, $0.01 par value per share, and 93.7 million shares of Class B stock, $0.01 par value per share, outstanding as of October 29, 2021.
PHILLIPS EDISON & COMPANY, INC. FORM 10-Q
TABLE OF CONTENTS
PART I.
ITEM 1. FINANCIAL STATEMENTS (CONDENSED AND UNAUDITED) 2
CONSOLIDATED BALANCE SHEETS AS OF SEPTEMBER 30, 2021 AND DECEMBER 31, 2020 2
CONSOLIDATED STATEMENTS OF OPERATIONS AND COMPREHENSIVE INCOME (LOSS) FOR THE THREE AND NINE MONTHS ENDED SEPTEMBER 30, 2021 AND 2020 3
CONSOLIDATED STATEMENTS OF EQUITY FOR THE THREE AND NINE MONTHS ENDED SEPTEMBER 30, 2021 AND 2020 4
CONSOLIDATED STATEMENTS OF CASH FLOWS FOR THE NINE MONTHS ENDED SEPTEMBER 30, 2021 AND 2020 6
NOTES TO THE UNAUDITED CONDENSED CONSOLIDATED FINANCIAL STATEMENTS AS OF AND FOR THE THREE AND NINE MONTHS ENDED SEPTEMBER 30, 2021
NOTE 1 ORGANIZATION 8
NOTE 2 SUMMARY OF SIGNIFICANT ACCOUNTING POLICIES 8
NOTE 3 LEASES 10
NOTE 4 REAL ESTATE ACTIVITY 11
NOTE 5 OTHER ASSETS, NET 12
NOTE 6 DEBT OBLIGATIONS 13
NOTE 7 DERIVATIVES AND HEDGING ACTIVITIES 13
NOTE 8 COMMITMENTS AND CONTINGENCIES 14
NOTE 9 EQUITY 15
NOTE 10 EARNINGS PER SHARE 16
NOTE 11 RELATED PARTY TRANSACTIONS 17
NOTE 12 FAIR VALUE MEASUREMENTS 17
NOTE 13 SUBSEQUENT EVENTS 20
ITEM 2.MANAGEMENT’S DISCUSSION AND ANALYSIS OF FINANCIAL CONDITION AND RESULTS OF OPERATIONS 21
ITEM 3. QUANTITATIVE AND QUALITATIVE DISCLOSURES ABOUT MARKET RISK 43
ITEM 4. CONTROLS AND PROCEDURES 44
PART II.
ITEM 1. LEGAL PROCEEDINGS 44
ITEM 1A. RISK FACTORS 44
ITEM 2. UNREGISTERED SALES OF EQUITY SECURITIES AND USE OF PROCEEDS 44
ITEM 6. EXHIBITS 45
SIGNATURES 46
PHILLIPS EDISON & COMPANYSEPTEMBER 30, 2021 FORM 10-Q 1
w PART I FINANCIAL INFORMATION
ITEM 1. FINANCIAL STATEMENTS
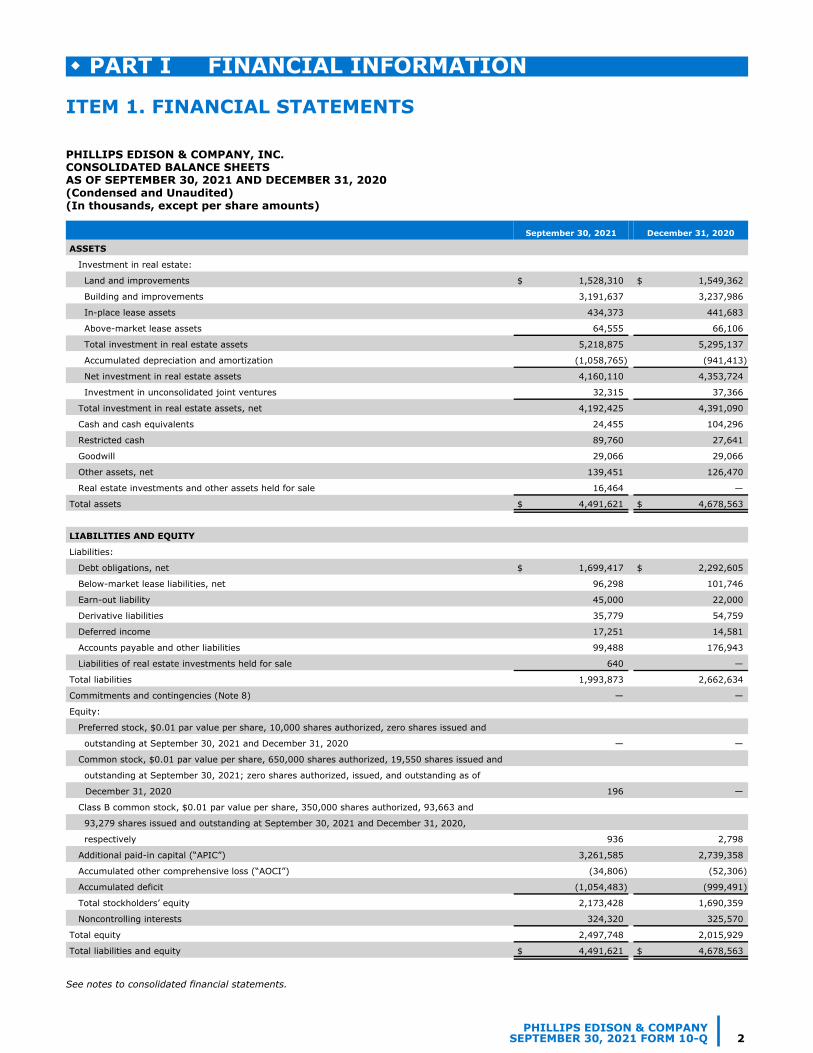
PHILLIPS EDISON & COMPANY, INC.CONSOLIDATED BALANCE SHEETSAS OF SEPTEMBER 30, 2021 AND DECEMBER 31, 2020 (Condensed and Unaudited)(In thousands, except per share amounts)
September 30, 2021 December 31, 2020
ASSETS
Investment in real estate:
Land and improvements $ 1,528,310 $ 1,549,362
Building and improvements 3,191,637 3,237,986
In-place lease assets 434,373 441,683
Above-market lease assets 64,555 66,106
Total investment in real estate assets 5,218,875 5,295,137
Accumulated depreciation and amortization (1,058,765) (941,413)
Net investment in real estate assets 4,160,110 4,353,724
Investment in unconsolidated joint ventures 32,315 37,366
Total investment in real estate assets, net 4,192,425 4,391,090
Cash and cash equivalents 24,455 104,296
Restricted cash 89,760 27,641
Goodwill 29,066 29,066
Other assets, net 139,451 126,470
Real estate investments and other assets held for sale 16,464 —
Total assets $ 4,491,621 $ 4,678,563
LIABILITIES AND EQUITY
Liabilities:
Debt obligations, net $ 1,699,417 $ 2,292,605
Below-market lease liabilities, net 96,298 101,746
Earn-out liability 45,000 22,000
Derivative liabilities 35,779 54,759
Deferred income 17,251 14,581
Accounts payable and other liabilities 99,488 176,943
Liabilities of real estate investments held for sale 640 —
Total liabilities 1,993,873 2,662,634
Commitments and contingencies (Note 8) — —
Equity:
Preferred stock, $0.01 par value per share, 10,000 shares authorized, zero shares issued and
outstanding at September 30, 2021 and December 31, 2020 — —
Common stock, $0.01 par value per share, 650,000 shares authorized, 19,550 shares issued and
outstanding at September 30, 2021; zero shares authorized, issued, and outstanding as of
December 31, 2020 196 —
Class B common stock, $0.01 par value per share, 350,000 shares authorized, 93,663 and
93,279 shares issued and outstanding at September 30, 2021 and December 31, 2020,
respectively 936 2,798
Additional paid-in capital (“APIC”) 3,261,585 2,739,358
Accumulated other comprehensive loss (“AOCI”) (34,806) (52,306)
Accumulated deficit (1,054,483) (999,491)
Total stockholders’ equity 2,173,428 1,690,359
Noncontrolling interests 324,320 325,570
Total equity 2,497,748 2,015,929
Total liabilities and equity $ 4,491,621 $ 4,678,563
See notes to consolidated financial statements.
PHILLIPS EDISON & COMPANYSEPTEMBER 30, 2021 FORM 10-Q 2
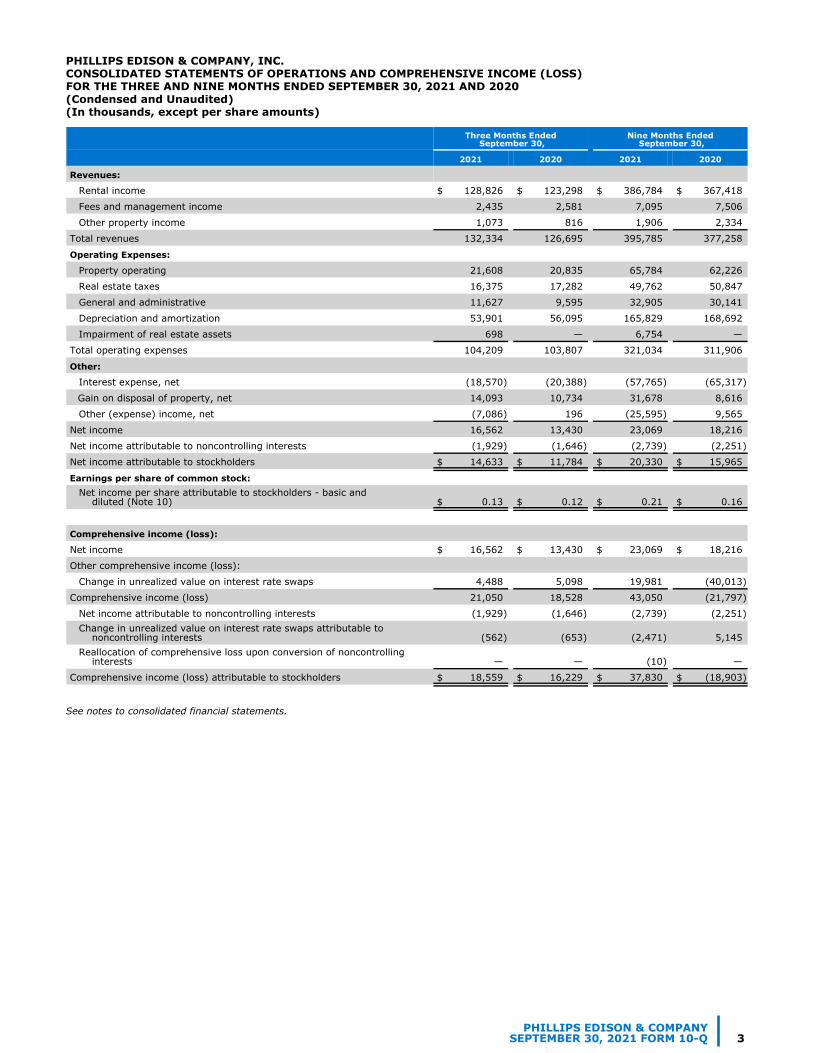
PHILLIPS EDISON & COMPANY, INC.CONSOLIDATED STATEMENTS OF OPERATIONS AND COMPREHENSIVE INCOME (LOSS) FOR THE THREE AND NINE MONTHS ENDED SEPTEMBER 30, 2021 AND 2020(Condensed and Unaudited)(In thousands, except per share amounts)
Three Months Ended September 30,
Nine Months Ended September 30,
2021 2020 2021 2020
Revenues:
Rental income $ 128,826 $ 123,298 $ 386,784 $ 367,418
Fees and management income 2,435 2,581 7,095 7,506
Other property income 1,073 816 1,906 2,334
Total revenues 132,334 126,695 395,785 377,258
Operating Expenses:
Property operating 21,608 20,835 65,784 62,226
Real estate taxes 16,375 17,282 49,762 50,847
General and administrative 11,627 9,595 32,905 30,141
Depreciation and amortization 53,901 56,095 165,829 168,692
Impairment of real estate assets 698 — 6,754 —
Total operating expenses 104,209 103,807 321,034 311,906
Other:
Interest expense, net (18,570) (20,388) (57,765) (65,317)
Gain on disposal of property, net 14,093 10,734 31,678 8,616
Other (expense) income, net (7,086) 196 (25,595) 9,565
Net income 16,562 13,430 23,069 18,216
Net income attributable to noncontrolling interests (1,929) (1,646) (2,739) (2,251)
Net income attributable to stockholders $ 14,633 $ 11,784 $ 20,330 $ 15,965
Earnings per share of common stock:Net income per share attributable to stockholders - basic and diluted (Note 10) $ 0.13 $ 0.12 $ 0.21 $ 0.16
Comprehensive income (loss):
Net income $ 16,562 $ 13,430 $ 23,069 $ 18,216
Other comprehensive income (loss):
Change in unrealized value on interest rate swaps 4,488 5,098 19,981 (40,013)
Comprehensive income (loss) 21,050 18,528 43,050 (21,797)
Net income attributable to noncontrolling interests (1,929) (1,646) (2,739) (2,251) Change in unrealized value on interest rate swaps attributable to noncontrolling interests (562) (653) (2,471) 5,145 Reallocation of comprehensive loss upon conversion of noncontrolling interests — — (10) —
Comprehensive income (loss) attributable to stockholders $ 18,559 $ 16,229 $ 37,830 $ (18,903)
See notes to consolidated financial statements.
PHILLIPS EDISON & COMPANYSEPTEMBER 30, 2021 FORM 10-Q 3
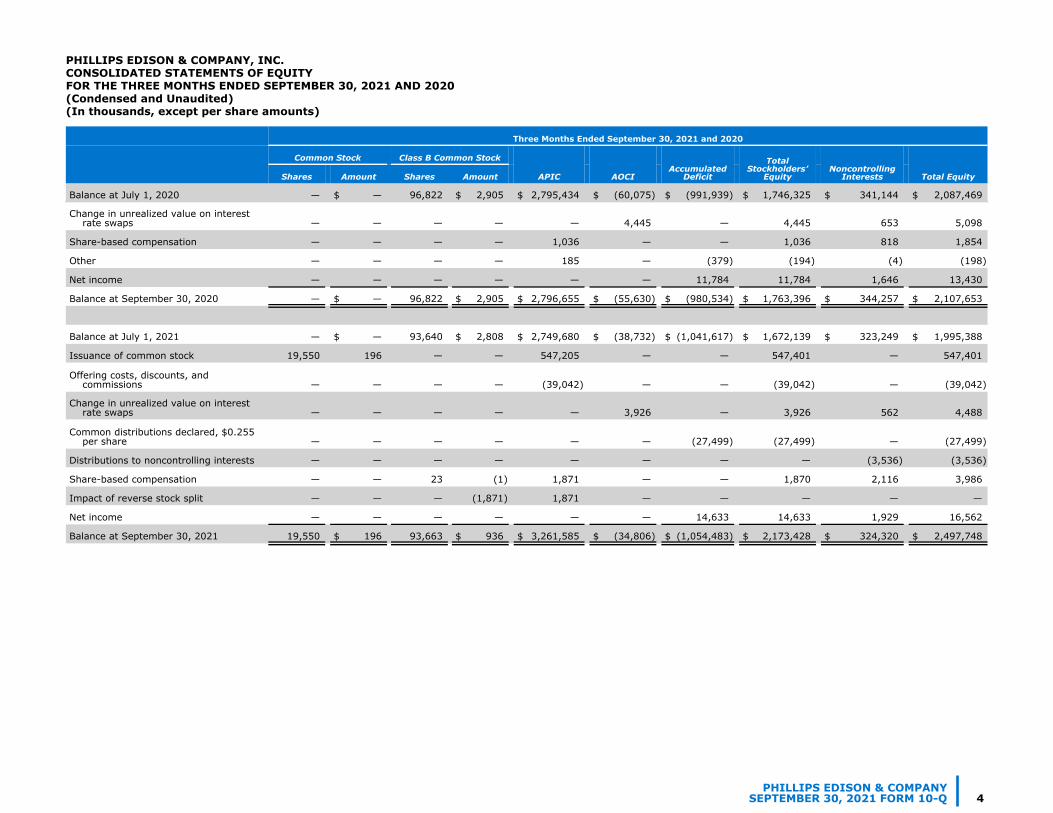
PHILLIPS EDISON & COMPANY, INC.CONSOLIDATED STATEMENTS OF EQUITYFOR THE THREE MONTHS ENDED SEPTEMBER 30, 2021 AND 2020 (Condensed and Unaudited)(In thousands, except per share amounts)
Change in unrealized value on interest rate swaps — — — — — 4,445 — 4,445 653 5,098
Share-based compensation — — — — 1,036 — — 1,036 818 1,854
Other — — — — 185 — (379) (194) (4) (198)
Net income — — — — — — 11,784 11,784 1,646 13,430
Balance at September 30, 2020 — $ — 96,822 $ 2,905 $ 2,796,655 $ (55,630) $ (980,534) $ 1,763,396 $ 344,257 $ 2,107,653
Balance at July 1, 2021 — $ — 93,640 $ 2,808 $ 2,749,680 $ (38,732) $ (1,041,617) $ 1,672,139 $ 323,249 $ 1,995,388
Issuance of common stock 19,550 196 — — 547,205 — — 547,401 — 547,401
Offering costs, discounts, and commissions — — — — (39,042) — — (39,042) — (39,042)
Change in unrealized value on interest rate swaps — — — — — 3,926 — 3,926 562 4,488
Common distributions declared, $0.255 per share — — — — — — (27,499) (27,499) — (27,499)
Distributions to noncontrolling interests — — — — — — — — (3,536) (3,536)
Share-based compensation — — 23 (1) 1,871 — — 1,870 2,116 3,986
Impact of reverse stock split — — — (1,871) 1,871 — — — — —
Net income — — — — — — 14,633 14,633 1,929 16,562
Balance at September 30, 2021 19,550 $ 196 93,663 $ 936 $ 3,261,585 $ (34,806) $ (1,054,483) $ 2,173,428 $ 324,320 $ 2,497,748
Three Months Ended September 30, 2021 and 2020
Common Stock Class B Common Stock
APIC AOCIAccumulated
Deficit
Total Stockholders’
EquityNoncontrolling
Interests Total Equity Shares Amount Shares Amount
Balance at July 1, 2020 — $ — 96,822 $ 2,905 $ 2,795,434 $ (60,075) $ (991,939) $ 1,746,325 $ 341,144 $ 2,087,469
PHILLIPS EDISON & COMPANYSEPTEMBER 30, 2021 FORM 10-Q 4
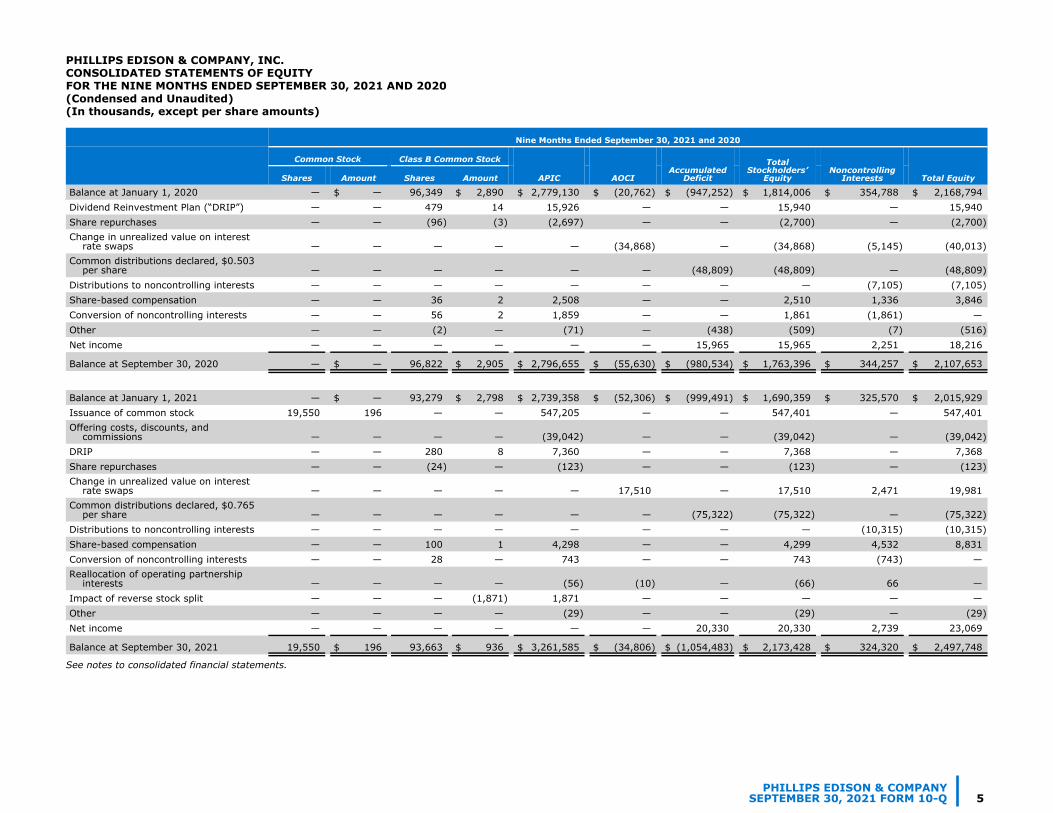
PHILLIPS EDISON & COMPANY, INC.CONSOLIDATED STATEMENTS OF EQUITYFOR THE NINE MONTHS ENDED SEPTEMBER 30, 2021 AND 2020 (Condensed and Unaudited)(In thousands, except per share amounts)
Dividend Reinvestment Plan (“DRIP”) — — 479 14 15,926 — — 15,940 — 15,940 Share repurchases — — (96) (3) (2,697) — — (2,700) — (2,700) Change in unrealized value on interest rate swaps — — — — — (34,868) — (34,868) (5,145) (40,013) Common distributions declared, $0.503 per share — — — — — — (48,809) (48,809) — (48,809) Distributions to noncontrolling interests — — — — — — — — (7,105) (7,105) Share-based compensation — — 36 2 2,508 — — 2,510 1,336 3,846 Conversion of noncontrolling interests — — 56 2 1,859 — — 1,861 (1,861) — Other — — (2) — (71) — (438) (509) (7) (516) Net income — — — — — — 15,965 15,965 2,251 18,216
Balance at September 30, 2020 — $ — 96,822 $ 2,905 $ 2,796,655 $ (55,630) $ (980,534) $ 1,763,396 $ 344,257 $ 2,107,653
Balance at January 1, 2021 — $ — 93,279 $ 2,798 $ 2,739,358 $ (52,306) $ (999,491) $ 1,690,359 $ 325,570 $ 2,015,929 Issuance of common stock 19,550 196 — — 547,205 — — 547,401 — 547,401 Offering costs, discounts, and commissions — — — — (39,042) — — (39,042) — (39,042) DRIP — — 280 8 7,360 — — 7,368 — 7,368 Share repurchases — — (24) — (123) — — (123) — (123) Change in unrealized value on interest rate swaps — — — — — 17,510 — 17,510 2,471 19,981 Common distributions declared, $0.765 per share — — — — — — (75,322) (75,322) — (75,322) Distributions to noncontrolling interests — — — — — — — — (10,315) (10,315) Share-based compensation — — 100 1 4,298 — — 4,299 4,532 8,831 Conversion of noncontrolling interests — — 28 — 743 — — 743 (743) — Reallocation of operating partnership interests — — — — (56) (10) — (66) 66 — Impact of reverse stock split — — — (1,871) 1,871 — — — — — Other — — — — (29) — — (29) — (29) Net income — — — — — — 20,330 20,330 2,739 23,069
Balance at September 30, 2021 19,550 $ 196 93,663 $ 936 $ 3,261,585 $ (34,806) $ (1,054,483) $ 2,173,428 $ 324,320 $ 2,497,748
Nine Months Ended September 30, 2021 and 2020
Common Stock Class B Common Stock
APIC AOCIAccumulated
Deficit
Total Stockholders’
EquityNoncontrolling
Interests Total Equity Shares Amount Shares Amount
Balance at January 1, 2020 — $ — 96,349 $ 2,890 $ 2,779,130 $ (20,762) $ (947,252) $ 1,814,006 $ 354,788 $ 2,168,794
See notes to consolidated financial statements.
PHILLIPS EDISON & COMPANYSEPTEMBER 30, 2021 FORM 10-Q 5
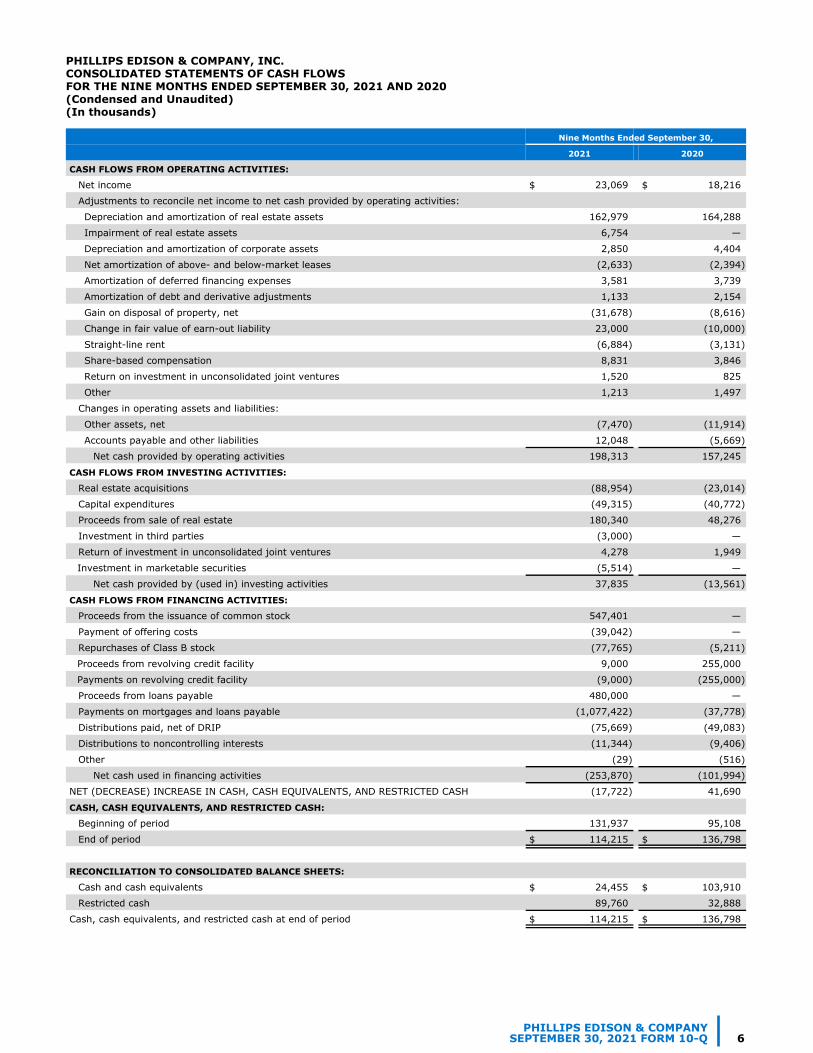
PHILLIPS EDISON & COMPANY, INC.CONSOLIDATED STATEMENTS OF CASH FLOWSFOR THE NINE MONTHS ENDED SEPTEMBER 30, 2021 AND 2020 (Condensed and Unaudited)(In thousands)
Nine Months Ended September 30,
2021 2020
CASH FLOWS FROM OPERATING ACTIVITIES:
Net income $ 23,069 $ 18,216
Adjustments to reconcile net income to net cash provided by operating activities:
Depreciation and amortization of real estate assets 162,979 164,288
Impairment of real estate assets 6,754 —
Depreciation and amortization of corporate assets 2,850 4,404
Net amortization of above- and below-market leases (2,633) (2,394)
Amortization of deferred financing expenses 3,581 3,739
Amortization of debt and derivative adjustments 1,133 2,154
Gain on disposal of property, net (31,678) (8,616)
Change in fair value of earn-out liability 23,000 (10,000)
Straight-line rent (6,884) (3,131)
Share-based compensation 8,831 3,846
Return on investment in unconsolidated joint ventures 1,520 825
Other 1,213 1,497
Changes in operating assets and liabilities:
Other assets, net (7,470) (11,914)
Accounts payable and other liabilities 12,048 (5,669)
Net cash provided by operating activities 198,313 157,245
CASH FLOWS FROM INVESTING ACTIVITIES:
Real estate acquisitions (88,954) (23,014)
Capital expenditures (49,315) (40,772)
Proceeds from sale of real estate 180,340 48,276
Investment in third parties (3,000) —
Return of investment in unconsolidated joint ventures 4,278 1,949
Investment in marketable securities (5,514) —
Net cash provided by (used in) investing activities 37,835 (13,561)
CASH FLOWS FROM FINANCING ACTIVITIES:
Proceeds from the issuance of common stock 547,401 —
Payment of offering costs (39,042) —
Repurchases of Class B stock (77,765) (5,211)
Proceeds from revolving credit facility 9,000 255,000
Payments on revolving credit facility (9,000) (255,000)
Proceeds from loans payable 480,000 —
Payments on mortgages and loans payable (1,077,422) (37,778)
Distributions paid, net of DRIP (75,669) (49,083)
Distributions to noncontrolling interests (11,344) (9,406)
Other (29) (516)
Net cash used in financing activities (253,870) (101,994)
NET (DECREASE) INCREASE IN CASH, CASH EQUIVALENTS, AND RESTRICTED CASH (17,722) 41,690
CASH, CASH EQUIVALENTS, AND RESTRICTED CASH:
Beginning of period 131,937 95,108
End of period $ 114,215 $ 136,798
RECONCILIATION TO CONSOLIDATED BALANCE SHEETS:
Cash and cash equivalents $ 24,455 $ 103,910
Restricted cash 89,760 32,888
Cash, cash equivalents, and restricted cash at end of period $ 114,215 $ 136,798
PHILLIPS EDISON & COMPANYSEPTEMBER 30, 2021 FORM 10-Q 6
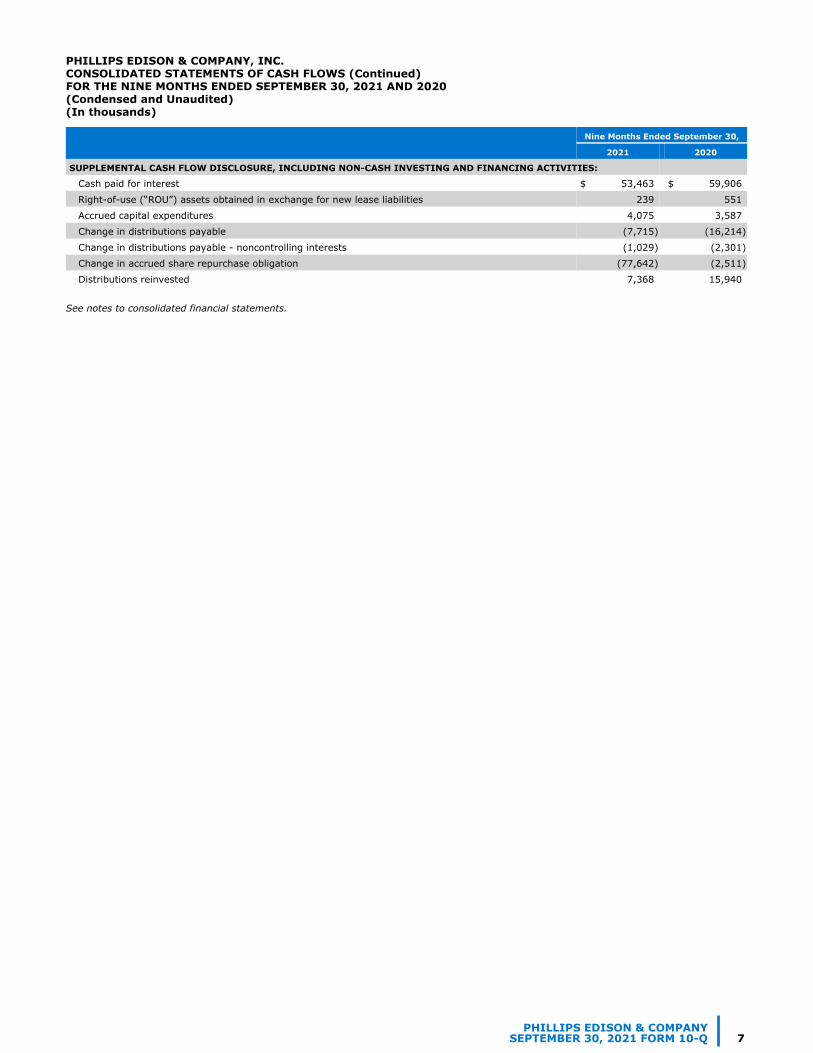
PHILLIPS EDISON & COMPANY, INC.CONSOLIDATED STATEMENTS OF CASH FLOWS (Continued)FOR THE NINE MONTHS ENDED SEPTEMBER 30, 2021 AND 2020 (Condensed and Unaudited)(In thousands)
Nine Months Ended September 30,
2021 2020
SUPPLEMENTAL CASH FLOW DISCLOSURE, INCLUDING NON-CASH INVESTING AND FINANCING ACTIVITIES:
Cash paid for interest $ 53,463 $ 59,906
Right-of-use (“ROU”) assets obtained in exchange for new lease liabilities 239 551
Accrued capital expenditures 4,075 3,587
Change in distributions payable (7,715) (16,214)
Change in distributions payable - noncontrolling interests (1,029) (2,301)
Change in accrued share repurchase obligation (77,642) (2,511)
Distributions reinvested 7,368 15,940
See notes to consolidated financial statements.
PHILLIPS EDISON & COMPANYSEPTEMBER 30, 2021 FORM 10-Q 7
Phillips Edison & Company, Inc.
Notes to Consolidated Financial Statements(Condensed and Unaudited)
As of and for the periods ended September 30, 2021
1. ORGANIZATION
Phillips Edison & Company, Inc. (“we,” the “Company,” “PECO,” “our,” or “us”) was formed as a Maryland corporation in October 2009. Substantially all of our business is conducted through Phillips Edison Grocery Center Operating Partnership I, L.P., (the “Operating Partnership”), a Delaware limited partnership formed in December 2009. We are a limited partner of the Operating Partnership, and our wholly-owned subsidiary, Phillips Edison Grocery Center OP GP I LLC, is the sole general partner of the Operating Partnership.
We are a real estate investment trust (“REIT”) that invests primarily in omni-channel grocery-anchored neighborhood and community shopping centers that have a mix of creditworthy national, regional, and local retailers that sell necessity-based goods and services in strong demographic markets throughout the United States. In addition to managing our own shopping centers, our third-party investment management business provides comprehensive real estate and asset management services to two unconsolidated institutional joint ventures, in which we have a partial ownership interest, and one private fund (collectively, the “Managed Funds”) as of September 30, 2021.
As of September 30, 2021, we wholly-owned 267 real estate properties. Additionally, we owned a 14% interest in Grocery Retail Partners I LLC (“GRP I”), a joint venture that owned 20 properties, and a 20% equity interest in Necessity Retail Partners (“NRP”), a joint venture that owned two properties.
On June 18, 2021, our stockholders approved an amendment to our charter (the “Articles of Amendment”) that effected a change of each share of our common stock outstanding at the time the amendment became effective into one share of a newly created class of Class B common stock (the “Recapitalization”). The Articles of Amendment became effective upon filing with, and acceptance by, the State Department of Assessments and Taxation of Maryland on July 2, 2021. Unless otherwise indicated, all information in this Form 10-Q gives effect to the Recapitalization and references to “shares” and per share metrics refer to our common stock and Class B common stock, collectively.
On July 2, 2021, our board of directors (the “Board”) approved an amendment to our articles of incorporation to effect a one-for-three reverse stock split. Concurrent with the reverse split, the Operating Partnership enacted a one-for-three reverse split of its outstanding Operating Partnership units (“OP units”). Unless otherwise indicated, the information in this Form 10-Q gives effect to the reverse stock and OP unit splits (Note 9).
On July 19, 2021, we closed our underwritten initial public offering (“underwritten IPO”), through which we offered 17.0 million shares of a new class of common stock, $0.01 par value per share, at an initial price to the public of $28.00 per share, pursuant to a registration statement filed with the U.S. Securities and Exchange Commission (“SEC”) on Form S-11 (File No. 333-255846), as amended. In connection with the underwritten IPO, the underwriters exercised a 30-day option to purchase additional shares of common stock to cover overallotments, and, accordingly, on August 2, 2021, we settled the sale of an additional 2.6 million shares at a price of $28.00 per share. These shares are listed on the Nasdaq Global Select Market (“NASDAQ”) under the trading symbol “PECO”. The underwritten IPO, including the underwriters overallotment election, resulted in gross proceeds of $547.4 million.
On September 20, 2021, the SEC declared effective our bond offering registration as filed on Form S-3 (File Nos. 333-259059 and 333-259059-01) relating to the offer, from time to time, of an unspecified number of debt securities not to exceed a maximum aggregate offering of $1 billion (“Bond Registration”). In October 2021, in connection with this registration, we settled $350 million aggregate principal amount of 2.625% senior notes (“2021 Bond Offering”) priced at 98.692% of the principal amount and maturing in November 2031. The notes are fully and unconditionally guaranteed by us.
Following our underwritten IPO, we are presenting common stock and Class B common stock as separate classes within our consolidated balance sheets and consolidated statements of equity. Any references to “common stock” in this 10-Q refer to our Nasdaq-listed shares sold through the underwritten IPO, whereas Class B common stock refers to the newly-created class of common stock that is not listed. This applies to all historical periods presented herein.
2. SUMMARY OF SIGNIFICANT ACCOUNTING POLICIES
Set forth below is a summary of the significant accounting estimates and policies that management believes are important to the preparation of our condensed consolidated interim financial statements. Certain of our accounting estimates are particularly important for an understanding of our financial position and results of operations and require the application of significant judgment by management. For example, significant estimates and assumptions have been made with respect to the useful lives of assets, remaining hold period of assets, recoverable amounts of receivables, and other fair value measurement assessments required for the preparation of the consolidated interim financial statements. As a result, these estimates are subject to a degree of uncertainty.
Beginning in 2020, the coronavirus (“COVID-19”) pandemic has caused significant disruption to our operations. All temporarily closed tenants have since been permitted to reopen; however, certain of our tenants have permanently closed. We have
PHILLIPS EDISON & COMPANYSEPTEMBER 30, 2021 FORM 10-Q 8

backfilled a number of these spaces and continue to work on backfilling any remaining vacancies. The continuing economic impacts of the COVID-19 pandemic could result in increased permanent store closures, reduce the demand for leasing space in our shopping centers, and/or result in a decline in occupancy and rental revenues in our real estate portfolio. Because of the adverse economic conditions that have occurred as a result of the impacts of the COVID-19 pandemic and any remaining uncertainty related to the pandemic, it is possible that the estimates and assumptions that have been utilized in the preparation of the consolidated financial statements could change significantly. All of this activity impacts our estimates around the collectibility of revenue and valuation of real estate assets, goodwill and other intangible assets, and certain liabilities, among others.
There were no changes to our significant accounting policies during the nine months ended September 30, 2021, except for those discussed below. For a full summary of our accounting policies, refer to our 2020 Annual Report on Form 10-K as originally filed with the SEC on March 12, 2021.
Basis of Presentation and Principles of Consolidation—The accompanying condensed consolidated financial statements have been prepared in accordance with accounting principles generally accepted in the United States of America (“GAAP”) for interim financial information and with instructions to Form 10-Q and Article 10 of Regulation S-X. Accordingly, they do not include all of the information and footnotes required by GAAP for complete financial statements. Readers of this Quarterly Report on Form 10-Q should refer to our audited consolidated financial statements for the year ended December 31, 2020, which are included in our 2020 Annual Report on Form 10-K. In the opinion of management, all normal and recurring adjustments necessary for the fair presentation of the unaudited consolidated financial statements for the periods presented have been included in this Quarterly Report. Our results of operations for the three and nine months ended September 30, 2021 are not necessarily indicative of the operating results expected for the full year.
The accompanying consolidated financial statements include our accounts and those of our majority-owned subsidiaries. All intercompany balances and transactions are eliminated upon consolidation.
Underwritten IPO Costs—Underwritten IPO costs are offset against underwritten IPO proceeds and included as a component of APIC on the consolidated balance sheets. Costs incurred that were related to our underwritten IPO activities but were not directly related to our equity raise were not capitalized and are included as transaction costs, currently in Other (Expense) Income, Net on our consolidated statements of operations and comprehensive income (loss) (“consolidated statements of operations”). As of September 30, 2021, we had underwritten IPO costs of approximately $39.0 million, and we incurred costs related to our underwritten IPO but not directly related to our equity raise of approximately $1.0 million.
Income Taxes—Our consolidated financial statements include the operations of wholly-owned subsidiaries that have jointly elected to be treated as Taxable REIT Subsidiaries and are subject to U.S. federal, state, and local income taxes at regular corporate tax rates. We recognized an insignificant amount of federal, state, and local income tax expense for the three and nine months ended September 30, 2021 and 2020, and we retain a full valuation allowance for our deferred tax asset. All income tax amounts are included in Other (Expense) Income, Net on our consolidated statements of operations.
Recently Issued Accounting Pronouncements—On January 7, 2021, the Financial Accounting Standards Board (“FASB”) issued Accounting Standards Update (“ASU”) 2021-01 to amend the scope of the guidance in ASU 2020-04 on facilitation of the effects of reference rate reform on financial reporting. Specifically, the amendments in ASU 2021-01 clarify that certain optional expedients and exceptions in Accounting Standards Codification (“ASC”) Topic 848, Reference Rate Reform for contract modifications and hedge accounting apply to derivatives that are affected by the discounting transition. We adopted ASU 2021-01 upon its issuance and the adoption of this standard did not have a material impact on our consolidated financial statements.
Reclassifications—The following line items on our consolidated statement of cash flows for the nine months ended September 30, 2020 were reclassified to conform to current year presentation:
• Return on Investment in Unconsolidated Joint Ventures was listed on a separate line from Other Assets, Net; and • Net Change in Credit Facility was separated into two lines, Proceeds from Revolving Credit Facility and Payments on
Revolving Credit Facility.
PHILLIPS EDISON & COMPANYSEPTEMBER 30, 2021 FORM 10-Q 9

3. LEASES
Lessor—The majority of our leases are largely similar in that the leased asset is retail space within our properties, and the lease agreements generally contain similar provisions and features, without substantial variations. All of our leases are currently classified as operating leases. Lease income related to our operating leases was as follows for the three and nine months ended September 30, 2021 and 2020 (in thousands):
Three Months Ended September 30, Nine Months Ended September 30,
2021 2020 2021 2020
Rental income related to fixed lease payments(1) $ 95,080 $ 94,511 $ 284,531 $ 285,572
Rental income related to variable lease payments(1)(2) 29,919 31,781 88,774 94,278
Straight-line rent amortization(3) 2,365 1,772 6,627 3,103
Amortization of lease assets 898 802 2,602 2,367
Lease buyout income 560 664 3,138 972
Adjustments for collectibility(4) 4 (6,232) 1,112 (18,874)
Total rental income $ 128,826 $ 123,298 $ 386,784 $ 367,418 (1) Includes rental income related to lease payments before assessing for collectibility.(2) Variable payments are primarily related to tenant recovery income.(3) For the three and nine months ended September 30, 2021, includes unfavorable revenue adjustments to straight-line rent for tenants
considered non-creditworthy of $0.2 million and $0.6 million, respectively. Includes favorable adjustments for the three months ended September 30, 2020 of $0.3 million, and unfavorable adjustments of $2.9 million for the nine months ended September 30, 2020.
(4) Includes general reserves as well as adjustments for tenants not considered creditworthy for which we are recording revenue on a cash basis, per ASC Topic 842, Leases (“ASC 842”).
For the three and nine months ended September 30, 2021, we had net favorable changes to general reserves of $0.5 million and $4.6 million, respectively. Additionally, we had net unfavorable adjustments of $0.5 million and $3.5 million, respectively, related to monthly revenue for tenants that we deemed non-creditworthy and for which we were recording revenue on a cash basis.
For the three and nine months ended September 30, 2020, we had net unfavorable adjustments of $0.8 million and $1.7 million, respectively, related to general reserve collections. Additionally, we had net unfavorable adjustments of $5.5 million and $17.2 million, respectively, related to monthly revenue for tenants that we deemed non-creditworthy and for which we were recording revenue on a cash basis.
Approximate future fixed contractual lease payments to be received under non-cancelable operating leases in effect as of September 30, 2021, assuming no new or renegotiated leases or option extensions on lease agreements, and including the impact of rent abatements, payment plans, and tenants who have been moved to the cash basis of accounting for revenue recognition purposes are as follows (in thousands):
Year Amount
Remaining 2021 $ 95,360
2022 375,318
2023 332,359
2024 279,403
2025 225,293
Thereafter 568,425
Total $ 1,876,158
In response to the COVID-19 pandemic, we executed payment plans with our tenants. As of September 30, 2021, we had $4.1 million of outstanding payment plans with our tenants and we expect to receive remaining amounts owed to us from these plans over a weighted-average term of approximately eleven months.
No single tenant comprised 7% or more of our aggregate annualized base rent (“ABR”) as of September 30, 2021. As of September 30, 2021, our wholly-owned real estate investments in Florida and California represented 12.4% and 10.1% of our ABR, respectively. As a result, the geographic concentration of our portfolio makes it particularly susceptible to adverse weather or economic events, including the impact of the COVID-19 pandemic, in the Florida and California real estate markets.
PHILLIPS EDISON & COMPANYSEPTEMBER 30, 2021 FORM 10-Q 10
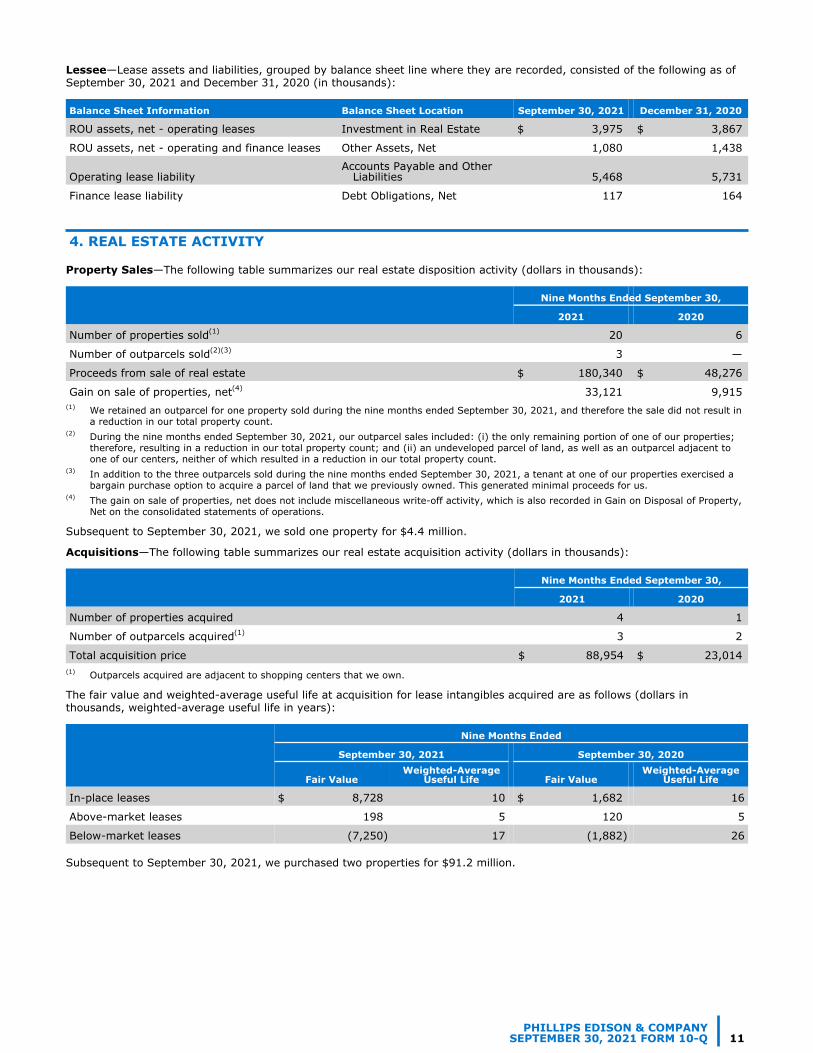
Lessee—Lease assets and liabilities, grouped by balance sheet line where they are recorded, consisted of the following as of September 30, 2021 and December 31, 2020 (in thousands):
Balance Sheet Information Balance Sheet Location September 30, 2021 December 31, 2020
ROU assets, net - operating leases Investment in Real Estate $ 3,975 $ 3,867
ROU assets, net - operating and finance leases Other Assets, Net 1,080 1,438
Operating lease liabilityAccounts Payable and Other Liabilities 5,468 5,731
Finance lease liability Debt Obligations, Net 117 164
4. REAL ESTATE ACTIVITY
Property Sales—The following table summarizes our real estate disposition activity (dollars in thousands):
Nine Months Ended September 30,
2021 2020
Number of properties sold(1) 20 6
Number of outparcels sold(2)(3) 3 —
Proceeds from sale of real estate $ 180,340 $ 48,276
Gain on sale of properties, net(4) 33,121 9,915 (1) We retained an outparcel for one property sold during the nine months ended September 30, 2021, and therefore the sale did not result in
a reduction in our total property count.(2) During the nine months ended September 30, 2021, our outparcel sales included: (i) the only remaining portion of one of our properties;
therefore, resulting in a reduction in our total property count; and (ii) an undeveloped parcel of land, as well as an outparcel adjacent to one of our centers, neither of which resulted in a reduction in our total property count.
(3) In addition to the three outparcels sold during the nine months ended September 30, 2021, a tenant at one of our properties exercised a bargain purchase option to acquire a parcel of land that we previously owned. This generated minimal proceeds for us.
(4) The gain on sale of properties, net does not include miscellaneous write-off activity, which is also recorded in Gain on Disposal of Property, Net on the consolidated statements of operations.
Subsequent to September 30, 2021, we sold one property for $4.4 million.
Acquisitions—The following table summarizes our real estate acquisition activity (dollars in thousands):
Nine Months Ended September 30,
2021 2020
Number of properties acquired 4 1
Number of outparcels acquired(1) 3 2
Total acquisition price $ 88,954 $ 23,014 (1) Outparcels acquired are adjacent to shopping centers that we own.
The fair value and weighted-average useful life at acquisition for lease intangibles acquired are as follows (dollars in thousands, weighted-average useful life in years):
Nine Months Ended
September 30, 2021 September 30, 2020
Fair ValueWeighted-Average
Useful Life Fair ValueWeighted-Average
Useful Life
In-place leases $ 8,728 10 $ 1,682 16
Above-market leases 198 5 120 5
Below-market leases (7,250) 17 (1,882) 26
Subsequent to September 30, 2021, we purchased two properties for $91.2 million.
PHILLIPS EDISON & COMPANYSEPTEMBER 30, 2021 FORM 10-Q 11
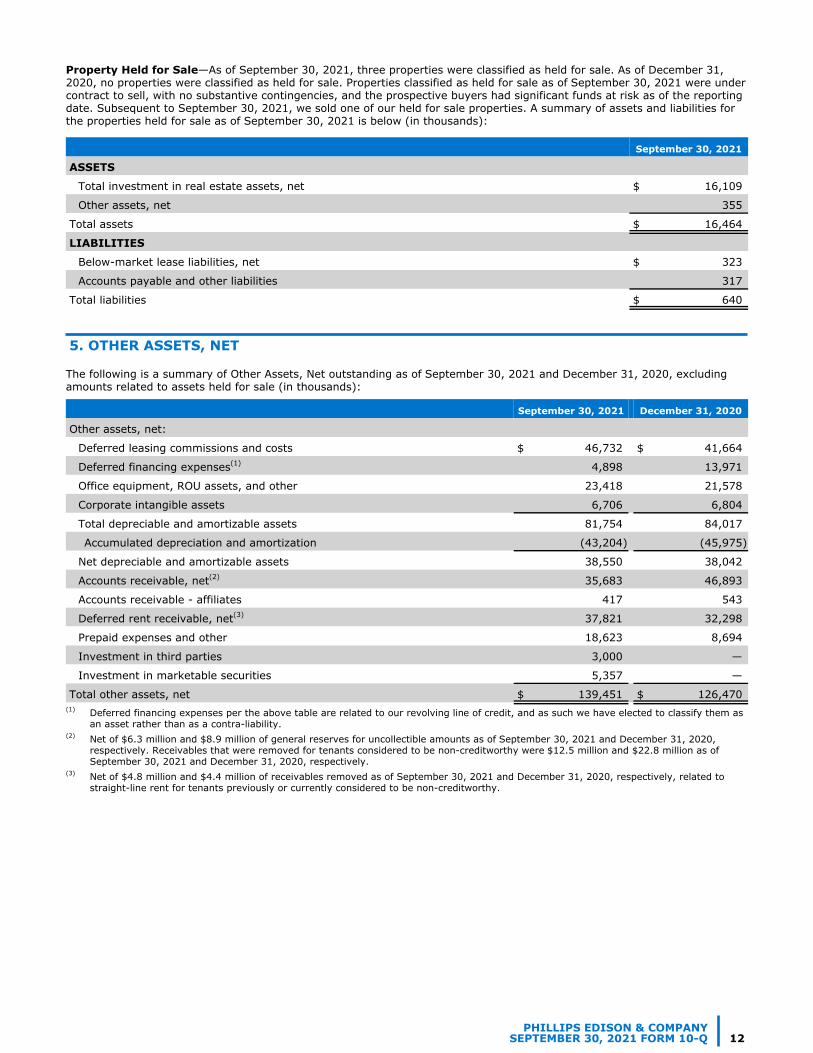
Property Held for Sale—As of September 30, 2021, three properties were classified as held for sale. As of December 31, 2020, no properties were classified as held for sale. Properties classified as held for sale as of September 30, 2021 were under contract to sell, with no substantive contingencies, and the prospective buyers had significant funds at risk as of the reporting date. Subsequent to September 30, 2021, we sold one of our held for sale properties. A summary of assets and liabilities for the properties held for sale as of September 30, 2021 is below (in thousands):
September 30, 2021
ASSETS
Total investment in real estate assets, net $ 16,109
Other assets, net 355
Total assets $ 16,464
LIABILITIES
Below-market lease liabilities, net $ 323
Accounts payable and other liabilities 317
Total liabilities $ 640
5. OTHER ASSETS, NET
The following is a summary of Other Assets, Net outstanding as of September 30, 2021 and December 31, 2020, excluding amounts related to assets held for sale (in thousands):
September 30, 2021 December 31, 2020
Other assets, net:
Deferred leasing commissions and costs $ 46,732 $ 41,664
Deferred financing expenses(1) 4,898 13,971
Office equipment, ROU assets, and other 23,418 21,578
Corporate intangible assets 6,706 6,804
Total depreciable and amortizable assets 81,754 84,017
Accumulated depreciation and amortization (43,204) (45,975)
Net depreciable and amortizable assets 38,550 38,042
Accounts receivable, net(2) 35,683 46,893
Accounts receivable - affiliates 417 543
Deferred rent receivable, net(3) 37,821 32,298
Prepaid expenses and other 18,623 8,694
Investment in third parties 3,000 —
Investment in marketable securities 5,357 —
Total other assets, net $ 139,451 $ 126,470 (1) Deferred financing expenses per the above table are related to our revolving line of credit, and as such we have elected to classify them as
an asset rather than as a contra-liability.(2) Net of $6.3 million and $8.9 million of general reserves for uncollectible amounts as of September 30, 2021 and December 31, 2020,
respectively. Receivables that were removed for tenants considered to be non-creditworthy were $12.5 million and $22.8 million as of September 30, 2021 and December 31, 2020, respectively.
(3) Net of $4.8 million and $4.4 million of receivables removed as of September 30, 2021 and December 31, 2020, respectively, related to straight-line rent for tenants previously or currently considered to be non-creditworthy.
PHILLIPS EDISON & COMPANYSEPTEMBER 30, 2021 FORM 10-Q 12
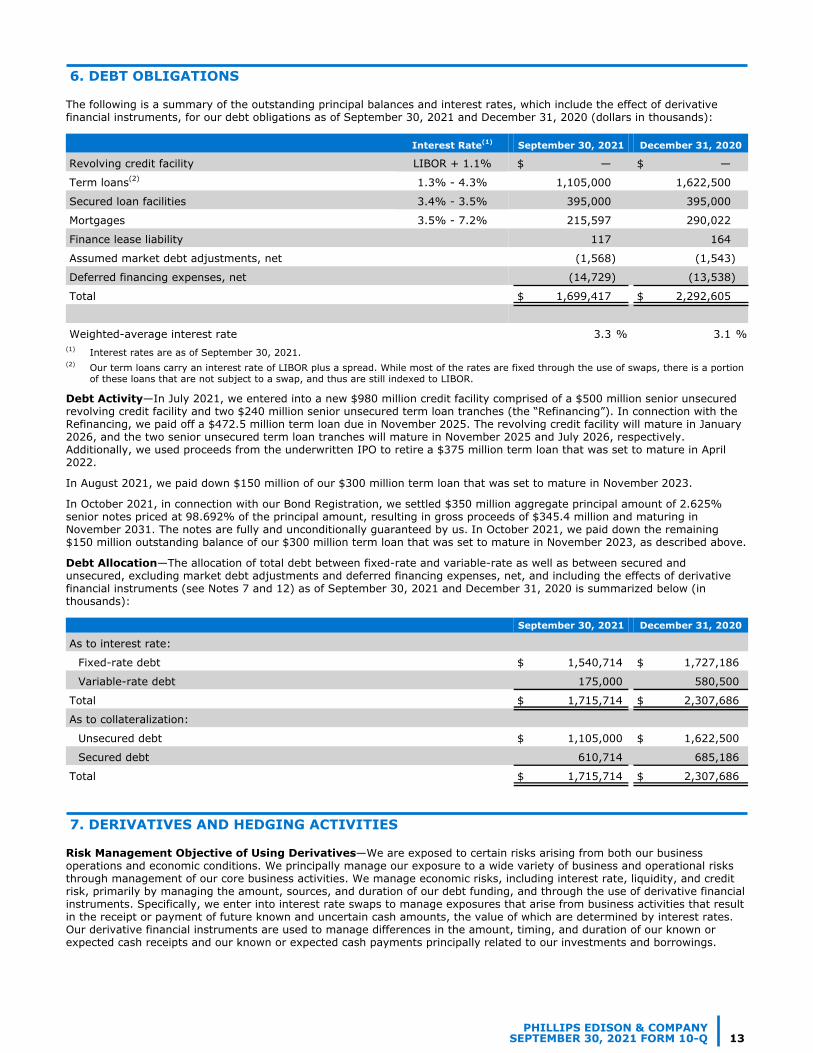
6. DEBT OBLIGATIONS
The following is a summary of the outstanding principal balances and interest rates, which include the effect of derivative financial instruments, for our debt obligations as of September 30, 2021 and December 31, 2020 (dollars in thousands):
Interest Rate(1) September 30, 2021 December 31, 2020
Revolving credit facility LIBOR + 1.1% $ — $ —
Term loans(2) 1.3% - 4.3% 1,105,000 1,622,500
Secured loan facilities 3.4% - 3.5% 395,000 395,000
Mortgages 3.5% - 7.2% 215,597 290,022
Finance lease liability 117 164
Assumed market debt adjustments, net (1,568) (1,543)
Deferred financing expenses, net (14,729) (13,538)
Total $ 1,699,417 $ 2,292,605
Weighted-average interest rate 3.3 % 3.1 %(1) Interest rates are as of September 30, 2021.(2) Our term loans carry an interest rate of LIBOR plus a spread. While most of the rates are fixed through the use of swaps, there is a portion
of these loans that are not subject to a swap, and thus are still indexed to LIBOR.
Debt Activity—In July 2021, we entered into a new $980 million credit facility comprised of a $500 million senior unsecured revolving credit facility and two $240 million senior unsecured term loan tranches (the “Refinancing”). In connection with the Refinancing, we paid off a $472.5 million term loan due in November 2025. The revolving credit facility will mature in January 2026, and the two senior unsecured term loan tranches will mature in November 2025 and July 2026, respectively. Additionally, we used proceeds from the underwritten IPO to retire a $375 million term loan that was set to mature in April 2022.
In August 2021, we paid down $150 million of our $300 million term loan that was set to mature in November 2023.
In October 2021, in connection with our Bond Registration, we settled $350 million aggregate principal amount of 2.625% senior notes priced at 98.692% of the principal amount, resulting in gross proceeds of $345.4 million and maturing in November 2031. The notes are fully and unconditionally guaranteed by us. In October 2021, we paid down the remaining $150 million outstanding balance of our $300 million term loan that was set to mature in November 2023, as described above.
Debt Allocation—The allocation of total debt between fixed-rate and variable-rate as well as between secured and unsecured, excluding market debt adjustments and deferred financing expenses, net, and including the effects of derivative financial instruments (see Notes 7 and 12) as of September 30, 2021 and December 31, 2020 is summarized below (in thousands):
September 30, 2021 December 31, 2020
As to interest rate:
Fixed-rate debt $ 1,540,714 $ 1,727,186
Variable-rate debt 175,000 580,500
Total $ 1,715,714 $ 2,307,686
As to collateralization:
Unsecured debt $ 1,105,000 $ 1,622,500
Secured debt 610,714 685,186
Total $ 1,715,714 $ 2,307,686
7. DERIVATIVES AND HEDGING ACTIVITIES
Risk Management Objective of Using Derivatives—We are exposed to certain risks arising from both our business operations and economic conditions. We principally manage our exposure to a wide variety of business and operational risks through management of our core business activities. We manage economic risks, including interest rate, liquidity, and credit risk, primarily by managing the amount, sources, and duration of our debt funding, and through the use of derivative financial instruments. Specifically, we enter into interest rate swaps to manage exposures that arise from business activities that result in the receipt or payment of future known and uncertain cash amounts, the value of which are determined by interest rates. Our derivative financial instruments are used to manage differences in the amount, timing, and duration of our known or expected cash receipts and our known or expected cash payments principally related to our investments and borrowings.
PHILLIPS EDISON & COMPANYSEPTEMBER 30, 2021 FORM 10-Q 13
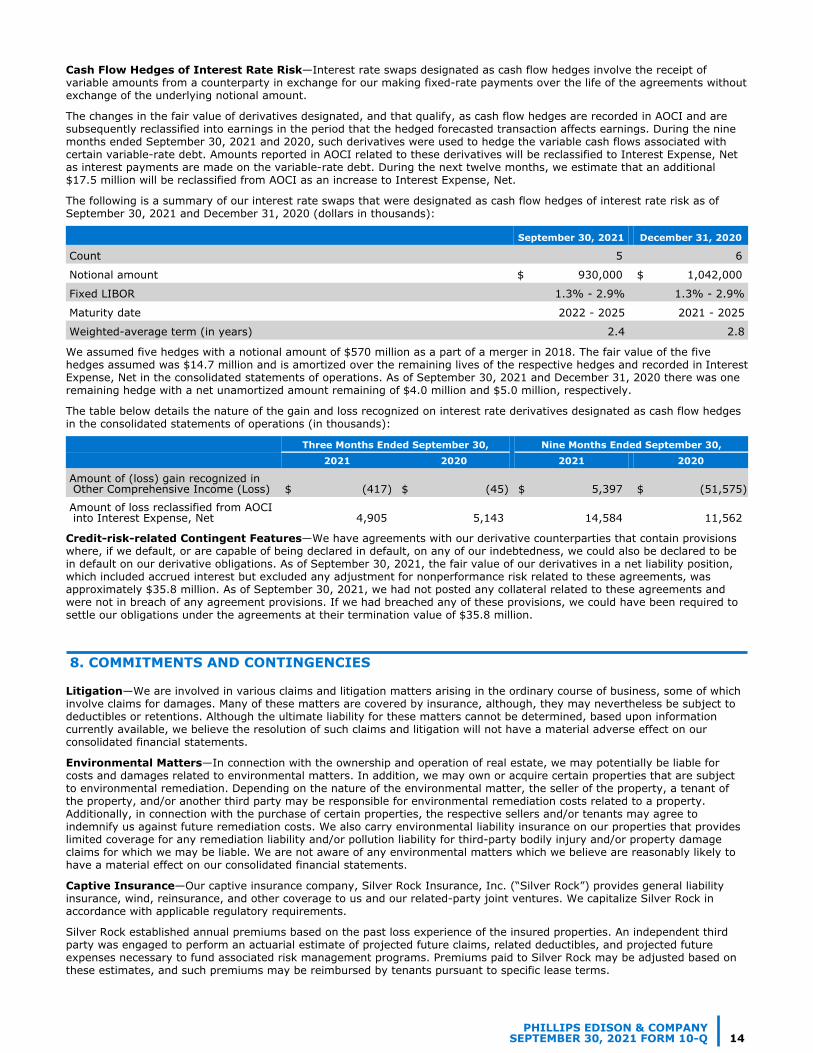
Cash Flow Hedges of Interest Rate Risk—Interest rate swaps designated as cash flow hedges involve the receipt of variable amounts from a counterparty in exchange for our making fixed-rate payments over the life of the agreements without exchange of the underlying notional amount.
The changes in the fair value of derivatives designated, and that qualify, as cash flow hedges are recorded in AOCI and are subsequently reclassified into earnings in the period that the hedged forecasted transaction affects earnings. During the nine months ended September 30, 2021 and 2020, such derivatives were used to hedge the variable cash flows associated with certain variable-rate debt. Amounts reported in AOCI related to these derivatives will be reclassified to Interest Expense, Net as interest payments are made on the variable-rate debt. During the next twelve months, we estimate that an additional $17.5 million will be reclassified from AOCI as an increase to Interest Expense, Net.
The following is a summary of our interest rate swaps that were designated as cash flow hedges of interest rate risk as of September 30, 2021 and December 31, 2020 (dollars in thousands):
September 30, 2021 December 31, 2020
Count 5 6
Notional amount $ 930,000 $ 1,042,000
Fixed LIBOR 1.3% - 2.9% 1.3% - 2.9%
Maturity date 2022 - 2025 2021 - 2025
Weighted-average term (in years) 2.4 2.8
We assumed five hedges with a notional amount of $570 million as a part of a merger in 2018. The fair value of the five hedges assumed was $14.7 million and is amortized over the remaining lives of the respective hedges and recorded in Interest Expense, Net in the consolidated statements of operations. As of September 30, 2021 and December 31, 2020 there was one remaining hedge with a net unamortized amount remaining of $4.0 million and $5.0 million, respectively.
The table below details the nature of the gain and loss recognized on interest rate derivatives designated as cash flow hedges in the consolidated statements of operations (in thousands):
Three Months Ended September 30, Nine Months Ended September 30, 2021 2020 2021 2020
Amount of (loss) gain recognized in Other Comprehensive Income (Loss) $ (417) $ (45) $ 5,397 $ (51,575)
Amount of loss reclassified from AOCI into Interest Expense, Net 4,905 5,143 14,584 11,562
Credit-risk-related Contingent Features—We have agreements with our derivative counterparties that contain provisions where, if we default, or are capable of being declared in default, on any of our indebtedness, we could also be declared to be in default on our derivative obligations. As of September 30, 2021, the fair value of our derivatives in a net liability position, which included accrued interest but excluded any adjustment for nonperformance risk related to these agreements, was approximately $35.8 million. As of September 30, 2021, we had not posted any collateral related to these agreements and were not in breach of any agreement provisions. If we had breached any of these provisions, we could have been required to settle our obligations under the agreements at their termination value of $35.8 million.
8. COMMITMENTS AND CONTINGENCIES
Litigation—We are involved in various claims and litigation matters arising in the ordinary course of business, some of which involve claims for damages. Many of these matters are covered by insurance, although, they may nevertheless be subject to deductibles or retentions. Although the ultimate liability for these matters cannot be determined, based upon information currently available, we believe the resolution of such claims and litigation will not have a material adverse effect on our consolidated financial statements.
Environmental Matters—In connection with the ownership and operation of real estate, we may potentially be liable for costs and damages related to environmental matters. In addition, we may own or acquire certain properties that are subject to environmental remediation. Depending on the nature of the environmental matter, the seller of the property, a tenant of the property, and/or another third party may be responsible for environmental remediation costs related to a property. Additionally, in connection with the purchase of certain properties, the respective sellers and/or tenants may agree to indemnify us against future remediation costs. We also carry environmental liability insurance on our properties that provides limited coverage for any remediation liability and/or pollution liability for third-party bodily injury and/or property damage claims for which we may be liable. We are not aware of any environmental matters which we believe are reasonably likely to have a material effect on our consolidated financial statements.
Captive Insurance—Our captive insurance company, Silver Rock Insurance, Inc. (“Silver Rock”) provides general liability insurance, wind, reinsurance, and other coverage to us and our related-party joint ventures. We capitalize Silver Rock in accordance with applicable regulatory requirements.
Silver Rock established annual premiums based on the past loss experience of the insured properties. An independent third party was engaged to perform an actuarial estimate of projected future claims, related deductibles, and projected future expenses necessary to fund associated risk management programs. Premiums paid to Silver Rock may be adjusted based on these estimates, and such premiums may be reimbursed by tenants pursuant to specific lease terms.
PHILLIPS EDISON & COMPANYSEPTEMBER 30, 2021 FORM 10-Q 14
As of September 30, 2021, we had four letters of credit outstanding totaling approximately $9.0 million to provide security for our obligations under Silver Rock’s insurance and reinsurance contracts.
9. EQUITY
General—The holders of common stock are entitled to one vote per share on all matters voted on by stockholders, including one vote per nominee in the election of the Board. Our charter does not provide for cumulative voting in the election of directors.
Reverse Stock Split—On July 2, 2021, we effected a one-for-three reverse stock split. Concurrent with the reverse split, the Operating Partnership enacted a one-for-three reverse split of its outstanding OP units. Neither the number of authorized shares nor the par value of the common stock were impacted. As a result of the reverse split, every three shares of our common stock or OP units were automatically combined and converted into one issued and outstanding share of common stock or OP unit rounded to the nearest 1/100th share. The reverse stock split impacts all common stock and OP units proportionately and had no impact on any stockholder’s percentage ownership of common stock.
In connection with the reverse stock split, the number of shares of common stock and OP units underlying the outstanding share-based awards was also proportionately reduced. All references to shares of common stock, number of OP units, and per share data for all periods presented in our consolidated financial statements and notes have been adjusted to reflect the reverse split on a retroactive basis.
Class B Common Stock—On June 18, 2021, our stockholders approved Articles of Amendment that effected the Recapitalization, wherein each share of our common stock outstanding at the time the amendment became effective was converted into one share of a newly created class of Class B common stock.
Our Class B common stock is identical to our common stock, except that (i) our Class B common stock is not listed on a national securities exchange, and (ii) upon the six month anniversary of the listing of our common stock for trading on a national securities exchange, or January 15, 2022 (or such earlier date or dates as may be approved by our Board in certain circumstances with respect to all or any portion of the outstanding shares of our Class B common stock), each share of our Class B common stock will automatically, and without any stockholder action, convert into one share of our listed common stock.
Underwritten IPO—On July 19, 2021, we completed an underwritten IPO and issued 17.0 million shares of common stock at an offering price to the public of $28.00 per share. We used a portion of the net proceeds to reduce our leverage and expect to use the remaining amount to fund external growth with property acquisitions and for other general corporate uses. As part of the underwritten IPO, underwriters were granted an option exercisable within 30 days from July 14, 2021 to purchase up to an additional 2.55 million shares of common stock at the underwritten IPO price, less underwriting discounts and commissions. On July 29, 2021, the underwriters exercised their option. The underwritten IPO, including the underwriters overallotment election, resulted in gross proceeds of $547.4 million.
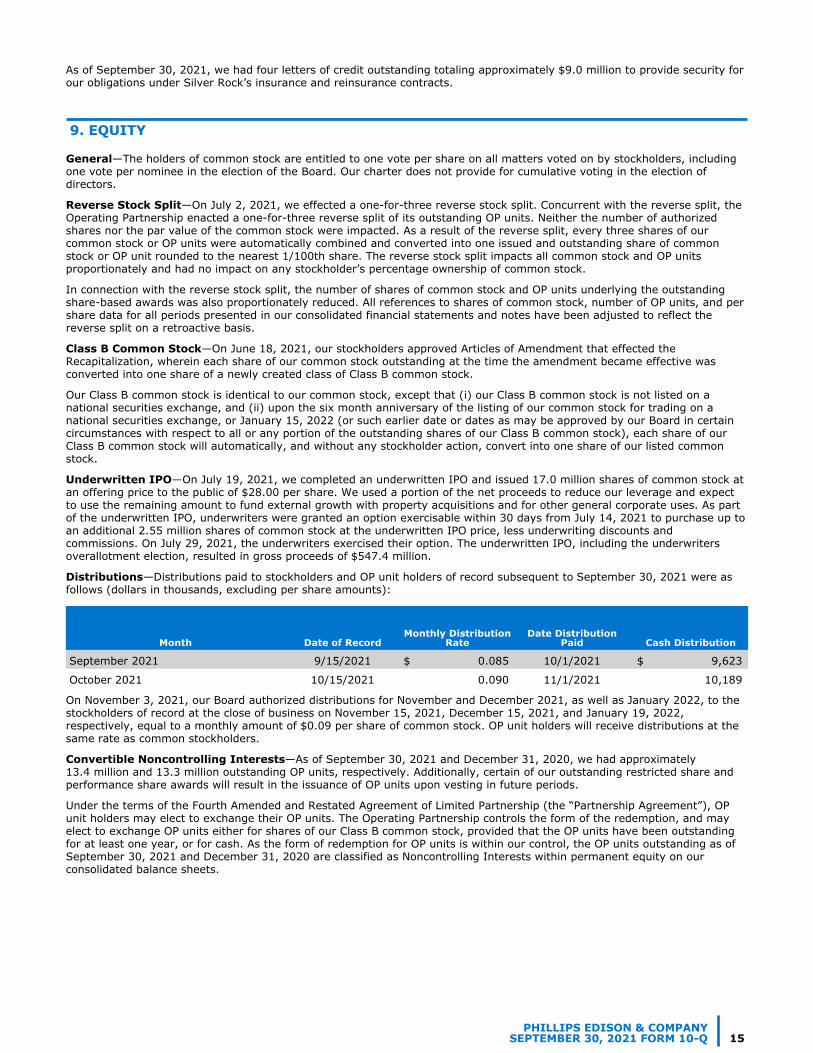
Distributions—Distributions paid to stockholders and OP unit holders of record subsequent to September 30, 2021 were as follows (dollars in thousands, excluding per share amounts):
Month Date of RecordMonthly Distribution
RateDate Distribution
Paid Cash Distribution
September 2021 9/15/2021 $ 0.085 10/1/2021 $ 9,623
October 2021 10/15/2021 0.090 11/1/2021 10,189
On November 3, 2021, our Board authorized distributions for November and December 2021, as well as January 2022, to the stockholders of record at the close of business on November 15, 2021, December 15, 2021, and January 19, 2022, respectively, equal to a monthly amount of $0.09 per share of common stock. OP unit holders will receive distributions at the same rate as common stockholders.
Convertible Noncontrolling Interests—As of September 30, 2021 and December 31, 2020, we had approximately 13.4 million and 13.3 million outstanding OP units, respectively. Additionally, certain of our outstanding restricted share and performance share awards will result in the issuance of OP units upon vesting in future periods.
Under the terms of the Fourth Amended and Restated Agreement of Limited Partnership (the “Partnership Agreement”), OP unit holders may elect to exchange their OP units. The Operating Partnership controls the form of the redemption, and may elect to exchange OP units either for shares of our Class B common stock, provided that the OP units have been outstanding for at least one year, or for cash. As the form of redemption for OP units is within our control, the OP units outstanding as of September 30, 2021 and December 31, 2020 are classified as Noncontrolling Interests within permanent equity on our consolidated balance sheets.
PHILLIPS EDISON & COMPANYSEPTEMBER 30, 2021 FORM 10-Q 15

The table below is a summary of our OP unit activity for the three and nine months ended September 30, 2021 and 2020 (dollars and shares in thousands):
Three Months Ended September 30, Nine Months Ended September 30,
2021 2020 2021 2020
OP units converted into shares of Class B common stock(1) — — 28 56
Distributions paid on OP units(2) $ 3,536 $ — $ 10,315 $ 7,105 (1) OP units are converted into shares of our Class B common stock at a 1:1 ratio.(2) Distributions paid on OP units are included in Distributions to Noncontrolling Interests on the consolidated statements of equity.
Underwritten IPO Grants—In connection with our underwritten IPO, we issued a total of 0.5 million restricted stock units (“RSUs”), inclusive of 0.3 million OP units, and restricted stock awards in the form of time-based stock compensation awards with expenses included within Other (Expense) Income, Net. The shares have a grant price of $28.00 per share and, with the exception of one individual whose award is subject to accelerated vesting provisions, 50% of the shares will vest after 18 months and the remaining 50% will vest after 36 months.
Estimated Value per Share—Prior to our underwritten IPO, on April 29, 2021, our Board increased the estimated value per share (“EVPS”) of our common stock to $31.65 based substantially on the estimated market value of our portfolio of real estate properties and our third-party investment management business as of March 31, 2021. We engaged a third-party valuation firm to provide a calculation of the range in EVPS of our common stock as of March 31, 2021, which reflected certain balance sheet assets and liabilities as of that date. Previously, our EVPS was $26.25, based substantially on the estimated market value of our portfolio of real estate properties and our third-party investment management business as of March 31, 2020.
Dividend Reinvestment Plan and Share Repurchase Program (“SRP”)—On August 4, 2021, as a result of our underwritten IPO, our Board approved the termination of the DRIP and the SRP.
10. EARNINGS PER SHARE
We use the two-class method of computing earnings per share (“EPS”), which is an earnings allocation formula that determines EPS for common stock and any participating securities according to dividends declared (whether paid or unpaid). Under the two-class method, basic EPS is computed by dividing Net Income Attributable to Stockholders by the weighted-average number of shares of common stock outstanding for the period. Diluted EPS reflects the potential dilution that could occur from share equivalent activity.
OP units held by limited partners other than us are considered to be participating securities because they contain non-forfeitable rights to dividends or dividend equivalents, and have the potential to be exchanged for an equal number of shares of our common stock in accordance with the terms of the Partnership Agreement.
The impact of these outstanding OP units on basic and diluted EPS has been calculated using the two-class method whereby earnings are allocated to the OP units based on dividends declared and the OP units’ participation rights in undistributed earnings. The effects of the two-class method on basic and diluted EPS were immaterial to the consolidated financial statements during the three and nine months ended September 30, 2021 and 2020.
The following table provides a reconciliation of the numerator and denominator of the earnings per share calculations, restated for prior periods to display the effect of the reverse split (in thousands, except per share amounts):
Three Months Ended September 30,
Nine Months Ended September 30,
2021 2020 2021 2020
Numerator:
Net income attributable to stockholders - basic $ 14,633 $ 11,784 $ 20,330 $ 15,965
Net income attributable to convertible OP units(1) 1,929 1,646 2,739 2,251
Net income - diluted $ 16,562 $ 13,430 $ 23,069 $ 18,216
Denominator:
Weighted-average shares - basic(2) 108,997 96,822 98,761 96,765
OP units(1) 13,388 14,247 13,371 14,264
Dilutive restricted stock awards 188 119 185 131
Adjusted weighted-average shares - diluted 122,573 111,188 112,317 111,160
Earnings per share of common stock:
Basic and diluted income per share $ 0.13 $ 0.12 $ 0.21 $ 0.16 (1) OP units include units that are convertible into Class B common stock or cash, at the Operating Partnership’s option. The Operating
Partnership income or loss attributable to these OP units, which is included as a component of Net Income Attributable to Noncontrolling Interests on the consolidated statements of operations, has been added back in the numerator as these OP units were included in the
PHILLIPS EDISON & COMPANYSEPTEMBER 30, 2021 FORM 10-Q 16
denominator for all periods presented. OP units are allocated income on a consistent basis with the common stockholder and therefore have no dilutive impact to earnings per share of common stock.
(2) Includes 93.7 million weighted-average shares of Class B common stock and 15.3 million weighted-average shares of common stock.
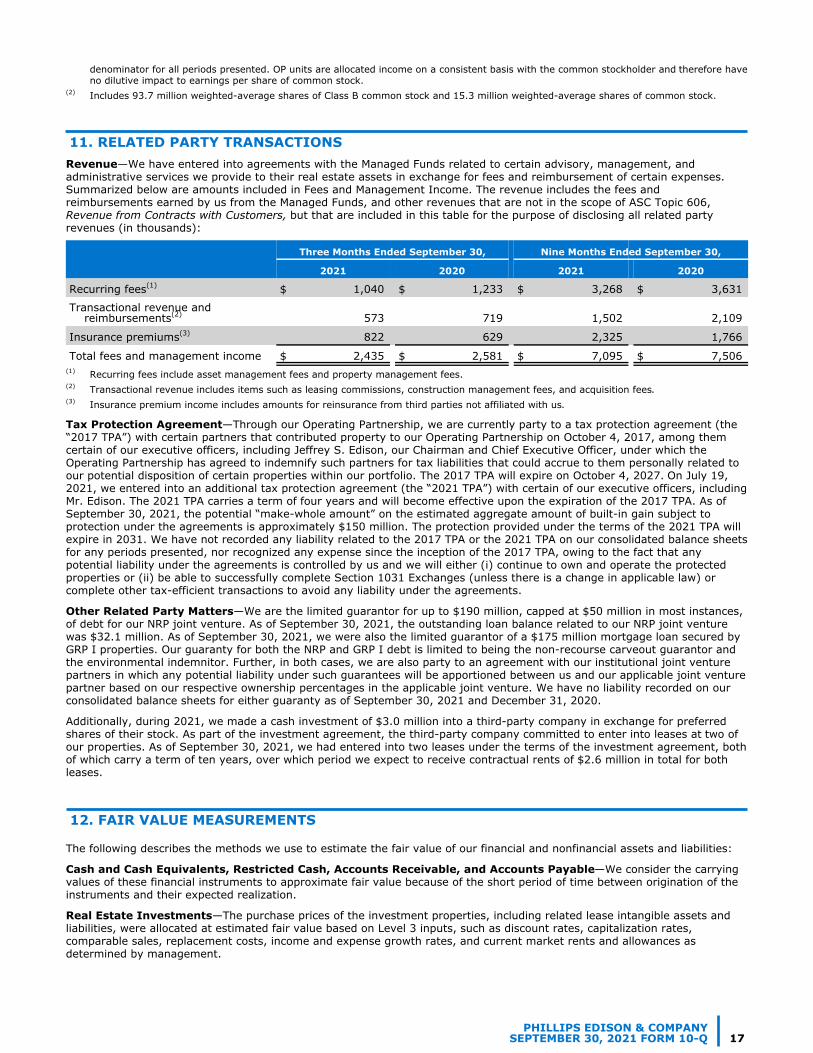
11. RELATED PARTY TRANSACTIONSRevenue—We have entered into agreements with the Managed Funds related to certain advisory, management, and administrative services we provide to their real estate assets in exchange for fees and reimbursement of certain expenses. Summarized below are amounts included in Fees and Management Income. The revenue includes the fees and reimbursements earned by us from the Managed Funds, and other revenues that are not in the scope of ASC Topic 606, Revenue from Contracts with Customers, but that are included in this table for the purpose of disclosing all related party revenues (in thousands):
Three Months Ended September 30, Nine Months Ended September 30,
2021 2020 2021 2020
Recurring fees(1) $ 1,040 $ 1,233 $ 3,268 $ 3,631
Transactional revenue and reimbursements(2) 573 719 1,502 2,109
Insurance premiums(3) 822 629 2,325 1,766
Total fees and management income $ 2,435 $ 2,581 $ 7,095 $ 7,506 (1) Recurring fees include asset management fees and property management fees. (2) Transactional revenue includes items such as leasing commissions, construction management fees, and acquisition fees.(3) Insurance premium income includes amounts for reinsurance from third parties not affiliated with us.
Tax Protection Agreement—Through our Operating Partnership, we are currently party to a tax protection agreement (the “2017 TPA”) with certain partners that contributed property to our Operating Partnership on October 4, 2017, among them certain of our executive officers, including Jeffrey S. Edison, our Chairman and Chief Executive Officer, under which the Operating Partnership has agreed to indemnify such partners for tax liabilities that could accrue to them personally related to our potential disposition of certain properties within our portfolio. The 2017 TPA will expire on October 4, 2027. On July 19, 2021, we entered into an additional tax protection agreement (the “2021 TPA”) with certain of our executive officers, including Mr. Edison. The 2021 TPA carries a term of four years and will become effective upon the expiration of the 2017 TPA. As of September 30, 2021, the potential “make-whole amount” on the estimated aggregate amount of built-in gain subject to protection under the agreements is approximately $150 million. The protection provided under the terms of the 2021 TPA will expire in 2031. We have not recorded any liability related to the 2017 TPA or the 2021 TPA on our consolidated balance sheets for any periods presented, nor recognized any expense since the inception of the 2017 TPA, owing to the fact that any potential liability under the agreements is controlled by us and we will either (i) continue to own and operate the protected properties or (ii) be able to successfully complete Section 1031 Exchanges (unless there is a change in applicable law) or complete other tax-efficient transactions to avoid any liability under the agreements.
Other Related Party Matters—We are the limited guarantor for up to $190 million, capped at $50 million in most instances, of debt for our NRP joint venture. As of September 30, 2021, the outstanding loan balance related to our NRP joint venture was $32.1 million. As of September 30, 2021, we were also the limited guarantor of a $175 million mortgage loan secured by GRP I properties. Our guaranty for both the NRP and GRP I debt is limited to being the non-recourse carveout guarantor and the environmental indemnitor. Further, in both cases, we are also party to an agreement with our institutional joint venture partners in which any potential liability under such guarantees will be apportioned between us and our applicable joint venture partner based on our respective ownership percentages in the applicable joint venture. We have no liability recorded on our consolidated balance sheets for either guaranty as of September 30, 2021 and December 31, 2020.
Additionally, during 2021, we made a cash investment of $3.0 million into a third-party company in exchange for preferred shares of their stock. As part of the investment agreement, the third-party company committed to enter into leases at two of our properties. As of September 30, 2021, we had entered into two leases under the terms of the investment agreement, both of which carry a term of ten years, over which period we expect to receive contractual rents of $2.6 million in total for both leases.
12. FAIR VALUE MEASUREMENTS
The following describes the methods we use to estimate the fair value of our financial and nonfinancial assets and liabilities:
Cash and Cash Equivalents, Restricted Cash, Accounts Receivable, and Accounts Payable—We consider the carrying values of these financial instruments to approximate fair value because of the short period of time between origination of the instruments and their expected realization.
Real Estate Investments—The purchase prices of the investment properties, including related lease intangible assets and liabilities, were allocated at estimated fair value based on Level 3 inputs, such as discount rates, capitalization rates, comparable sales, replacement costs, income and expense growth rates, and current market rents and allowances as determined by management.
PHILLIPS EDISON & COMPANYSEPTEMBER 30, 2021 FORM 10-Q 17
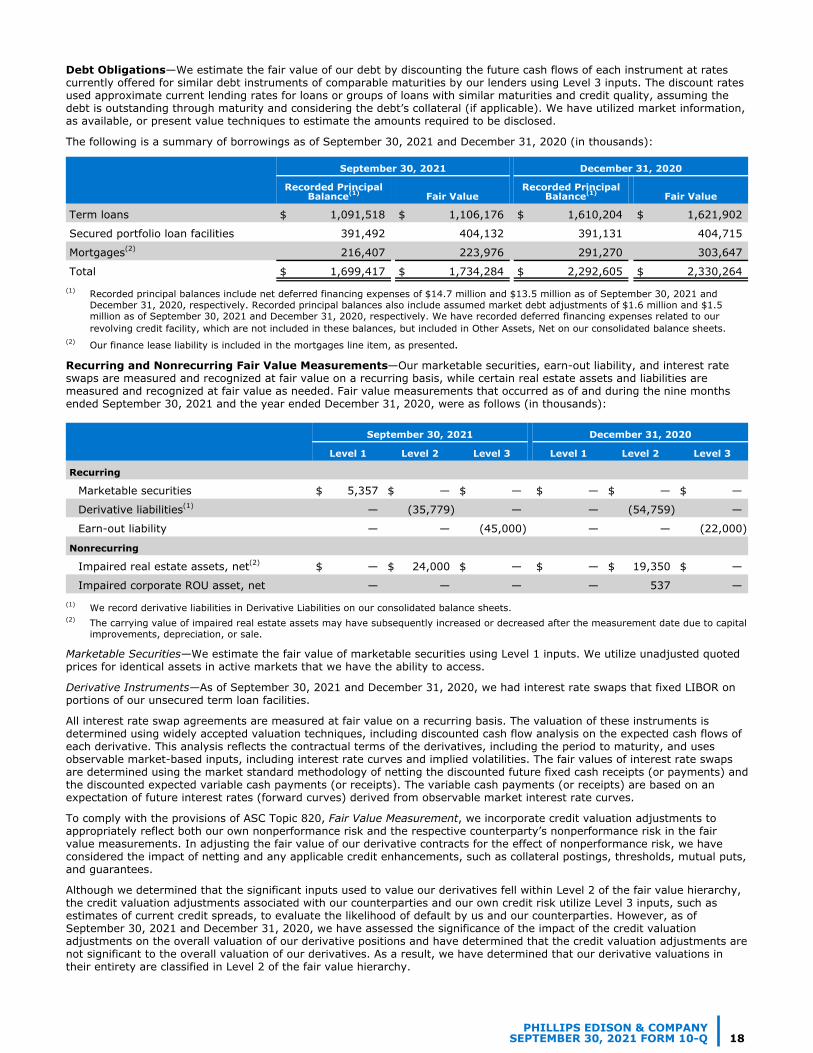
Debt Obligations—We estimate the fair value of our debt by discounting the future cash flows of each instrument at rates currently offered for similar debt instruments of comparable maturities by our lenders using Level 3 inputs. The discount rates used approximate current lending rates for loans or groups of loans with similar maturities and credit quality, assuming the debt is outstanding through maturity and considering the debt’s collateral (if applicable). We have utilized market information, as available, or present value techniques to estimate the amounts required to be disclosed.
The following is a summary of borrowings as of September 30, 2021 and December 31, 2020 (in thousands):
September 30, 2021 December 31, 2020
Recorded Principal Balance(1) Fair Value
Recorded Principal Balance(1) Fair Value
Term loans $ 1,091,518 $ 1,106,176 $ 1,610,204 $ 1,621,902
Secured portfolio loan facilities 391,492 404,132 391,131 404,715
Mortgages(2) 216,407 223,976 291,270 303,647
Total $ 1,699,417 $ 1,734,284 $ 2,292,605 $ 2,330,264 (1) Recorded principal balances include net deferred financing expenses of $14.7 million and $13.5 million as of September 30, 2021 and
December 31, 2020, respectively. Recorded principal balances also include assumed market debt adjustments of $1.6 million and $1.5 million as of September 30, 2021 and December 31, 2020, respectively. We have recorded deferred financing expenses related to our revolving credit facility, which are not included in these balances, but included in Other Assets, Net on our consolidated balance sheets.
(2) Our finance lease liability is included in the mortgages line item, as presented.
Recurring and Nonrecurring Fair Value Measurements—Our marketable securities, earn-out liability, and interest rate swaps are measured and recognized at fair value on a recurring basis, while certain real estate assets and liabilities are measured and recognized at fair value as needed. Fair value measurements that occurred as of and during the nine months ended September 30, 2021 and the year ended December 31, 2020, were as follows (in thousands):
September 30, 2021 December 31, 2020
Level 1 Level 2 Level 3 Level 1 Level 2 Level 3
Recurring
Marketable securities $ 5,357 $ — $ — $ — $ — $ —
Derivative liabilities(1) — (35,779) — — (54,759) —
Earn-out liability — — (45,000) — — (22,000)
Nonrecurring
Impaired real estate assets, net(2) $ — $ 24,000 $ — $ — $ 19,350 $ —
Impaired corporate ROU asset, net — — — — 537 — (1) We record derivative liabilities in Derivative Liabilities on our consolidated balance sheets.(2) The carrying value of impaired real estate assets may have subsequently increased or decreased after the measurement date due to capital
improvements, depreciation, or sale.
Marketable Securities—We estimate the fair value of marketable securities using Level 1 inputs. We utilize unadjusted quoted prices for identical assets in active markets that we have the ability to access.
Derivative Instruments—As of September 30, 2021 and December 31, 2020, we had interest rate swaps that fixed LIBOR on portions of our unsecured term loan facilities.
All interest rate swap agreements are measured at fair value on a recurring basis. The valuation of these instruments is determined using widely accepted valuation techniques, including discounted cash flow analysis on the expected cash flows of each derivative. This analysis reflects the contractual terms of the derivatives, including the period to maturity, and uses observable market-based inputs, including interest rate curves and implied volatilities. The fair values of interest rate swaps are determined using the market standard methodology of netting the discounted future fixed cash receipts (or payments) and the discounted expected variable cash payments (or receipts). The variable cash payments (or receipts) are based on an expectation of future interest rates (forward curves) derived from observable market interest rate curves.
To comply with the provisions of ASC Topic 820, Fair Value Measurement, we incorporate credit valuation adjustments to appropriately reflect both our own nonperformance risk and the respective counterparty’s nonperformance risk in the fair value measurements. In adjusting the fair value of our derivative contracts for the effect of nonperformance risk, we have considered the impact of netting and any applicable credit enhancements, such as collateral postings, thresholds, mutual puts, and guarantees.
Although we determined that the significant inputs used to value our derivatives fell within Level 2 of the fair value hierarchy, the credit valuation adjustments associated with our counterparties and our own credit risk utilize Level 3 inputs, such as estimates of current credit spreads, to evaluate the likelihood of default by us and our counterparties. However, as of September 30, 2021 and December 31, 2020, we have assessed the significance of the impact of the credit valuation adjustments on the overall valuation of our derivative positions and have determined that the credit valuation adjustments are not significant to the overall valuation of our derivatives. As a result, we have determined that our derivative valuations in their entirety are classified in Level 2 of the fair value hierarchy.
PHILLIPS EDISON & COMPANYSEPTEMBER 30, 2021 FORM 10-Q 18
Earn-out—As part of our acquisition of Phillips Edison Limited Partnership (“PELP”) in 2017, an earn-out structure was established which gave PELP the opportunity to earn additional OP units based upon the potential achievement of certain performance targets subsequent to the acquisition. After the expiration of certain provisions in 2019, PELP is now eligible to earn a minimum of 1.0 million and a maximum of approximately 1.7 million OP units as contingent consideration based upon the timing and valuation of a liquidity event for PECO. Certain of these performance targets are tied to the post-underwritten IPO trading price of our common stock. The number of OP units awarded will vary based on the highest volume weighted average price per share of our common stock over any 30 consecutive trading day period during the 180 days following the underwritten IPO commencement (the “liquidity event price per share”):
• if the liquidity event price per share is greater than or equal to $33.60, PELP will receive approximately 1.7 million OP units;
• if the liquidity event price per share is less than $33.60 but greater than or equal to $26.40, PELP will receive a number of OP units equal to (i) 1.0 million plus (ii) the product of (A) approximately 0.7 million and (B) the quotient obtained by dividing the liquidity event price per share in excess of $26.40 by $7.20; or
• if the liquidity event price per share is less than $26.40, PELP will receive 1.0 million OP units.
Prior to the second quarter of 2021, we estimated the fair value of the earn-out liability on a quarterly basis using the Monte Carlo method. Following our underwritten IPO, the only remaining variable for calculating final amounts to be paid under the earn-out agreement was the liquidity event price per share. Therefore, as of September 30, 2021, we estimated the fair value of the liability related to the earn-out using a probability-weighted model to estimate the liquidity event price per share. In calculating the fair value of this liability as of September 30, 2021, we have determined that 1.4 million OP units have been earned with the possibility of up to an additional 0.3 million units being issued.
For the three months ended September 30, 2021, we recorded expense of $5.0 million related to the change in fair value of the earn-out liability. There was no change to the fair value of our earn-out liability for the three months ended September 30, 2020. We recorded expense of $23.0 million and income of $10.0 million, respectively, for the nine months ended September 30, 2021 and September 30, 2020 related to changes in the fair value of the earn-out liability. The increase in the fair value of the liability as of September 30, 2021 was attributable to the commencement of our underwritten IPO as well as improved market conditions in 2021. The change in fair value for each period has been recognized in Other (Expense) Income, Net in the consolidated statements of operations.
Real Estate Asset Impairment—Our real estate assets are measured and recognized at fair value, less costs to sell for held-for-sale properties, on a nonrecurring basis dependent upon when we determine an impairment has occurred. During the three and nine months ended September 30, 2021, we impaired assets that were under contract at a disposition price that was less than carrying value, or that had other operational impairment indicators. The valuation technique used for the fair value of all impaired real estate assets was the expected net sales proceeds, which we consider to be a Level 2 input in the fair value hierarchy. There were no impairment charges recorded during the three and nine months ended September 30, 2020.
On a quarterly basis, we employ a multi-step approach to assess our real estate assets for possible impairment and record any impairment charges identified. The first step is the identification of potential triggering events, such as significant decreases in occupancy or the presence of large dark or vacant spaces. If we observe any of these indicators for a shopping center, we then perform an additional screen test consisting of a years-to-recover analysis to determine if we will recover the net carrying value of the property over its remaining economic life based upon net operating income (“NOI”) as forecasted for the current year. In the event that the results of this first step indicate a triggering event for a center, we proceed to the second step, utilizing an undiscounted cash flow model for the center to identify potential impairment. If the undiscounted cash flows are less than the net book value of the center as of the balance sheet date, we proceed to the third step. In performing the third step, we utilize market data such as capitalization rates and sales price per square foot on comparable recent real estate transactions to estimate fair value of the real estate assets. We also utilize expected net sales proceeds to estimate the fair value of any centers that are actively being marketed for sale. If the estimated fair value of the property is less than the recorded net book value at the balance sheet date, we record an impairment charge.
In addition to these procedures, we also review undeveloped or unimproved land parcels that we own for evidence of impairment and record any impairment charges as necessary. Primary impairment triggers for these land parcels are changes to our plans or intentions with regards to such properties, or planned dispositions at prices that are less than the current carrying values.
It is possible that we could experience unanticipated changes in assumptions that are employed in our impairment review which could impact our cash flows and fair value conclusions. Such unanticipated changes relative to our expectations may include but are not limited to: increases or decreases in the duration or permanence of tenant closures, increases or decreases in collectibility reserves and write-offs, additional capital required to fill vacancies, extended lease-up periods, future closings of large tenants, changes in macroeconomic assumptions such as rate of inflation and capitalization rates, and changes to the estimated timing of disposition of the properties under review.
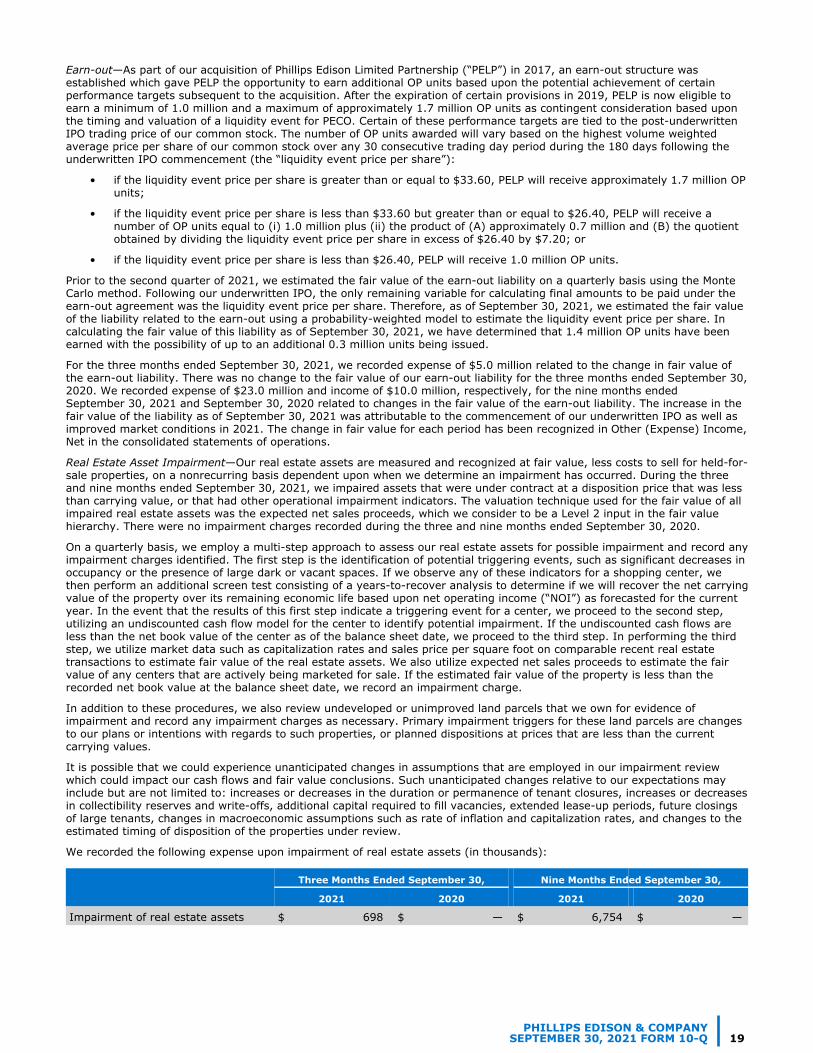
We recorded the following expense upon impairment of real estate assets (in thousands):
Three Months Ended September 30, Nine Months Ended September 30,
2021 2020 2021 2020
Impairment of real estate assets $ 698 $ — $ 6,754 $ —
PHILLIPS EDISON & COMPANYSEPTEMBER 30, 2021 FORM 10-Q 19

13. SUBSEQUENT EVENTS
In preparing the condensed and unaudited consolidated financial statements, we have evaluated subsequent events through the filing of this report on Form 10-Q for recognition and/or disclosure purposes. Based on this evaluation, we have determined that there were no events that have occurred that require recognition or disclosure, other than certain events and transactions that have been disclosed elsewhere in these consolidated financial statements.
PHILLIPS EDISON & COMPANYSEPTEMBER 30, 2021 FORM 10-Q 20
ITEM 2. MANAGEMENT’S DISCUSSION AND ANALYSIS OF FINANCIAL CONDITION AND RESULTS OF OPERATIONS
The following discussion and analysis should be read in conjunction with our accompanying consolidated financial statements and notes thereto. All references to “Notes” throughout this document refer to the footnotes to the consolidated financial statements in “Part I, Item 1. Financial Statements”. See also “Cautionary Note Regarding Forward-Looking Statements” below.
CAUTIONARY NOTE REGARDING FORWARD-LOOKING STATEMENTS
Certain statements contained in this Quarterly Report on Form 10-Q (this “Report”) of Phillips Edison & Company, Inc. (“we,” the “Company,” “our,” or “us”) other than historical facts may be considered forward-looking statements within the meaning of Section 27A of the Securities Act of 1933, as amended (the “Securities Act”), Section 21E of the Securities Exchange Act of 1934, as amended (the “Exchange Act”), and the Private Securities Litigation Reform Act of 1995 (collectively with the Securities Act and the Exchange Act, the “Acts”). We intend for all such forward-looking statements to be covered by the applicable safe harbor provisions for forward-looking statements contained in the Acts. Such forward-looking statements generally can be identified by the use of forward-looking terminology such as “may,” “will,” “can,” “expect,” “intend,” “anticipate,” “estimate,” “believe,” “continue,” “possible,” “initiatives,” “focus,” “seek,” “objective,” “goal,” “strategy,” “plan,” “potential,” “potentially,” “preparing,” “projected,” “future,” “long-term,” “once,” “should,” “could,” “would,” “might,” “uncertainty,” or other similar words. Readers are cautioned not to place undue reliance on these forward-looking statements, which speak only as of the date this report is filed with the SEC. Such statements include, but are not limited to, (a) statements about our plans, strategies, initiatives, and prospects; (b) statements about the COVID-19 pandemic, including its duration and potential or expected impact on our tenants, our business, and our view on forward trends; (c) statements about our underwritten incremental yields; and (d) statements about our future results of operations, capital expenditures, and liquidity. Such statements are subject to known and unknown risks and uncertainties, which could cause actual results to differ materially from those projected or anticipated, including, without limitation: (i) changes in national, regional, or local economic climates; (ii) local market conditions, including an oversupply of space in, or a reduction in demand for, properties similar to those in our portfolio; (iii) vacancies, changes in market rental rates, and the need to periodically repair, renovate, and re-let space; (iv) competition from other available shopping centers and the attractiveness of properties in our portfolio to our tenants; (v) the financial stability of our tenants, including, without limitation, their ability to pay rent; (vi) our ability to pay down, refinance, restructure, or extend our indebtedness as it becomes due; (vii) increases in our borrowing costs as a result of changes in interest rates and other factors, including the potential phasing out of LIBOR after 2021; (viii) potential liability for environmental matters; (ix) damage to our properties from catastrophic weather and other natural events, and the physical effects of climate change; (x) our ability and willingness to maintain our qualification as a REIT in light of economic, market, legal, tax, and other considerations; (xi) changes in tax, real estate, environmental, and zoning laws; (xii) information technology security breaches; (xiii) our corporate responsibility initiatives; (xiv) loss of key executives; (xv) the measures taken by federal, state, and local government agencies and tenants in response to the COVID-19 pandemic, including mandatory business shutdowns, “stay-at-home” orders and social distancing guidelines, the duration of any such measures and the extent to which the revenues of our tenants recover following the lifting of such restrictions; (xvi) the effectiveness or lack of effectiveness of governmental relief in providing assistance to individuals and businesses adversely impacted by the COVID-19 pandemic, including our tenants; (xvii) the effects of the COVID-19 pandemic, including on the demand for consumer goods and services and levels of consumer confidence in the safety of visiting shopping centers as a result of the COVID-19 pandemic; (xviii) the impact of the COVID-19 pandemic on our tenants and their ability and willingness to renew their leases upon expiration; (xix) our ability to re-lease our properties on the same or better terms, or at all, in the event of non-renewal or in the event we exercise our right to replace an existing tenant; (xx) the loss or bankruptcy of our tenants, particularly in light of the adverse impact to the financial health of many retailers and service providers that has occurred and continues to occur as a result of the COVID-19 pandemic; (xxi) the pace of recovery following the COVID-19 pandemic given its unpredictable nature and impact on macroeconomic conditions; (xxii) to the extent we were seeking to dispose of properties in the near term, significantly greater uncertainty regarding our ability to do so at attractive prices or at all; and (xxiii) our ability to implement cost containment strategies. Additional important factors that could cause actual results to differ are described in the filings made from time to time by the Company with the SEC and include the risk factors and other risks and uncertainties described in our 2020 Annual Report on Form 10-K, as originally filed with the SEC on March 12, 2021, and any subsequently filed Quarterly Reports on Form 10-Q, in each case as updated from time to time in our periodic and/or current reports filed with the SEC, which are accessible on the SEC’s website at www.sec.gov.
Except as required by law, we do not undertake any obligation to update or revise any forward-looking statement, whether as a result of new information, future events, or otherwise.
KEY PERFORMANCE INDICATORS AND DEFINED TERMS
We use certain key performance indicators (“KPIs”), which include both financial and nonfinancial metrics, to measure the performance of our operations. We believe these KPIs, as well as the core concepts and terms defined below, allow our Board, management, and investors to analyze trends around our business strategy, financial condition, and results of operations in a manner that is focused on items unique to the retail real estate industry.
We do not consider our non-GAAP measures to be alternatives to measures required in accordance with GAAP. Certain non-GAAP measures should not be viewed as an alternative measure of our financial performance as they may not reflect the operations of our entire portfolio, and they may not reflect the impact of general and administrative expenses, depreciation and amortization, interest expense, other income (expense), or the level of capital expenditures and leasing costs necessary
PHILLIPS EDISON & COMPANYSEPTEMBER 30, 2021 FORM 10-Q 21
to maintain the operating performance of our shopping centers that could materially impact our results from operations. Additionally, certain non-GAAP measures should not be considered as an indication of our liquidity, nor as an indication of funds available to cover our cash needs, including our ability to fund distributions, and may not be a useful measure of the impact of long-term operating performance on value if we do not continue to operate our business in the manner currently contemplated. Accordingly, non-GAAP measures should be reviewed in connection with other GAAP measurements, and should not be viewed as more prominent measures of performance than net income (loss) or cash flows from operations prepared in accordance with GAAP. Other REITs may use different methodologies for calculating similar non-GAAP measures, and accordingly, our non-GAAP measures may not be comparable to other REITs.
Our KPIs and terminology can be grouped into three key areas:
PORTFOLIO—Portfolio metrics help management to gauge the health of our centers overall and individually.
• Anchor space—We define an anchor space as a space greater than or equal to 10,000 square feet of gross leasable area (“GLA”).
• ABR—We use ABR to refer to the monthly contractual base rent as of September 30, 2021 multiplied by twelve months.
• ABR per Square Foot (“PSF”)—This metric is calculated by dividing ABR by leased GLA. Increases in ABR PSF can be an indication of our ability to create rental rate growth in our centers, as well as an indication of demand for our spaces, which generally provides us with greater leverage during lease negotiations.
• GLA—We use GLA to refer to the total occupied and unoccupied square footage of a building that is available for tenants (whom we refer to as a “Neighbor” or our “Neighbors”) or other retailers to lease.
• Inline space—We define an inline space as a space containing less than 10,000 square feet of GLA.
• Leased Occupancy—This metric is calculated as the percentage of total GLA for which a lease has been signed regardless of whether the lease has commenced or the Neighbor has taken possession. High occupancy is an indicator of demand for our spaces, which generally provides us with greater leverage during lease negotiations.
• Underwritten incremental yield—This reflects the yield we target to generate from a project upon expected stabilization and is calculated as the estimated incremental NOI for a project at stabilization divided by its estimated net project investment. The estimated incremental NOI is the difference between the estimated annualized NOI we target to generate by project upon stabilization and the estimated annualized NOI without the planned improvements. Underwritten incremental yield does not include peripheral impacts, such as lease rollover risk or the impact on the long term value of the property upon sale or disposition. Actual incremental yields may vary from our underwritten incremental yield range based on the actual total cost to complete a project and its actual incremental NOI at stabilization.
LEASING—Leasing is a key driver of growth for our company.
• Comparable lease—We use this term to refer to a lease with consistent structure that is executed for substantially the exact same space that has been vacant less than twelve months.
• Comparable rent spread—This metric is calculated as the percentage increase or decrease in first-year ABR (excluding any free rent or escalations) on new or renewal leases (excluding options) where the lease was considered a comparable lease. This metric provides an indication of our ability to generate revenue growth through leasing activity.
• Cost of executing new leases—We use this term to refer to certain costs associated with new leasing, namely, leasing commissions, tenant improvement costs, and tenant concessions.
• Portfolio retention rate—This metric is calculated by dividing (i) total square feet of retained Neighbors with current period lease expirations by (ii) the total square feet of leases expiring during the period. The portfolio retention rate provides insight into our ability to retain Neighbors at our shopping centers as their leases approach expiration. Generally, the costs to retain an existing Neighbor are lower than costs to replace with a new Neighbor.
• Recovery rate—This metric is calculated by dividing (i) total recovery income by (ii) total recoverable expenses during the period. A high recovery rate is an indicator of our ability to recover certain property operating expenses and capital costs from our Neighbors.
FINANCIAL PERFORMANCE—In addition to financial metrics calculated in accordance with GAAP, such as net income, we utilize non-GAAP metrics to measure our operational and financial performance. See the section within this Item 2 titled “Management’s Discussion and Analysis of Financial Condition and Results of Operations - Non-GAAP Measures” for further discussion on the following metrics.
• Adjusted Earnings Before Interest, Taxes, Depreciation, and Amortization for Real Estate (“Adjusted EBITDAre”)—To arrive at Adjusted EBITDAre, we adjust EBITDAre, as defined below, to exclude certain recurring and non-recurring items including, but not limited to: (i) changes in the fair value of the earn-out liability; (ii) other impairment charges; (iii) amortization of basis differences in our investments in our unconsolidated joint ventures; and (iv) transaction and acquisition expenses. We use EBITDAre and Adjusted EBITDAre as additional measures of operating performance which allow us to compare earnings independent of capital structure and evaluate debt leverage and fixed cost coverage.
• Core Funds From Operations (“Core FFO”)—To arrive at Core FFO, we adjust Nareit FFO attributable to stockholders and OP unit holders, as defined below, to exclude certain recurring and non-recurring items including, but not limited to: (i) depreciation and amortization of corporate assets; (ii) changes in the fair value of the earn-out liability; (iii) amortization of unconsolidated joint venture basis differences; (iv) gains or losses on the extinguishment or
PHILLIPS EDISON & COMPANYSEPTEMBER 30, 2021 FORM 10-Q 22
modification of debt, (v) other impairment charges; and (vi) transaction and acquisition expenses. We believe Nareit FFO provides insight into our operating performance as it excludes certain items that are not indicative of such performance. Core FFO provides further insight into the sustainability of our operating performance and provides an additional measure to compare our performance across reporting periods on a consistent basis by excluding items that may cause short-term fluctuations in net income (loss).
• EBITDAre—The National Association of Real Estate Investment Trusts (“Nareit”) defines EBITDAre as net income (loss) computed in accordance with GAAP before: (i) interest expense; (ii) income tax expense; (iii) depreciation and amortization; (iv) gains or losses from disposition of depreciable property; and (v) impairment write-downs of depreciable property. Adjustments for unconsolidated partnerships and joint ventures are calculated to reflect EBITDAre on the same basis.
• Equity Market Capitalization—We calculate equity market capitalization as the total dollar value of all outstanding shares.
• Nareit FFO—Nareit defines FFO as net income (loss) computed in accordance with GAAP, excluding: (i) gains (or losses) from sales of property and gains (or losses) from change in control; (ii) depreciation and amortization related to real estate; (iii) impairment losses on real estate and impairments of in-substance real estate investments in investees that are driven by measurable decreases in the fair value of the depreciable real estate held by the unconsolidated partnerships and joint ventures; and (iv) adjustments for unconsolidated partnerships and joint ventures, calculated to reflect FFO on the same basis. We calculate Nareit FFO in a manner consistent with the Nareit definition.
• Net Debt—We calculate net debt as total debt, excluding market adjustments and deferred financing expenses, less cash and cash equivalents.
• Net Debt to Adjusted EBITDAre—This ratio is calculated by dividing net debt by Adjusted EBITDAre (included on an annualized basis within the calculation). It provides insight into our leverage rate based on earnings and is not impacted by fluctuations in our equity price.
• Net Debt to Total Enterprise Value—This ratio is calculated by dividing net debt by total enterprise value, as defined below. It provides insight into our capital structure and usage of debt.
• NOI—We calculate NOI as total operating revenues, adjusted to exclude non-cash revenue items, less property operating expenses and real estate taxes. NOI provides insight about our financial and operating performance because it provides a performance measure of the revenues and expenses directly involved in owning and operating real estate assets and provides a perspective not immediately apparent from net income (loss).
• Same-Center—We use this term to refer to a property, or portfolio of properties, that has been owned and operational for the entirety of each reporting period (i.e., since January 1, 2020).
• Total Enterprise Value—We calculate total enterprise value as our net debt plus our equity market capitalization on a fully diluted basis.
OVERVIEW
We are a REIT and one of the nation’s largest owners and operators of omni-channel grocery-anchored neighborhood and community shopping centers. The majority of our revenue is lease revenue derived from our real estate investments. Additionally, we operate an investment management business providing property management and advisory services to over $460 million of unconsolidated joint ventures. This business provides comprehensive real estate and asset management services to the Managed Funds.
As of September 30, 2021, we wholly-owned 267 real estate properties. Additionally, we owned a 14% interest in GRP I, a joint venture that owned 20 properties, and a 20% interest in NRP, a joint venture that owned two properties.
RECAPITALIZATION—On June 18, 2021, our stockholders approved Articles of Amendment that effected the Recapitalization, wherein each share of our common stock outstanding at the time the amendment became effective was converted into one share of a newly created class of Class B common stock. The Articles of Amendment became effective upon filing with, and acceptance by, the State Department of Assessments and Taxation of Maryland on July 2, 2021. Unless otherwise indicated, all information in this Form 10-Q gives effect to the Recapitalization and references to “shares” and per share metrics refer to our common stock and Class B common stock, collectively (see Note 9).
REVERSE STOCK SPLIT—On July 2, 2021, our Board approved an amendment to our articles of incorporation to effect a one-for-three reverse stock split. Concurrent with the reverse split, the Operating Partnership enacted a one-for-three reverse split of its outstanding OP units. Unless otherwise indicated, the information in this Form 10-Q gives effect to the reverse stock and OP unit splits (see Note 9).
UNDERWRITTEN INITIAL PUBLIC OFFERING—On July 19, 2021, we closed our underwritten IPO, through which we offered 17.0 million shares of a new class of common stock, $0.01 par value per share, at an initial price to the public of $28.00 per share, pursuant to a registration statement filed with the SEC on Form S-11 (File No. 333-255846), as amended. In connection with the underwritten IPO, the underwriters exercised a 30-day option to purchase additional shares of common stock to cover overallotments, and, accordingly, on August 2, 2021, we settled the sale of an additional 2.6 million shares at a price of $28.00 per share. These shares are listed on NASDAQ under the trading symbol “PECO”. The underwritten IPO, including the underwriters overallotment election, resulted in gross proceeds of $547.4 million.
PHILLIPS EDISON & COMPANYSEPTEMBER 30, 2021 FORM 10-Q 23

On August 4, 2021, as a result of our underwritten IPO, our Board approved the termination of the DRIP and the SRP.
2021 BOND OFFERING—In October 2021, in connection with our Bond Registration, we settled the 2021 Bond Offering priced at 98.692% of the principal amount and maturing in November 2031. This offering resulted in gross proceeds of $345.4 million. The notes are fully and unconditionally guaranteed by us.
COVID-19 STRATEGY—During 2020, as a result of the COVID-19 pandemic, many state governments issued “stay-at-home” mandates that generally limited travel and movement of the general public to essential activities only and required all non-essential businesses to close. All statistics and financial results included in this COVID-19 Strategy section are approximate and include the prorated portion attributable to properties owned through our joint ventures.
Our management team determined the recovery of our portfolio was dependent on the execution of key actions, including guiding our Neighbors toward returning to monthly rent payments, recovering missed charges, and monitoring for credit risk. Our actions in conjunction with the resiliency of our tenant mix has led to improved collections from the second quarter of 2020. Further, we believe our collections have returned to levels consistent with those prior to the onset of the pandemic. The following table summarizes our collections by quarter, as they were originally reported as well as updated for payments received subsequent to the month billed:
Originally Reported Current(1)
Q2 2020 86 % 93 %
Q3 2020 94 % 97 %
Q4 2020 95 % 97 %
Q1 2021 95 % 98 %
Q2 2021 98 % 99 %
Q3 2021 N/A 99 %(1) Collections include those received through October 20, 2021.
We believe substantially all Neighbors, including those that were required to temporarily close under governmental mandates, are contractually obligated to continue with their rent payments as documented in our lease agreements with them. However, we decided to negotiate relief for a small subset of our Neighbors, including rent deferrals. As of October 20, 2021, we have $4.2 million of outstanding payment plans with our Neighbors of which approximately 28% are scheduled to be received by December 31, 2021. As of October 20, 2021, the weighted-average term over which we expect to receive remaining amounts owed on executed payment plans is approximately eleven months. We cannot guarantee that we will ultimately be able to collect these amounts.
Despite seeing improvements in collections for current and past due amounts during 2021, the negative impact the pandemic has had on our Neighbors continues to be considered in our evaluation of Neighbors who potentially pose a credit risk. For Neighbors with a higher degree of uncertainty as to their creditworthiness, we may not record revenue for amounts billed until the cash is received. For the three and nine months ended September 30, 2021, we had $0.6 million and $4.2 million, respectively, in net unfavorable monthly revenue adjustments for Neighbors who are being accounted for on a cash basis. For the three and nine months ended September 30, 2020, we had $5.3 million and $20.3 million, respectively, in net unfavorable monthly revenue adjustments for Neighbors who were being accounted for on a cash basis. As of September 30, 2021, our Neighbors currently being accounted for on a cash basis represented approximately 8% of our total Neighbor spaces, or approximately 7.3% of portfolio ABR. Further, many of our Neighbors who are on a cash basis of accounting are actively making payments toward their outstanding balances. When considering the ABR associated with Neighbors who are currently on a cash basis of accounting, 79% of this ABR is represented by Neighbors who are actively making payments.
Additionally, certain of our Neighbors entered into bankruptcy proceedings. We believe that Neighbors in the bankruptcy process represent an exposure of less than 1% of our total portfolio ABR as of September 30, 2021. We have included our assessment of the impact of these bankruptcies in our estimate of rent collectibility, which impacted recorded revenue, as noted previously.
Certain of our Neighbors were unable to remain in their spaces as a result of the factors previously noted. Despite this fallout, our leasing activity has been strong as demand for space in our centers remains high, allowing us to re-lease these spaces to Neighbors who may increase our concentration of necessity-based and omni-channel retailers. For the three and nine months ended September 30, 2021, our wholly-owned portfolio retention rate was 91.2% and 88.3%, respectively. Additionally, for the three and nine months ended September 30, 2021, for our wholly-owned portfolio, we executed 140 and 417 new leases, respectively, each an increase as compared to the same period a year ago.
PHILLIPS EDISON & COMPANYSEPTEMBER 30, 2021 FORM 10-Q 24
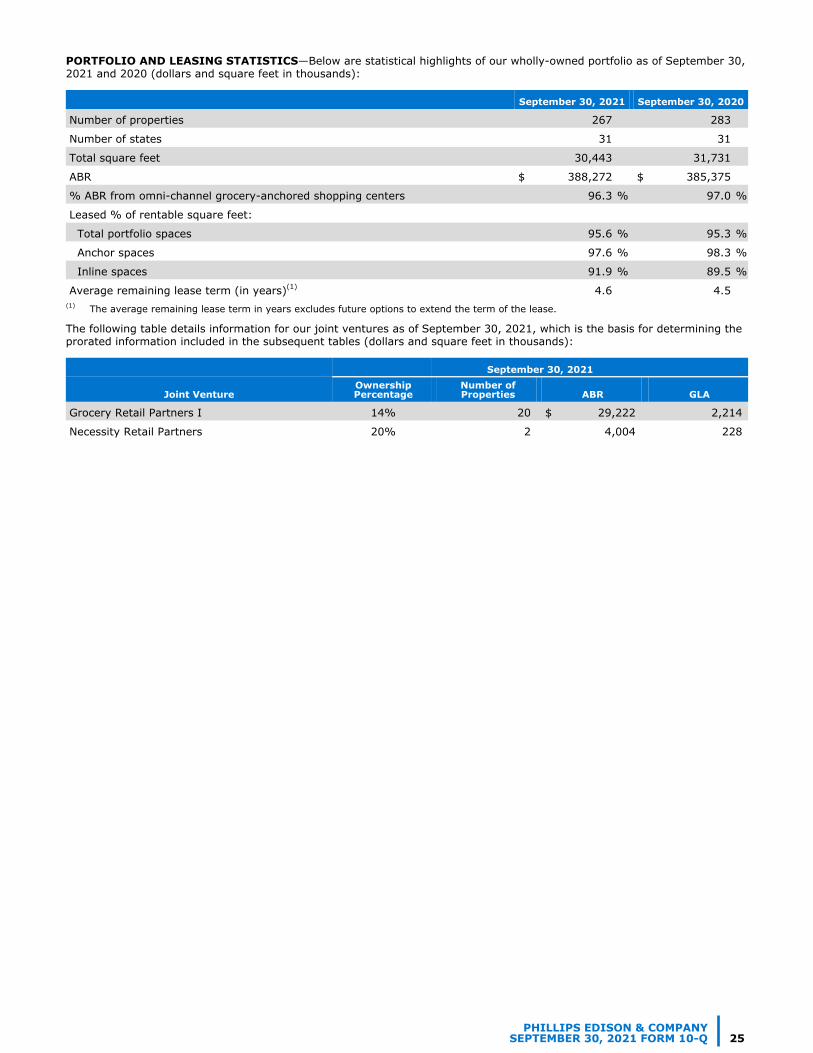
PORTFOLIO AND LEASING STATISTICS—Below are statistical highlights of our wholly-owned portfolio as of September 30, 2021 and 2020 (dollars and square feet in thousands):
September 30, 2021 September 30, 2020
Number of properties 267 283
Number of states 31 31
Total square feet 30,443 31,731
ABR $ 388,272 $ 385,375
% ABR from omni-channel grocery-anchored shopping centers 96.3 % 97.0 %
Leased % of rentable square feet:
Total portfolio spaces 95.6 % 95.3 %
Anchor spaces 97.6 % 98.3 %
Inline spaces 91.9 % 89.5 %
Average remaining lease term (in years)(1) 4.6 4.5 (1) The average remaining lease term in years excludes future options to extend the term of the lease.
The following table details information for our joint ventures as of September 30, 2021, which is the basis for determining the prorated information included in the subsequent tables (dollars and square feet in thousands):
September 30, 2021
Joint VentureOwnership Percentage
Number of Properties ABR GLA
Grocery Retail Partners I 14% 20 $ 29,222 2,214
Necessity Retail Partners 20% 2 4,004 228
PHILLIPS EDISON & COMPANYSEPTEMBER 30, 2021 FORM 10-Q 25
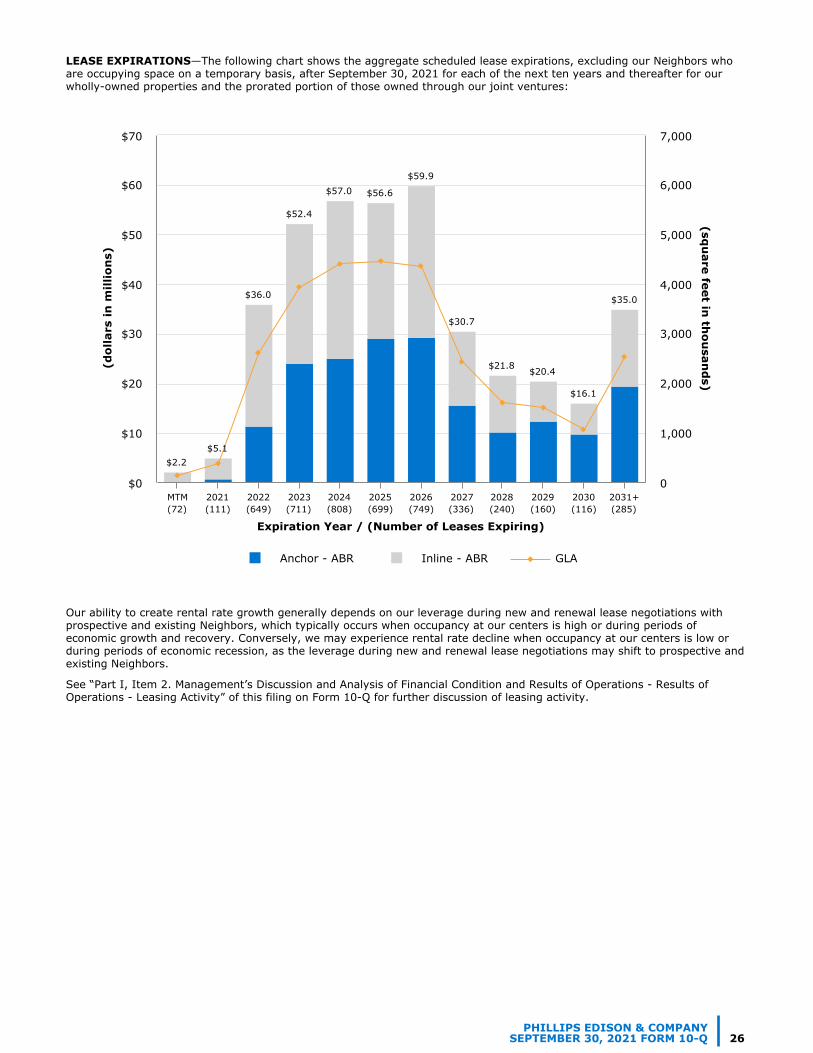
LEASE EXPIRATIONS—The following chart shows the aggregate scheduled lease expirations, excluding our Neighbors who are occupying space on a temporary basis, after September 30, 2021 for each of the next ten years and thereafter for our wholly-owned properties and the prorated portion of those owned through our joint ventures:
Expiration Year / (Number of Leases Expiring)
(dol
lars
in m
illio
ns)
(squ
are feet in th
ousan
ds)
$2.2$5.1
$36.0
$52.4
$57.0 $56.6
$59.9
$30.7
$21.8 $20.4
$16.1
$35.0
Anchor - ABR Inline - ABR GLA
MTM(72)
2021(111)
2022(649)
2023(711)
2024(808)
2025(699)
2026(749)
2027(336)
2028(240)
2029(160)
2030(116)
2031+(285)
$0
$10
$20
$30
$40
$50
$60
$70
0
1,000
2,000
3,000
4,000
5,000
6,000
7,000
Our ability to create rental rate growth generally depends on our leverage during new and renewal lease negotiations with prospective and existing Neighbors, which typically occurs when occupancy at our centers is high or during periods of economic growth and recovery. Conversely, we may experience rental rate decline when occupancy at our centers is low or during periods of economic recession, as the leverage during new and renewal lease negotiations may shift to prospective and existing Neighbors.
See “Part I, Item 2. Management’s Discussion and Analysis of Financial Condition and Results of Operations - Results of Operations - Leasing Activity” of this filing on Form 10-Q for further discussion of leasing activity.
PHILLIPS EDISON & COMPANYSEPTEMBER 30, 2021 FORM 10-Q 26
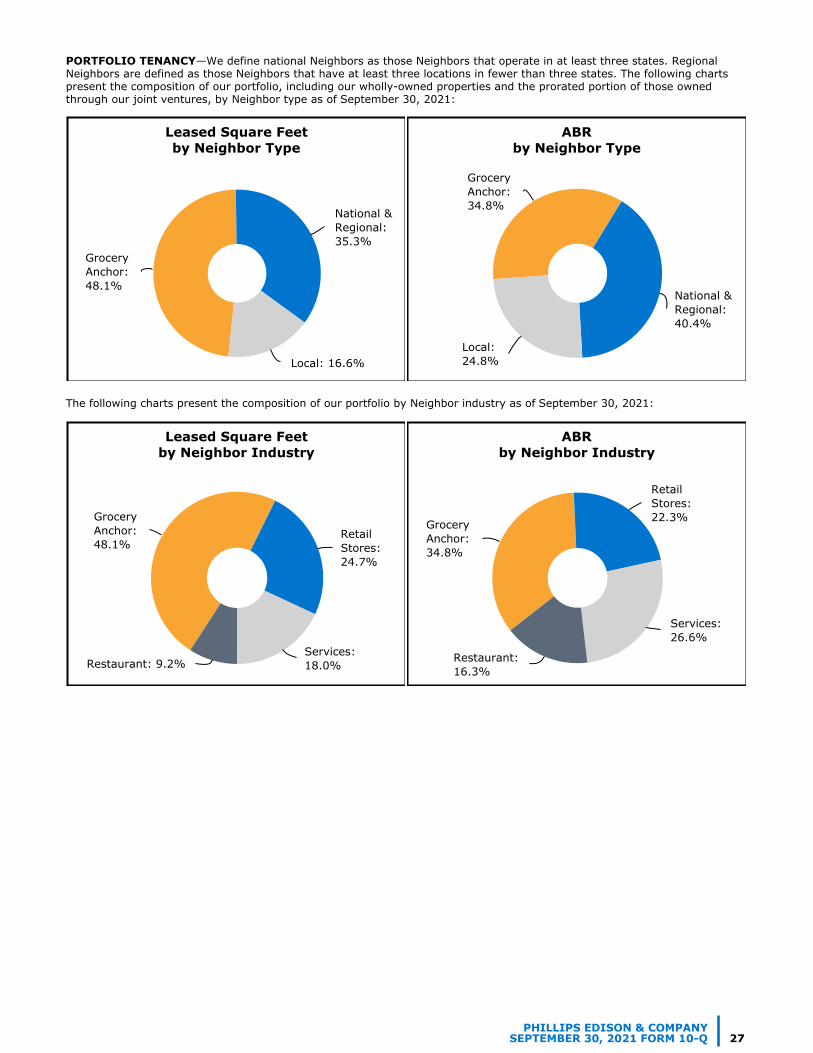
PORTFOLIO TENANCY—We define national Neighbors as those Neighbors that operate in at least three states. Regional Neighbors are defined as those Neighbors that have at least three locations in fewer than three states. The following charts present the composition of our portfolio, including our wholly-owned properties and the prorated portion of those owned through our joint ventures, by Neighbor type as of September 30, 2021:
Leased Square Feetby Neighbor Type
GroceryAnchor:48.1%
National &Regional:35.3%
Local: 16.6%
ABRby Neighbor Type
GroceryAnchor:34.8%
National &Regional:40.4%
Local:24.8%
The following charts present the composition of our portfolio by Neighbor industry as of September 30, 2021:
Leased Square Feetby Neighbor Industry
GroceryAnchor:48.1%
RetailStores:24.7%
Services:18.0%Restaurant: 9.2%
ABRby Neighbor Industry
GroceryAnchor:34.8%
RetailStores:22.3%
Services:26.6%
Restaurant:16.3%
PHILLIPS EDISON & COMPANYSEPTEMBER 30, 2021 FORM 10-Q 27
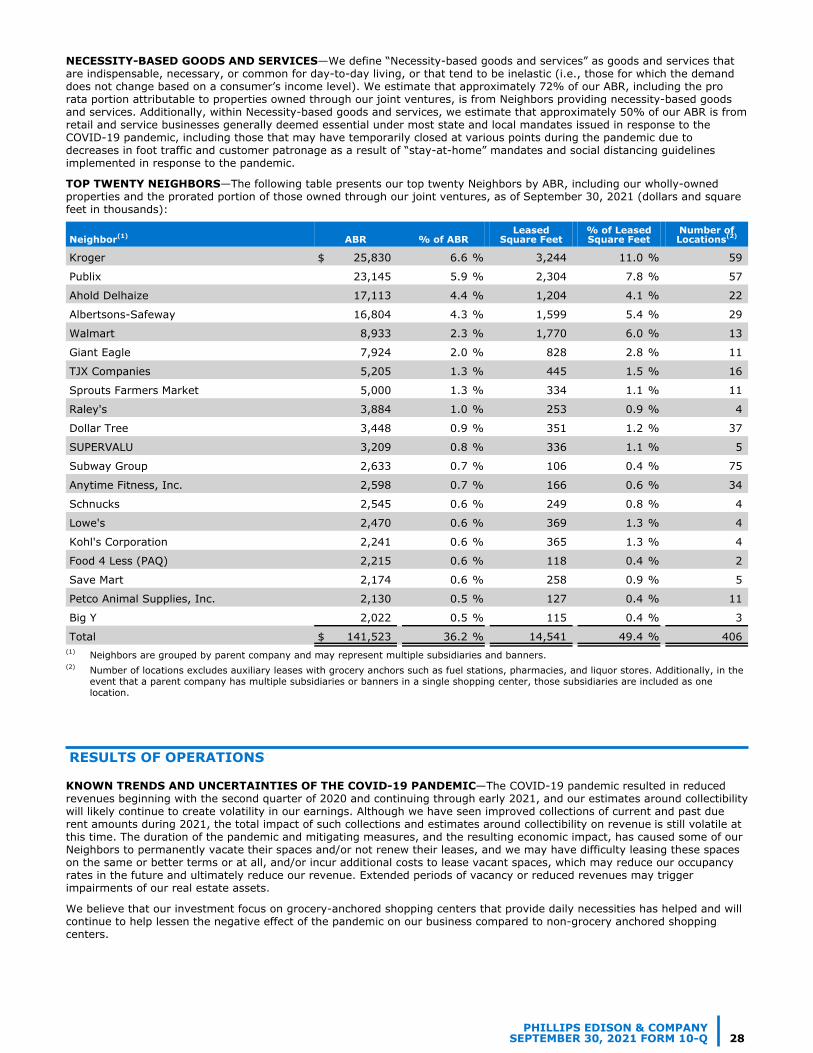
NECESSITY-BASED GOODS AND SERVICES—We define “Necessity-based goods and services” as goods and services that are indispensable, necessary, or common for day-to-day living, or that tend to be inelastic (i.e., those for which the demand does not change based on a consumer’s income level). We estimate that approximately 72% of our ABR, including the pro rata portion attributable to properties owned through our joint ventures, is from Neighbors providing necessity-based goods and services. Additionally, within Necessity-based goods and services, we estimate that approximately 50% of our ABR is from retail and service businesses generally deemed essential under most state and local mandates issued in response to the COVID-19 pandemic, including those that may have temporarily closed at various points during the pandemic due to decreases in foot traffic and customer patronage as a result of “stay-at-home” mandates and social distancing guidelines implemented in response to the pandemic.
TOP TWENTY NEIGHBORS—The following table presents our top twenty Neighbors by ABR, including our wholly-owned properties and the prorated portion of those owned through our joint ventures, as of September 30, 2021 (dollars and square feet in thousands):
Neighbor(1) ABR % of ABRLeased
Square Feet% of Leased Square Feet
Number of Locations(2)
Kroger $ 25,830 6.6 % 3,244 11.0 % 59
Publix 23,145 5.9 % 2,304 7.8 % 57
Ahold Delhaize 17,113 4.4 % 1,204 4.1 % 22
Albertsons-Safeway 16,804 4.3 % 1,599 5.4 % 29
Walmart 8,933 2.3 % 1,770 6.0 % 13
Giant Eagle 7,924 2.0 % 828 2.8 % 11
TJX Companies 5,205 1.3 % 445 1.5 % 16
Sprouts Farmers Market 5,000 1.3 % 334 1.1 % 11
Raley's 3,884 1.0 % 253 0.9 % 4
Dollar Tree 3,448 0.9 % 351 1.2 % 37
SUPERVALU 3,209 0.8 % 336 1.1 % 5
Subway Group 2,633 0.7 % 106 0.4 % 75
Anytime Fitness, Inc. 2,598 0.7 % 166 0.6 % 34
Schnucks 2,545 0.6 % 249 0.8 % 4
Lowe's 2,470 0.6 % 369 1.3 % 4
Kohl's Corporation 2,241 0.6 % 365 1.3 % 4
Food 4 Less (PAQ) 2,215 0.6 % 118 0.4 % 2
Save Mart 2,174 0.6 % 258 0.9 % 5
Petco Animal Supplies, Inc. 2,130 0.5 % 127 0.4 % 11
Big Y 2,022 0.5 % 115 0.4 % 3
Total $ 141,523 36.2 % 14,541 49.4 % 406 (1) Neighbors are grouped by parent company and may represent multiple subsidiaries and banners.(2) Number of locations excludes auxiliary leases with grocery anchors such as fuel stations, pharmacies, and liquor stores. Additionally, in the
event that a parent company has multiple subsidiaries or banners in a single shopping center, those subsidiaries are included as one location.
RESULTS OF OPERATIONS
KNOWN TRENDS AND UNCERTAINTIES OF THE COVID-19 PANDEMIC—The COVID-19 pandemic resulted in reduced revenues beginning with the second quarter of 2020 and continuing through early 2021, and our estimates around collectibility will likely continue to create volatility in our earnings. Although we have seen improved collections of current and past due rent amounts during 2021, the total impact of such collections and estimates around collectibility on revenue is still volatile at this time. The duration of the pandemic and mitigating measures, and the resulting economic impact, has caused some of our Neighbors to permanently vacate their spaces and/or not renew their leases, and we may have difficulty leasing these spaces on the same or better terms or at all, and/or incur additional costs to lease vacant spaces, which may reduce our occupancy rates in the future and ultimately reduce our revenue. Extended periods of vacancy or reduced revenues may trigger impairments of our real estate assets.
We believe that our investment focus on grocery-anchored shopping centers that provide daily necessities has helped and will continue to help lessen the negative effect of the pandemic on our business compared to non-grocery anchored shopping centers.
PHILLIPS EDISON & COMPANYSEPTEMBER 30, 2021 FORM 10-Q 28
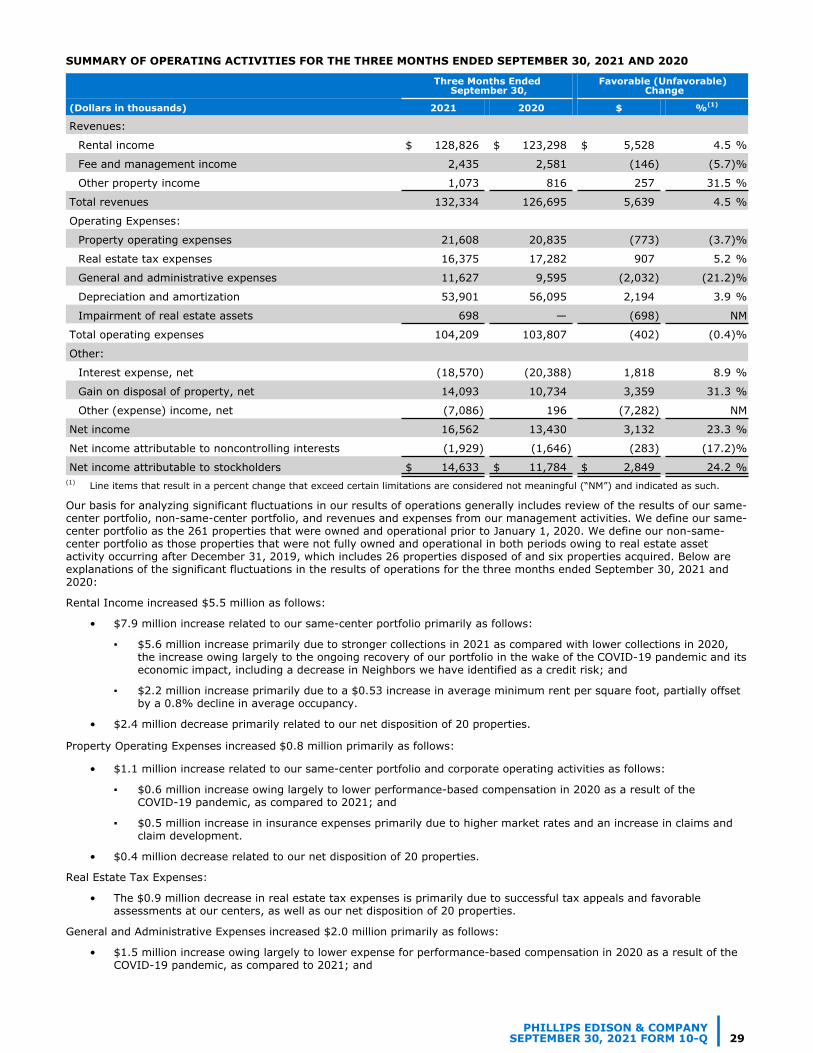
SUMMARY OF OPERATING ACTIVITIES FOR THE THREE MONTHS ENDED SEPTEMBER 30, 2021 AND 2020
Three Months Ended September 30,
Favorable (Unfavorable) Change
(Dollars in thousands) 2021 2020 $ %(1)
Revenues:
Rental income $ 128,826 $ 123,298 $ 5,528 4.5 %
Fee and management income 2,435 2,581 (146) (5.7) %
Other property income 1,073 816 257 31.5 %
Total revenues 132,334 126,695 5,639 4.5 %
Operating Expenses:
Property operating expenses 21,608 20,835 (773) (3.7) %
Real estate tax expenses 16,375 17,282 907 5.2 %
General and administrative expenses 11,627 9,595 (2,032) (21.2) %
Depreciation and amortization 53,901 56,095 2,194 3.9 %
Impairment of real estate assets 698 — (698) NM
Total operating expenses 104,209 103,807 (402) (0.4) %
Other:
Interest expense, net (18,570) (20,388) 1,818 8.9 %
Gain on disposal of property, net 14,093 10,734 3,359 31.3 %
Other (expense) income, net (7,086) 196 (7,282) NM
Net income 16,562 13,430 3,132 23.3 %
Net income attributable to noncontrolling interests (1,929) (1,646) (283) (17.2) %
Net income attributable to stockholders $ 14,633 $ 11,784 $ 2,849 24.2 %(1) Line items that result in a percent change that exceed certain limitations are considered not meaningful (“NM”) and indicated as such.
Our basis for analyzing significant fluctuations in our results of operations generally includes review of the results of our same-center portfolio, non-same-center portfolio, and revenues and expenses from our management activities. We define our same-center portfolio as the 261 properties that were owned and operational prior to January 1, 2020. We define our non-same-center portfolio as those properties that were not fully owned and operational in both periods owing to real estate asset activity occurring after December 31, 2019, which includes 26 properties disposed of and six properties acquired. Below are explanations of the significant fluctuations in the results of operations for the three months ended September 30, 2021 and 2020:
Rental Income increased $5.5 million as follows:
• $7.9 million increase related to our same-center portfolio primarily as follows:
▪ $5.6 million increase primarily due to stronger collections in 2021 as compared with lower collections in 2020, the increase owing largely to the ongoing recovery of our portfolio in the wake of the COVID-19 pandemic and its economic impact, including a decrease in Neighbors we have identified as a credit risk; and
▪ $2.2 million increase primarily due to a $0.53 increase in average minimum rent per square foot, partially offset by a 0.8% decline in average occupancy.
• $2.4 million decrease primarily related to our net disposition of 20 properties.
Property Operating Expenses increased $0.8 million primarily as follows:
• $1.1 million increase related to our same-center portfolio and corporate operating activities as follows:
▪ $0.6 million increase owing largely to lower performance-based compensation in 2020 as a result of the COVID-19 pandemic, as compared to 2021; and
▪ $0.5 million increase in insurance expenses primarily due to higher market rates and an increase in claims and claim development.
• $0.4 million decrease related to our net disposition of 20 properties.
Real Estate Tax Expenses:
• The $0.9 million decrease in real estate tax expenses is primarily due to successful tax appeals and favorable assessments at our centers, as well as our net disposition of 20 properties.
General and Administrative Expenses increased $2.0 million primarily as follows:
• $1.5 million increase owing largely to lower expense for performance-based compensation in 2020 as a result of the COVID-19 pandemic, as compared to 2021; and
PHILLIPS EDISON & COMPANYSEPTEMBER 30, 2021 FORM 10-Q 29
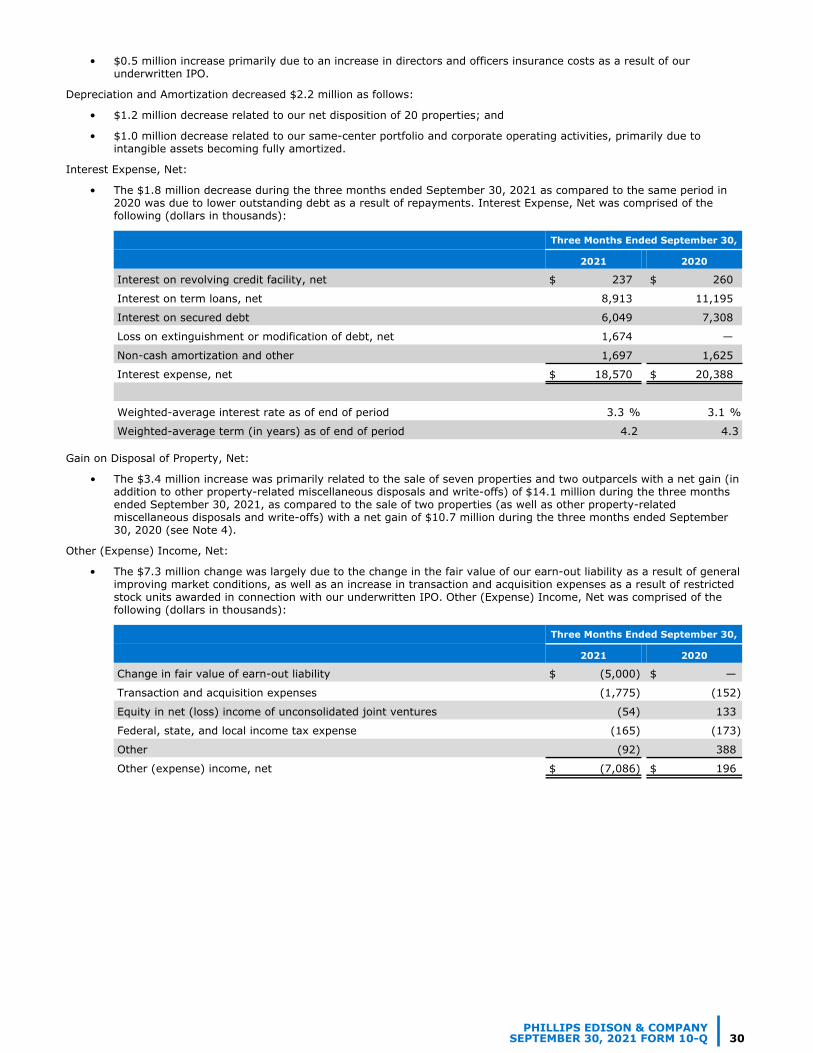
• $0.5 million increase primarily due to an increase in directors and officers insurance costs as a result of our underwritten IPO.
Depreciation and Amortization decreased $2.2 million as follows:
• $1.2 million decrease related to our net disposition of 20 properties; and
• $1.0 million decrease related to our same-center portfolio and corporate operating activities, primarily due to intangible assets becoming fully amortized.
Interest Expense, Net:
• The $1.8 million decrease during the three months ended September 30, 2021 as compared to the same period in 2020 was due to lower outstanding debt as a result of repayments. Interest Expense, Net was comprised of the following (dollars in thousands):
Three Months Ended September 30,
2021 2020
Interest on revolving credit facility, net $ 237 $ 260
Interest on term loans, net 8,913 11,195
Interest on secured debt 6,049 7,308
Loss on extinguishment or modification of debt, net 1,674 —
Non-cash amortization and other 1,697 1,625
Interest expense, net $ 18,570 $ 20,388
Weighted-average interest rate as of end of period 3.3 % 3.1 %
Weighted-average term (in years) as of end of period 4.2 4.3
Gain on Disposal of Property, Net:
• The $3.4 million increase was primarily related to the sale of seven properties and two outparcels with a net gain (in addition to other property-related miscellaneous disposals and write-offs) of $14.1 million during the three months ended September 30, 2021, as compared to the sale of two properties (as well as other property-related miscellaneous disposals and write-offs) with a net gain of $10.7 million during the three months ended September 30, 2020 (see Note 4).
Other (Expense) Income, Net:
• The $7.3 million change was largely due to the change in the fair value of our earn-out liability as a result of general improving market conditions, as well as an increase in transaction and acquisition expenses as a result of restricted stock units awarded in connection with our underwritten IPO. Other (Expense) Income, Net was comprised of the following (dollars in thousands):
Three Months Ended September 30,
2021 2020
Change in fair value of earn-out liability $ (5,000) $ —
Transaction and acquisition expenses (1,775) (152)
Equity in net (loss) income of unconsolidated joint ventures (54) 133
Federal, state, and local income tax expense (165) (173)
Other (92) 388
Other (expense) income, net $ (7,086) $ 196
PHILLIPS EDISON & COMPANYSEPTEMBER 30, 2021 FORM 10-Q 30
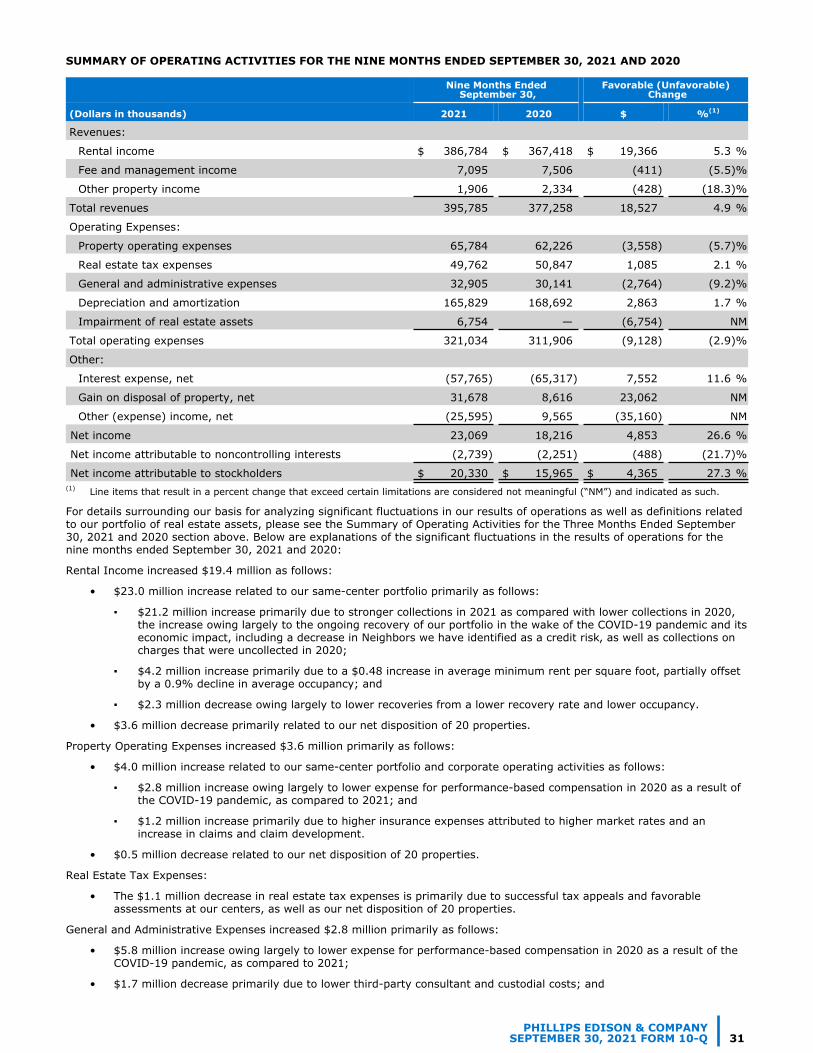
SUMMARY OF OPERATING ACTIVITIES FOR THE NINE MONTHS ENDED SEPTEMBER 30, 2021 AND 2020
Nine Months Ended September 30,
Favorable (Unfavorable) Change
(Dollars in thousands) 2021 2020 $ %(1)
Revenues:
Rental income $ 386,784 $ 367,418 $ 19,366 5.3 %
Fee and management income 7,095 7,506 (411) (5.5) %
Other property income 1,906 2,334 (428) (18.3) %
Total revenues 395,785 377,258 18,527 4.9 %
Operating Expenses:
Property operating expenses 65,784 62,226 (3,558) (5.7) %
Real estate tax expenses 49,762 50,847 1,085 2.1 %
General and administrative expenses 32,905 30,141 (2,764) (9.2) %
Depreciation and amortization 165,829 168,692 2,863 1.7 %
Impairment of real estate assets 6,754 — (6,754) NM
Total operating expenses 321,034 311,906 (9,128) (2.9) %
Other:
Interest expense, net (57,765) (65,317) 7,552 11.6 %
Gain on disposal of property, net 31,678 8,616 23,062 NM
Other (expense) income, net (25,595) 9,565 (35,160) NM
Net income 23,069 18,216 4,853 26.6 %
Net income attributable to noncontrolling interests (2,739) (2,251) (488) (21.7) %
Net income attributable to stockholders $ 20,330 $ 15,965 $ 4,365 27.3 %(1) Line items that result in a percent change that exceed certain limitations are considered not meaningful (“NM”) and indicated as such.
For details surrounding our basis for analyzing significant fluctuations in our results of operations as well as definitions related to our portfolio of real estate assets, please see the Summary of Operating Activities for the Three Months Ended September 30, 2021 and 2020 section above. Below are explanations of the significant fluctuations in the results of operations for the nine months ended September 30, 2021 and 2020:
Rental Income increased $19.4 million as follows:
• $23.0 million increase related to our same-center portfolio primarily as follows:
▪ $21.2 million increase primarily due to stronger collections in 2021 as compared with lower collections in 2020, the increase owing largely to the ongoing recovery of our portfolio in the wake of the COVID-19 pandemic and its economic impact, including a decrease in Neighbors we have identified as a credit risk, as well as collections on charges that were uncollected in 2020;
▪ $4.2 million increase primarily due to a $0.48 increase in average minimum rent per square foot, partially offset by a 0.9% decline in average occupancy; and
▪ $2.3 million decrease owing largely to lower recoveries from a lower recovery rate and lower occupancy.
• $3.6 million decrease primarily related to our net disposition of 20 properties.
Property Operating Expenses increased $3.6 million primarily as follows:
• $4.0 million increase related to our same-center portfolio and corporate operating activities as follows:
▪ $2.8 million increase owing largely to lower expense for performance-based compensation in 2020 as a result of the COVID-19 pandemic, as compared to 2021; and
▪ $1.2 million increase primarily due to higher insurance expenses attributed to higher market rates and an increase in claims and claim development.
• $0.5 million decrease related to our net disposition of 20 properties.
Real Estate Tax Expenses:
• The $1.1 million decrease in real estate tax expenses is primarily due to successful tax appeals and favorable assessments at our centers, as well as our net disposition of 20 properties.
General and Administrative Expenses increased $2.8 million primarily as follows:
• $5.8 million increase owing largely to lower expense for performance-based compensation in 2020 as a result of the COVID-19 pandemic, as compared to 2021;
• $1.7 million decrease primarily due to lower third-party consultant and custodial costs; and
PHILLIPS EDISON & COMPANYSEPTEMBER 30, 2021 FORM 10-Q 31

• $1.4 million decrease related to expense reductions taken in 2020 to reduce the impact of the COVID-19 pandemic, with the majority of these decreases related to overhead costs at our corporate offices.
Depreciation and Amortization decreased $2.9 million as follows:
• $1.8 million decrease related to our net disposition of 20 properties; and
• $1.1 million decrease related to our same-center portfolio and corporate operating activities, primarily due to intangible assets becoming fully amortized.
Impairment of Real Estate Assets:
• The $6.8 million increase in impairment of real estate assets was due to assets that have sold during 2021 as well as assets that are actively being marketed for sale at a disposition price that is less than the carrying value.
Interest Expense, Net:
• The $7.6 million decrease during the nine months ended September 30, 2021 as compared to the same period in 2020 was due to: (i) lower borrowings as a result of early repayments of debt; (ii) the $200 million draw and subsequent repayment of our draw on the revolver during the second quarter of 2020; and (iii) lower average interest rates due to the decrease in LIBOR. Interest Expense, Net was comprised of the following (dollars in thousands):
Nine Months Ended September 30,
2021 2020
Interest on revolving credit facility, net $ 672 $ 1,455
Interest on term loans, net 30,119 35,611
Interest on secured debt 19,075 21,973
Loss on extinguishment or modification of debt, net 2,784 73
Non-cash amortization and other 5,115 6,205
Interest expense, net $ 57,765 $ 65,317
Weighted-average interest rate as of end of period 3.3 % 3.1 %
Weighted-average term (in years) as of end of period 4.2 4.3
Gain on Disposal of Property, Net:
• The $23.1 million increase was primarily related to the sale of 20 properties and three outparcels (in addition to other miscellaneous property-related disposals and write-offs) with a net gain of $31.7 million during the nine months ended September 30, 2021, as compared to the sale of six properties (as well as other property-related miscellaneous disposals and write-offs) with a net gain of $8.6 million during the nine months ended September 30, 2020 (see Note 4).
Other (Expense) Income, Net:
• The $35.2 million change was largely due to the change in the fair value of our earn-out liability as a result of general improving market conditions, as well as an increase in transaction and acquisition expenses as a result of restricted stock units awarded in connection with our underwritten IPO. Other (Expense) Income, Net was comprised of the following (in thousands):
Nine Months Ended September 30,
2021 2020
Change in fair value of earn-out liability $ (23,000) $ 10,000
Transaction and acquisition expenses (2,850) (211)
Equity in income (loss) of unconsolidated joint ventures 747 (506)
Federal, state, and local income tax expense (496) (382)
Other 4 664
Other (expense) income, net $ (25,595) $ 9,565
PHILLIPS EDISON & COMPANYSEPTEMBER 30, 2021 FORM 10-Q 32
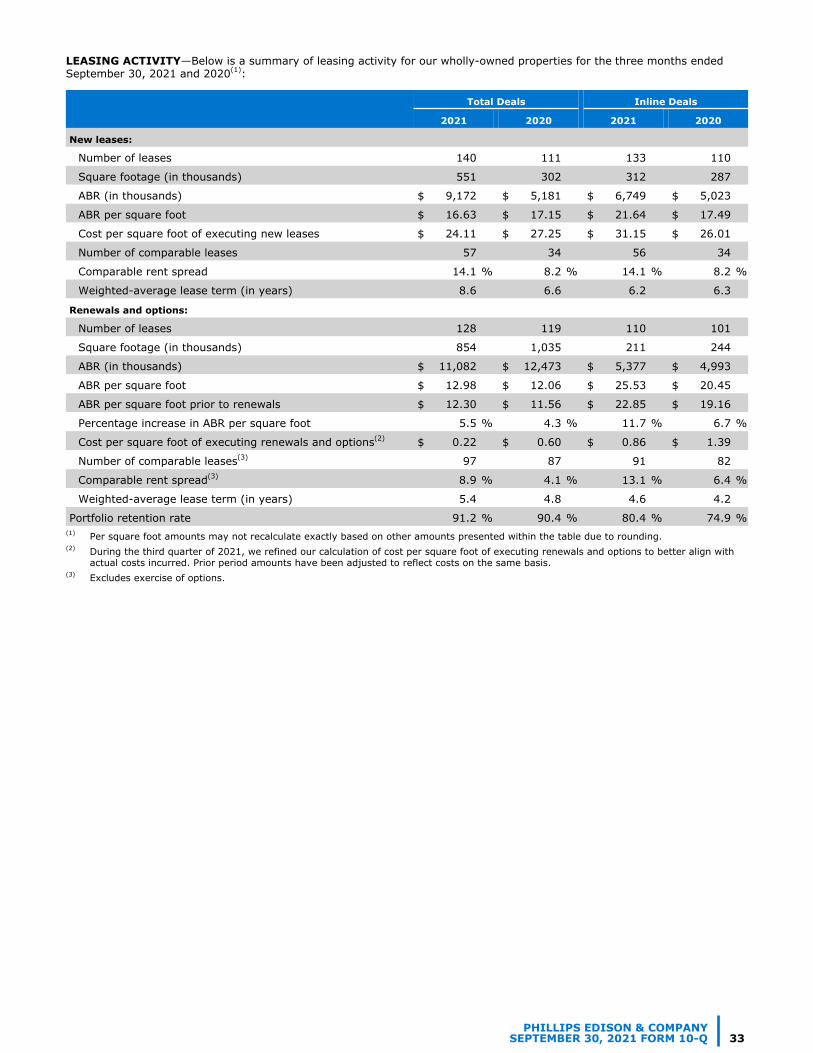
LEASING ACTIVITY—Below is a summary of leasing activity for our wholly-owned properties for the three months ended September 30, 2021 and 2020(1):
Total Deals Inline Deals
2021 2020 2021 2020
New leases:
Number of leases 140 111 133 110
Square footage (in thousands) 551 302 312 287
ABR (in thousands) $ 9,172 $ 5,181 $ 6,749 $ 5,023
ABR per square foot $ 16.63 $ 17.15 $ 21.64 $ 17.49
Cost per square foot of executing new leases $ 24.11 $ 27.25 $ 31.15 $ 26.01
Number of comparable leases 57 34 56 34
Comparable rent spread 14.1 % 8.2 % 14.1 % 8.2 %
Weighted-average lease term (in years) 8.6 6.6 6.2 6.3
Renewals and options:
Number of leases 128 119 110 101
Square footage (in thousands) 854 1,035 211 244
ABR (in thousands) $ 11,082 $ 12,473 $ 5,377 $ 4,993
ABR per square foot $ 12.98 $ 12.06 $ 25.53 $ 20.45
ABR per square foot prior to renewals $ 12.30 $ 11.56 $ 22.85 $ 19.16
Percentage increase in ABR per square foot 5.5 % 4.3 % 11.7 % 6.7 %
Cost per square foot of executing renewals and options(2) $ 0.22 $ 0.60 $ 0.86 $ 1.39
Number of comparable leases(3) 97 87 91 82
Comparable rent spread(3) 8.9 % 4.1 % 13.1 % 6.4 %
Weighted-average lease term (in years) 5.4 4.8 4.6 4.2
Portfolio retention rate 91.2 % 90.4 % 80.4 % 74.9 %(1) Per square foot amounts may not recalculate exactly based on other amounts presented within the table due to rounding.(2) During the third quarter of 2021, we refined our calculation of cost per square foot of executing renewals and options to better align with
actual costs incurred. Prior period amounts have been adjusted to reflect costs on the same basis. (3) Excludes exercise of options.
PHILLIPS EDISON & COMPANYSEPTEMBER 30, 2021 FORM 10-Q 33

Below is a summary of leasing activity for our wholly-owned properties for the nine months ended September 30, 2021 and 2020(1):
Total Deals Inline Deals
2021 2020 2021 2020
New leases:
Number of leases 417 259 401 245
Square footage (in thousands) 1,360 881 931 627
ABR (in thousands) $ 23,630 $ 13,778 $ 19,171 $ 11,038
ABR per square foot $ 17.38 $ 15.63 $ 20.59 $ 17.62
Cost per square foot of executing new leases $ 27.52 $ 23.25 $ 30.05 $ 25.89
Number of comparable leases 184 79 181 78
Comparable rent spread 14.9 % 9.7 % 14.9 % 9.7 %
Weighted-average lease term (in years) 8.1 7.7 6.4 6.6
Renewals and options:
Number of leases 465 354 416 309
Square footage (in thousands) 2,880 2,749 855 702
ABR (in thousands) $ 35,449 $ 31,135 $ 19,752 $ 14,498
ABR per square foot $ 12.31 $ 11.33 $ 23.10 $ 20.64
ABR per square foot prior to renewals $ 11.58 $ 10.74 $ 21.11 $ 18.94
Percentage increase in ABR per square foot 6.3 % 5.4 % 9.4 % 9.0 %
Cost per square foot of executing renewals and options(2) $ 0.56 $ 0.72 $ 1.22 $ 1.18
Number of comparable leases(3) 388 263 372 252
Comparable rent spread(3) 8.2 % 7.4 % 9.8 % 9.9 %
Weighted-average lease term (in years) 5.0 4.9 4.1 4.0
Portfolio retention rate 88.3 % 82.7 % 80.1 % 70.5 %(1) Per square foot amounts may not recalculate exactly based on other amounts presented within the table due to rounding.(2) During the third quarter of 2021, we refined our calculation of cost per square foot of executing renewals and options to better align with
actual costs incurred. Prior period amounts have been adjusted to reflect costs on the same basis. (3) Excludes exercise of options.
NON-GAAP MEASURES
See “Item 2. Management’s Discussion and Analysis of Financial Condition and Results of Operations - Key Performance Indicators and Defined Terms” of this filing on Form 10-Q for a discussion related to the following non-GAAP measures.
SAME-CENTER NET OPERATING INCOME—Same-Center NOI is presented as a supplemental measure of our performance, as it highlights operating trends such as occupancy levels, rental rates, and operating costs for our Same-Center portfolio. Other REITs may use different methodologies for calculating Same-Center NOI, and accordingly, our Same-Center NOI may not be comparable to other REITs. For the three and nine months ended September 30, 2021 and 2020, Same-Center NOI represents the NOI for the 261 properties that were wholly-owned and operational for the entire portion of both comparable periods.
Same-Center NOI should not be viewed as an alternative measure of our financial performance as it does not reflect the operations of our entire portfolio, nor does it reflect the impact of general and administrative expenses, depreciation and amortization, interest expense, other income (expense), or the level of capital expenditures and leasing costs necessary to maintain the operating performance of our properties that could materially impact our results from operations.
PHILLIPS EDISON & COMPANYSEPTEMBER 30, 2021 FORM 10-Q 34

The table below presents our Same-Center NOI for the current period and the comparable prior period (dollars in thousands):
Three Months Ended September 30,
Favorable (Unfavorable)
Nine Months Ended September 30,
Favorable (Unfavorable)
2021 2020$
Change%
Change 2021 2020 $ Change%
Change
Revenues:Rental income(1) $ 91,490 $ 89,188 $ 2,302 $ 271,643 $ 269,669 $ 1,974 Tenant recovery income 29,937 31,102 (1,165) 87,025 91,211 (4,186) Reserves for uncollectibility(2) 57 (5,807) 5,864 1,318 (17,817) 19,135 Other property income 1,010 765 245 1,740 2,213 (473)
Total revenues 122,494 115,248 7,246 6.3 % 361,726 345,276 16,450 4.8 %
Operating expenses:
Property operating expenses 17,333 16,439 (894) 53,397 50,448 (2,949)
Real estate taxes 16,039 16,793 754 48,452 49,648 1,196
Total operating expenses 33,372 33,232 (140) (0.4) % 101,849 100,096 (1,753) (1.8) %
Total Same-Center NOI $ 89,122 $ 82,016 $ 7,106 8.7 % $ 259,877 $ 245,180 $ 14,697 6.0 %(1) Excludes straight-line rental income, net amortization of above- and below-market leases, and lease buyout income.(2) Includes billings that will not be recognized as revenue until cash is collected or the Neighbor resumes regular payments and/or we deem it
appropriate to resume recording revenue on an accrual basis, rather than on a cash basis.
SAME-CENTER NOI RECONCILIATION—Below is a reconciliation of Net Income to NOI and Same-Center NOI (in thousands):
Three Months Ended September 30,
Nine Months Ended September 30,
2021 2020 2021 2020
Net income $ 16,562 $ 13,430 $ 23,069 $ 18,216
Adjusted to exclude:
Fees and management income (2,435) (2,581) (7,095) (7,506)
Straight-line rental income(1) (2,476) (1,800) (6,868) (3,164)
Net amortization of above- and below-market leases (908) (811) (2,633) (2,394)
Lease buyout income (560) (664) (3,138) (972)
General and administrative expenses 11,627 9,595 32,905 30,141
Depreciation and amortization 53,901 56,095 165,829 168,692
Impairment of real estate assets 698 — 6,754 —
Interest expense, net 18,570 20,388 57,765 65,317
Gain on disposal of property, net (14,093) (10,734) (31,678) (8,616)
Other expense (income), net 7,086 (196) 25,595 (9,565) Property operating expenses related to fees and management income 1,489 1,058 3,611 2,586
NOI for real estate investments 89,461 83,780 264,116 252,735
Less: Non-same-center NOI(2) (339) (1,764) (4,239) (7,555)
Total Same-Center NOI $ 89,122 $ 82,016 $ 259,877 $ 245,180 (1) Includes straight-line rent adjustments for Neighbors for whom revenue is being recorded on a cash basis.(2) Includes operating revenues and expenses from non-same-center properties which includes properties acquired or sold and corporate
activities.
NAREIT FFO AND CORE FFO—Nareit FFO is a non-GAAP financial performance measure that is widely recognized as a measure of REIT operating performance. Core FFO is an additional financial performance measure used by us as Nareit FFO includes certain non-comparable items that affect our performance over time. Core FFO is helpful in assisting management and investors with assessing the sustainability of our operating performance in future periods.
PHILLIPS EDISON & COMPANYSEPTEMBER 30, 2021 FORM 10-Q 35

Nareit FFO, Nareit FFO Attributable to Stockholders and OP Unit Holders, and Core FFO should not be considered alternatives to net income (loss) under GAAP, as an indication of our liquidity, nor as an indication of funds available to cover our cash needs, including our ability to fund distributions. Core FFO may not be a useful measure of the impact of long-term operating performance on value if we do not continue to operate our business plan in the manner currently contemplated.
Accordingly, Nareit FFO, Nareit FFO Attributable to Stockholders and OP Unit Holders, and Core FFO should be reviewed in connection with other GAAP measurements, and should not be viewed as more prominent measures of performance than net income (loss) or cash flows from operations prepared in accordance with GAAP. Our Nareit FFO, Nareit FFO Attributable to Stockholders and OP Unit Holders, and Core FFO, as presented, may not be comparable to amounts calculated by other REITs.
The following table presents our calculation of Nareit FFO Attributable to Stockholders and OP Unit Holders, and Core FFO (in thousands, except per share amounts):
Three Months Ended September 30,
Nine Months Ended September 30,
2021 2020(1) 2021 2020(1)
Calculation of Nareit FFO Attributable to Stockholders and OP Unit Holders
Net income $ 16,562 $ 13,430 $ 23,069 $ 18,216
Adjustments:
Depreciation and amortization of real estate assets 52,984 54,579 162,979 164,288
Impairment of real estate assets 698 — 6,754 —
Gain on disposal of property, net (14,093) (10,734) (31,678) (8,616)
Adjustments related to unconsolidated joint ventures 776 166 676 1,760 Nareit FFO attributable to stockholders and OP unit holders $ 56,927 $ 57,441 $ 161,800 $ 175,648
Calculation of Core FFO Nareit FFO attributable to stockholders and OP unit holders $ 56,927 $ 57,441 $ 161,800 $ 175,648
Adjustments:
Depreciation and amortization of corporate assets 917 1,516 2,850 4,404
Change in fair value of earn-out liability 5,000 — 23,000 (10,000) Amortization of unconsolidated joint venture basis differences 80 546 905 1,267
Transaction and acquisition expenses 1,775 152 2,850 211
Loss on extinguishment or modification of debt, net 1,674 — 2,784 73
Core FFO $ 66,373 $ 59,655 $ 194,189 $ 171,603
Nareit FFO Attributable to Stockholders and OP Unit Holders/Core FFO per Share(1)
Weighted-average shares of common stock outstanding - diluted 122,573 111,188 112,317 111,160 Nareit FFO attributable to stockholders and OP unit holders per share - diluted $ 0.46 $ 0.52 $ 1.44 $ 1.58
Core FFO per share - diluted $ 0.54 $ 0.54 $ 1.73 $ 1.54 (1) Certain prior period amounts have been reclassified to conform with current year presentation.(2) Restricted stock awards were dilutive to Nareit FFO Attributable to Stockholders and OP Unit Holders per share and Core FFO per share for
the three and nine months ended September 30, 2021 and 2020, and, accordingly, their impact was included in the weighted-average shares of common stock used in their respective per share calculations.
PHILLIPS EDISON & COMPANYSEPTEMBER 30, 2021 FORM 10-Q 36

EBITDAre and ADJUSTED EBITDAre—We use EBITDAre and Adjusted EBITDAre as additional measures of operating performance which allow us to compare earnings independent of capital structure, determine debt service and fixed cost coverage, and measure enterprise value. Additionally, we believe they are a useful indicator of our ability to support our debt obligations.
EBITDAre and Adjusted EBITDAre should not be considered as alternatives to net income (loss), as an indication of our liquidity, nor as an indication of funds available to cover our cash needs, including our ability to fund distributions. Accordingly, EBITDAre and Adjusted EBITDAre should be reviewed in connection with other GAAP measurements, and should not be viewed as more prominent measures of performance than net income (loss) or cash flows from operations prepared in accordance with GAAP. Our EBITDAre and Adjusted EBITDAre, as presented, may not be comparable to amounts calculated by other REITs.
The following table presents our calculation of EBITDAre and Adjusted EBITDAre (in thousands):
Three Months Ended September 30,
Nine Months Ended September 30,
Year Ended December 31,
2021 2020 2021 2020 2020
Calculation of EBITDAre
Net income $ 16,562 $ 13,430 $ 23,069 $ 18,216 $ 5,462
Adjustments:
Depreciation and amortization 53,901 56,095 165,829 168,692 224,679
Interest expense, net 18,570 20,388 57,765 65,317 85,303
Gain on disposal of property, net (14,093) (10,734) (31,678) (8,616) (6,494)
Impairment of real estate assets 698 — 6,754 — 2,423
Federal, state, and local tax expense 165 173 496 382 491 Adjustments related to unconsolidated joint ventures 1,107 594 1,704 3,162 3,355
EBITDAre $ 76,910 $ 79,946 $ 223,939 $ 247,153 $ 315,219
Calculation of Adjusted EBITDAre
EBITDAre $ 76,910 $ 79,946 $ 223,939 $ 247,153 $ 315,219
Adjustments:
Change in fair value of earn-out liability 5,000 — 23,000 (10,000) (10,000)
Transaction and acquisition expenses 1,775 152 2,850 211 539 Amortization of unconsolidated joint venture basis differences 80 546 905 1,267 1,883
Other impairment charges — — — — 359
Adjusted EBITDAre $ 83,765 $ 80,644 $ 250,694 $ 238,631 $ 308,000
LIQUIDITY AND CAPITAL RESOURCES
GENERAL—Aside from standard operating expenses, we expect our principal cash demands to be for:
• cash distributions to stockholders;• investments in real estate;• capital expenditures and leasing costs;• redevelopment and repositioning projects; and
• principal and interest payments on our outstanding indebtedness.
We expect our primary sources of liquidity to be:
• net proceeds from our underwritten IPO;• operating cash flows;• proceeds received from the disposition of properties;• proceeds from equity and debt financings, including borrowings in connection with our Bond Registration and those
under our unsecured revolving credit facility;• distributions received from our unconsolidated joint ventures; and• available, unrestricted cash and cash equivalents.
At this time, we believe our current sources of liquidity, most significantly the net proceeds from our underwritten IPO, our operating cash flows, and borrowing availability on our revolving credit facility, are sufficient to meet our short- and long-term cash demands.
PHILLIPS EDISON & COMPANYSEPTEMBER 30, 2021 FORM 10-Q 37
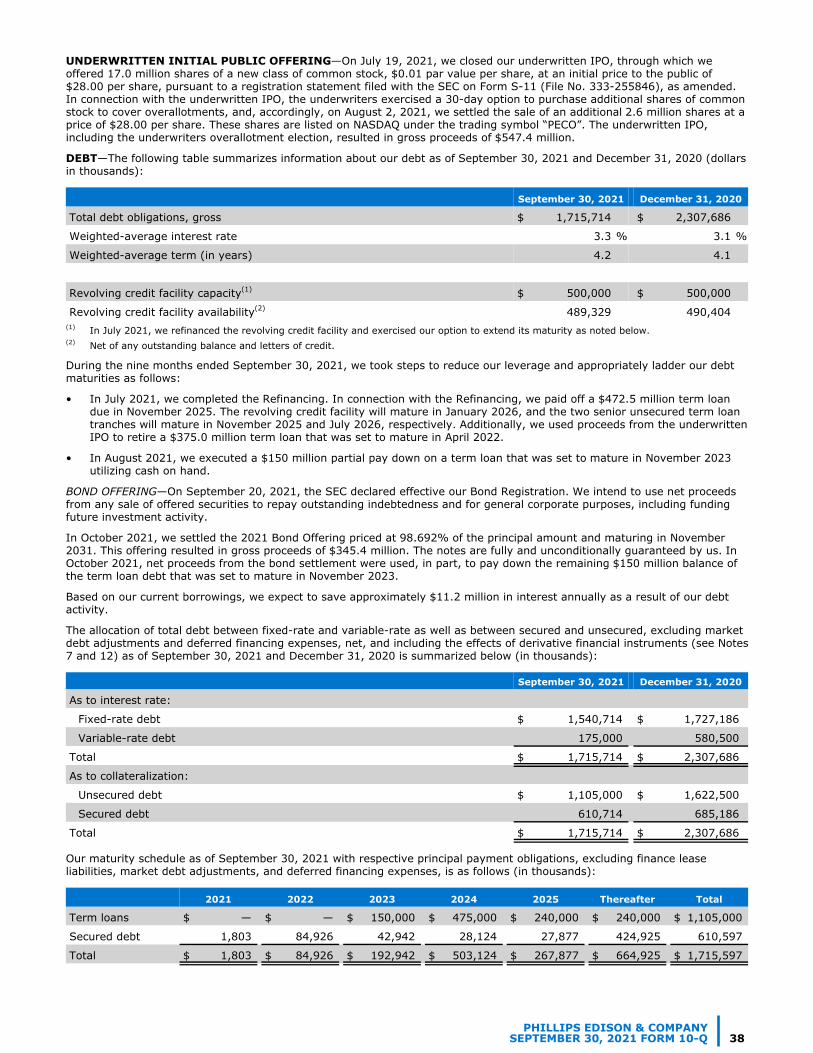
UNDERWRITTEN INITIAL PUBLIC OFFERING—On July 19, 2021, we closed our underwritten IPO, through which we offered 17.0 million shares of a new class of common stock, $0.01 par value per share, at an initial price to the public of $28.00 per share, pursuant to a registration statement filed with the SEC on Form S-11 (File No. 333-255846), as amended. In connection with the underwritten IPO, the underwriters exercised a 30-day option to purchase additional shares of common stock to cover overallotments, and, accordingly, on August 2, 2021, we settled the sale of an additional 2.6 million shares at a price of $28.00 per share. These shares are listed on NASDAQ under the trading symbol “PECO”. The underwritten IPO, including the underwriters overallotment election, resulted in gross proceeds of $547.4 million.
DEBT—The following table summarizes information about our debt as of September 30, 2021 and December 31, 2020 (dollars in thousands):
September 30, 2021 December 31, 2020
Total debt obligations, gross $ 1,715,714 $ 2,307,686
Weighted-average interest rate 3.3 % 3.1 %
Weighted-average term (in years) 4.2 4.1
Revolving credit facility capacity(1) $ 500,000 $ 500,000
Revolving credit facility availability(2) 489,329 490,404 (1) In July 2021, we refinanced the revolving credit facility and exercised our option to extend its maturity as noted below. (2) Net of any outstanding balance and letters of credit.
During the nine months ended September 30, 2021, we took steps to reduce our leverage and appropriately ladder our debt maturities as follows:
• In July 2021, we completed the Refinancing. In connection with the Refinancing, we paid off a $472.5 million term loan due in November 2025. The revolving credit facility will mature in January 2026, and the two senior unsecured term loan tranches will mature in November 2025 and July 2026, respectively. Additionally, we used proceeds from the underwritten IPO to retire a $375.0 million term loan that was set to mature in April 2022.
• In August 2021, we executed a $150 million partial pay down on a term loan that was set to mature in November 2023 utilizing cash on hand.
BOND OFFERING—On September 20, 2021, the SEC declared effective our Bond Registration. We intend to use net proceeds from any sale of offered securities to repay outstanding indebtedness and for general corporate purposes, including funding future investment activity.
In October 2021, we settled the 2021 Bond Offering priced at 98.692% of the principal amount and maturing in November 2031. This offering resulted in gross proceeds of $345.4 million. The notes are fully and unconditionally guaranteed by us. In October 2021, net proceeds from the bond settlement were used, in part, to pay down the remaining $150 million balance of the term loan debt that was set to mature in November 2023.
Based on our current borrowings, we expect to save approximately $11.2 million in interest annually as a result of our debt activity.
The allocation of total debt between fixed-rate and variable-rate as well as between secured and unsecured, excluding market debt adjustments and deferred financing expenses, net, and including the effects of derivative financial instruments (see Notes 7 and 12) as of September 30, 2021 and December 31, 2020 is summarized below (in thousands):
September 30, 2021 December 31, 2020
As to interest rate:
Fixed-rate debt $ 1,540,714 $ 1,727,186
Variable-rate debt 175,000 580,500
Total $ 1,715,714 $ 2,307,686
As to collateralization:
Unsecured debt $ 1,105,000 $ 1,622,500
Secured debt 610,714 685,186
Total $ 1,715,714 $ 2,307,686
Our maturity schedule as of September 30, 2021 with respective principal payment obligations, excluding finance lease liabilities, market debt adjustments, and deferred financing expenses, is as follows (in thousands):
2021 2022 2023 2024 2025 Thereafter Total
Term loans $ — $ — $ 150,000 $ 475,000 $ 240,000 $ 240,000 $ 1,105,000
Secured debt 1,803 84,926 42,942 28,124 27,877 424,925 610,597
Total $ 1,803 $ 84,926 $ 192,942 $ 503,124 $ 267,877 $ 664,925 $ 1,715,597
PHILLIPS EDISON & COMPANYSEPTEMBER 30, 2021 FORM 10-Q 38
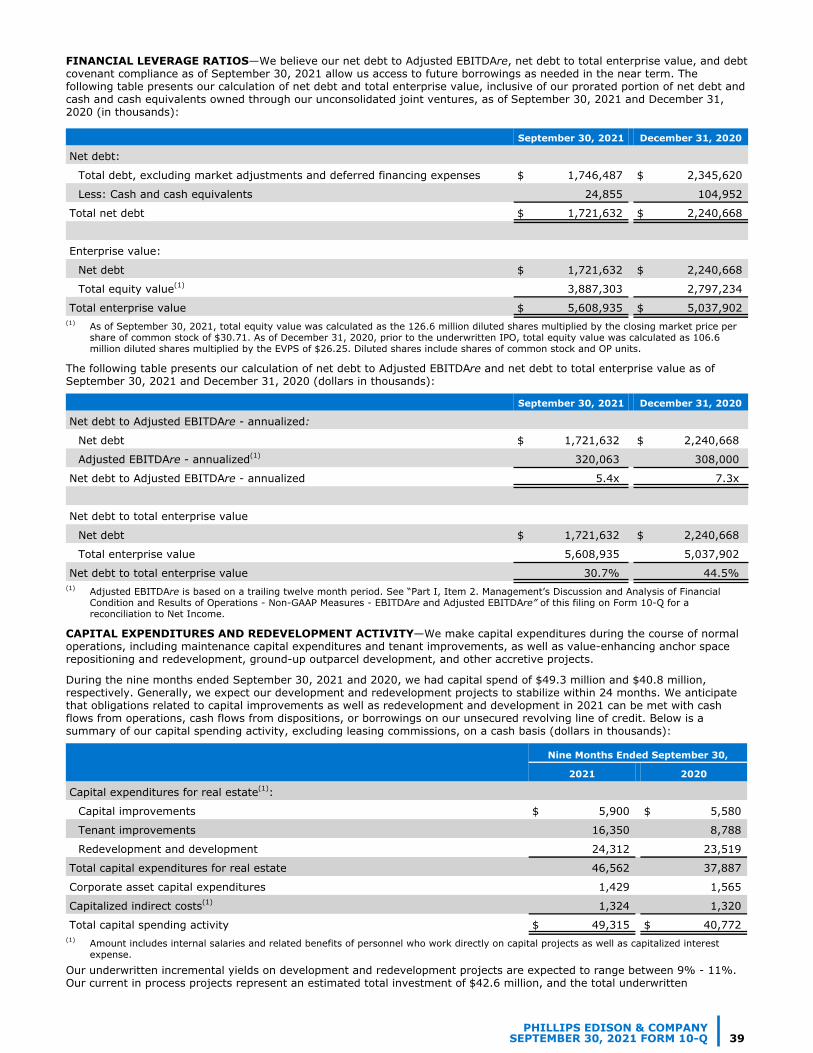
FINANCIAL LEVERAGE RATIOS—We believe our net debt to Adjusted EBITDAre, net debt to total enterprise value, and debt covenant compliance as of September 30, 2021 allow us access to future borrowings as needed in the near term. The following table presents our calculation of net debt and total enterprise value, inclusive of our prorated portion of net debt and cash and cash equivalents owned through our unconsolidated joint ventures, as of September 30, 2021 and December 31, 2020 (in thousands):
September 30, 2021 December 31, 2020
Net debt:
Total debt, excluding market adjustments and deferred financing expenses $ 1,746,487 $ 2,345,620
Less: Cash and cash equivalents 24,855 104,952
Total net debt $ 1,721,632 $ 2,240,668
Enterprise value:
Net debt $ 1,721,632 $ 2,240,668
Total equity value(1) 3,887,303 2,797,234
Total enterprise value $ 5,608,935 $ 5,037,902 (1) As of September 30, 2021, total equity value was calculated as the 126.6 million diluted shares multiplied by the closing market price per
share of common stock of $30.71. As of December 31, 2020, prior to the underwritten IPO, total equity value was calculated as 106.6 million diluted shares multiplied by the EVPS of $26.25. Diluted shares include shares of common stock and OP units.
The following table presents our calculation of net debt to Adjusted EBITDAre and net debt to total enterprise value as of September 30, 2021 and December 31, 2020 (dollars in thousands):
September 30, 2021 December 31, 2020
Net debt to Adjusted EBITDAre - annualized:
Net debt $ 1,721,632 $ 2,240,668
Adjusted EBITDAre - annualized(1) 320,063 308,000
Net debt to Adjusted EBITDAre - annualized 5.4 x 7.3 x
Net debt to total enterprise value
Net debt $ 1,721,632 $ 2,240,668
Total enterprise value 5,608,935 5,037,902
Net debt to total enterprise value 30.7 % 44.5 %(1) Adjusted EBITDAre is based on a trailing twelve month period. See “Part I, Item 2. Management’s Discussion and Analysis of Financial
Condition and Results of Operations - Non-GAAP Measures - EBITDAre and Adjusted EBITDAre” of this filing on Form 10-Q for a reconciliation to Net Income.
CAPITAL EXPENDITURES AND REDEVELOPMENT ACTIVITY—We make capital expenditures during the course of normal operations, including maintenance capital expenditures and tenant improvements, as well as value-enhancing anchor space repositioning and redevelopment, ground-up outparcel development, and other accretive projects.
During the nine months ended September 30, 2021 and 2020, we had capital spend of $49.3 million and $40.8 million, respectively. Generally, we expect our development and redevelopment projects to stabilize within 24 months. We anticipate that obligations related to capital improvements as well as redevelopment and development in 2021 can be met with cash flows from operations, cash flows from dispositions, or borrowings on our unsecured revolving line of credit. Below is a summary of our capital spending activity, excluding leasing commissions, on a cash basis (dollars in thousands):
Nine Months Ended September 30,
2021 2020
Capital expenditures for real estate(1):
Capital improvements $ 5,900 $ 5,580
Tenant improvements 16,350 8,788
Redevelopment and development 24,312 23,519
Total capital expenditures for real estate 46,562 37,887
Corporate asset capital expenditures 1,429 1,565
Capitalized indirect costs(1) 1,324 1,320
Total capital spending activity $ 49,315 $ 40,772 (1) Amount includes internal salaries and related benefits of personnel who work directly on capital projects as well as capitalized interest
expense.
Our underwritten incremental yields on development and redevelopment projects are expected to range between 9% - 11%. Our current in process projects represent an estimated total investment of $42.6 million, and the total underwritten
PHILLIPS EDISON & COMPANYSEPTEMBER 30, 2021 FORM 10-Q 39

incremental yield range on this estimated investment is approximately 9.5% - 10.5%. Actual incremental yields may vary from our underwritten incremental yield range based on the actual total cost to complete a project and its actual incremental annual NOI at stabilization. See “Part I, Item 2. Management’s Discussion and Analysis of Financial Condition and Results of Operations - Key Performance Indicators and Defined Terms” of this filing on Form 10-Q for further information.
ACQUISITION ACTIVITY—We continually monitor the commercial real estate market for properties that have future growth potential, are located in attractive demographic markets, and support our business objectives. The following table highlights our property acquisitions (dollars in thousands):
Nine Months Ended September 30,
2021 2020
Number of properties acquired 4 1
Number of outparcels acquired(1) 3 2
Total acquisition price $ 88,954 $ 23,014 (1) Outparcels acquired are adjacent to shopping centers that we own.
Subsequent to September 30, 2021, we purchased two properties for $91.2 million.
DISPOSITION ACTIVITY—We are actively evaluating our portfolio of assets for opportunities to make strategic dispositions of assets that no longer meet our growth and investment objectives or assets that have stabilized in order to capture their value. We expect to continue to make strategic dispositions during the remainder of 2021. The following table highlights our property dispositions (dollars in thousands):
Nine Months Ended September 30,
2021 2020
Number of properties sold(1) 20 6
Number of outparcels sold(2)(3) 3 —
Proceeds from sale of real estate $ 180,340 $ 48,276
Gain on sale of property, net(4) 33,121 9,915 (1) We retained an outparcel for one property sold during the nine months ended September 30, 2021, and therefore the sale did not result in
a reduction in our total property count.(2) During the nine months ended September 30, 2021, our outparcel sales included: (i) the only remaining portion of one of our properties;
therefore, resulting in a reduction in our total property count; and (ii) an undeveloped parcel of land, as well as an outparcel adjacent to one of our centers, neither of which resulted in a reduction in our total property count.
(3) In addition to the three outparcels sold during the nine months ended September 30, 2021, a tenant at one of our properties exercised a bargain purchase option to acquire a parcel of land that we previously owned. This generated minimal proceeds for us.
(4) The gain on sale of properties, net does not include miscellaneous write-off activity, which is also recorded in Gain on Disposal of Property, Net on the consolidated statements of operations.
Subsequent to September 30, 2021, we sold one property for $4.4 million.
PHILLIPS EDISON & COMPANYSEPTEMBER 30, 2021 FORM 10-Q 40
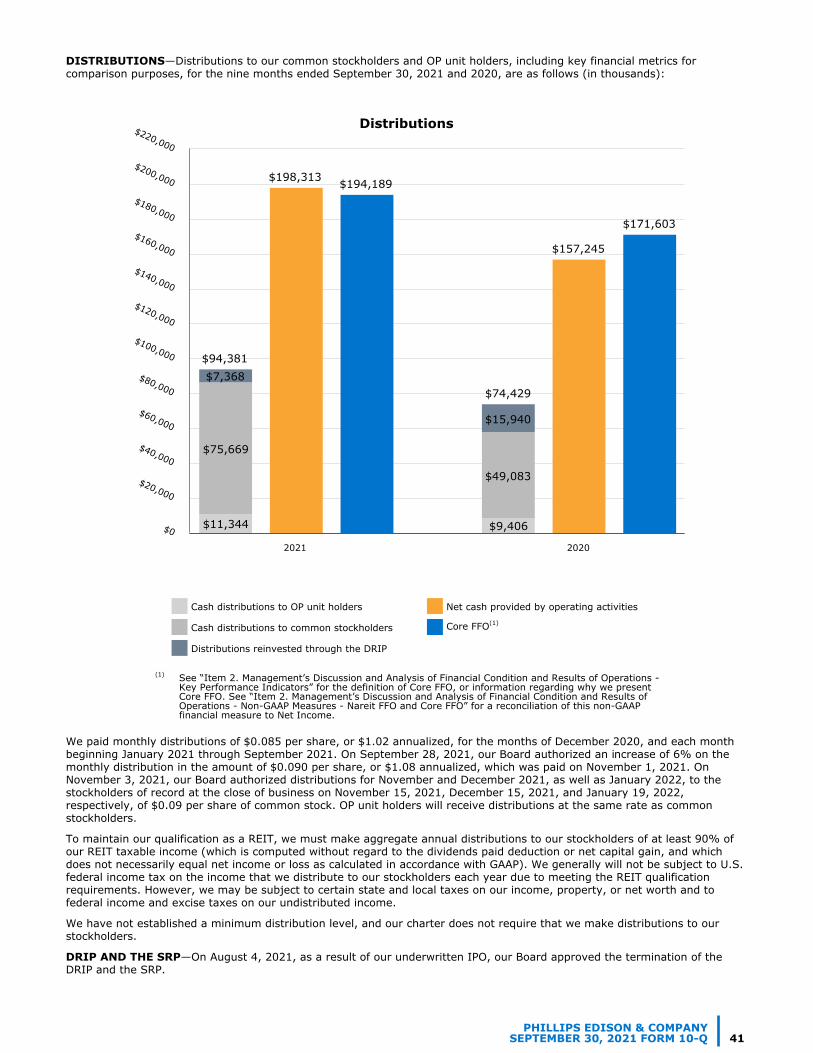
DISTRIBUTIONS—Distributions to our common stockholders and OP unit holders, including key financial metrics for comparison purposes, for the nine months ended September 30, 2021 and 2020, are as follows (in thousands):
Distributions
$94,381
$198,313 $194,189
$74,429
$157,245
$171,603
$11,344 $9,406
$75,669
$49,083
$7,368
$15,940
2021 2020
$0
$20,000
$40,000
$60,000
$80,000
$100,000
$120,000
$140,000
$160,000
$180,000
$200,000
$220,000
Cash distributions to OP unit holders Net cash provided by operating activities
Cash distributions to common stockholders Core FFO(1)
Distributions reinvested through the DRIP
(1) See “Item 2. Management’s Discussion and Analysis of Financial Condition and Results of Operations - Key Performance Indicators” for the definition of Core FFO, or information regarding why we present Core FFO. See “Item 2. Management’s Discussion and Analysis of Financial Condition and Results of Operations - Non-GAAP Measures - Nareit FFO and Core FFO” for a reconciliation of this non-GAAP financial measure to Net Income.
We paid monthly distributions of $0.085 per share, or $1.02 annualized, for the months of December 2020, and each month beginning January 2021 through September 2021. On September 28, 2021, our Board authorized an increase of 6% on the monthly distribution in the amount of $0.090 per share, or $1.08 annualized, which was paid on November 1, 2021. On November 3, 2021, our Board authorized distributions for November and December 2021, as well as January 2022, to the stockholders of record at the close of business on November 15, 2021, December 15, 2021, and January 19, 2022, respectively, of $0.09 per share of common stock. OP unit holders will receive distributions at the same rate as common stockholders.
To maintain our qualification as a REIT, we must make aggregate annual distributions to our stockholders of at least 90% of our REIT taxable income (which is computed without regard to the dividends paid deduction or net capital gain, and which does not necessarily equal net income or loss as calculated in accordance with GAAP). We generally will not be subject to U.S. federal income tax on the income that we distribute to our stockholders each year due to meeting the REIT qualification requirements. However, we may be subject to certain state and local taxes on our income, property, or net worth and to federal income and excise taxes on our undistributed income.
We have not established a minimum distribution level, and our charter does not require that we make distributions to our stockholders.
DRIP AND THE SRP—On August 4, 2021, as a result of our underwritten IPO, our Board approved the termination of the DRIP and the SRP.
PHILLIPS EDISON & COMPANYSEPTEMBER 30, 2021 FORM 10-Q 41
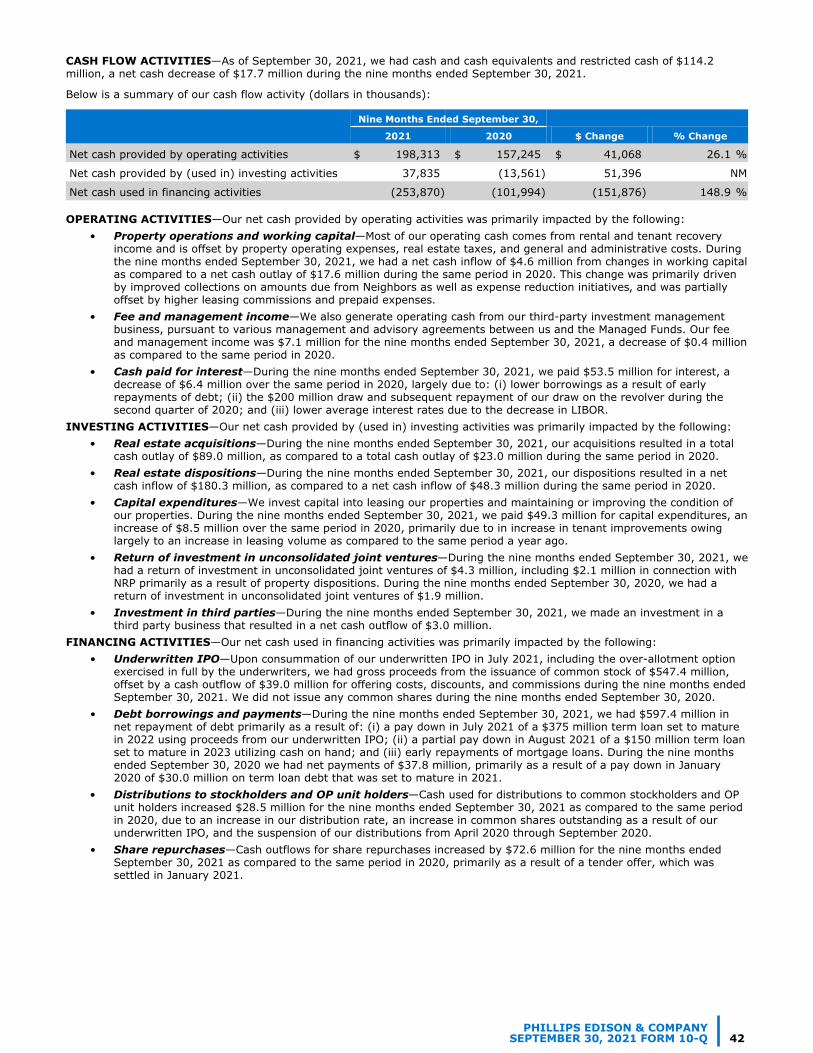
CASH FLOW ACTIVITIES—As of September 30, 2021, we had cash and cash equivalents and restricted cash of $114.2 million, a net cash decrease of $17.7 million during the nine months ended September 30, 2021.
Below is a summary of our cash flow activity (dollars in thousands):
Nine Months Ended September 30,
2021 2020 $ Change % Change
Net cash provided by operating activities $ 198,313 $ 157,245 $ 41,068 26.1 %
Net cash provided by (used in) investing activities 37,835 (13,561) 51,396 NM
Net cash used in financing activities (253,870) (101,994) (151,876) 148.9 %
OPERATING ACTIVITIES—Our net cash provided by operating activities was primarily impacted by the following:• Property operations and working capital—Most of our operating cash comes from rental and tenant recovery
income and is offset by property operating expenses, real estate taxes, and general and administrative costs. During the nine months ended September 30, 2021, we had a net cash inflow of $4.6 million from changes in working capital as compared to a net cash outlay of $17.6 million during the same period in 2020. This change was primarily driven by improved collections on amounts due from Neighbors as well as expense reduction initiatives, and was partially offset by higher leasing commissions and prepaid expenses.
• Fee and management income—We also generate operating cash from our third-party investment management business, pursuant to various management and advisory agreements between us and the Managed Funds. Our fee and management income was $7.1 million for the nine months ended September 30, 2021, a decrease of $0.4 million as compared to the same period in 2020.
• Cash paid for interest—During the nine months ended September 30, 2021, we paid $53.5 million for interest, a decrease of $6.4 million over the same period in 2020, largely due to: (i) lower borrowings as a result of early repayments of debt; (ii) the $200 million draw and subsequent repayment of our draw on the revolver during the second quarter of 2020; and (iii) lower average interest rates due to the decrease in LIBOR.
INVESTING ACTIVITIES—Our net cash provided by (used in) investing activities was primarily impacted by the following:• Real estate acquisitions—During the nine months ended September 30, 2021, our acquisitions resulted in a total
cash outlay of $89.0 million, as compared to a total cash outlay of $23.0 million during the same period in 2020.• Real estate dispositions—During the nine months ended September 30, 2021, our dispositions resulted in a net
cash inflow of $180.3 million, as compared to a net cash inflow of $48.3 million during the same period in 2020. • Capital expenditures—We invest capital into leasing our properties and maintaining or improving the condition of
our properties. During the nine months ended September 30, 2021, we paid $49.3 million for capital expenditures, an increase of $8.5 million over the same period in 2020, primarily due to in increase in tenant improvements owing largely to an increase in leasing volume as compared to the same period a year ago.
• Return of investment in unconsolidated joint ventures—During the nine months ended September 30, 2021, we had a return of investment in unconsolidated joint ventures of $4.3 million, including $2.1 million in connection with NRP primarily as a result of property dispositions. During the nine months ended September 30, 2020, we had a return of investment in unconsolidated joint ventures of $1.9 million.
• Investment in third parties—During the nine months ended September 30, 2021, we made an investment in a third party business that resulted in a net cash outflow of $3.0 million.
FINANCING ACTIVITIES—Our net cash used in financing activities was primarily impacted by the following:• Underwritten IPO—Upon consummation of our underwritten IPO in July 2021, including the over-allotment option
exercised in full by the underwriters, we had gross proceeds from the issuance of common stock of $547.4 million, offset by a cash outflow of $39.0 million for offering costs, discounts, and commissions during the nine months ended September 30, 2021. We did not issue any common shares during the nine months ended September 30, 2020.
• Debt borrowings and payments—During the nine months ended September 30, 2021, we had $597.4 million in net repayment of debt primarily as a result of: (i) a pay down in July 2021 of a $375 million term loan set to mature in 2022 using proceeds from our underwritten IPO; (ii) a partial pay down in August 2021 of a $150 million term loan set to mature in 2023 utilizing cash on hand; and (iii) early repayments of mortgage loans. During the nine months ended September 30, 2020 we had net payments of $37.8 million, primarily as a result of a pay down in January 2020 of $30.0 million on term loan debt that was set to mature in 2021.
• Distributions to stockholders and OP unit holders—Cash used for distributions to common stockholders and OP unit holders increased $28.5 million for the nine months ended September 30, 2021 as compared to the same period in 2020, due to an increase in our distribution rate, an increase in common shares outstanding as a result of our underwritten IPO, and the suspension of our distributions from April 2020 through September 2020.
• Share repurchases—Cash outflows for share repurchases increased by $72.6 million for the nine months ended September 30, 2021 as compared to the same period in 2020, primarily as a result of a tender offer, which was settled in January 2021.
PHILLIPS EDISON & COMPANYSEPTEMBER 30, 2021 FORM 10-Q 42
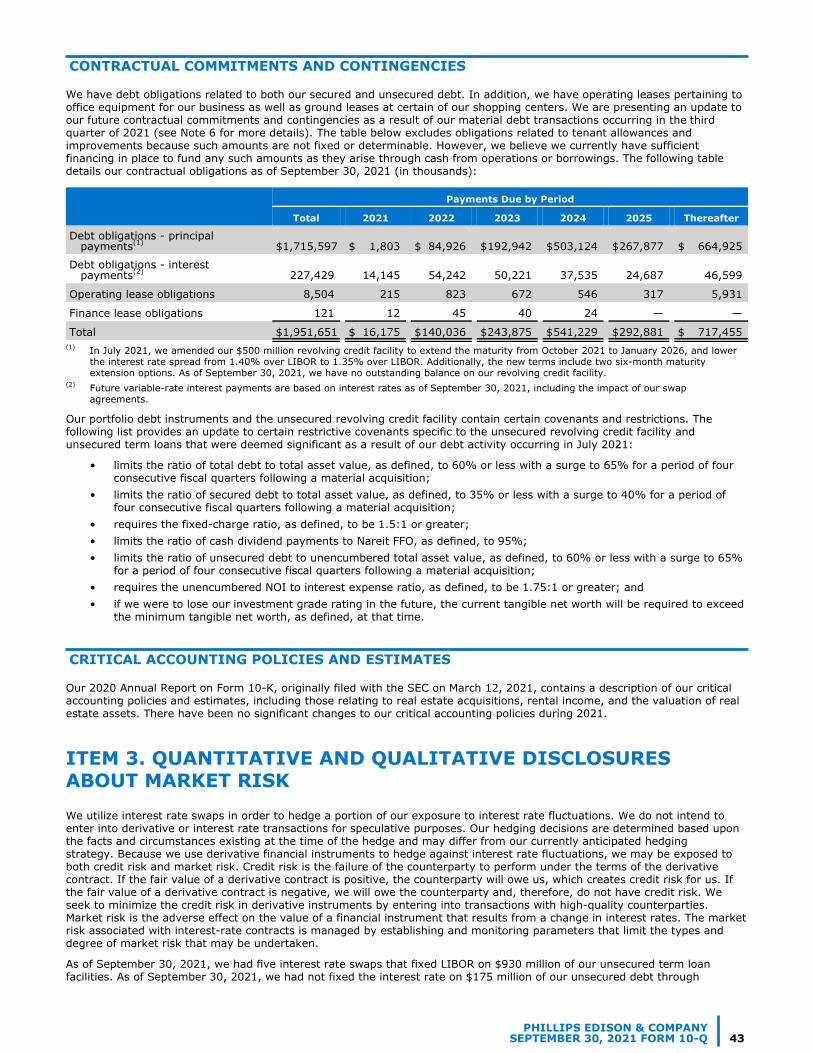
CONTRACTUAL COMMITMENTS AND CONTINGENCIES
We have debt obligations related to both our secured and unsecured debt. In addition, we have operating leases pertaining to office equipment for our business as well as ground leases at certain of our shopping centers. We are presenting an update to our future contractual commitments and contingencies as a result of our material debt transactions occurring in the third quarter of 2021 (see Note 6 for more details). The table below excludes obligations related to tenant allowances and improvements because such amounts are not fixed or determinable. However, we believe we currently have sufficient financing in place to fund any such amounts as they arise through cash from operations or borrowings. The following table details our contractual obligations as of September 30, 2021 (in thousands):
Payments Due by Period
Total 2021 2022 2023 2024 2025 Thereafter
Debt obligations - principal payments(1) $ 1,715,597 $ 1,803 $ 84,926 $ 192,942 $ 503,124 $ 267,877 $ 664,925
Debt obligations - interest payments(2) 227,429 14,145 54,242 50,221 37,535 24,687 46,599
Operating lease obligations 8,504 215 823 672 546 317 5,931
Finance lease obligations 121 12 45 40 24 — —
Total $ 1,951,651 $ 16,175 $ 140,036 $ 243,875 $ 541,229 $ 292,881 $ 717,455 (1) In July 2021, we amended our $500 million revolving credit facility to extend the maturity from October 2021 to January 2026, and lower
the interest rate spread from 1.40% over LIBOR to 1.35% over LIBOR. Additionally, the new terms include two six-month maturity extension options. As of September 30, 2021, we have no outstanding balance on our revolving credit facility.
(2) Future variable-rate interest payments are based on interest rates as of September 30, 2021, including the impact of our swap agreements.
Our portfolio debt instruments and the unsecured revolving credit facility contain certain covenants and restrictions. The following list provides an update to certain restrictive covenants specific to the unsecured revolving credit facility and unsecured term loans that were deemed significant as a result of our debt activity occurring in July 2021:
• limits the ratio of total debt to total asset value, as defined, to 60% or less with a surge to 65% for a period of four consecutive fiscal quarters following a material acquisition;
• limits the ratio of secured debt to total asset value, as defined, to 35% or less with a surge to 40% for a period of four consecutive fiscal quarters following a material acquisition;
• requires the fixed-charge ratio, as defined, to be 1.5:1 or greater;• limits the ratio of cash dividend payments to Nareit FFO, as defined, to 95%;• limits the ratio of unsecured debt to unencumbered total asset value, as defined, to 60% or less with a surge to 65%
for a period of four consecutive fiscal quarters following a material acquisition;• requires the unencumbered NOI to interest expense ratio, as defined, to be 1.75:1 or greater; and• if we were to lose our investment grade rating in the future, the current tangible net worth will be required to exceed
the minimum tangible net worth, as defined, at that time.
CRITICAL ACCOUNTING POLICIES AND ESTIMATES
Our 2020 Annual Report on Form 10-K, originally filed with the SEC on March 12, 2021, contains a description of our critical accounting policies and estimates, including those relating to real estate acquisitions, rental income, and the valuation of real estate assets. There have been no significant changes to our critical accounting policies during 2021.
ITEM 3. QUANTITATIVE AND QUALITATIVE DISCLOSURES ABOUT MARKET RISK
We utilize interest rate swaps in order to hedge a portion of our exposure to interest rate fluctuations. We do not intend to enter into derivative or interest rate transactions for speculative purposes. Our hedging decisions are determined based upon the facts and circumstances existing at the time of the hedge and may differ from our currently anticipated hedging strategy. Because we use derivative financial instruments to hedge against interest rate fluctuations, we may be exposed to both credit risk and market risk. Credit risk is the failure of the counterparty to perform under the terms of the derivative contract. If the fair value of a derivative contract is positive, the counterparty will owe us, which creates credit risk for us. If the fair value of a derivative contract is negative, we will owe the counterparty and, therefore, do not have credit risk. We seek to minimize the credit risk in derivative instruments by entering into transactions with high-quality counterparties. Market risk is the adverse effect on the value of a financial instrument that results from a change in interest rates. The market risk associated with interest-rate contracts is managed by establishing and monitoring parameters that limit the types and degree of market risk that may be undertaken.
As of September 30, 2021, we had five interest rate swaps that fixed LIBOR on $930 million of our unsecured term loan facilities. As of September 30, 2021, we had not fixed the interest rate on $175 million of our unsecured debt through
PHILLIPS EDISON & COMPANYSEPTEMBER 30, 2021 FORM 10-Q 43

derivative financial instruments. We estimate that a one percentage point increase in interest rates on the outstanding balance of our variable rate debt would result in approximately $1.8 million of additional interest expense annually.
The additional interest expense was determined based on the impact of hypothetical interest rates on our borrowing cost and assumes no changes in our capital structure. For further discussion of certain quantitative details related to our interest rate swaps, see Note 7.
See “Part II, Item 7A. Quantitative and Qualitative Disclosures about Market Risk” of our 2020 Annual Report on Form 10-K originally filed with the SEC on March 12, 2021 for more details associated with our exposure to credit risk and market risk.
ITEM 4. CONTROLS AND PROCEDURES
Evaluation of Disclosure Controls and Procedures
Our management, with the participation of our Principal Executive Officer and Principal Financial Officer, has evaluated the effectiveness of our disclosure controls and procedures (as defined in Rule 13a-15(e) under the Exchange Act) as of September 30, 2021. Based on that evaluation, our Principal Executive Officer and Principal Financial Officer concluded that our disclosure controls and procedures (as defined in Rule 13a-15(e) under the Exchange Act) were effective as of September 30, 2021.
Changes in Internal Control over Financial Reporting
During the quarter ended September 30, 2021, there were no changes in our internal control over financial reporting (as defined in Rule 13a-15(f) under the Exchange Act) that have materially affected, or are reasonably likely to materially affect, our internal control over financial reporting.
w PART II OTHER INFORMATION
ITEM 1. LEGAL PROCEEDINGS
From time to time, we are party to legal proceedings, which arise in the ordinary course of our business. We are not currently involved in any legal proceedings for which we are not covered by our liability insurance or the outcome is reasonably likely to have a material impact on our results of operations or financial condition, nor are we aware of any such legal proceedings contemplated by governmental authorities.
ITEM 1A. RISK FACTORS
There have been no material changes to our risk factors and other risks and uncertainties as described in our 2020 Annual Report on Form 10-K, as originally filed with the SEC on March 12, 2021, and any subsequently filed Quarterly Reports on Form 10-Q.
ITEM 2. UNREGISTERED SALES OF EQUITY SECURITIES AND USE OF PROCEEDS
On August 4, 2021, as a result of our underwritten IPO, our Board approved the termination of the standard repurchase program (“SRP”). During the nine months ended September 30, 2021, we did not repurchase any shares prior to our underwritten initial public offering, which closed on July 19, 2021.
PHILLIPS EDISON & COMPANYSEPTEMBER 30, 2021 FORM 10-Q 44

ITEM 6. EXHIBITS
Ex. Description Reference3.1 Fifth Articles of Amendment and Restatement of Phillips
Edison & Company, Inc., as amendedForm 10-Q, filed August 5, 2021. Exhibit 3.1
3.2 Fifth Amended and Restated Bylaws of Phillips Edison & Company, Inc.
Form 8-K, filed July 19, 2021, Exhibit 3.1
4.1 Form of Indenture, by and among Phillips Edison & Company, Inc., as issuer, and U.S. Bank National Association, as trustee
Form S-3, filed August 25, 2021, Exhibit 4.2
4.2 Form of Indenture, by and among Phillips Edison Grocery Center Operating Partnership I, L.P., as issuer, and U.S. Bank National Association, as trustee
Form S-3, filed August 25, 2021, Exhibit 4.3
10.1 First Amendment to Credit Agreement, by and among Phillips Edison Grocery Center Operating Partnership I, L.P., Phillips Edison & Company, Inc., the Lenders and Capital One, National Association, as administrative agent, dated November 16, 2018
Form S-11/A, filed July 7, 2021, Exhibit 10.4
10.2 Credit Agreement among Phillips Edison Grocery Center Operating Partnership I, L.P., Phillips Edison & Company, Inc., the lenders party thereto, and PNC Bank, National Association as administrative agent, dated July 2, 2021
Form 8-K, filed July 2, 2021, Exhibit 10.1
10.3 Tax Protection Agreement by and among Phillips Edison & Company, Inc., Phillips Edison Grocery Center Operating Partnership I, L.P., and each Protected Partner identified as a signatory on Schedule I
Form 8-K, filed July 19, 2021, Exhibit 10.1
10.4 Form of LTIP Listing Equity Grant Form S-11/A, filed July 7, 2021, Exhibit 10.32
10.5 Form of LTIP Listing Equity Grant (Murphy) Form S-11/A, filed July 7, 2021, Exhibit 10.33
10.6 Form of RSU Listing Equity Grant Form S-11/A, filed July 7, 2021, Exhibit 10.34
10.7 Form of Restricted Stock Listing Equity Grant Form S-11/A, filed July 7, 2021, Exhibit 10.35
31.1 * Certification of Principal Executive Officer pursuant to Section 302 of the Sarbanes-Oxley Act of 2002
31.2 * Certification of Principal Financial Officer pursuant to Section 302 of the Sarbanes-Oxley Act of 2002
32.1 * Certification of Principal Executive Officer pursuant to 18 U.S.C. 1350, as created by Section 906 of the Sarbanes-Oxley Act of 2002
32.2 * Certification of Principal Financial Officer pursuant to 18 U.S.C. 1350, as created by Section 906 of the Sarbanes-Oxley Act of 2002
101.INS Inline XBRL Instance Document - the instance document does not appear in the Interactive Data File because its XBRL tags are embedded within the Inline XBRL document
101.SCH Inline XBRL Taxonomy Extension Schema Document101.CAL Inline XBRL Taxonomy Extension Calculation Linkbase
Document101.DEF Inline XBRL Taxonomy Definition Linkbase Document101.LAB Inline XBRL Taxonomy Extension Label Linkbase Document
101.PRE Inline XBRL Taxonomy Extension Presentation Linkbase Document
104 Cover Page Interactive Data File (formatted as inline XBRL and contained in exhibit 101)
*Filed herewith
PHILLIPS EDISON & COMPANYSEPTEMBER 30, 2021 FORM 10-Q 45
SIGNATURES
Pursuant to the requirements of the Securities Exchange Act of 1934, the Registrant has duly caused this report to be signed on its behalf by the undersigned thereunto duly authorized.
PHILLIPS EDISON & COMPANY, INC.
Date: November 4, 2021 By: /s/ Jeffrey S. Edison Jeffrey S. Edison
Chairman of the Board and Chief Executive Officer (Principal Executive Officer)
Date: November 4, 2021 By: /s/ John P. Caulfield John P. Caulfield
Chief Financial Officer, Senior Vice President and Treasurer (Principal Financial Officer)
PHILLIPS EDISON & COMPANYSEPTEMBER 30, 2021 FORM 10-Q 46