Embed Size (px)
Citation preview
'Iliere is no fiigfier orIower k.nowfeage, Gut one on{y, flowing out of
experimentation - Leonardo da 'Vinci
ChapterS
Photoacoustic measurement of thermal
conductivity of liquid crystal mixtures
Abstract
Thermal characterization of liquid crystal mixtures of cholesterol and
1 hexadecanol with various relative fractions of constituents have
been carried out using laser induced photoacoustic technique. The
phase of liquid crystal mixtures are identified using Polarising
microscope as Smectic A. Thermal diffusivity measurements of liquid
crystal mixtures are done using open cell photoacoustic technique
whereas thermal effusivity IS measured using conventional
photoacoustic technique. From the measured values of thermal
diffusivity and thermal effusivity, the calculation of thermal
conductivity and thermal capacity has been made. Analysis of data
shows that hydrogen bonding has a significant effect on thermal
properties of liquid crystal mixtures.
145
Chapter 5. Photoacoustic measurement ..
5.1. Introduction
The term liquid crystal signifies a state of aggregation that is intermediate
between the crystalline solid and the amorphous liquid. As a rule, a substance in this
mesophase or liquid crystalline state is strongly anisotropic in some of its properties
and yet exhibits a certain degree of fluidity. Differences in orientational and spatial
ordering of the, molecules define the mesophases. Depending on the detailed
molecular structure, the system can pass through one of more mesophases before the
transformation to completely isotropic liquid. Transitions to these intermediate states
may be brought about by purely thermal processes (thermotropic mesomorphism) or
by the influence of solvents (lyotropic mesomorphism). The thermotropic liquid
crystal composed of rod like molecules can be broadly classified into three groups;
nematic, cholestric and smectic. The nematic liquid crystal has a high degree of long
range orientational order of molecules, but no long-range transnational order. The
cholestric mesophase is also a nematic type of liquid crystal except that it is
composed of optically active molecules. Smectic liquid crystals have stratified
structures but a variety of molecular arrangements are possible within each
stratification. Thermotropic liquid crystal can be further classified into two groups:
enantiotropic or monotropic. The former type can be changed into liquid crystal state
by lowering the temperature of the liquid or by raising the temperature of a solid.
However, the monotropic liquid crystals can only be changed into a liquid crystal
state by either an increase in temperature of a solid or by a decrease in temperature of
a liquid, but not both. Thermotropic liquid crystals are usually made of discotic shape
or rod shaped molecules. Discotics are flat disc-like molecules consisting of a core of
adjacent aromatic rings. This allows for two-dimensional columnar ordering of liquid
crystal. Rod-shaped molecules have an elongated and anisotropic geometry, which
allows for preferential alignment along any spatial direction. Structurally, most of the
rod shaped molecules fall into two categories, the columnar and the nematic.
Polymer liquid crystals have a basic monomer unit mass of low molar mass mesogens
147
Laser induced photothermal studies .•........•.......
having rod-like or disc like shapes, which are attached to the polymer backbone in the
main chain itself, or as a side groups [1-2].
Lyotropic mesophases occur as a result of solvent induced aggregation of the
constituents into micellar structures. Lyotropic mesogens are typically amphiphilic,
which means that they are composed of both lyophilic (solvent-attracting) and
lyophobic (solvent-repelling) parts. This causes them to form into micellar structures
in the presence of a solvent, since the lyophobic ends will stay together as the
lyophilic ends extend outwards towards the solution. As the concentration of the
solution is increased and the solution is cooled, the micelles increase in size and
eventually coalesce. This separates the newly formed liquid crystalline state from the
solvent. In the lamellar or neat phase of the lyotropic liquid crystals, water is
sandwiched between the polar heads of adjacent layers, while the hydrocarbon tails,
which are disordered or in a liquid like configuration are in a non-polar environment
[2].
Thermal measurements play an important role in locating and characterizing
the different phases and phase transitions in liquid crystals. Differential scanning
calorimetry (DSC) is extensively used to locate transition temperatures and to
determine the important thermal properties of the specimen [3]. High resolution
calorimetric measurements, in particular near phase transitions, are usually carried out
by adiabatic scanning calorimetry or a.c. calorimetric techniques [4-6]. These
methods give information only on the static quantities such as enthalpy, heat capacity
etc [7-9]. A more complete characterisation of these specimens, however, also
requires determination of the thermal transport properties such as thermal diffusivity,
thermal effusivity and thermal conductivity. Conventional steady state gradient and
transient techniques have mainly been used to determine the thermal conductivity
which rather demands larger size specimens [6-8]. Some high-resolution a.c.
techniques [10], such as forced Rayleigh light scattering, have been used in a number
of cases to measure the thermal diffusivity and thermal conductivity [11-15].
However, since 19705, the multitude ways of generating photothermal effects using
148
Chapter5. Photoacoustic measurement .
all kinds of radiation, from laser to particle beams and the diversity in detection
schemes of the thermal or acoustical waves have revolutionalised the field of
nondestructive characterisation of liquid crystals. Photoacoustic (PA) and related
photothermal methods are the well established technique for the characterisation of
liquid crystals, especially for the evaluation of dynamic thermal parameters as well as
for the phase transition studies because the temperature rise during these experiments
is only - mK so that photothermal experiments do not result any phase transitions in
the liquid crystals. These thermal methods are particularly useful in studying the
polymer and polymer containing samples. Modern polymeric materials are usually
blends or composites with complex morphologies that are crucial in determining their
material properties [16-22].
Although thermal diffusivity and thermal conductivity are extensively
investigated using various techniques, thermal effusivity is one of the important and
unique thermophysical parameter which is least explored in applied physics [22].
Thermal effusivity is a rather abstract physical quantity that characterizes the material
from the standpoint of its heat storage capacity. The thermal effusivity, e., defined
by (kpC)h, has the dimensions of Ws hcm-2K-', where k is the thermal
conductivity, p is the density and C is the specific heat capacity. Though the
thermal effusivity is a relevant thermophysical parameter for surface heating or
cooling processes, as well as for quenching processes, a direct measurement of this
quantity using conventional heat flow methods is not easy. The thermal effusivity
measures essentially the thermal impedance of the sample, or effectively, the
sample's ability to exchange heat with the environment. Hence, its value is very
significant in the case of liquids and in liquid crystals, especially when these are used
as temperature sensors or in temperature sensing devices.
As the mixtures of liquid crystals are extremely important since they provide
thermophysical parameters that are not available in nature. Such a tunability in the
thermophysical parameters of the mixtures has wide applicability, especially from
149
Laser induced photothermal studies .
industrial point of view. In this context, a nondestructive evaluation of thermal
diffusivity and thermal effusivity of liquid crystal mixture manufactured from
cholesterol and 1 hexadecanol with various relative mass fractions has great physical
significance and practical applications. Measurement of these two dynamic
thermophysical parameters allows the evaluation of thermal conductivity and specific
heat capacity of the samples under investigation.
5.2. Sample Preparation
The two substances (Cholesterol and 1 hexadecanol) comprising the mixture
were carefully weighed in different mass proportion (70%:30%, 60%:40%, 50%:50%,
40%:60%). The mixture was then heated to a temperature well above the melting
point with continuous stirring to ensure thorough and complete mixing. The
homogeneous mixture was then quickly cooled and solidified by quenching in ice.
This process was repeated until constant melting and transition temperatures were
obtained.
Although cholesterol is non-mesomorphic, it must be considered to be
potentially mesomorphic since even cholesteryl chloride gives a monotropic
cholesteric phase, and it is possible that the hydrogen bonding in pure cholesterol
increases the intermolecular cohesion and is responsible for its high melting point.
The presence of hexadecanol may present alternate sites to which the cholesterol
hydroxyl groups can hydrogen bond without resulting in a high melting crystal lattice,
yet giving sufficiently strong intermolecular attractions to make possible the existence
of an anisotropic melt.
The presence of a liquid crystalline phase is usuall~'§0asy to identify but
the identification of the phase type is often very difficult. Optical polarizing
microscopy is the most common method used to identify liquid crystal phases. A
smallsample of the liquid crystal is placed on a microscope slide with a cover slip..s->: .~~,...-- - - --
The slide is placed in a hot sta~~ of variable temperature which is placed under a
microscope between crossed polarizers. When viewed between cross polarizers an
150
Chapter 5. Photoacoustic measurement .
isotr~?~clwill appear black because the polarized light will be extinguished by
the second, crossed polarizer. Liquid crystals have certain ordering of their
constituent molecules and are birefringent. Accordingly, plane polarized light are
affected by the liquid crystal material, and does not, in all cases, get extinguished by
the second or crossed polarizer and this generates a colored texture pattern. It is easy
to identify some of the more simple, common liquid crystalline phases (Nematic,
Smectic A, Smectic C etc) eventhough some of the others are quiet difficult to
identify and a great deal of experience is required. If the sample with an unknown
liquid crystalline phase is mixed with a known and fully characterized liquid crystal
then the complete miscibility across the phase diagram indicates that two phases are
identical. Such miscibility studies are frequently employed in the identification of
liquid crystal phase. In the present case, an Olympus Polarizing microscope in
conjunction with a Linkam [TMS 94] heating stage is used for the microscopic
textural observations. The polarized thermal microscopic observations revealed that--_ .._-- -... '. .....
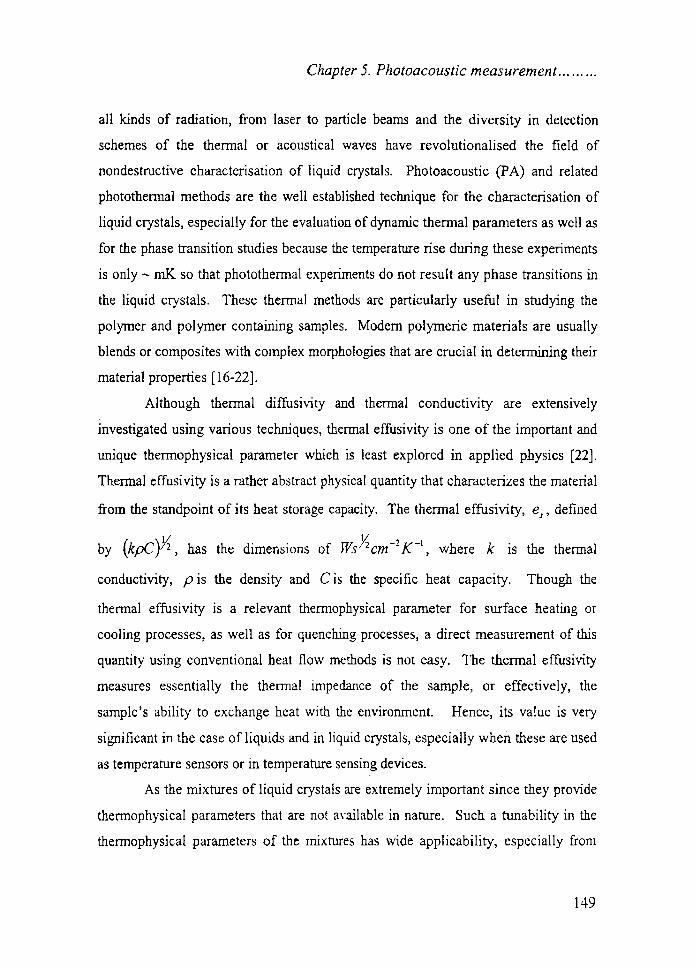
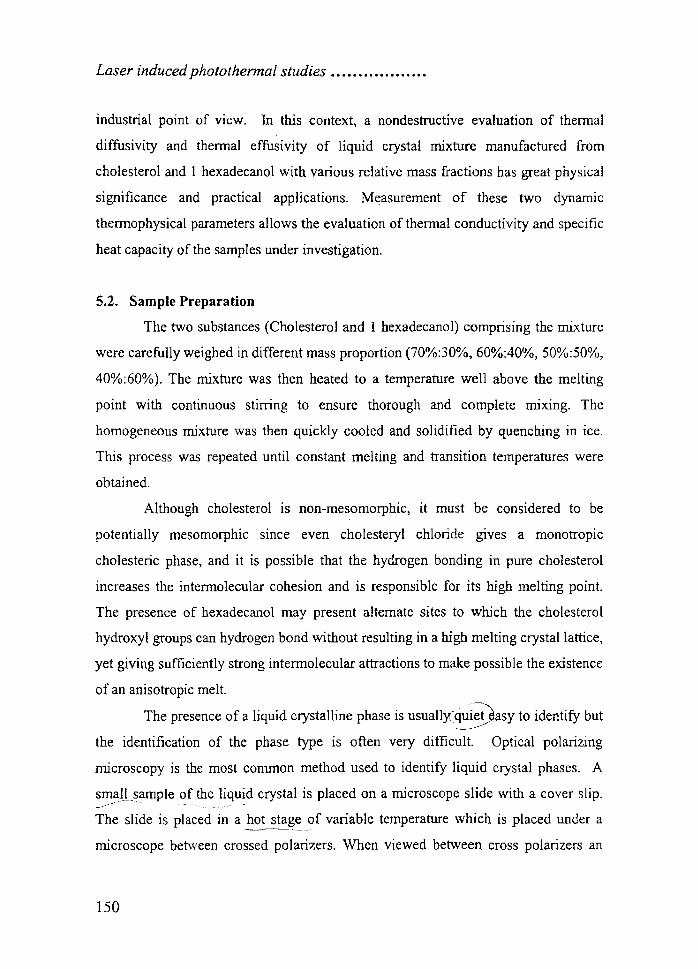
all the mixtures exhibit Smectic A (SmA) phase. In the present case, for the.>
convenience, mixtures containing 70% Cholestrol: 30% 1 Hexadeconal is called as
sample I whereas 60% Cholestrol: 40% l-Hexadecanol, 50% Cholesterol: 50%
Hexadecanol and 40% Cholestrol and 60% l-Hexadecanol are called samples 2, 3
and 4, respectively. Figure 1 to 4 shows the phase of mixtures under investigation.
Tbis method provides a simple and quick method for exploring the textures of liquid
crystal mixtures.
151
Laser induced photothermal studies .
Figure 1. Textural observation of sample containin g Cholesterol:
1 Hexadecanol (70:30)
Figure 2. Textural observation of sample containing Cholesterol:
1 Hexadecanol (60:40)
152
Chapter 5. Photoacousticmeasurement .
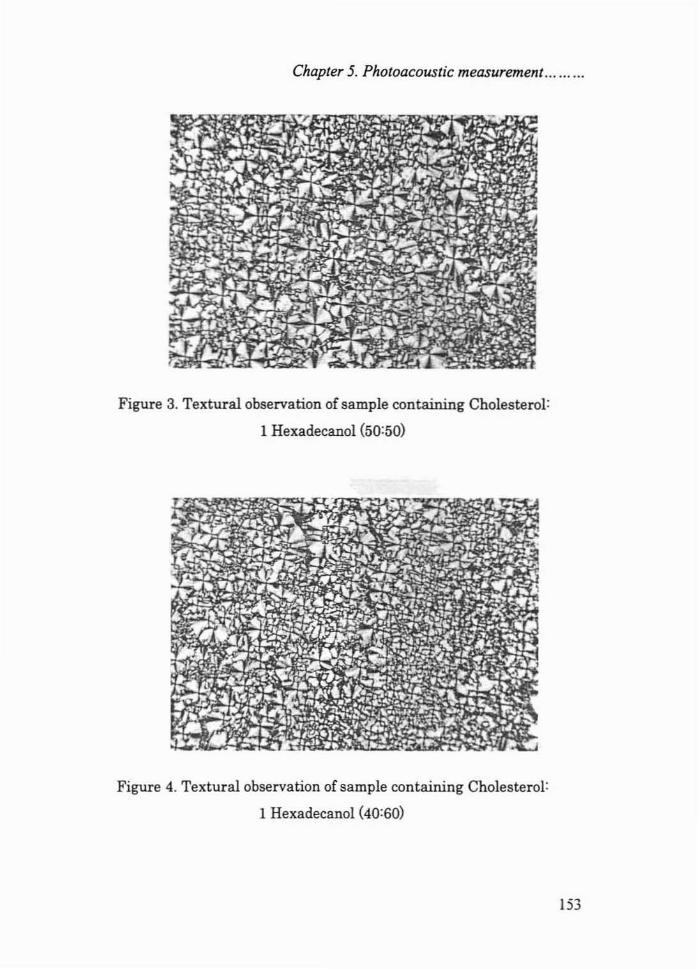
Figure 3. Textural observation of sample containing Cholesterol:
1 Hexadecanol (50:50)
Figure 4. Textural observation of sample containing Cholesterol:
1 Hexadecanol (40:60)
153
Laser induced photothermal studies .
5.3 Thermal diffusivity measurements
The necessary theoretical background for the evaluation of the thermal
diffusivity of the specimen under heat transmission configuration by taking into
account the effect of thennoelastic bending due to temperature gradient existing
within the specimen is given in the latter part of the previous chapter. The same
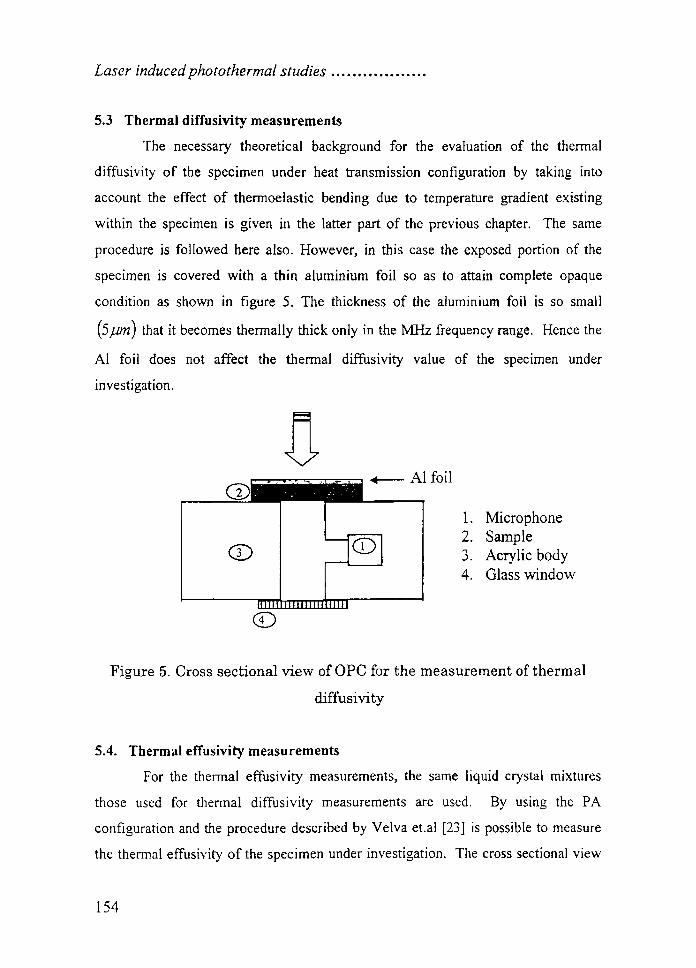
procedure is followed here also. However, in this case the exposed portion of the
specimen is covered with a thin aluminium foil so as to attain complete opaque
condition as shown in figure 5. The thickness of the aluminium foil is so small
(5j.lIr2) that it becomes thennaIly thick only in the MHz frequency range. Hence the
Al foil does not affect the thermal diffusivity value of the specimen under
investigation.
CD
1. Microphone2. Sample3. Acrylic body4. Glass window
Figure 5. Cross sectional view of ope for the measurement of thermal
diffusivity
5.4. Thermal effusivity measurements
For the thermal effusivity measurements, the same liquid crystal mixtures
those used for thermal diffusivity measurements are used. By using the PA
configuration and the procedure described by Velva et.al [23] is possible to measure
the thermal effusivity of the specimen under investigation. The cross sectional view
154
Chapter 5. Photoacoustic measurement .
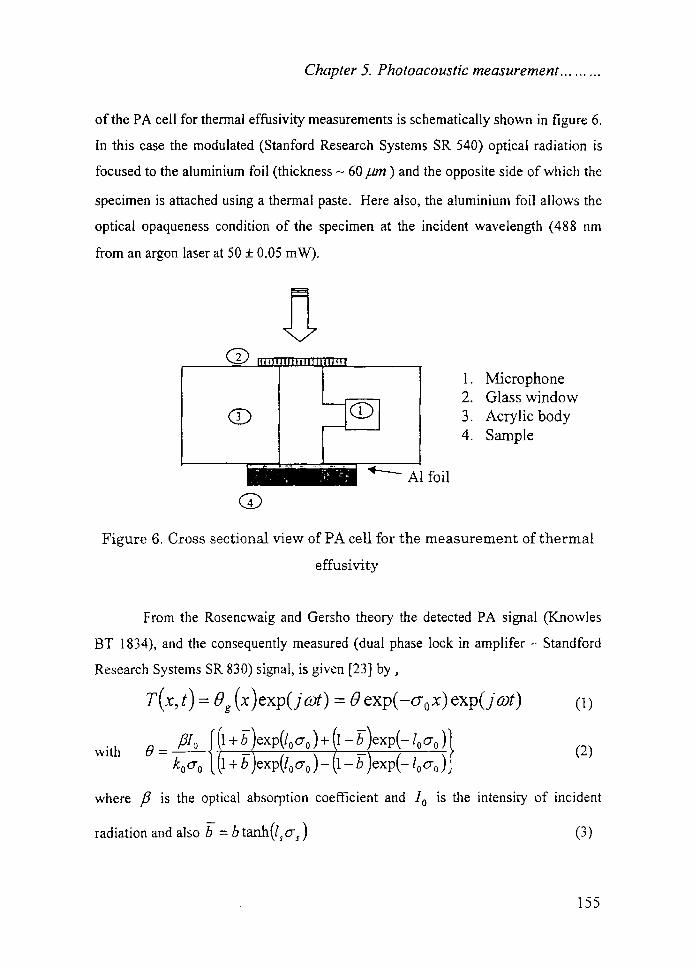
of the PA cell for thermal effusivity measurements is schematically shown in figure 6.
In this case the modulated (Stanford Research Systems SR 540) optical radiation is
focused to the aluminium foil (thickness ~ 60 um ) and the opposite side of which the
specimen is attached using a thermal paste. Here also, the aluminium foil allows the
optical opaqueness condition of the specimen at the incident wavelength (488 nm
from an argon laser at 50 ± 0.05 mW).
CD
~ Al foil
I. Microphone2. Glass window3. Acrylic body4. Sample
Figure 6. Cross sectional view of PA cell for the measurement of thermal
effusivity
From the Rosencwaig and Gersho theory the detected PA signal (Knowles
BT 1834), and the consequently measured (dual phase lock in amplifer - Standford
Research Systems SR 830) signal, is given [23] by,
with
r(x,t)= Bg(x)exp(j@[) =Bexp(-crox)exp(jaJt)
()= fJlo {(I+~ exp(loao)+(I-~)eXP(-loao)}ko(jo I+b exp(lo(jo)-I-b exp(-lo(jo)
(1)
(2)
where fJ is the optical absorption coefficient and 10 is the intensity of incident
radiation and also b =btanh(ls(js) (3)
155
(4)
Laser induced photothermal studies .
with b =: ksO"s :::: ~kJPJcJ :::: £s
koO"o ~koPoco Co
Here O"j = (1+ /)a; is the complex thermal diffusion coefficient. Here the index i
denotes the sample (i:::: s), air (i:::: g) and the aluminium foil (i:::: 0) .
Q;:::: r!l and a.. kj , ».. cj and ej are the thermal diffusivity, conductivity, densityf~-;
, specific heat capacity and effusivity of the specimen 'i'.
In the modulation frequency ([) range forwhich the sample is thermally thick, the
equation (3) can be written as
(5)
For the case in which only the aluminium foil close to the PA cell, then the PA signal
is reduced to
e :::: fJloo kol00"~
From the ratio between equations (5) and (6), the equation becomes
(6)
(7)R=!...-:::: 1
eo 1+( hi )/100" 0
Then the thermal effusivity value of each sample is obtained by fitting the
experimentally obtained ratio of the signal as a function of chopping frequency to that
of equation (7)
5.5. Results and Discussions
The variation of PA phase spectrum under heat transmission configuration for
the samples under investigation is shown in figures 7 to 10. In all the cases, the
156
Chapter 5. Photoacoustic measurement .
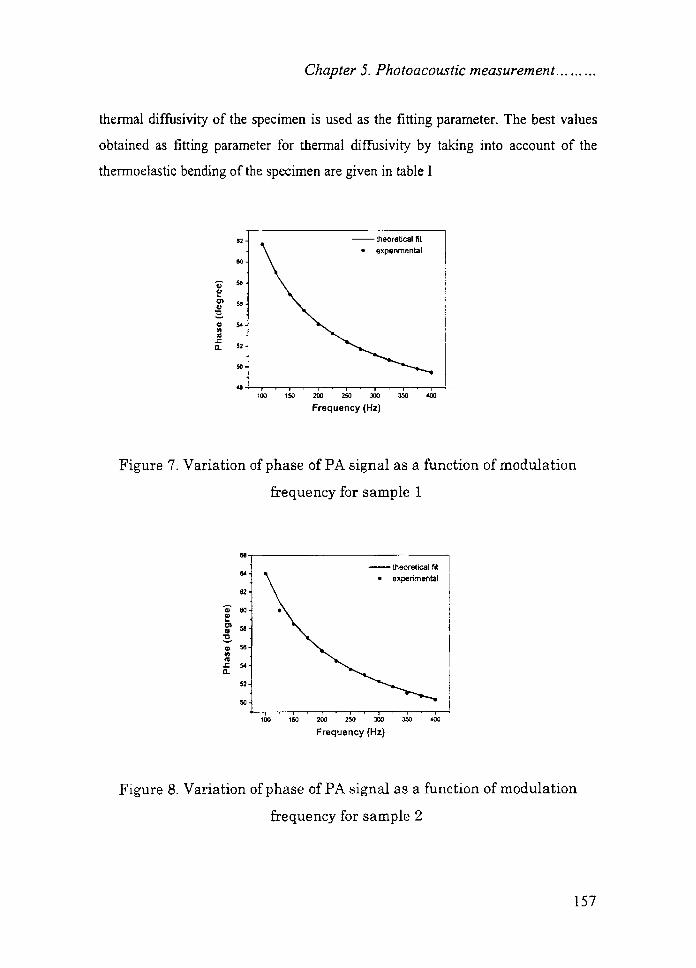
thermal diffusivity of the specimen is used as the fitting parameter. The best values
obtained as fitting parameter for thermal diffusivity by taking into account of the
thermoelastic bending of the specimen are given in table I
- theoretical ftt
• expenmental
'50 200 250 300 350 '00
Frequency (Hz)
52
tIO
'i' 51
etn so4>~Ql 501.,III
.::::a. 52
50
..100
Figure 7. Variation of phase ofPA signal as a function of modulation
frequency for sample 1
68.,----------------------,
62
52
50
-theoretical fit• experimental
100 150 200 250 300 .l5O 400
Frequency (Hz)
Figure 8. Variation of phase of PA signal as a function of modulation
frequency for sample 2
157
Laser induced photothermal studies ...•..............
ell
Illl -Iheoretlcal.. . experimental
~0:2
e <10
'"ell
~ 5.ellIf) ,."'s:Cl. 5<4
52
so
100 150 200 2SO 300 350 400
Frequency (Hz)
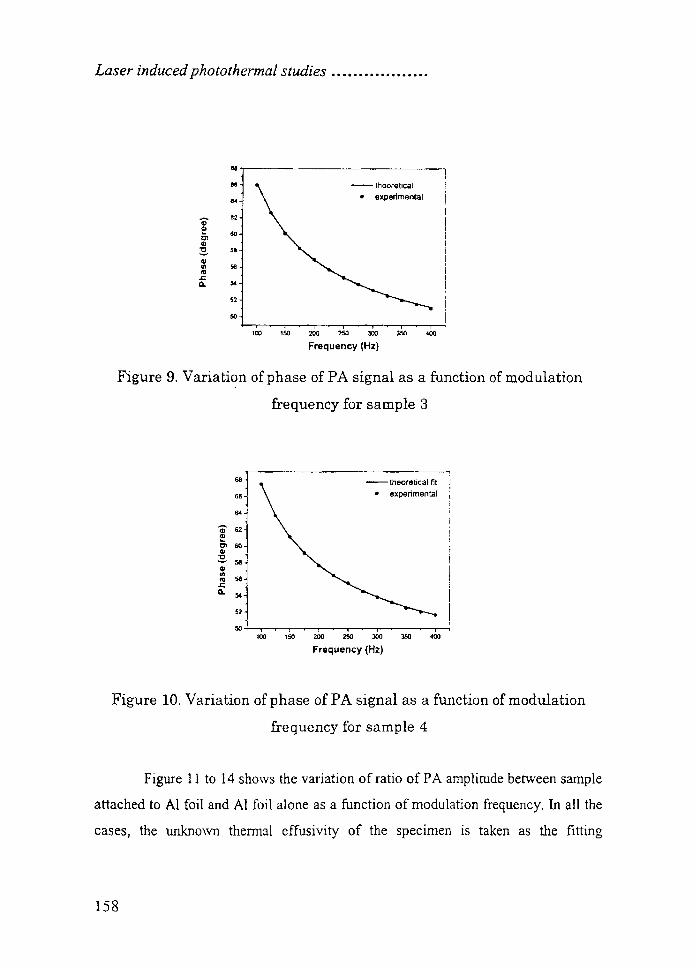
Figure 9. Variation of phase of PA signal as a function of modulation
frequency for sample 3
68
56
64
~ 62.,0. 50CIl"0- sa
'"If) satoJ':Cl. Sol
52
50100 150
-theoretical fit
• experimental
200 250 :lOO :l5Q 400
Frequency (Hz)
Figure 10. Variation of phase ofPA signal as a function of modulation
frequency for sample 4
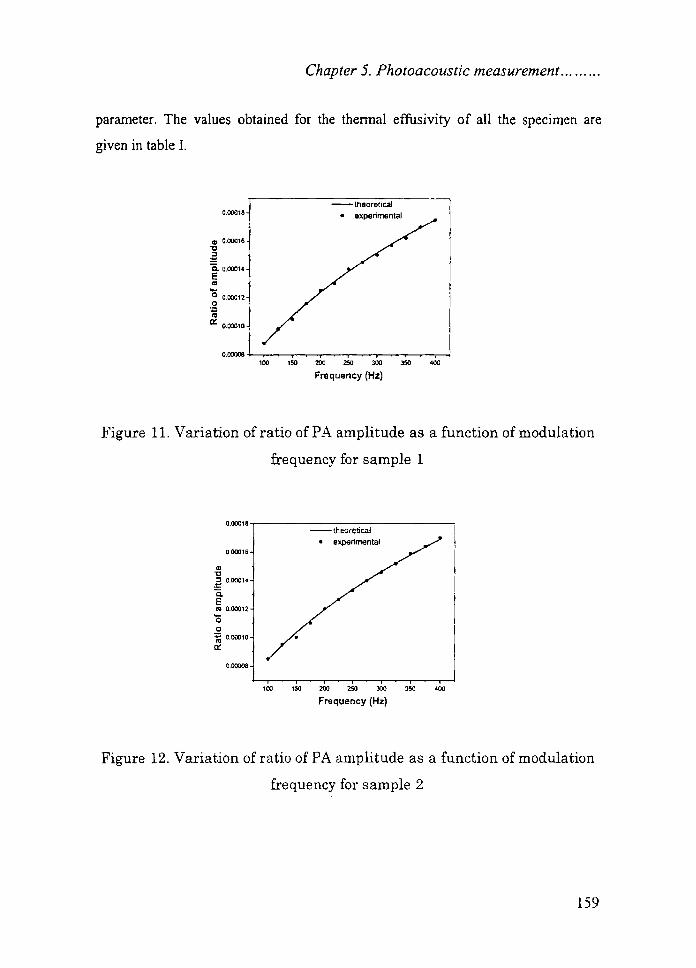
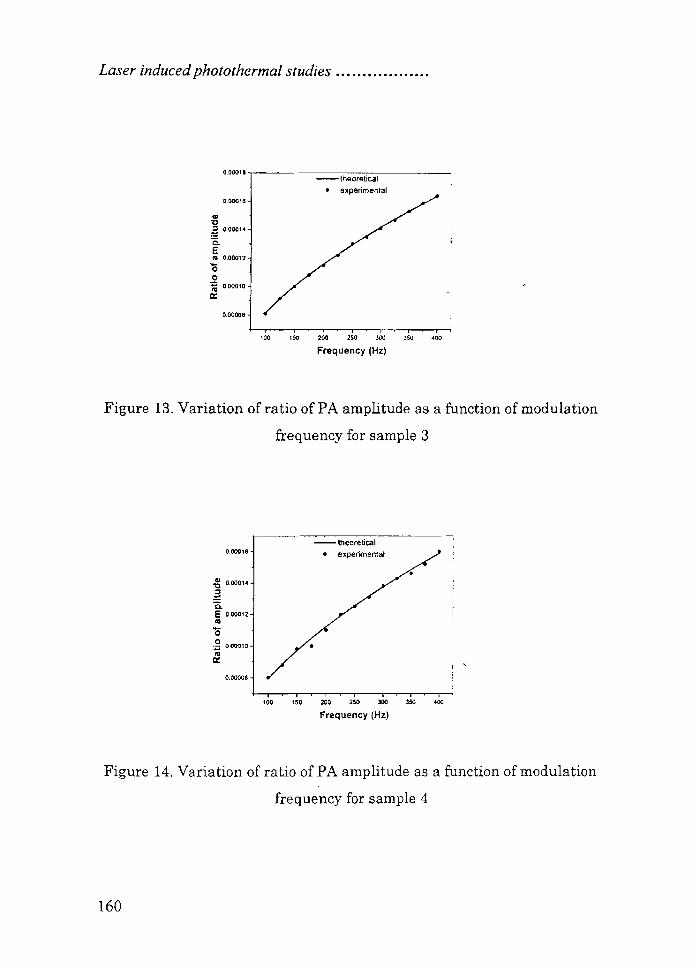
Figure 11 to 14 shows the variation of ratio of PA amplitude between sample
attached to Al foil and Al foil alone as a function of modulation frequency. In all the
cases, the unknown thermal effusivity of the specimen is taken as the fitting
158
Chapter 5. Photoacoustic measurement .
parameter. The values obtained for the thermal effusivity of all the specimen are
given in table 1.
0.00018
<11 0.00018'C:l
:!:lQ. 0,00014
E......o o.o(xm.2...0:: 0.00010
-lheoretlcal• experimental
100 150 200 250 300 350 400
Frequency (Hz)
Figure 11. Variation of ratio of PA amplitude as a function of modulation
frequency for sample 1
0.00018..,.---------------,-theoretical
• experimental0.00016
GO'CE 0.00014
Q.E'" 0.00012
'0o~ 0.00010
0::
0.00008
roe 150 200 2!o:J JOO 350 400
Frequency (Hz)
Figure 12. Variation of ratio of PA amplitude as a function of modulation
frequency for sample 2
159
Laser induced photothermal studies .
--lheorelical• experimental
0.000'5,----------:;-- ~-- _
D.00015
..'tl~ 000014
CoEn:I O.OOg1Z
'0o:; 0.00010
a:
0.00008
'00 lSO 200 250 300 JSO 400
Frequency (H:l)
Figure 13. Variation of ratio ofPA amplitude as a function of modulation
frequency for sample 3
O,CIOOlI!l
~ 000014
~CoE 000011..'0.g 000010..a:
0.00005
y-----------,----------lheorelical
• expenmental
100 150 200 250 300 3SO <10(]
Frequency (Hz]
Figure 14. Variation of ratio of PA amplitude as a function of modulation
frequency for sample 4
160
Chapter 5. Photoacoustic measurement .
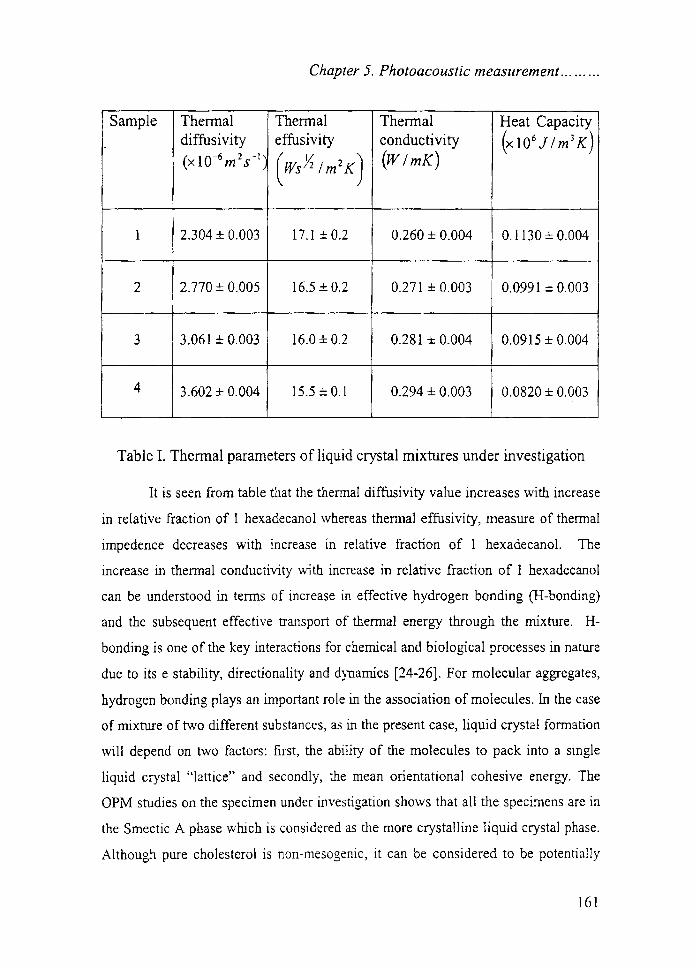
Sample Thermal Thermal Thermal Heat Capacitydiffusivity effusivity conductivity (xI0 6J/m 3K)(10-6 '-1
(ws~ /m 2K) (w /mK)x m:s
1 2.304 ± 0.003 17.I±0.2 0.260 ± 0.004 0.1130 ± 0.004
2 2.770 ± 0.005 16.5 ± 0.2 0.271 ± 0.003 0.0991 ± 0.003
3 3.061 ± 0.003 16.0 ± 0.2 0.281 ± 0.004 0.0915 ± 0.004
4 3.602 ± 0.004 IS.S±O.1 0.294 ± 0.003 0.0820 ± 0.003
Table 1. Thermal parameters of liquid crystal mixtures under investigation
It is seen from table that the thermal diffusivity value increases with increase
in relative fraction of 1 hexadecanol whereas thennaI effusivity, measure of thermal
impedence decreases with increase in relative fraction of 1 hexadecanol. The
increase in thermal conductivity with increase in relative fraction of 1 hexadecanol
can be understood in terms of increase in effective hydrogen bonding (H-bonding)
and the subsequent effective transport of thermal energy through the mixture. H
bonding is one of the key interactions for chemical and biological processes in nature
due to its e stability, directionality and dynamics [24-26]. For molecular aggregates,
hydrogen bonding plays an important role in the association of molecules. In the case
of mixture of two different substances, as in the present case, liquid crystal formation
will depend on two factors: first, the ability of the molecules to pack into a single
liquid crystal "lattice" and secondly, the mean orientational cohesive energy. The
OPM studies on the specimen under investigation shows that all the specimens are in
the Smectic A phase which is considered as the more crystalline liquid crystal phase.
Although pure cholesterol is non-rnesogenic, it can be considered to be potentially
161
Laser induced photothermal studies .
mesomorphic because even cholesteryl chloride gives monotropic cholesteric
mesophase. An increase in intermolecular cohesion is possible through hydrogen
bonding in the case of pure cholesterol which in turn causes the high melting point of
cholesterol. Introduction of hexadecanol molecules may present alternate sites to
which cholesterol hydroxyl group can hydrogen bond without resulting in the high
melting point of the crystal lattice, yet giving sufficiently strong intermolecular
attractions to make possible the existence of an anisotropic melt. The increase in
relative volume fraction of the 1 hexadecanol increases the number sites available for
the H- bonding and consequently more intermolecular attraction. With the increase in
intermolecular attraction and consequent cohesive structure, the' liquid crystal mixture
provides easier path for heat transport and result in an increased value for thermal
conductivity with increase in relative fraction of 1 hexadecanol. The unification of
components of the mixture through H-bonding causes the reduction in heterogeneity
of the liquid crystal mixture. As the heterogeneity of the specimen decreases, the
factors which causes in the reduction in thermal parameters of the heterogeneous
materials, namely interface thermal resistance and lattice expansion mismatch also
decreases [27]. This may also cause the increased value for thermal conductivity with
the increase in relative fraction of 1 hexadecanol.
5.6. Conclusion
In conclusion, in this chapter, investigations on the dependence of effective
thermal parameters on the volume fraction of constituents in a liquid crystal mixture
consisting of cholesterol and I hexadecanol have been presented. It is seen that
thermal conductivity (thermal diffusivity) of the specimen increases with increase in
volume fraction of I hexadecanol whereas thermal diffusivity decreases. Analysis of
results shows that H-bonding play a key role in determining the effective thermal
parameters of a liquid crystal mixture. The present study also suggests that tunability
in effective thermal parameters is possible by varying the volume fraction of the
constituents.
162
Chapter 5. Photoacoustic measurement .
5. 7 1?Jferences1. S. Chandrasekhar "Liquid Crystals" Cambridge University Press, New York
(1992)2. Satyen Kumar (Edit), "Liquid Crystals 1 the Nineties and Beyond" World
.Scientific, Singapore (1995)3. Jan Thoen (Chapter 6) in Physical Properties of Liquid Crystals, Wiley
VCH, Singapore (1999)4. C. W Garland in Geometry and Thennodyanmics (Ed, J. C. Toledano)
NATO ASl Ser.B 229m, 221 Plennum New York (1990)5. M. A. Anisimov Critical Phenomena in Liquids and Liquid Crystals,
Gordon and Breach, Philadelphia (1990)6. J. Thoen in Phase Transitions in Liquid Crystals (Eds: S. Martellucci and A.
N. Chester) NATO ASI Ser.B 229m, 290, Plennum New York (1992)7. C. W Garland in Phase Transitions in Liquid Crystals Eds: S. Martellucci
and A. N. Chester) NATO ASI Ser.B 229m, 290, Plennum New York(1992)
8. J. Thoen, Int. J. Mod. Phys. B, 9,2157 (1995)9. C. W. Garland in Liquid Cystals: Physical Properties and Phase Transitions
(Eds: S. Kumar), Oxford University Press (1997)10. T. Akbabane, M. Kondok, K. Hashimoto and N. Nagakawa, Jpn. J. APp\.
Phys,26,LIOO,(1987)11. M. Marinelli, U. Zammit, F. Mercuri and R. Pizzaferrato, J. Appl. Phys, 72,
1096 (1992)12. C. Glorieux, E. Schoubs, ang 1. Thoen, Mater. Sci. Eng., A122, 87 (1989).13. J. Thoen, C. Glorieux, E. Schoubs and W. Lauriks, Mol. Cryst, Liq. Cryst.,
191,29 (1990).14. U. Zammit, M. Marinelli, R. Pizzoferrato, F. Scudieri and S. Martellucci,
Phys. Rev. A, 41, 1153 (1990).15. J. Thoen, E. Schoubs, V. Fagard in O. Leroy and M.A. Breazeale (Eds.),
Physical Acoustics: Fundamentals and Applications, (Plenum Press, NewYork), 1992.
16. M. Marinelli, U. Zarnmit, F. Scudieri and S. Martellucci, High Temperature- High Pressures, 18, 1 (1986).
17. F. Scudieri, M. Marinelli, U. Zammit and S. Martellucci, 1. Phys. D: Appl.Phys., 20, 1045 (1987).
18. G. Pucceti and R. M. Leblanc, J. Chem. Phys., 108 (17), 7258 (1998).19. J. Thoen, Intl. 1. Mod. Phys. B, 9 (18 & 19), 2157 (1995).20. N.A. George, C.P.G. Vallabhan, V.P.N. Nampoori, A.K.George and P.
Radhakrishnan, Appl. Phys. B 73, 145 (2001).21. N.A. George, Smart Mater. Struct. 11, 561 (2002).22. N.A. George, C.P.G. Vallabhan, V.P.N. Nampoori, A.K.George and P.
Radhakrishnan, Opt. Eng., 40(7) 1343, (2001).23. L. Veleva, S. A. Tomas, E. Marin, A. Cruz-Orea, I. Delgadillo, J. J.
Alvarado Gil, P. Quintana, R. Pornes, F. Sanchez, H. Vargas and L. C. M.Miranda, Corrosion Science, 39 (9),1641 (1997)
24. Yoon-SokKang and Wang-Cheol Zin, Liquid Crystals, 29,3,369 (2002)
163
Laser induced photothermal studies .
25. 1. Borg, M. H. Jansen, K. Sneepman and G. Tiana, Phys. Rev. Lett. 86,1031(2001)
26. S. I Torgova and A. Strigazzi, Mol. Crys.Liq. Cryst., 336, 229(1999)27. P.1. Mendoza, A. Mandelis, L. Nicolaides, J. Huerta, and M. E. Rodriguez,
Anal.Sci., 17, s 269 (2001)
164