Embed Size (px)
Citation preview
Statistical Office of the Republic of Serbia
Pilot Survey on the Structure of Earnings for 2014
Belgrade, 2017www.stat.gov.rs
Pi
lot S
urve
y on the Structure of Earnings for 2014

REPUBLIC OF SERBIA STATISTICAL OFFICE OF THE REPUBLIC OF SERBIA
PILOT SURVEY ON THE STRUCTURE OF EARNINGS FOR 2014
Belgrade, 2017

2
Pilot Survey on the Structure of Earnings for 2014
Pilot Survey on the Structure of Earnings for 2014
Publisher: Statistical Office of the Republic of Serbia, Belgrade, 5 Milana Rakića For the Publisher: Dr Miladin Kovačević, Director
Manuscript prepared by
Chapter One: Vesna Pantelić, Jelena Milaković, Jovana Đerić, Snežana Svetozarević Chapter Two: Jelena Milaković, Bojana Šoškić, Jovana Đerić, Snežana Svetozarević,
Olga Melovski Trpinac, Melinda Tokai Chapter Three: Bojana Šoškić, Jovana Đerić, Snežana Svetozarević, Melinda Tokai
Sample selection and estimation of survey parameters: Olga Melovski Trpinac, Melinda Tokai
Preparation of web application and program for data entry and control: Ljiljana Gavrić, Svetlana Mandić
Data processing and tabulation: Bojana Šoškić, Jovana Đerić, Snežana Svetozarević
Data analysis: Vesna Pantelić, Jelena Milaković, Jovana Đerić, Snežana Svetozarević, Bojana Šoškić
Editorial Staff
Editor in chief: Dušan Gavrilović
Members: Jelena Zdravković, Katarina Stančić and Mirjana Popović
Translated by: Milena Kovačević
Cover design: Said Dalip and Aleksandra Vučković
Tehnical editors: Suzana Jovanović and Aleksandra Vučković
© When using the data from this publication, it is obligatory to quote the source.

Statistical Office of the Republic of Serbia 3
Preface
Statistical Office of the Republic of Serbia publishes results of the Pilot Survey on the Structure of Earnings, which was first conducted in the Republic of Serbia for 2014.
The Structure of Earnings Survey (SES) is conducted on the basis of the Law on Official Statistics („Official Gazette of RS", No. 104/09). The methodological framework for the implementation of this survey consists of Council Regulation (EC) No 530/1999 concerning structural statistics on earnings and on labour costs, and Commission Regulation (EC) No 1738/2005 amending Regulation (EC) No 1916/2000 as regards the definition and transmission of information on the structure of earnings. Since 2002, the Structure of Earnings Survey in EU Member States is conducted 4-yearly in accordance with the common uniform methodological principles.
This pilot survey was conducted within the framework of IPA 2012 Multi-beneficiary Statistical Cooperation Programme, with the aim of harmonizing the official labour market statistics with EU regulations and to ensure international comparability of data.
In preparatory stages of the pilot project detailed analyses on the possibility of using data from administrative sources (Tax Administration, Central Registry of Compulsory Social Insurance and Statistical Business Register) were performed, after which it was determined that at the time of the survey it was not possible to provide all necessary information from the mentioned sources. Thus, the survey was conducted on a sample. Efforts are being made so that the data from administrative sources are used for conducting survey in the years to come.
The importance of this survey is that it provides detailed and comparable data on annual, monthly and hourly earnings according to the individual characteristics of employees and enterprises in which they work. Calculation of gender pay gap, as one of indicators of sustainable development, was based on the survey’s data.
The data from this survey are intended for a wide range of users both in the country and abroad. The information can also be found on the Eurostat website.
The publication consists of three parts. The first part presents basic survey results in the form of graphs, with accompanying text commentaries. The second part contains the methodological explanation which present the objective of the survey, the characteristics of the sample and definitions of variables. The third part contains tabular presentation of data on the average annual earnings, average monthly earnings, average hourly earnings and gender pay gap. In accordance with Article 105 of the Labour Law, earnings are defined in gross amount.
The survey was not conducted on the territory of Kosovo and Metohija.
Belgrade, 2017 Director
Dr Miladin Kovačević

4
Pilot Survey on the Structure of Earnings for 2014

Statistical Office of the Republic of Serbia 5
Contents
Preface ................................................................................................................................................................. 3
1. Basic results ..................................................................................................................................................... 9
1.1. General overview ...................................................................................................................................... 11
1.2. The average annual earnings by characteristics of enterprises .............................................. ................. 13
1.2.1. Earnings by sections of activities ....................................................................................................... 13
1.2.2. Earnings by type of ownership ........................................................................................................... 15
1.2.3. Earnings by size of the enterprise...................................................................................................... 16
1.3. Average annual earnings by characteristics of employees ....................................................................... 17
1.3.1. Earnings by occupational groups ....................................................................................................... 17
1.3.2. Earnings by level of education ........................................................................................................... 19
1.3.3. Earnings by age groups ..................................................................................................................... 20
1.3.4. Earnings by length of service in the enterprise .................................................................................. 21
1.3.5. Earnings by type of employment contract .......................................................................................... 22
1.4. Distribution of earnings .............................................................................................................................. 24
1.5. Other indicators ......................................................................................................................................... 25
1.5.1. Bonuses ............................................................................................................................................. 25
1.5.2. Number of annual days of holiday leave ............................................................................................ 25
1.5.3. Number of paid hours of work ............................................................................................................ 26
1.6. Gender pay gap ......................................................................................................................................... 26
1.7. International comparison ........................................................................................................................... 31
1.8. Structure of employees ............................................................................................................................. 33
2. Methodological explanations ............................................................................................................................ 37
2.1. The objective of the survey ....................................................................................................................... 39
2.2. Reporting units, statistical units ................................................................................................................. 39
2.3. Characteristics of the sample .................................................................................................................... 39
2.3.1. Accuracy of the data .......................................................................................................................... 41
2.4. Survey coverage ....................................................................................................................................... 45
2.5. Method, period and sources for data collection ........................................................................................ 45
2.6. Definitions of basic variables ..................................................................................................................... 45

6
Pilot Survey on the Structure of Earnings for 2014
2.7. Differences in comparison to data of RAD-1 survey ................................................................................. 47
2.8. Classifications used in the survey ............................................................................................................. 47
2.9. References ................................................................................................................................................ 47
3. Tabular presentation of data ............................................................................................................................ 49
3.1. Annual earnings for 2014 .......................................................................................................................... 51
3.1.1. Average annual earnings and average number of annual days of holiday leave by sections of
activities and gender, 2014 ................................................................................................................ 51
3.1.2. Average annual earnings and average number of annual days of holiday leave by type of
ownership and gender, 2014 ............................................................................................................. 52
3.1.3. Average annual earnings and average number of annual days of holiday leave by size of the
enterprise and gender, 2014 .............................................................................................................. 53
3.1.4. Average annual earnings and average number of annual days of holiday leave by occupational
groups and gender, 2014 ................................................................................................................... 53
3.1.5. Average annual earnings and average number of annual days of holiday leave by level of
education and gender, 2014 .............................................................................................................. 54
3.1.6. Average annual earnings and average number of annual days of holiday leave by
age groups and gender, 2014 ............................................................................................................ 55
3.1.7. Average annual earnings and average number of annual days of holiday leave by length
of service in the enterprise and gender, 2014 ................................................................................... 55
3.1.8. Average annual earnings and average number of annual days of holiday leave by
type of employment contract and gender, 2014 ................................................................................ 56
3.2. Monthly earnings for October 2014 ........................................................................................................... 57
3.2.1. Average monthly earnings by sections of activities and gender, October 2014 ................................ 57
3.2.2. Average monthly earnings by type of ownership and gender, October 2014 .................................... 58
3.2.3. Average monthly earnings by size of the enterprise and gender, October 2014 .............................. 59
3.2.4. Average monthly earnings by occupational groups and gender, October 2014 ................................ 59
3.2.5. Average monthly earnings by level of education and gender, October 2014 .................................... 60
3.2.6. Average monthly earnings by age groups and gender, October 2014 .............................................. 61
3.2.7. Average monthly earnings by length of service in the enterprise and gender, October 2014 .................... 62
3.2.8. Average monthly earnings by type of employment contract and gender, October 2014 ................... 62
3.3. Hourly earnings for October 2014 ............................................................................................................. 63
3.3.1. Average hourly earnings, average number of paid hours and low-wage earners as
a proportion of all employees by sections of activities and gender, October 2014 ........................... 63
3.3.2. Average hourly earnings, average number of paid hours and low-wage earners as
a proportion of all employees by type of ownership and gender, October 2014 ............................... 64
Statistical Office of the Republic of Serbia 7
3.3.3. Average hourly earnings, average number of paid hours and low-wage earners as
a proportion of all employees by size of the enterprise and gender, October 2014 .......................... 65
3.3.4. Average hourly earnings, average number of paid hours and low-wage earners as
a proportion of all employees by occupational groups and gender, October 2014 ........................... 65
3.3.5. Average hourly earnings, average number of paid hours and low-wage earners as
a proportion of all employees by level of education and gender, October 2014 ............................... 66
3.3.6. Average hourly earnings, average number of paid hours and low-wage earners as
a proportion of all employees by age groups and gender, October 2014 ......................................... 67
3.3.7. Average hourly earnings, average number of paid hours and low-wage earners as
a proportion of all employees by length of service in the enterprise and gender, October 2014 ...... 68
3.3.8. Average hourly earnings, average number of paid hours and low-wage earners as
a proportion of all employees by type of employment contract and gender, October 2014 .............. 68
3.4. Gender pay gap, October 2014 ................................................................................................................. 69
Glossary of statistical terminology ........................................................................................................................ 70
8
Pilot Survey on the Structure of Earnings for 2014
Explanation of symbols
- = no entry
* = symbol for a note in the table/graph
0 = value is less than 0.5 of the unit of measure
( ) = a less precise estimate - use with caution
/ = an imprecise estimate - not published
Statistical Office of the Republic of Serbia 9
1. Basic results

10
Pilot Survey on the Structure of Earnings for 2014
Statistical Office of the Republic of Serbia 11
1.1. General overview
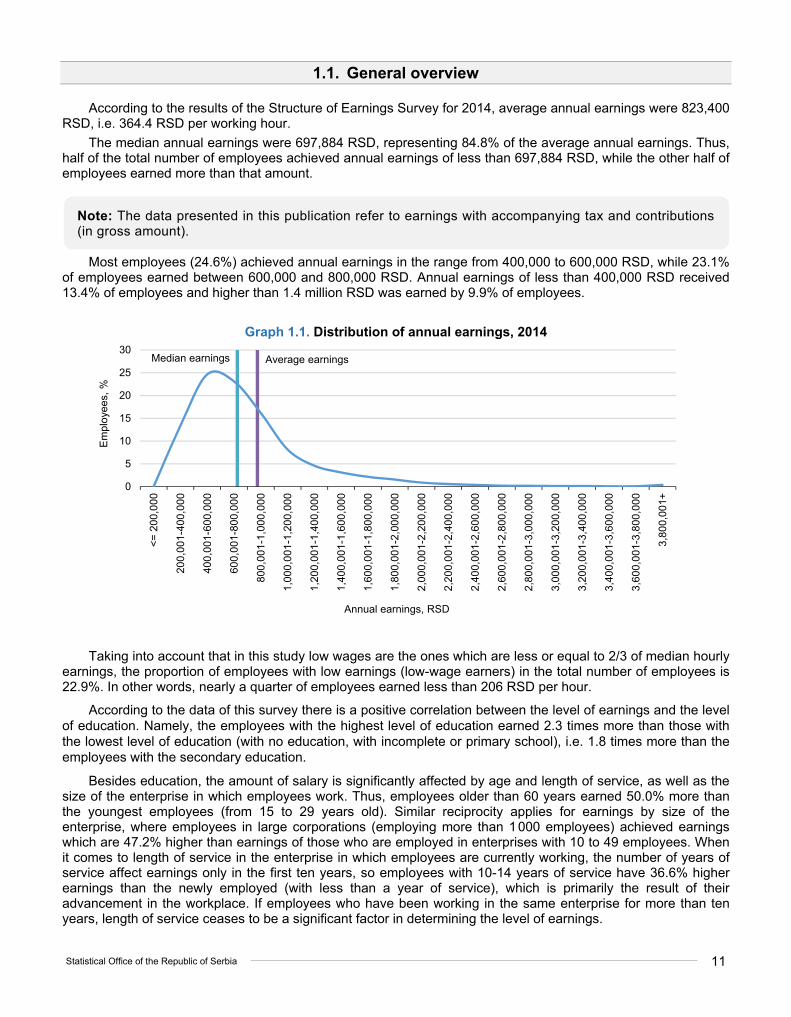
According to the results of the Structure of Earnings Survey for 2014, average annual earnings were 823,400 RSD, i.e. 364.4 RSD per working hour.
The median annual earnings were 697,884 RSD, representing 84.8% of the average annual earnings. Thus, half of the total number of employees achieved annual earnings of less than 697,884 RSD, while the other half of employees earned more than that amount.
Note: The data presented in this publication refer to earnings with accompanying tax and contributions (in gross amount).
Most employees (24.6%) achieved annual earnings in the range from 400,000 to 600,000 RSD, while 23.1% of employees earned between 600,000 and 800,000 RSD. Annual earnings of less than 400,000 RSD received 13.4% of employees and higher than 1.4 million RSD was earned by 9.9% of employees.
Graph 1.1. Distribution of annual earnings, 2014
Taking into account that in this study low wages are the ones which are less or equal to 2/3 of median hourly earnings, the proportion of employees with low earnings (low-wage earners) in the total number of employees is 22.9%. In other words, nearly a quarter of employees earned less than 206 RSD per hour.
According to the data of this survey there is a positive correlation between the level of earnings and the level of education. Namely, the employees with the highest level of education earned 2.3 times more than those with the lowest level of education (with no education, with incomplete or primary school), i.e. 1.8 times more than the employees with the secondary education.
Besides education, the amount of salary is significantly affected by age and length of service, as well as the size of the enterprise in which employees work. Thus, employees older than 60 years earned 50.0% more than the youngest employees (from 15 to 29 years old). Similar reciprocity applies for earnings by size of the enterprise, where employees in large corporations (employing more than 1 000 employees) achieved earnings which are 47.2% higher than earnings of those who are employed in enterprises with 10 to 49 employees. When it comes to length of service in the enterprise in which employees are currently working, the number of years of service affect earnings only in the first ten years, so employees with 10-14 years of service have 36.6% higher earnings than the newly employed (with less than a year of service), which is primarily the result of their advancement in the workplace. If employees who have been working in the same enterprise for more than ten years, length of service ceases to be a significant factor in determining the level of earnings.
Average earningsMedian earnings
0
5
10
15
20
25
30
<=
200
,000
200
,001
-400
,000
400
,001
-600
,000
600
,001
-800
,000
800
,001
-1,0
00,0
00
1,00
0,00
1-1,
200
,000
1,20
0,00
1-1,
400
,000
1,40
0,00
1-1,
600
,000
1,60
0,00
1-1,
800
,000
1,80
0,00
1-2,
000
,000
2,00
0,00
1-2,
200
,000
2,20
0,00
1-2,
400
,000
2,40
0,00
1-2,
600
,000
2,60
0,00
1-2,
800
,000
2,80
0,00
1-3,
000
,000
3,00
0,00
1-3,
200
,000
3,20
0,00
1-3,
400
,000
3,40
0,00
1-3,
600
,000
3,60
0,00
1-3,
800
,000
3,80
0,00
1+
Em
ploy
ees,
%
Annual earnings, RSD

12
Pilot Survey on the Structure of Earnings for 2014
That employees with higher education earn more is also confirmed by the data on average earnings by different occupations. In addition to the highest expected earnings in the occupational group of Managers (by 79.9% higher than average) it is interesting that the employees in the occupational group of Professionals earned twice as much as the employees in service and sales occupations. The earnings of clerical support workers were most closely to the overall average.
The activity of the enterprise largely determines the level of earnings. The highest average annual earnings were in the section Financial and insurance activities (1,454,507 RSD), which is as much as 76.6% higher than the overall average, as well as in sections Electricity, gas, steam and air conditioning supply (1,356,675 RSD) and Professional, scientific and technical activities (1,309,598 RSD). Earnings in education were almost two times lower (45.2%) than earnings in the most paid activity (Financial and insurance activities).
The average earnings vary significantly depending on whether the person is employed for an indefinite or definite period of time or on the basis of temporary work contract. Persons with permanent employment contract received the highest average annual earnings, 846,071 RSD, which is 52.5% more than the earnings of persons with temporary work contract, and 27.6% more than the earnings of employees with fixed term contract.
Gender pay gap was 8.7%, which indicates that women were paid 8.7% less than men.
Bonuses (quarterly and annual) were paid to one fifth of the total number of employees. On average, bonuses amounted to 14,463 RSD, which is 1.8% of average annual earnings.
On average, employees were entitled to 26 days of annual holiday leave. The employees in private sector were entitled to 22 days, while the employees in public sector were entitled to 30 days of annual holiday leave.
The average number of paid hours for October 2014 was 185.
Average hourly earnings expressed in euros amounted to 3.1 euros, which was almost five times lower than the average of the EU Member States (28 countries). The only countries of the European Union in which hourly earnings were lower than in Serbia were Bulgaria and Romania.
Table 1.1. Basic results of the Pilot Survey on the Structure of Earnings for 2014
Total Men Women
Average annual earnings, RSD 823,400 863,618 778,282
Median annual earnings, RSD 697,884 715,651 680,175
Average bonuses, RSD 14,463 17,692 10,841
Average number of paid hours 185 186 184
Average hourly earnings, RSD 364.42 379.96 346.81
Median hourly earnings, RSD 309.03 312.96 305.18
Gender pay gap, % 8.7 - -
Low-wage earners as a proportion of all employees*, % 22.94 21.63 24.42
* Low-wage earners are persons who earn less or equal to 2/3 of the median hourly earnings.

Statistical Office of the Republic of Serbia 13
1.2. The average annual earnings by characteristics of enterprises
1.2.1. Earnings by sections of activities
The highest average annual earnings (hereinafter referred to as: average earnings) were recorded in the Financial and insurance activities (1,454,507 RSD), which is as much as 76.6% more than the overall average, while the lowest average earnings were in Accommodation and food service activities (594,160 RSD), which is 27.8% less than the overall average.
The median annual earnings (hereinafter referred to as: median earnings) amounted to 697,884 RSD, which is 15.2% lower than the average salary (823,400 RSD). The greatest difference between the median salary and average salary was recorded in the sections of economic activities Wholesale and retail trade; repair of motor vehicles and motorcycles (the median was 475,532 RSD) and Professional, scientific and technical activities (the median was 957,016 RSD), where the median was about 73% of the average, which means that in these sections median earnings were about 27% lower than the average salary. The smallest difference was noted in the mining and quarrying activities, where the median earnings were 1,203,817 RSD, which is only 0.8% less than the average salary. Median earnings were higher than the average earnings (by 1.5%) in educational activities only, and amounted to 809,328 RSD.
Graph 1.2. Average annual earnings and median annual earnings by sections of activities, 2014
0
200,000
400,000
600,000
800,000
1,000,000
1,200,000
1,400,000
1,600,000
To
tal
Min
ing
and
qua
rryi
ng
Man
ufa
ctur
ing
Ele
ctri
city
, ga
s, s
team
and
air
con
ditio
nin
g s
uppl
y
Wat
er s
upp
ly; s
ewe
rage
, was
tem
ana
gem
ent
and
rem
edia
tion
activ
itie
s
Con
stru
ctio
n
Who
lesa
le a
nd r
etai
l tra
de;
repa
ir of
mo
tor
vehi
cles
and
mot
orcy
cles
Tra
nspo
rtat
ion
and
stor
age
Acc
omm
odat
ion
and
food
ser
vice
activ
itie
s
Info
rmat
ion
and
com
mun
ica
tion
Fin
anci
al a
nd in
sura
nce
act
iviti
es
Rea
l est
ate
act
iviti
es
Pro
fess
iona
l, sc
ient
ific
and
tech
nica
lac
tiviti
es
Adm
inis
trat
ive
and
sup
port
ser
vice
activ
itie
s
Edu
catio
n
Hum
an h
ealth
and
soc
ial w
ork
act
iviti
es
Art
s, e
nte
rta
inm
ent
and
rec
reat
ion
Oth
er
serv
ice
act
iviti
es
RSD Average annual earnings
Median annual earnings
14
Pilot Survey on the Structure of Earnings for 2014
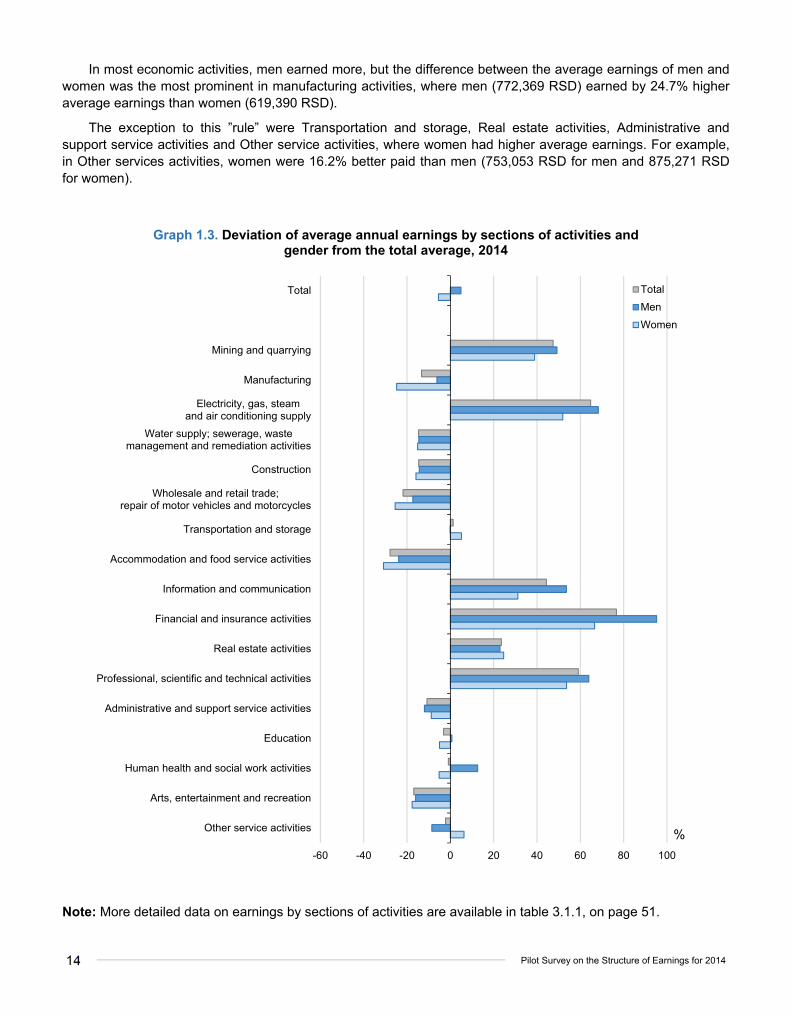
In most economic activities, men earned more, but the difference between the average earnings of men and women was the most prominent in manufacturing activities, where men (772,369 RSD) earned by 24.7% higher average earnings than women (619,390 RSD).
The exception to this ”rule” were Transportation and storage, Real estate activities, Administrative and support service activities and Other service activities, where women had higher average earnings. For example, in Other services activities, women were 16.2% better paid than men (753,053 RSD for men and 875,271 RSD for women).
Graph 1.3. Deviation of average annual earnings by sections of activities and gender from the total average, 2014
Note: More detailed data on earnings by sections of activities are available in table 3.1.1, on page 51.
-60 -40 -20 0 20 40 60 80 100
Total
Mining and quarrying
Manufacturing
Electricity, gas, steamand air conditioning supply
Water supply; sewerage, wastemanagement and remediation activities
Construction
Wholesale and retail trade;repair of motor vehicles and motorcycles
Transportation and storage
Accommodation and food service activities
Information and communication
Financial and insurance activities
Real estate activities
Professional, scientific and technical activities
Administrative and support service activities
Education
Human health and social work activities
Arts, entertainment and recreation
Other service activities%
Total
Men
Women

Statistical Office of the Republic of Serbia 15
1.2.2. Earnings by type of ownership
In this survey, the classification of enterprises in private and public ownership was performed on the basis of prevailing ownership structure. If the participation of private capital in the enterprise is more than 50%, the enterprise is considered to be private, and if the participation of private capital in less than 50%, the enterprise is considered to be in public ownership.
Note: When analysing the data on earnings according to the type of ownership, one has to take into account that since 1 November 2014, started to implement the law by which earnings of the employees in public sector were linearly decreased by 10%, which could not affect the results of this survey.
Average earnings of employees in private enterprises amounted to 761,794 RSD, which is about 14% less than the average earnings of employees in enterprises owned by the state. On the other hand, the average earnings of employees in enterprises owned by the state were 7.7% higher than the overall average. What should be borne in mind is that the section of Public administration and defence; compulsory social security was not included in this survey.
The median earnings were lower than the average earnings both in private and in public ownership. In private enterprises, the median amounted to 572,566 RSD, which is 24.8% lower than average earnings, while in public enterprises the median earnings were 797,210 RSD, which is 10.1% lower than the average.
Graph 1.4. Average annual earnings and median annual earnings by type of ownership, 2014
Average earnings of men were higher than average earnings of women, regardless of the type of ownership of the enterprise in which they are employed. In privately owned enterprises, average earnings of men were 11.2% higher than average earnings of women, while in public owned enterprises this difference is greater and is 14.7% in favour of men.
0
200,000
400,000
600,000
800,000
1,000,000
1,200,000
1,400,000
1,600,000
Total Privateownership
Publicownership
RSD Average annual earnings
Median annual earnings

16
Pilot Survey on the Structure of Earnings for 2014
Table 1.2. Average annual earnings by type of ownership and gender, 2014
Graph 1.5. Deviation of average annual earnings by type of ownership and gender from the total average, 2014
Total Men Women
Total 823,400 863,618 778,282
Private ownership
761,794 795,014 715,065
Public ownership 887,172 951,749 829,681
Note: More detailed data on earnings by type of ownership are available in table 3.1.2, on page 52.
1.2.3. Earnings by size of the enterprise
The data from this survey indicate a positive correlation between the average earnings and size of the enterprise in which an employee works. Namely, average salary in enterprises with 1 000 or more employees (970,252 RSD) was 47.2% higher than average salary in enterprises which employ between 10 and 49 workers (658,953 RSD).
The median salary was below the average one in all sizes of enterprises. The smallest deviation of the median from the average salary (13.9%) was noted in enterprises that employ between 50 and 249 employees, as well as in enterprises with 1 000 or more employees. In enterprises with 10-49 employees, the median earnings amounted to 500,222 RSD, i.e. 75.9% of the average salary, which was also the maximum deviation of the median from the average value (24.1%).
Graph 1.6. Average annual earnings and median annual earnings by size of the enterprise, 2014
-30 -20 -10 0 10 20 30
Total
Privateownership
Publicownership
%
Total
Men
Women
697,
884
500,
222
655,
274
697,
472
754,
713
835,
127
823,400
658,953760,631
853,864911,928
970,252
0
200,000
400,000
600,000
800,000
1,000,000
1,200,000
1,400,000
1,600,000
Total 10-49 50-249 250-499 500-999 1000+
RSD Average annual earningsMedian annual earnings
Statistical Office of the Republic of Serbia 17
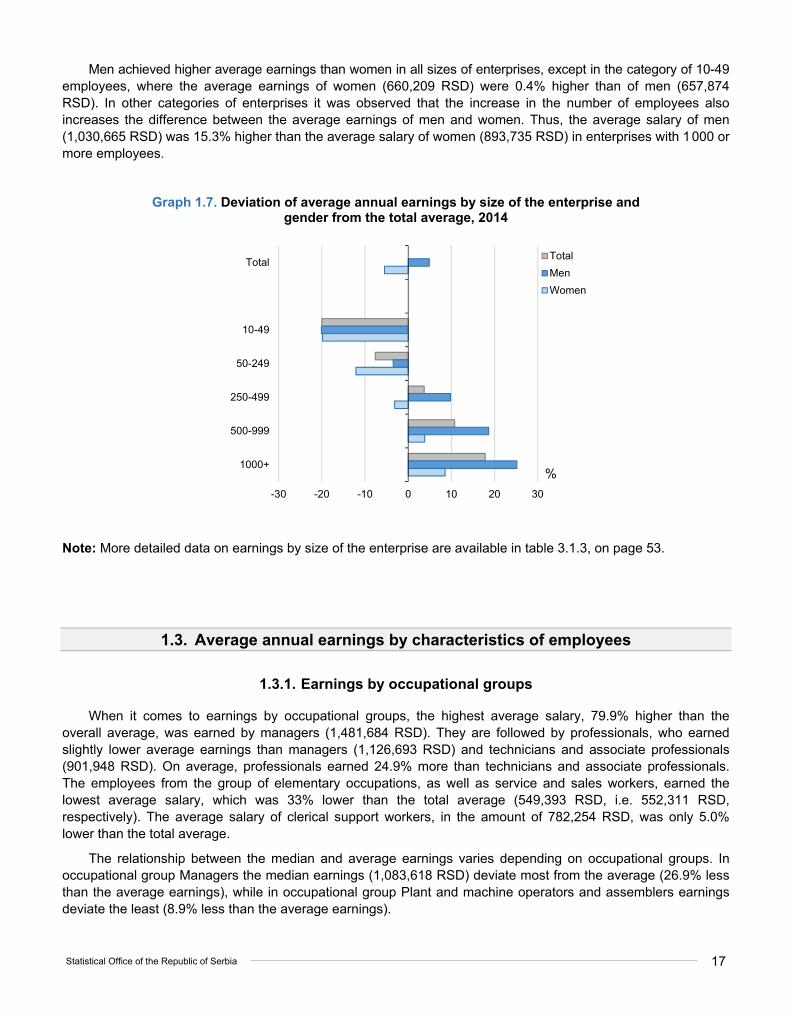
Men achieved higher average earnings than women in all sizes of enterprises, except in the category of 10-49 employees, where the average earnings of women (660,209 RSD) were 0.4% higher than of men (657,874 RSD). In other categories of enterprises it was observed that the increase in the number of employees also increases the difference between the average earnings of men and women. Thus, the average salary of men (1,030,665 RSD) was 15.3% higher than the average salary of women (893,735 RSD) in enterprises with 1 000 or more employees.
Graph 1.7. Deviation of average annual earnings by size of the enterprise and gender from the total average, 2014
Note: More detailed data on earnings by size of the enterprise are available in table 3.1.3, on page 53.
1.3. Average annual earnings by characteristics of employees
1.3.1. Earnings by occupational groups
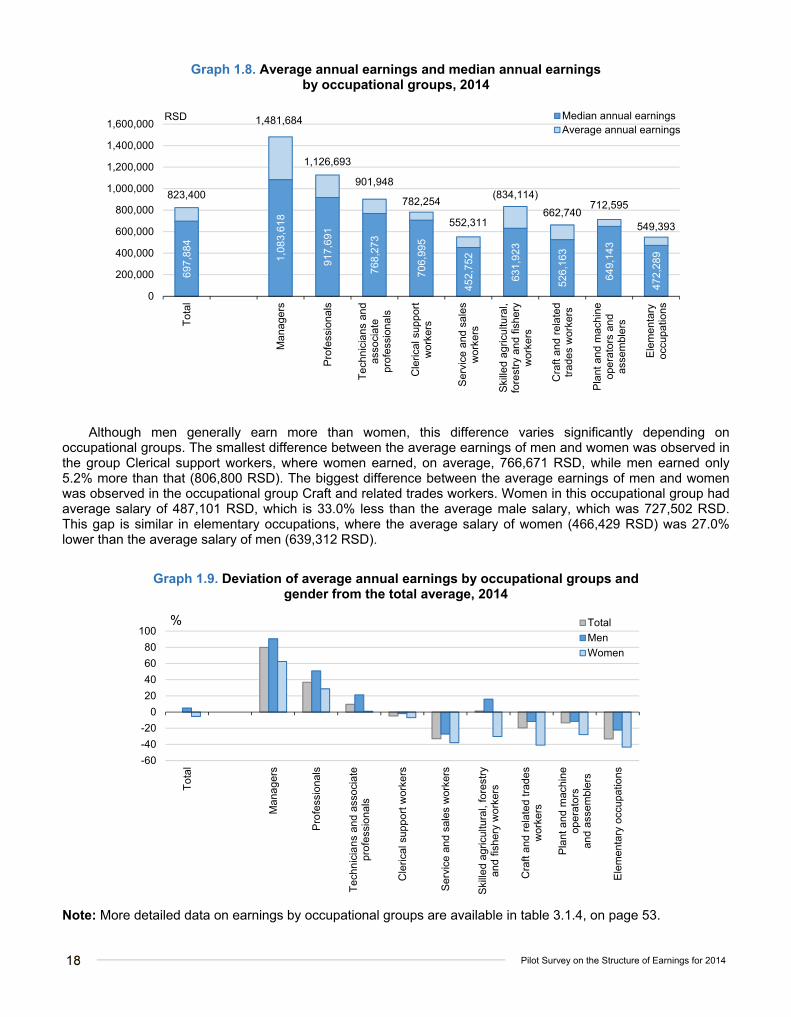
When it comes to earnings by occupational groups, the highest average salary, 79.9% higher than the overall average, was earned by managers (1,481,684 RSD). They are followed by professionals, who earned slightly lower average earnings than managers (1,126,693 RSD) and technicians and associate professionals (901,948 RSD). On average, professionals earned 24.9% more than technicians and associate professionals. The employees from the group of elementary occupations, as well as service and sales workers, earned the lowest average salary, which was 33% lower than the total average (549,393 RSD, i.e. 552,311 RSD, respectively). The average salary of clerical support workers, in the amount of 782,254 RSD, was only 5.0% lower than the total average.
The relationship between the median and average earnings varies depending on occupational groups. In occupational group Managers the median earnings (1,083,618 RSD) deviate most from the average (26.9% less than the average earnings), while in occupational group Plant and machine operators and assemblers earnings deviate the least (8.9% less than the average earnings).
-30 -20 -10 0 10 20 30
Total
10-49
50-249
250-499
500-999
1000+%
Total
Men
Women
18
Pilot Survey on the Structure of Earnings for 2014
Graph 1.8. Average annual earnings and median annual earnings by occupational groups, 2014
Although men generally earn more than women, this difference varies significantly depending on occupational groups. The smallest difference between the average earnings of men and women was observed in the group Clerical support workers, where women earned, on average, 766,671 RSD, while men earned only 5.2% more than that (806,800 RSD). The biggest difference between the average earnings of men and women was observed in the occupational group Craft and related trades workers. Women in this occupational group had average salary of 487,101 RSD, which is 33.0% less than the average male salary, which was 727,502 RSD. This gap is similar in elementary occupations, where the average salary of women (466,429 RSD) was 27.0% lower than the average salary of men (639,312 RSD).
Graph 1.9. Deviation of average annual earnings by occupational groups and gender from the total average, 2014
Note: More detailed data on earnings by occupational groups are available in table 3.1.4, on page 53.
697,
884
1,08
3,61
8
917,
691
768,
273
706,
995
452,
752
631,
923
526,
163
649,
143
472,
289
823,400
1,481,684
1,126,693
901,948
782,254
552,311
(834,114)
662,740712,595
549,393
0
200,000
400,000
600,000
800,000
1,000,000
1,200,000
1,400,000
1,600,000
To
tal
Man
age
rs
Pro
fess
iona
ls
Te
chn
icia
ns a
ndas
soci
ate
prof
essi
onal
s
Cle
rical
sup
port
wor
kers
Ser
vice
and
sal
esw
orke
rs
Ski
lled
agri
cultu
ral,
fore
stry
and
fis
hery
wor
kers
Cra
ft an
d r
elat
edtr
ades
wor
kers
Pla
nt a
nd m
achi
neop
era
tors
and
asse
mbl
ers
Ele
men
tary
occu
patio
ns
RSD Median annual earningsAverage annual earnings
-60
-40
-20
0
20
40
60
80
100
To
tal
Man
age
rs
Pro
fess
iona
ls
Te
chn
icia
ns a
nd a
ssoc
iate
prof
essi
onal
s
Cle
rical
sup
port
wor
kers
Ser
vice
and
sal
es w
orke
rs
Ski
lled
agric
ultu
ral,
fore
stry
and
fish
ery
wor
kers
Cra
ft an
d r
elat
ed t
rade
sw
orke
rs
Pla
nt a
nd m
achi
neop
era
tors
and
ass
emb
lers
Ele
men
tary
occ
upa
tion
s% Total
Men
Women

Statistical Office of the Republic of Serbia 19
1.3.2. Earnings by level of education
According to the data of this survey, a higher level of education implies higher earnings. Accordingly, the highest average salary in the amount of 1,237,851 RSD, was earned by the employees with higher education, masters or PhDs. The employees with no education, with incomplete primary school or primary education achieved the lowest average earnings, only 541,536 RSD, which represents 43.7% of the average earnings of employees with the highest level of education. The employees with secondary education earned, on average, 56.9% of the average salary of employees with a higher education, master or PhD.
The average salary of employees with higher education, master and doctoral studies was 50.3% higher than the overall average. Also, above the total average, for 8.3%, was the average salary of employees with college, I level of univerity or expert studies. The average salary of employees with no education, incomplete primary school or primary education was 34.2% lower than the overall average.
The median earnings were about 12% lower than the average earnings with the employees in the first three categories of education, while the above-mentioned deviation is the most prominent (19.8%) in the employees with higher education, master or doctoral studies, where the median earnings amounted to 992,948 RSD.
Graph 1.10. Average annual earnings and median annual earnings by level of education, 2014
Men achieved a higher average earnings than women in all categories of education. However, the smallest difference between earnings was observed among employees with college, I level of university or expert studies, where women (837,051 RSD) achieved, on average, by 12.8% lower earnings than men (960,210 RSD). The biggest difference between the earnings of men and women was recorded in the category of employees with no education, incomplete primary school or primary education, where men earned, on average, 602,267 RSD, and women earned by 23.1% lower earnings (463,018 RSD), on an annual level.
697,
884
472,
807
626,
075
788,
118
992,
948
823,400
541,536
703,996
891,628
1,237,851
0
200,000
400,000
600,000
800,000
1,000,000
1,200,000
1,400,000
1,600,000
Total No education,incomplete primary school or primary
education
Secondaryeducation
College, I level ofuniversity or expert
studies
Higher education,master and
doctoral studies
RSD
Median annual earnings Average annual earnings

20
Pilot Survey on the Structure of Earnings for 2014
Graph 1.11. Deviation of annual earnings by level of education and gender from the total average, 2014
Note: More detailed data on earnings by level of education are available in table 3.1.5, on page 54.
1.3.3. Earnings by age groups
The average earnings are positively correlated with age. The employees aged 60 or more had the highest average salary (995,136 RSD), which was 20.9% higher than the overall average, while the average salary of employees from the age groups of 15-29 and 30-39 was 19.4% and 0.5% lower than the overall average, respectively. The average salary of employees aged 15-29 was 2/3 of the average salary of the employees aged 60 or more.
The median earnings were lower than the average earnings in all age groups. The smallest deviation of the median from the average earnings was recorded among the employees aged 15-29, where the median earnings were 595,254 RSD, which is 10.4% less than the average. Among the employees aged 30-39, the median earnings amounted to 689,665 RSD, which is 15.8% less than the average salary.
Graph 1.12. Average annual earnings and median annual earnings by age groups, 2014
-34.2
-14.5
8.3
50.3
-60 -40 -20 0 20 40 60 80 100
Total
No education, incomplete primary school or primary education
Secondary education
College, I level of university or expert studies
Higher education, master and doctoral studies%
Total
Men
Women
697,
884
595,
254
689,
665
704,
826
742,
777
842,
394
823,400
664,068
819,205 834,007 865,820
995,136
0
200,000
400,000
600,000
800,000
1,000,000
1,200,000
1,400,000
1,600,000
Total 15-29 30-39 40-49 50-59 60+
RSD Average annual earningsMedian annual earnings
Statistical Office of the Republic of Serbia 21
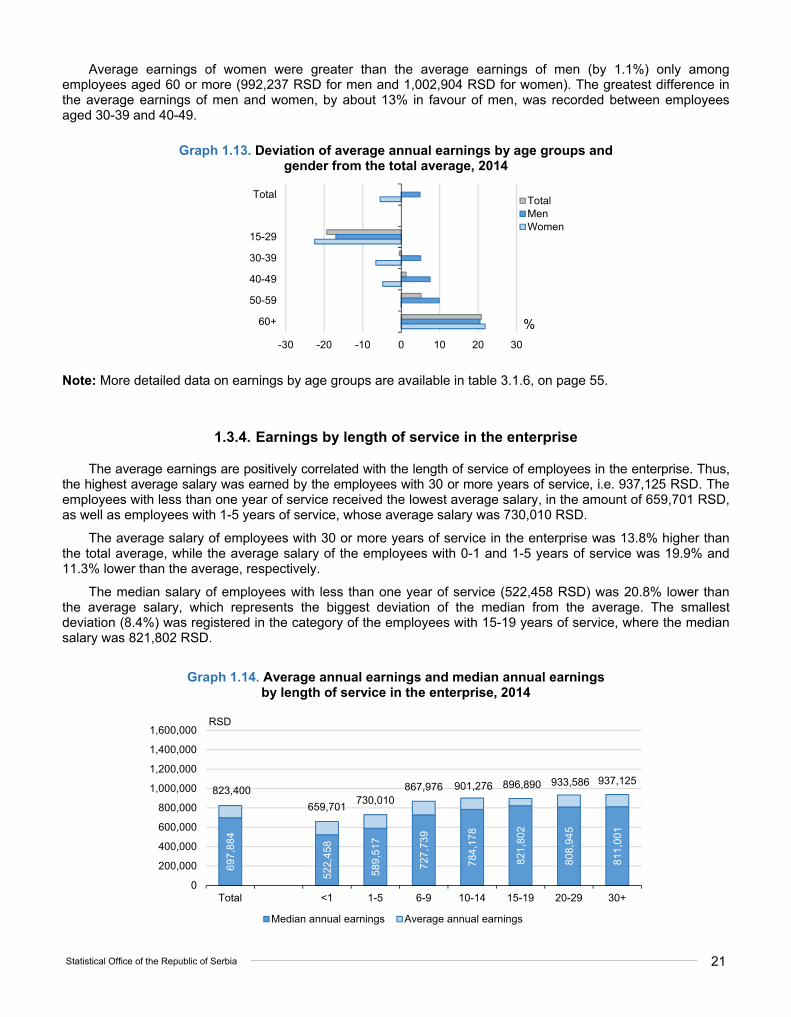
Average earnings of women were greater than the average earnings of men (by 1.1%) only among employees aged 60 or more (992,237 RSD for men and 1,002,904 RSD for women). The greatest difference in the average earnings of men and women, by about 13% in favour of men, was recorded between employees aged 30-39 and 40-49.
Graph 1.13. Deviation of average annual earnings by age groups and gender from the total average, 2014
Note: More detailed data on earnings by age groups are available in table 3.1.6, on page 55.
1.3.4. Earnings by length of service in the enterprise
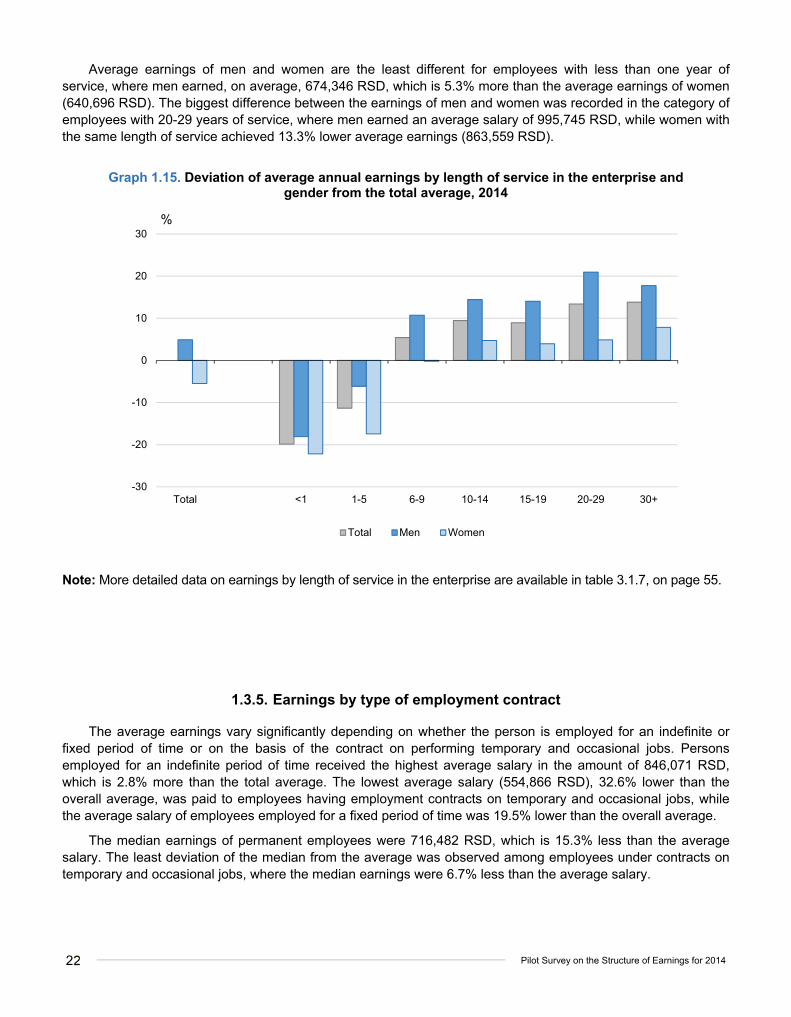
The average earnings are positively correlated with the length of service of employees in the enterprise. Thus, the highest average salary was earned by the employees with 30 or more years of service, i.e. 937,125 RSD. The employees with less than one year of service received the lowest average salary, in the amount of 659,701 RSD, as well as employees with 1-5 years of service, whose average salary was 730,010 RSD.
The average salary of employees with 30 or more years of service in the enterprise was 13.8% higher than the total average, while the average salary of the employees with 0-1 and 1-5 years of service was 19.9% and 11.3% lower than the average, respectively.
The median salary of employees with less than one year of service (522,458 RSD) was 20.8% lower than the average salary, which represents the biggest deviation of the median from the average. The smallest deviation (8.4%) was registered in the category of the employees with 15-19 years of service, where the median salary was 821,802 RSD.
Graph 1.14. Average annual earnings and median annual earnings by length of service in the enterprise, 2014
-30 -20 -10 0 10 20 30
Total
15-29
30-39
40-49
50-59
60+ %
TotalMenWomen
697,
884
522,
458
589,
517
727,
739
784,
178
821,
802
808,
945
811,
001
823,400
659,701730,010
867,976 901,276 896,890 933,586 937,125
0
200,000
400,000
600,000
800,000
1,000,000
1,200,000
1,400,000
1,600,000
Total <1 1-5 6-9 10-14 15-19 20-29 30+
RSD
Median annual earnings Average annual earnings
22
Pilot Survey on the Structure of Earnings for 2014
Average earnings of men and women are the least different for employees with less than one year of service, where men earned, on average, 674,346 RSD, which is 5.3% more than the average earnings of women (640,696 RSD). The biggest difference between the earnings of men and women was recorded in the category of employees with 20-29 years of service, where men earned an average salary of 995,745 RSD, while women with the same length of service achieved 13.3% lower average earnings (863,559 RSD).
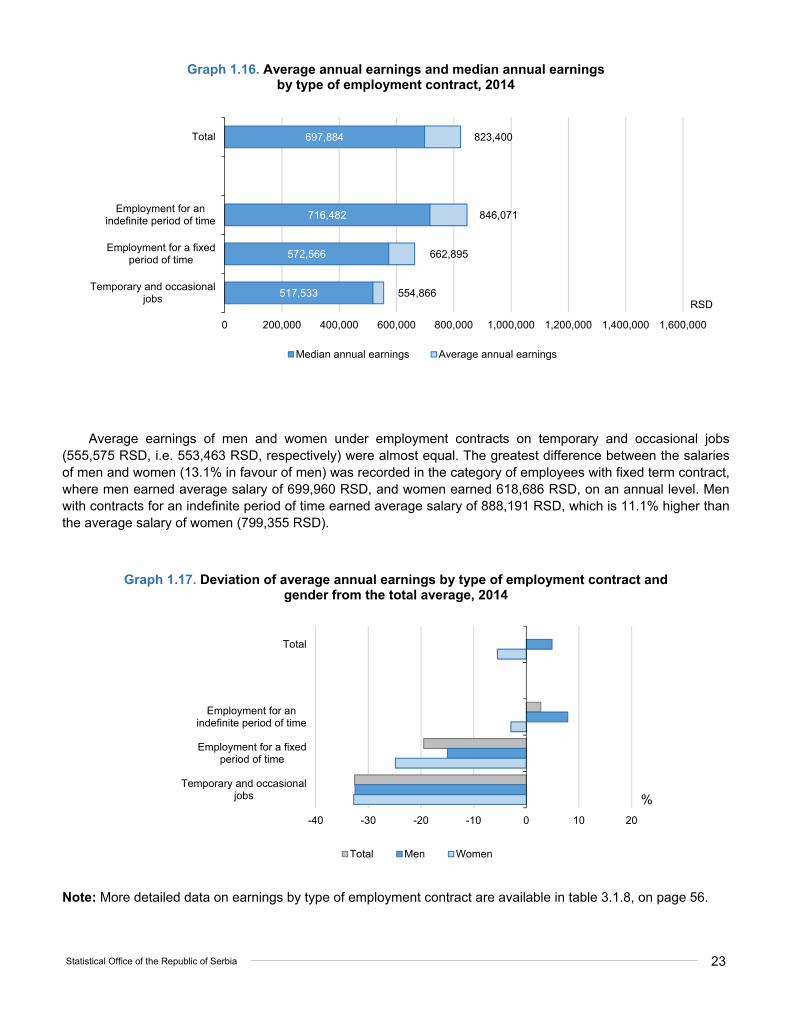
Graph 1.15. Deviation of average annual earnings by length of service in the enterprise and gender from the total average, 2014
Note: More detailed data on earnings by length of service in the enterprise are available in table 3.1.7, on page 55.
1.3.5. Earnings by type of employment contract
The average earnings vary significantly depending on whether the person is employed for an indefinite or fixed period of time or on the basis of the contract on performing temporary and occasional jobs. Persons employed for an indefinite period of time received the highest average salary in the amount of 846,071 RSD, which is 2.8% more than the total average. The lowest average salary (554,866 RSD), 32.6% lower than the overall average, was paid to employees having employment contracts on temporary and occasional jobs, while the average salary of employees employed for a fixed period of time was 19.5% lower than the overall average.
The median earnings of permanent employees were 716,482 RSD, which is 15.3% less than the average salary. The least deviation of the median from the average was observed among employees under contracts on temporary and occasional jobs, where the median earnings were 6.7% less than the average salary.
-30
-20
-10
0
10
20
30
Total <1 1-5 6-9 10-14 15-19 20-29 30+
%
Total Men Women
Statistical Office of the Republic of Serbia 23
Graph 1.16. Average annual earnings and median annual earnings by type of employment contract, 2014
Average earnings of men and women under employment contracts on temporary and occasional jobs (555,575 RSD, i.e. 553,463 RSD, respectively) were almost equal. The greatest difference between the salaries of men and women (13.1% in favour of men) was recorded in the category of employees with fixed term contract, where men earned average salary of 699,960 RSD, and women earned 618,686 RSD, on an annual level. Men with contracts for an indefinite period of time earned average salary of 888,191 RSD, which is 11.1% higher than the average salary of women (799,355 RSD).
Graph 1.17. Deviation of average annual earnings by type of employment contract and gender from the total average, 2014
Note: More detailed data on earnings by type of employment contract are available in table 3.1.8, on page 56.
697,884
716,482
572,566
517,533
823,400
846,071
662,895
554,866
0 200,000 400,000 600,000 800,000 1,000,000 1,200,000 1,400,000 1,600,000
Total
Employment for anindefinite period of time
Employment for a fixedperiod of time
Temporary and occasionaljobs RSD
Median annual earnings Average annual earnings
-40 -30 -20 -10 0 10 20
Total
Employment for anindefinite period of time
Employment for a fixedperiod of time
Temporary and occasionaljobs %
Total Men Women
24
Pilot Survey on the Structure of Earnings for 2014
1.4. Distribution of earnings
The median earnings were 84.8% of average earnings for 2014.
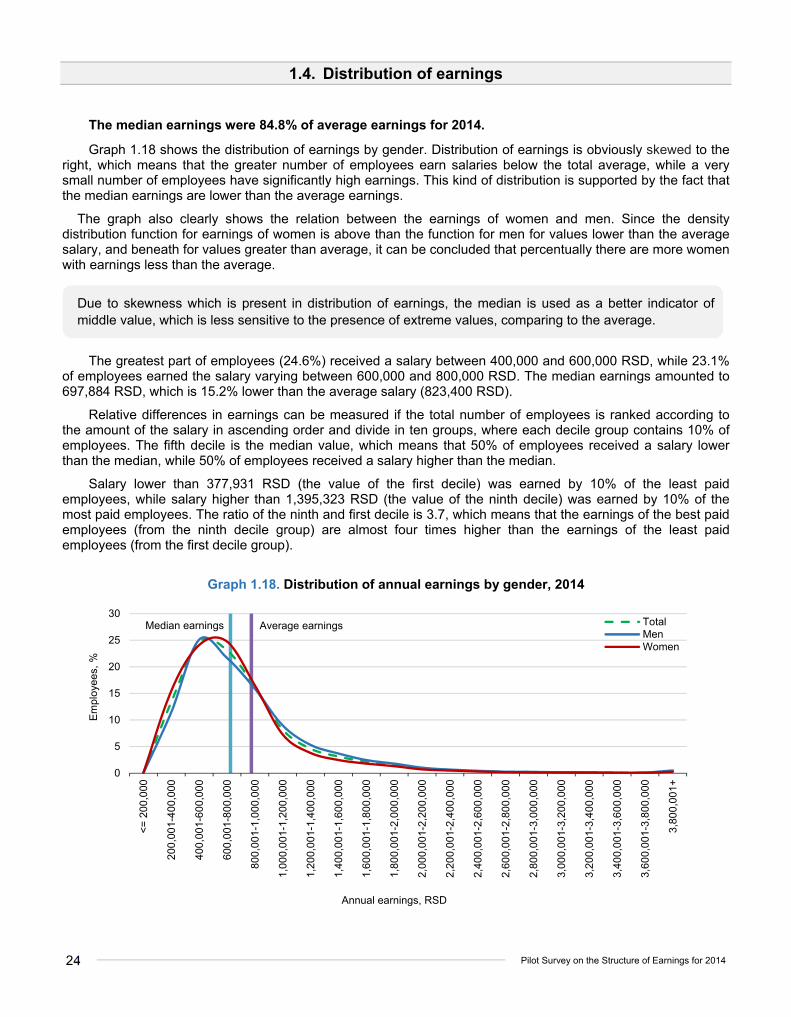
Graph 1.18 shows the distribution of earnings by gender. Distribution of earnings is obviously skewed to the right, which means that the greater number of employees earn salaries below the total average, while a very small number of employees have significantly high earnings. This kind of distribution is supported by the fact that the median earnings are lower than the average earnings.
The graph also clearly shows the relation between the earnings of women and men. Since the density distribution function for earnings of women is above than the function for men for values lower than the average salary, and beneath for values greater than average, it can be concluded that percentually there are more women with earnings less than the average.
Due to skewness which is present in distribution of earnings, the median is used as a better indicator of middle value, which is less sensitive to the presence of extreme values, comparing to the average.
The greatest part of employees (24.6%) received a salary between 400,000 and 600,000 RSD, while 23.1% of employees earned the salary varying between 600,000 and 800,000 RSD. The median earnings amounted to 697,884 RSD, which is 15.2% lower than the average salary (823,400 RSD).
Relative differences in earnings can be measured if the total number of employees is ranked according to the amount of the salary in ascending order and divide in ten groups, where each decile group contains 10% of employees. The fifth decile is the median value, which means that 50% of employees received a salary lower than the median, while 50% of employees received a salary higher than the median.
Salary lower than 377,931 RSD (the value of the first decile) was earned by 10% of the least paid employees, while salary higher than 1,395,323 RSD (the value of the ninth decile) was earned by 10% of the most paid employees. The ratio of the ninth and first decile is 3.7, which means that the earnings of the best paid employees (from the ninth decile group) are almost four times higher than the earnings of the least paid employees (from the first decile group).
Graph 1.18. Distribution of annual earnings by gender, 2014
Average earningsMedian earnings
0
5
10
15
20
25
30
<=
200
,000
200
,001
-400
,000
400
,001
-600
,000
600
,001
-800
,000
800
,001
-1,0
00,0
00
1,00
0,00
1-1,
200
,000
1,20
0,00
1-1,
400
,000
1,40
0,00
1-1,
600
,000
1,60
0,00
1-1,
800
,000
1,80
0,00
1-2,
000
,000
2,00
0,00
1-2,
200
,000
2,20
0,00
1-2,
400
,000
2,40
0,00
1-2,
600
,000
2,60
0,00
1-2,
800
,000
2,80
0,00
1-3,
000
,000
3,00
0,00
1-3,
200
,000
3,20
0,00
1-3,
400
,000
3,40
0,00
1-3,
600
,000
3,60
0,00
1-3,
800
,000
3,80
0,00
1+
Em
ploy
ees,
%
Annual earnings, RSD
TotalMenWomen
Statistical Office of the Republic of Serbia 25
1.5. Other indicators
1.5.1. Bonuses
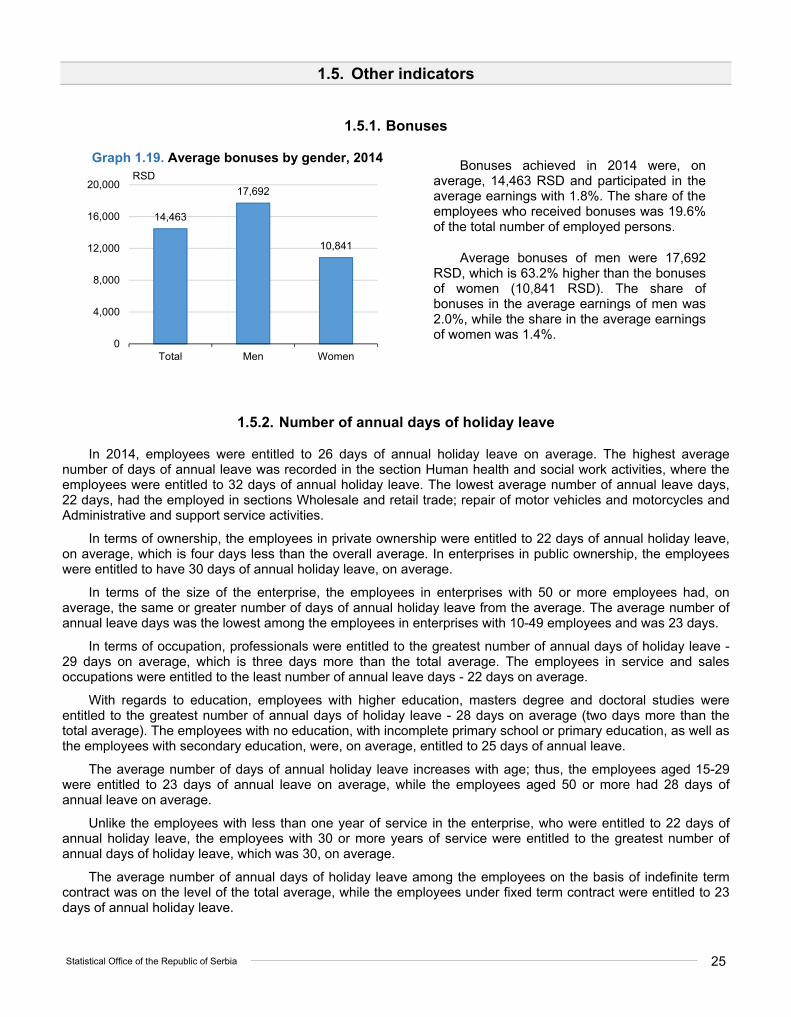
Graph 1.19. Average bonuses by gender, 2014 Bonuses achieved in 2014 were, on
average, 14,463 RSD and participated in the average earnings with 1.8%. The share of the employees who received bonuses was 19.6% of the total number of employed persons.
Average bonuses of men were 17,692 RSD, which is 63.2% higher than the bonuses of women (10,841 RSD). The share of bonuses in the average earnings of men was 2.0%, while the share in the average earnings of women was 1.4%.
1.5.2. Number of annual days of holiday leave
In 2014, employees were entitled to 26 days of annual holiday leave on average. The highest average number of days of annual leave was recorded in the section Human health and social work activities, where the employees were entitled to 32 days of annual holiday leave. The lowest average number of annual leave days, 22 days, had the employed in sections Wholesale and retail trade; repair of motor vehicles and motorcycles and Administrative and support service activities.
In terms of ownership, the employees in private ownership were entitled to 22 days of annual holiday leave, on average, which is four days less than the overall average. In enterprises in public ownership, the employees were entitled to have 30 days of annual holiday leave, on average.
In terms of the size of the enterprise, the employees in enterprises with 50 or more employees had, on average, the same or greater number of days of annual holiday leave from the average. The average number of annual leave days was the lowest among the employees in enterprises with 10-49 employees and was 23 days.
In terms of occupation, professionals were entitled to the greatest number of annual days of holiday leave - 29 days on average, which is three days more than the total average. The employees in service and sales occupations were entitled to the least number of annual leave days - 22 days on average.
With regards to education, employees with higher education, masters degree and doctoral studies were entitled to the greatest number of annual days of holiday leave - 28 days on average (two days more than the total average). The employees with no education, with incomplete primary school or primary education, as well as the employees with secondary education, were, on average, entitled to 25 days of annual leave.
The average number of days of annual holiday leave increases with age; thus, the employees aged 15-29 were entitled to 23 days of annual leave on average, while the employees aged 50 or more had 28 days of annual leave on average.
Unlike the employees with less than one year of service in the enterprise, who were entitled to 22 days of annual holiday leave, the employees with 30 or more years of service were entitled to the greatest number of annual days of holiday leave, which was 30, on average.
The average number of annual days of holiday leave among the employees on the basis of indefinite term contract was on the level of the total average, while the employees under fixed term contract were entitled to 23 days of annual holiday leave.
14,463
17,692
10,841
0
4,000
8,000
12,000
16,000
20,000
Total Men Women
RSD

26
Pilot Survey on the Structure of Earnings for 2014
1.5.3. Number of paid hours of work
The average number of paid hours of work in October 2014, was 185. Of the total number of hours, employees had, on average, two hours of paid overtime work, for which they were paid 831 RSD. Men had an average of 186 paid hours of work, while women had 184.
The highest average number of paid hours was achieved by the employees in construction (188 hours), while the employees in education had the smallest number of paid hours on average (180 hours).
The number of paid hours, depending on the type of ownership of enterprises, was not significantly different from the overall average. Men in enterprises in private ownership had, on average, 186 paid hours of work, while women had 184. In enterprises in public ownership, the average number of paid hours was 185 for men and 183 hours for women.
In enterprises with 250 or more employees, the number of paid hours of work was above the overall average. The employees in enterprises with 250-499 employees had, on average, 187 paid hours of work, while in enterprises with 500 employees or more the number of paid hours was 186. The lowest average number of paid hours of work was achieved by the employees in enterprises with less than 250 employees (183 hours).
The largest number of paid hours of work was achieved in occupational groups Skilled agricultural, forestry and fishery workers - 187 hours (two hours more than the overall average) and Craft and related trades workers (186 hours). Professionals recorded the lowest number of paid hours, a total of 183 hours (184 hours for men and 182 hours for women).
The employees with no education, incomplete primary school or primary education, as well as the employees with secondary education had, on average, 185 paid hours. The average number of paid hours achieved by the employees with higher education, master and doctoral studies was 183 hours, two hours less than the overall average.
Observed by age groups, the average number of paid hours was not significantly different from the overall average. In all age groups, the number of paid hours was, on average, lower for women than for men. The greatest difference was observed among employees aged 15-29, where men, on average, had 185 paid hours of work, and women had 182 paid hours. The smallest difference between the average number of paid hours for men and women was recorded among employees aged 60 or more (185 hours for men and 184 hours for women).
The average number of paid hours of work has not significantly varied regarding the length of service, i.e. it has not significantly varied from the overall average. The employees with nine or less years of service had 184 paid hours on average, while the employees with 30 or more years of service had 186 paid hours of work, on average.
The employees under indefinite term contract had, on average, 185 paid hours of work, while employees under fixed term contract had, on average, 184 paid hours. The number of paid hours of employees on the basis of contract on performing temporary and occasional jobs was two hours less than the overall average (183 hours).
1.6. Gender pay gap
The Gender pay gap (GPG) represents the difference between average hourly earnings of employed men and of employed women as a percentage of average hourly earnings of employed men.
The GPG is an important, internationally comparable indicator of gender inequality in terms of earnings, and is, as such, used in a number of strategic documents, both national and international, e.g. European employment strategy – EES1.
Hourly earnings of men ♂
Hourly earnings of women ♀ ÷
Hourly earnings of men ♂ × 100 = Gender
pay gap
1 http://ec.europa.eu/social/main.jsp?catId=101&langId=en
Statistical Office of the Republic of Serbia 27
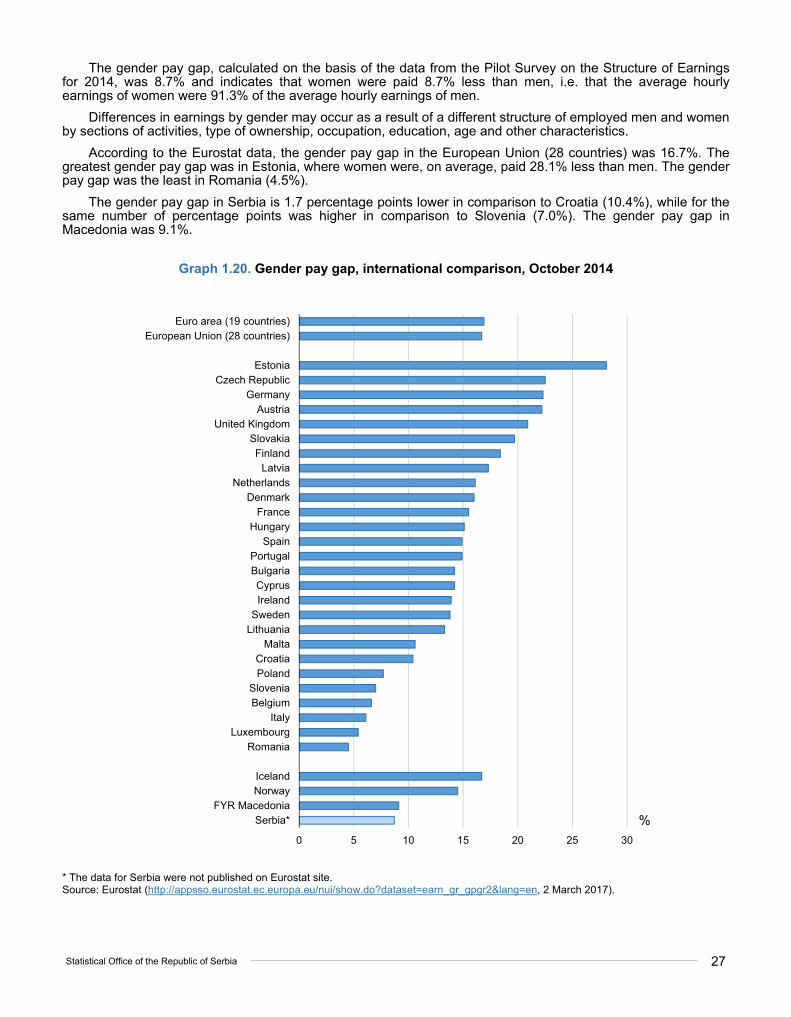
The gender pay gap, calculated on the basis of the data from the Pilot Survey on the Structure of Earnings for 2014, was 8.7% and indicates that women were paid 8.7% less than men, i.e. that the average hourly earnings of women were 91.3% of the average hourly earnings of men.
Differences in earnings by gender may occur as a result of a different structure of employed men and women by sections of activities, type of ownership, occupation, education, age and other characteristics.
According to the Eurostat data, the gender pay gap in the European Union (28 countries) was 16.7%. The greatest gender pay gap was in Estonia, where women were, on average, paid 28.1% less than men. The gender pay gap was the least in Romania (4.5%).
The gender pay gap in Serbia is 1.7 percentage points lower in comparison to Croatia (10.4%), while for the same number of percentage points was higher in comparison to Slovenia (7.0%). The gender pay gap in Macedonia was 9.1%.
Graph 1.20. Gender pay gap, international comparison, October 2014
* The data for Serbia were not published on Eurostat site. Source: Eurostat (http://appsso.eurostat.ec.europa.eu/nui/show.do?dataset=earn_gr_gpgr2&lang=en, 2 March 2017).
0 5 10 15 20 25 30
Euro area (19 countries)European Union (28 countries)
EstoniaCzech Republic
GermanyAustria
United KingdomSlovakiaFinland
LatviaNetherlands
DenmarkFrance
HungarySpain
PortugalBulgariaCyprusIreland
SwedenLithuania
MaltaCroatiaPoland
SloveniaBelgium
ItalyLuxembourg
Romania
IcelandNorway
FYR MacedoniaSerbia* %
28
Pilot Survey on the Structure of Earnings for 2014
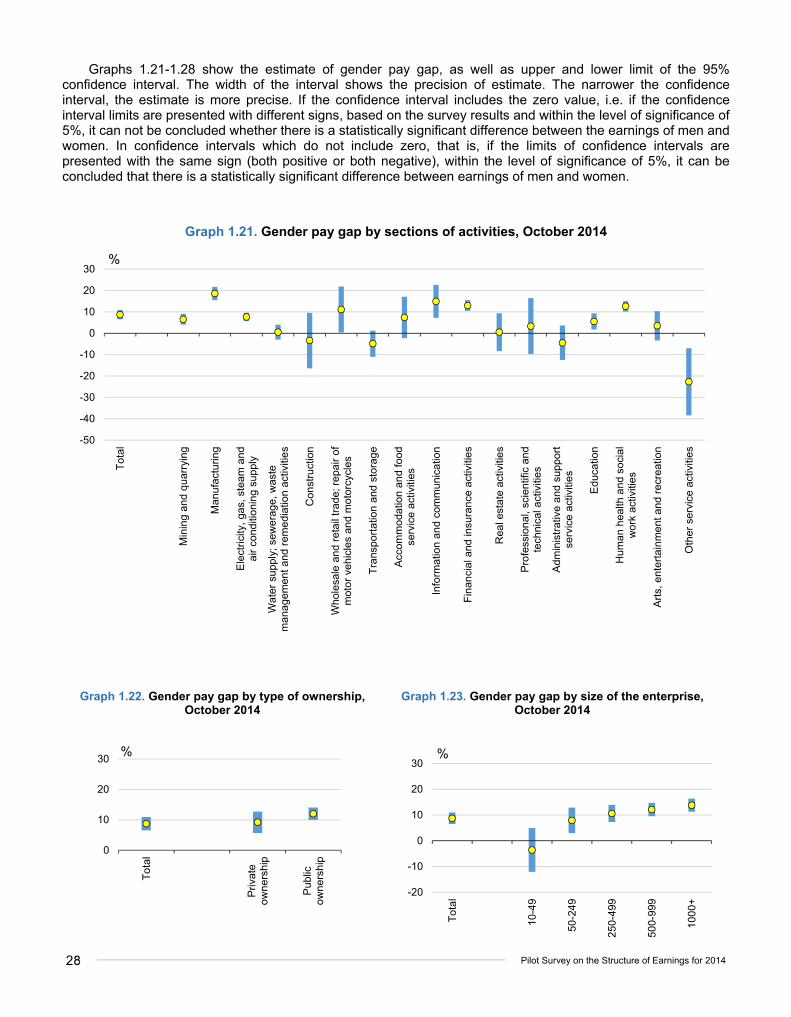
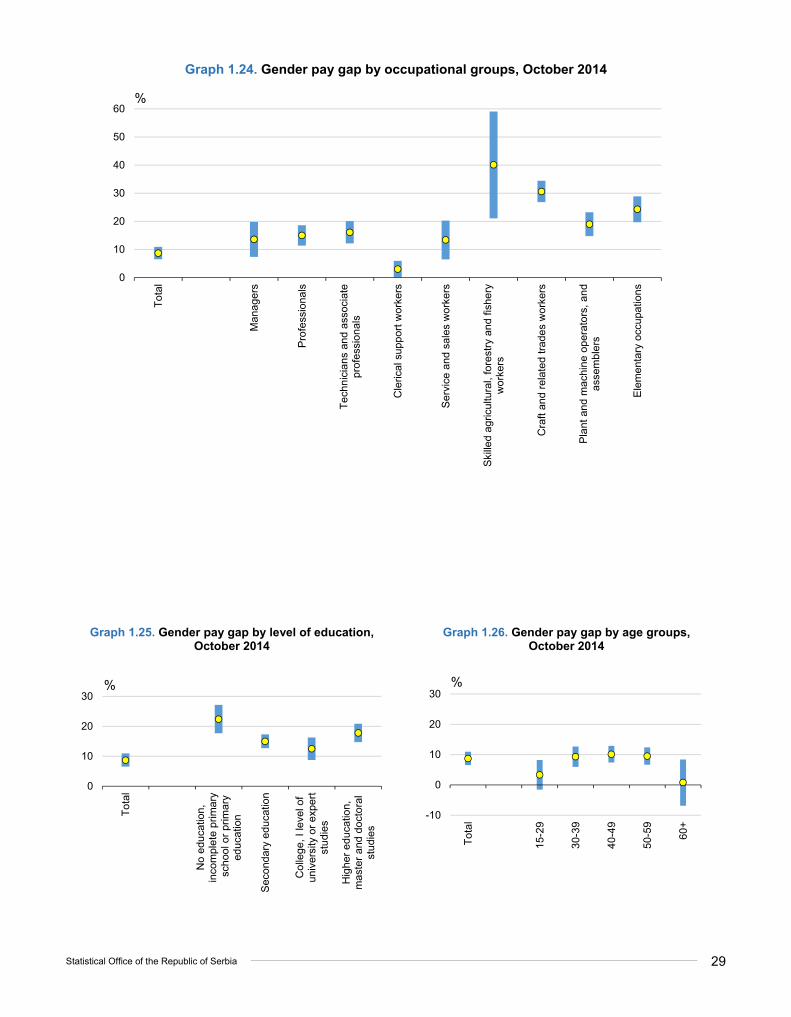
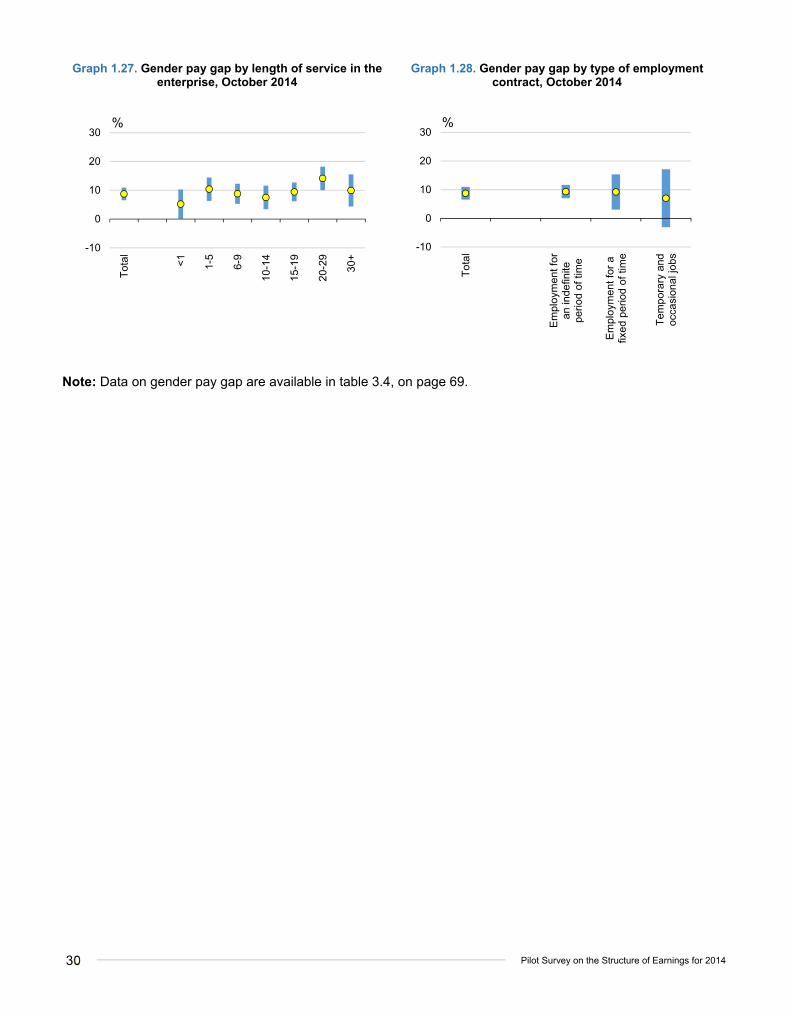
Graphs 1.21-1.28 show the estimate of gender pay gap, as well as upper and lower limit of the 95% confidence interval. The width of the interval shows the precision of estimate. The narrower the confidence interval, the estimate is more precise. If the confidence interval includes the zero value, i.e. if the confidence interval limits are presented with different signs, based on the survey results and within the level of significance of 5%, it can not be concluded whether there is a statistically significant difference between the earnings of men and women. In confidence intervals which do not include zero, that is, if the limits of confidence intervals are presented with the same sign (both positive or both negative), within the level of significance of 5%, it can be concluded that there is a statistically significant difference between earnings of men and women.
Graph 1.21. Gender pay gap by sections of activities, October 2014
Graph 1.22. Gender pay gap by type of ownership, October 2014
Graph 1.23. Gender pay gap by size of the enterprise, October 2014
-50
-40
-30
-20
-10
0
10
20
30
To
tal
Min
ing
and
qua
rryi
ng
Man
ufa
ctur
ing
Ele
ctri
city
, ga
s, s
team
and
air
cond
ition
ing
supp
ly
Wat
er s
upp
ly; s
ewe
rage
, was
tem
ana
gem
ent
and
rem
edia
tion
activ
itie
s
Con
stru
ctio
n
Who
lesa
le a
nd r
etai
l tra
de; r
epai
r o
fm
oto
r ve
hicl
es a
nd m
oto
rcyc
les
Tra
nspo
rtat
ion
and
stor
age
Acc
omm
odat
ion
and
food
serv
ice
act
iviti
es
Info
rmat
ion
and
com
mun
ica
tion
Fin
anci
al a
nd in
sura
nce
act
iviti
es
Rea
l est
ate
act
iviti
es
Pro
fess
iona
l, sc
ient
ific
and
tech
nica
l act
iviti
es
Adm
inis
trat
ive
and
sup
port
serv
ice
act
iviti
es
Edu
catio
n
Hum
an h
ealth
and
soc
ial
wor
k ac
tiviti
es
Art
s, e
nte
rta
inm
ent
and
rec
reat
ion
Oth
er
serv
ice
act
iviti
es
%
0
10
20
30
To
tal
Priv
ate
own
ersh
ip
Pub
licow
ner
ship
%
-20
-10
0
10
20
30
To
tal
10-4
9
50-2
49
250
-499
500
-999
100
0+
%
Statistical Office of the Republic of Serbia 29
Graph 1.24. Gender pay gap by occupational groups, October 2014
Graph 1.25. Gender pay gap by level of education, October 2014
Graph 1.26. Gender pay gap by age groups, October 2014
0
10
20
30
40
50
60
To
tal
Man
age
rs
Pro
fess
iona
ls
Te
chn
icia
ns a
nd a
ssoc
iate
prof
essi
onal
s
Cle
rical
sup
port
wor
kers
Ser
vice
and
sal
es w
orke
rs
Ski
lled
agric
ultu
ral,
fore
stry
and
fis
hery
wor
kers
Cra
ft an
d r
elat
ed t
rade
s w
orke
rs
Pla
nt a
nd m
achi
ne o
pera
tors
, an
das
sem
bler
s
Ele
men
tary
occ
upa
tion
s
%
0
10
20
30
To
tal
No
educ
atio
n,in
com
ple
te p
rimar
y s
choo
l or
prim
ary
edu
catio
n
Sec
onda
ry e
duca
tion
Col
lege
, I
leve
l of
univ
ersi
ty o
r ex
pert
stud
ies
Hig
her
educ
atio
n,m
aste
r an
d do
cto
ral
stud
ies
%
-10
0
10
20
30
To
tal
15-2
9
30-3
9
40-4
9
50-5
9
60+
%
30
Pilot Survey on the Structure of Earnings for 2014
Graph 1.27. Gender pay gap by length of service in the enterprise, October 2014
Graph 1.28. Gender pay gap by type of employment contract, October 2014
Note: Data on gender pay gap are available in table 3.4, on page 69.
-10
0
10
20
30T
ota
l
<1
1-5
6-9
10-1
4
15-1
9
20-2
9
30+
%
-10
0
10
20
30
To
tal
Em
ploy
men
t fo
ran
inde
finite
perio
d of
tim
e
Em
ploy
men
t fo
r a
fixe
d pe
riod
of ti
me
Te
mpo
rary
and
occa
sion
al jo
bs
%
Statistical Office of the Republic of Serbia 31
1.7. International comparison
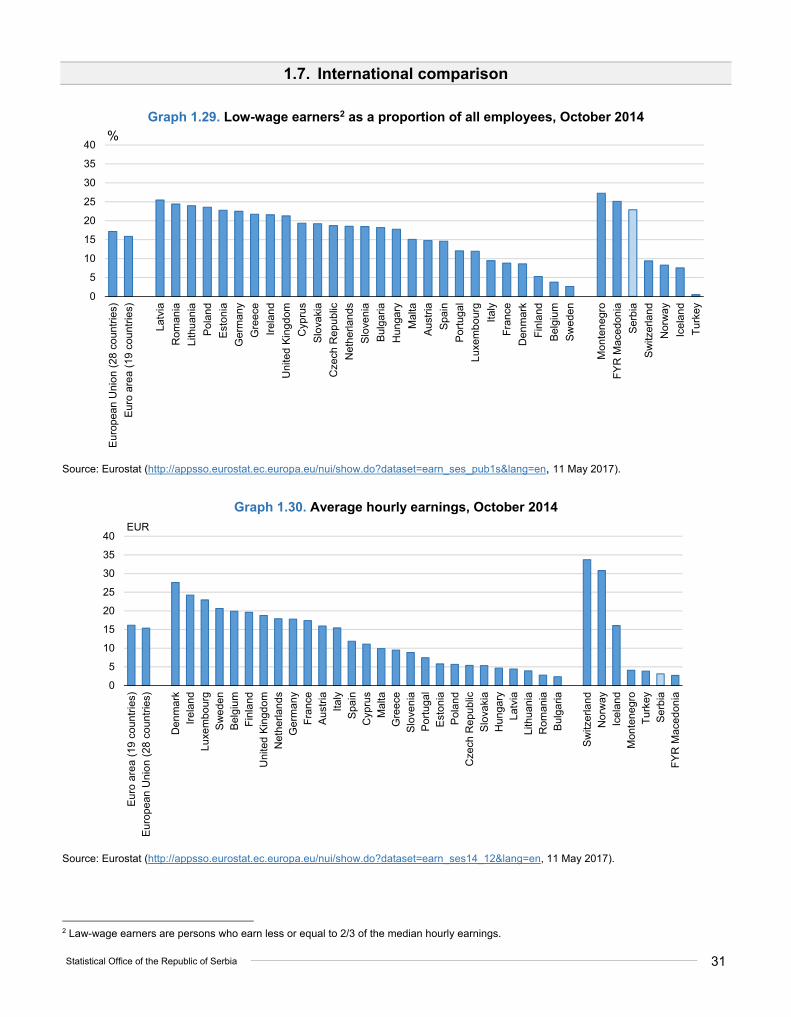
Graph 1.29. Low-wage earners2 as a proportion of all employees, October 2014
Source: Eurostat (http://appsso.eurostat.ec.europa.eu/nui/show.do?dataset=earn_ses_pub1s&lang=en, 11 May 2017).
Graph 1.30. Average hourly earnings, October 2014
Source: Eurostat (http://appsso.eurostat.ec.europa.eu/nui/show.do?dataset=earn_ses14_12&lang=en, 11 May 2017).
2 Law-wage earners are persons who earn less or equal to 2/3 of the median hourly earnings.
0
5
10
15
20
25
30
35
40
Eur
opea
n U
nio
n (2
8 c
oun
trie
s)
Eur
o ar
ea
(19
cou
ntrie
s)
Latv
ia
Rom
ania
Lith
uan
ia
Pol
and
Est
onia
Ge
rma
ny
Gre
ece
Irel
and
Uni
ted
Kin
gdom
Cyp
rus
Slo
vaki
a
Cze
ch R
epub
lic
Net
herla
nds
Slo
veni
a
Bul
garia
Hun
gary
Mal
ta
Aus
tria
Spa
in
Por
tuga
l
Luxe
mbo
urg
Ital
y
Fra
nce
Den
mar
k
Fin
land
Bel
giu
m
Sw
eden
Mon
tene
gro
FY
R M
aced
onia
Ser
bia
Sw
itzer
land
Nor
way
Icel
and
Tu
rkey
%
0
5
10
15
20
25
30
35
40
Eur
o ar
ea
(19
cou
ntrie
s)E
urop
ean
Uni
on
(28
co
untr
ies)
Den
mar
kIr
elan
dLu
xem
bour
gS
wed
enB
elgi
um
Fin
land
Uni
ted
Kin
gdom
Net
herla
nds
Ge
rma
ny
Fra
nce
Aus
tria
Ital
yS
pain
Cyp
rus
Mal
taG
ree
ceS
love
nia
Por
tuga
lE
ston
iaP
olan
dC
zech
Rep
ublic
Slo
vaki
aH
unga
ryLa
tvia
Lith
uan
iaR
oman
iaB
ulga
ria
Sw
itzer
land
Nor
way
Icel
and
Mon
tene
gro
Tu
rkey
Ser
bia
FY
R M
aced
onia
EUR
32
Pilot Survey on the Structure of Earnings for 2014
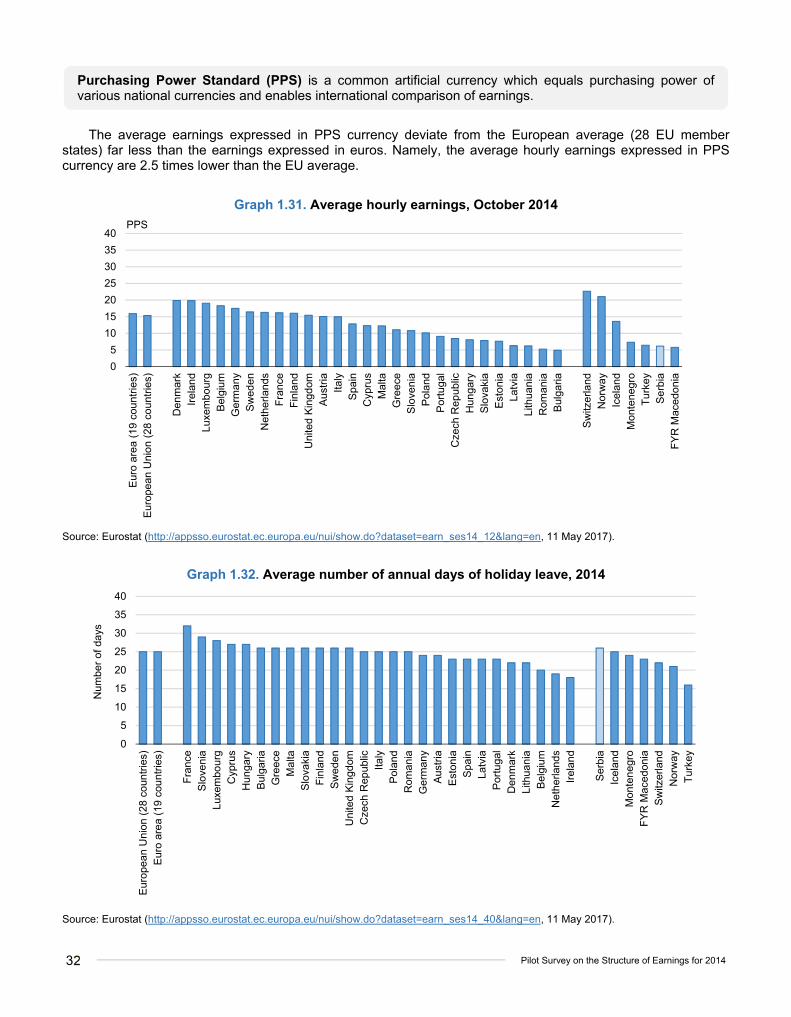
Purchasing Power Standard (PPS) is a common artificial currency which equals purchasing power of various national currencies and enables international comparison of earnings.
The average earnings expressed in PPS currency deviate from the European average (28 EU member states) far less than the earnings expressed in euros. Namely, the average hourly earnings expressed in PPS currency are 2.5 times lower than the EU average.
Graph 1.31. Average hourly earnings, October 2014
Source: Eurostat (http://appsso.eurostat.ec.europa.eu/nui/show.do?dataset=earn_ses14_12&lang=en, 11 May 2017).
Graph 1.32. Average number of annual days of holiday leave, 2014
Source: Eurostat (http://appsso.eurostat.ec.europa.eu/nui/show.do?dataset=earn_ses14_40&lang=en, 11 May 2017).
0
5
10
15
20
25
30
35
40
Eur
o ar
ea
(19
cou
ntrie
s)E
urop
ean
Uni
on
(28
co
untr
ies)
Den
mar
kIr
elan
dLu
xem
bour
gB
elgi
um
Ge
rma
ny
Sw
eden
Net
herla
nds
Fra
nce
Fin
land
Uni
ted
Kin
gdom
Aus
tria
Ital
yS
pain
Cyp
rus
Mal
taG
ree
ceS
love
nia
Pol
and
Por
tuga
lC
zech
Rep
ublic
Hun
gary
Slo
vaki
aE
ston
iaLa
tvia
Lith
uan
iaR
oman
iaB
ulga
ria
Sw
itzer
land
Nor
way
Icel
and
Mon
tene
gro
Tu
rkey
Ser
bia
FY
R M
aced
onia
PPS
0
5
10
15
20
25
30
35
40
Eur
opea
n U
nio
n (2
8 c
oun
trie
s)E
uro
are
a (1
9 c
ount
ries)
Fra
nce
Slo
veni
aLu
xem
bour
gC
ypru
sH
unga
ryB
ulga
riaG
ree
ceM
alta
Slo
vaki
aF
inla
ndS
wed
enU
nite
d K
ingd
omC
zech
Rep
ublic
Ital
yP
olan
dR
oman
iaG
erm
an
yA
ustr
iaE
ston
iaS
pain
Latv
iaP
ortu
gal
Den
mar
kLi
thua
nia
Bel
giu
mN
ethe
rland
sIr
elan
d
Ser
bia
Icel
and
Mon
tene
gro
FY
R M
aced
onia
Sw
itzer
land
Nor
way
Tu
rkey
Num
ber
of d
ays
Statistical Office of the Republic of Serbia 33
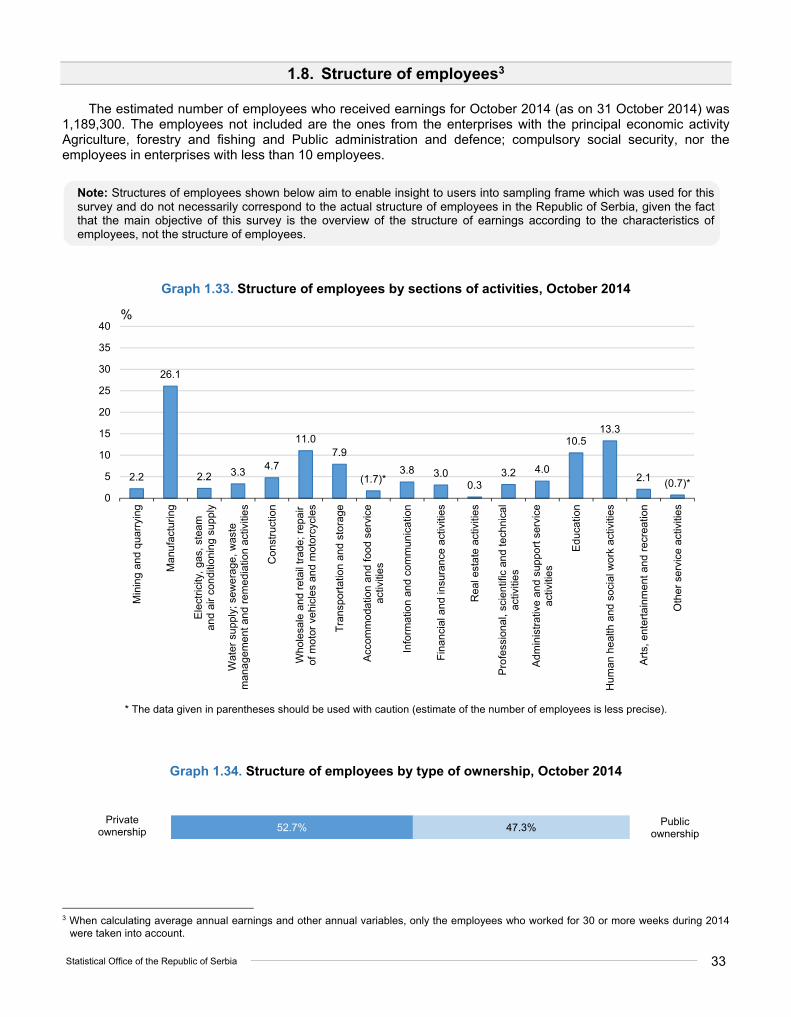
1.8. Structure of employees3
The estimated number of employees who received earnings for October 2014 (as on 31 October 2014) was 1,189,300. The employees not included are the ones from the enterprises with the principal economic activity Agriculture, forestry and fishing and Public administration and defence; compulsory social security, nor the employees in enterprises with less than 10 employees.
Note: Structures of employees shown below aim to enable insight to users into sampling frame which was used for this survey and do not necessarily correspond to the actual structure of employees in the Republic of Serbia, given the fact that the main objective of this survey is the overview of the structure of earnings according to the characteristics of employees, not the structure of employees.
Graph 1.33. Structure of employees by sections of activities, October 2014
* The data given in parentheses should be used with caution (estimate of the number of employees is less precise).
Graph 1.34. Structure of employees by type of ownership, October 2014
3 When calculating average annual earnings and other annual variables, only the employees who worked for 30 or more weeks during 2014
were taken into account.
2.2
26.1
2.2 3.34.7
11.07.9
(1.7)*3.8 3.0
0.33.2 4.0
10.513.3
2.1 (0.7)*0
5
10
15
20
25
30
35
40
Min
ing
and
qua
rryi
ng
Man
ufa
ctur
ing
Ele
ctri
city
, ga
s, s
team
and
air
con
ditio
nin
g s
uppl
y
Wat
er s
upp
ly; s
ewe
rage
, was
tem
ana
gem
ent
and
rem
edia
tion
activ
itie
s
Con
stru
ctio
n
Who
lesa
le a
nd r
etai
l tra
de; r
epai
rof
mo
tor
vehi
cles
and
mot
orcy
cles
Tra
nspo
rtat
ion
and
stor
age
Acc
omm
odat
ion
and
food
ser
vice
activ
itie
s
Info
rmat
ion
and
com
mun
ica
tion
Fin
anci
al a
nd in
sura
nce
act
iviti
es
Rea
l est
ate
act
iviti
es
Pro
fess
iona
l, sc
ient
ific
and
tech
nica
lac
tiviti
es
Adm
inis
trat
ive
and
sup
port
ser
vice
activ
itie
s
Edu
catio
n
Hum
an h
ealth
and
soc
ial w
ork
act
iviti
es
Art
s, e
nte
rta
inm
ent
and
rec
reat
ion
Oth
er
serv
ice
act
iviti
es
%
52.7% 47.3%Private
ownershipPublic
ownership
34
Pilot Survey on the Structure of Earnings for 2014
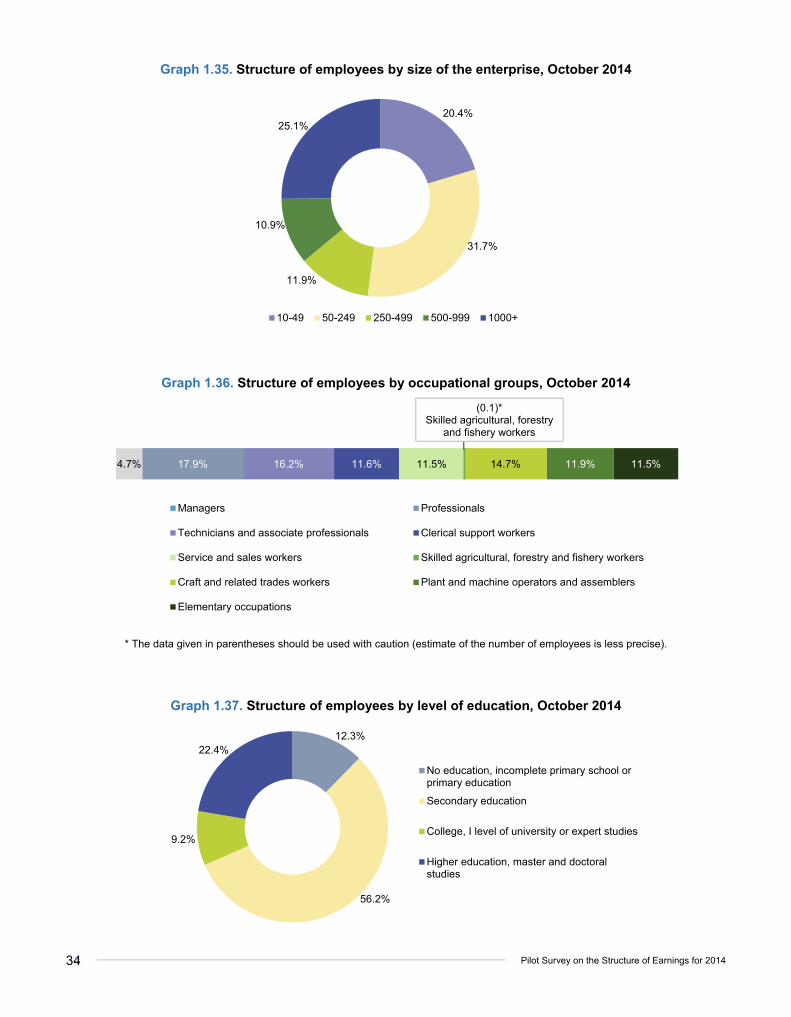
Graph 1.35. Structure of employees by size of the enterprise, October 2014
Graph 1.36. Structure of employees by occupational groups, October 2014
* The data given in parentheses should be used with caution (estimate of the number of employees is less precise).
Graph 1.37. Structure of employees by level of education, October 2014
20.4%
31.7%
11.9%
10.9%
25.1%
10-49 50-249 250-499 500-999 1000+
4.7% 17.9% 16.2% 11.6% 11.5%
(0.1)*Skilled agricultural, forestry
and fishery workers
14.7% 11.9% 11.5%
Managers Professionals
Technicians and associate professionals Clerical support workers
Service and sales workers Skilled agricultural, forestry and fishery workers
Craft and related trades workers Plant and machine operators and assemblers
Elementary occupations
12.3%
56.2%
9.2%
22.4%
No education, incomplete primary school orprimary education
Secondary education
College, I level of university or expert studies
Higher education, master and doctoralstudies
Statistical Office of the Republic of Serbia 35
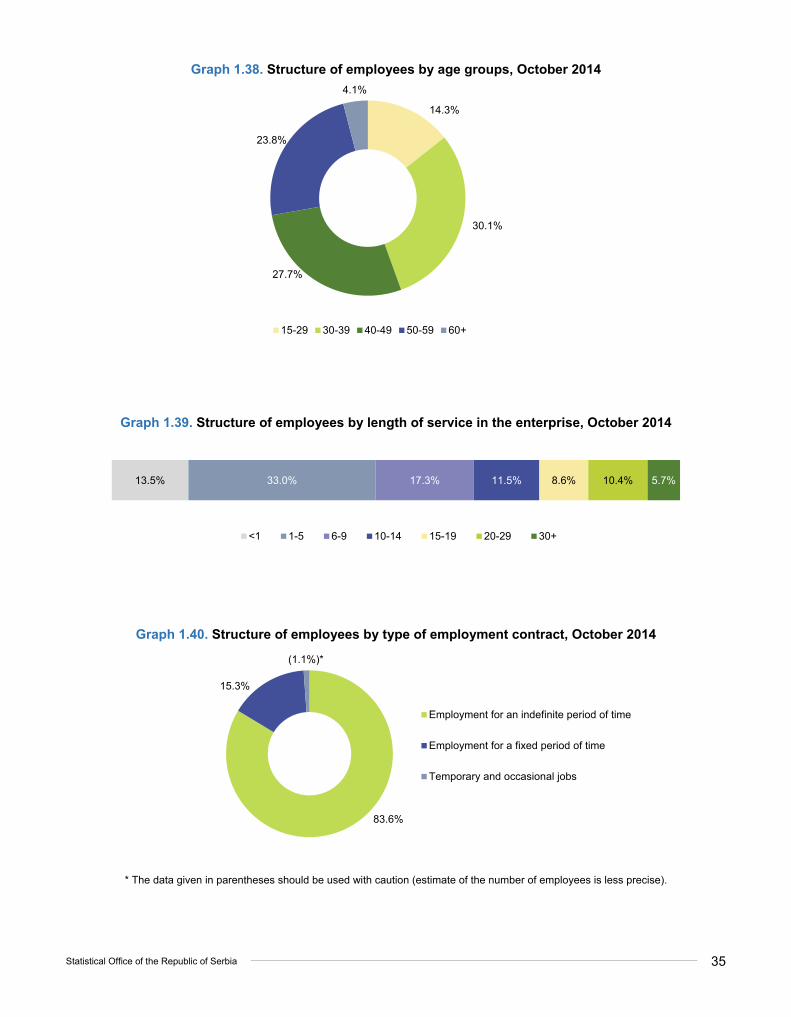
Graph 1.38. Structure of employees by age groups, October 2014
Graph 1.39. Structure of employees by length of service in the enterprise, October 2014
Graph 1.40. Structure of employees by type of employment contract, October 2014
* The data given in parentheses should be used with caution (estimate of the number of employees is less precise).
14.3%
30.1%
27.7%
23.8%
4.1%
15-29 30-39 40-49 50-59 60+
13.5% 33.0% 17.3% 11.5% 8.6% 10.4% 5.7%
<1 1-5 6-9 10-14 15-19 20-29 30+
83.6%
15.3%
(1.1%)*
Employment for an indefinite period of time
Employment for a fixed period of time
Temporary and occasional jobs

36
Pilot Survey on the Structure of Earnings for 2014
Statistical Office of the Republic of Serbia 37
2. Methodological explanations

38
Pilot Survey on the Structure of Earnings for 2014

Statistical Office of the Republic of Serbia 39
2.1. The objective of the survey
The objective of the Structure of Earnings Survey is to obtain data on average monthly and annual earnings and on the average hourly earnings according to the individual characteristics of employees - occupation, gender, education, age, length of service in the enterprise, type of employment contract (employment for an indefinite and for a fixed period of time and employment contract on temporary and occasional jobs), as well as according to the characteristics of the enterprise in which employees work - economic activity, size and type of ownership of the enterprise.
The pilot survey was conducted in accordance with the EU regulations, with reference year 2014 and reference month October.
2.2. Reporting units, statistical units
Reporting units are active enterprises (legal entities and entrepreneurs) with 10 or more employees (more explanations in the part Characteristics of the sample).
Units of observation (statistical units) are the employees in enterprises who received earnings for October 2014, regardless of the type of employment contract that they had with the employer: definite or indefinite period of time or persons who worked under employment contract on temporary and occasional jobs.
2.3. Characteristics of the sample
Sampling frame was formed on the basis of the data on active enterprises from the Statistical Business Register (SBR) and the Central Registry of Compulsory Social Insurance (CRCSI). The sampling frame consisted of enterprises whose principal economic activity was in any of the CA (2010) sections, except sections Agriculture, forestry and fishing and Public administration and defence; compulsory social security. In addition, the enterprises had to fulfil the condition that they have 10 or more employees on 31 October 2014, according to the data from CRCSI. The sampling frame consisted of about 18 thousand active enterprises with approximately 1.3 million employees.
The survey was conducted on a two-stage stratified random sample. The units of the first stage were enterprises, and the units of the second stage were the employees.
Stratification of enterprises was performed according to 79 divisions of activities from the scope of the survey and five size classes of enterprises defined according to the number of employees (10-49; 50-249; 250-499; 500-999; 1000 or more). Strata with enterprises that had 250 or more employees, as well as the strata with only one unit, were census strata – all units of these strata were included in the survey sample. From the remaining strata, which were not census strata, random samples were selected. A total of 301 strata were defined, out of which 150 were census strata.
Sample allocation by strata was defined as a solution of a nonlinear optimization problem with given constraints for multiple variables and multiple domains (Bethel, 1989, ISTAT). In the case of one auxiliary variable and one domain, the allocation determined using Bethel algorithm coincides with the Neyman allocation.
Table 2.1 shows the planned maximum errors, i.e. coefficients of variation (CV) by pre-defined domains for the estimation of the total of an auxiliary variable - the number of employees obtained from CRCSI. Other auxiliary variables, which would be more significantly correlated with individual characteristics of employees and which would contribute to a more optimum allocation, were not available.

40
Pilot Survey on the Structure of Earnings for 2014
Table 2.1. Planned errors for estimation of the number of employees, 2014
Type of domain Number of domains Planned error for estimation of the
number of employees CV (%)
CA (2010) divisions 79 9
CA (2010) sections 17 7
Size classes 5 3
The allocated sample had 1,761 enterprises with about 670 thousand employees.
A simple random sample of the first sampling units (enterprises) was selected by a sequential scheme with the help of permanent random numbers uniformly distributed over the interval (0,1). The starting point for selection was 0.75.
Within each selected enterprise, a systematic sample of the second stage sampling units (employees) was selected from the list of employees that had received salaries for October 2014. Employees were selected by a person in charge of accounting jobs who was obliged to follow the instructions for conducting the survey.
The number of employees to be selected in the sample depended on the size of the enterprise and was selected in the manner showed in table 2.2.
Table 2.2. Selection of a systematic sample of employees, 2014
Total number of employees in the enterprise, as on 31 October 2014
Number of employees to be selected in the sample
Between 51 and 99 employees 50% (every second)
Between 100 and 249 25% (every fourth)
Between 250 and 1499 10% (every tenth)
1500 or more employees 150 employees
Estimate of the total and its standard error, as well as the estimate of the ratio, median and other parameters were calculated using the standard procedure for two-stage stratified sample with simple random sample selected in both stages (Horvitz-Thompson estimates).
Estimates of standard error of the ratio and other rational functions of the totals, were calculated using Taylor linearization. The Estimating Equations technique was used for estimation of the standard error of the median which depends on the order of variable values in a sequence (order statistics).
Sampling weight for a first stage unit was equal to the ratio of the total number of units and the number of units in the sample, in the stratum to which the unit belonged. On the stratum level, parameter estimates were calculated using weighted variable values of sampled enterprises.
The weight for second stage unit (selected employee in the enterprise) was equal to the ratio of the total number of employees in the enterprise and the number of sampled employees from the enterprise.
The weight for the employee at the stratum level was equal to the product of the weight of first and second stage sampling unit.
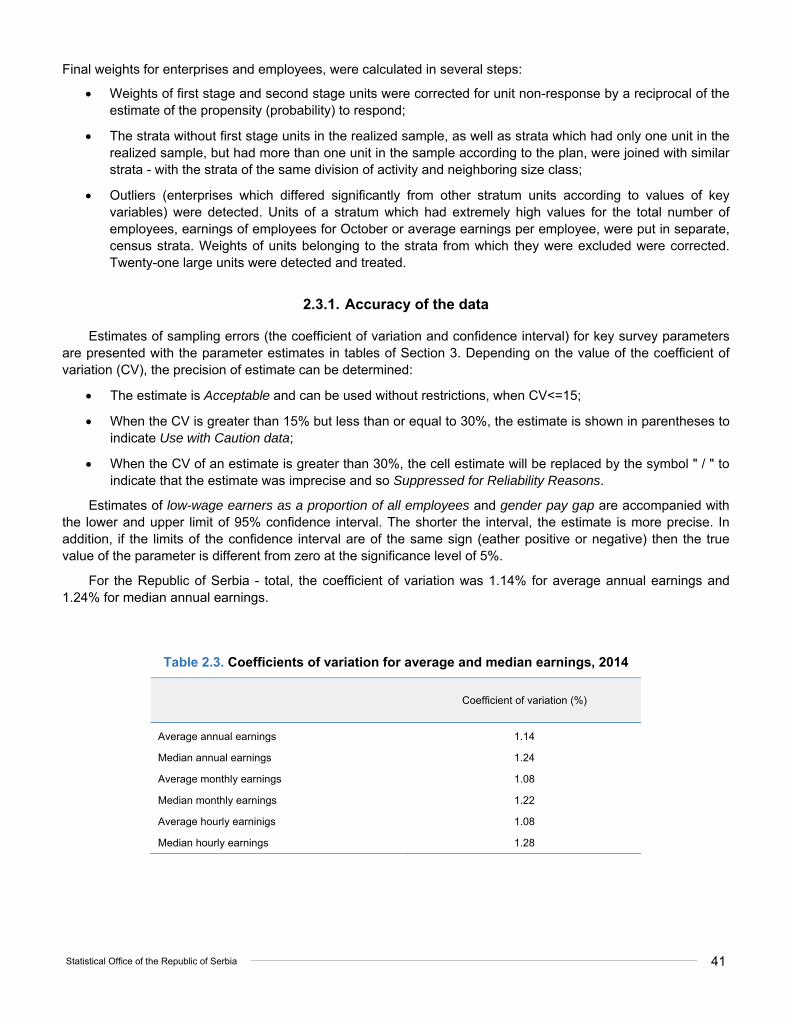
Statistical Office of the Republic of Serbia 41
Final weights for enterprises and employees, were calculated in several steps:
Weights of first stage and second stage units were corrected for unit non-response by a reciprocal of the estimate of the propensity (probability) to respond;
The strata without first stage units in the realized sample, as well as strata which had only one unit in the realized sample, but had more than one unit in the sample according to the plan, were joined with similar strata - with the strata of the same division of activity and neighboring size class;
Outliers (enterprises which differed significantly from other stratum units according to values of key variables) were detected. Units of a stratum which had extremely high values for the total number of employees, earnings of employees for October or average earnings per employee, were put in separate, census strata. Weights of units belonging to the strata from which they were excluded were corrected. Twenty-one large units were detected and treated.
2.3.1. Accuracy of the data
Estimates of sampling errors (the coefficient of variation and confidence interval) for key survey parameters are presented with the parameter estimates in tables of Section 3. Depending on the value of the coefficient of variation (CV), the precision of estimate can be determined:
The estimate is Acceptable and can be used without restrictions, when CV<=15;
When the CV is greater than 15% but less than or equal to 30%, the estimate is shown in parentheses to indicate Use with Caution data;
When the CV of an estimate is greater than 30%, the cell estimate will be replaced by the symbol " / " to indicate that the estimate was imprecise and so Suppressed for Reliability Reasons.
Estimates of low-wage earners as a proportion of all employees and gender pay gap are accompanied with the lower and upper limit of 95% confidence interval. The shorter the interval, the estimate is more precise. In addition, if the limits of the confidence interval are of the same sign (eather positive or negative) then the true value of the parameter is different from zero at the significance level of 5%.
For the Republic of Serbia - total, the coefficient of variation was 1.14% for average annual earnings and 1.24% for median annual earnings.
Table 2.3. Coefficients of variation for average and median earnings, 2014
Coefficient of variation (%)
Average annual earnings 1.14
Median annual earnings 1.24
Average monthly earnings 1.08
Median monthly earnings 1.22
Average hourly earninigs 1.08
Median hourly earnings 1.28
42
Pilot Survey on the Structure of Earnings for 2014
Low-wage earners as a proportion of all employees in the Republic of Serbia is in the range from 21.01% to 24.86%, at the confidence level of 95%.
The survey results show that at the significance level of 5% there is a statistically significant difference between hourly earnings of women and men. Earnings of women are, on average, lower than earnings of men, and gender pay gap is in the range from 6.51% to 10.93%.
Non-sampling errors, which exist regardless of whether the survey is conducted on a sample or on the entire survey population, are: coverage errors, non-response errors, measurement errors, processing errors, imputation, etc.
The correct interpretation of statistical survey results is not possible without considering both types of errors, sampling and non-sampling errors.
Tables 2.4-2.7 show estimates of coverage and non-response errors, as some of non-sampling errors that were encountered in this survey.
Coverage errors are most often the result of sampling frame imperfection. Under-coverage occurs when the frame is missing some of the units that are in the scope of the survey. On the other hand, over-coverage occurs when the frame includes units that are out-of-scope units (ineligible units).
Under-coverage errors were not calculated in this survey, but it is assumed that it had no significant effect on the results. The sampling frame was constructed using the number of employees from CRCSI as on 31 October 2014, which is the reference date of the survey. Other under-coverage errors could have occurred because of a delay in updating the SBR, for example, some newly registered enterprises or the change in their economic activity could have been missed.
Over-coverage errors were estimated on the basis of the collected data on the unit response, which were categorized in 12 classes:
less than 10 employees;
report submitted, active;
active, but refuses to submit the report;
not found (the report was not delivered);
closed, shut down;
at a standstill, not performing any business;
out of survey coverage (economic activity out of survey scope);
bankruptcy;
liquidation;
other reasons (e.g. unknown reason of non-response, organizational changes);
the report is not completely filled in;
no earnings were paid for October 2014.
Enterprises and its employees were classified as belonging to over-coverage if the response was one of the following: less than 10 employees; the enterprise closed, shut down; the enterprise is at a standstill; not performing economic activity in scope of the survey; bankruptcy, liqudation or no earnings were paid for October 2014.
Tables 2.4 and 2.5 present over-coverage errors by sections of activities and size classes.

Statistical Office of the Republic of Serbia 43
Table 2.4. Over-coverage errors by sections of activities, 2014
Section of activity CA (2010)
Over-coverage rate (%)
Enterprises Employees
Total 3.8 2.1
Mining and quarrying 9.1 4.6
Manufacturing 3.7 3.0
Electricity, gas, steam and air conditioning supply 4.4 0.5
Water supply; sewerage, waste management and remediation
activities 1.8 1.3
Construction 2.3 0.7
Wholesale and retail trade; repair of motor vehicles and
motorcycles 4.5 1.8
Transportation and storage 1.4 1.0
Accommodation and food service activities 7.8 3.6
Information and communication 2.1 1.4
Financial and insurance activities 0.0 0.0
Real estate activities 4.2 1.9
Professional, scientific and technical activities 7.6 4.6
Administrative and support service activities 8.4 4.5
Education 0.0 0.0
Human health and social work activities 1.0 0.5
Arts, entertainment and recreation 5.4 4.1
Other service activities 4.3 2.0
Table 2.5. Over-coverage errors by size classes, 2014
Size class Over-coverage rate (%)
Enterprises Employees
Total 3.8 2.1
10 to 49 employees 8.2 5.9
50 to 249 2.6 2.9
250 to 499 1.7 1.6
500 to 999 0.5 0.7
1000 or more employees 0.7 0.7
In the selected sample of enterprises, there were no over-coverage errors in sections Financial and insurance activities, and Education. The largest over-coverage errors were in the sections Mining and quarrying (9% for enterprises; 5% for employees), Administrative and support service activities (8% for enterprises; 5% for employees), Accommodation and food service activities, (8% for enterprises; 4% for employees) and Professional, scientific and technical activities (8% for enterprises; 5% for employees).
Table 2.6 shows response rates of sample units by sections of activities, and Table 2.7 by size classes. The response rate for enterprises was calculated as the ratio of the number of units that submitted the report to the sum of the units that: submitted or refused to complete the report, were not found at the given address, and the ones which did not respond for unknown reasons. The response rate for employees was calculated analogically, with the data referring to the number of completed questionnaires for persons and planned sample size for persons from the enterprise to which the employees belonged.

44
Pilot Survey on the Structure of Earnings for 2014
Table 2.6. Response rate by sections of activities, 2014
Section of activity
CA (2010)
Response rate (%)
Enterprises Employees
Total 63.3 68.5
Mining and quarrying 50.0 68.5
Manufacturing 57.8 63.6
Electricity, gas, steam and air conditioning supply 86.4 87.5
Water supply; sewerage, waste management and remediation
activities 83.6 85.4
Construction 63.1 63.6
Wholesale and retail trade; repair of motor vehicles and
motorcycles 51.0 54.3
Transportation and storage 68.6 74.3
Accommodation and food service activities 51.1 61.3
Information and communication 67.8 74.7
Financial and insurance activities 70.3 76.5
Real estate activities 87.0 92.7
Professional, scientific and technical activities 59.6 63.9
Administrative and support service activities 49.0 54.1
Education 65.2 68.2
Human health and social work activities 81.1 81.9
Arts, entertainment and recreation 67.1 70.2
Other service activities 62.2 71.0
The lowest response rates for enterprises were in sections Administrative and support service activities (49%), Mining and quarrying (50%), Wholesale and retail trade; repair of motor vehicles and motorcycles (51%) and Accommodation and food service activities (51%). The highest response rates were in sections Real estate activities (87%) and Electricity, gas, steam and air conditioning supply (86%).
The lowest response rates for employees (54%) were is sections Administrative and support service activities and Wholesale and retail trade; repair of motor vehicles and motorcycles, while the highest were in sections Real estate activities (93%) and Electricity, gas, steam and air conditioning supply (88%).
The response rates by size classes were the lowest for the enterprises with 10-49 employees (52% for enterprises and 56% for employees), while the response rates were relatively uniform in classes with 250 or more employees, about 71% for enterprises and about 72% for the employees.
Table 2.7. Response rate by size classes of enterprises, 2014
Size class Response rate (%)
Enterprises Employees
Total 63.3 68.5
10 to 49 employees 51.9 55.6
50 to 249 64.3 65.5
250 to 499 70.0 72.2
500 to 999 71.0 72.8
1000 or more employees 72.1 72.3

Statistical Office of the Republic of Serbia 45
2.4. Survey coverage
The survey refers to employees who were under an employment contract in October 2014, whether it was for a fixed or indefinite period of time, as well as employees who worked on the basis of contract on performing temporary and occasional jobs (regardless of whether they worked full-time or part-time) and who received earnings for October 2014. The employees who were not included in the survey were the ones in enterprises employing fewer than 10 employees, as well as the employees in sections Agriculture, forestry and fishing and Public administration and defence; compulsory social security.
2.5. Method, period and sources for data collection
The reporting method for data collection was applied in the survey, through the SES form. The forms were submitted by reporting units through post or in electronic form (using a web application, or by e-mail in the form of Excel tables).
The survey is conducted on a four-yearly basis.
The source for data collection in this survey were accounting and personnel records of enterprises, on the basis of which the data about the employees who were selected in the sample were filled in. The data on earnings and remunerations, as well as data on paid hours of work, were filled in based on accounting records, while the data on demographic and work characteristics of employees were filled in based on records of personnel.
2.6. Definitions of basic variables
The term employees in this survey refers to persons who were under an employment contract in October 2014, whether it was for a fixed or indefinite period of time, as well as persons who worked on the basis of contract on performing temporary and occasional jobs, regardless of whether they worked full-time or part-time.
DATA FOR THE REFERENCE YEAR (2014)
Unlike the concept of earnings, as defined in Article 105 of the Labour Law, which includes regular salary with tax and contributions paid by employees, as well as increased salary, remunerations, regular and periodic bonuses and other income to which they pay tax and contributions, this survey includes the full amount of compensation for transport costs for going to and from work.
The annual earnings include all payments to employees to which tax and contributions are to be paid. Annual earnings include: payments for work with full, shorter than full or longer than full working hours (overtime), back-dated arrears or differences in earnings, allowances for on-call, night work and shift work, work on Sundays and public holidays, bonuses, regular monthly bonuses, compensation for transport costs for going to and from work, meal allowances during work, as well as allowances for hours not worked (annual holiday leave, paid leave, public holidays, sick leave up to 30 days, leave for professional training, operational delay that is not the fault of workers).
The earnings do not include remunerations: for sick leave longer than 30 days, for time spent on business trips in the country or abroad, for accommodation and meal during work and stay on the field, for costs of funeral services, damage due to injury at work or professional diseases, nor other benefits to which tax and contributions are not to be paid. Also, the earnings do not include wages earned for work abroad.
Bonuses (bonuses which are not paid each month) are the ones paid on the basis of periodical and final accounts, thirteenth salary, allowance for annual holiday leave and other periodical payments which have the character of salary, as well as jubilee awards and severance payments to employees at the time of retirement or to employees who have been made redundant.
Compensation for transport costs for going to and from work is the total amount which the employer paid to the employee as remuneration of transport costs for going to and from work for the reference year.
46
Pilot Survey on the Structure of Earnings for 2014
Annual days of holiday leave is the total number of annual holidays, expressed in days, to which an employee is entitled in the reference year, regardless of whether the days were used or not.
Note: In calculating the average annual earnings, median annual earnings, average bonuses, average compensation for transport costs, average number of annual days of holiday leave, only the employees who worked 30 or more weeks during 2014 were taken into account. In case that employees, who received earnings for October 2014, did not work throughout the year (due to sick leave, unpaid leave, because the employee began working during October 2014, etc.), the data for the entire year were obtained by adequate adjusting. Also, in order to eliminate differences in earnings that are the result of a different number of working hours between the full-time employees and part-time employees, the earnings of the part-time employees were adjusted to the amount of earnings corresponding to full-time work.
All the mentioned variables, which were collected for the reference year, were adjusted in such a way that they correspond to the data referring to the whole year (in case that employees did not work throughout the year). Additional adjustments of the data for part-time employees were applied to annual earnings and bonuses, in order to obtain amounts which would correspond to full-time employment.
DATA FOR THE REFERENCE MONTH (OCTOBER 2014)
Monthly earnings are defined as total earnings paid for October 2014, regardless of the month in which they were paid. The earnings include bonuses paid in the reference month, earnings related to overtime, as well as special payments for shift work (including payments for night work, work on Sundays or on public holidays).
Earnings related to overtime and special payments for shift work represent the part of the total amount of earnings paid for October. In accordance with Regulation (EC) 1738/2005, the earnings related to overtime and special payments for shift work are presented separately.
Compensation for transport costs for going to and from work is the total amount which the employer paid to the employee as remuneration of transport costs for going to and from work for the reference month.
Total number of paid hours is the total number of hours for which the employee was paid in the reference month (October 2014). Paid hours include hours actually worked, hours not worked and paid overtime hours. Hours not worked are paid hours which the employee did not work due to annual holiday leave, public holidays, sick leave up to 30 days, professional training, etc.
Number of paid overtime hours is the number of paid overtime hours which the employee performed outside the contracted working hours, at the request of the employer.
Average hourly earnings are defined as the ratio of the monthly earnings paid to the employee for October 2014 and paid hours for the same month.
Note: In case that employees who received earnings for October 2014 did not work during the whole month (due to sick leave, unpaid leave, because the employee started working in the enterprise during October 2014, etc.) the data for such persons were adjusted in order to obtain the data for the whole month. Also, in order to eliminate differences in earnings that are the result of a different number of working hours between the full-time employees and part-time employees, the earnings of the part-time employees were adjusted to the amount of earnings corresponding to full-time work.
All the mentioned variables, which were collected for the reference month, were adjusted in such a way that they correspond to the data referring to the whole month (in case that employees did not work throughout the month). Additional adjustments of the data for part-time employees were applied in monthly earnings and the total number of paid hours, in order to obtain amounts which would correspond to full-time employment. Additional adjustments of the data for part-time employees were not performed for the following variables: earnings related to overtime and special payments for shift work, compensation for transport costs for going to and from work and the number of paid overtime hours.
Gender pay gap represents the difference between average hourly earnings of employed men and of employed women as a percentage of average hourly earnings of employed men.
Statistical Office of the Republic of Serbia 47
2.7. Differences in comparison to data of RAD-1 survey
In comparison to the data of RAD-1 survey, the following differences should be taken into account:
The Structure of Earnings Survey (SES) also includes the employees under contract on performing temporary and occasional jobs, while the RAD-1 survey includes only the persons under indefinite or fixed time employment contract;
The average earnings are calculated on the basis of the number of employees who received salaries, while the average earnings in the RAD-1 survey are calculated according to the number of employees based on the personnel records;
The average monthly earnings in the SES are calculated on the basis of payments made for October, while the average monthly earnings in the RAD-1 survey are calculated on the basis of payments made in the observed month, regardless of which month the payment refers to;
Due to international comparability of the data obtained by this survey, the earnings include the whole amount of transport costs for going to and from work;
The earnings of the employees who did not work throughout the year, i.e. the month, were adjusted to the whole year, i.e. whole month, while earnings of the part-time employees were adjusted in such a way that they correspond to earnings for full-time employment.
2.8. Classifications used in the survey
1. Classification of Activities (2010) which was prescribed on the basis of the Law on the Classification of Activities (”Official Gazette of the Republic of Serbia”, No 104/09) by the Government on 29 July 2009 (”Official Gazette of the Republic of Serbia”, No 54/10). This classification is comparable with the EU classification of economic activities (NACE, Rev. 2).
2. Classification of occupations - translation of the International Standard Classification of Occupations 2008 (ISCO-08), extended with certain professions from the Nomenclature of occupations (Serbian: JNZ), which is prescribed as a standard for managing data on occupations in the labour records ("Official Gazette", No 9/98).
2.9. References
1. Bethel, J. “Sample allocation in multivariate surveys”. Survey methodology, 15 (1989): 47-57.
2. Structure of Earnings Survey 2014 - Eurostat’s arrangements for implementing the Council Regulation 530/1999, the Commission Regulations 1916/2000 and 1738/2005 (http://ec.europa.eu/eurostat/cache/metadata/Annexes/earn_ses2014_esms_an1.pdf).
3. Quality Report (http://ec.europa.eu/eurostat/cache/metadata/en/earn_ses2014_esms.htm).

48
Pilot Survey on the Structure of Earnings for 2014

Statistical Office of the Republic of Serbia 49
3. Tabular presentation of data

50
Pilot Survey on the Structure of Earnings for 2014
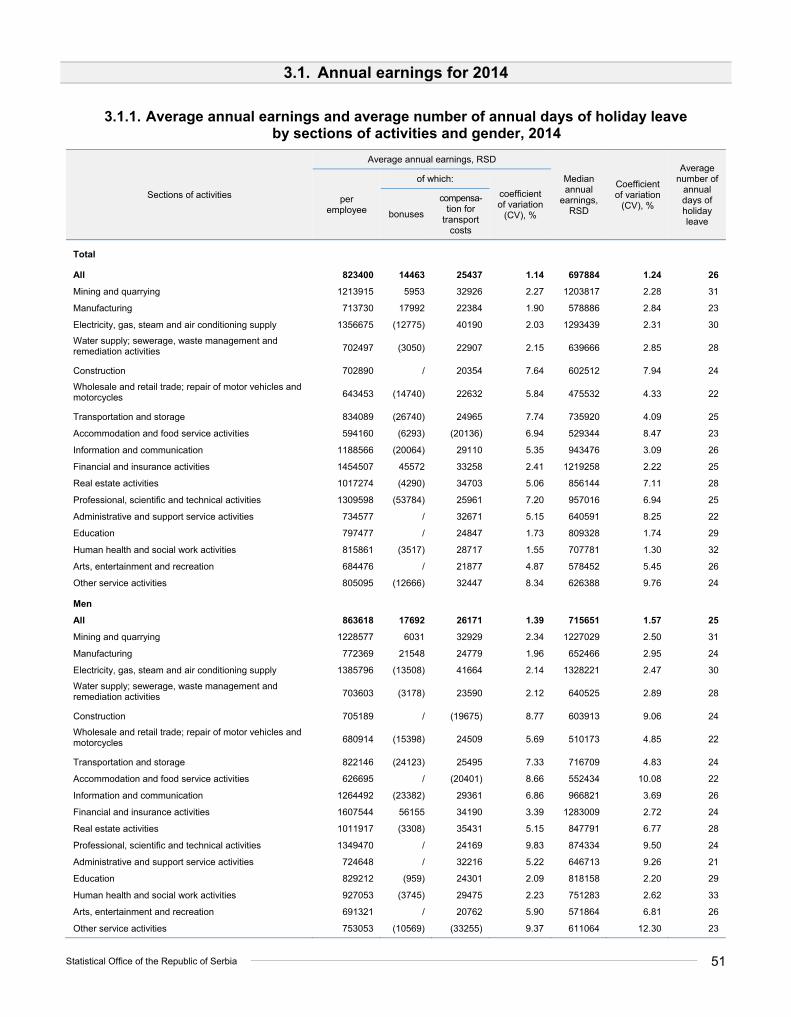
Statistical Office of the Republic of Serbia 51
3.1. Annual earnings for 2014
3.1.1. Average annual earnings and average number of annual days of holiday leave by sections of activities and gender, 2014
Sections of activities
Average annual earnings, RSD
Median annual
earnings, RSD
Coefficient of variation
(CV), %
Average number of
annual days of holiday leave
per employee
of which:
coefficient of variation
(CV), % bonuses
compensa-tion for
transport costs
Total
All 823400 14463 25437 1.14 697884 1.24 26
Mining and quarrying 1213915 5953 32926 2.27 1203817 2.28 31
Manufacturing 713730 17992 22384 1.90 578886 2.84 23
Electricity, gas, steam and air conditioning supply 1356675 (12775) 40190 2.03 1293439 2.31 30
Water supply; sewerage, waste management and remediation activities 702497 (3050) 22907 2.15 639666 2.85 28
Construction 702890 / 20354 7.64 602512 7.94 24
Wholesale and retail trade; repair of motor vehicles and motorcycles 643453 (14740) 22632 5.84 475532 4.33 22
Transportation and storage 834089 (26740) 24965 7.74 735920 4.09 25
Accommodation and food service activities 594160 (6293) (20136) 6.94 529344 8.47 23
Information and communication 1188566 (20064) 29110 5.35 943476 3.09 26
Financial and insurance activities 1454507 45572 33258 2.41 1219258 2.22 25
Real estate activities 1017274 (4290) 34703 5.06 856144 7.11 28
Professional, scientific and technical activities 1309598 (53784) 25961 7.20 957016 6.94 25
Administrative and support service activities 734577 / 32671 5.15 640591 8.25 22
Education 797477 / 24847 1.73 809328 1.74 29
Human health and social work activities 815861 (3517) 28717 1.55 707781 1.30 32
Arts, entertainment and recreation 684476 / 21877 4.87 578452 5.45 26
Other service activities 805095 (12666) 32447 8.34 626388 9.76 24
Men
All 863618 17692 26171 1.39 715651 1.57 25
Mining and quarrying 1228577 6031 32929 2.34 1227029 2.50 31
Manufacturing 772369 21548 24779 1.96 652466 2.95 24
Electricity, gas, steam and air conditioning supply 1385796 (13508) 41664 2.14 1328221 2.47 30
Water supply; sewerage, waste management and remediation activities 703603 (3178) 23590 2.12 640525 2.89 28
Construction 705189 / (19675) 8.77 603913 9.06 24
Wholesale and retail trade; repair of motor vehicles and motorcycles 680914 (15398) 24509 5.69 510173 4.85 22
Transportation and storage 822146 (24123) 25495 7.33 716709 4.83 24
Accommodation and food service activities 626695 / (20401) 8.66 552434 10.08 22
Information and communication 1264492 (23382) 29361 6.86 966821 3.69 26
Financial and insurance activities 1607544 56155 34190 3.39 1283009 2.72 24
Real estate activities 1011917 (3308) 35431 5.15 847791 6.77 28
Professional, scientific and technical activities 1349470 / 24169 9.83 874334 9.50 24
Administrative and support service activities 724648 / 32216 5.22 646713 9.26 21
Education 829212 (959) 24301 2.09 818158 2.20 29
Human health and social work activities 927053 (3745) 29475 2.23 751283 2.62 33
Arts, entertainment and recreation 691321 / 20762 5.90 571864 6.81 26
Other service activities 753053 (10569) (33255) 9.37 611064 12.30 23
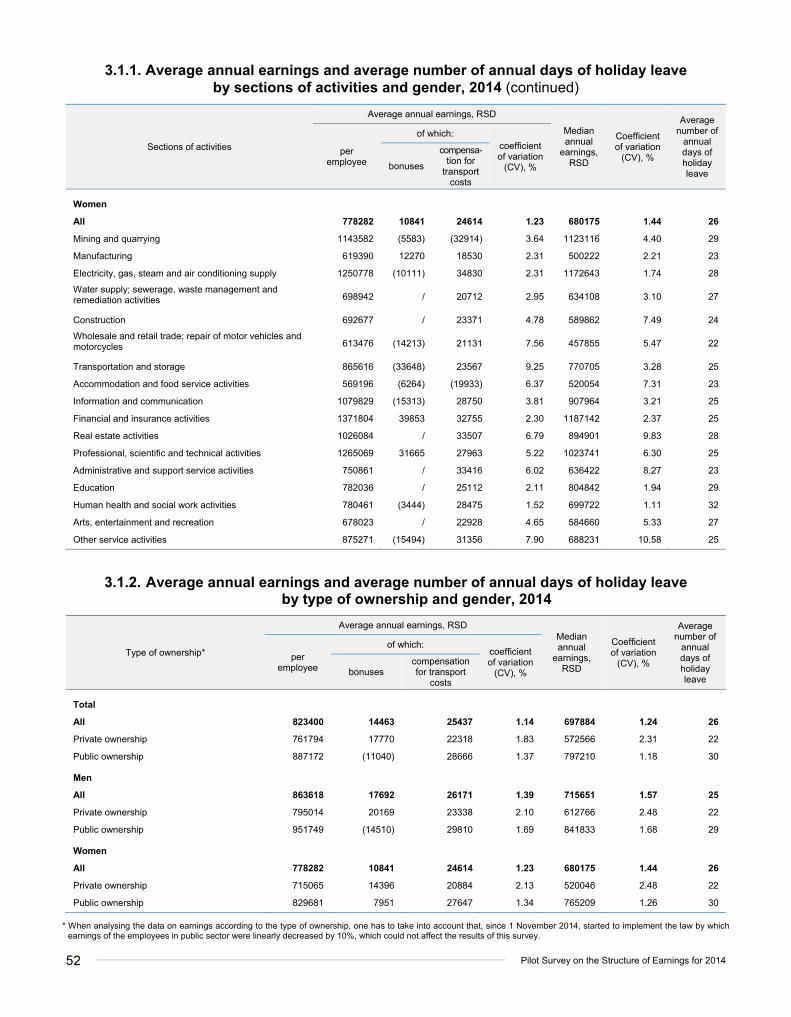
52
Pilot Survey on the Structure of Earnings for 2014
3.1.1. Average annual earnings and average number of annual days of holiday leave by sections of activities and gender, 2014 (continued)
Sections of activities
Average annual earnings, RSD
Median annual
earnings, RSD
Coefficient of variation
(CV), %
Average number of
annual days of holiday leave
per employee
of which: coefficient of variation
(CV), % bonuses
compensa-tion for
transport costs
Women
All 778282 10841 24614 1.23 680175 1.44 26
Mining and quarrying 1143582 (5583) (32914) 3.64 1123116 4.40 29
Manufacturing 619390 12270 18530 2.31 500222 2.21 23
Electricity, gas, steam and air conditioning supply 1250778 (10111) 34830 2.31 1172643 1.74 28
Water supply; sewerage, waste management and remediation activities 698942 / 20712 2.95 634108 3.10 27
Construction 692677 / 23371 4.78 589862 7.49 24
Wholesale and retail trade; repair of motor vehicles and motorcycles 613476 (14213) 21131 7.56 457855 5.47 22
Transportation and storage 865616 (33648) 23567 9.25 770705 3.28 25
Accommodation and food service activities 569196 (6264) (19933) 6.37 520054 7.31 23
Information and communication 1079829 (15313) 28750 3.81 907964 3.21 25
Financial and insurance activities 1371804 39853 32755 2.30 1187142 2.37 25
Real estate activities 1026084 / 33507 6.79 894901 9.83 28
Professional, scientific and technical activities 1265069 31665 27963 5.22 1023741 6.30 25
Administrative and support service activities 750861 / 33416 6.02 636422 8.27 23
Education 782036 / 25112 2.11 804842 1.94 29
Human health and social work activities 780461 (3444) 28475 1.52 699722 1.11 32
Arts, entertainment and recreation 678023 / 22928 4.65 584660 5.33 27
Other service activities 875271 (15494) 31356 7.90 688231 10.58 25
3.1.2. Average annual earnings and average number of annual days of holiday leave by type of ownership and gender, 2014
Type of ownership*
Average annual earnings, RSD Median annual
earnings, RSD
Coefficient of variation
(CV), %
Average number of
annual days of holiday leave
per employee
of which: coefficient of variation
(CV), % bonuses compensation for transport
costs
Total
All 823400 14463 25437 1.14 697884 1.24 26
Private ownership 761794 17770 22318 1.83 572566 2.31 22
Public ownership 887172 (11040) 28666 1.37 797210 1.18 30
Men
All 863618 17692 26171 1.39 715651 1.57 25
Private ownership 795014 20169 23338 2.10 612766 2.48 22
Public ownership 951749 (14510) 29810 1.69 841833 1.68 29
Women
All 778282 10841 24614 1.23 680175 1.44 26
Private ownership 715065 14396 20884 2.13 520046 2.48 22
Public ownership 829681 7951 27647 1.34 765209 1.26 30
* When analysing the data on earnings according to the type of ownership, one has to take into account that, since 1 November 2014, started to implement the law by which earnings of the employees in public sector were linearly decreased by 10%, which could not affect the results of this survey.

Statistical Office of the Republic of Serbia 53
3.1.3. Average annual earnings and average number of annual days of holiday leave by size of the enterprise and gender, 2014
Size of the enterprise
Average annual earnings, RSD Median annual
earnings, RSD
Coefficient of variation
(CV), %
Average number of
annual days of holiday leave
per employee
of which: coefficient of variation
(CV), % bonuses compensation for transport
costs
Total
All 823400 14463 25437 1.14 697884 1.24 26
10⎼49 employees 658953 / 18705 4.14 500222 4.18 23
50⎼249 760631 (12651) 22308 2.90 655274 2.69 26
250⎼499 853864 18472 26429 1.69 697472 1.51 26
500⎼999 911928 17535 29401 1.52 754713 1.90 27
1000 or more employees 970252 18095 32102 1.10 835127 1.64 27
Men
All 863618 17692 26171 1.39 715651 1.57 25
10⎼49 employees 657874 / 15427 5.18 462576 4.04 23
50⎼249 794769 (16725) 25304 3.63 662572 3.16 25
250⎼499 904160 23383 27450 1.71 731941 1.90 25
500⎼999 976743 21950 29188 1.96 790864 2.63 26
1000 or more employees 1030665 19593 33205 0.93 919068 1.09 27
Women
All 778282 10841 24614 1.23 680175 1.44 26
10⎼49 employees 660209 / 22523 4.21 556103 5.98 24
50⎼249 723733 (8247) 19069 2.71 647992 3.59 26
250⎼499 797516 12970 25286 2.30 663935 1.94 27
500⎼999 854806 13645 29588 1.45 728667 1.60 28
1000 or more employees 893735 16198 30704 1.92 749470 1.93 28
3.1.4. Average annual earnings and average number of annual days of holiday leave by occupational groups and gender, 2014
Occupational groups
Average annual earnings, RSD Median annual
earnings, RSD
Coefficient of variation
(CV), %
Average number of
annual days of holiday leave
per employee
of which: coefficient of variation
(CV), % bonuses compensation for transport
costs
Total
All 823400 14463 25437 1.14 697884 1.24 26
Managers 1481684 (47092) 22002 3.50 1083618 3.79 25
Professionals 1126693 14879 27796 1.39 917691 1.75 29
Technicians and associate professionals 901948 16182 29209 1.54 768273 1.18 28
Clerical support workers 782254 18140 27690 2.28 706995 1.70 25
Service and sales workers 552311 (7171) 20955 3.50 452752 3.10 22
Skilled agricultural, forestry and fishery workers (834114) / 34085 20.75 631923 6.82 25
Craft and related trades workers 662740 (9685) 22258 2.29 526163 2.87 24
Plant and machine operators and assemblers 712595 (13231) 25000 2.17 649143 2.20 25
Elementary occupations 549393 (7511) 23940 2.44 472289 2.50 25
Men
All 863618 17692 26171 1.39 715651 1.57 25
Managers 1569250 (57733) 20653 4.24 1122128 4.34 25
Professionals 1242647 21637 29033 2.20 1005718 3.14 28
Technicians and associate professionals 997780 22102 29764 2.48 870307 1.93 27
Clerical support workers 806800 20752 29351 2.87 724169 2.63 25
Service and sales workers 599115 (8541) 23667 3.43 493900 3.67 23
Skilled agricultural, forestry and fishery workers (953645) / (38634) 25.42 649204 7.07 25
Craft and related trades workers 727502 (10913) 24621 2.54 615962 3.95 25
Plant and machine operators and assemblers 728505 (13835) 24969 2.30 663837 2.27 25
Elementary occupations 639312 (11132) 25940 3.41 550726 3.19 25
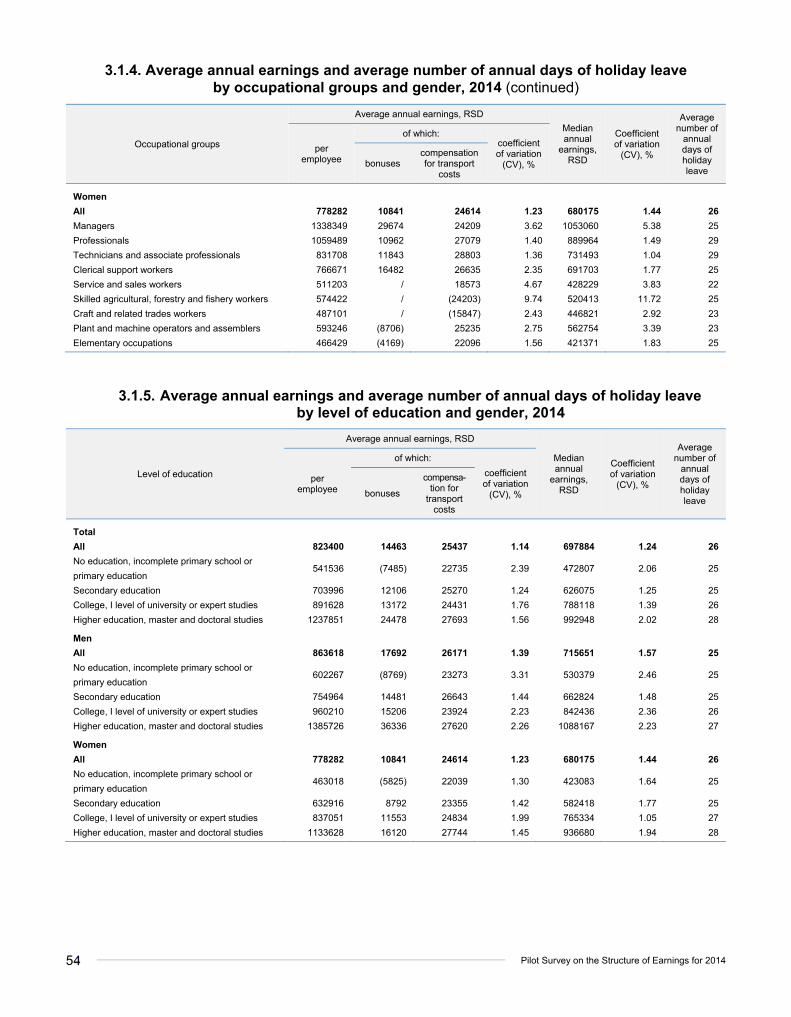
54
Pilot Survey on the Structure of Earnings for 2014
3.1.4. Average annual earnings and average number of annual days of holiday leave by occupational groups and gender, 2014 (continued)
Occupational groups
Average annual earnings, RSD
Median annual
earnings, RSD
Coefficient of variation
(CV), %
Average number of
annual days of holiday leave
per employee
of which: coefficient of variation
(CV), % bonuses compensation for transport
costs
Women
All 778282 10841 24614 1.23 680175 1.44 26
Managers 1338349 29674 24209 3.62 1053060 5.38 25
Professionals 1059489 10962 27079 1.40 889964 1.49 29
Technicians and associate professionals 831708 11843 28803 1.36 731493 1.04 29
Clerical support workers 766671 16482 26635 2.35 691703 1.77 25
Service and sales workers 511203 / 18573 4.67 428229 3.83 22
Skilled agricultural, forestry and fishery workers 574422 / (24203) 9.74 520413 11.72 25
Craft and related trades workers 487101 / (15847) 2.43 446821 2.92 23
Plant and machine operators and assemblers 593246 (8706) 25235 2.75 562754 3.39 23
Elementary occupations 466429 (4169) 22096 1.56 421371 1.83 25
3.1.5. Average annual earnings and average number of annual days of holiday leave by level of education and gender, 2014
Level of education
Average annual earnings, RSD
Median annual
earnings, RSD
Coefficient of variation
(CV), %
Average number of
annual days of holiday leave
per employee
of which:
coefficient of variation
(CV), % bonuses
compensa-tion for
transport costs
Total
All 823400 14463 25437 1.14 697884 1.24 26
No education, incomplete primary school or
primary education 541536 (7485) 22735 2.39 472807 2.06 25
Secondary education 703996 12106 25270 1.24 626075 1.25 25
College, I level of university or expert studies 891628 13172 24431 1.76 788118 1.39 26
Higher education, master and doctoral studies 1237851 24478 27693 1.56 992948 2.02 28
Men
All 863618 17692 26171 1.39 715651 1.57 25
No education, incomplete primary school or
primary education 602267 (8769) 23273 3.31 530379 2.46 25
Secondary education 754964 14481 26643 1.44 662824 1.48 25
College, I level of university or expert studies 960210 15206 23924 2.23 842436 2.36 26
Higher education, master and doctoral studies 1385726 36336 27620 2.26 1088167 2.23 27
Women
All 778282 10841 24614 1.23 680175 1.44 26
No education, incomplete primary school or
primary education 463018 (5825) 22039 1.30 423083 1.64 25
Secondary education 632916 8792 23355 1.42 582418 1.77 25
College, I level of university or expert studies 837051 11553 24834 1.99 765334 1.05 27
Higher education, master and doctoral studies 1133628 16120 27744 1.45 936680 1.94 28

Statistical Office of the Republic of Serbia 55
3.1.6. Average annual earnings and average number of annual days of holiday leave by age groups and gender, 2014
Age groups
Average annual earnings, RSD Median annual
earnings, RSD
Coefficient of variation
(CV), %
Average number of
annual days of holiday leave
per employee
of which: coefficient of variation
(CV), % bonuses compensation for transport
costs
Total
All 823400 14463 25437 1.14 697884 1.24 26
15⎼29 years 664068 11092 23672 1.72 595254 2.67 23
30⎼39 819205 15463 25192 1.48 689665 1.58 25
40⎼49 834007 14286 25729 1.24 704826 1.53 26
50⎼59 865820 (14583) 25998 1.87 742777 1.58 28
60 or more years 995136 (17700) 27028 2.40 842394 2.47 28
Men
All 863618 17692 26171 1.39 715651 1.57 25
15⎼29 years 683633 (13858) 23755 1.92 602149 2.89 22
30⎼39 865268 19091 25645 2.05 709259 2.27 24
40⎼49 885285 18267 26521 1.62 726841 1.79 26
50⎼59 904715 (17290) 27439 2.10 762709 2.21 27
60 or more years 992237 (18424) 27370 2.97 827543 3.20 28
Women
All 778282 10841 24614 1.23 680175 1.44 26
15⎼29 years 638101 7421 23562 2.67 584997 4.31 23
30⎼39 769157 11521 24699 1.56 669845 1.75 25
40⎼49 783835 10391 24955 1.40 680252 1.93 27
50⎼59 823205 11617 24420 2.03 724598 1.69 28
60 or more years 1002904 (15757) 26113 3.48 878216 3.24 29
3.1.7. Average annual earnings and average number of annual days of holiday leave by length of service in the enterprise and gender, 2014
Length of service in the enterprise
Average annual earnings, RSD Median annual
earnings, RSD
Coefficient of variation (CV), %
Average number of
annual days of holiday leave
per employee
of which: coefficient of
variation (CV), % bonuses
compensation for transport
costs
Total
All 823400 14463 25437 1.14 697884 1.24 26
Less than one year 659701 (8509) 21301 3.19 522458 3.93 22
1⎼5 730010 13567 22479 1.93 589517 2.44 24
6⎼9 867976 16099 25722 1.70 727739 2.07 26
10⎼14 901276 14783 26912 1.91 784178 1.78 27
15⎼19 896890 12189 29691 1.41 821802 2.16 29
20⎼29 933586 (15497) 28341 2.91 808945 2.06 29
30 or more years 937125 (22181) 31424 2.82 811001 2.00 30
Men
All 863618 17692 26171 1.39 715651 1.57 25
Less than one year 674346 (11080) 23293 3.42 542714 4.24 22
1⎼5 772809 17121 23119 2.39 619039 2.80 23
6⎼9 911772 19293 25980 2.23 749154 2.71 25
10⎼14 942317 19162 25999 2.54 800552 2.29 26
15⎼19 938844 17107 30313 1.81 848327 2.35 28
20⎼29 995745 (18358) 30010 3.71 838235 3.19 28
30 or more years 969513 (20643) 34301 2.32 854358 2.54 29
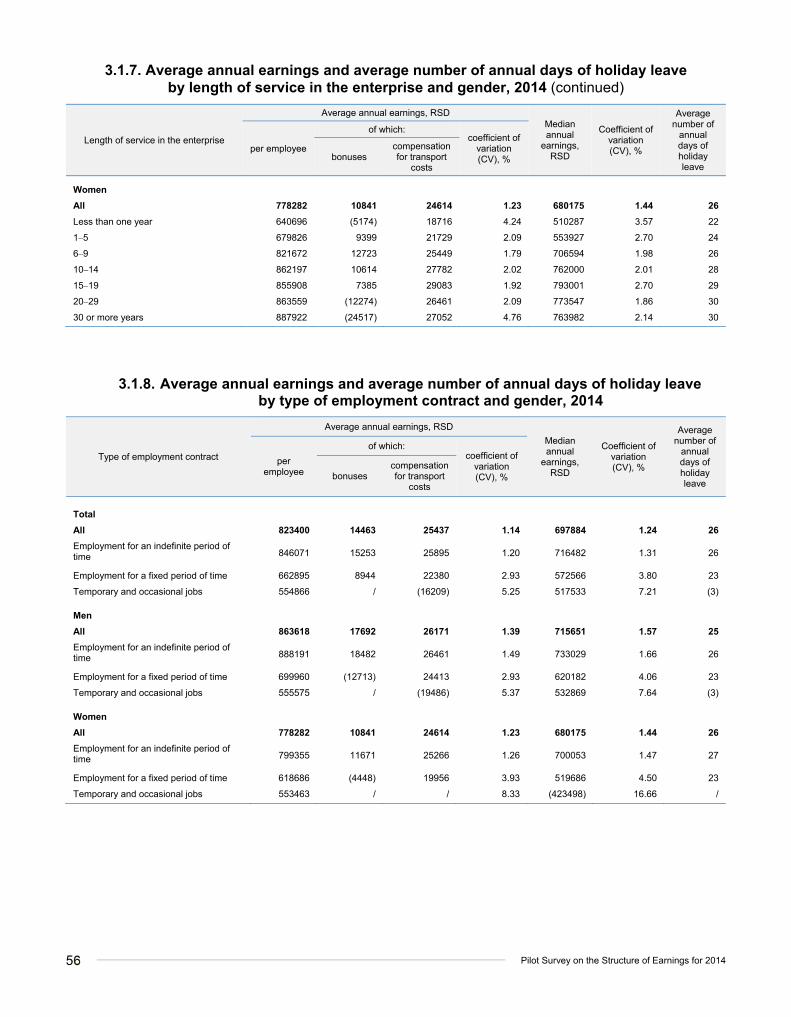
56
Pilot Survey on the Structure of Earnings for 2014
3.1.7. Average annual earnings and average number of annual days of holiday leave by length of service in the enterprise and gender, 2014 (continued)
Length of service in the enterprise
Average annual earnings, RSD Median annual
earnings, RSD
Coefficient of variation (CV), %
Average number of
annual days of holiday leave
per employee
of which: coefficient of
variation (CV), % bonuses
compensation for transport
costs
Women
All 778282 10841 24614 1.23 680175 1.44 26
Less than one year 640696 (5174) 18716 4.24 510287 3.57 22
1⎼5 679826 9399 21729 2.09 553927 2.70 24
6⎼9 821672 12723 25449 1.79 706594 1.98 26
10⎼14 862197 10614 27782 2.02 762000 2.01 28
15⎼19 855908 7385 29083 1.92 793001 2.70 29
20⎼29 863559 (12274) 26461 2.09 773547 1.86 30
30 or more years 887922 (24517) 27052 4.76 763982 2.14 30
3.1.8. Average annual earnings and average number of annual days of holiday leave by type of employment contract and gender, 2014
Type of employment contract
Average annual earnings, RSD
Median annual
earnings, RSD
Coefficient of variation (CV), %
Average number of
annual days of holiday leave
per employee
of which: coefficient of
variation (CV), % bonuses
compensation for transport
costs
Total
All 823400 14463 25437 1.14 697884 1.24 26
Employment for an indefinite period of time 846071 15253 25895 1.20 716482 1.31 26
Employment for a fixed period of time 662895 8944 22380 2.93 572566 3.80 23
Temporary and occasional jobs 554866 / (16209) 5.25 517533 7.21 (3)
Men
All 863618 17692 26171 1.39 715651 1.57 25
Employment for an indefinite period of time 888191 18482 26461 1.49 733029 1.66 26
Employment for a fixed period of time 699960 (12713) 24413 2.93 620182 4.06 23
Temporary and occasional jobs 555575 / (19486) 5.37 532869 7.64 (3)
Women
All 778282 10841 24614 1.23 680175 1.44 26
Employment for an indefinite period of time 799355 11671 25266 1.26 700053 1.47 27
Employment for a fixed period of time 618686 (4448) 19956 3.93 519686 4.50 23
Temporary and occasional jobs 553463 / / 8.33 (423498) 16.66 /

Statistical Office of the Republic of Serbia 57
3.2. Monthly earnings for October 2014
3.2.1. Average monthly earnings by sections of activities and gender, October 2014
Sections of activities
Average monthly earnings, RSD
Median monthly
earnings, RSD
Coefficient of variation (CV), %
per employee
of which:
coefficient of variation (CV), %
earnings related to overtime
special payments for shift
work
compensation for transport
costs
Total
All 67309 831 820 2145 1.08 57002 1.22
Mining and quarrying 104158 / 5493 2700 2.18 103411 2.37
Manufacturing 58627 1054 935 1944 1.90 47803 2.50
Electricity, gas, steam and air conditioning supply 119843 (1510) 2884 3802 2.16 115055 2.03
Water supply; sewerage, waste management and remediation activities
57568 608 (699) 1913 2.64 52042 3.67
Construction 57021 / (185) (1722) 7.15 46553 8.30
Wholesale and retail trade; repair of motor vehicles and motorcycles
51661 (281) (154) 1752 5.04 38948 3.56
Transportation and storage 67662 / 1043 1970 6.83 60483 3.49
Accommodation and food service activities 49312 / / (1558) 7.84 42178 11.03
Information and communication 100271 (203) (385) 2503 5.74 80900 3.75
Financial and insurance activities 114461 / / 2787 2.32 93417 2.17
Real estate activities 81593 / / 2495 5.48 69174 7.33
Professional, scientific and technical activities 104341 / / 2050 6.41 78387 6.67
Administrative and support service activities 58826 (340) 938 2483 4.49 51350 5.25
Education 65104 / / 2199 1.31 67205 1.43
Human health and social work activities 67601 1633 1374 2571 1.48 58786 1.14
Arts, entertainment and recreation 56957 / / 1730 5.35 47036 5.03
Other service activities 60513 / / 2135 6.54 48361 8.86
Men
All 70537 1078 1161 2186 1.35 58006 1.58
Mining and quarrying 105327 / 6130 2742 2.31 106376 2.27
Manufacturing 63415 1165 1235 2150 1.93 52369 2.92
Electricity, gas, steam and air conditioning supply 122143 (1762) 3676 3953 2.25 118016 1.98
Water supply; sewerage, waste management and remediation activities
57692 708 (872) 1956 2.69 51960 3.72
Construction 57024 / (213) (1657) 8.15 46538 9.70
Wholesale and retail trade; repair of motor vehicles and motorcycles
55066 (342) / 1877 5.27 41605 4.71
Transportation and storage 67143 / 1292 1956 6.61 59260 3.96
Accommodation and food service activities 51558 / / (1638) 8.68 43945 11.92
Information and communication 106708 (251) (541) 2484 6.89 83112 4.44
Financial and insurance activities 125118 / / 2823 3.18 99255 2.51
Real estate activities 81746 / / 2601 5.72 67395 6.73
Professional, scientific and technical activities 106161 / / 1892 8.90 70901 9.60
Administrative and support service activities 57915 (373) 1245 2443 4.78 51240 7.03
Education 67644 / / 2166 2.04 66751 2.34
Human health and social work activities 75951 3264 2076 2651 2.21 61374 2.31
Arts, entertainment and recreation 57856 / / 1612 6.48 47036 6.56
Other service activities 55839 / / (2186) 8.01 (45993) 20.78

58
Pilot Survey on the Structure of Earnings for 2014
3.2.1. Average monthly earnings by sections of activities and gender, October 2014 (continued)
Sections of activities
Average monthly earnings, RSD
Median monthly
earnings, RSD
Coefficient of variation (CV), %
per employee
of which:
coefficient of variation (CV), %
earnings related to overtime
special payments for shift
work
compensation for transport
costs
Women
All 63651 553 435 2099 1.14 56057 1.39
Mining and quarrying 98599 / (2463) 2501 3.48 99287 3.60
Manufacturing 51060 (878) 461 1619 2.28 42020 2.85
Electricity, gas, steam and air conditioning supply 111819 / / 3275 2.46 106067 2.11
Water supply; sewerage, waste management and remediation activities
57172 (288) / 1772 3.22 52657 4.48
Construction 57008 (371) / 2038 4.86 46777 7.63
Wholesale and retail trade; repair of motor vehicles and motorcycles
48852 (230) (92) 1650 6.62 37058 5.09
Transportation and storage 69067 / (367) 2007 7.99 61678 3.10
Accommodation and food service activities 47665 / / (1499) 7.97 41656 11.34
Information and communication 90932 / (159) 2531 4.48 78093 3.81
Financial and insurance activities 108648 / / 2767 2.35 90196 2.29
Real estate activities 81336 - / 2318 6.37 72753 9.91
Professional, scientific and technical activities 102297 / / 2229 4.97 83988 5.85
Administrative and support service activities 60422 / / 2554 5.18 51682 5.94
Education 63891 / / 2215 1.52 67352 1.42
Human health and social work activities 64996 1124 1155 2546 1.41 58316 1.02
Arts, entertainment and recreation 56124 / / 1840 5.00 47076 4.68
Other service activities 68426 / / (2048) 5.06 58076 9.43
3.2.2. Average monthly earnings by type of ownership and gender, October 2014
Type of ownership*
Average monthly earnings, RSD
Median monthly
earnings, RSD
Coefficient of variation (CV), %
per employee
of which:
coefficient of variation (CV), %
earnings related to overtime
special payments for shift
work
compensation for transport
costs
Total
All 67309 831 820 2145 1.08 57002 1.22
Private ownership 61860 (716) 523 1802 1.76 46204 2.11
Public ownership 73387 960 1152 2529 1.23 66125 1.02
Men
All 70537 1078 1161 2186 1.35 58006 1.58
Private ownership 64552 (889) 700 1866 2.03 48572 2.34
Public ownership 78881 1341 1803 2632 1.59 69334 1.57
Women
All 63651 553 435 2099 1.14 56057 1.39
Private ownership 58040 (472) 273 1711 2.00 43079 2.46
Public ownership 68527 623 576 2437 1.13 63997 1.11
* When analysing the data on earnings according to the type of ownership, one has to take into account that, since 1 November 2014, started to implement the law by which earnings of the employees in public sector were linearly decreased by 10%, which could not affect the results of this survey.

Statistical Office of the Republic of Serbia 59
3.2.3. Average monthly earnings by size of the enterprise and gender, October 2014
Size of the enterprise
Average monthly earnings, RSD
Median monthly
earnings, RSD
Coefficient of variation (CV), %
per employee
of which:
coefficient of variation (CV), %
earnings related to overtime
special payments for shift
work
compensation for transport
costs
Total
All 67309 831 820 2145 1.08 57002 1.22
10⎼49 employees 53098 (120) / 1504 3.71 40495 3.98
50⎼249 62840 (730) (352) 1857 2.67 54054 2.79
250⎼499 69762 1149 751 2234 1.69 57236 1.54
500⎼999 74999 1224 1174 2535 1.59 61179 1.69
1000 or more employees 79962 1215 1873 2818 1.10 67960 1.55
Men
All 70537 1078 1161 2186 1.35 58006 1.58
10⎼49 employees 52381 / / 1254 4.61 37004 3.08
50⎼249 65877 / (485) 2065 3.43 54380 3.39
250⎼499 73665 1389 938 2267 1.72 60008 1.84
500⎼999 80691 1716 1428 2473 2.15 64147 2.62
1000 or more employees 85437 1474 2750 2934 0.96 74110 1.25
Women
All 63651 553 435 2099 1.14 56057 1.39
10⎼49 employees 53976 / / 1810 3.77 45368 5.85
50⎼249 59556 / (208) 1633 2.43 53341 3.89
250⎼499 65323 877 538 2197 2.27 54649 1.92
500⎼999 69999 791 952 2590 1.43 59407 1.33
1000 or more employees 73072 890 769 2671 1.85 61287 1.65
3.2.4. Average monthly earnings by occupational groups and gender, October 2014
Occupational groups
Average monthly earnings, RSD
Median monthly
earnings, RSD
Coefficient of variation (CV), %
per employee
of which:
coefficient of variation (CV), %
earnings related to overtime
special payments for shift
work
compensation for transport
costs
Total
All 67309 831 820 2145 1.08 57002 1.22
Managers 121372 (590) (181) 1875 3.27 89413 3.39
Professionals 93106 1266 588 2489 1.50 75765 1.17
Technicians and associate professionals 74240 775 953 2489 1.49 63715 1.14
Clerical support workers 63995 / 400 2336 1.97 57661 1.46
Service and sales workers 45432 (214) 571 1662 3.08 37109 2.86
Skilled agricultural, forestry and fishery workers (71159) / / 2787 19.78 53409 6.84
Craft and related trades workers 55094 1280 972 1875 2.27 44832 2.58
Plant and machine operators and assemblers 58691 925 1757 2038 2.15 51505 2.75
Elementary occupations 44975 / 768 1983 2.28 38726 2.83
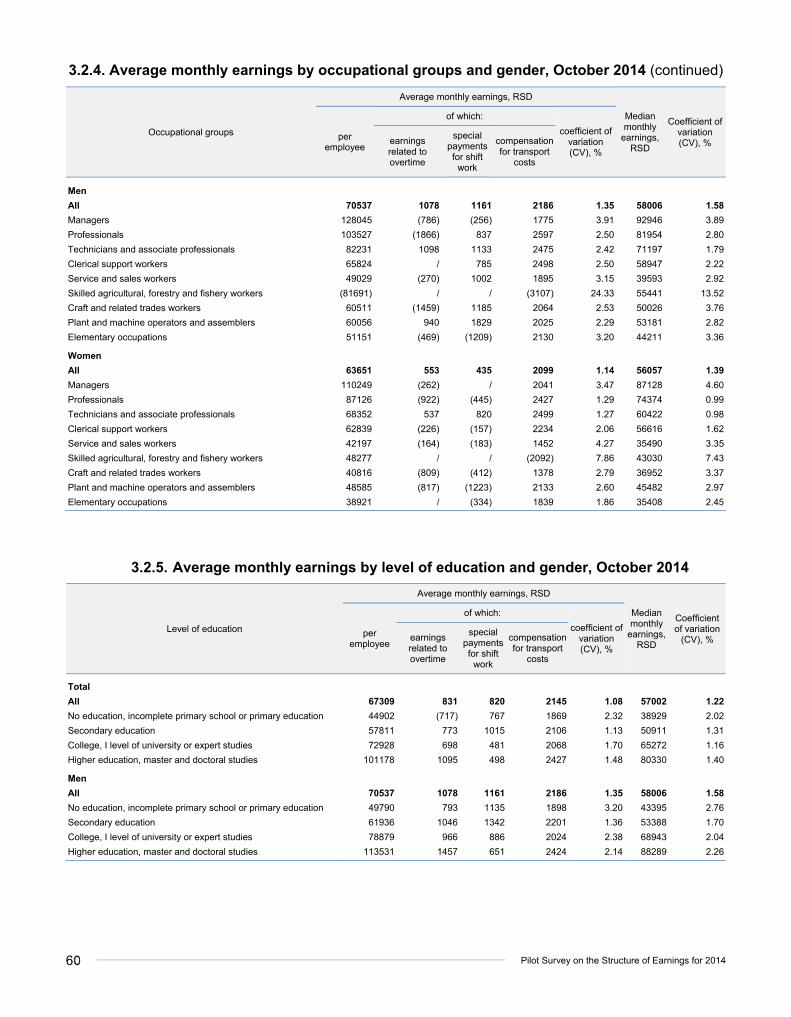
60
Pilot Survey on the Structure of Earnings for 2014
3.2.4. Average monthly earnings by occupational groups and gender, October 2014 (continued)
Occupational groups
Average monthly earnings, RSD
Median monthly
earnings, RSD
Coefficient of variation (CV), %
per employee
of which:
coefficient of variation (CV), %
earnings related to overtime
special payments for shift
work
compensation for transport
costs
Men
All 70537 1078 1161 2186 1.35 58006 1.58
Managers 128045 (786) (256) 1775 3.91 92946 3.89
Professionals 103527 (1866) 837 2597 2.50 81954 2.80
Technicians and associate professionals 82231 1098 1133 2475 2.42 71197 1.79
Clerical support workers 65824 / 785 2498 2.50 58947 2.22
Service and sales workers 49029 (270) 1002 1895 3.15 39593 2.92
Skilled agricultural, forestry and fishery workers (81691) / / (3107) 24.33 55441 13.52
Craft and related trades workers 60511 (1459) 1185 2064 2.53 50026 3.76
Plant and machine operators and assemblers 60056 940 1829 2025 2.29 53181 2.82
Elementary occupations 51151 (469) (1209) 2130 3.20 44211 3.36
Women
All 63651 553 435 2099 1.14 56057 1.39
Managers 110249 (262) / 2041 3.47 87128 4.60
Professionals 87126 (922) (445) 2427 1.29 74374 0.99
Technicians and associate professionals 68352 537 820 2499 1.27 60422 0.98
Clerical support workers 62839 (226) (157) 2234 2.06 56616 1.62
Service and sales workers 42197 (164) (183) 1452 4.27 35490 3.35
Skilled agricultural, forestry and fishery workers 48277 / / (2092) 7.86 43030 7.43
Craft and related trades workers 40816 (809) (412) 1378 2.79 36952 3.37
Plant and machine operators and assemblers 48585 (817) (1223) 2133 2.60 45482 2.97
Elementary occupations 38921 / (334) 1839 1.86 35408 2.45
3.2.5. Average monthly earnings by level of education and gender, October 2014
Level of education
Average monthly earnings, RSD
Median monthly
earnings, RSD
Coefficient of variation
(CV), % per
employee
of which:
coefficient of variation (CV), %
earnings related to overtime
special payments for shift
work
compensation for transport
costs
Total
All 67309 831 820 2145 1.08 57002 1.22
No education, incomplete primary school or primary education 44902 (717) 767 1869 2.32 38929 2.02
Secondary education 57811 773 1015 2106 1.13 50911 1.31
College, I level of university or expert studies 72928 698 481 2068 1.70 65272 1.16
Higher education, master and doctoral studies 101178 1095 498 2427 1.48 80330 1.40
Men
All 70537 1078 1161 2186 1.35 58006 1.58
No education, incomplete primary school or primary education 49790 793 1135 1898 3.20 43395 2.76
Secondary education 61936 1046 1342 2201 1.36 53388 1.70
College, I level of university or expert studies 78879 966 886 2024 2.38 68943 2.04
Higher education, master and doctoral studies 113531 1457 651 2424 2.14 88289 2.26
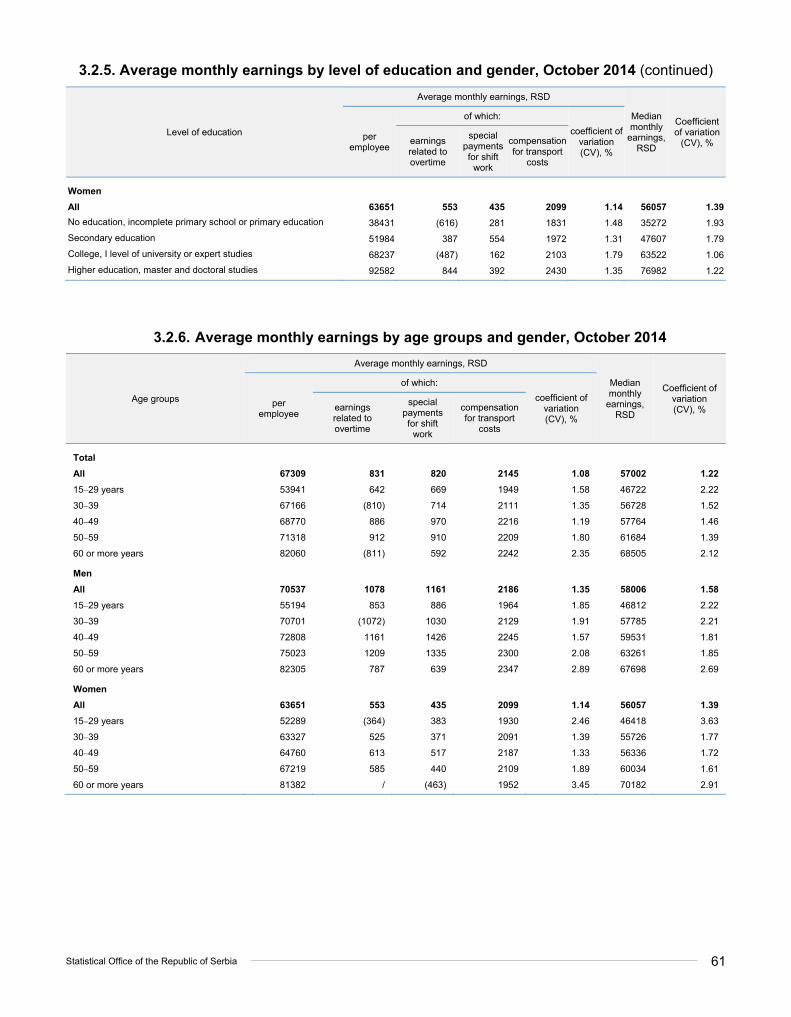
Statistical Office of the Republic of Serbia 61
3.2.5. Average monthly earnings by level of education and gender, October 2014 (continued)
Level of education
Average monthly earnings, RSD
Median monthly
earnings, RSD
Coefficient of variation
(CV), % per
employee
of which:
coefficient of variation (CV), %
earnings related to overtime
special payments for shift
work
compensation for transport
costs
Women
All 63651 553 435 2099 1.14 56057 1.39
No education, incomplete primary school or primary education 38431 (616) 281 1831 1.48 35272 1.93
Secondary education 51984 387 554 1972 1.31 47607 1.79
College, I level of university or expert studies 68237 (487) 162 2103 1.79 63522 1.06
Higher education, master and doctoral studies 92582 844 392 2430 1.35 76982 1.22
3.2.6. Average monthly earnings by age groups and gender, October 2014
Age groups
Average monthly earnings, RSD
Median monthly
earnings, RSD
Coefficient of variation (CV), %
per employee
of which:
coefficient of variation (CV), %
earnings related to overtime
special payments for shift
work
compensation for transport
costs
Total
All 67309 831 820 2145 1.08 57002 1.22
15⎼29 years 53941 642 669 1949 1.58 46722 2.22
30⎼39 67166 (810) 714 2111 1.35 56728 1.52
40⎼49 68770 886 970 2216 1.19 57764 1.46
50⎼59 71318 912 910 2209 1.80 61684 1.39
60 or more years 82060 (811) 592 2242 2.35 68505 2.12
Men
All 70537 1078 1161 2186 1.35 58006 1.58
15⎼29 years 55194 853 886 1964 1.85 46812 2.22
30⎼39 70701 (1072) 1030 2129 1.91 57785 2.21
40⎼49 72808 1161 1426 2245 1.57 59531 1.81
50⎼59 75023 1209 1335 2300 2.08 63261 1.85
60 or more years 82305 787 639 2347 2.89 67698 2.69
Women
All 63651 553 435 2099 1.14 56057 1.39
15⎼29 years 52289 (364) 383 1930 2.46 46418 3.63
30⎼39 63327 525 371 2091 1.39 55726 1.77
40⎼49 64760 613 517 2187 1.33 56336 1.72
50⎼59 67219 585 440 2109 1.89 60034 1.61
60 or more years 81382 / (463) 1952 3.45 70182 2.91

62
Pilot Survey on the Structure of Earnings for 2014
3.2.7. Average monthly earnings by length of service in the enterprise and gender, October 2014
Length of service in the enterprise
Average monthly earnings, RSD
Median monthly
earnings, RSD
Coefficient of variation (CV), %
per employee
of which: coefficient of
variation (CV), %
earnings related to overtime
special payments for
shift work
compensation for transport
costs
Total
All 67309 831 820 2145 1.08 57002 1.22
Less than one year 54211 (775) 358 1570 3.20 42778 2.50
1⎼5 60595 686 554 1958 1.84 48837 2.20
6⎼9 72323 (938) 744 2232 1.60 60812 1.92
10⎼14 74432 791 989 2318 1.80 65410 1.75
15⎼19 74684 843 1191 2637 1.34 67271 1.88
20⎼29 77364 1027 1567 2440 2.71 66803 1.84
30 or more years 77942 1185 1421 2694 2.54 66663 1.61
Men
All 70537 1078 1161 2186 1.35 58006 1.58
Less than one year 55586 (787) 462 1646 3.65 43146 2.96
1⎼5 64068 (916) 772 2008 2.29 50615 2.63
6⎼9 76049 (1307) 1011 2243 2.12 62375 2.55
10⎼14 77808 1063 1470 2189 2.45 66785 2.20
15⎼19 78857 1145 1842 2723 1.75 70637 2.33
20⎼29 83154 1332 2304 2555 3.59 69656 2.74
30 or more years 81348 (1511) 1956 2921 2.22 71078 2.29
Women
All 63651 553 435 2099 1.14 56057 1.39
Less than one year 52308 / 213 1466 3.21 42275 3.32
1⎼5 56582 420 301 1900 2.04 46016 2.65
6⎼9 68431 553 (465) 2220 1.70 59638 2.15
10⎼14 71250 535 535 2440 1.88 64131 1.90
15⎼19 70616 (548) 557 2553 1.76 65099 2.34
20⎼29 70907 686 745 2312 1.82 63997 1.55
30 or more years 72753 (690) 605 2347 4.29 63812 1.78
3.2.8. Average monthly earnings by type of employment contract and gender, October 2014
Type of employment contract
Average monthly earnings, RSD Median monthly
earnings, RSD
Coefficient of variation
(CV), % per
employee
of which: coefficient of
variation (CV), %
earnings related to overtime
special payments for
shift work
compensation for transport
costs
Total
All 67309 831 820 2145 1.08 57002 1.22
Employment for an indefinite period of time 70096 860 890 2227 1.18 59388 1.23
Employment for a fixed period of time 53558 (694) 489 1775 2.32 45315 2.95
Temporary and occasional jobs 46512 / / (1066) 4.39 42360 8.64
Men
All 70537 1078 1161 2186 1.35 58006 1.58
Employment for an indefinite period of time 73717 1141 1269 2263 1.49 60460 1.64
Employment for a fixed period of time 56147 (778) 685 1872 2.49 46956 3.39
Temporary and occasional jobs 47777 (747) / 1260 4.97 44881 8.20
Women
All 63651 553 435 2099 1.14 56057 1.39
Employment for an indefinite period of time 66104 551 471 2188 1.20 58470 1.32
Employment for a fixed period of time 50262 / 241 1652 3.23 42860 4.27
Temporary and occasional jobs 44201 / / (713) 5.35 40992 8.45
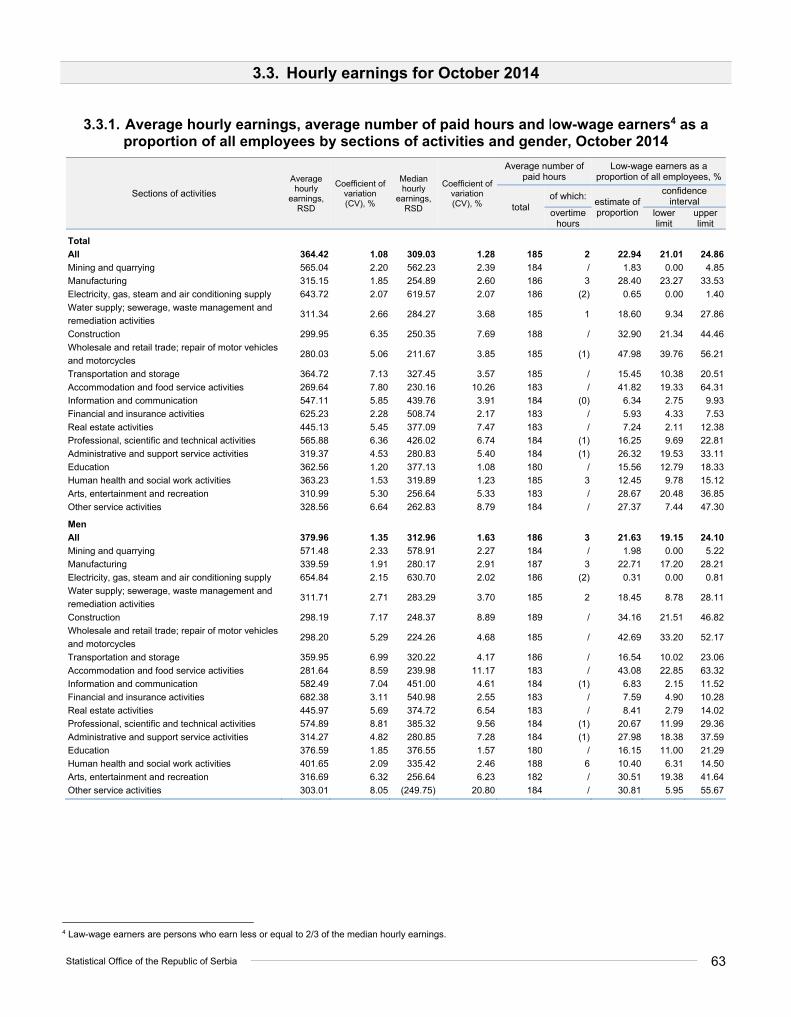
Statistical Office of the Republic of Serbia 63
3.3. Hourly earnings for October 2014
3.3.1. Average hourly earnings, average number of paid hours and low-wage earners4 as a proportion of all employees by sections of activities and gender, October 2014
Sections of activities
Average hourly
earnings, RSD
Coefficient of variation (CV), %
Median hourly
earnings, RSD
Coefficient of variation (CV), %
Average number of paid hours
Low-wage earners as a proportion of all employees, %
total of which:
estimate of proportion
confidence interval
overtime hours
lower limit
upper limit
Total
All 364.42 1.08 309.03 1.28 185 2 22.94 21.01 24.86
Mining and quarrying 565.04 2.20 562.23 2.39 184 / 1.83 0.00 4.85
Manufacturing 315.15 1.85 254.89 2.60 186 3 28.40 23.27 33.53
Electricity, gas, steam and air conditioning supply 643.72 2.07 619.57 2.07 186 (2) 0.65 0.00 1.40
Water supply; sewerage, waste management and
remediation activities 311.34 2.66 284.27 3.68 185 1 18.60 9.34 27.86
Construction 299.95 6.35 250.35 7.69 188 / 32.90 21.34 44.46
Wholesale and retail trade; repair of motor vehicles
and motorcycles 280.03 5.06 211.67 3.85 185 (1) 47.98 39.76 56.21
Transportation and storage 364.72 7.13 327.45 3.57 185 / 15.45 10.38 20.51
Accommodation and food service activities 269.64 7.80 230.16 10.26 183 / 41.82 19.33 64.31
Information and communication 547.11 5.85 439.76 3.91 184 (0) 6.34 2.75 9.93
Financial and insurance activities 625.23 2.28 508.74 2.17 183 / 5.93 4.33 7.53
Real estate activities 445.13 5.45 377.09 7.47 183 / 7.24 2.11 12.38
Professional, scientific and technical activities 565.88 6.36 426.02 6.74 184 (1) 16.25 9.69 22.81
Administrative and support service activities 319.37 4.53 280.83 5.40 184 (1) 26.32 19.53 33.11
Education 362.56 1.20 377.13 1.08 180 / 15.56 12.79 18.33
Human health and social work activities 363.23 1.53 319.89 1.23 185 3 12.45 9.78 15.12
Arts, entertainment and recreation 310.99 5.30 256.64 5.33 183 / 28.67 20.48 36.85
Other service activities 328.56 6.64 262.83 8.79 184 / 27.37 7.44 47.30
Men
All 379.96 1.35 312.96 1.63 186 3 21.63 19.15 24.10
Mining and quarrying 571.48 2.33 578.91 2.27 184 / 1.98 0.00 5.22
Manufacturing 339.59 1.91 280.17 2.91 187 3 22.71 17.20 28.21
Electricity, gas, steam and air conditioning supply 654.84 2.15 630.70 2.02 186 (2) 0.31 0.00 0.81
Water supply; sewerage, waste management and
remediation activities 311.71 2.71 283.29 3.70 185 2 18.45 8.78 28.11
Construction 298.19 7.17 248.37 8.89 189 / 34.16 21.51 46.82
Wholesale and retail trade; repair of motor vehicles
and motorcycles 298.20 5.29 224.26 4.68 185 / 42.69 33.20 52.17
Transportation and storage 359.95 6.99 320.22 4.17 186 / 16.54 10.02 23.06
Accommodation and food service activities 281.64 8.59 239.98 11.17 183 / 43.08 22.85 63.32
Information and communication 582.49 7.04 451.00 4.61 184 (1) 6.83 2.15 11.52
Financial and insurance activities 682.38 3.11 540.98 2.55 183 / 7.59 4.90 10.28
Real estate activities 445.97 5.69 374.72 6.54 183 / 8.41 2.79 14.02
Professional, scientific and technical activities 574.89 8.81 385.32 9.56 184 (1) 20.67 11.99 29.36
Administrative and support service activities 314.27 4.82 280.85 7.28 184 (1) 27.98 18.38 37.59
Education 376.59 1.85 376.55 1.57 180 / 16.15 11.00 21.29
Human health and social work activities 401.65 2.09 335.42 2.46 188 6 10.40 6.31 14.50
Arts, entertainment and recreation 316.69 6.32 256.64 6.23 182 / 30.51 19.38 41.64
Other service activities 303.01 8.05 (249.75) 20.80 184 / 30.81 5.95 55.67
4 Law-wage earners are persons who earn less or equal to 2/3 of the median hourly earnings.

64
Pilot Survey on the Structure of Earnings for 2014
3.3.1. Average hourly earnings, average number of paid hours and low-wage earners as a proportion of all employees by sections of activities and gender, October 2014 (continued)
Sections of activities
Average hourly
earnings, RSD
Coefficient of variation (CV), %
Median hourly
earnings, RSD
Coefficient of variation (CV), %
Average number of paid hours
Low-wage earners as a proportion of all employees, %
total of which:
estimate of proportion
confidence interval
overtime hours
lower limit
upper limit
Women
All 346.81 1.13 305.18 1.45 184 1 24.42 22.24 26.59
Mining and quarrying 534.40 3.46 539.60 3.60 184 / 1.09 0.00 3.09
Manufacturing 276.53 2.11 225.19 1.65 185 (3) 37.39 31.21 43.56
Electricity, gas, steam and air conditioning supply 604.90 2.42 576.51 2.06 185 / 1.83 0.00 3.94
Water supply; sewerage, waste management and
remediation activities 310.18 3.18 287.01 4.26 184 (1) 19.10 9.69 28.52
Construction 308.42 4.83 254.22 7.56 184 (1) 26.80 15.24 38.36
Wholesale and retail trade; repair of motor vehicles
and motorcycles 265.04 6.60 200.79 4.82 184 / 52.35 42.24 62.47
Transportation and storage 377.63 7.92 339.64 3.11 183 (0) 12.50 6.72 18.27
Accommodation and food service activities 260.85 8.00 226.39 10.75 183 / 40.89 15.26 66.52
Information and communication 495.78 4.52 424.92 3.86 184 (0) 5.62 3.00 8.24
Financial and insurance activities 594.06 2.34 493.14 2.30 183 / 5.02 3.71 6.33
Real estate activities 443.74 6.37 398.42 10.31 183 ‐ 5.31 0.67 9.94
Professional, scientific and technical activities 555.77 4.95 456.46 5.93 184 / 11.28 5.55 17.00
Administrative and support service activities 328.30 5.26 280.38 6.02 184 / 23.41 16.90 29.92
Education 355.85 1.43 378.43 1.12 180 / 15.28 12.08 18.48
Human health and social work activities 351.24 1.43 316.93 1.01 185 2 13.09 10.68 15.49
Arts, entertainment and recreation 305.70 5.03 256.80 4.95 184 / 26.96 19.02 34.90
Other service activities 371.82 5.22 314.81 9.86 184 / 21.55 9.37 33.72
3.3.2. Average hourly earnings, average number of paid hours and low-wage earners as a proportion of all employees by type of ownership and gender, October 2014
Type of ownership*
Average hourly
earnings, RSD
Coefficient of variation (CV), %
Median hourly
earnings, RSD
Coefficient of variation (CV), %
Average number of paid hours
Low-wage earners as a proportion of all employees, %
total
of which: estimate of proportion
confidence interval
overtime hours
lower limit upper limit
Total
All 364.42 1.08 309.03 1.28 185 2 22.94 21.01 24.86
Private ownership 334.48 1.74 247.28 2.13 185 2 34.37 30.95 37.79
Public ownership 397.82 1.22 364.36 0.89 184 2 10.18 8.95 11.41
Men
All 379.96 1.35 312.96 1.63 186 3 21.63 19.15 24.10
Private ownership 347.68 2.02 261.29 2.34 186 2 31.23 27.27 35.20
Public ownership 424.94 1.57 376.38 1.31 185 3 8.23 6.67 9.80
Women
All 346.81 1.13 305.18 1.45 184 1 24.42 22.24 26.59
Private ownership 315.74 1.97 229.17 2.07 184 (2) 38.81 34.68 42.94
Public ownership 373.82 1.13 354.51 1.08 183 1 11.91 10.48 13.33
* When analysing the data on earnings according to the type of ownership, one has to take into account that, since 1 November 2014, started to implement the law by which earnings of the employees in public sector were linearly decreased by 10%, which could not affect the results of this survey.
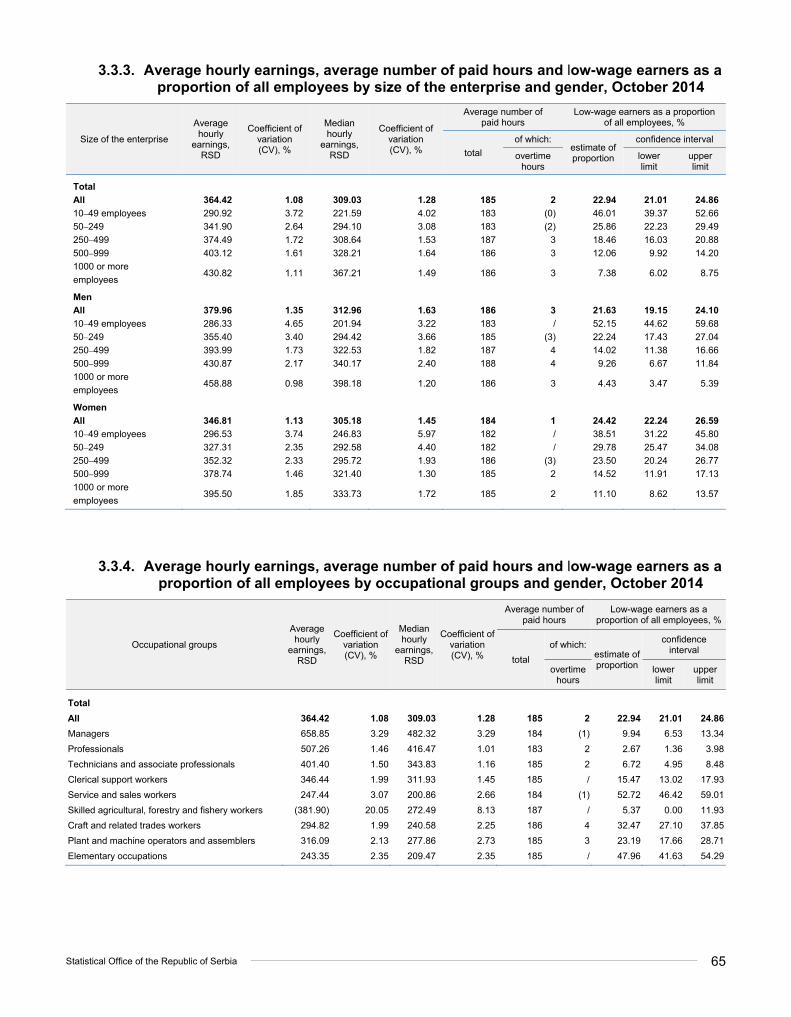
Statistical Office of the Republic of Serbia 65
3.3.3. Average hourly earnings, average number of paid hours and low-wage earners as a proportion of all employees by size of the enterprise and gender, October 2014
Size of the enterprise
Average hourly
earnings, RSD
Coefficient of variation (CV), %
Median hourly
earnings, RSD
Coefficient of variation (CV), %
Average number of paid hours
Low-wage earners as a proportion of all employees, %
total
of which: estimate of proportion
confidence interval
overtime hours
lower limit
upper limit
Total
All 364.42 1.08 309.03 1.28 185 2 22.94 21.01 24.86
10⎼49 employees 290.92 3.72 221.59 4.02 183 (0) 46.01 39.37 52.66
50⎼249 341.90 2.64 294.10 3.08 183 (2) 25.86 22.23 29.49
250⎼499 374.49 1.72 308.64 1.53 187 3 18.46 16.03 20.88
500⎼999 403.12 1.61 328.21 1.64 186 3 12.06 9.92 14.20
1000 or more
employees 430.82 1.11 367.21 1.49 186 3 7.38 6.02 8.75
Men
All 379.96 1.35 312.96 1.63 186 3 21.63 19.15 24.10
10⎼49 employees 286.33 4.65 201.94 3.22 183 / 52.15 44.62 59.68
50⎼249 355.40 3.40 294.42 3.66 185 (3) 22.24 17.43 27.04
250⎼499 393.99 1.73 322.53 1.82 187 4 14.02 11.38 16.66
500⎼999 430.87 2.17 340.17 2.40 188 4 9.26 6.67 11.84
1000 or more
employees 458.88 0.98 398.18 1.20 186 3 4.43 3.47 5.39
Women
All 346.81 1.13 305.18 1.45 184 1 24.42 22.24 26.59
10⎼49 employees 296.53 3.74 246.83 5.97 182 / 38.51 31.22 45.80
50⎼249 327.31 2.35 292.58 4.40 182 / 29.78 25.47 34.08
250⎼499 352.32 2.33 295.72 1.93 186 (3) 23.50 20.24 26.77
500⎼999 378.74 1.46 321.40 1.30 185 2 14.52 11.91 17.13
1000 or more
employees 395.50 1.85 333.73 1.72 185 2 11.10 8.62 13.57
3.3.4. Average hourly earnings, average number of paid hours and low-wage earners as a proportion of all employees by occupational groups and gender, October 2014
Occupational groups
Average hourly
earnings, RSD
Coefficient of variation (CV), %
Median hourly
earnings, RSD
Coefficient of variation (CV), %
Average number of paid hours
Low-wage earners as a proportion of all employees, %
total
of which: estimate of proportion
confidence interval
overtime hours
lower limit
upper limit
Total
All 364.42 1.08 309.03 1.28 185 2 22.94 21.01 24.86
Managers 658.85 3.29 482.32 3.29 184 (1) 9.94 6.53 13.34
Professionals 507.26 1.46 416.47 1.01 183 2 2.67 1.36 3.98
Technicians and associate professionals 401.40 1.50 343.83 1.16 185 2 6.72 4.95 8.48
Clerical support workers 346.44 1.99 311.93 1.45 185 / 15.47 13.02 17.93
Service and sales workers 247.44 3.07 200.86 2.66 184 (1) 52.72 46.42 59.01
Skilled agricultural, forestry and fishery workers (381.90) 20.05 272.49 8.13 187 / 5.37 0.00 11.93
Craft and related trades workers 294.82 1.99 240.58 2.25 186 4 32.47 27.10 37.85
Plant and machine operators and assemblers 316.09 2.13 277.86 2.73 185 3 23.19 17.66 28.71
Elementary occupations 243.35 2.35 209.47 2.35 185 / 47.96 41.63 54.29

66
Pilot Survey on the Structure of Earnings for 2014
3.3.4. Average hourly earnings, average number of paid hours and low-wage earners as a proportion of all employees by occupational groups and gender, October 2014 (continued)
Occupational groups
Average hourly
earnings, RSD
Coefficient of variation (CV), %
Median hourly
earnings, RSD
Coefficient of variation (CV), %
Average number of paid hours
Low-wage earners as a proportion of all employees, %
total
of which: estimate of proportion
confidence interval
overtime hours
lower limit
upper limit
Men
All 379.96 1.35 312.96 1.63 186 3 21.63 19.15 24.10
Managers 694.20 3.94 496.32 3.81 185 (1) 10.39 6.96 13.82
Professionals 560.70 2.45 442.79 2.31 184 3 3.15 1.22 5.07
Technicians and associate professionals 442.48 2.44 384.17 1.80 186 2 8.41 5.56 11.26
Clerical support workers 352.93 2.35 318.45 1.88 186 / 13.62 9.80 17.43
Service and sales workers 266.15 3.14 214.18 2.88 184 (1) 45.51 38.48 52.53
Skilled agricultural, forestry and fishery workers (437.08) 24.79 (301.31) 15.06 188 / 0.00 0.00 0.00
Craft and related trades workers 321.94 2.32 268.54 3.63 187 4 26.78 21.16 32.39
Plant and machine operators and assemblers 323.39 2.27 284.77 2.93 186 3 23.10 17.44 28.77
Elementary occupations 277.33 3.35 237.67 3.41 185 (2) 35.78 28.36 43.21
Women
All 346.81 1.13 305.18 1.45 184 1 24.42 22.24 26.59
Managers 599.92 3.47 470.24 4.56 184 (0) 9.18 4.48 13.88
Professionals 476.61 1.22 408.83 0.91 182 1 2.40 1.27 3.52
Technicians and associate professionals 371.14 1.28 328.26 0.93 184 1 5.47 3.68 7.26
Clerical support workers 342.33 2.06 308.74 1.72 183 (1) 16.65 13.96 19.33
Service and sales workers 230.60 4.25 192.86 3.28 184 (1) 59.20 50.96 67.43
Skilled agricultural, forestry and fishery workers 262.02 7.88 233.86 7.34 184 / 17.04 0.00 36.54
Craft and related trades workers 223.36 2.06 211.89 3.13 183 (3) 47.49 37.46 57.53
Plant and machine operators and assemblers 262.01 2.48 247.18 2.94 185 (2) 23.82 13.70 33.94
Elementary occupations 210.04 1.57 192.14 2.38 185 / 59.90 52.84 66.96
3.3.5. Average hourly earnings, average number of paid hours and low-wage earners as a proportion of all employees by level of education and gender, October 2014
Level of education
Average hourly
earnings, RSD
Coefficient of variation (CV), %
Median hourly
earnings, RSD
Coefficient of variation (CV), %
Average number of paid hours
Low-wage earners as a proportion of all employees, %
total
of which: estimate of proportion
confidence interval
overtime hours
lower limit
upper limit
Total
All 364.42 1.08 309.03 1.28 185 2 22.94 21.01 24.86
No education, incomplete primary school or
primary education 242.20 2.39 211.17 1.79 185 (3) 47.11 42.41 51.80
Secondary education 311.87 1.11 275.45 1.36 185 2 27.02 24.54 29.50
College, I level of university or expert studies 395.69 1.70 355.05 1.10 184 2 10.84 8.28 13.40
Higher education, master and doctoral studies 550.75 1.46 439.10 1.29 183 2 4.34 3.23 5.45

Statistical Office of the Republic of Serbia 67
3.3.5. Average hourly earnings, average number of paid hours and low-wage earners as a proportion of all employees by level of education and gender, October 2014 (continued)
Level of education
Average hourly
earnings, RSD
Coefficient of variation (CV), %
Median hourly
earnings, RSD
Coefficient of variation (CV), %
Average number of paid hours
Low-wage earners as a proportion of all employees, %
total
of which: estimate of proportion
confidence interval
overtime hours
lower limit
upper limit
Men
All 379.96 1.35 312.96 1.63 186 3 21.63 19.15 24.10
No education, incomplete primary school or
primary education 268.06 3.36 234.37 2.66 186 3 36.86 31.03 42.69
Secondary education 332.54 1.31 288.35 1.68 186 3 24.26 21.36 27.16
College, I level of university or expert studies 425.42 2.39 370.53 1.90 185 (2) 11.93 7.41 16.45
Higher education, master and doctoral studies 615.30 2.14 479.75 2.17 184 2 4.83 3.39 6.27
Women
All 346.81 1.13 305.18 1.45 184 1 24.42 22.24 26.59
No education, incomplete primary school or
primary education 207.97 1.29 192.17 1.78 185 (3) 60.67 54.86 66.47
Secondary education 282.68 1.30 257.09 1.84 184 1 30.92 27.61 34.23
College, I level of university or expert studies 372.26 1.76 347.51 0.97 183 (1) 9.98 7.51 12.44
Higher education, master and doctoral studies 505.84 1.31 422.26 1.03 182 1 4.00 2.85 5.15
3.3.6. Average hourly earnings, average number of paid hours and low-wage earners as a proportion of all employees by age groups and gender, October 2014
Age groups
Average hourly
earnings, RSD
Coefficient of variation (CV), %
Median hourly
earnings, RSD
Coefficient of variation (CV), %
Average number of paid hours
Low-wage earners as a proportion of all employees, %
total
of which: estimate of proportion
confidence interval
overtime hours
lower limit upper limit
Total
All 364.42 1.08 309.03 1.28 185 2 22.94 21.01 24.86
15⎼29 years 293.31 1.49 254.15 2.23 184 2 31.87 28.13 35.60
30⎼39 364.05 1.32 307.92 1.70 184 2 23.99 21.43 26.56
40⎼49 371.67 1.18 312.95 1.50 185 2 22.66 20.56 24.76
50⎼59 385.60 1.83 335.21 1.56 185 2 18.11 15.80 20.41
60 or more years 444.46 2.33 374.64 2.17 184 2 13.67 10.83 16.51
Men
All 379.96 1.35 312.96 1.63 186 3 21.63 19.15 24.10
15⎼29 years 297.61 1.83 253.58 2.30 185 3 32.08 27.41 36.75
30⎼39 381.08 1.86 312.32 2.44 185 (3) 23.37 19.96 26.79
40⎼49 391.54 1.56 320.75 1.80 186 3 20.79 18.11 23.48
50⎼59 403.85 2.13 343.31 2.06 186 3 15.33 12.77 17.88
60 or more years 445.37 2.88 370.30 2.69 185 2 14.10 10.71 17.50
Women
All 346.81 1.13 305.18 1.45 184 1 24.42 22.24 26.59
15⎼29 years 287.65 2.19 254.21 3.43 182 1 31.59 25.96 37.21
30⎼39 345.55 1.38 303.67 1.91 183 (1) 24.67 21.79 27.55
40⎼49 351.93 1.33 306.43 1.80 184 1 24.52 22.06 26.98
50⎼59 365.40 1.89 326.71 1.82 184 (1) 21.19 18.10 24.28
60 or more years 441.97 3.32 381.42 3.05 184 / 12.48 7.03 17.93
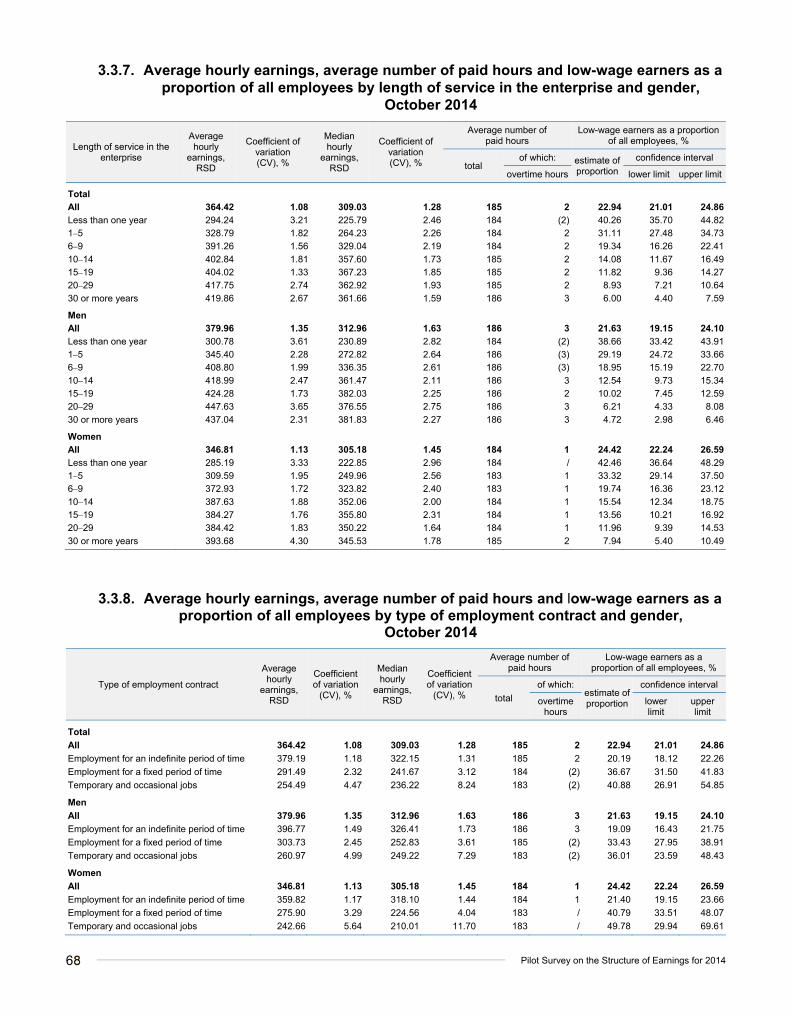
68
Pilot Survey on the Structure of Earnings for 2014
3.3.7. Average hourly earnings, average number of paid hours and low-wage earners as a proportion of all employees by length of service in the enterprise and gender,
October 2014
Length of service in the enterprise
Average hourly
earnings, RSD
Coefficient of variation (CV), %
Median hourly
earnings, RSD
Coefficient of variation (CV), %
Average number of paid hours
Low-wage earners as a proportion of all employees, %
total of which: estimate of
proportion
confidence interval
overtime hours lower limit upper limit
Total All 364.42 1.08 309.03 1.28 185 2 22.94 21.01 24.86
Less than one year 294.24 3.21 225.79 2.46 184 (2) 40.26 35.70 44.82 1⎼5 328.79 1.82 264.23 2.26 184 2 31.11 27.48 34.73 6⎼9 391.26 1.56 329.04 2.19 184 2 19.34 16.26 22.41
10⎼14 402.84 1.81 357.60 1.73 185 2 14.08 11.67 16.49 15⎼19 404.02 1.33 367.23 1.85 185 2 11.82 9.36 14.27 20⎼29 417.75 2.74 362.92 1.93 185 2 8.93 7.21 10.64
30 or more years 419.86 2.67 361.66 1.59 186 3 6.00 4.40 7.59
Men All 379.96 1.35 312.96 1.63 186 3 21.63 19.15 24.10
Less than one year 300.78 3.61 230.89 2.82 184 (2) 38.66 33.42 43.91 1⎼5 345.40 2.28 272.82 2.64 186 (3) 29.19 24.72 33.66 6⎼9 408.80 1.99 336.35 2.61 186 (3) 18.95 15.19 22.70
10⎼14 418.99 2.47 361.47 2.11 186 3 12.54 9.73 15.34 15⎼19 424.28 1.73 382.03 2.25 186 2 10.02 7.45 12.59 20⎼29 447.63 3.65 376.55 2.75 186 3 6.21 4.33 8.08
30 or more years 437.04 2.31 381.83 2.27 186 3 4.72 2.98 6.46
Women All 346.81 1.13 305.18 1.45 184 1 24.42 22.24 26.59
Less than one year 285.19 3.33 222.85 2.96 184 / 42.46 36.64 48.29 1⎼5 309.59 1.95 249.96 2.56 183 1 33.32 29.14 37.50 6⎼9 372.93 1.72 323.82 2.40 183 1 19.74 16.36 23.12
10⎼14 387.63 1.88 352.06 2.00 184 1 15.54 12.34 18.75 15⎼19 384.27 1.76 355.80 2.31 184 1 13.56 10.21 16.92 20⎼29 384.42 1.83 350.22 1.64 184 1 11.96 9.39 14.53
30 or more years 393.68 4.30 345.53 1.78 185 2 7.94 5.40 10.49
3.3.8. Average hourly earnings, average number of paid hours and low-wage earners as a proportion of all employees by type of employment contract and gender,
October 2014
Type of employment contract
Average hourly
earnings, RSD
Coefficient of variation
(CV), %
Median hourly
earnings, RSD
Coefficient of variation
(CV), %
Average number of paid hours
Low-wage earners as a proportion of all employees, %
total
of which: estimate of proportion
confidence interval
overtime hours
lower limit
upper limit
Total
All 364.42 1.08 309.03 1.28 185 2 22.94 21.01 24.86
Employment for an indefinite period of time 379.19 1.18 322.15 1.31 185 2 20.19 18.12 22.26
Employment for a fixed period of time 291.49 2.32 241.67 3.12 184 (2) 36.67 31.50 41.83
Temporary and occasional jobs 254.49 4.47 236.22 8.24 183 (2) 40.88 26.91 54.85
Men
All 379.96 1.35 312.96 1.63 186 3 21.63 19.15 24.10
Employment for an indefinite period of time 396.77 1.49 326.41 1.73 186 3 19.09 16.43 21.75
Employment for a fixed period of time 303.73 2.45 252.83 3.61 185 (2) 33.43 27.95 38.91
Temporary and occasional jobs 260.97 4.99 249.22 7.29 183 (2) 36.01 23.59 48.43
Women
All 346.81 1.13 305.18 1.45 184 1 24.42 22.24 26.59
Employment for an indefinite period of time 359.82 1.17 318.10 1.44 184 1 21.40 19.15 23.66
Employment for a fixed period of time 275.90 3.29 224.56 4.04 183 / 40.79 33.51 48.07
Temporary and occasional jobs 242.66 5.64 210.01 11.70 183 / 49.78 29.94 69.61

Statistical Office of the Republic of Serbia 69
3.4. Gender pay gap, October 2014
Gender pay gap, %
gap estimate confidence interval
lower limit upper limit
Total 8.7 6.51 10.93
Sections of activities Mining and quarrying 6.5 3.98 9.00 Manufacturing 18.6 15.49 21.65 Electricity, gas, steam and air conditioning supply 7.6 5.68 9.57 Water supply; sewerage, waste management and remediation activities 0.5 ⎼2.98 3.96 Construction ⎼3.4 ⎼16.39 9.52 Wholesale and retail trade; repair of motor vehicles and motorcycles 11.1 0.42 21.82 Transportation and storage ⎼4.9 ⎼11.06 1.24 Accommodation and food service activities 7.4 ⎼2.29 17.05 Information and communication 14.9 7.15 22.63 Financial and insurance activities 12.9 10.44 15.45 Real estate activities 0.5 ⎼8.32 9.32 Professional, scientific and technical activities 3.3 ⎼9.72 16.37 Administrative and support service activities ⎼4.5 ⎼12.50 3.57 Education 5.5 1.71 9.30 Human health and social work activities 12.6 10.09 15.01 Arts, entertainment and recreation 3.5 ⎼3.41 10.35 Other service activities ⎼22.7 ⎼38.40 ⎼7.02 Type of ownership* Private ownership 9.2 5.67 12.70 Public ownership 12.0 9.99 14.07 Size of the enterprise 10⎼49 employees ⎼3.6 ⎼12.09 4.96 50⎼249 7.9 2.95 12.86 250⎼499 10.6 7.24 13.92 500⎼999 12.1 9.49 14.71 1000 or more employees 13.8 11.25 16.37 Occupational groups Managers 13.6 7.36 19.80 Professionals 15.0 11.38 18.62 Technicians and associate professionals 16.1 12.18 20.06 Clerical support workers 3.0 0.08 5.93 Service and sales workers 13.4 6.48 20.24 Skilled agricultural, forestry and fishery workers 40.1 21.06 59.05 Craft and related trades workers 30.6 26.82 34.43 Plant and machine operators and assemblers 19.0 14.74 23.22 Elementary occupations 24.3 19.67 28.85 Level of education No education, incomplete primary school or primary education 22.4 17.69 27.14 Secondary education 15.0 12.71 17.28 College, I level of university or expert studies 12.5 8.72 16.28 Higher education, master and doctoral studies 17.8 14.73 20.85 Age groups 15⎼29 years 3.3 ⎼1.55 8.24 30⎼39 9.3 5.97 12.67 40⎼49 10.1 7.38 12.86 50⎼59 9.5 6.66 12.38 60 or more years 0.8 ⎼6.87 8.40 Length of service in the enterprise Less than one year 5.2 0.13 10.24 1⎼5 10.4 6.33 14.41 6⎼9 8.8 5.28 12.26 10⎼14 7.5 3.39 11.58 15⎼19 9.4 6.20 12.66 20⎼29 14.1 10.04 18.20 30 or more years 9.9 4.32 15.52 Type of employment contract Employment for an indefinite period of time 9.3 7.00 11.63 Employment for a fixed period of time 9.2 3.01 15.32 Temporary and occasional jobs 7.0 ⎼3.08 17.12
* When analysing the data on earnings according to the type of ownership, one has to take into account that, since 1 November 2014, started to implement the law by which earnings of the employees in public sector were linearly decreased by 10%, which could not affect the results of this survey.
70
Pilot Survey on the Structure of Earnings for 2014
Glossary of statistical terminology5
Coefficient of variation. Coefficient of variation is the ratio of standard error of an estimator and its
expected value, often expressed as percentage. Coefficient of variation is the relative standard error and shows
what percentage of the expected value is the standard error.
Data. Data present factual information, such as measurements, observations or statistics, which are used as
a basis for reasoning, discussion, or calculation.
Estimator of the finite population parameter. The values of study variables that are collected in the survey
are used to estimate parameters of the population. Estimator of the finite population parameter is a function of the
collected values of the study variable. If the survey is conducted on a random sample, precision of the estimator
can be estimated (measured by the variance of the estimator).
Expected value. Expected value of an estimator is the weighted average of all possible estimates (values)
of an estimator, over all possible samples, with the weight being the probability of a sample to be selected under
a given sample design.
Finite population. Finite population is the finite set of elements. The goal of the survey is collection of
information on the finite population or its sub-sets (domains of survey).
Mean. Mean values of a variable is the parameter of the finite population which is equal to the sum of
variable values of population elements, divided by their number. It is estimated by average value of weighted
values of sample units.
Median. Median or medium value of a variable is a parameter of population represented by the value which
is located exactly in the middle of an ordered set of the population variable values. It is estimated by an adequate
weighted median of the sample values.
Non-response. In sample surveys, the failure to obtain information from a designated individual or unit for
any reason (refusal to reply, not found at the address and similar) is termed non-response. The proportion of non-
responses in the total number of sampling units is called the non-response rate.
Non-response error. Non-response errors occur when the survey fails to get a response to one or, possibly,
all of the questions. Non-response causes an increase in variance because of the decrease in the effective
sample size and because some method must be used to impute a response. Imputation methods may cause bias
if the non-respondents and respondents differ with respect to the characteristic of interest.
Non-sampling errors. Non–sampling error is an error in the sample estimate which cannot be attributed to
sampling fluctuations (see Sampling error). Such errors may arise from many different sources such as non-
response, defects in the frame, faulty demarcation of sample units, defects in the selection of sampling units,
mistakes in the collection of data due to misunderstandings, negligence or dishonesty on the part of the
researcher or of the reporting unit, mistakes in editing or processing the data, etc.
Over-coverage. Over-coverage occurs when units that are outside the target population have been included
in the sampling frame and is a consequence of imperfect sampling frames. Over-coverage can be identified
during collection of the data.
5 Manual for Business Tendency Survey, OECD, 2003 and http://stats.oecd.org/glossary/.

Statistical Office of the Republic of Serbia 71
Population parameter. The aim of the survey is to collect data on unknown characteristics or parameters of
the population. Parameters are functions of study variable values (e.g. average annual earnings, average hourly
earnings by level of education and gender, etc.).
Purchasing power parity (PPP) equals purchasing powers of various currencies by eliminating influences
of different levels of prices between countries. It is used to translate economic indicators (as well as average
earnings, among others) expressed in the national currency into one common artificial currency PPS
(Purchasing power standard).
Purchasing power standard (PPS) is the term used by Eurostat referring to the common artificial currency.
In theory, one PPS can buy the same quantity of goods or services in any country. It is obtained by dividing
economic indicators expressed in domestic currency by corresponding purchasing power parity.
Random sampling. Random sampling is any method of selecting a sample based on the probability theory.
At any stage of the process of selection the probability of any set of units being selected must be known. It is the
only general method known which can provide a measure of precision of the estimate.
Reporting unit. A reporting unit or individual is the one that provides the information that is requested.
Sample size. Sample size is equal to the number of sampling units which are to be included in the sample.
In case of a multi-phase sample, this number refers to the number of units in the final phase of the sample
selection.
Sampling error. Sampling error is a part of the difference between a population parameter and an estimate
of that value, which has been derived from a random sample, and that is due to the fact that only a sample of
values is observed.
Sampling frame. A sampling frame is a set of information about the population being investigated which is
used as the basis for sample selection and in subsequent estimation procedures.
Sampling units. Sampling units are the units (employees or enterprises) that are described in the list or
frame from which the sample is selected, with the aim of estimating population parameters. This term is
synonymous with “Survey unit” / “Statistical units”.
Sampling weight. Sampling weight is equal to the reciprocal value of probability of inclusion of a unit in the
sample. For example, if a simple random sample of 10 units is selected from a set of 100 units, then the
probability of inclusion in the sample of a unit is 1/10, thus weight is 10. In this case, the average earnings are
estimated as a ratio of the sum of weighted (multiplied by 10) values of earnings and the estimated number of
units (the sum of weights of those sample units).
Simple random sample. Sampling in which every member of the population has an equal chance of being
selected is simple random sample.
Standard error of an estimator. The standard error of an estimator is equal to the square root of the
variance of that estimator.
Stratification. Stratification is the division of a population into disjoint sub-sets, known as strata. The strata
should be selected in such a way that the units of each stratum are relatively homogeneous, with respect to the
variables that are to be measured. Stratification may be done, for example, by economic activity or size of the
enterprise.
72
Pilot Survey on the Structure of Earnings for 2014
Stratified sample. Stratified sample is a sample chosen from the stratified population. Selection of samples
from each stratum is performed independently of sample selection in other strata.
Study variable. The study variable is a variable whose values are attached to the finite population elements.
Most often there is more than one study variable.
The 95% confidence interval. The 95% confidence interval for parameter A is the random interval 21)(2 ava , where a is the point estimator of A and )(av is the estimator of its variance aV . The
interval contains the true value of the parameter with approximate probability of 0.95 (in the sense that
confidence intervals, constructed on the basis of random samples of the same size that are selected under given
sample design, in 95% of cases contain the true value of the unknown parameter). This characteristic is valid
provided that the estimator a is unbiased and that it has an approximately normal distribution, as well as that
there exists a consistent variance estimator )(av of aV .
Under-coverage. Under-coverage occurs when some units that should be included in the sampling frame
have been omitted and is a consequence of imperfect sampling frames. Under-coverage cannot be identified
during collection of data.
Variance of an estimator. The variance of an estimator is the average of the square of differences of
individual values of estimates and their expectation over all possible independent repetitions of the sample of
same size and sample designs.


![Marshallese Community Pilot Survey - Pacific Web Pilot Survey.pdf · [a] Pilot Survey conducted in late 2001 on the community in NW Arkansas [b] Aggregated data from surveys conducted](https://img.pdfslide.net/doc/110x75/5fcbb52e777a485bf666aa73/marshallese-community-pilot-survey-pacific-web-pilot-surveypdf-a-pilot-survey.jpg)


![[REDACTED] FINAL 2009 BATHYMETRIC SURVEY OF PILOT](https://img.pdfslide.net/doc/110x75/61ca8c4f0953c566e845b7a5/redacted-final-2009-bathymetric-survey-of-pilot-.jpg)