Embed Size (px)
Citation preview
PKN ORLEN Capital Group
April 2014
2
Agenda
Summary
PKN ORLEN today & in the future
Upstream & Energy – growth segments
Downstream – core business
33
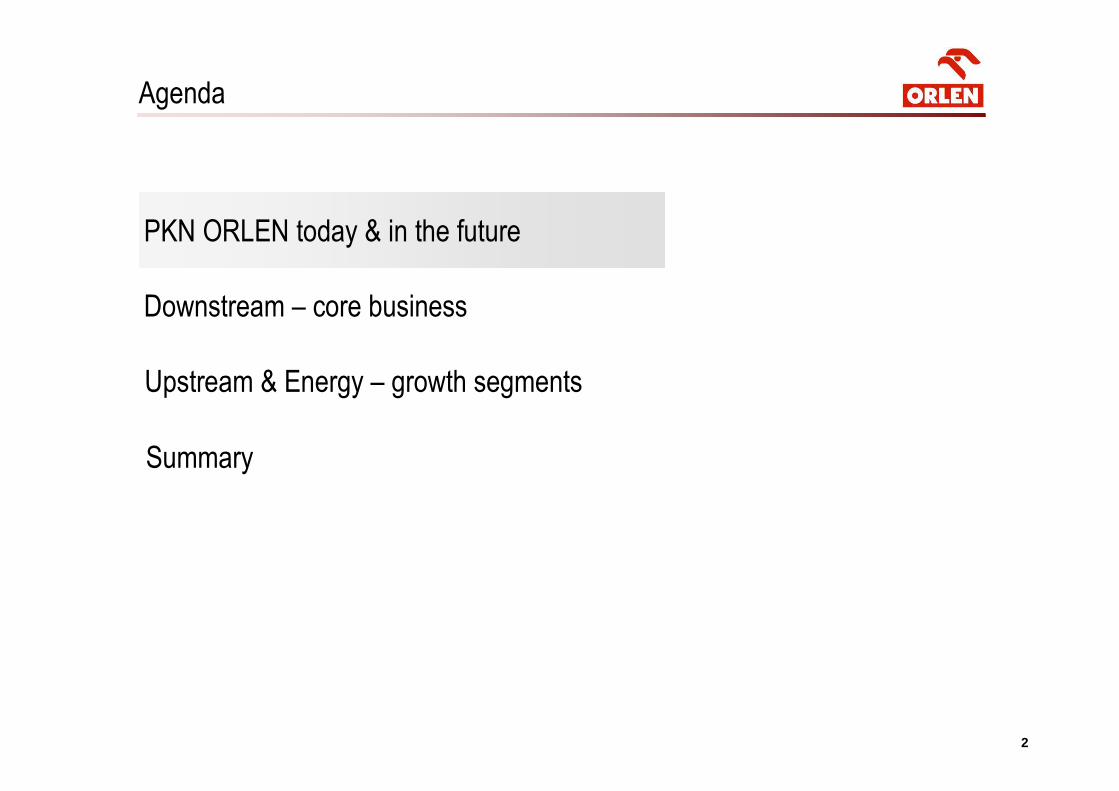
Integrated oil&gas company with energy assets
KEY DATASHAREHOLDERS STRUCTURE
REFINING
� Strategic location on key pipeline network and access to crude oil sea
terminals in Gdansk (Poland) and Butinge (Lithuania)
� Refineries in Poland (supersite in Plock), Lithuania and the Czech Rep.
� REBCO crude oil processing - benefiting from B/U diff
PETCHEM
� Petrochemical assets fully integrated with the refining
RETAIL
� 2 700 filling stations: Poland, the Czech Rep., Germany and Lithuania
UPSTREAM
� Poland: exploration shale gas projects as well as conventional projects
� Canada: TriOil – production assets
ENERGY
� Building a 463 MWe CCGT plant in Wloclawek (Poland)
OPERATIONAL (mt/y):
Max. throughput capacity ca. 32.4
Petrochemical production ca. 5.8
FINANCIAL (PLN bn ): 2010 2011 2012 2013 1Q14
Revenues 83.5 107.0 120.1 113.9 24.1
EBITDA LIFO 4.1 2.1* 4.5* 3.2 1.0
* Including impairments: 2011 PLN (-) 1,8 bn / 2012 PLN (-) 0,7 bn
� Listed since 1999
� WSE ticker: PKN
� Mcap: USD 6.3 bn***
� WSE indices included:
WIG, WIG 20, WIG 30,
WIG fuels
** Data as of 25.04.2014
Free float
72,48%
State Treasury
27,52%
4
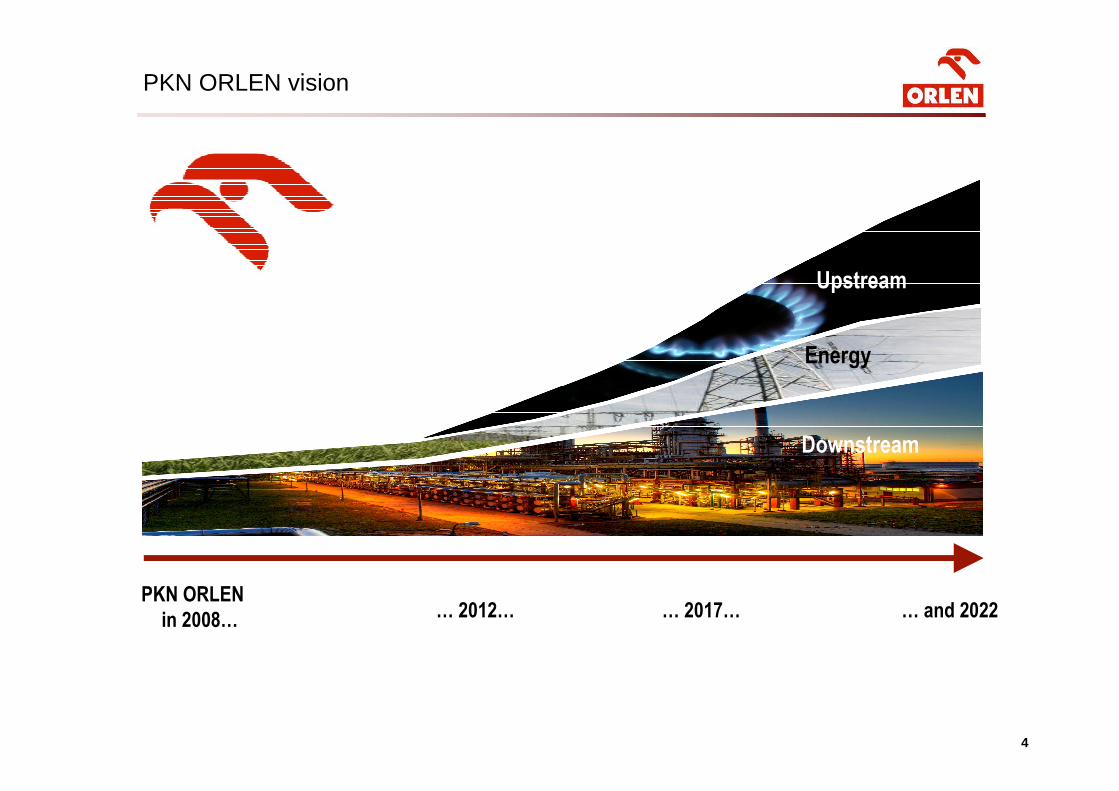
PKN ORLEN vision
PKN ORLEN
in 2008… … 2017… … and 2022… 2012…
Downstream
Energy
Upstream
5
Agenda
Summary
PKN ORLEN today & in the future
Upstream & Energy – growth segments
Downstream – core business
6
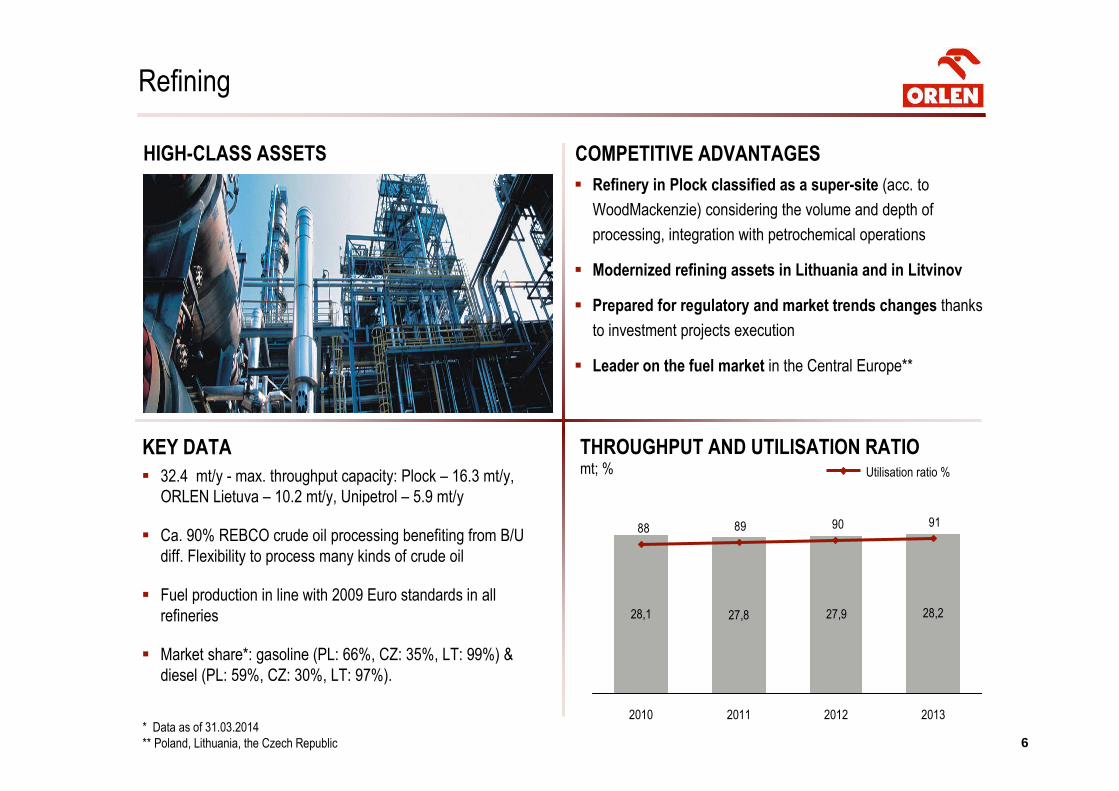
� 32.4 mt/y - max. throughput capacity: Plock – 16.3 mt/y,
ORLEN Lietuva – 10.2 mt/y, Unipetrol – 5.9 mt/y
� Ca. 90% REBCO crude oil processing benefiting from B/U
diff. Flexibility to process many kinds of crude oil
� Fuel production in line with 2009 Euro standards in all
refineries
� Market share*: gasoline (PL: 66%, CZ: 35%, LT: 99%) &
diesel (PL: 59%, CZ: 30%, LT: 97%).
KEY DATA
HIGH-CLASS ASSETS
Refining
* Data as of 31.03.2014
** Poland, Lithuania, the Czech Republic
COMPETITIVE ADVANTAGES
� Refinery in Plock classified as a super-site (acc. to
WoodMackenzie) considering the volume and depth of
processing, integration with petrochemical operations
� Modernized refining assets in Lithuania and in Litvinov
� Prepared for regulatory and market trends changes thanks
to investment projects execution
� Leader on the fuel market in the Central Europe**
THROUGHPUT AND UTILISATION RATIO mt; %
28,1 27,8 27,9 28,2
91 90 89 88
2011 2012 20132010
Utilisation ratio %
7
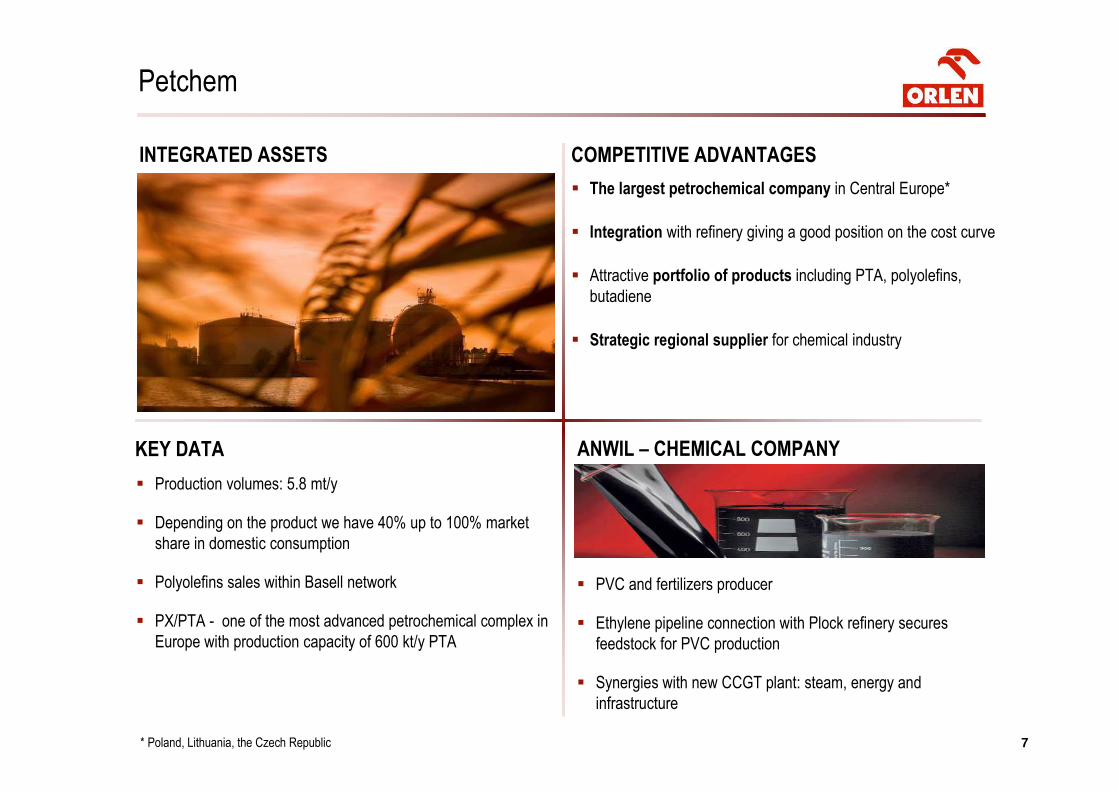
� Production volumes: 5.8 mt/y
� Depending on the product we have 40% up to 100% market
share in domestic consumption
� Polyolefins sales within Basell network
� PX/PTA - one of the most advanced petrochemical complex in
Europe with production capacity of 600 kt/y PTA
KEY DATA
INTEGRATED ASSETS
ANWIL – CHEMICAL COMPANY
Petchem
COMPETITIVE ADVANTAGES
� The largest petrochemical company in Central Europe*
� Integration with refinery giving a good position on the cost curve
� Attractive portfolio of products including PTA, polyolefins,
butadiene
� Strategic regional supplier for chemical industry
� PVC and fertilizers producer
� Ethylene pipeline connection with Plock refinery secures
feedstock for PVC production
� Synergies with new CCGT plant: steam, energy and
infrastructure
* Poland, Lithuania, the Czech Republic
8
� Over 2 700 filling stations*: Poland - 1766, Germany - 555, the
Czech Rep. - 338, Lithuania - 26
� Market share*: PL: 36%, CZ: 15%, LT: 4%, DE: 6%
� Almost 1100 Stop Cafe and Bistro Cafe in Poland.
In 2013 we sold 35m hotdogs (ca. 1 hotdog per second) and
5.3m litters hot drinks (2,5 Olympic swimming pools)
� The largest group of loyal customers in Poland: 2,5 m of active
customers VITAY and FLOTA programs
KEY DATA
Retail
* Data as of 31.03.2014
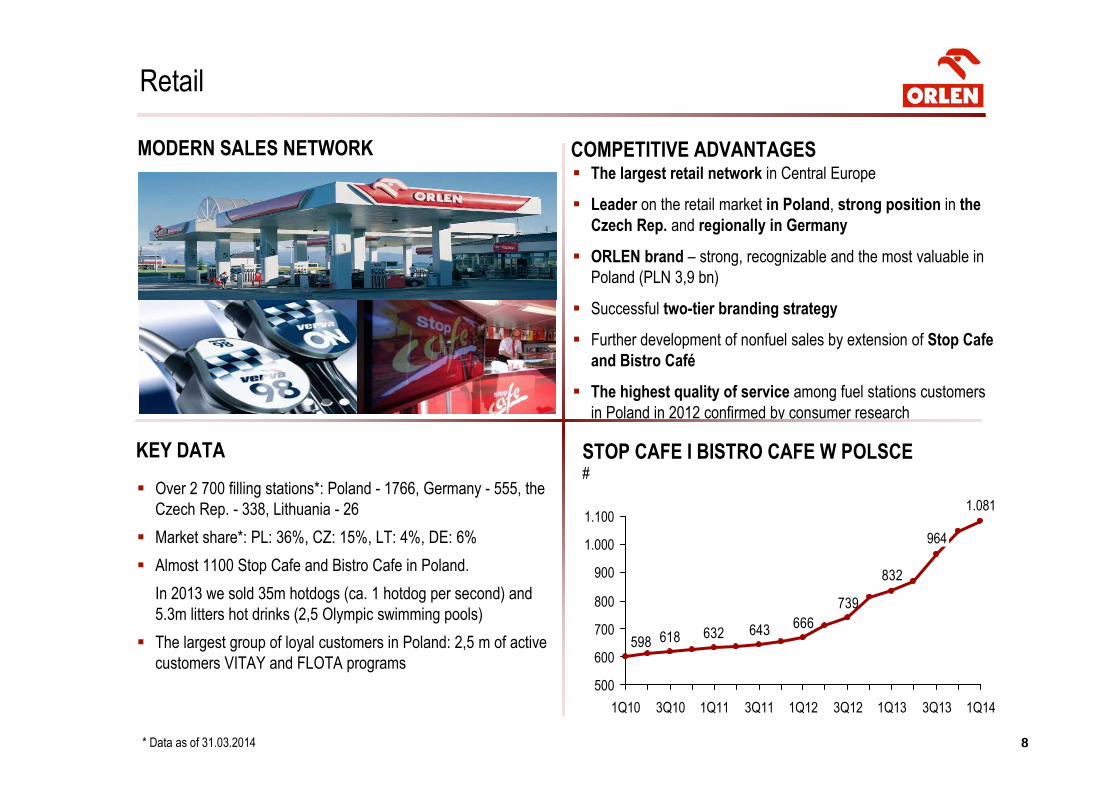
MODERN SALES NETWORK COMPETITIVE ADVANTAGES� The largest retail network in Central Europe
� Leader on the retail market in Poland, strong position in the
Czech Rep. and regionally in Germany
� ORLEN brand – strong, recognizable and the most valuable in
Poland (PLN 3,9 bn)
� Successful two-tier branding strategy
� Further development of nonfuel sales by extension of Stop Cafe
and Bistro Café
� The highest quality of service among fuel stations customers
in Poland in 2012 confirmed by consumer research
STOP CAFE I BISTRO CAFE W POLSCE#
832
739
666643632618598
500
900
600
1.000
1.100
800
700
3Q13
1.081
1Q12
964
3Q12 1Q133Q10 1Q111Q10 1Q143Q11
9
Agenda
Summary
PKN ORLEN today & in the future
Upstream & Energy – growth segments
Downstream – core business
10
Petrochemicals
Refining
Upstream (E&P)
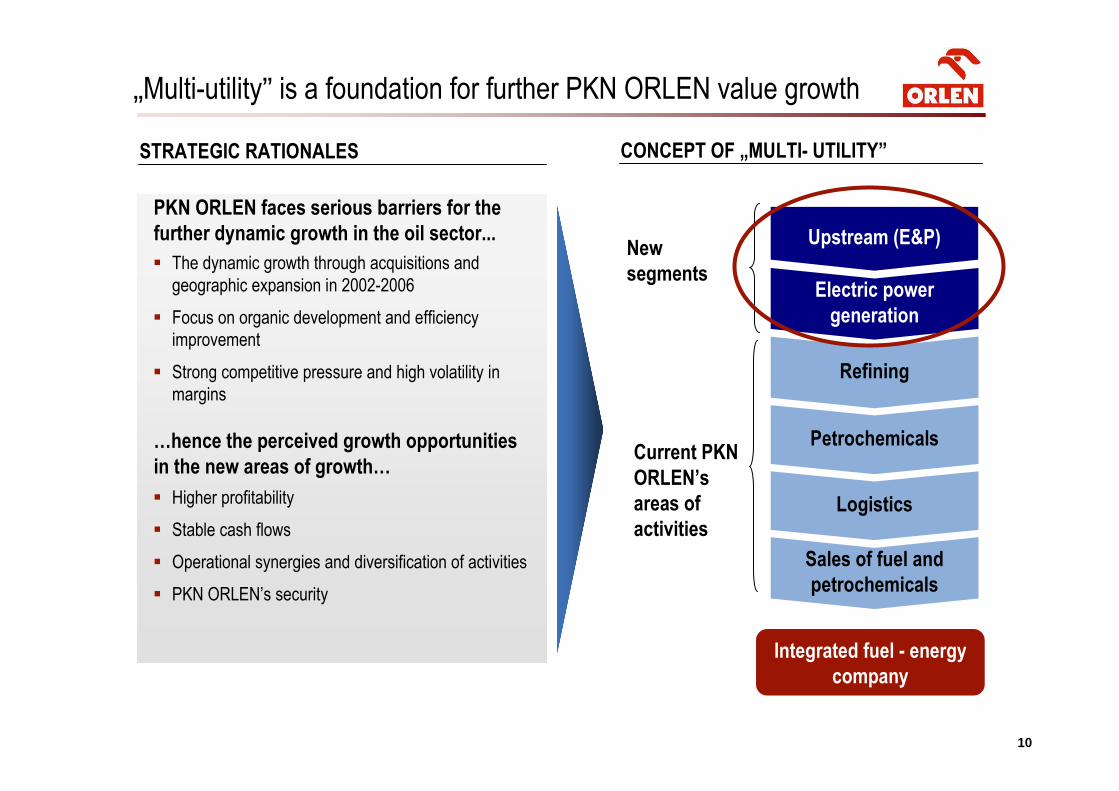
„Multi-utility” is a foundation for further PKN ORLEN value growth
CONCEPT OF „MULTI- UTILITY”
Current PKN
ORLEN’s
areas of
activities
New
segments
Integrated fuel - energy
company
Electric power
generation
Sales of fuel and
petrochemicals
Logistics� Higher profitability
� Stable cash flows
� Operational synergies and diversification of activities
� PKN ORLEN’s security
� The dynamic growth through acquisitions and
geographic expansion in 2002-2006
� Focus on organic development and efficiency
improvement
� Strong competitive pressure and high volatility in
margins
…hence the perceived growth opportunities
in the new areas of growth…
STRATEGIC RATIONALES
PKN ORLEN faces serious barriers for the
further dynamic growth in the oil sector...
11
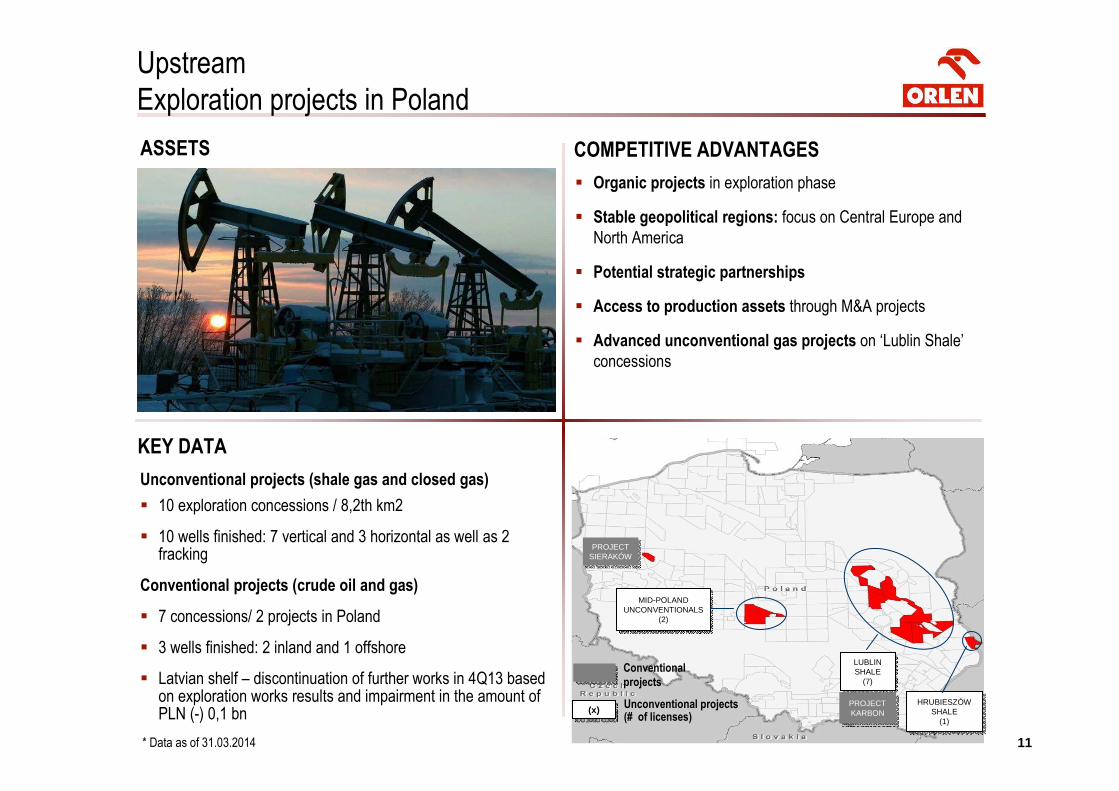
KEY DATA
Upstream
Exploration projects in Poland
ASSETS COMPETITIVE ADVANTAGES
� Organic projects in exploration phase
� Stable geopolitical regions: focus on Central Europe and
North America
� Potential strategic partnerships
� Access to production assets through M&A projects
� Advanced unconventional gas projects on ‘Lublin Shale’
concessions
MID-POLAND UNCONVENTIONALS
(2)
MID-POLAND UNCONVENTIONALS
(2)
LUBLIN SHALE
(7)
LUBLIN SHALE
(7)
HRUBIESZÓW SHALE
(1)
HRUBIESZÓW SHALE
(1)
PROJECTKARBON
PROJECTKARBON
PROJECT SIERAKÓW
PROJECT SIERAKÓW
Conventional
projects
(x)(x) Unconventional projects(# of licenses)
* Data as of 31.03.2014
Unconventional projects (shale gas and closed gas)
� 10 exploration concessions / 8,2th km2
� 10 wells finished: 7 vertical and 3 horizontal as well as 2 fracking
Conventional projects (crude oil and gas)
� 7 concessions/ 2 projects in Poland
� 3 wells finished: 2 inland and 1 offshore
� Latvian shelf – discontinuation of further works in 4Q13 based on exploration works results and impairment in the amount of PLN (-) 0,1 bn

1212
� Transaction value: CAD 183,7 m i.e. 2,85 CAD per share
� Assets portfolio in Canadian province of Alberta on 3 areas -
Lochend, Kaybob oraz Pouce Coupe
� Ca. 22 m boe of crude oil and gas reserves (2P)
� In 2013 - 15 net wells* were done
� Average production in 2013 ca. 3,8 th boe/d (ca. 60% crude
oil, 40% gas)
� In 2014 planned average production over 5 th boe/d
AKTYWABUSINESS RATIONALES
Upstream
Production assets in Canada
� Steadily growing company with an experienced management
team in place
� Access to crude oil and gas producing assets in a mature and
technologically advanced Canadian market
� Transaction with low-risk profile
� Know-how transfer and synergies with ORLEN’s organic E&P
projects
� Cash flow stabilization and risk diversification
* Number of wells multiplied by share percentage in particular asset
1Q14
� Average production– 3,7 th boe/d
� Number of realized drills: 8 gross (6,3 net*)
� EBITDA – PLN 37 m
� CAPEX – PLN 89 m
� Analysis of further inorganic development possibility
13
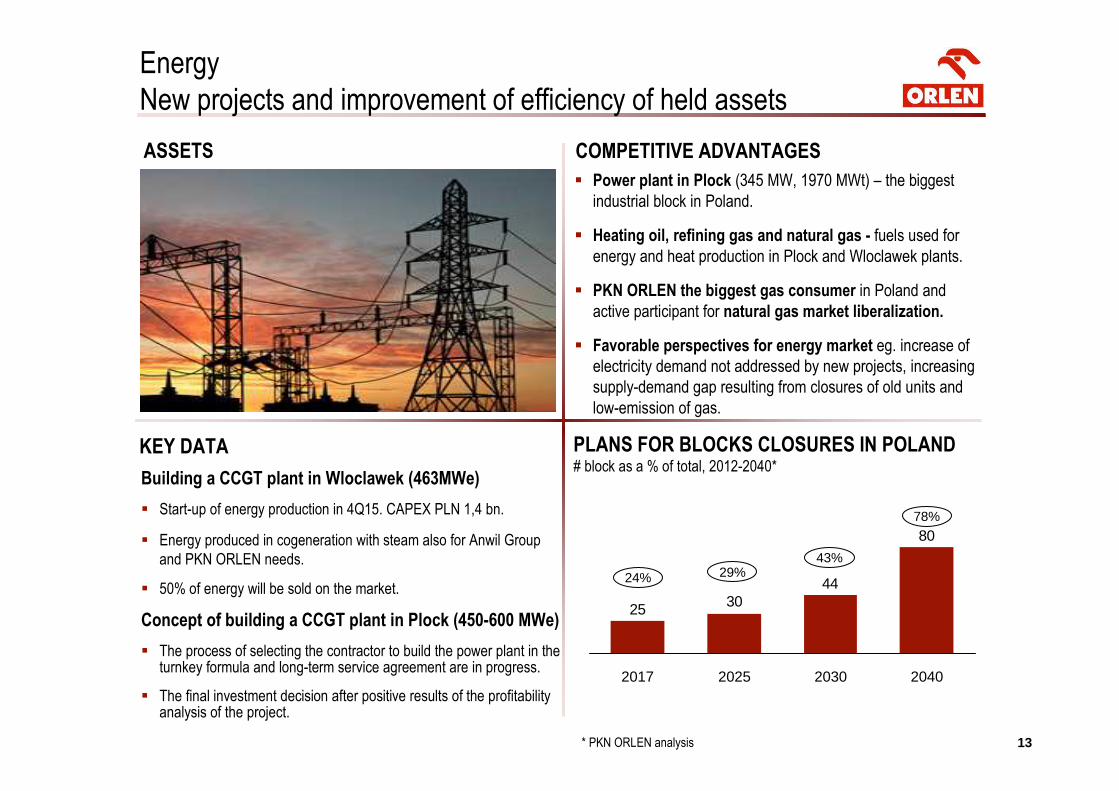
KEY DATA
Energy
New projects and improvement of efficiency of held assets
ASSETS COMPETITIVE ADVANTAGES
� Power plant in Plock (345 MW, 1970 MWt) – the biggest
industrial block in Poland.
� Heating oil, refining gas and natural gas - fuels used for
energy and heat production in Plock and Wloclawek plants.
� PKN ORLEN the biggest gas consumer in Poland and
active participant for natural gas market liberalization.
� Favorable perspectives for energy market eg. increase of
electricity demand not addressed by new projects, increasing
supply-demand gap resulting from closures of old units and
low-emission of gas.
80
443025
2040203020252017
PLANS FOR BLOCKS CLOSURES IN POLAND# block as a % of total, 2012-2040*
24%
43%29%
78%
Building a CCGT plant in Wloclawek (463MWe)
� Start-up of energy production in 4Q15. CAPEX PLN 1,4 bn.
� Energy produced in cogeneration with steam also for Anwil Group
and PKN ORLEN needs.
� 50% of energy will be sold on the market.
Concept of building a CCGT plant in Plock (450-600 MWe)
� The process of selecting the contractor to build the power plant in the turnkey formula and long-term service agreement are in progress.
� The final investment decision after positive results of the profitability analysis of the project.
* PKN ORLEN analysis
14
Agenda
Summary
PKN ORLEN today & in the future
Upstream & Energy – growth segments
Downstream – core business
15
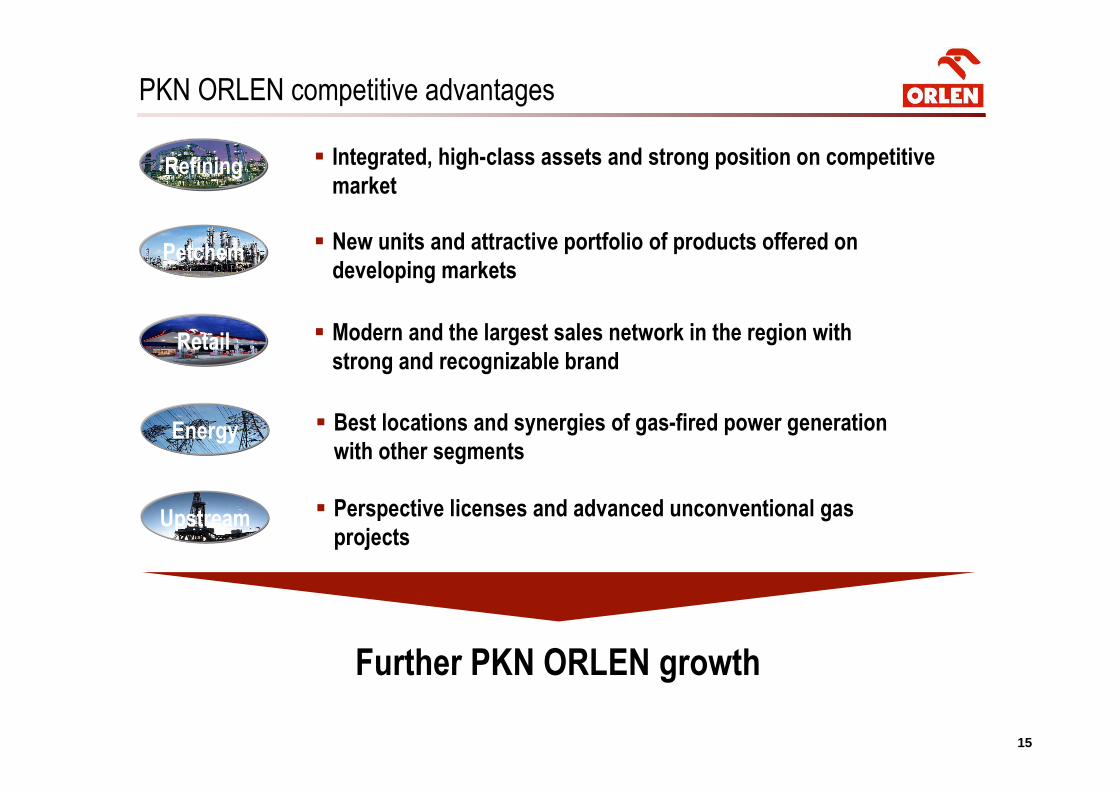
PKN ORLEN competitive advantages
Refining
Petchem
Retail
Energy
Upstream
� Integrated, high-class assets and strong position on competitive
market
� Modern and the largest sales network in the region with
strong and recognizable brand
� Best locations and synergies of gas-fired power generation
with other segments
� Perspective licenses and advanced unconventional gas
projects
� New units and attractive portfolio of products offered on
developing markets
Further PKN ORLEN growth
16
Mission and Corporate Values
RESPONSIBILITYWe respect our customers, shareholders, the natural environment and local communities
PROGRESSWe explore new possibilities
PEOPLEWe are characterized by our know-how, teamwork and integrity
ENERGYWe are enthusiastic about what we do
DEPENDABILITYYou can rely on us
„We discover and process natural resources to fuel the
future”
1717
Thank You for Your attention
For more information on PKN ORLEN, please contact Investor Relations Department:
phone: + 48 24 256 81 80fax: + 48 24 367 77 11e-mail: [email protected]
www.orlen.pl

18
Agenda
Supporting slides
19
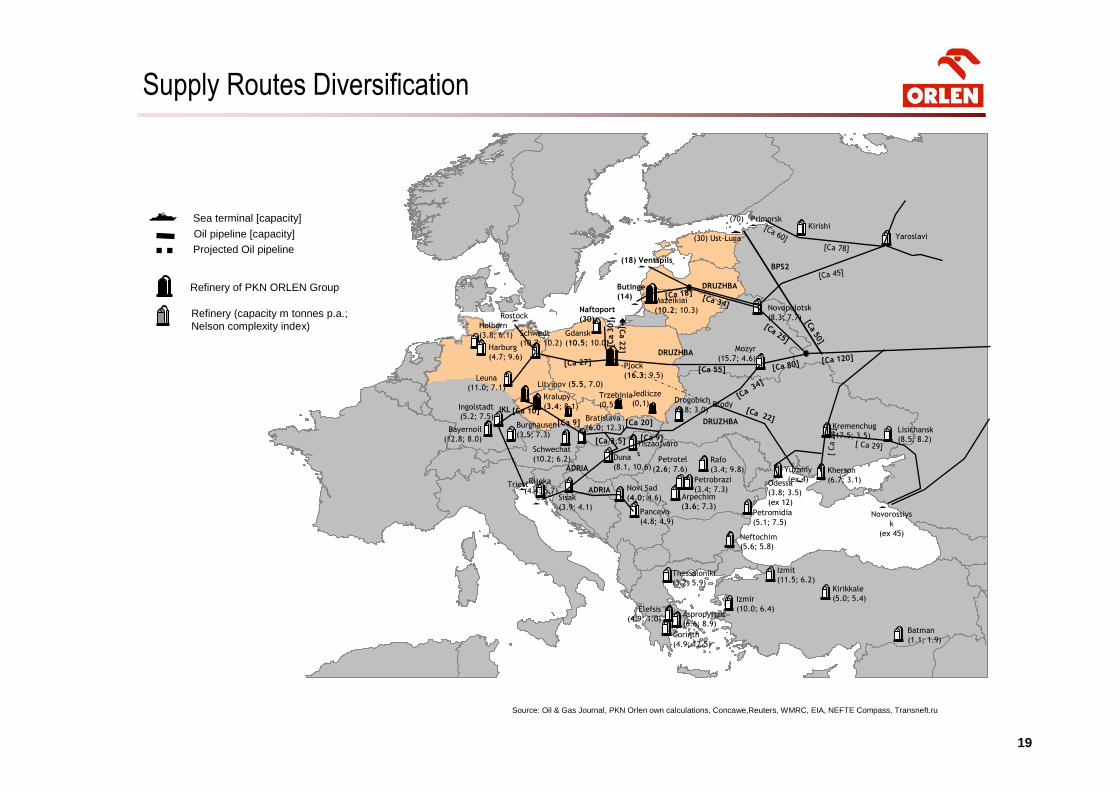
Source: Oil & Gas Journal, PKN Orlen own calculations, Concawe,Reuters, WMRC, EIA, NEFTE Compass, Transneft.ru
Refinery (capacity m tonnes p.a.; Nelson complexity index)
�Oil pipeline [capacity]
Refinery of PKN ORLEN Group
Projected Oil pipeline
Sea terminal [capacity]
Lisichansk
(8.5; 8.2)
Batman
(1.1; 1.9)
Yaroslavi
Ingolstadt
(5.2; 7.5)
Litvinov (5.5, 7.0)
Kralupy
(3.4; 8.1)
Plock
(16.3; 9.5)
Gdansk
(10.5; 10.0)
Mazeikiai
(10.2; 10.3) Novopolotsk
(8.3; 7.7)
Mozyr
(15.7; 4.6)
Bratislava
(6.0; 12.3)
Schwechat
(10.2; 6.2)
Burghausen
(3.5; 7.3)
Holborn
(3.8; 6.1)
Bayernoil
(12.8; 8.0)
Harburg
(4.7; 9.6)
Leuna
(11.0; 7.1)
Schwedt
(10.7; 10.2)
Aspropyrgos
(6.6; 8.9)
Corinth
(4.9; 12.5)
Elefsis
(4.9; 1.0)
Thessaloniki
(3.2; 5.9)
Izmit
(11.5; 6.2)
Izmir
(10.0; 6.4)
Kirikkale
(5.0; 5.4)
Duna
(8.1, 10.6)
Arpechim
(3.6; 7.3)
Petrobrazi
(3.4; 7.3)
Petrotel
(2.6; 7.6)Rafo
(3.4; 9.8)
Petromidia
(5.1; 7.5)
Rijeka
(4.4; 5.7)Sisak
(3.9; 4.1)
Novi Sad
(4.0; 4.6)
Pancevo
(4.8; 4.9)
Neftochim
(5.6; 5.8)
Drogobich
(3.8; 3.0)
Kremenchug
(17.5; 3.5)
Odessa
(3.8; 3.5)
(ex 12)
Kherson
(6.7; 3.1)
DRUZHBA
DRUZHBA
DRUZHBA
ADRIA
IKL
ADRIA
�(18) Ventspils
Butinge(14)
�
(70) Primorsk� Kirishi
Yuzhniy
(ex 4)�
Brody
Tiszaojvaro
s
�
Triest�
�
Rostock�
[Ca 78]
[Ca 60]
[Ca 34] [Ca 18]
[Ca 80][Ca 55]
[Ca
34]
[Ca 27]
�[C
a 2
2]
�� ��[C
a 3
0]
[ Ca 2
4]
[Ca 22]
Novorossiys
k
(ex 45)
�
[ Ca 29]
Trzebinia
(0,5)
Jedlicze
(0,1)
[Ca 45]
[Ca 25]
[Ca 120]
Naftoport(30)
[Ca 20][Ca 9]
[Ca 10]
[Ca 9][Ca 3,5]
Supply Routes Diversification
�(30) Ust-Luga
[Ca 50]
BPS2
2020
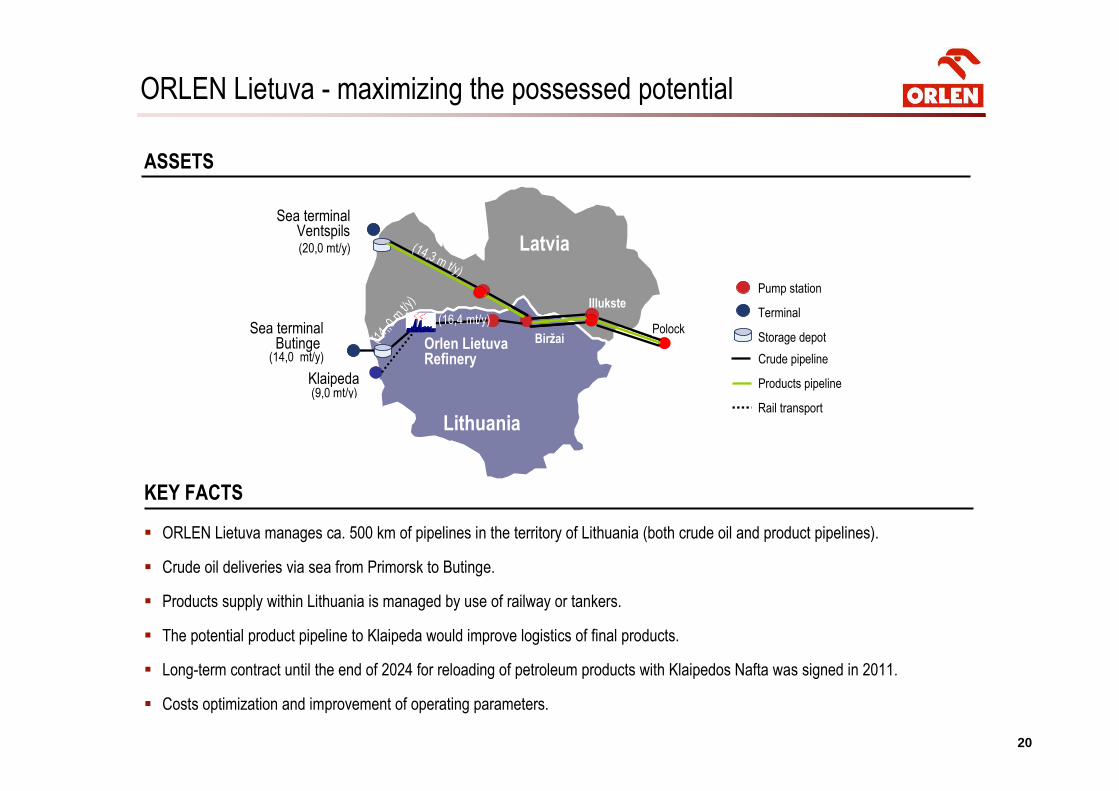
ORLEN Lietuva - maximizing the possessed potential
KEY FACTS
ASSETS
Crude pipeline
Products pipeline
Rail transport
Pump station
Terminal
Storage depot Mažeikių
Nafta
Klaipeda
Joniskis
Latvia
Sea terminal Butinge Orlen Lietuva
Refinery
Lithuania
Illukste
Biržai
Sea terminal Ventspils(20,0 mt/y)
(14,0 mt/y)
(14,3 m t/y)
(14,
,0 m
t/y)
(16,4 mt/y)
Klaipeda(9,0 mt/y)
Polock
� ORLEN Lietuva manages ca. 500 km of pipelines in the territory of Lithuania (both crude oil and product pipelines).
� Crude oil deliveries via sea from Primorsk to Butinge.
� Products supply within Lithuania is managed by use of railway or tankers.
� The potential product pipeline to Klaipeda would improve logistics of final products.
� Long-term contract until the end of 2024 for reloading of petroleum products with Klaipedos Nafta was signed in 2011.
� Costs optimization and improvement of operating parameters.
2121
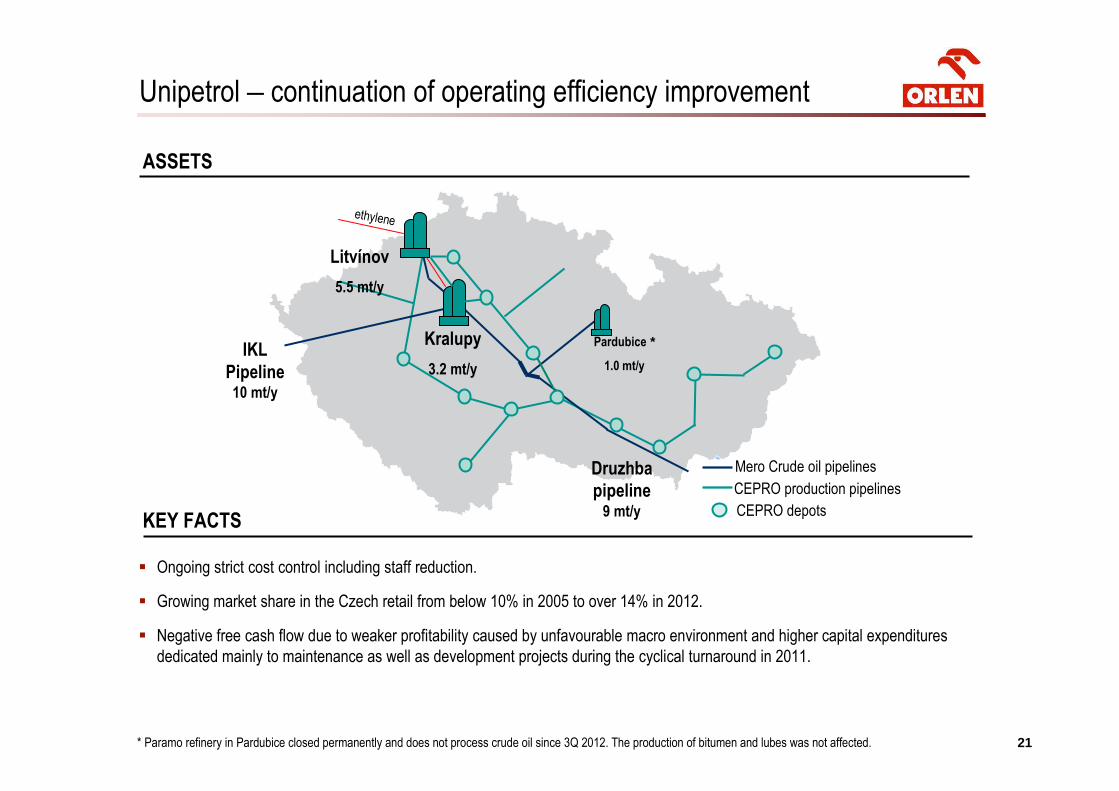
Unipetrol – continuation of operating efficiency improvement
� Ongoing strict cost control including staff reduction.
� Growing market share in the Czech retail from below 10% in 2005 to over 14% in 2012.
� Negative free cash flow due to weaker profitability caused by unfavourable macro environment and higher capital expenditures
dedicated mainly to maintenance as well as development projects during the cyclical turnaround in 2011.
KEY FACTS
ASSETS
IKL
Pipeline10 mt/y
CEPRO production pipelines
Mero Crude oil pipelines
CEPRO depots
Kralupy
3.2 mt/y
Pardubice *
1.0 mt/y
Litvínov
5.5 mt/y
Druzhba
pipeline9 mt/y
ethylene
* Paramo refinery in Pardubice closed permanently and does not process crude oil since 3Q 2012. The production of bitumen and lubes was not affected.
22
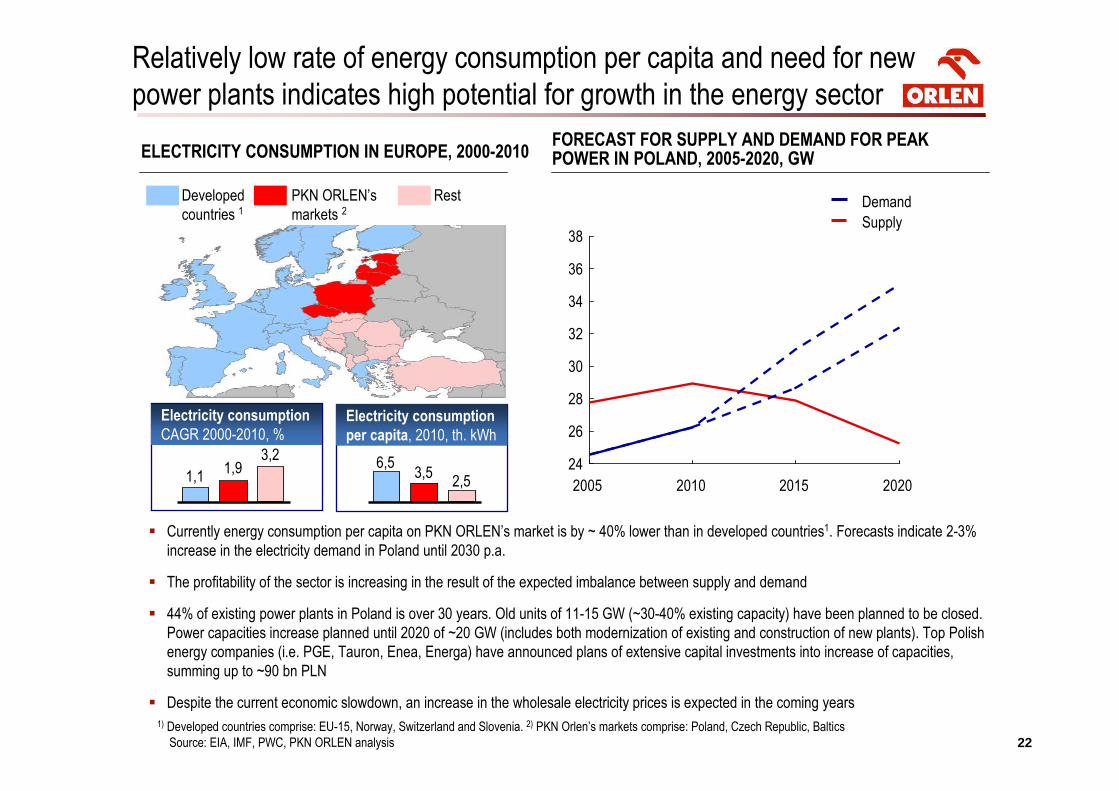
1) Developed countries comprise: EU-15, Norway, Switzerland and Slovenia. 2) PKN Orlen’s markets comprise: Poland, Czech Republic, Baltics
Source: EIA, IMF, PWC, PKN ORLEN analysis
ELECTRICITY CONSUMPTION IN EUROPE, 2000-2010
Developed
countries 1PKN ORLEN’s
markets 2Rest
FORECAST FOR SUPPLY AND DEMAND FOR PEAK POWER IN POLAND, 2005-2020, GW
Demand
Supply
24
26
28
30
32
34
36
38
2005 2010 2015 2020
Relatively low rate of energy consumption per capita and need for new
power plants indicates high potential for growth in the energy sector
� Currently energy consumption per capita on PKN ORLEN’s market is by ~ 40% lower than in developed countries1. Forecasts indicate 2-3%
increase in the electricity demand in Poland until 2030 p.a.
� The profitability of the sector is increasing in the result of the expected imbalance between supply and demand
� 44% of existing power plants in Poland is over 30 years. Old units of 11-15 GW (~30-40% existing capacity) have been planned to be closed.
Power capacities increase planned until 2020 of ~20 GW (includes both modernization of existing and construction of new plants). Top Polish
energy companies (i.e. PGE, Tauron, Enea, Energa) have announced plans of extensive capital investments into increase of capacities,
summing up to ~90 bn PLN
� Despite the current economic slowdown, an increase in the wholesale electricity prices is expected in the coming years
Electricity consumption
CAGR 2000-2010, %Electricity consumption
per capita, 2010, th. kWh
6,53,5
2,51,11,9
3,2
23
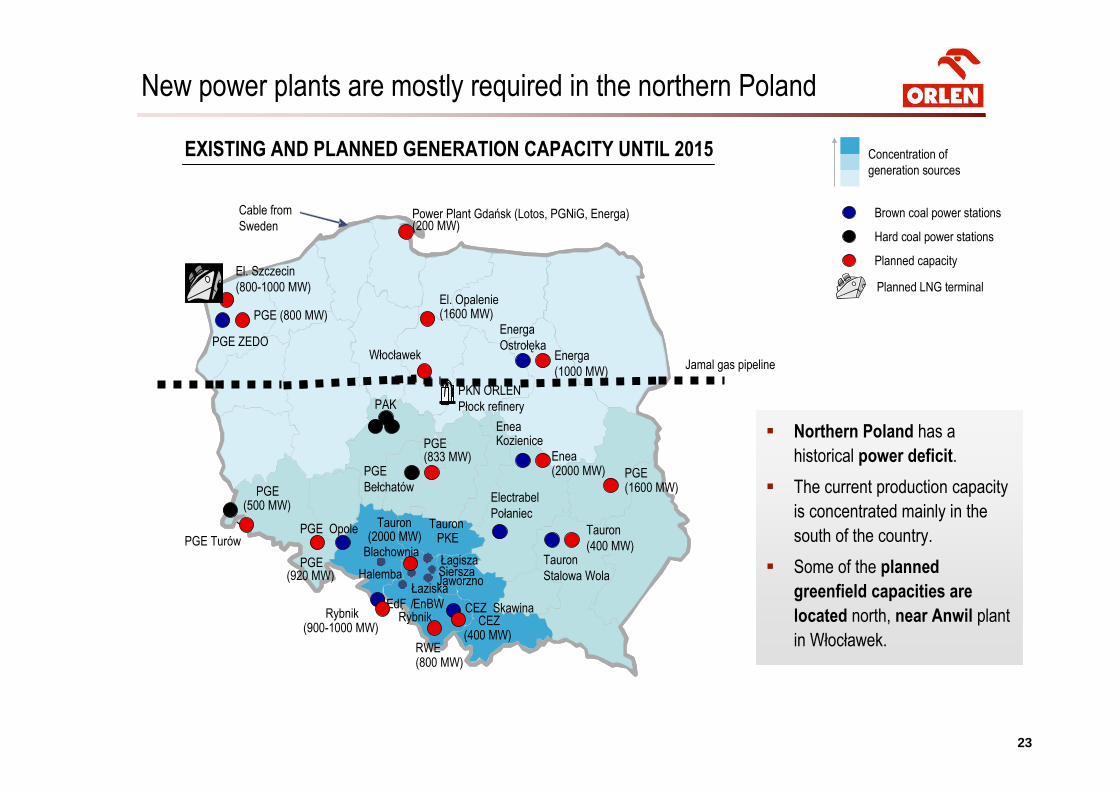
New power plants are mostly required in the northern Poland
EXISTING AND PLANNED GENERATION CAPACITY UNTIL 2015
Rybnik (900-1000 MW)
Ostro leka
Jaworzno
Rybnik
Siersza
Skawina
Dolna Odra
Turów Polaniec
Wola
Blachownia
LaziskaHalemba
Lagisza
Belchatów
PAK
Kozienice
PKE
BOT
Opole
JaworznoSiersza
CEZ Skawina
Łagisza
Tauron
(400 MW)
PGE (1600 MW)
Electrabel
Połaniec
EneaKozienice
Enea(2000 MW)
Energa
OstrołękaEnerga
(1000 MW)
El. Opalenie(1600 MW)
Cable from
Sweden
PGE ZEDO
PGE (800 MW)
El. Szczecin
(800-1000 MW)
Włocławek
CEZ (400 MW)
RWE (800 MW)
EdF /EnBWRybnik
PGE Opole
PGE (920 MW)
PGE Turów
PGE (500 MW)
PGE
Bełchatów
PGE (833 MW)
TauronPKE
Tauron(2000 MW)
PAK
Blachownia
Halemba
Concentration of
generation sources
Łaziska
Tauron
Stalowa Wola
(200 MW)Power Plant Gdańsk (Lotos, PGNiG, Energa)
� Northern Poland has a
historical power deficit.
� The current production capacity
is concentrated mainly in the
south of the country.
� Some of the planned
greenfield capacities are
located north, near Anwil plant
in Włocławek.
PKN ORLEN
Płock refinery
Planned capacity
Hard coal power stations
Brown coal power stations
Planned LNG terminal
Jamal gas pipeline
24
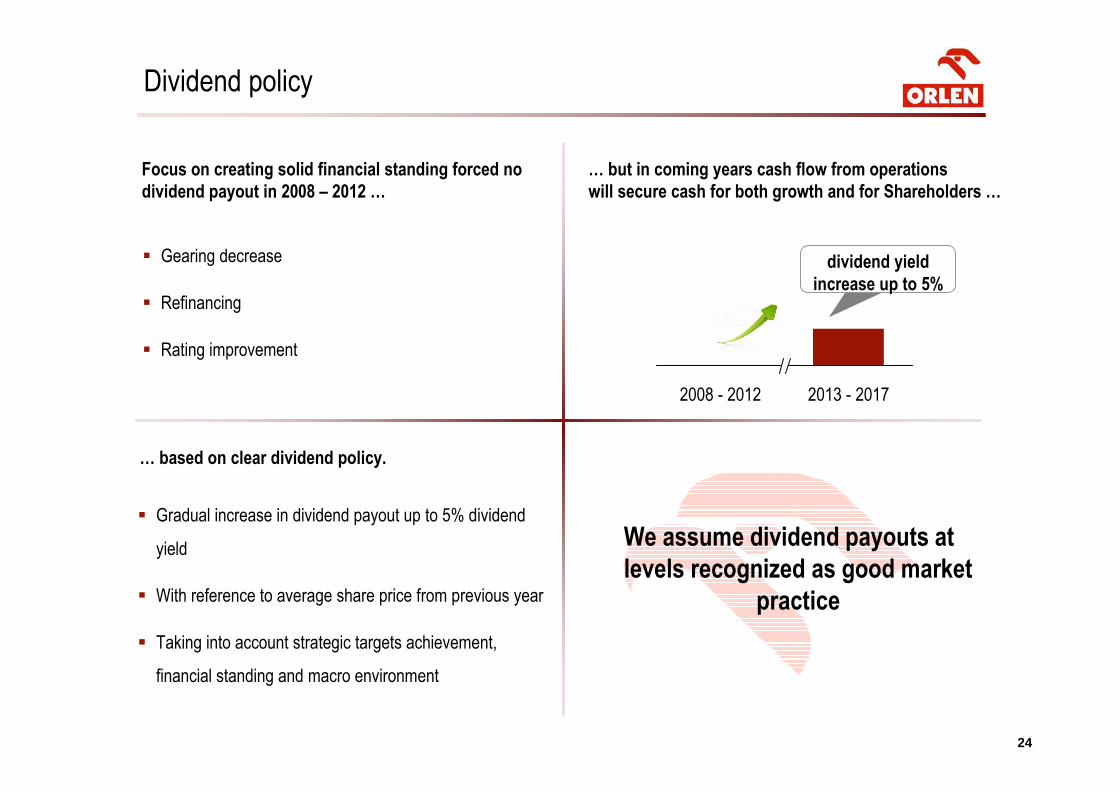
Dividend policy
Focus on creating solid financial standing forced no
dividend payout in 2008 – 2012 …
… but in coming years cash flow from operations
will secure cash for both growth and for Shareholders …
� Gearing decrease
� Refinancing
� Rating improvement
2008 - 2012 2013 - 2017
dividend yield
increase up to 5%
… based on clear dividend policy.
� Gradual increase in dividend payout up to 5% dividend
yield
� With reference to average share price from previous year
� Taking into account strategic targets achievement,
financial standing and macro environment
We assume dividend payouts at
levels recognized as good market
practice
25
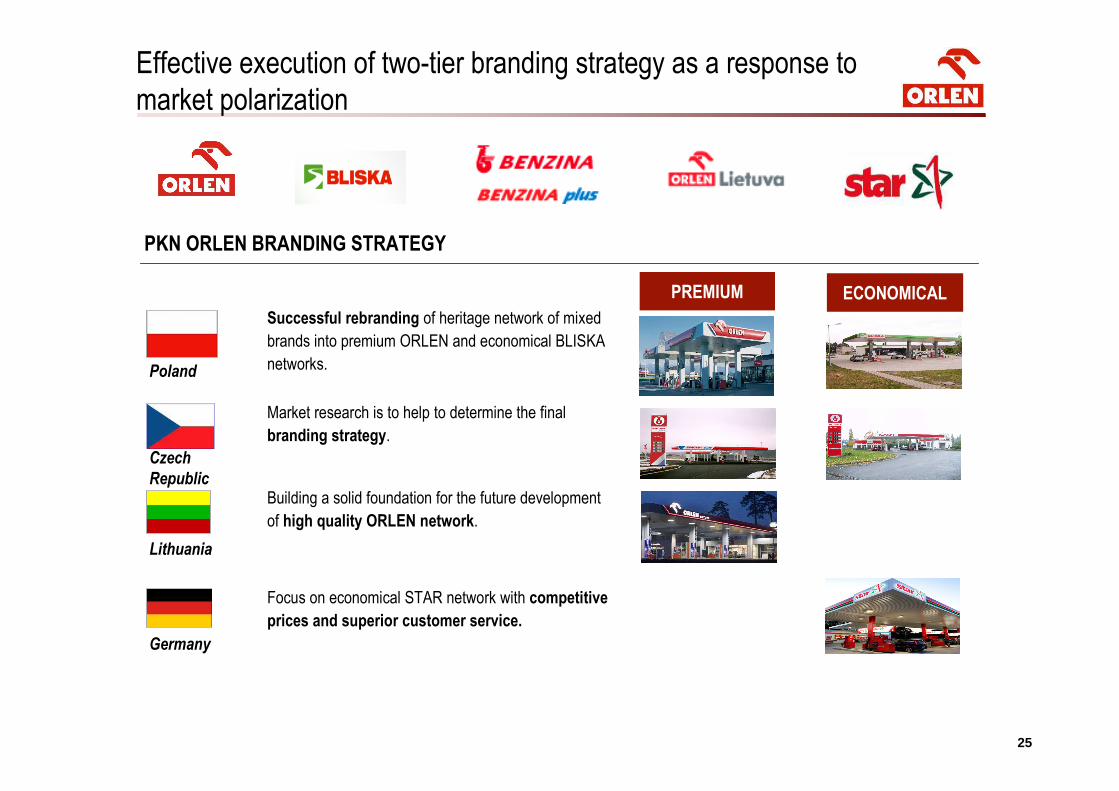
Effective execution of two-tier branding strategy as a response to
market polarization
PKN ORLEN BRANDING STRATEGY
ECONOMICALPREMIUM
Poland
Czech
Republic
Lithuania
Germany
Successful rebranding of heritage network of mixed
brands into premium ORLEN and economical BLISKA
networks.
Market research is to help to determine the final
branding strategy.
Building a solid foundation for the future development
of high quality ORLEN network.
Focus on economical STAR network with competitive
prices and superior customer service.
2626
This presentation (“Presentation”) has been prepared by PKN ORLEN S.A. (“PKN ORLEN” or “Company”). Neither the Presentation nor any copy hereof may be copied,
distributed or delivered directly or indirectly to any person for any purpose without PKN ORLEN’s knowledge and consent. Copying, mailing, distribution or delivery of this
Presentation to any person in some jurisdictions may be subject to certain legal restrictions, and persons who may or have received this Presentation should familiarize
themselves with any such restrictions and abide by them. Failure to observe such restrictions may be deemed an infringement of applicable laws.
This Presentation contains neither a complete nor a comprehensive financial or commercial analysis of PKN ORLEN and of the ORLEN Group, nor does it present its position
or prospects in a complete or comprehensive manner. PKN ORLEN has prepared the Presentation with due care, however certain inconsistencies or omissions might have
appeared in it. Therefore it is recommended that any person who intends to undertake any investment decision regarding any security issued by PKN ORLEN or its subsidiaries
shall only rely on information released as an official communication by PKN ORLEN in accordance with the legal and regulatory provisions that are binding for PKN ORLEN.
The Presentation, as well as the attached slides and descriptions thereof may and do contain forward-looking statements. However, such statements must not be understood as
PKN ORLEN’s assurances or projections concerning future expected results of PKN ORLEN or companies of the ORLEN Group. The Presentation is not and shall not be
understand as a forecast of future results of PKN ORLEN as well as of the ORLEN Group.
It should be also noted that forward-looking statements, including statements relating to expectations regarding the future financial results give no guarantee or assurance that
such results will be achieved. The Management Board’s expectations are based on present knowledge, awareness and/or views of PKN ORLEN’s Management Board’s
members and are dependent on a number of factors, which may cause that the actual results that will be achieved by PKN ORLEN may differ materially from those discussed in
the document. Many such factors are beyond the present knowledge, awareness and/or control of the Company, or cannot be predicted by it.
No warranties or representations can be made as to the comprehensiveness or reliability of the information contained in this Presentation. Neither PKN ORLEN nor its directors,
managers, advisers or representatives of such persons shall bear any liability that might arise in connection with any use of this Presentation. Furthermore, no information
contained herein constitutes an obligation or representation of PKN ORLEN, its managers or directors, its Shareholders, subsidiary undertakings, advisers or representatives of
such persons.
This Presentation was prepared for information purposes only and is neither a purchase or sale offer, nor a solicitation of an offer to purchase or sell any securities or financial
instruments or an invitation to participate in any commercial venture. This Presentation is neither an offer nor an invitation to purchase or subscribe for any securities in any
jurisdiction and no statements contained herein may serve as a basis for any agreement, commitment or investment decision, or may be relied upon in connection with any
agreement, commitment or investment decision.
Disclaimer
2727
For more information on PKN ORLEN, please contact Investor Relations Department:
phone: + 48 24 256 81 80fax: + 48 24 367 77 11e-mail: [email protected]
www.orlen.pl