Embed Size (px)
Citation preview
Capital Improvement PlanFiscal Years 2022 through 2041
“Planning for the future”
May 18, 2021
www.collierschools.com
Dr. Kamela Patton Superintendent of Schools
THE DISTRICT SCHOOL BOARD OF COLLIER COUNTY
Erick Carter, Chair Jen Mitchell, Vice Chair
Stephanie Lucarelli, Member Roy M. Terry, Member
Dr. Jory Westberry, Member
This report has been prepared by The District School Board of Collier County. Additional copies, if available, may be obtained by writing:
The District School Board of Collier County Dr. Martin Luther King, Jr. Administrative Center
5775 Osceola Trail Naples, Florida 34109-0919
Report Number: Coordinated by: 05182021-01 Siobhan Fox Assistant Superintendent, Financial Services
VISION STATEMENT
All students will complete school prepared for ongoing learning as well as community and global responsibilities.
The District School Board of Collier County does not discriminate on the basis of race, color, religion, national origin, sex, disability, or age in the provision of educational opportunities or employment opportunities and benefits. The District School Board does not discriminate on the basis of sex or disability in the education programs and activities that it operates, pursuant to the requirements of Title IX of the Education Amendments of 1972, Section 504 of the Rehabilitation Act of 1973, and the Americans with Disabilities Act of 1990, respectively. The right not to be discriminated against extends to both employees and students of the District and shall include equal access to designated youth organizations in conformity with the Boy Scouts of America Equal Access Act. The following personnel should be contacted for inquires about their rights or to learn how to file a complaint regarding discrimination. Employees: For matters involving Section 504 of the Rehabilitation Act of 1973, the Americans with Disabilities Act, Age Discrimination in Employment Act, Title VII, and Florida’s Educational Equity Act, contact Ms. Valerie Wenrich, Executive Director, Human Resources, at (239) 377-0351, or at 5775 Osceola Trail, Naples, Florida 34109. Students: For matters involving (a) Florida’s Education Act and Federal Title VI (race, religion, national origin issues), contact Mr. Stephen McFadden, Coordinator of School Counseling, Grades K-8, at (239) 377-0517, or at 5775 Osceola Trail, Naples, Florida 34109; and (b) Section 504 of the Rehabilitation Act of 1973 and the Americans with Disabilities Act, contact Dr. Dena Landry, Coordinator of Psychological Services, at (239) 377-0521, or at 5775 Osceola Trail, Naples, Florida, 34109.
Title IX: For all Title IX related matters, whether involving employees and/or students, contact Dr. Tammy Caraker, the District’s Title IX Coordinator and Associate Superintendent, School and District Operations, at (239) 377-0202, or at 5775 Osceola Trail, Naples, Florida 34109.
Executive Summary
The administration is pleased to present the Capital Improvement Plan for FY2022-2041. Consolidated into this one document are five-year
enrollment projections, school capacity calculations, long-range space needs, funding, and a variety of related information relevant to planning
for our schools. Chapter 6 contains detailed information by school pertaining to maintenance projects and renovations planned over the next
twenty years. The information in this document will provide the foundation for the Five-Year Facilities Work Program to be submitted to the State
in the fall.
Within the five-year timeframe of this plan, elementary and middle level enrollment projections are not expected to exceed total capacity.
However, elementary and middle school enrollments will be closely monitored to address temporary overcrowding due to anticipated enrollment
fluctuations and to provide permanent solutions to high growth schools as identified in this plan. High school level enrollment exceeds total
capacity. Therefore, this plan includes the planning, engineering, construction and opening phases of a permanent addition to an existing high
school (August 2022) and a new high school (August 2023). Chapter 1 contains information on the funding and timing of these projects. Temporary
classrooms are included in this plan to address overcrowding at all levels as needed.
The District continues to upgrade air conditioning systems, replace roofs, paint, replace buses and fund other necessary projects related to
facilities, maintenance, health and safety, security, furniture and equipment, and technology in order to maintain our schools and ancillary
facilities.
This financially feasible plan levies 1.15 mils in the first four years and 1.50 mils in the fifth year based upon the voter approved tax neutral
referendum that will shift the tax burden between the capital and operating funds.
Table of Contents
Quick Reference Guide ............................................................................................................................... I
Overview .......................................................................................................................................... ......II
Chapter 1 – Summary of 5 Year Capital Budget ....................................................................................... 1-1
Chapter 2 – The Collier County Planning Environment............................................................................. 2-1
Chapter 3 – Facilities Planning Process and Components ........................................................................ 3-1
Chapter 4 – Planning Goals and Recommendations ................................................................................. 4-1
Chapter 5 – School Enrollment and Recommendations by Planning Area ................................................ 5-1
Help guide “How to Use Tables in Chapter 5” is found at the beginning of Chapter 5
Chapter 6 – Maintenance Plan by School ................................................................................................. 6-1
Chapter 7 – Concurrency Service Areas ................................................................................................... 7-1
Chapter 8 – Appendices ........................................................................................................................... 8-1
Appendix A: Glossary of Terms
Appendix B: School Opening Dates Table
Appendix C: Collier County Planning Communities Map
I
QUICK REFERENCE GUIDE
TO THE
CAPITAL IMPROVEMENT PLAN 2022-2041
IF YOU ARE LOOKING FOR INFORMATION ON:
GO TO
PAGE
Budget Summary 2022-2026 ........................................................................................................................................... 1-1
Concurrency – public school concurrency information .............................................................................................. 7-1
Growth Projections – Collier County and School District ........................................................................................... 2-1
Growth Projections by School ....................................................................................................................................... 5-1
Maintenance Projects by School 2022-2041 ................................................................................................................. 6-1
Glossary of Terms ........................................................................................................................................................... Chapter 8 Appendix A
II
OVERVIEW OF THE CAPITAL IMPROVEMENT PROGRAM
The Collier County Public Schools’ 5-Year Capital Improvement Program (CIP) has been developed in accordance with the requirements of Florida Department of Education Guidelines. The CIP integrates the facilities planning program with the annual capital budgeting process and the District’s educational programming strategies. The document contains eight chapters as follows: Chapter 1 summarizes the 5-year capital improvement budget, expenditures and revenue. Chapter 2 discusses the economic and demographic trends that affect educational facilities planning for Collier County Public Schools (CCPS). Chapter 3 describes the facilities planning components as they relate to the 5-Year CIP. Outlined in this chapter is the enrollment forecasting methodology, formulas for calculating capacities, and educational program considerations.
Chapter 4 summarizes this year’s proposed CIP by major goals. It describes facilities goals and strategies and the recommendations for individual schools. Chapter 5 is organized by planning zones and provides an annual enrollment and 5-year projection for each school. It also includes capacity and other facility information, as well as recommended actions for individual schools. Chapter 6 includes the Maintenance Plan by school for the next 20 years shown in 10 year increments. Chapter 7 describes the District’s concurrency service areas (CSA) and provides a list of schools within each CSA, and the projected enrollment and utilization for the 5-year planning period. Maps show the boundaries of concurrency service areas by school type. Chapter 8 contains a glossary of common terms used throughout the book as well as a table of school opening dates and a map of the Collier County Planning Communities.
Chapter
1
Chapter 1
Summary of 5 Year Capital Budget
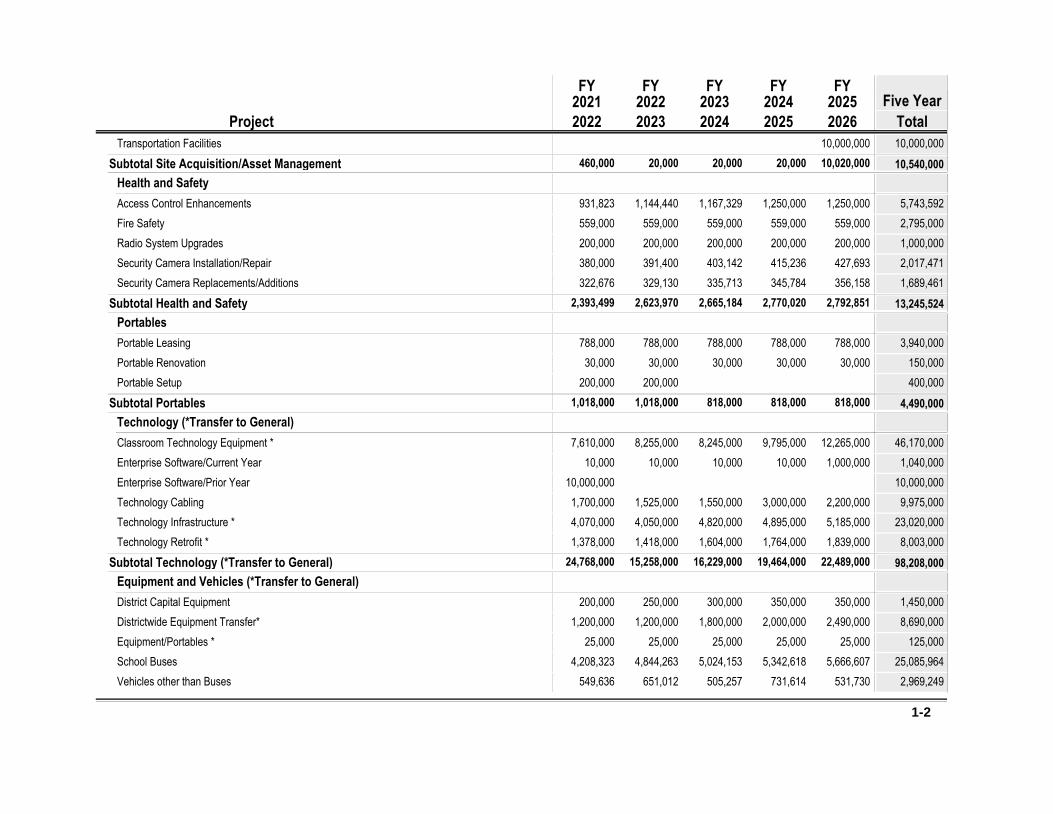
5 Year Capital Budget Summary
Project 2023
2022FY
2024
2023FY
2025
2024FY
2026
2025FY
Five Year
Total
2022
2021FY
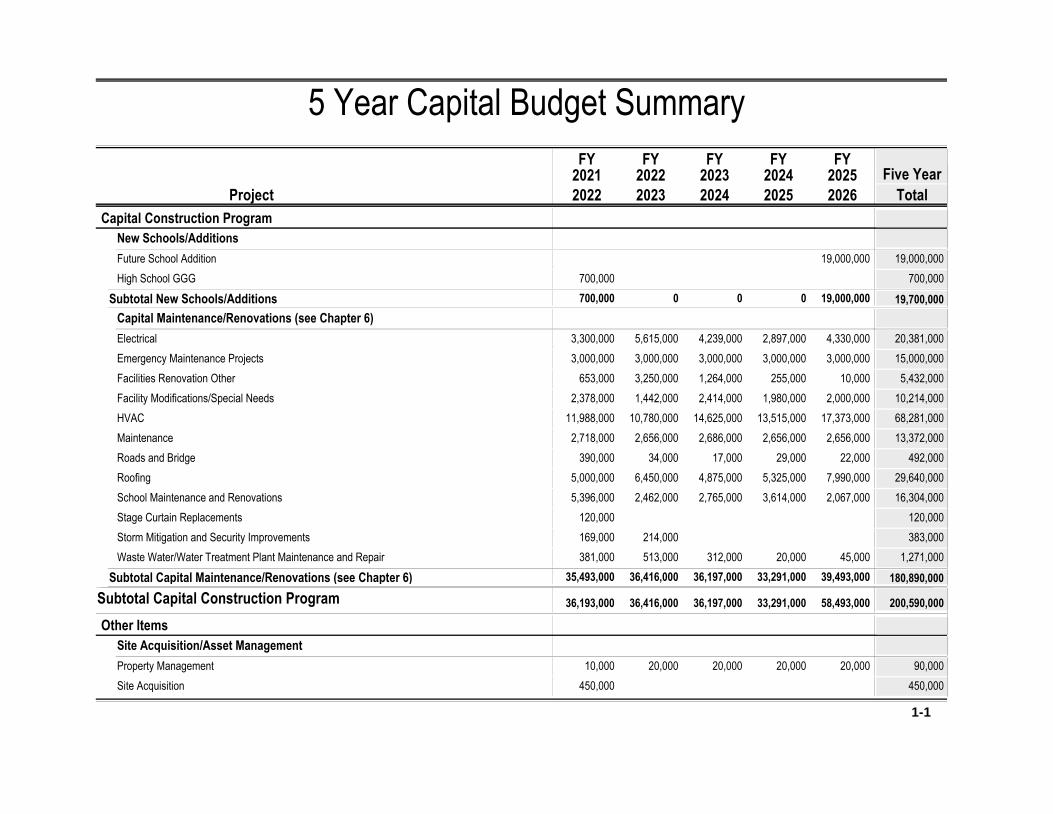
Capital Construction Program
New Schools/Additions
Future School Addition 19,000,000 19,000,000
High School GGG 700,000700,000
0 0 0 19,000,000Subtotal New Schools/Additions 19,700,000700,000
Capital Maintenance/Renovations (see Chapter 6)
Electrical 5,615,000 4,239,000 2,897,000 4,330,000 20,381,0003,300,000
Emergency Maintenance Projects 3,000,000 3,000,000 3,000,000 3,000,000 15,000,0003,000,000
Facilities Renovation Other 3,250,000 1,264,000 255,000 10,000 5,432,000653,000
Facility Modifications/Special Needs 1,442,000 2,414,000 1,980,000 2,000,000 10,214,0002,378,000
HVAC 10,780,000 14,625,000 13,515,000 17,373,000 68,281,00011,988,000
Maintenance 2,656,000 2,686,000 2,656,000 2,656,000 13,372,0002,718,000
Roads and Bridge 34,000 17,000 29,000 22,000 492,000390,000
Roofing 6,450,000 4,875,000 5,325,000 7,990,000 29,640,0005,000,000
School Maintenance and Renovations 2,462,000 2,765,000 3,614,000 2,067,000 16,304,0005,396,000
Stage Curtain Replacements 120,000120,000
Storm Mitigation and Security Improvements 214,000 383,000169,000
Waste Water/Water Treatment Plant Maintenance and Repair 513,000 312,000 20,000 45,000 1,271,000381,000
36,416,000 36,197,000 33,291,000 39,493,000Subtotal Capital Maintenance/Renovations (see Chapter 6) 180,890,00035,493,000
36,416,000 36,197,000 33,291,000 58,493,000Subtotal Capital Construction Program 200,590,000 36,193,000
Other Items
Site Acquisition/Asset Management
Property Management 20,000 20,000 20,000 20,000 90,00010,000
Site Acquisition 450,000450,000
1-1
Project 2023
2022FY
2024
2023FY
2025
2024FY
2026
2025FY
Five Year
Total
2022
2021FY
Transportation Facilities 10,000,000 10,000,000
20,000 20,000 20,000 10,020,000Subtotal Site Acquisition/Asset Management 10,540,000460,000
Health and Safety
Access Control Enhancements 1,144,440 1,167,329 1,250,000 1,250,000 5,743,592931,823
Fire Safety 559,000 559,000 559,000 559,000 2,795,000559,000
Radio System Upgrades 200,000 200,000 200,000 200,000 1,000,000200,000
Security Camera Installation/Repair 391,400 403,142 415,236 427,693 2,017,471380,000
Security Camera Replacements/Additions 329,130 335,713 345,784 356,158 1,689,461322,676
2,623,970 2,665,184 2,770,020 2,792,851Subtotal Health and Safety 13,245,5242,393,499
Portables
Portable Leasing 788,000 788,000 788,000 788,000 3,940,000788,000
Portable Renovation 30,000 30,000 30,000 30,000 150,00030,000
Portable Setup 200,000 400,000200,000
1,018,000 818,000 818,000 818,000Subtotal Portables 4,490,0001,018,000
Technology (*Transfer to General)
Classroom Technology Equipment * 8,255,000 8,245,000 9,795,000 12,265,000 46,170,0007,610,000
Enterprise Software/Current Year 10,000 10,000 10,000 1,000,000 1,040,00010,000
Enterprise Software/Prior Year 10,000,00010,000,000
Technology Cabling 1,525,000 1,550,000 3,000,000 2,200,000 9,975,0001,700,000
Technology Infrastructure * 4,050,000 4,820,000 4,895,000 5,185,000 23,020,0004,070,000
Technology Retrofit * 1,418,000 1,604,000 1,764,000 1,839,000 8,003,0001,378,000
15,258,000 16,229,000 19,464,000 22,489,000Subtotal Technology (*Transfer to General) 98,208,00024,768,000
Equipment and Vehicles (*Transfer to General)
District Capital Equipment 250,000 300,000 350,000 350,000 1,450,000200,000
Districtwide Equipment Transfer* 1,200,000 1,800,000 2,000,000 2,490,000 8,690,0001,200,000
Equipment/Portables * 25,000 25,000 25,000 25,000 125,00025,000
School Buses 4,844,263 5,024,153 5,342,618 5,666,607 25,085,9644,208,323
Vehicles other than Buses 651,012 505,257 731,614 531,730 2,969,249549,636
1-2
Project 2023
2022FY
2024
2023FY
2025
2024FY
2026
2025FY
Five Year
Total
2022
2021FY
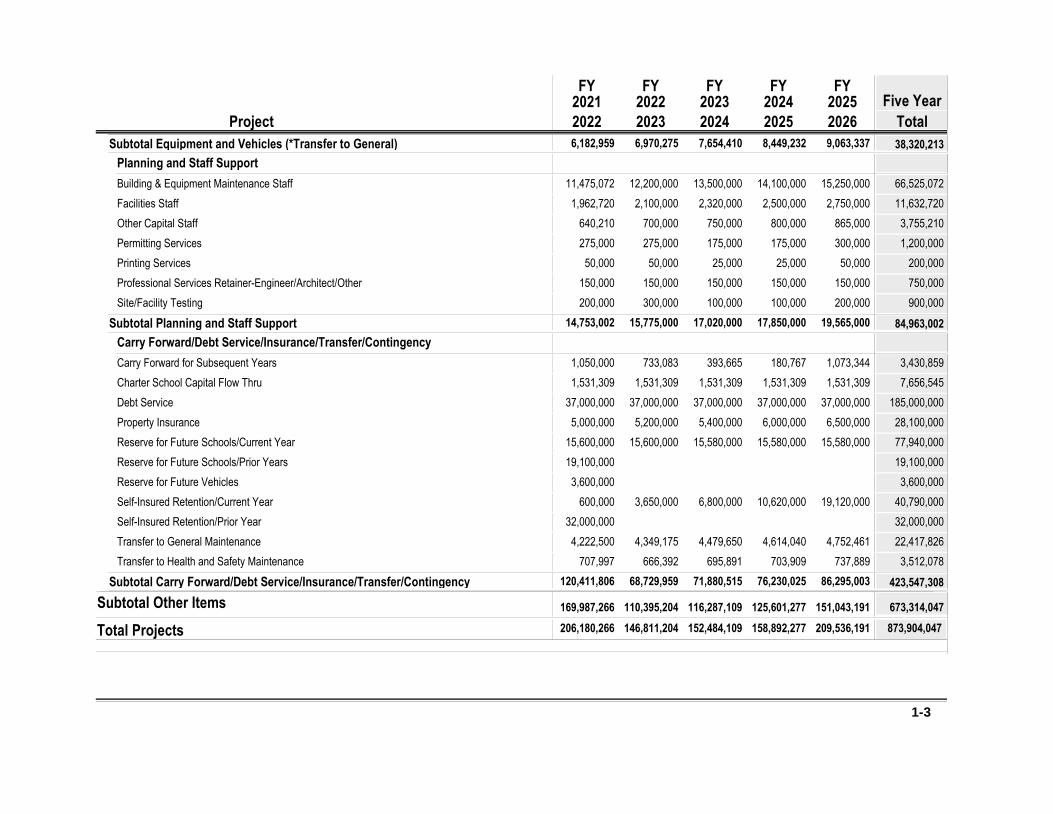
6,970,275 7,654,410 8,449,232 9,063,337Subtotal Equipment and Vehicles (*Transfer to General) 38,320,2136,182,959
Planning and Staff Support
Building & Equipment Maintenance Staff 12,200,000 13,500,000 14,100,000 15,250,000 66,525,07211,475,072
Facilities Staff 2,100,000 2,320,000 2,500,000 2,750,000 11,632,7201,962,720
Other Capital Staff 700,000 750,000 800,000 865,000 3,755,210640,210
Permitting Services 275,000 175,000 175,000 300,000 1,200,000275,000
Printing Services 50,000 25,000 25,000 50,000 200,00050,000
Professional Services Retainer-Engineer/Architect/Other 150,000 150,000 150,000 150,000 750,000150,000
Site/Facility Testing 300,000 100,000 100,000 200,000 900,000200,000
15,775,000 17,020,000 17,850,000 19,565,000Subtotal Planning and Staff Support 84,963,00214,753,002
Carry Forward/Debt Service/Insurance/Transfer/Contingency
Carry Forward for Subsequent Years 733,083 393,665 180,767 1,073,344 3,430,8591,050,000
Charter School Capital Flow Thru 1,531,309 1,531,309 1,531,309 1,531,309 7,656,5451,531,309
Debt Service 37,000,000 37,000,000 37,000,000 37,000,000 185,000,00037,000,000
Property Insurance 5,200,000 5,400,000 6,000,000 6,500,000 28,100,0005,000,000
Reserve for Future Schools/Current Year 15,600,000 15,580,000 15,580,000 15,580,000 77,940,00015,600,000
Reserve for Future Schools/Prior Years 19,100,00019,100,000
Reserve for Future Vehicles 3,600,0003,600,000
Self-Insured Retention/Current Year 3,650,000 6,800,000 10,620,000 19,120,000 40,790,000600,000
Self-Insured Retention/Prior Year 32,000,00032,000,000
Transfer to General Maintenance 4,349,175 4,479,650 4,614,040 4,752,461 22,417,8264,222,500
Transfer to Health and Safety Maintenance 666,392 695,891 703,909 737,889 3,512,078707,997
68,729,959 71,880,515 76,230,025 86,295,003Subtotal Carry Forward/Debt Service/Insurance/Transfer/Contingency 423,547,308120,411,806
110,395,204 116,287,109 125,601,277 151,043,191Subtotal Other Items 673,314,047 169,987,266
146,811,204 152,484,109 158,892,277 209,536,191206,180,266Total Projects 873,904,047
1-3
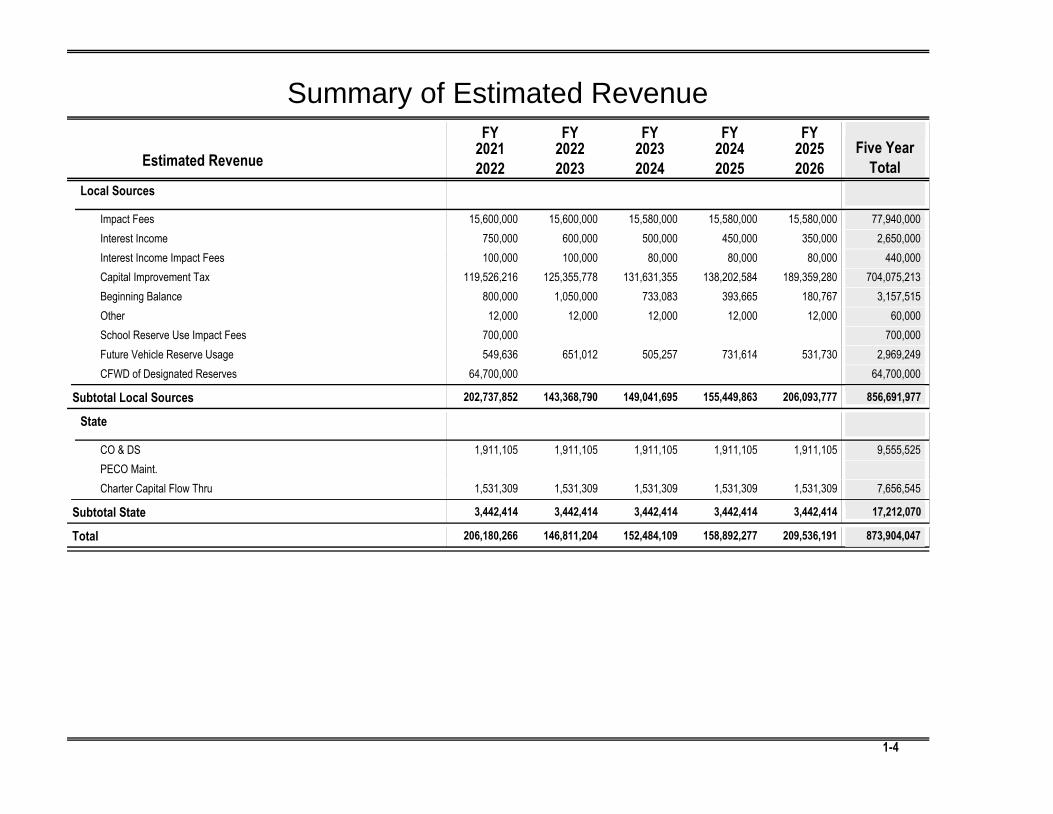
Summary of Estimated Revenue
Estimated Revenue2022
2021FY
2023
2022FY
2024
2023FY
2025
2024FY
2026
2025FY
Total
Five Year
Local Sources
Impact Fees 15,600,000 15,600,000 15,580,000 15,580,000 15,580,000 77,940,000
Interest Income 750,000 600,000 500,000 450,000 350,000 2,650,000
Interest Income Impact Fees 100,000 100,000 80,000 80,000 80,000 440,000
Capital Improvement Tax 119,526,216 125,355,778 131,631,355 138,202,584 189,359,280 704,075,213
Beginning Balance 800,000 1,050,000 733,083 393,665 180,767 3,157,515
Other 12,000 12,000 12,000 12,000 12,000 60,000
School Reserve Use Impact Fees 700,000 700,000
Future Vehicle Reserve Usage 549,636 651,012 505,257 731,614 531,730 2,969,249
CFWD of Designated Reserves 64,700,000 64,700,000
202,737,852 143,368,790 149,041,695 155,449,863 206,093,777Subtotal Local Sources 856,691,977
State
CO & DS 1,911,105 1,911,105 1,911,105 1,911,105 1,911,105 9,555,525
PECO Maint.
Charter Capital Flow Thru 1,531,309 1,531,309 1,531,309 1,531,309 1,531,309 7,656,545
3,442,414 3,442,414 3,442,414 3,442,414 3,442,414Subtotal State 17,212,070
206,180,266 146,811,204 152,484,109 158,892,277 209,536,191Total 873,904,047
1-4
Chapter
2
Cha
p
ter
Chapter 2
The Collier County Planning Environment
2-1
Chapter 2
THE COLLIER COUNTY PLANNING ENVIRONMENT
INTRODUCTION Collier County Public Schools (CCPS) provides and maintains high quality school facilities for the residential communities of Collier County. Nearly 50% of CCPS schools have been built since 1990. There are 31 elementary schools, 10 middle schools, 8 high schools, one PK-12 school and various alternative and technical programs throughout the District. Collier County is a geographically large and demographically diverse county, where distinct residential communities have developed over time. These include; 1) coastal areas with predominately high density residential development and significant seasonal populations that include the cities of Naples and Marco Island, 2) urban areas characterized by single-family gated communities, 3) pre-platted rural area known as the Golden Gate Estates, 4) rural areas that when developed are required by local government to be in the form of “Rural” Villages and Towns, and 5) established agricultural and fishing communities such as Immokalee to the north and Everglades City to the southeast. Collier County had grown from a small agricultural/resort area of 38,040 people in 1970 to an estimated 257,926 permanent residents in 2000. Between 2000 and 2010 the permanent resident population grew to 322,653 an increase of 25.1%. Growth rates during this time period varied widely from as high as 4 to 5 percent annually from 2000 to 2004 to negative growth in 2008. Beginning in 2009 the housing market began to stabilize and by 2015 to 2020 annual average growth rate increased to over two percent. The 2021 total permanent population projected by the County is 395,249, a projected increase of 22.4% from 2011. CCPS experienced variations in growth rates and trends in its student
population between school years 2000/01 and 2010/11 as well. From 2000 to 2005, the school district grew by 8,718 Pre-Kindergarten through 12th grade students, experiencing annual increases ranging from 3% to as high as 6.5% annually. By the 2006/07 school year economic conditions sharply changed and CCPS experienced declines in student enrollment for two years in a row. Beginning in the 2008/09 school year traditional student enrollment has made modest gains every year up to the 2019/20 school year. Enrollment at the beginning of the 2020/21 school year was lower than originally forecast due to the impacts of the COVID-19 pandemic. Those impacts continue to diminish and by next school year growth rates are expected to return to historic levels.
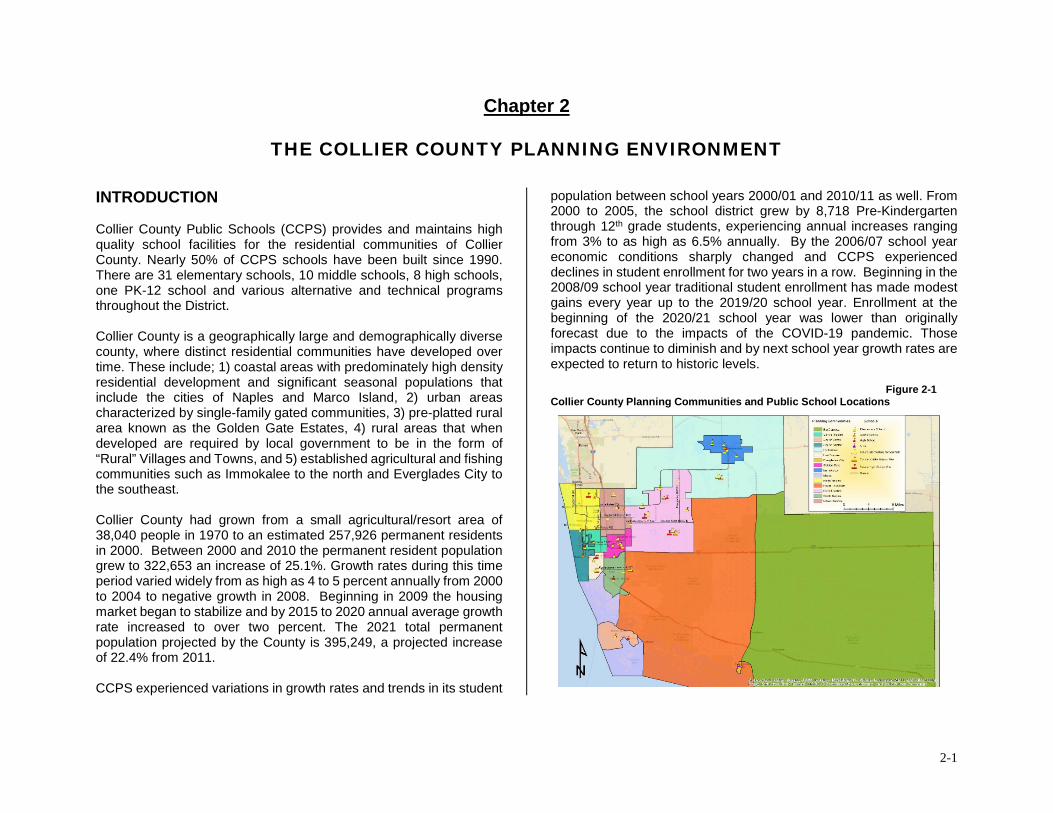
Figure 2-1
Collier County Planning Communities and Public School Locations
2-2
DEMOGRAPHIC CONTEXT CCPS relies primarily on a cohort survivorship method as the basis for projecting student changes in enrollment over a five year planning timeframe. Local government residential development approvals provide additional support for the five-year projections in enrollment. In a ten year planning timeframe, the locations and timing of population changes are the primary factor in estimating student projections. According to the County, the overall population will increase to an estimated 459,210 permanent residents by 2031.
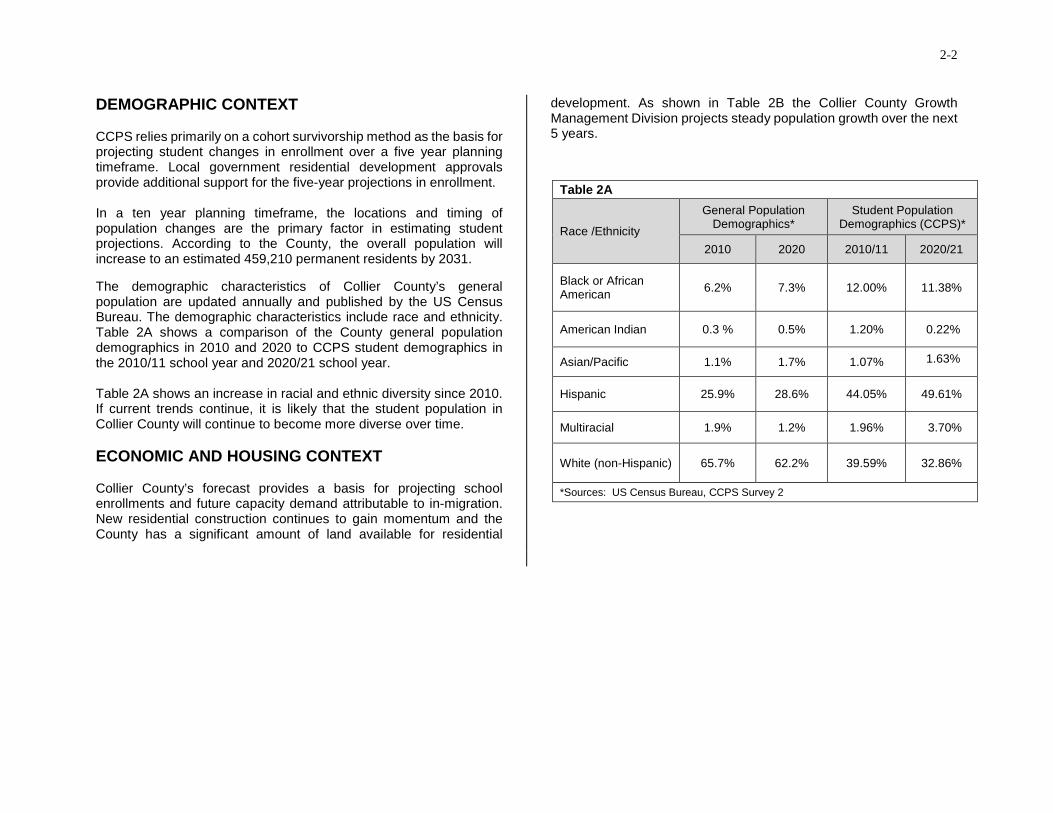
The demographic characteristics of Collier County’s general population are updated annually and published by the US Census Bureau. The demographic characteristics include race and ethnicity. Table 2A shows a comparison of the County general population demographics in 2010 and 2020 to CCPS student demographics in the 2010/11 school year and 2020/21 school year. Table 2A shows an increase in racial and ethnic diversity since 2010. If current trends continue, it is likely that the student population in Collier County will continue to become more diverse over time.
ECONOMIC AND HOUSING CONTEXT Collier County’s forecast provides a basis for projecting school enrollments and future capacity demand attributable to in-migration. New residential construction continues to gain momentum and the County has a significant amount of land available for residential
development. As shown in Table 2B the Collier County Growth Management Division projects steady population growth over the next 5 years.
Table 2A
Race /Ethnicity
General Population Demographics*
Student Population Demographics (CCPS)*
2010 2020 2010/11 2020/21
Black or African American
6.2% 7.3% 12.00% 11.38%
American Indian 0.3 % 0.5% 1.20% 0.22%
Asian/Pacific 1.1% 1.7% 1.07% 1.63%
Hispanic 25.9% 28.6% 44.05% 49.61%
Multiracial 1.9% 1.2% 1.96% 3.70%
White (non-Hispanic) 65.7% 62.2% 39.59% 32.86%
*Sources: US Census Bureau, CCPS Survey 2
2-3
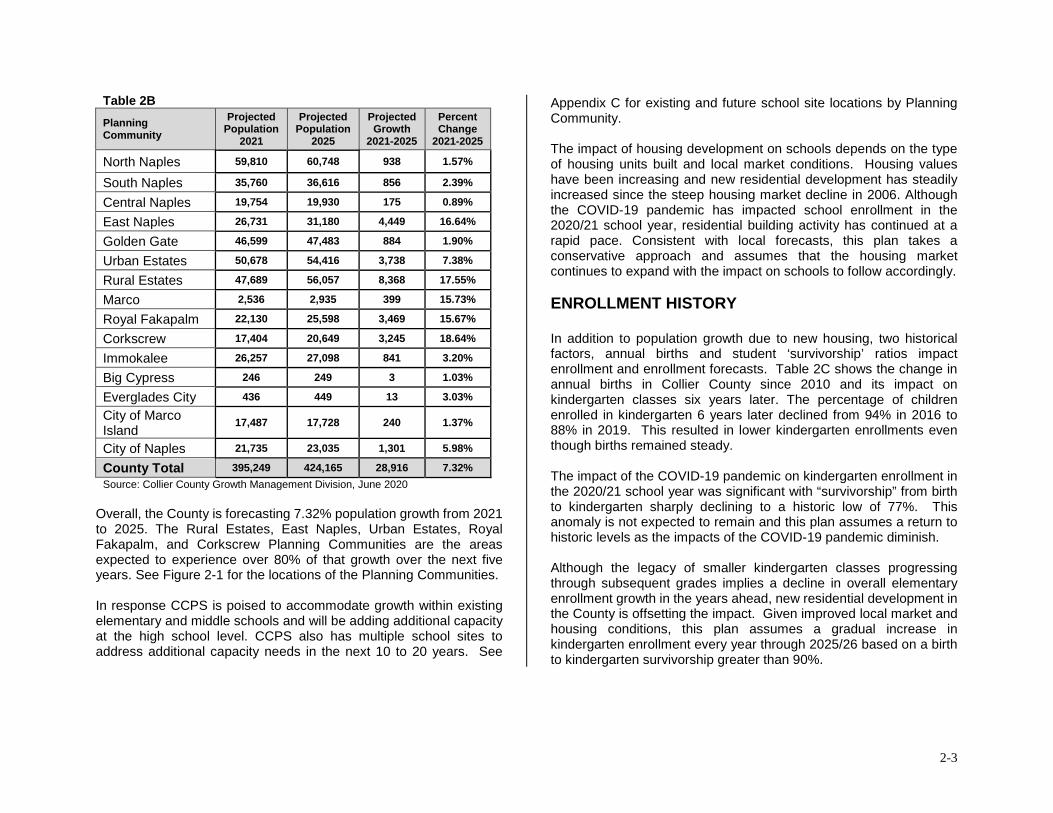
Overall, the County is forecasting 7.32% population growth from 2021 to 2025. The Rural Estates, East Naples, Urban Estates, Royal Fakapalm, and Corkscrew Planning Communities are the areas expected to experience over 80% of that growth over the next five years. See Figure 2-1 for the locations of the Planning Communities. In response CCPS is poised to accommodate growth within existing elementary and middle schools and will be adding additional capacity at the high school level. CCPS also has multiple school sites to address additional capacity needs in the next 10 to 20 years. See
Appendix C for existing and future school site locations by Planning Community. The impact of housing development on schools depends on the type of housing units built and local market conditions. Housing values have been increasing and new residential development has steadily increased since the steep housing market decline in 2006. Although the COVID-19 pandemic has impacted school enrollment in the 2020/21 school year, residential building activity has continued at a rapid pace. Consistent with local forecasts, this plan takes a conservative approach and assumes that the housing market continues to expand with the impact on schools to follow accordingly.
ENROLLMENT HISTORY In addition to population growth due to new housing, two historical factors, annual births and student ‘survivorship’ ratios impact enrollment and enrollment forecasts. Table 2C shows the change in annual births in Collier County since 2010 and its impact on kindergarten classes six years later. The percentage of children enrolled in kindergarten 6 years later declined from 94% in 2016 to 88% in 2019. This resulted in lower kindergarten enrollments even though births remained steady. The impact of the COVID-19 pandemic on kindergarten enrollment in the 2020/21 school year was significant with “survivorship” from birth to kindergarten sharply declining to a historic low of 77%. This anomaly is not expected to remain and this plan assumes a return to historic levels as the impacts of the COVID-19 pandemic diminish. Although the legacy of smaller kindergarten classes progressing through subsequent grades implies a decline in overall elementary enrollment growth in the years ahead, new residential development in the County is offsetting the impact. Given improved local market and housing conditions, this plan assumes a gradual increase in kindergarten enrollment every year through 2025/26 based on a birth to kindergarten survivorship greater than 90%.
Table 2B
Planning Community
Projected Population
2021
Projected Population
2025
Projected Growth
2021-2025
Percent Change
2021-2025
North Naples 59,810 60,748 938 1.57%
South Naples 35,760 36,616 856 2.39%
Central Naples 19,754 19,930 175 0.89%
East Naples 26,731 31,180 4,449 16.64%
Golden Gate 46,599 47,483 884 1.90%
Urban Estates 50,678 54,416 3,738 7.38%
Rural Estates 47,689 56,057 8,368 17.55%
Marco 2,536 2,935 399 15.73%
Royal Fakapalm 22,130 25,598 3,469 15.67%
Corkscrew 17,404 20,649 3,245 18.64%
Immokalee 26,257 27,098 841 3.20%
Big Cypress 246 249 3 1.03%
Everglades City 436 449 13 3.03%
City of Marco Island
17,487 17,728 240 1.37%
City of Naples 21,735 23,035 1,301 5.98%
County Total 395,249 424,165 28,916 7.32%
Source: Collier County Growth Management Division, June 2020
2-4
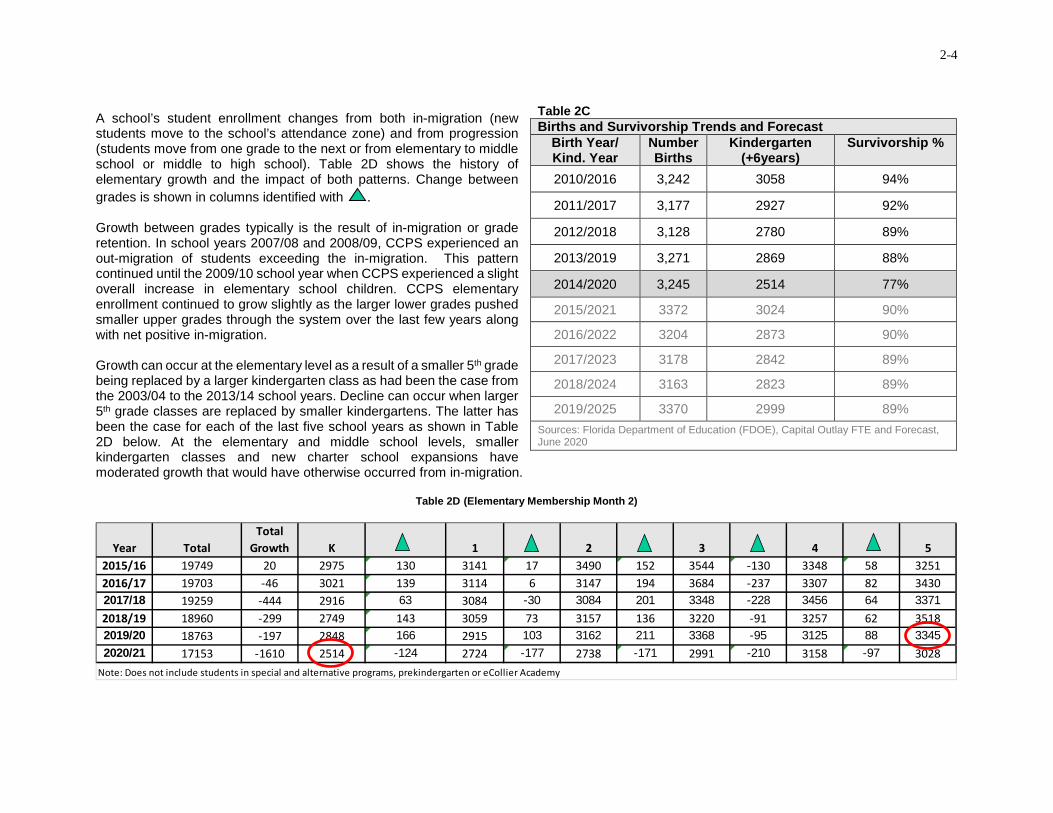
A school’s student enrollment changes from both in-migration (new students move to the school’s attendance zone) and from progression (students move from one grade to the next or from elementary to middle school or middle to high school). Table 2D shows the history of elementary growth and the impact of both patterns. Change between
grades is shown in columns identified with .
Growth between grades typically is the result of in-migration or grade retention. In school years 2007/08 and 2008/09, CCPS experienced an out-migration of students exceeding the in-migration. This pattern continued until the 2009/10 school year when CCPS experienced a slight overall increase in elementary school children. CCPS elementary enrollment continued to grow slightly as the larger lower grades pushed smaller upper grades through the system over the last few years along with net positive in-migration.
Growth can occur at the elementary level as a result of a smaller 5th grade being replaced by a larger kindergarten class as had been the case from the 2003/04 to the 2013/14 school years. Decline can occur when larger 5th grade classes are replaced by smaller kindergartens. The latter has been the case for each of the last five school years as shown in Table 2D below. At the elementary and middle school levels, smaller kindergarten classes and new charter school expansions have moderated growth that would have otherwise occurred from in-migration.
Table 2D (Elementary Membership Month 2)
Year TotalTotal
Growth K 1 2 3 4 52015/16 19749 20 2975 130 3141 17 3490 152 3544 -130 3348 58 32512016/17 19703 -46 3021 139 3114 6 3147 194 3684 -237 3307 82 34302017/18 19259 -444 2916 63 3084 -30 3084 201 3348 -228 3456 64 3371
2018/19 18960 -299 2749 143 3059 73 3157 136 3220 -91 3257 62 35182019/20 18763 -197 2848 166 2915 103 3162 211 3368 -95 3125 88 3345
2020/21 17153 -1610 2514 -124 2724 -177 2738 -171 2991 -210 3158 -97 3028Note: Does not include students in special and alternative programs, prekindergarten or eCollier Academy
Table 2C
Births and Survivorship Trends and Forecast
Birth Year/ Kind. Year
Number Births
Kindergarten (+6years)
Survivorship %
2010/2016 3,242 3058 94%
2011/2017 3,177 2927 92%
2012/2018 3,128 2780 89%
2013/2019 3,271 2869 88%
2014/2020 3,245 2514 77%
2015/2021 3372 3024 90%
2016/2022 3204 2873 90%
2017/2023 3178 2842 89%
2018/2024 3163 2823 89%
2019/2025 3370 2999 89%
Sources: Florida Department of Education (FDOE), Capital Outlay FTE and Forecast, June 2020
2-5
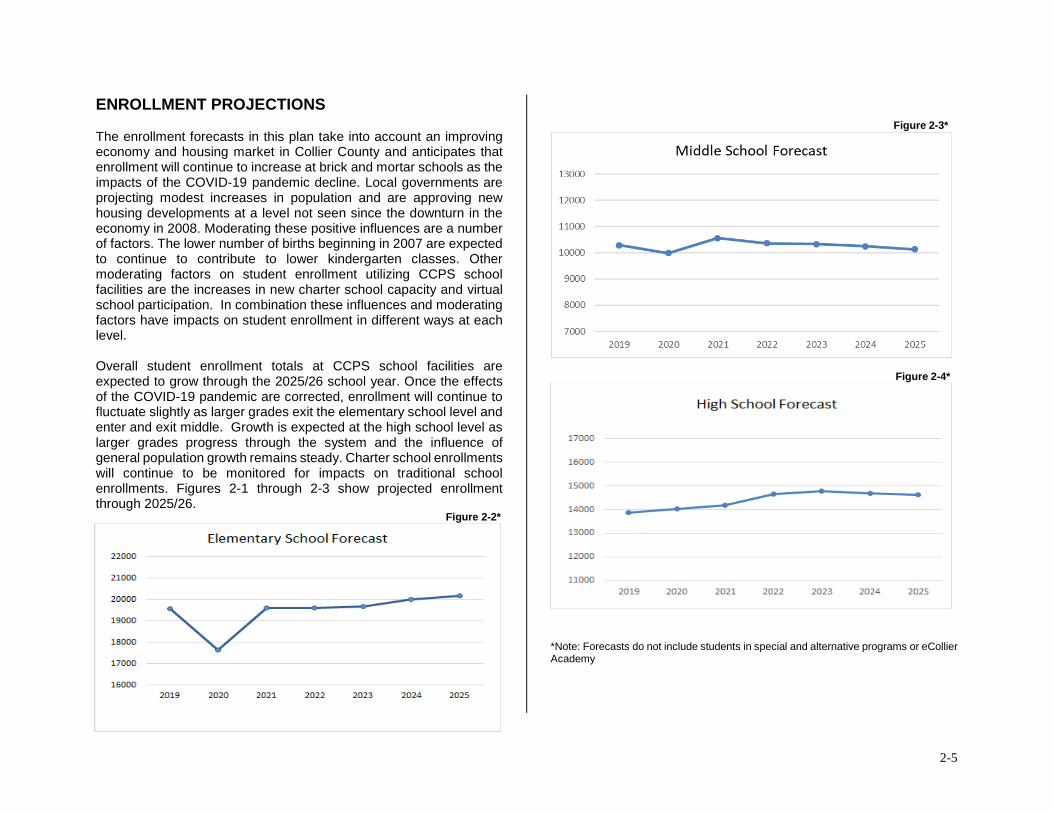
ENROLLMENT PROJECTIONS
The enrollment forecasts in this plan take into account an improving economy and housing market in Collier County and anticipates that enrollment will continue to increase at brick and mortar schools as the impacts of the COVID-19 pandemic decline. Local governments are projecting modest increases in population and are approving new housing developments at a level not seen since the downturn in the economy in 2008. Moderating these positive influences are a number of factors. The lower number of births beginning in 2007 are expected to continue to contribute to lower kindergarten classes. Other moderating factors on student enrollment utilizing CCPS school facilities are the increases in new charter school capacity and virtual school participation. In combination these influences and moderating factors have impacts on student enrollment in different ways at each level.
Overall student enrollment totals at CCPS school facilities are expected to grow through the 2025/26 school year. Once the effects of the COVID-19 pandemic are corrected, enrollment will continue to fluctuate slightly as larger grades exit the elementary school level and enter and exit middle. Growth is expected at the high school level as larger grades progress through the system and the influence of general population growth remains steady. Charter school enrollments will continue to be monitored for impacts on traditional school enrollments. Figures 2-1 through 2-3 show projected enrollment through 2025/26.
Figure 2-2*
Figure 2-3*
Figure 2-4*
*Note: Forecasts do not include students in special and alternative programs or eCollierAcademy
2-6
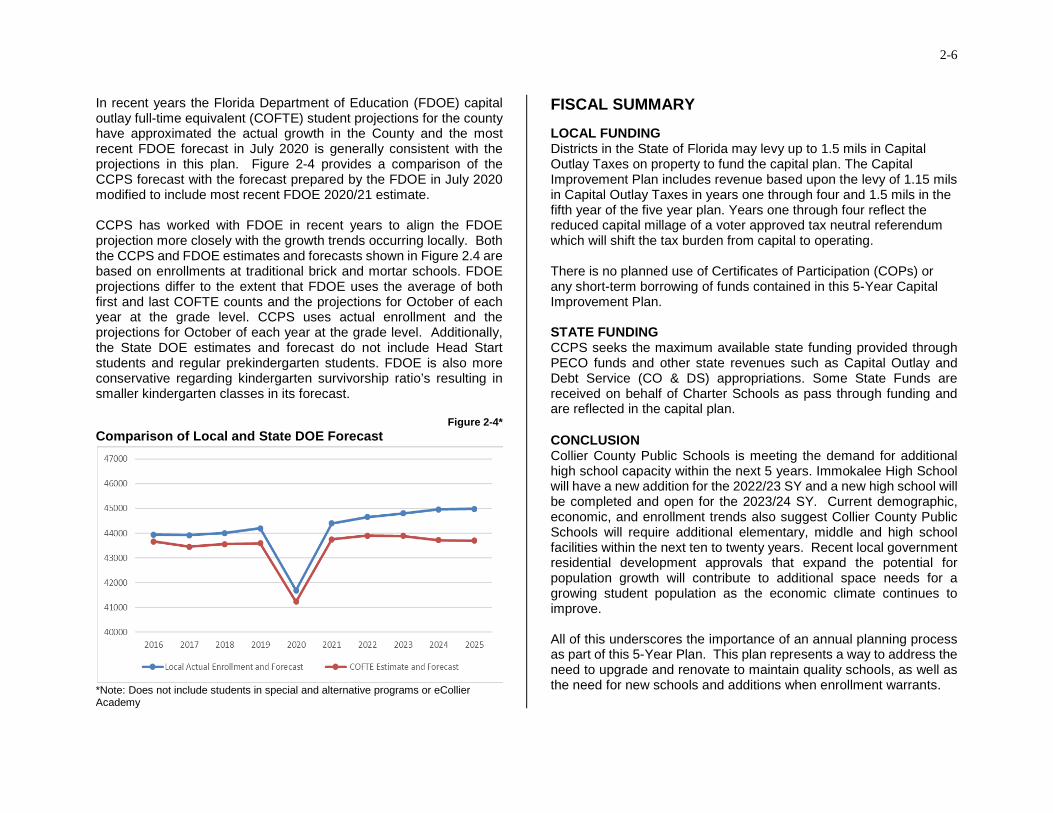
In recent years the Florida Department of Education (FDOE) capital outlay full-time equivalent (COFTE) student projections for the county have approximated the actual growth in the County and the most recent FDOE forecast in July 2020 is generally consistent with the projections in this plan. Figure 2-4 provides a comparison of the CCPS forecast with the forecast prepared by the FDOE in July 2020 modified to include most recent FDOE 2020/21 estimate. CCPS has worked with FDOE in recent years to align the FDOE projection more closely with the growth trends occurring locally. Both the CCPS and FDOE estimates and forecasts shown in Figure 2.4 are based on enrollments at traditional brick and mortar schools. FDOE projections differ to the extent that FDOE uses the average of both first and last COFTE counts and the projections for October of each year at the grade level. CCPS uses actual enrollment and the projections for October of each year at the grade level. Additionally, the State DOE estimates and forecast do not include Head Start students and regular prekindergarten students. FDOE is also more conservative regarding kindergarten survivorship ratio’s resulting in smaller kindergarten classes in its forecast.
Figure 2-4*
Comparison of Local and State DOE Forecast
*Note: Does not include students in special and alternative programs or eCollier Academy
FISCAL SUMMARY
LOCAL FUNDING Districts in the State of Florida may levy up to 1.5 mils in Capital Outlay Taxes on property to fund the capital plan. The Capital Improvement Plan includes revenue based upon the levy of 1.15 mils in Capital Outlay Taxes in years one through four and 1.5 mils in the fifth year of the five year plan. Years one through four reflect the reduced capital millage of a voter approved tax neutral referendum which will shift the tax burden from capital to operating. There is no planned use of Certificates of Participation (COPs) or any short-term borrowing of funds contained in this 5-Year Capital Improvement Plan. STATE FUNDING CCPS seeks the maximum available state funding provided through PECO funds and other state revenues such as Capital Outlay and Debt Service (CO & DS) appropriations. Some State Funds are received on behalf of Charter Schools as pass through funding and are reflected in the capital plan.
CONCLUSION Collier County Public Schools is meeting the demand for additional high school capacity within the next 5 years. Immokalee High School will have a new addition for the 2022/23 SY and a new high school will be completed and open for the 2023/24 SY. Current demographic, economic, and enrollment trends also suggest Collier County Public Schools will require additional elementary, middle and high school facilities within the next ten to twenty years. Recent local government residential development approvals that expand the potential for population growth will contribute to additional space needs for a growing student population as the economic climate continues to improve. All of this underscores the importance of an annual planning process as part of this 5-Year Plan. This plan represents a way to address the need to upgrade and renovate to maintain quality schools, as well as the need for new schools and additions when enrollment warrants.
Chapter
3
Chapter 3
Facilities Planning Process and Components
3-1
Chapter 3
FACILITIES PLANNING PROCESS AND COMPONENTS
INTRODUCTION
The 5-Year Capital Improvement Program (CIP) is the foundation of an annual planning process that allows Collier County Public Schools (CCPS) to effectively address changing enrollment patterns, development and growth, and sustains the facility requirements of high quality educational programs. The major components of this process are outlined below.
Major Steps in the Annual Planning Process include:
Preparing an updated 5-Year enrollment forecast on a school-by-school basis
Updating school facilities and program information, as warranted
Comparing enrollment projections to available capacity Developing / confirming capital and non-capital solutions to
meet facility needs due to growth and class-size reduction Assessing the fiscal environment Adjusting the 5-Year CIP, as required Finalizing the CIP Adopting the Capital Budget for the next fiscal year
STATE REQUIREMENTS
Five Year Work Plan In 1998 the Florida legislature passed the Smart Schools initiative. This legislation provides guidelines for addressing school overcrowding and includes a number of requirements for all Florida districts. One of these requirements is the annual submission of a
5-Year Work Plan. This annual document must include, at a minimum, the following information:
• A schedule of major repair and renovation projects.
• A schedule of capital outlay projects necessary to ensure the availability of satisfactory student stations.
• The projected cost for each project identified in the Work Plan.
• A schedule of capital outlay revenues.
• A list of projects to be funded from current revenues.
• A set of options for the generation of additional revenues for the projects identified in the Work Plan.
• Ten and twenty year projected enrollment and capital needs. This 5-Year Capital Improvement Plan is an expansion and reformatting of the State requirement and is used as the primary planning document for the provision of capital improvements across the District. The goal of the Plan is to encourage community support and understanding and assure public accountability.
Educational Plant Survey The 5-Year Work Plan is prepared in accordance with the Educational Plant Survey. The Educational Plant Survey recommends all possible projects that a school district should undertake to meet projected enrollment and bring all schools up to current state and local standards. The Survey must be prepared every five years but may be updated as often as needed to be consistent with local plans. These two documents should be coordinated in light of growth planning goals and guidelines.
3-2
ENROLLMENT FORECASTING
In accordance with Florida Department of Education guidelines, CCPS annually prepares or updates enrollment forecasts following a review of local government planning area population projections and school level trends. A history of each school’s grade-by-grade enrollment is compiled and analyzed. This history reveals patterns in the “aging” or progression (less out-migration factors) of students from one grade to the next. These patterns are extrapolated to develop a school’s basic forecast. This approach, termed the Cohort-Survivorship Model, is the most widely applied forecasting method for schools. Enrollment projections for CCPS are prepared annually using school and grade-level enrollment information. The Cohort-Survivorship method “ages” students ahead grade by grade and calculates change for future years based on an historic trend. The data yielded by the basic survivorship model is the foundation for enrollment projections. The model data is then compared to projected county population growth associated with new housing starts to provide an indication of future growth patterns. The most difficult segment of the K-12 population to predict is each year’s kindergarten class. In order to project the kindergarten population for each year of the CIP, statistical profiles of residential birth data are drawn, then matched to anticipated growth patterns and applied to individual schools. Finally, the forecast is compared to the Florida Department of Education (FDOE) forecast for CCPS. To the extent feasible, the forecasts are then reconciled. Any remaining differences should be explainable in light of specific Collier County data. Recognizing the uncertainty that surrounds forecasts, the District needs to annually review the enrollment projections for adjustments. Demographic shifts are to be expected in counties like Collier with fluctuating economic conditions, diverse communities, and the potential for new towns in undeveloped agricultural lands. Annual changes in school programs can also generate near-term facility needs. Staff works with local government planners to encourage an on-going exchange of
information that fosters proactive planning rather than reactive problem solving.
CAPACITY ANALYSIS
CCPS uses the Florida Inventory of School Houses (FISH) capacity information for each school, based on Florida Department of Education (FDOE) formulas. FISH Capacity Defined FISH (School) Capacity is the number of students that may be housed in a facility (school) at any given time. FISH is based on a utilization percentage of the number of existing satisfactory student stations, based on FDOE formulas. It is a product of the number of classrooms at a school and the student stations assigned to each room type. Unless noted otherwise portable classrooms are not included in the FISH capacity contained herein. The capacity of some spaces is modified for actual square footage of the teaching space.
Teaching stations are roughly defined as being 600 square feet or more with a teacher and students regularly assigned to the space. Class Size Reduction (CSR) Class size and how it is calculated effects the overall student capacity of a school. In 2002, an amendment to the Florida Constitution set limits on the number of students per classroom to 18 students in Prekindergarten through grade 3, 22 students in grades 4 through 8, and 25 students in grades 9 through 12 in core curriculum areas such as Math, English and Science. Districts had been required to strictly adhere to class size limits on a class-by-class basis since 2010 or face penalties. Subsequently, legislative changes shifted the way class size compliance is calculated to provide more flexibility for those Districts that meet specific criteria. Instead of basing compliance on a class-by-class basis, some school districts including CCPS are now allowed to use school-wide average.
3-3
Concurrency The objective of concurrency for local governments and other public facility and service providers is that the necessary public facilities and services (roads, libraries, parks, etc) are available when the impacts of development occur. Collier County implemented concurrency for CCPS schools in 2008/09 by entering into agreements with Collier County, and the cities of Everglades City, Marco Island and Naples. In the agreements the Five Year Work Plan must be a financially feasible plan that meets a level of service standard (LOSS). LOSS is based on utilization of school facilities which is a factor of enrollment to capacity. CCPS has adopted a district-wide LOSS of 95% of the permanent Florida Inventory of School Houses (FISH) capacity for elementary and middle schools, and 100% of permanent FISH capacity for high schools.
PLANT SURVEY RENOVATIONS/ADDITIONS
Schools built in Collier County today are expected to provide an appropriate learning environment for children. During that building life cycle, they must be expandable, contractible and adaptable. The newly adopted Educational Plant Survey identifies educational plant updates for nearly every Collier County Public School. Additions include new classrooms, resource rooms, and expanded media and dining. Many of these schools were built in the last 15 to 20 years. An addition to an existing high school is included as well as the planning and construction of a new high school Parallel to these ‘upgrade’ projects and capacity additions, the District manages a comprehensive maintenance program that addresses the needs of the physical plant including replacing roofs, HVAC equipment, and flooring.
For newer schools this approach to upgrades and renovations ensures that buildings are able to meet the educational needs of the programs and remain safe and comfortable throughout their useful life. Typically, school buildings have a useful life of 35-40 years before they require a more comprehensive renovation or modernization. To address these older buildings, CCPS has historically evaluated older schools and systematically scheduled schools for comprehensive modernization projects. Modernization is defined herein as “a comprehensive upgrading of an existing school to ‘like new’ school standards”. Modernization is the replacement or rehabilitation of all major physical systems (HVAC, windows, lighting, work surfaces, etc.). It is also the expansion and remodeling of spaces to comply with current facilities standards. A modernization addresses the school building as an integrated system and considers such issues as delivery of the instructional program, student circulation, and the relationships of core facilities, security concerns, and site access. A modernized school is expected to begin its life cycle again as though it were a new building.
MAJOR MAINTENANCE PROGRAM
Buildings and their major components have a limited life cycle that begins with the opening of a new school and culminates in a modernization or replacement. As building components reach the end of their useful life, they become operationally unreliable, often energy inefficient and require extensive maintenance time and money. CCPS provides for the maintenance of school buildings through the support of the operating and capital budgets. District-wide projects ensure the routine maintenance, repair, and replacement of building components such as roofs, and HVAC systems.
3-4
INFORMATION TECHNOLOGY
CCPS relies on data to make informed decisions for both business and instruction. The role of technology is to provide efficient communication between business systems and schools; to provide CCPS users with immediate access to accurate information; to use productivity tools effectively in the schools and the workplace; and to provide a variety of technology within the classroom to deliver as well as supplement instruction and show evidence of student learning. Currently, all public schools are connected through their school’s Local Area Network (LAN) to the CCPS Wide Area Network (WAN) providing access to information via the District’s Student Information System (SIS), Internet, and intranet in a secure manner. CCPS users depend on the information and resources provided via these networks. Continued migration from paper to electronic systems in a user-friendly format provides users with current information available at their fingertips. With foresight, commitment, and an up-to-date strategic technology plan, CCPS has continued to work toward the technology foundation for a 21st century school system. However, changing technology requires systematic upgrades to continue accurate state reporting and easier access to CCPS information, and to provide rich, educationally worthwhile technological experiences in the classroom.
COUNTY-WIDE EQUIPMENT AND MATERIALS
The regular maintenance and replacement of materials and equipment to support the educational programs is important to the viability of older schools. The CIP includes a reliable funding source to ensure a systematic approach to equipment replacement. This category includes the replacement of vehicles, buses, furniture and multi-media equipment.
CONCLUSION
The planning process is continuous, allowing for coordination with the local governments and communities, capital projects to add student capacity, modernization of existing facilities to provide an equitable school system, improvements to provide for safer environments and improved technology to better plan and communicate. The process is an essential balancing act to meet students’ needs with available resources and financial capabilities. It is the process that guides CCPS responsibilities and accomplishments for the overall benefit of the students.
Chapter
4
Chapter 4
Planning Goals and Recommendations
4-1
Chapter 4
PLANNING GOALS AND RECOMMENDATIONS
INTRODUCTION
This chapter provides a summary of the recommendations in the Capital Improvement Program (CIP). The recommendations are grouped under the following goals:
Goal 1: Build space for students and programs; plan the use of temporary space to meet peak enrollment periods; evaluate other solutions to capital needs, such as boundary or program changes.
Goal 2: Update schools on a systematic schedule to
guarantee safe, up-to-date facilities that meet changing educational program needs. Provide funding for maintenance and system renovation on a schedule.
Goal 3: Support a Technology Plan that provides students
and staff members continued access to contemporary educational technology.
Goal 4: Provide for the systematic replacement of equipment
and materials to support the educational program and transportation needs of a growing county.
Goal 5: Develop a long-range facilities plan that is fiscally
responsible.
These recommendations and goals are the foundation of the CIP and the continuation of a systematic, consistent process for addressing the long-range facilities needs of Collier County Public Schools (CCPS).
As such, they are more than just a response to Florida’s legislative mandates or long standing capacity needs; in fact, they comprise a balanced plan to relieve crowded schools, upgrade older facilities, meet technological challenges and efficiently care for the facility heritage of CCPS. The recommendations in the CIP support a focus on instructional programs as the cornerstones of facility planning and design.
IMPLEMENTING THE GOALS
Goal 1: Build space for students and programs; plan the use of temporary space to meet peak enrollment periods; evaluate other solutions to capital needs, such as boundary or program changes
To carry out this Goal the Plan incorporates the following strategies:
• Plan, engineer and construct new schools and additions to address growth when growth and projected enrollment support additional space.
• Expand core spaces (media centers, dining areas, administration and support spaces, and assembly spaces) as needed. Where site constraints limit facility expansion, reduce enrollment through student reassignments.
• Plan for and provide temporary space as short-term relief for schools experiencing overcrowding
• Incorporate long-range planning for choice, alternative programs, Pre-Kindergarten and Exceptional Student Education (ESE) programs.
4-2
• As space and funds become available, implement Board priorities and legislative mandates for:
o Class size reduction o Universal PreK implementation o Computer-based testing o Other programs as determined by the Board
• Develop articulation patterns that support cohesive communities as boundaries are modified.
• Purchase new sites necessary for future needs and expand existing smaller sites in coastal communities.
Program Planning Considerations The location of special programs is a key factor for recommending the size and design of new capacity. Long-range plans for these programs provide input into the facilities planning process and ensure that there are adequate facilities for all students. Five Year Facility Needs (2021/22-2025/26) To meet the facility needs of the projected enrollment at the high school level this plan includes a new high school and an addition to an existing high school. Temporary classrooms are also provided for in this plan to address overcrowding prior to the completion of permanent capacity at the high school level. See Chapter 1 of this plan (5 Year Capital Budget Summary) for information on the funding and timing of these projects.
Goal 2: Update schools on a systematic schedule to guarantee safe, up-to-date facilities that meet changing educational program needs. Provide funding for maintenance and system renovation on a schedule.
The District maintains a 20-year maintenance program. Detailed information by school is located in Chapter 6.
Goal 3: Support a Technology Plan that provides students and staff members continued access to contemporary educational technology.
The Educational Technology Budget is made up of three areas;
• Technology Infrastructure
• Classroom Technology Equipment
• Technology Retrofit
Within the framework of the Technology Infrastructure budget, the following areas are addressed;
• Switches and Routers
• Servers
• Network Storage
• Network Infrastructure Equipment
• Cabling & Fiber (new and repair)
• UPS Battery Back-ups
• Wireless Infrastructure and Equipment
• Other technology infrastructure equipment as needed
Classroom Technology Equipment includes;
• Student and staff computers and laptops
• ESE Adaptive Technology equipment
• Career Technology Equipment
• Printers, scanners and related peripheral devices for students and staff
• Other peripheral devices including headphones, microphones and related devices
• Computer Repair equipment and parts
• Administrative computer needs
• Other classroom instructional technology equipment such as TI Navigator / Graphing Calculators and Science Probes
4-3
Technology Retrofit includes classrooms that have hardware failure or end of life of technology-rich classroom equipment. This includes projectors, document cameras, interactive whiteboards and sound systems.
Goal 4: Provide for the systematic replacement of equipment and materials to support the educational program and transportation needs of a growing county.
To support the educational goals of the District, the following equipment and materials-related objectives for the 5-Year Capital Improvement Program have been developed.
• Ensure relevant equipment and materials are updated or replaced equitably throughout the county as the educational program changes.
• Systematically replace buses to guarantee safe and cost effective student transportation.
The recommendations for funding multi-media and other county-wide equipment assume a continuation of the programs.
Goal 5: Develop a long-range facilities plan that is fiscally responsible.
The CIP has been developed in accordance with Florida Statute that requires the development of a financially feasible plan where sufficient revenues are currently available or will be available from committed funding sources for the first 3 years, or will be available from committed or planned funding sources for years 4 and 5 of a five-year capital improvement schedule for financing capital improvements. Such funds must be adequate to fund the projected costs of the capital improvements identified in the CIP within the period covered by the 5-year schedule of capital improvements.
CCPS will affirm and strengthen its commitment to responsible construction oversight and fiscal “checks and balances” review. These steps will ensure the best of school construction practices and the lowest feasible cost for all projects listed in the CIP.
CONCLUSION
These five goals and their implementing strategies are the driving forces of the Capital Improvement Program. They embody a clear commitment to the citizens of this county that CCPS facilities will meet the challenges of capacity demand, technological change and responsible caretaking through efficient investments that transform ‘bricks and mortar’ into high performing schools for all students.

THIS PAGE INTENTIONALLY LEFT BLANK
Chapter
5
Chapter 5
School Enrollment and Recommendations
by Planning Area
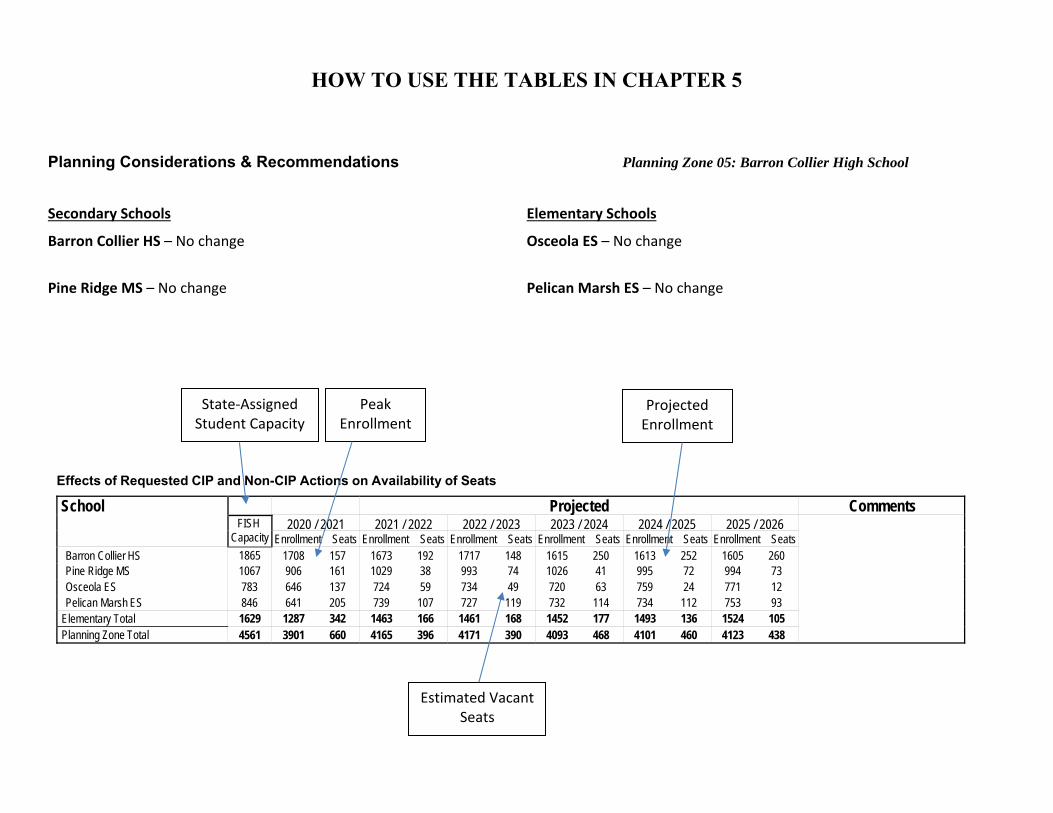
HOW TO USE THE TABLES IN CHAPTER 5
Planning Considerations & Recommendations Planning Zone 05: Barron Collier High School
Secondary Schools Elementary Schools
Barron Collier HS – No change Osceola ES – No change
Pine Ridge MS – No change Pelican Marsh ES – No change
Effects of Requested CIP and Non-CIP Actions on Availability of Seats
School Projected Comments FISH
Capacity 2020 / 2021 2021 / 2022 2022 / 2023 2023 / 2024 2024 / 2025 2025 / 2026
Enrollment Seats Enrollment Seats Enrollment Seats Enrollment Seats Enrollment Seats Enrollment Seats Barron Collier HS 1865 1708 157 1673 192 1717 148 1615 250 1613 252 1605 260 Pine Ridge MS 1067 906 161 1029 38 993 74 1026 41 995 72 994 73 Osceola ES 783 646 137 724 59 734 49 720 63 759 24 771 12 Pelican Marsh ES 846 641 205 739 107 727 119 732 114 734 112 753 93
Elementary Total 1629 1287 342 1463 166 1461 168 1452 177 1493 136 1524 105 Planning Zone Total 4561 3901 660 4165 396 4171 390 4093 468 4101 460 4123 438
State‐Assigned Student Capacity
Peak Enrollment
Projected Enrollment
Estimated Vacant Seats
Alternative and technical schools that do not have a specific geographic attendance boundary have not been assigned to a planning zone.
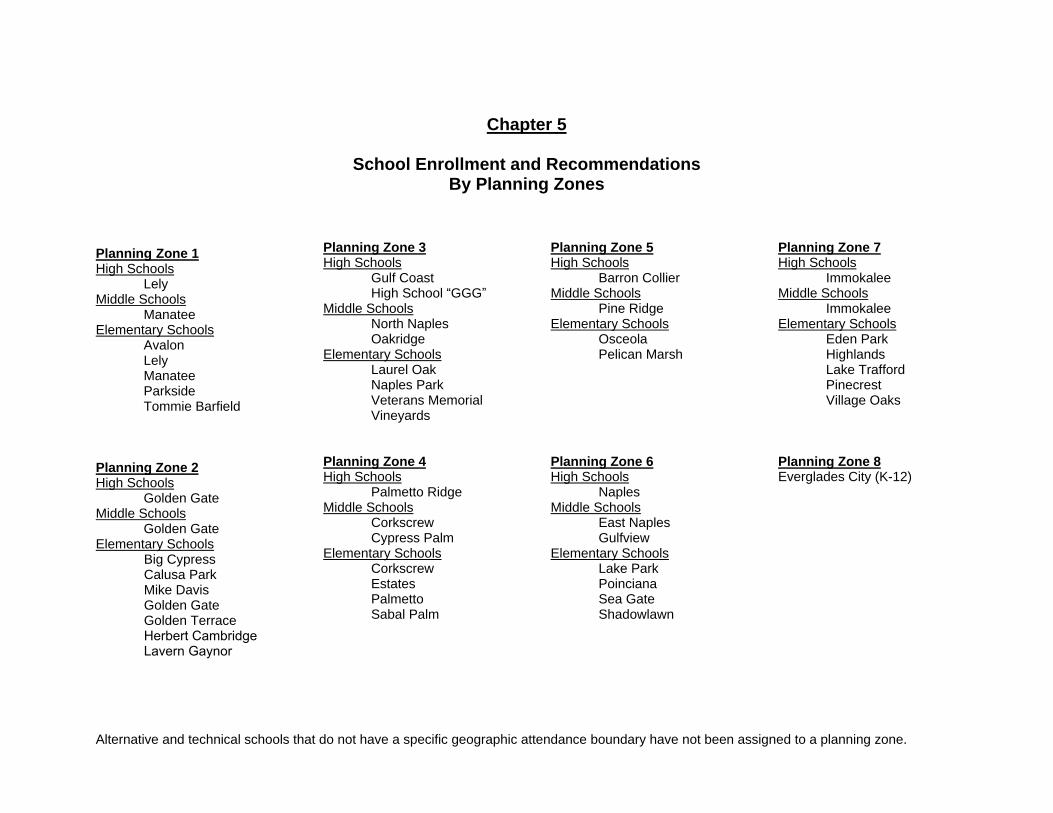
Chapter 5
School Enrollment and Recommendations By Planning Zones
Planning Zone 1 High Schools
Lely Middle Schools
Manatee Elementary Schools
Avalon Lely Manatee Parkside Tommie Barfield
Planning Zone 2 High Schools
Golden Gate Middle Schools
Golden Gate Elementary Schools
Big Cypress Calusa Park Mike Davis Golden Gate Golden Terrace Herbert Cambridge Lavern Gaynor
Planning Zone 3 High Schools
Gulf Coast High School “GGG”
Middle Schools North Naples Oakridge
Elementary Schools Laurel Oak Naples Park Veterans Memorial Vineyards
Planning Zone 4 High Schools
Palmetto Ridge Middle Schools
Corkscrew Cypress Palm
Elementary Schools Corkscrew Estates Palmetto Sabal Palm
Planning Zone 5 High Schools
Barron Collier Middle Schools
Pine Ridge Elementary Schools
Osceola Pelican Marsh
Planning Zone 6 High Schools
Naples Middle Schools
East Naples Gulfview
Elementary Schools Lake Park Poinciana Sea Gate Shadowlawn
Planning Zone 7 High Schools
Immokalee Middle Schools
Immokalee Elementary Schools
Eden Park Highlands Lake Trafford Pinecrest Village Oaks
Planning Zone 8 Everglades City (K-12)
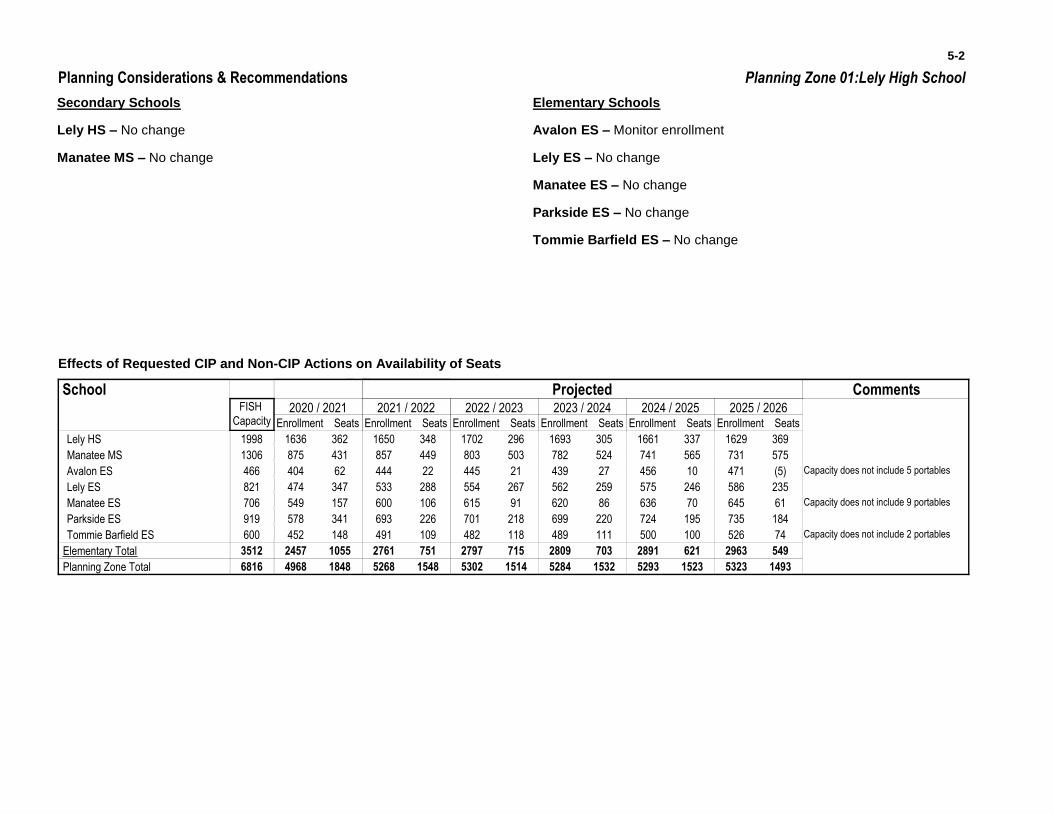
Planning Zone 01:Lely High SchoolPlanning Considerations & Recommendations
5-2
Secondary Schools
Lely HS – No change
Manatee MS – No change
Elementary Schools
Avalon ES – Monitor enrollment
Lely ES – No change
Manatee ES – No change
Parkside ES – No change
Tommie Barfield ES – No change
Effects of Requested CIP and Non-CIP Actions on Availability of Seats
School
Enrollment Seats
Projected
Enrollment Seats Enrollment Seats Enrollment Seats Enrollment Seats Enrollment Seats
2020 / 2021 2021 / 2022 2022 / 2023 2023 / 2024 2024 / 2025 2025 / 2026
CommentsFISH
Capacity
Lely HS 1998 1636 1650 1702 1693 1661 1629362 348 296 305 337 369
Manatee MS 1306 875 857 803 782 741 731431 449 503 524 565 575
Avalon ES 466 404 444 445 439 456 47162 22 21 27 10 (5) Capacity does not include 5 portables
Lely ES 821 474 533 554 562 575 586347 288 267 259 246 235
Manatee ES 706 549 600 615 620 636 645157 106 91 86 70 61 Capacity does not include 9 portables
Parkside ES 919 578 693 701 699 724 735341 226 218 220 195 184
Tommie Barfield ES 600 452 491 482 489 500 526148 109 118 111 100 74 Capacity does not include 2 portables
2761 2797 2809 2891 2963Elementary Total 1055 703 6213512 2457 751 715 549
4968 5268 5302 5284 5293 5323Planning Zone Total 6816 1848 1548 1514 1532 1523 1493
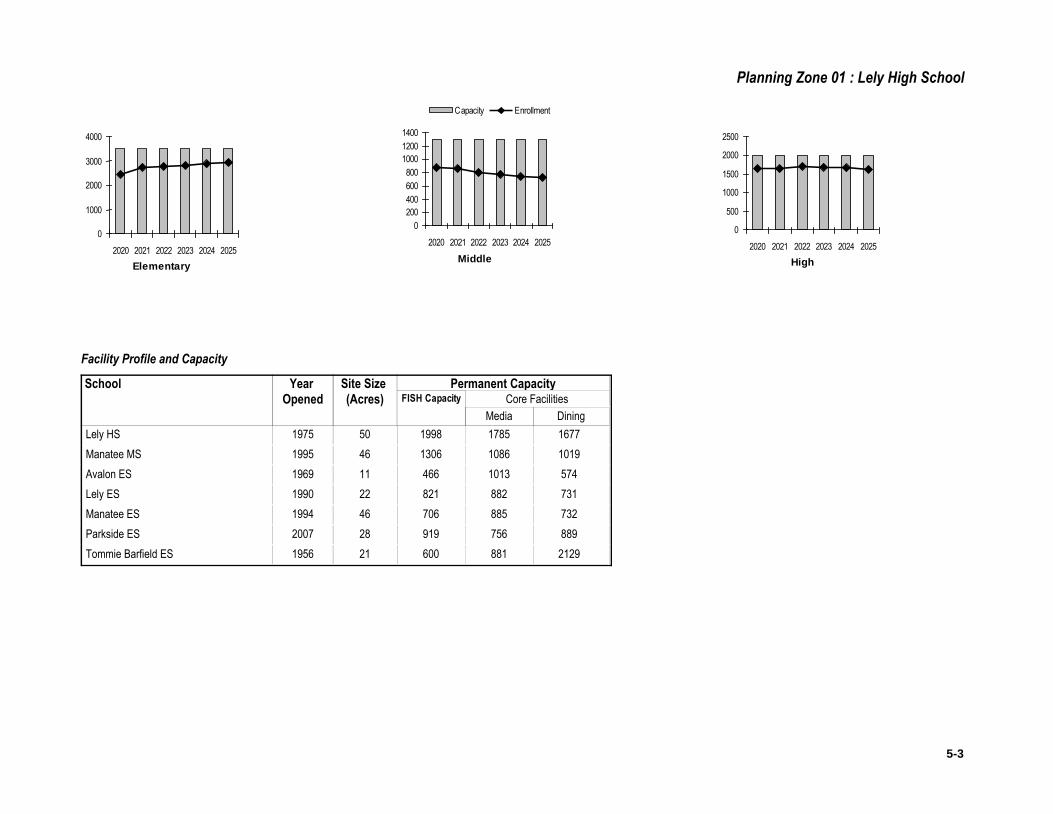
Planning Zone 01 : Lely High School
Facility Profile and Capacity
High
0
500
1000
1500
2000
2500
2020 2021 2022 2023 2024 2025
Elementary
0
1000
2000
3000
4000
2020 2021 2022 2023 2024 2025Middle
0
200
400
600
800
1000
1200
1400
2020 2021 2022 2023 2024 2025
Capacity Enrollment
School Year Opened
Site Size (Acres)
Media Dining
Permanent CapacityCore FacilitiesFISH Capacity
Lely HS 1975 50 1998 1785 1677
Manatee MS 1995 46 1306 1086 1019
Avalon ES 1969 11 466 1013 574
Lely ES 1990 22 821 882 731
Manatee ES 1994 46 706 885 732
Parkside ES 2007 28 919 756 889
Tommie Barfield ES 1956 21 600 881 2129
5-3
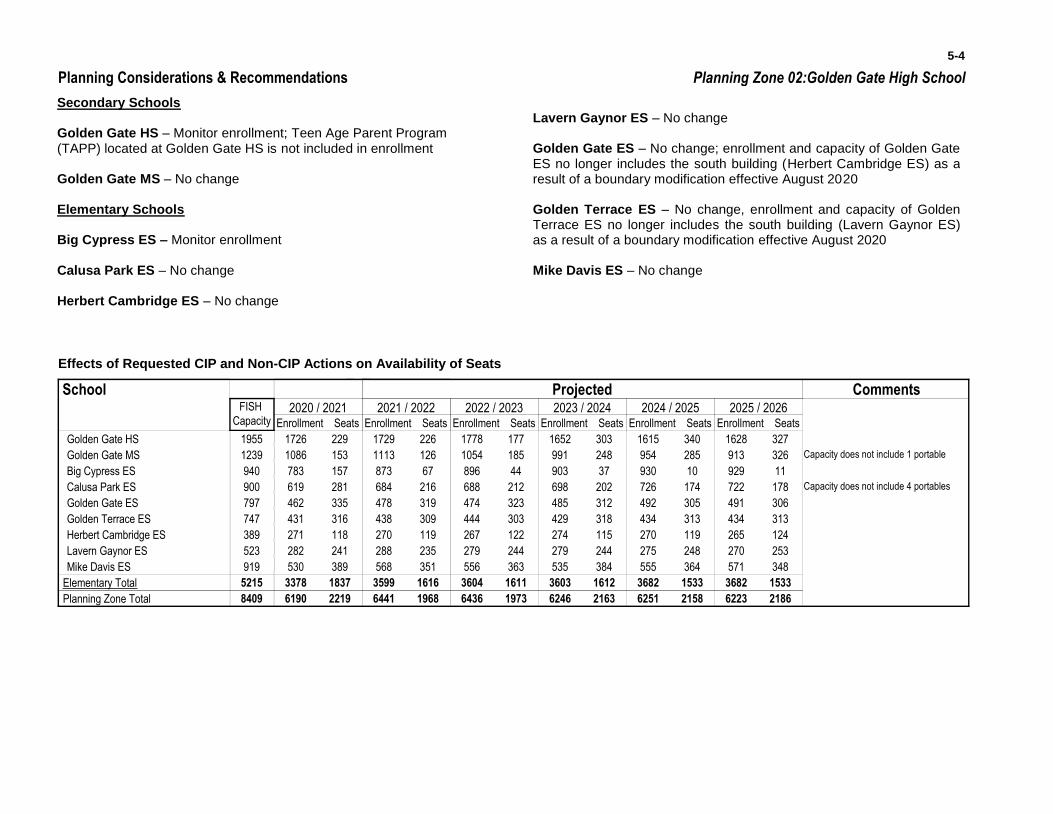
Planning Zone 02:Golden Gate High SchoolPlanning Considerations & Recommendations
5-4
Secondary Schools
Golden Gate HS – Monitor enrollment; Teen Age Parent Program (TAPP) located at Golden Gate HS is not included in enrollment
Golden Gate MS – No change
Elementary Schools
Big Cypress ES – Monitor enrollment
Calusa Park ES – No change
Herbert Cambridge ES – No change
Lavern Gaynor ES – No change
Golden Gate ES – No change; enrollment and capacity of Golden Gate ES no longer includes the south building (Herbert Cambridge ES) as a result of a boundary modification effective August 2020
Golden Terrace ES – No change, enrollment and capacity of Golden Terrace ES no longer includes the south building (Lavern Gaynor ES) as a result of a boundary modification effective August 2020
Mike Davis ES – No change
Effects of Requested CIP and Non-CIP Actions on Availability of Seats
School
Enrollment Seats
Projected
Enrollment Seats Enrollment Seats Enrollment Seats Enrollment Seats Enrollment Seats
2020 / 2021 2021 / 2022 2022 / 2023 2023 / 2024 2024 / 2025 2025 / 2026
CommentsFISH
Capacity
Golden Gate HS 1955 1726 1729 1778 1652 1615 1628229 226 177 303 340 327
Golden Gate MS 1239 1086 1113 1054 991 954 913153 126 185 248 285 326 Capacity does not include 1 portable
Big Cypress ES 940 783 873 896 903 930 929157 67 44 37 10 11
Calusa Park ES 900 619 684 688 698 726 722281 216 212 202 174 178 Capacity does not include 4 portables
Golden Gate ES 797 462 478 474 485 492 491335 319 323 312 305 306
Golden Terrace ES 747 431 438 444 429 434 434316 309 303 318 313 313
Herbert Cambridge ES 389 271 270 267 274 270 265118 119 122 115 119 124
Lavern Gaynor ES 523 282 288 279 279 275 270241 235 244 244 248 253
Mike Davis ES 919 530 568 556 535 555 571389 351 363 384 364 348
3599 3604 3603 3682 3682Elementary Total 1837 1612 15335215 3378 1616 1611 1533
6190 6441 6436 6246 6251 6223Planning Zone Total 8409 2219 1968 1973 2163 2158 2186
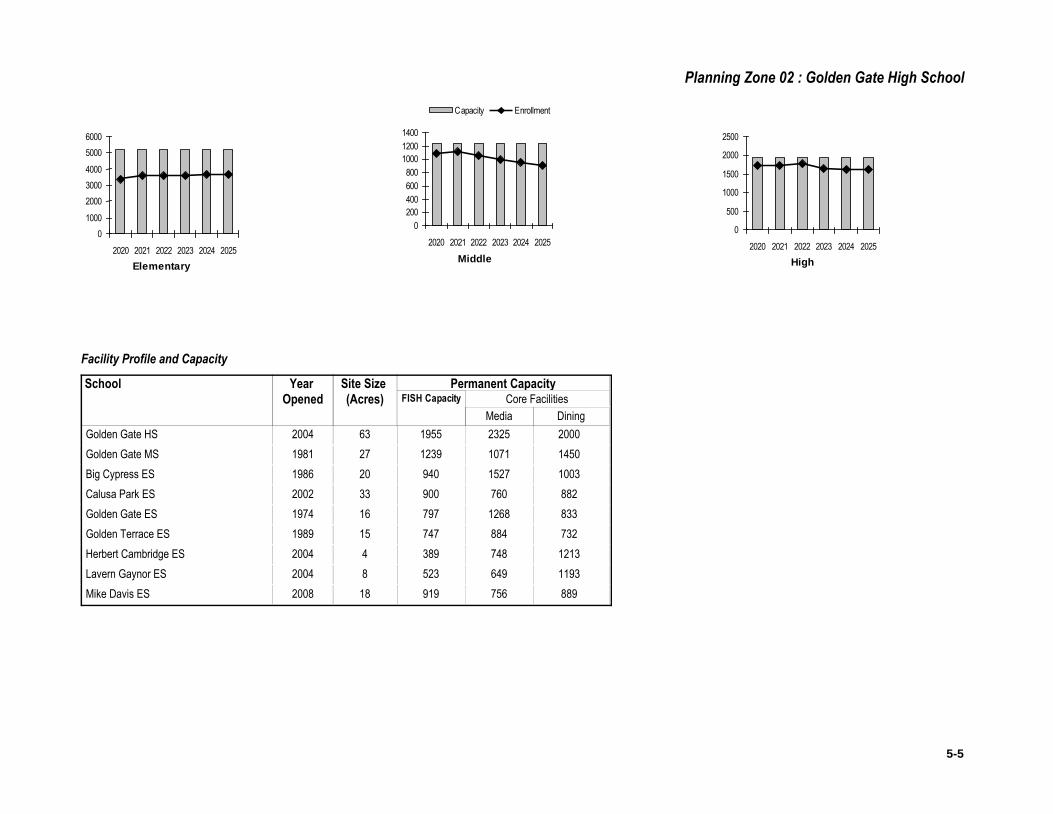
Planning Zone 02 : Golden Gate High School
Facility Profile and Capacity
High
0
500
1000
1500
2000
2500
2020 2021 2022 2023 2024 2025
Elementary
0
1000
2000
3000
4000
5000
6000
2020 2021 2022 2023 2024 2025Middle
0
200
400
600
800
1000
1200
1400
2020 2021 2022 2023 2024 2025
Capacity Enrollment
School Year Opened
Site Size (Acres)
Media Dining
Permanent CapacityCore FacilitiesFISH Capacity
Golden Gate HS 2004 63 1955 2325 2000
Golden Gate MS 1981 27 1239 1071 1450
Big Cypress ES 1986 20 940 1527 1003
Calusa Park ES 2002 33 900 760 882
Golden Gate ES 1974 16 797 1268 833
Golden Terrace ES 1989 15 747 884 732
Herbert Cambridge ES 2004 4 389 748 1213
Lavern Gaynor ES 2004 8 523 649 1193
Mike Davis ES 2008 18 919 756 889
5-5
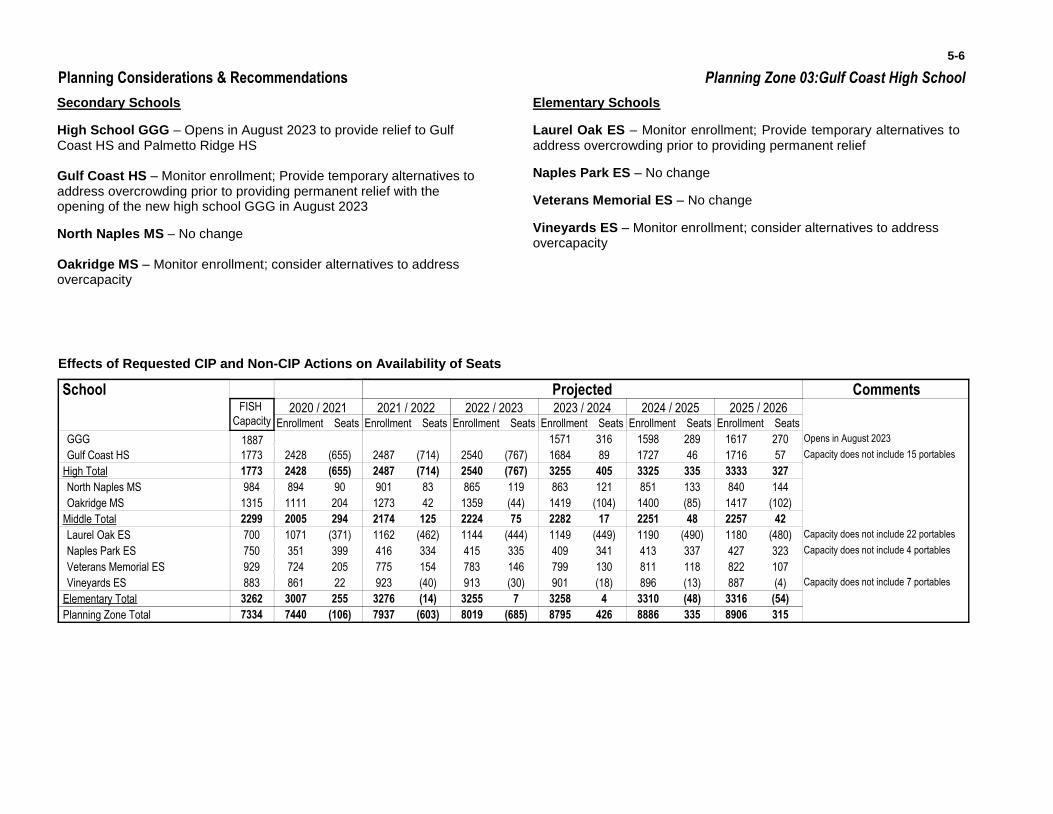
Planning Zone 03:Gulf Coast High SchoolPlanning Considerations & Recommendations
5-6
Secondary Schools
High School GGG – Opens in August 2023 to provide relief to Gulf Coast HS and Palmetto Ridge HS
Gulf Coast HS – Monitor enrollment; Provide temporary alternatives to address overcrowding prior to providing permanent relief with the opening of the new high school GGG in August 2023
North Naples MS – No change
Elementary Schools
Laurel Oak ES – Monitor enrollment; Provide temporary alternatives to address overcrowding prior to providing permanent relief
Naples Park ES – No change
Veterans Memorial ES – No change
Vineyards ES – Monitor enrollment; consider alternatives to address overcapacity
Oakridge MS – Monitor enrollment; consider alternatives to address overcapacity
Effects of Requested CIP and Non-CIP Actions on Availability of Seats
School
Enrollment Seats
Projected
Enrollment Seats Enrollment Seats Enrollment Seats Enrollment Seats Enrollment Seats
2020 / 2021 2021 / 2022 2022 / 2023 2023 / 2024 2024 / 2025 2025 / 2026
CommentsFISH
Capacity
GGG 1571 1598 1617316 289 270 Opens in August 2023
Gulf Coast HS 1773 2428 2487 2540 1684 1727 1716(655) (714) (767) 89 46 57 Capacity does not include 15 portables
2487 2540 3255 3325 3333High Total (655) 405 3351773 2428 (714) (767) 327
North Naples MS 984 894 901 865 863 851 84090 83 119 121 133 144
Oakridge MS 1315 1111 1273 1359 1419 1400 1417204 42 (44) (104) (85) (102)
2174 2224 2282 2251 2257Middle Total 294 17 482299 2005 125 75 42
Laurel Oak ES 700 1071 1162 1144 1149 1190 1180(371) (462) (444) (449) (490) (480) Capacity does not include 22 portables
Naples Park ES 750 351 416 415 409 413 427399 334 335 341 337 323 Capacity does not include 4 portables
Veterans Memorial ES 929 724 775 783 799 811 822205 154 146 130 118 107
Vineyards ES 883 861 923 913 901 896 88722 (40) (30) (18) (13) (4) Capacity does not include 7 portables
3276 3255 3258 3310 3316Elementary Total 255 4 (48)3262 3007 (14) 7 (54)
7440 7937 8019 8795 8886 8906Planning Zone Total 7334 (106) (603) (685) 426 335 315
1887
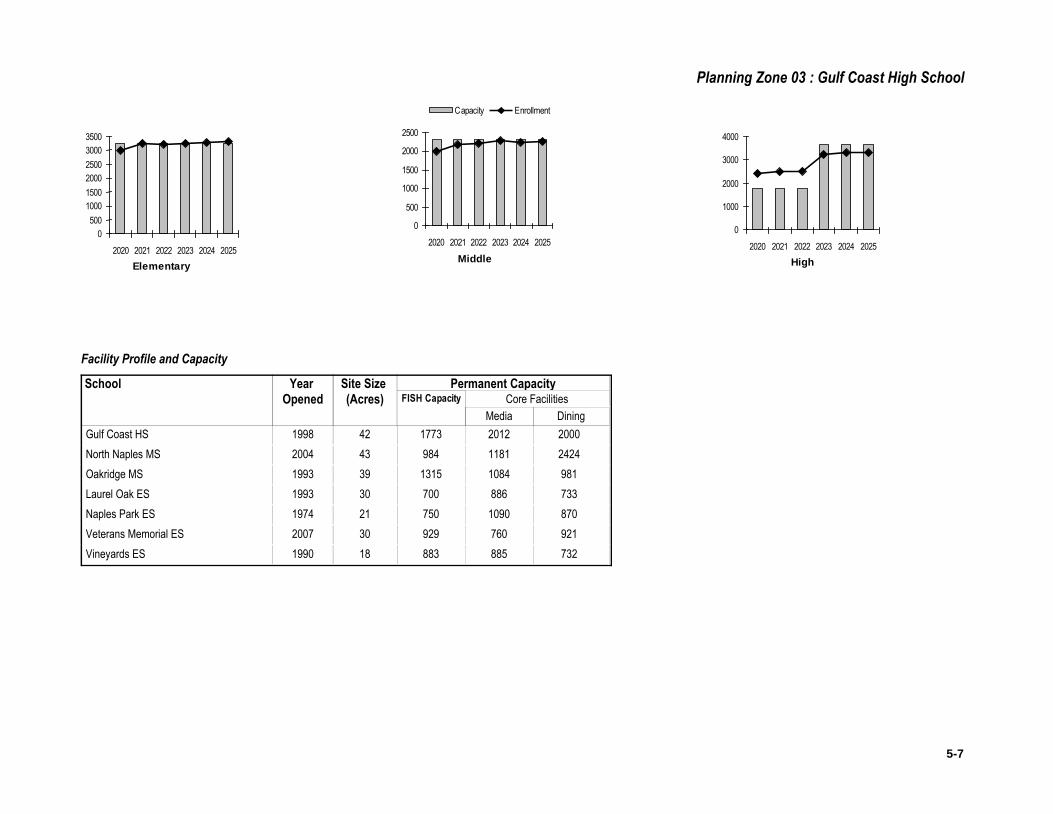
Planning Zone 03 : Gulf Coast High School
Facility Profile and Capacity
High
0
1000
2000
3000
4000
2020 2021 2022 2023 2024 2025
Elementary
0
500
1000
1500
2000
2500
3000
3500
2020 2021 2022 2023 2024 2025Middle
0
500
1000
1500
2000
2500
2020 2021 2022 2023 2024 2025
Capacity Enrollment
School Year Opened
Site Size (Acres)
Media Dining
Permanent CapacityCore FacilitiesFISH Capacity
Gulf Coast HS 1998 42 1773 2012 2000
North Naples MS 2004 43 984 1181 2424
Oakridge MS 1993 39 1315 1084 981
Laurel Oak ES 1993 30 700 886 733
Naples Park ES 1974 21 750 1090 870
Veterans Memorial ES 2007 30 929 760 921
Vineyards ES 1990 18 883 885 732
5-7
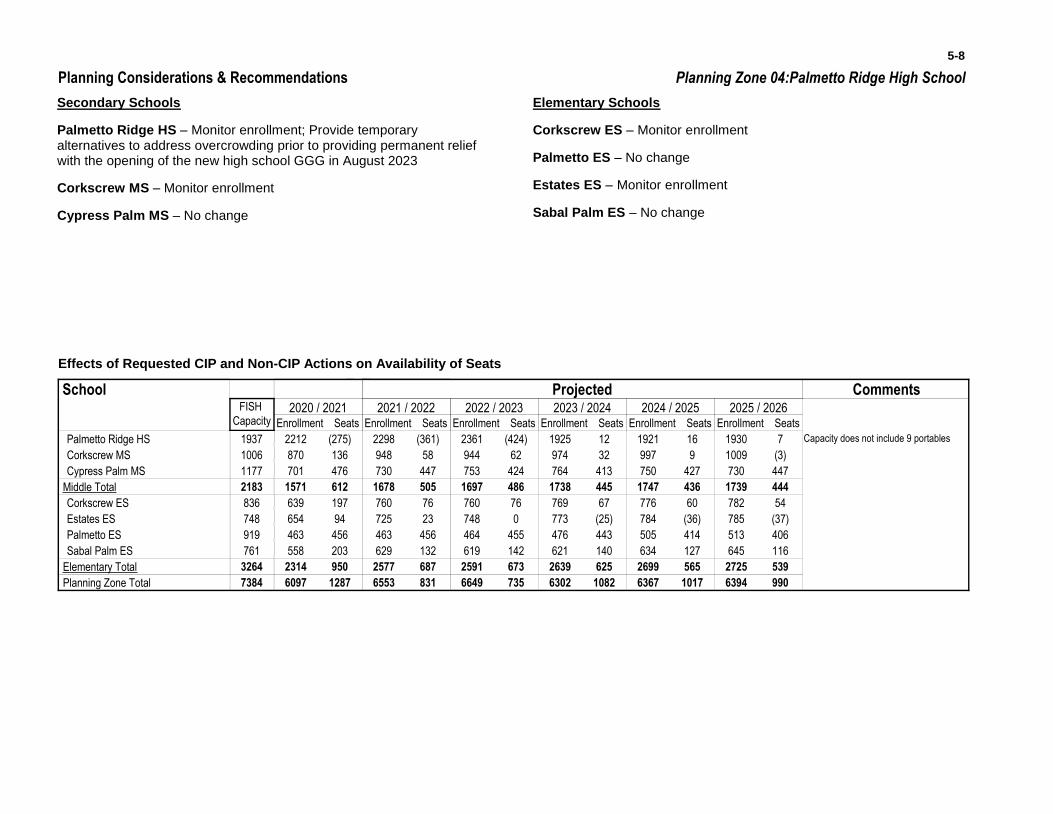
Planning Zone 04:Palmetto Ridge High SchoolPlanning Considerations & Recommendations
5-8
Secondary Schools
Palmetto Ridge HS – Monitor enrollment; Provide temporary alternatives to address overcrowding prior to providing permanent relief with the opening of the new high school GGG in August 2023
Corkscrew MS – Monitor enrollment
Cypress Palm MS – No change
Elementary Schools
Corkscrew ES – Monitor enrollment
Palmetto ES – No change
Estates ES – Monitor enrollment
Sabal Palm ES – No change
Effects of Requested CIP and Non-CIP Actions on Availability of Seats
School
Enrollment Seats
Projected
Enrollment Seats Enrollment Seats Enrollment Seats Enrollment Seats Enrollment Seats
2020 / 2021 2021 / 2022 2022 / 2023 2023 / 2024 2024 / 2025 2025 / 2026
CommentsFISH
Capacity
Palmetto Ridge HS 1937 2212 2298 2361 1925 1921 1930(275) (361) (424) 12 16 7 Capacity does not include 9 portables
Corkscrew MS 1006 870 948 944 974 997 1009136 58 62 32 9 (3)
Cypress Palm MS 1177 701 730 753 764 750 730476 447 424 413 427 447
1678 1697 1738 1747 1739Middle Total 612 445 4362183 1571 505 486 444
Corkscrew ES 836 639 760 760 769 776 782197 76 76 67 60 54
Estates ES 748 654 725 748 773 784 78594 23 0 (25) (36) (37)
Palmetto ES 919 463 463 464 476 505 513456 456 455 443 414 406
Sabal Palm ES 761 558 629 619 621 634 645203 132 142 140 127 116
2577 2591 2639 2699 2725Elementary Total 950 625 5653264 2314 687 673 539
6097 6553 6649 6302 6367 6394Planning Zone Total 7384 1287 831 735 1082 1017 990
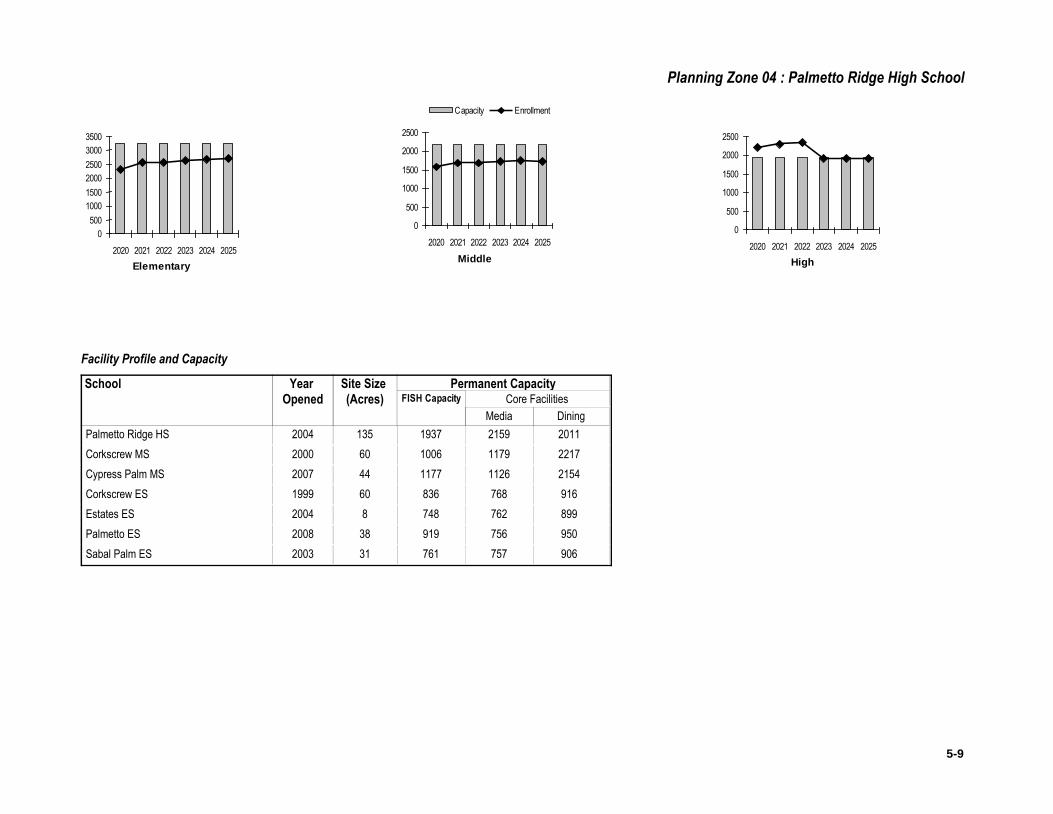
Planning Zone 04 : Palmetto Ridge High School
Facility Profile and Capacity
High
0
500
1000
1500
2000
2500
2020 2021 2022 2023 2024 2025
Elementary
0
500
1000
1500
2000
2500
3000
3500
2020 2021 2022 2023 2024 2025Middle
0
500
1000
1500
2000
2500
2020 2021 2022 2023 2024 2025
Capacity Enrollment
School Year Opened
Site Size (Acres)
Media Dining
Permanent CapacityCore FacilitiesFISH Capacity
Palmetto Ridge HS 2004 135 1937 2159 2011
Corkscrew MS 2000 60 1006 1179 2217
Cypress Palm MS 2007 44 1177 1126 2154
Corkscrew ES 1999 60 836 768 916
Estates ES 2004 8 748 762 899
Palmetto ES 2008 38 919 756 950
Sabal Palm ES 2003 31 761 757 906
5-9
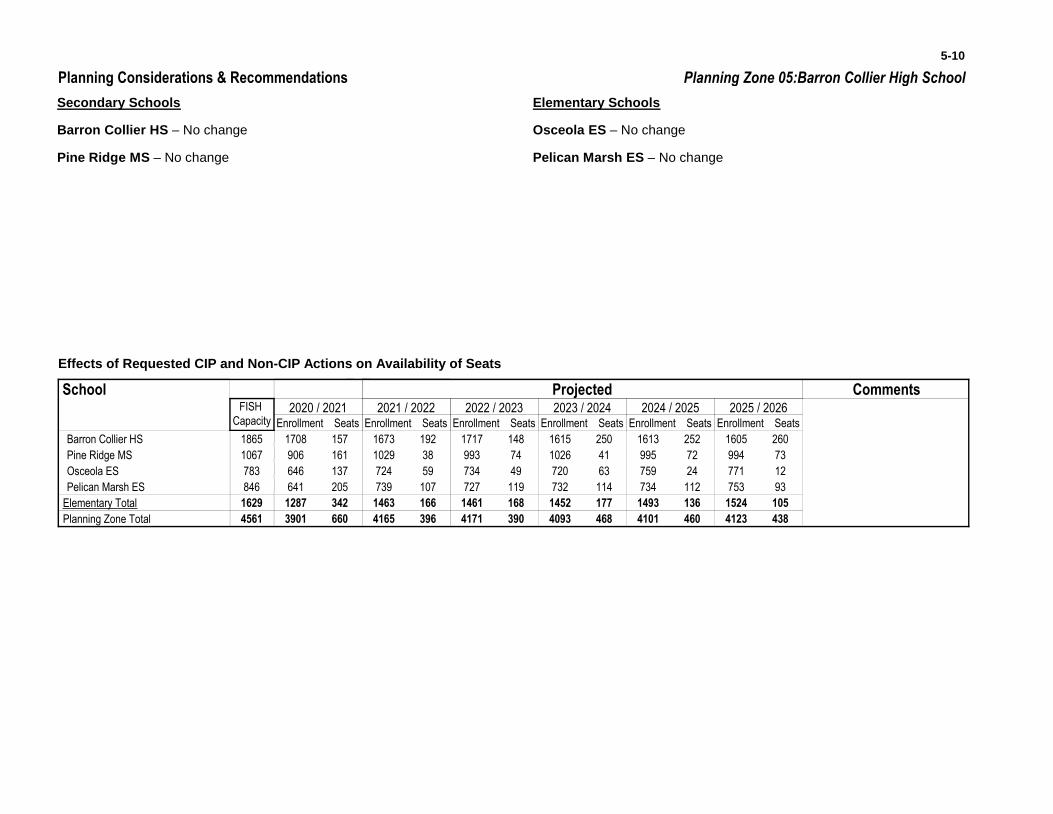
Planning Zone 05:Barron Collier High SchoolPlanning Considerations & Recommendations
5-10
Secondary Schools
Barron Collier HS – No change
Pine Ridge MS – No change
Elementary Schools
Osceola ES – No change
Pelican Marsh ES – No change
Effects of Requested CIP and Non-CIP Actions on Availability of Seats
School
Enrollment Seats
Projected
Enrollment Seats Enrollment Seats Enrollment Seats Enrollment Seats Enrollment Seats
2020 / 2021 2021 / 2022 2022 / 2023 2023 / 2024 2024 / 2025 2025 / 2026
CommentsFISH
Capacity
Barron Collier HS 1865 1708 1673 1717 1615 1613 1605157 192 148 250 252 260
Pine Ridge MS 1067 906 1029 993 1026 995 994161 38 74 41 72 73
Osceola ES 783 646 724 734 720 759 771137 59 49 63 24 12
Pelican Marsh ES 846 641 739 727 732 734 753205 107 119 114 112 93
1463 1461 1452 1493 1524Elementary Total 342 177 1361629 1287 166 168 105
3901 4165 4171 4093 4101 4123Planning Zone Total 4561 660 396 390 468 460 438
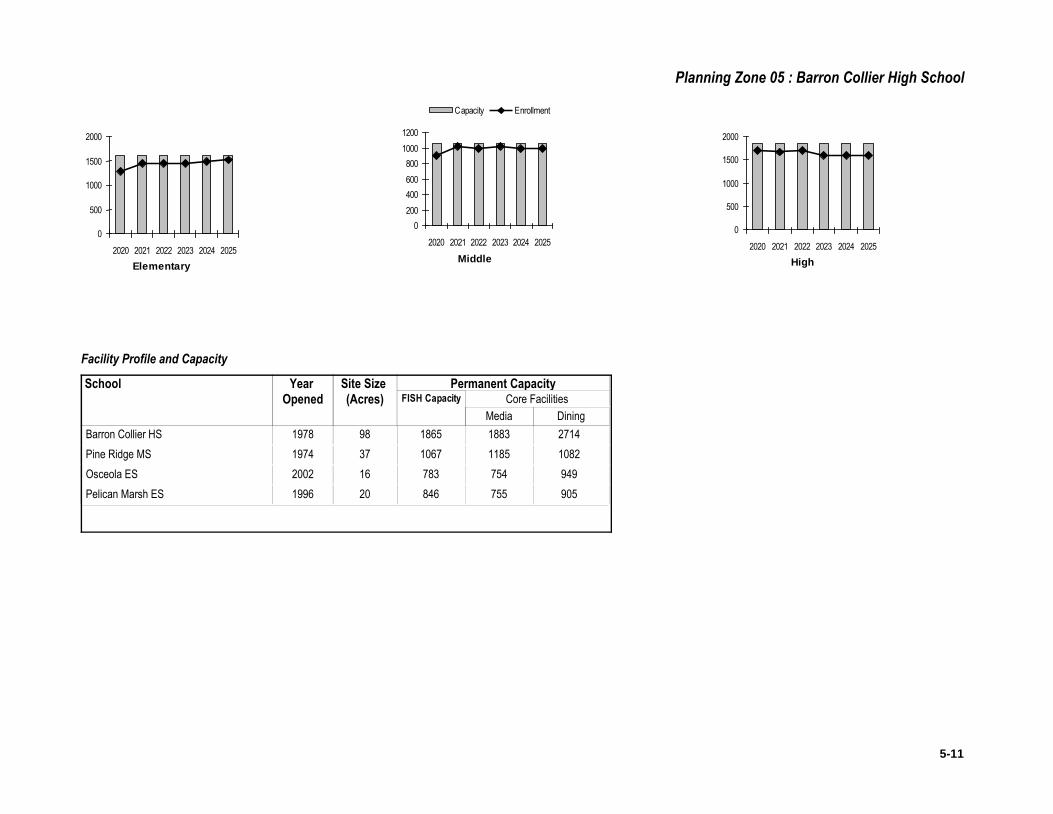
Planning Zone 05 : Barron Collier High School
Facility Profile and Capacity
High
0
500
1000
1500
2000
2020 2021 2022 2023 2024 2025
Elementary
0
500
1000
1500
2000
2020 2021 2022 2023 2024 2025Middle
0
200
400
600
800
1000
1200
2020 2021 2022 2023 2024 2025
Capacity Enrollment
School Year Opened
Site Size (Acres)
Media Dining
Permanent CapacityCore FacilitiesFISH Capacity
Barron Collier HS 1978 98 1865 1883 2714
Pine Ridge MS 1974 37 1067 1185 1082
Osceola ES 2002 16 783 754 949
Pelican Marsh ES 1996 20 846 755 905
5-11
Planning Zone 06:Naples High SchoolPlanning Considerations & Recommendations
5-12
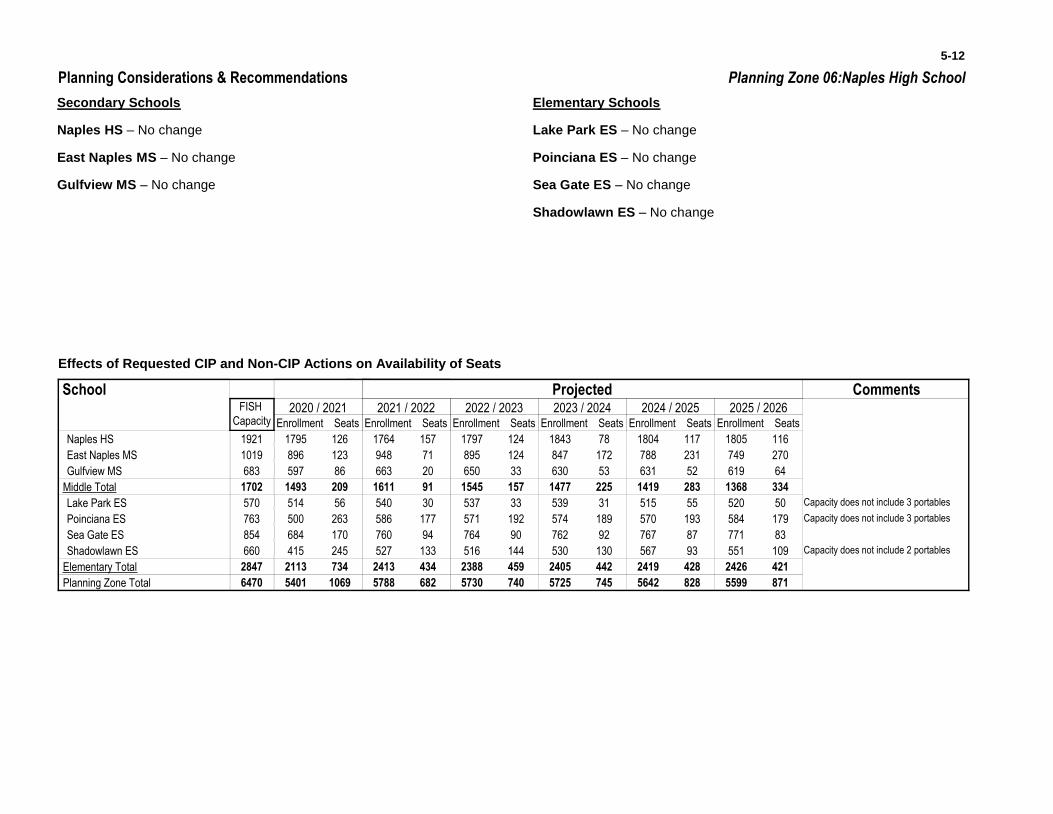
Secondary Schools
Naples HS – No change
East Naples MS – No change
Gulfview MS – No change
Elementary Schools
Lake Park ES – No change
Poinciana ES – No change
Sea Gate ES – No change
Shadowlawn ES – No change
Effects of Requested CIP and Non-CIP Actions on Availability of Seats
School
Enrollment Seats
Projected
Enrollment Seats Enrollment Seats Enrollment Seats Enrollment Seats Enrollment Seats
2020 / 2021 2021 / 2022 2022 / 2023 2023 / 2024 2024 / 2025 2025 / 2026
CommentsFISH
Capacity
Naples HS 1921 1795 1764 1797 1843 1804 1805126 157 124 78 117 116
East Naples MS 1019 896 948 895 847 788 749123 71 124 172 231 270
Gulfview MS 683 597 663 650 630 631 61986 20 33 53 52 64
1611 1545 1477 1419 1368Middle Total 209 225 2831702 1493 91 157 334
Lake Park ES 570 514 540 537 539 515 52056 30 33 31 55 50 Capacity does not include 3 portables
Poinciana ES 763 500 586 571 574 570 584263 177 192 189 193 179 Capacity does not include 3 portables
Sea Gate ES 854 684 760 764 762 767 771170 94 90 92 87 83
Shadowlawn ES 660 415 527 516 530 567 551245 133 144 130 93 109 Capacity does not include 2 portables
2413 2388 2405 2419 2426Elementary Total 734 442 4282847 2113 434 459 421
5401 5788 5730 5725 5642 5599Planning Zone Total 6470 1069 682 740 745 828 871
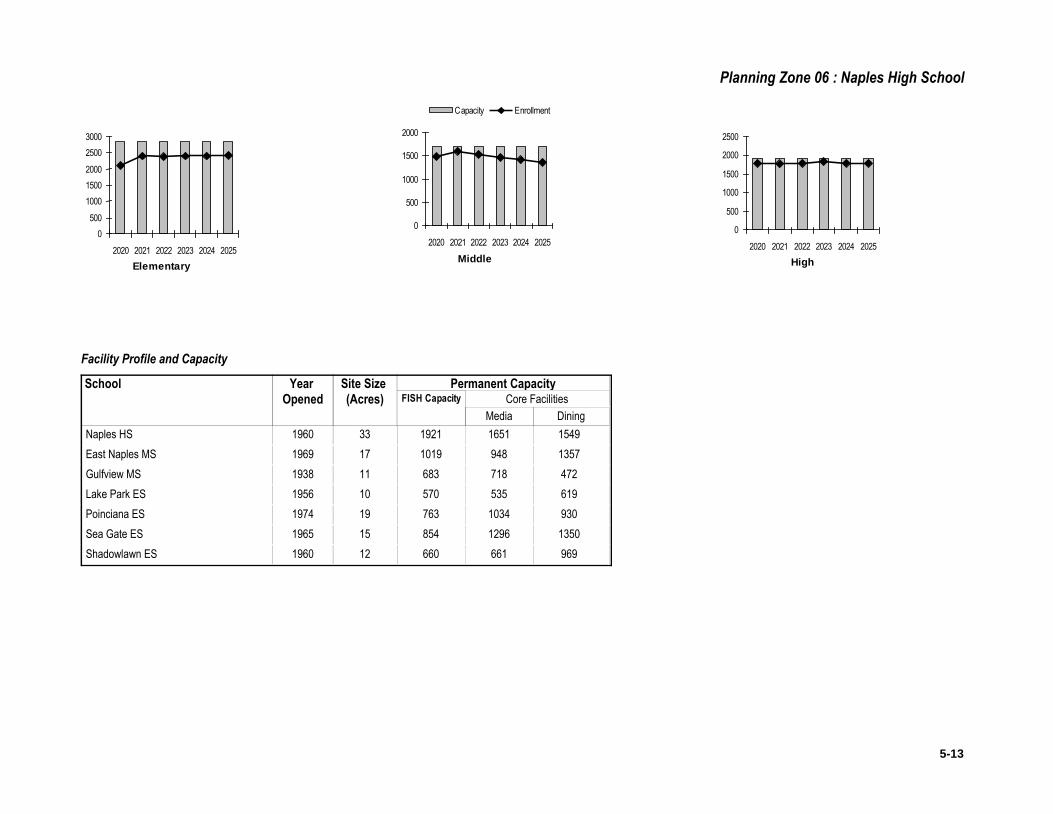
Planning Zone 06 : Naples High School
Facility Profile and Capacity
High
0
500
1000
1500
2000
2500
2020 2021 2022 2023 2024 2025
Elementary
0
500
1000
1500
2000
2500
3000
2020 2021 2022 2023 2024 2025Middle
0
500
1000
1500
2000
2020 2021 2022 2023 2024 2025
Capacity Enrollment
School Year Opened
Site Size (Acres)
Media Dining
Permanent CapacityCore FacilitiesFISH Capacity
Naples HS 1960 33 1921 1651 1549
East Naples MS 1969 17 1019 948 1357
Gulfview MS 1938 11 683 718 472
Lake Park ES 1956 10 570 535 619
Poinciana ES 1974 19 763 1034 930
Sea Gate ES 1965 15 854 1296 1350
Shadowlawn ES 1960 12 660 661 969
5-13
Planning Zone 07:Immokalee High SchoolPlanning Considerations & Recommendations
5-14
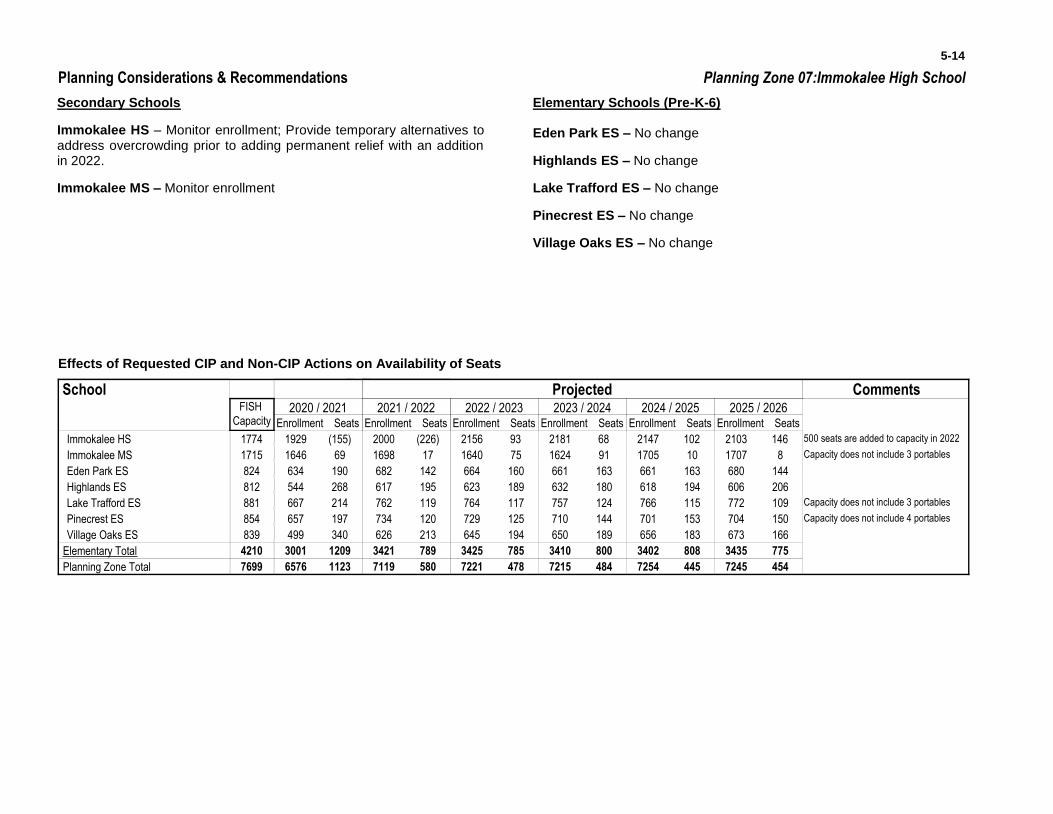
Secondary Schools
Immokalee HS – Monitor enrollment; Provide temporary alternatives to address overcrowding prior to adding permanent relief with an addition in 2022.
Immokalee MS – Monitor enrollment
Elementary Schools (Pre-K-6)
Eden Park ES – No change
Highlands ES – No change
Lake Trafford ES – No change
Pinecrest ES – No change
Village Oaks ES – No change
Effects of Requested CIP and Non-CIP Actions on Availability of Seats
School
Enrollment Seats
Projected
Enrollment Seats Enrollment Seats Enrollment Seats Enrollment Seats Enrollment Seats
2020 / 2021 2021 / 2022 2022 / 2023 2023 / 2024 2024 / 2025 2025 / 2026
CommentsFISH
Capacity
Immokalee HS 1774 1929 2000 2156 2181 2147 2103(155) (226) 93 68 102 146 500 seats are added to capacity in 2022
Immokalee MS 1715 1646 1698 1640 1624 1705 170769 17 75 91 10 8 Capacity does not include 3 portables
Eden Park ES 824 634 682 664 661 661 680190 142 160 163 163 144
Highlands ES 812 544 617 623 632 618 606268 195 189 180 194 206
Lake Trafford ES 881 667 762 764 757 766 772214 119 117 124 115 109 Capacity does not include 3 portables
Pinecrest ES 854 657 734 729 710 701 704197 120 125 144 153 150 Capacity does not include 4 portables
Village Oaks ES 839 499 626 645 650 656 673340 213 194 189 183 166
3421 3425 3410 3402 3435Elementary Total 1209 800 8084210 3001 789 785 775
6576 7119 7221 7215 7254 7245Planning Zone Total 7699 1123 580 478 484 445 454
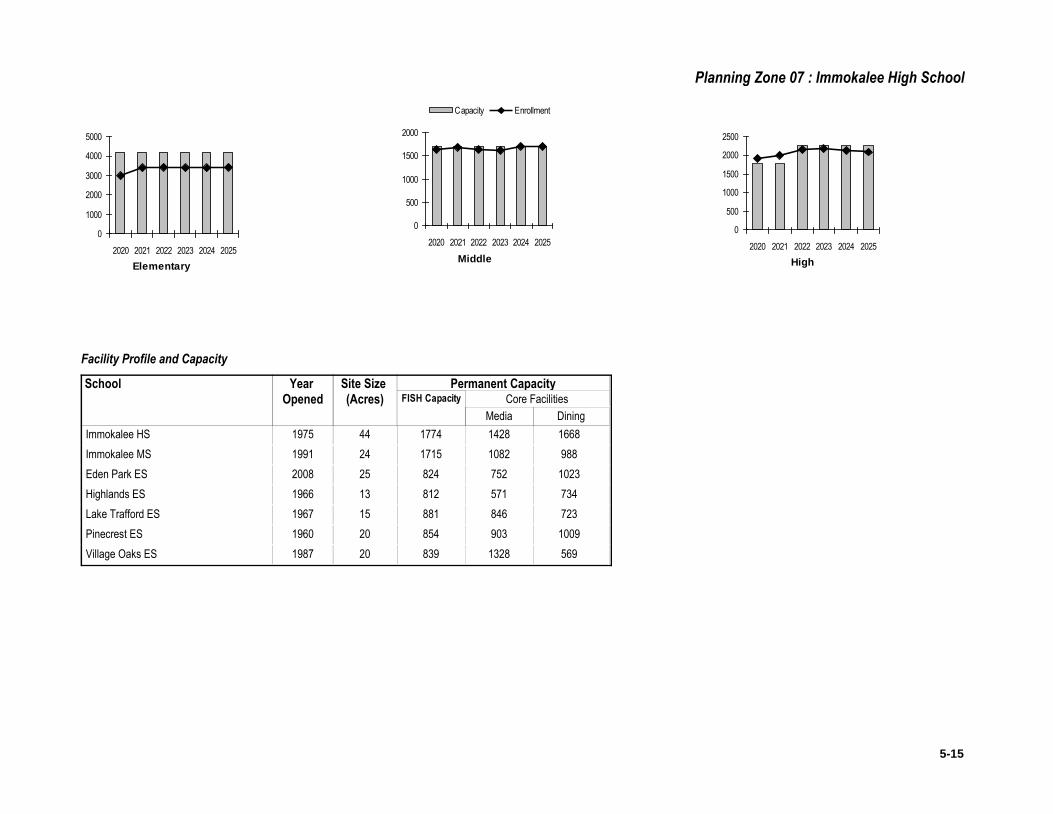
Planning Zone 07 : Immokalee High School
Facility Profile and Capacity
High
0
500
1000
1500
2000
2500
2020 2021 2022 2023 2024 2025
Elementary
0
1000
2000
3000
4000
5000
2020 2021 2022 2023 2024 2025Middle
0
500
1000
1500
2000
2020 2021 2022 2023 2024 2025
Capacity Enrollment
School Year Opened
Site Size (Acres)
Media Dining
Permanent CapacityCore FacilitiesFISH Capacity
Immokalee HS 1975 44 1774 1428 1668
Immokalee MS 1991 24 1715 1082 988
Eden Park ES 2008 25 824 752 1023
Highlands ES 1966 13 812 571 734
Lake Trafford ES 1967 15 881 846 723
Pinecrest ES 1960 20 854 903 1009
Village Oaks ES 1987 20 839 1328 569
5-15
Planning Zone 08:Everglades City PK-12Planning Considerations & Recommendations
5-16
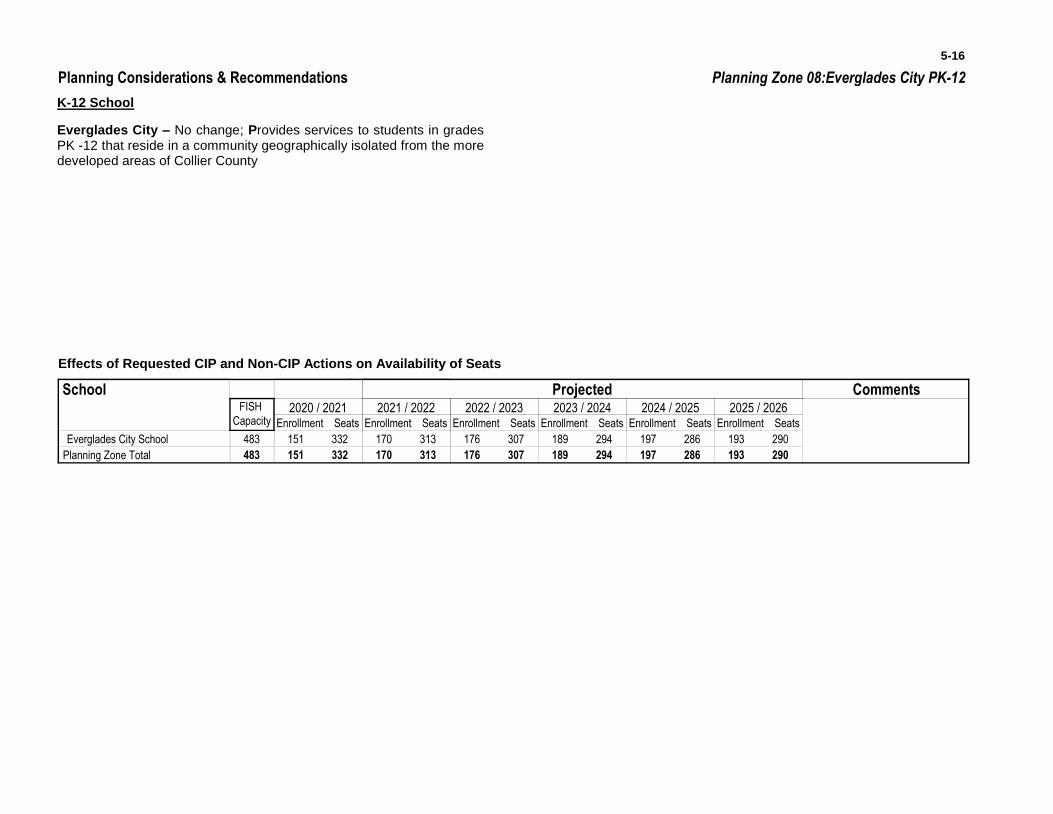
K-12 School
Everglades City – No change; Provides services to students in grades PK -12 that reside in a community geographically isolated from the more developed areas of Collier County
Effects of Requested CIP and Non-CIP Actions on Availability of Seats
School
Enrollment Seats
Projected
Enrollment Seats Enrollment Seats Enrollment Seats Enrollment Seats Enrollment Seats
2020 / 2021 2021 / 2022 2022 / 2023 2023 / 2024 2024 / 2025 2025 / 2026
CommentsFISH
Capacity
Everglades City School 483 151 170 176 189 197 193332 313 307 294 286 290
151 170 176 189 197 193Planning Zone Total 483 332 313 307 294 286 290
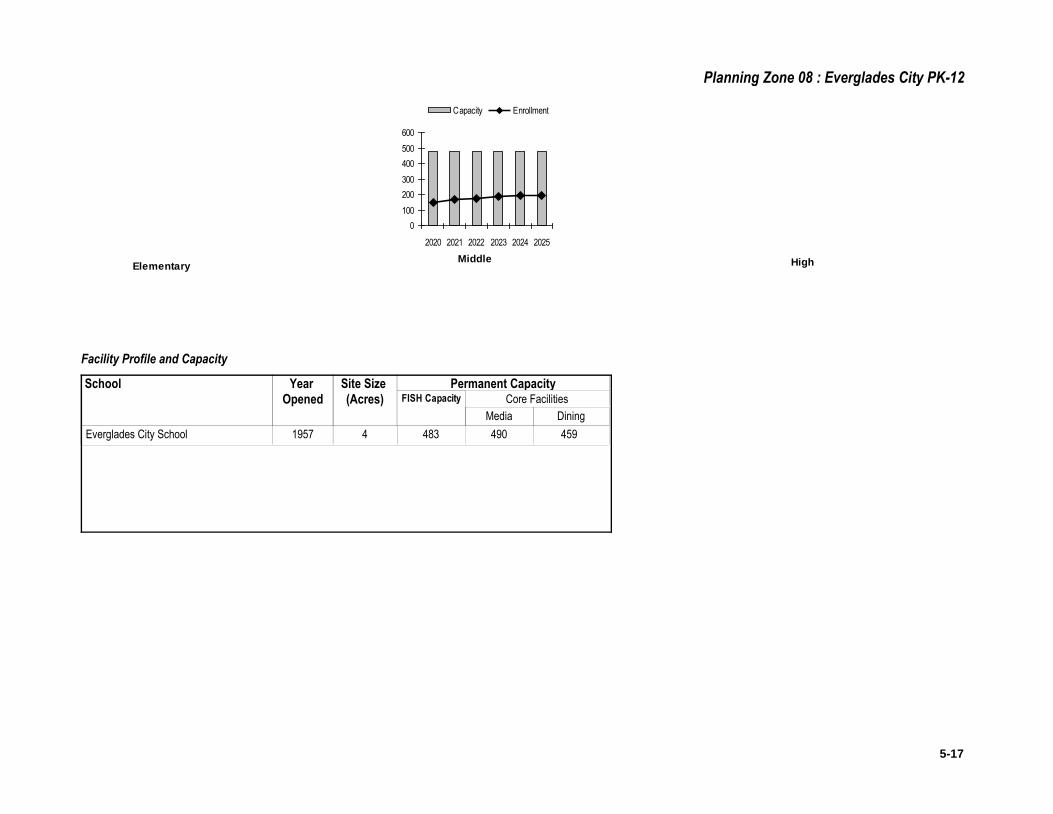
Planning Zone 08 : Everglades City PK-12
Facility Profile and Capacity
HighElementaryMiddle
0
100
200
300
400
500
600
2020 2021 2022 2023 2024 2025
Capacity Enrollment
School Year Opened
Site Size (Acres)
Media Dining
Permanent CapacityCore FacilitiesFISH Capacity
Everglades City School 1957 4 483 490 459
5-17
Chapter
6
Chapter 6
Maintenance Plan by School
Maintenance Plan by School

Facility Maintenance Plan - 10 Years Alternative School
2022 2023 2024 2025 2026
FY FY FY FY FY
2027 2028 2029 2030 2031
FY FY FY FY FY
1,430,000 50,000 180,000 45,000 180,000 10,000Yearly Totals
Electrical
Replace Parking Lot Lights 30,000
Replace Interior Lights 150,000
Replace Fire Alarm Devices 20,000
Replace Ext Building Lights 45,000
HVAC
Replace Chiller and Pumps 400,000
Renovate Terminal A/C Equipment 300,000
Design Terminal A/C Equipment Reno 35,000
Design Chiller and Pump Replacement 45,000
Clean Air Distribution System 30,000
Roofing
Replace Roof 650,000
Renovation
Seal/Repair Parking Lot 10,000
Replace Carpet (All Areas) 30,000
Paint Interior 100,000
Paint Int Ext Doors & Frames 50,000
6-1

Facility Maintenance Plan 11 - 20 Years Alternative School
2032 2033 2034 2035 2036
FY FY FY FY FY
2037 2038 2039 2040 2041
FY FY FY FY FY
231,000 40,000Yearly Totals
HVAC
Clean Air Distribution System 40,000
Renovation
Seal/Repair Parking Lot 11,000
Replace Carpet (All Areas) 37,000
Paint Interior 122,000
Paint Int Ext Doors & Frames 61,000
6-2
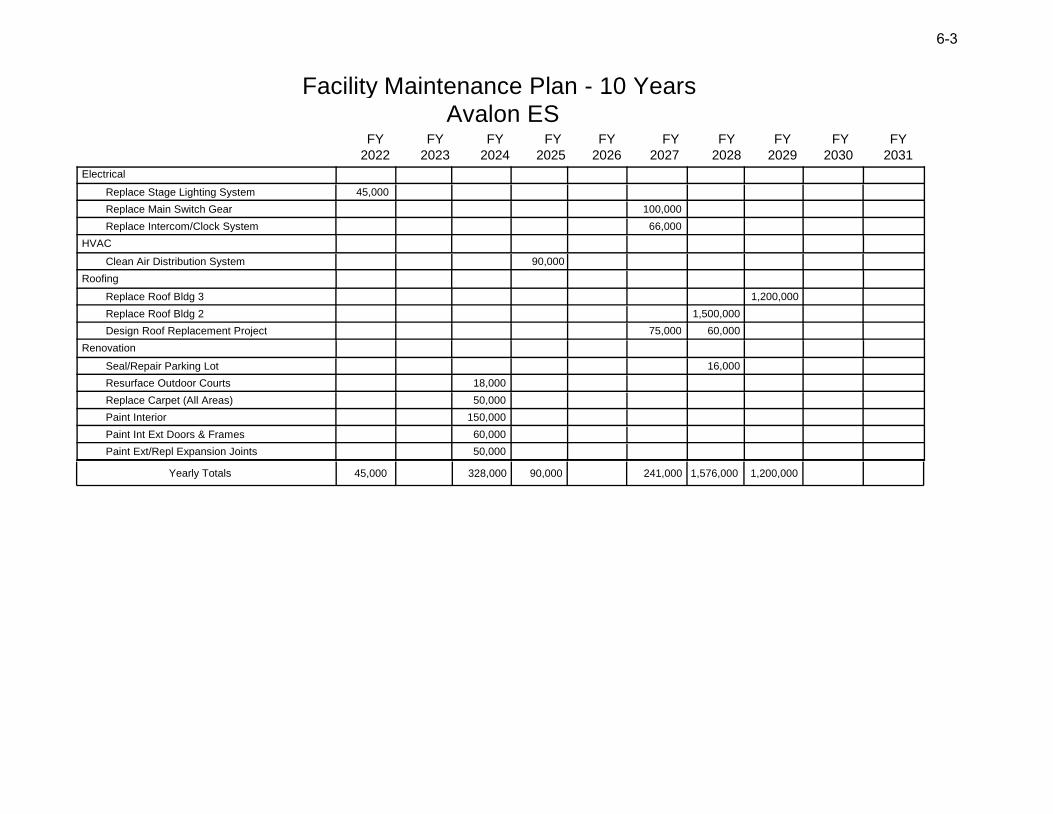
Facility Maintenance Plan - 10 Years Avalon ES
2022 2023 2024 2025 2026
FY FY FY FY FY
2027 2028 2029 2030 2031
FY FY FY FY FY
45,000 328,000 90,000 241,000 1,576,000 1,200,000Yearly Totals
Electrical
Replace Stage Lighting System 45,000
Replace Main Switch Gear 100,000
Replace Intercom/Clock System 66,000
HVAC
Clean Air Distribution System 90,000
Roofing
Replace Roof Bldg 3 1,200,000
Replace Roof Bldg 2 1,500,000
Design Roof Replacement Project 75,000 60,000
Renovation
Seal/Repair Parking Lot 16,000
Resurface Outdoor Courts 18,000
Replace Carpet (All Areas) 50,000
Paint Interior 150,000
Paint Int Ext Doors & Frames 60,000
Paint Ext/Repl Expansion Joints 50,000
6-3
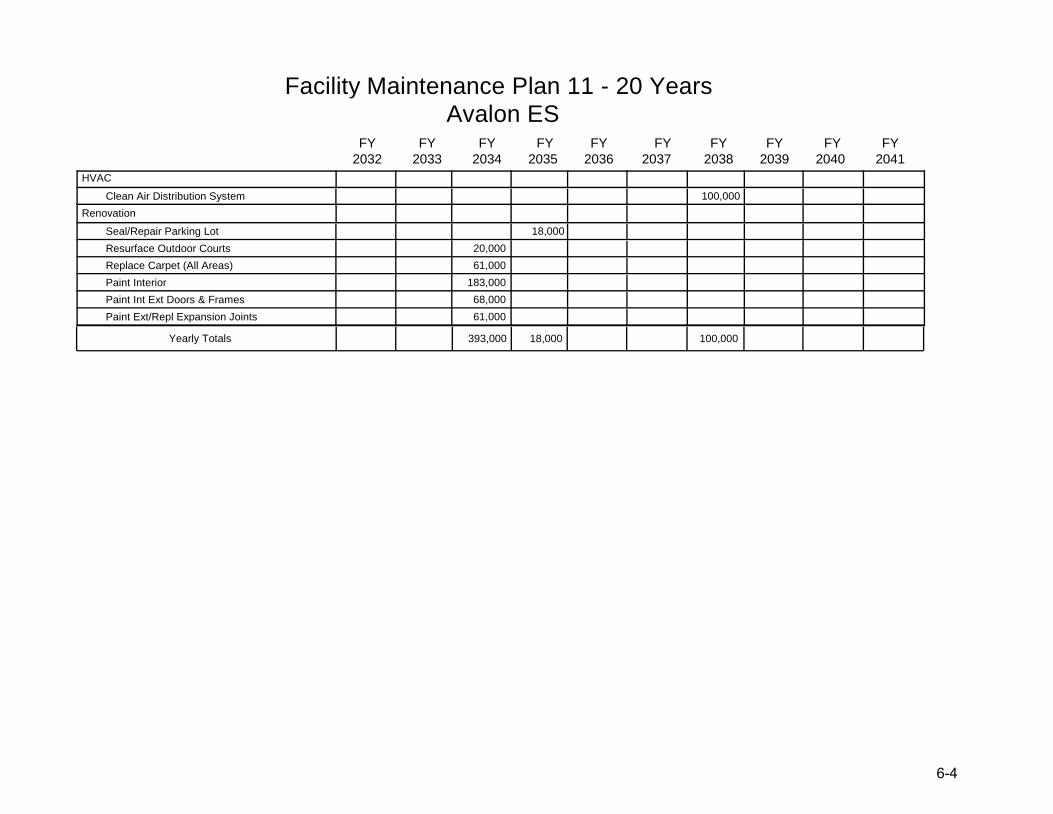
Facility Maintenance Plan 11 - 20 Years Avalon ES
2032 2033 2034 2035 2036
FY FY FY FY FY
2037 2038 2039 2040 2041
FY FY FY FY FY
393,000 18,000 100,000Yearly Totals
HVAC
Clean Air Distribution System 100,000
Renovation
Seal/Repair Parking Lot 18,000
Resurface Outdoor Courts 20,000
Replace Carpet (All Areas) 61,000
Paint Interior 183,000
Paint Int Ext Doors & Frames 68,000
Paint Ext/Repl Expansion Joints 61,000
6-44
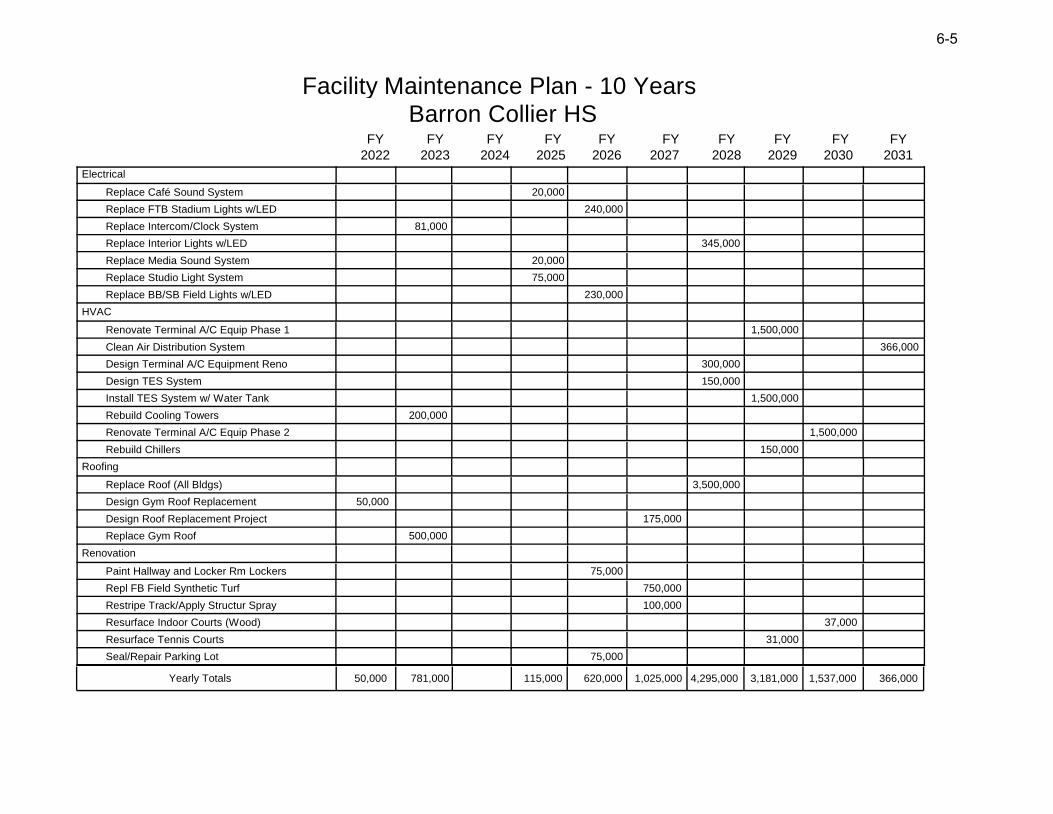
Facility Maintenance Plan - 10 Years Barron Collier HS
2022 2023 2024 2025 2026
FY FY FY FY FY
2027 2028 2029 2030 2031
FY FY FY FY FY
50,000 781,000 115,000 620,000 1,025,000 4,295,000 3,181,000 1,537,000 366,000Yearly Totals
Electrical
Replace Café Sound System 20,000
Replace FTB Stadium Lights w/LED 240,000
Replace Intercom/Clock System 81,000
Replace Interior Lights w/LED 345,000
Replace Media Sound System 20,000
Replace Studio Light System 75,000
Replace BB/SB Field Lights w/LED 230,000
HVAC
Renovate Terminal A/C Equip Phase 1 1,500,000
Clean Air Distribution System 366,000
Design Terminal A/C Equipment Reno 300,000
Design TES System 150,000
Install TES System w/ Water Tank 1,500,000
Rebuild Cooling Towers 200,000
Renovate Terminal A/C Equip Phase 2 1,500,000
Rebuild Chillers 150,000
Roofing
Replace Roof (All Bldgs) 3,500,000
Design Gym Roof Replacement 50,000
Design Roof Replacement Project 175,000
Replace Gym Roof 500,000
Renovation
Paint Hallway and Locker Rm Lockers 75,000
Repl FB Field Synthetic Turf 750,000
Restripe Track/Apply Structur Spray 100,000
Resurface Indoor Courts (Wood) 37,000
Resurface Tennis Courts 31,000
Seal/Repair Parking Lot 75,000
6-5
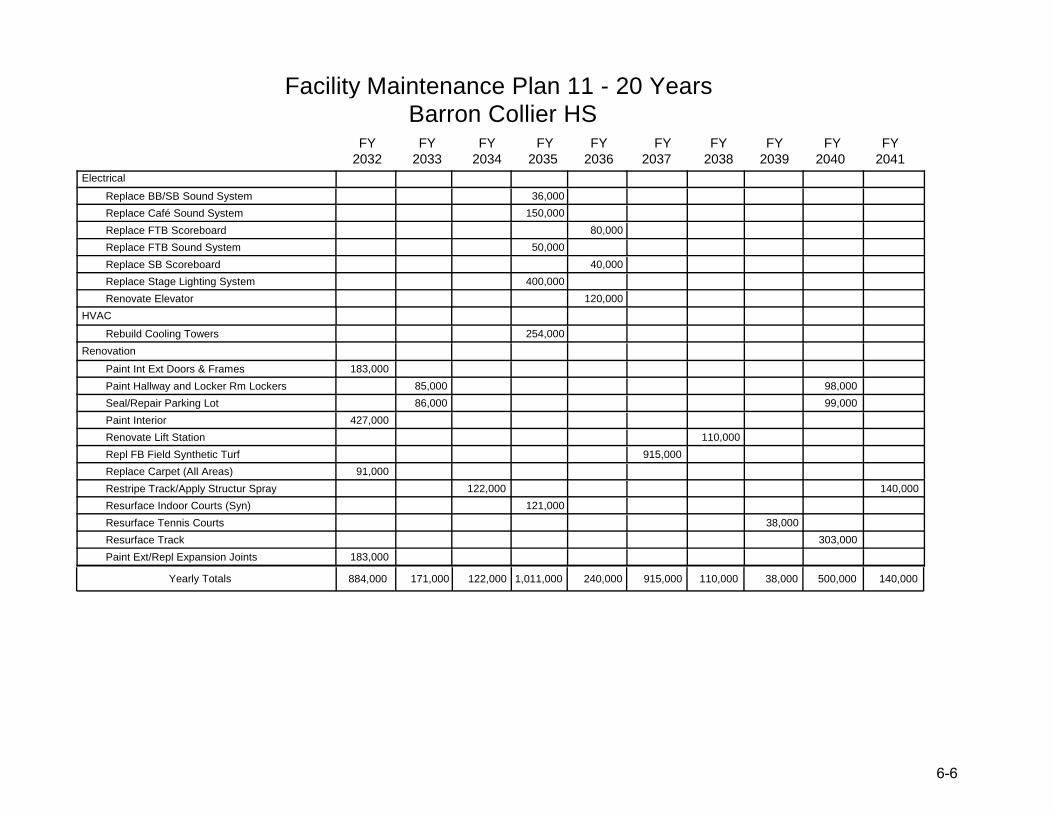
Facility Maintenance Plan 11 - 20 Years Barron Collier HS
2032 2033 2034 2035 2036
FY FY FY FY FY
2037 2038 2039 2040 2041
FY FY FY FY FY
884,000 171,000 122,000 1,011,000 240,000 915,000 110,000 38,000 500,000 140,000Yearly Totals
Electrical
Replace BB/SB Sound System 36,000
Replace Café Sound System 150,000
Replace FTB Scoreboard 80,000
Replace FTB Sound System 50,000
Replace SB Scoreboard 40,000
Replace Stage Lighting System 400,000
Renovate Elevator 120,000
HVAC
Rebuild Cooling Towers 254,000
Renovation
Paint Int Ext Doors & Frames 183,000
Paint Hallway and Locker Rm Lockers 85,000 98,000
Seal/Repair Parking Lot 86,000 99,000
Paint Interior 427,000
Renovate Lift Station 110,000
Repl FB Field Synthetic Turf 915,000
Replace Carpet (All Areas) 91,000
Restripe Track/Apply Structur Spray 122,000 140,000
Resurface Indoor Courts (Syn) 121,000
Resurface Tennis Courts 38,000
Resurface Track 303,000
Paint Ext/Repl Expansion Joints 183,000
6-6
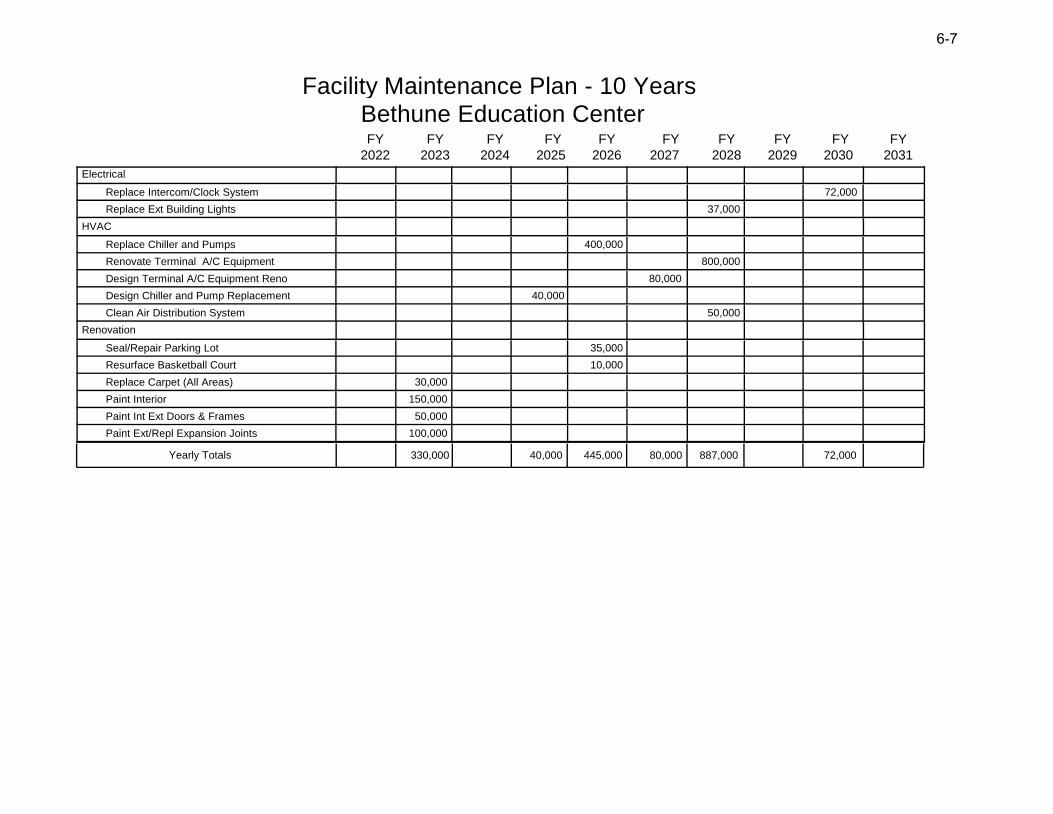
Facility Maintenance Plan - 10 Years Bethune Education Center
2022 2023 2024 2025 2026
FY FY FY FY FY
2027 2028 2029 2030 2031
FY FY FY FY FY
330,000 40,000 445,000 80,000 887,000 72,000Yearly Totals
Electrical
Replace Intercom/Clock System 72,000
Replace Ext Building Lights 37,000
HVAC
Replace Chiller and Pumps 400,000
Renovate Terminal A/C Equipment 800,000
Design Terminal A/C Equipment Reno 80,000
Design Chiller and Pump Replacement 40,000
Clean Air Distribution System 50,000
Renovation
Seal/Repair Parking Lot 35,000
Resurface Basketball Court 10,000
Replace Carpet (All Areas) 30,000
Paint Interior 150,000
Paint Int Ext Doors & Frames 50,000
Paint Ext/Repl Expansion Joints 100,000
6-7
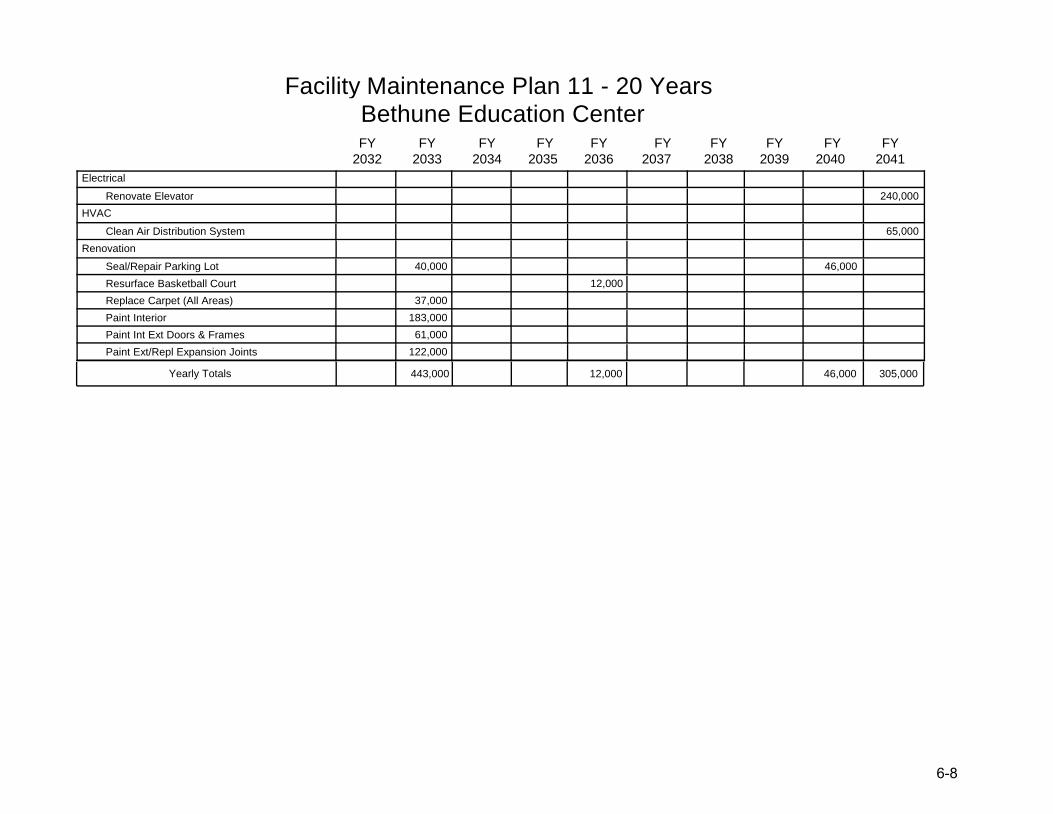
Facility Maintenance Plan 11 - 20 Years Bethune Education Center
2032 2033 2034 2035 2036
FY FY FY FY FY
2037 2038 2039 2040 2041
FY FY FY FY FY
443,000 12,000 46,000 305,000Yearly Totals
Electrical
Renovate Elevator 240,000
HVAC
Clean Air Distribution System 65,000
Renovation
Seal/Repair Parking Lot 40,000 46,000
Resurface Basketball Court 12,000
Replace Carpet (All Areas) 37,000
Paint Interior 183,000
Paint Int Ext Doors & Frames 61,000
Paint Ext/Repl Expansion Joints 122,000
6-88
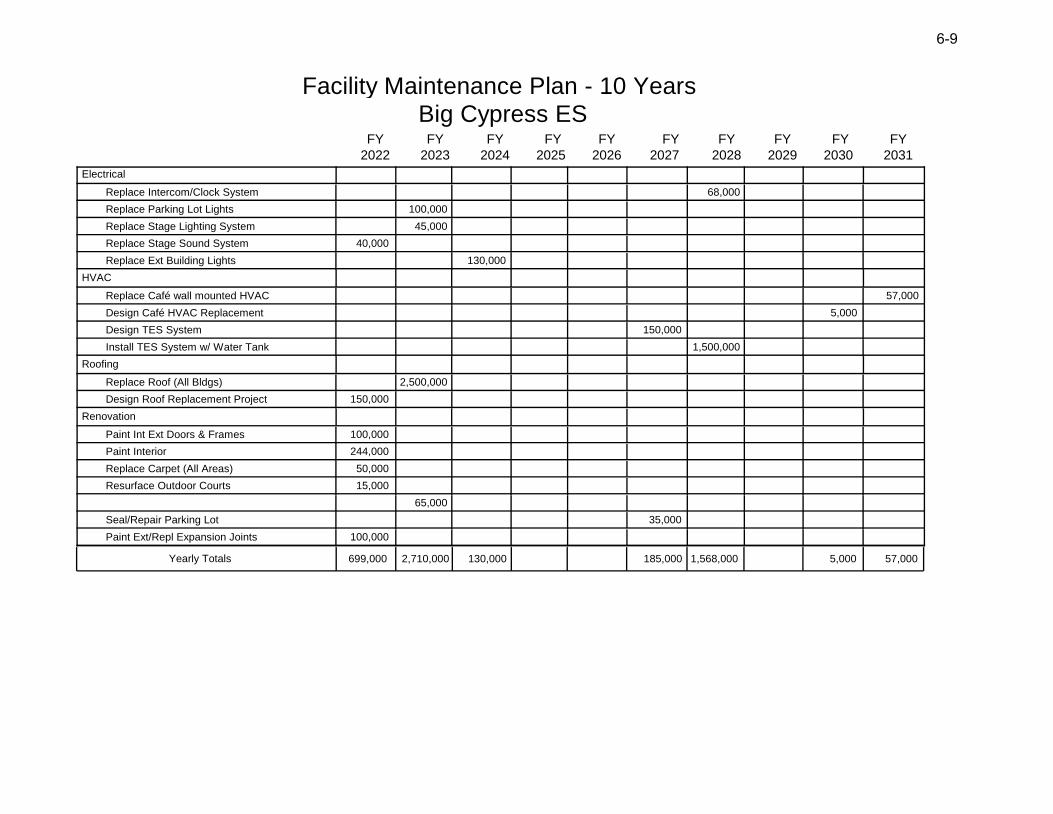
Facility Maintenance Plan - 10 Years Big Cypress ES
2022 2023 2024 2025 2026
FY FY FY FY FY
2027 2028 2029 2030 2031
FY FY FY FY FY
699,000 2,710,000 130,000 185,000 1,568,000 5,000 57,000Yearly Totals
Electrical
Replace Intercom/Clock System 68,000
Replace Parking Lot Lights 100,000
Replace Stage Lighting System 45,000
Replace Stage Sound System 40,000
Replace Ext Building Lights 130,000
HVAC
Replace Café wall mounted HVAC 57,000
Design Café HVAC Replacement 5,000
Design TES System 150,000
Install TES System w/ Water Tank 1,500,000
Roofing
Replace Roof (All Bldgs) 2,500,000
Design Roof Replacement Project 150,000
Renovation
Paint Int Ext Doors & Frames 100,000
Paint Interior 244,000
Replace Carpet (All Areas) 50,000
Resurface Outdoor Courts 15,000
65,000
Seal/Repair Parking Lot 35,000
Paint Ext/Repl Expansion Joints 100,000
6-99
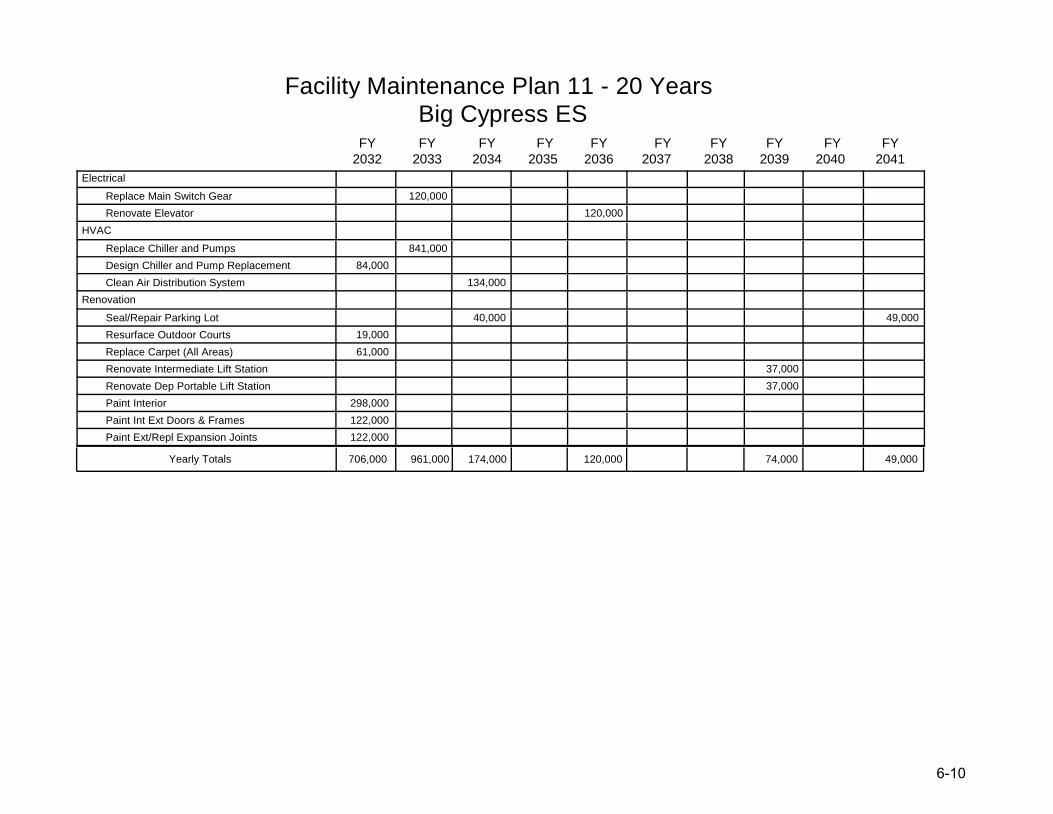
Facility Maintenance Plan 11 - 20 Years Big Cypress ES
2032 2033 2034 2035 2036
FY FY FY FY FY
2037 2038 2039 2040 2041
FY FY FY FY FY
706,000 961,000 174,000 120,000 74,000 49,000Yearly Totals
Electrical
Replace Main Switch Gear 120,000
Renovate Elevator 120,000
HVAC
Replace Chiller and Pumps 841,000
Design Chiller and Pump Replacement 84,000
Clean Air Distribution System 134,000
Renovation
Seal/Repair Parking Lot 40,000 49,000
Resurface Outdoor Courts 19,000
Replace Carpet (All Areas) 61,000
Renovate Intermediate Lift Station 37,000
Renovate Dep Portable Lift Station 37,000
Paint Interior 298,000
Paint Int Ext Doors & Frames 122,000
Paint Ext/Repl Expansion Joints 122,000
6-1010
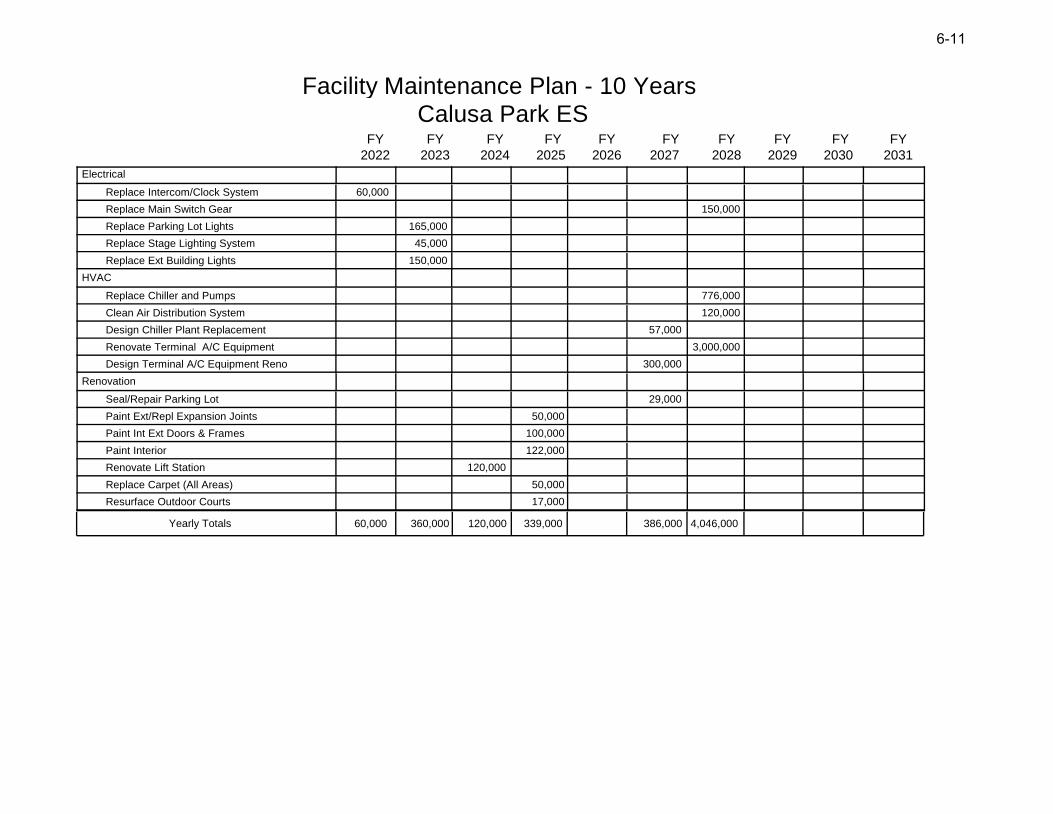
Facility Maintenance Plan - 10 Years Calusa Park ES
2022 2023 2024 2025 2026
FY FY FY FY FY
2027 2028 2029 2030 2031
FY FY FY FY FY
60,000 360,000 120,000 339,000 386,000 4,046,000Yearly Totals
Electrical
Replace Intercom/Clock System 60,000
Replace Main Switch Gear 150,000
Replace Parking Lot Lights 165,000
Replace Stage Lighting System 45,000
Replace Ext Building Lights 150,000
HVAC
Replace Chiller and Pumps 776,000
Clean Air Distribution System 120,000
Design Chiller Plant Replacement 57,000
Renovate Terminal A/C Equipment 3,000,000
Design Terminal A/C Equipment Reno 300,000
Renovation
Seal/Repair Parking Lot 29,000
Paint Ext/Repl Expansion Joints 50,000
Paint Int Ext Doors & Frames 100,000
Paint Interior 122,000
Renovate Lift Station 120,000
Replace Carpet (All Areas) 50,000
Resurface Outdoor Courts 17,000
6-11

Facility Maintenance Plan 11 - 20 Years Calusa Park ES
2032 2033 2034 2035 2036
FY FY FY FY FY
2037 2038 2039 2040 2041
FY FY FY FY FY
34,000 412,000 216,000Yearly Totals
HVAC
Clean Air Distribution System 175,000
Renovation
Seal/Repair Parking Lot 34,000 41,000
Resurface Outdoor Courts 19,000
Replace Carpet (All Areas) 61,000
Paint Interior 149,000
Paint Int Ext Doors & Frames 122,000
Paint Ext/Repl Expansion Joints 61,000
6-12
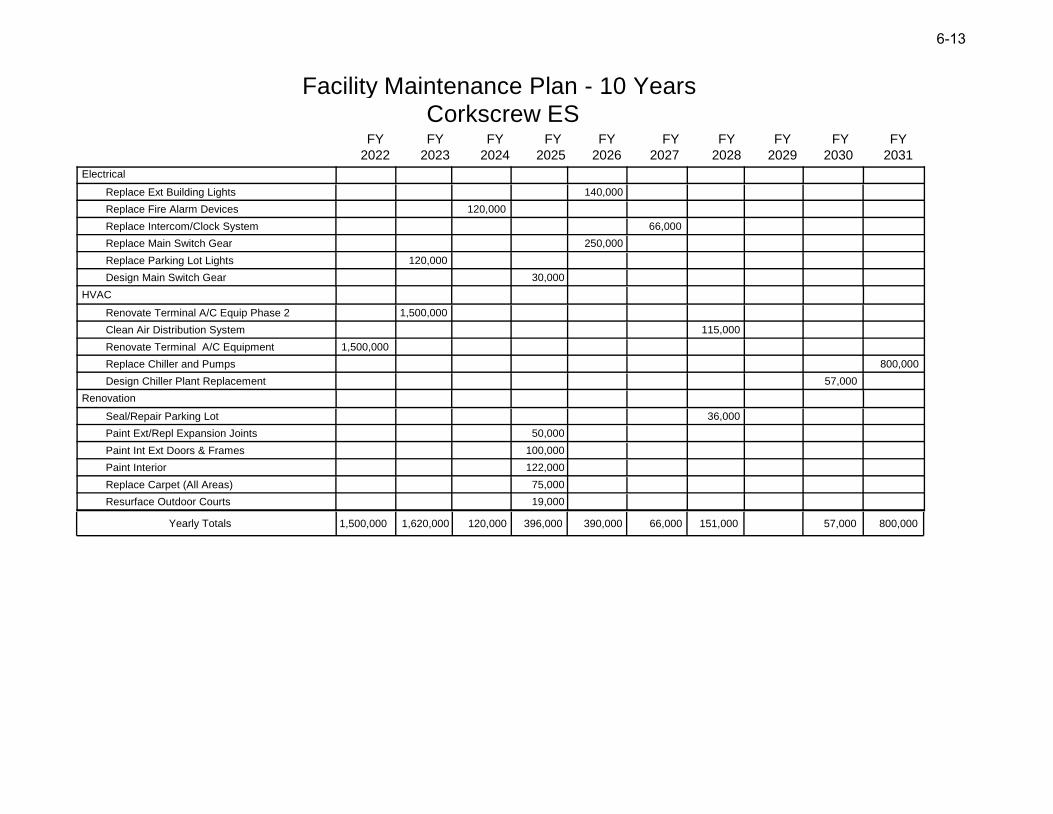
Facility Maintenance Plan - 10 Years Corkscrew ES
2022 2023 2024 2025 2026
FY FY FY FY FY
2027 2028 2029 2030 2031
FY FY FY FY FY
1,500,000 1,620,000 120,000 396,000 390,000 66,000 151,000 57,000 800,000Yearly Totals
Electrical
Replace Ext Building Lights 140,000
Replace Fire Alarm Devices 120,000
Replace Intercom/Clock System 66,000
Replace Main Switch Gear 250,000
Replace Parking Lot Lights 120,000
Design Main Switch Gear 30,000
HVAC
Renovate Terminal A/C Equip Phase 2 1,500,000
Clean Air Distribution System 115,000
Renovate Terminal A/C Equipment 1,500,000
Replace Chiller and Pumps 800,000
Design Chiller Plant Replacement 57,000
Renovation
Seal/Repair Parking Lot 36,000
Paint Ext/Repl Expansion Joints 50,000
Paint Int Ext Doors & Frames 100,000
Paint Interior 122,000
Replace Carpet (All Areas) 75,000
Resurface Outdoor Courts 19,000
6-13
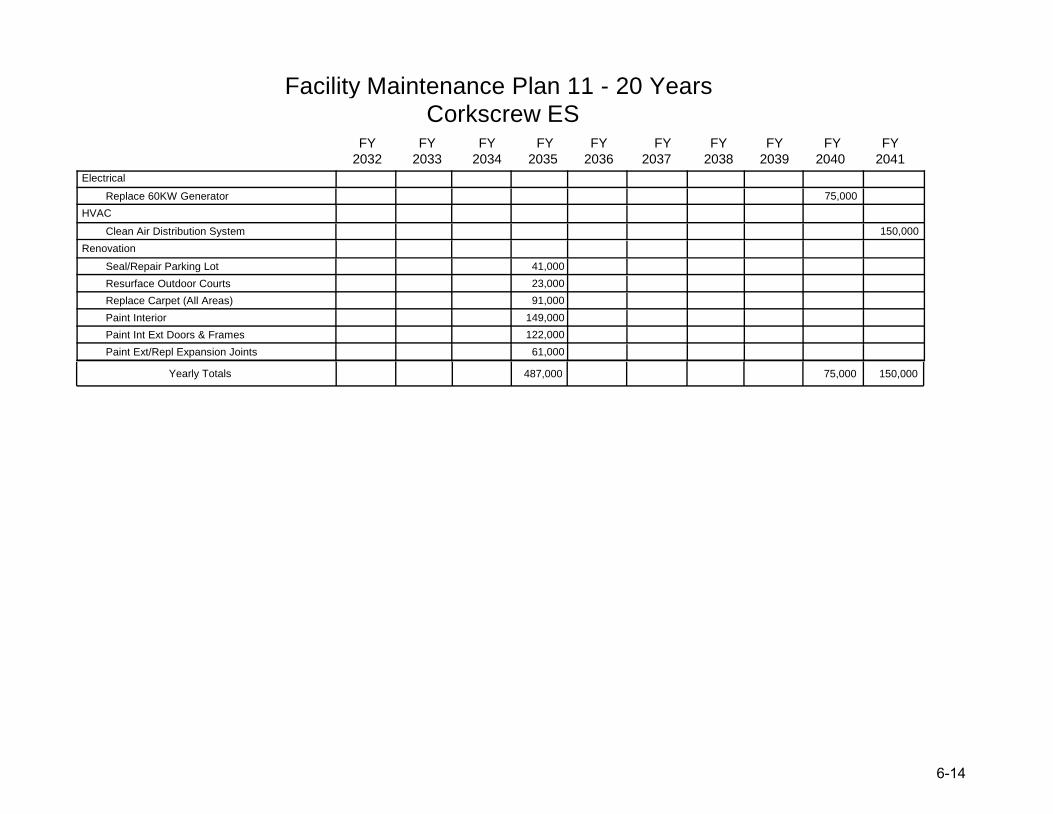
Facility Maintenance Plan 11 - 20 Years Corkscrew ES
2032 2033 2034 2035 2036
FY FY FY FY FY
2037 2038 2039 2040 2041
FY FY FY FY FY
487,000 75,000 150,000Yearly Totals
Electrical
Replace 60KW Generator 75,000
HVAC
Clean Air Distribution System 150,000
Renovation
Seal/Repair Parking Lot 41,000
Resurface Outdoor Courts 23,000
Replace Carpet (All Areas) 91,000
Paint Interior 149,000
Paint Int Ext Doors & Frames 122,000
Paint Ext/Repl Expansion Joints 61,000
6-1414

Facility Maintenance Plan - 10 Years Corkscrew MS
2022 2023 2024 2025 2026
FY FY FY FY FY
2027 2028 2029 2030 2031
FY FY FY FY FY
131,000 3,760,000 596,000 290,000 32,000 127,000Yearly Totals
Electrical
Replace Stage Sound System 55,000
Renovate Intercom/Clock System 71,000
Replace Ext Building Lights 115,000
Replace Fire Alarm Devices 120,000
Replace Gym Sound System 30,000
Replace Main Switch Gear 175,000
Replace Music Rm Sound System 55,000
Replace Parking Lot Lights 60,000
Design Main Switch Gear 45,000
Replace Stage Lighting System 75,000
HVAC
Renovate Terminal A/C Equipment 3,500,000
Renovation
Seal/Stripe Track 52,000
Paint Ext/Repl Expansion Joints 50,000
Paint Hallway and Locker Rm Lockers 75,000
Paint Int Ext Doors & Frames 100,000
Paint Interior 250,000
Replace Carpet (All Areas) 50,000
Resurface Outdoor Courts 32,000
Seal/Repair Parking Lot 26,000
6-155
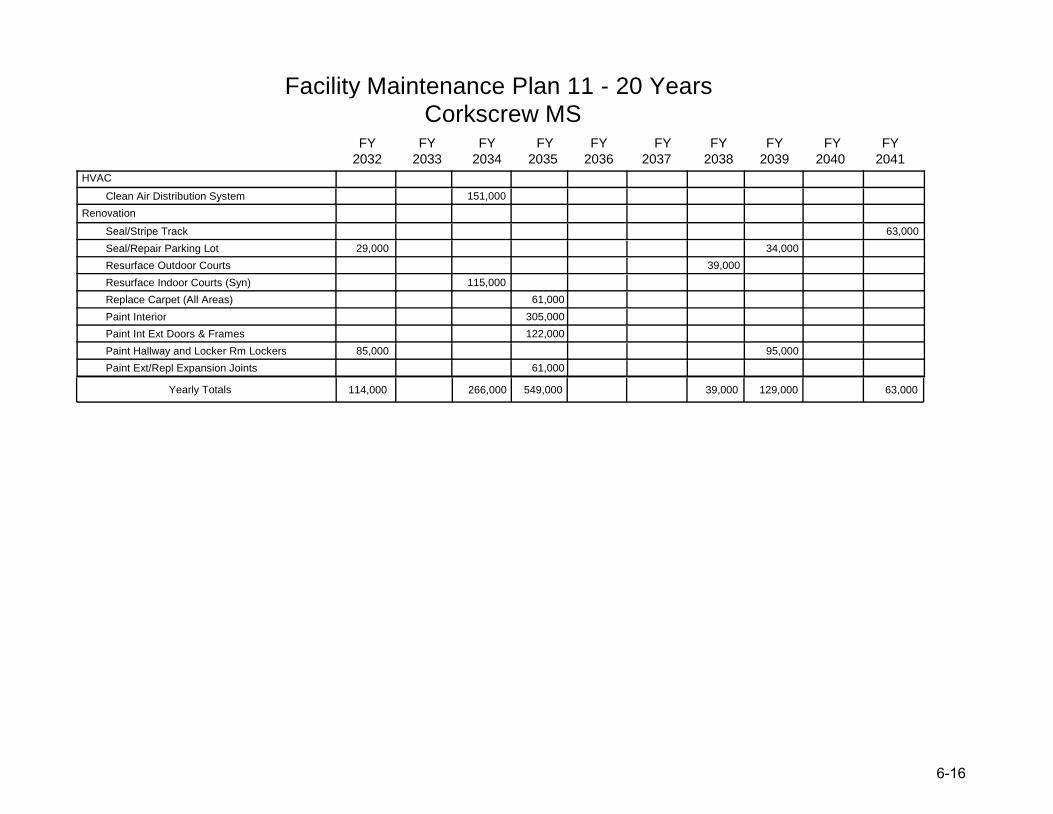
Facility Maintenance Plan 11 - 20 Years Corkscrew MS
2032 2033 2034 2035 2036
FY FY FY FY FY
2037 2038 2039 2040 2041
FY FY FY FY FY
114,000 266,000 549,000 39,000 129,000 63,000Yearly Totals
HVAC
Clean Air Distribution System 151,000
Renovation
Seal/Stripe Track 63,000
Seal/Repair Parking Lot 29,000 34,000
Resurface Outdoor Courts 39,000
Resurface Indoor Courts (Syn) 115,000
Replace Carpet (All Areas) 61,000
Paint Interior 305,000
Paint Int Ext Doors & Frames 122,000
Paint Hallway and Locker Rm Lockers 85,000 95,000
Paint Ext/Repl Expansion Joints 61,000
6-1616
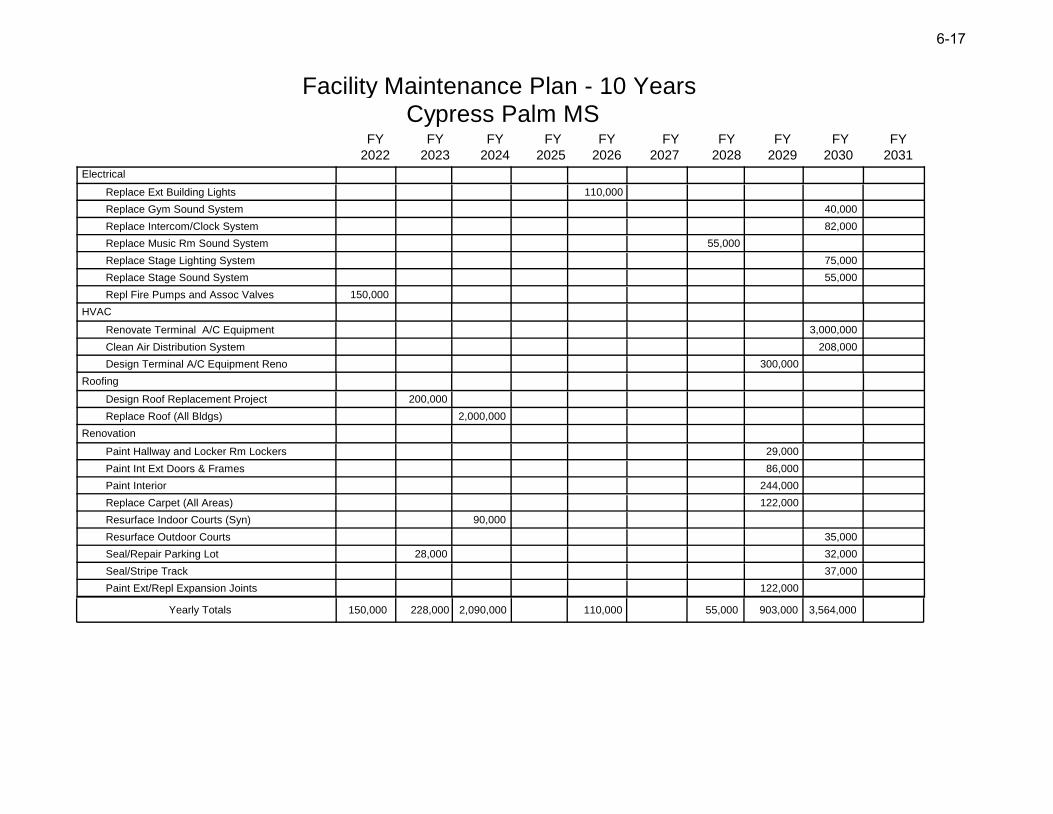
Facility Maintenance Plan - 10 Years Cypress Palm MS
2022 2023 2024 2025 2026
FY FY FY FY FY
2027 2028 2029 2030 2031
FY FY FY FY FY
150,000 228,000 2,090,000 110,000 55,000 903,000 3,564,000Yearly Totals
Electrical
Replace Ext Building Lights 110,000
Replace Gym Sound System 40,000
Replace Intercom/Clock System 82,000
Replace Music Rm Sound System 55,000
Replace Stage Lighting System 75,000
Replace Stage Sound System 55,000
Repl Fire Pumps and Assoc Valves 150,000
HVAC
Renovate Terminal A/C Equipment 3,000,000
Clean Air Distribution System 208,000
Design Terminal A/C Equipment Reno 300,000
Roofing
Design Roof Replacement Project 200,000
Replace Roof (All Bldgs) 2,000,000
Renovation
Paint Hallway and Locker Rm Lockers 29,000
Paint Int Ext Doors & Frames 86,000
Paint Interior 244,000
Replace Carpet (All Areas) 122,000
Resurface Indoor Courts (Syn) 90,000
Resurface Outdoor Courts 35,000
Seal/Repair Parking Lot 28,000 32,000
Seal/Stripe Track 37,000
Paint Ext/Repl Expansion Joints 122,000
6-17
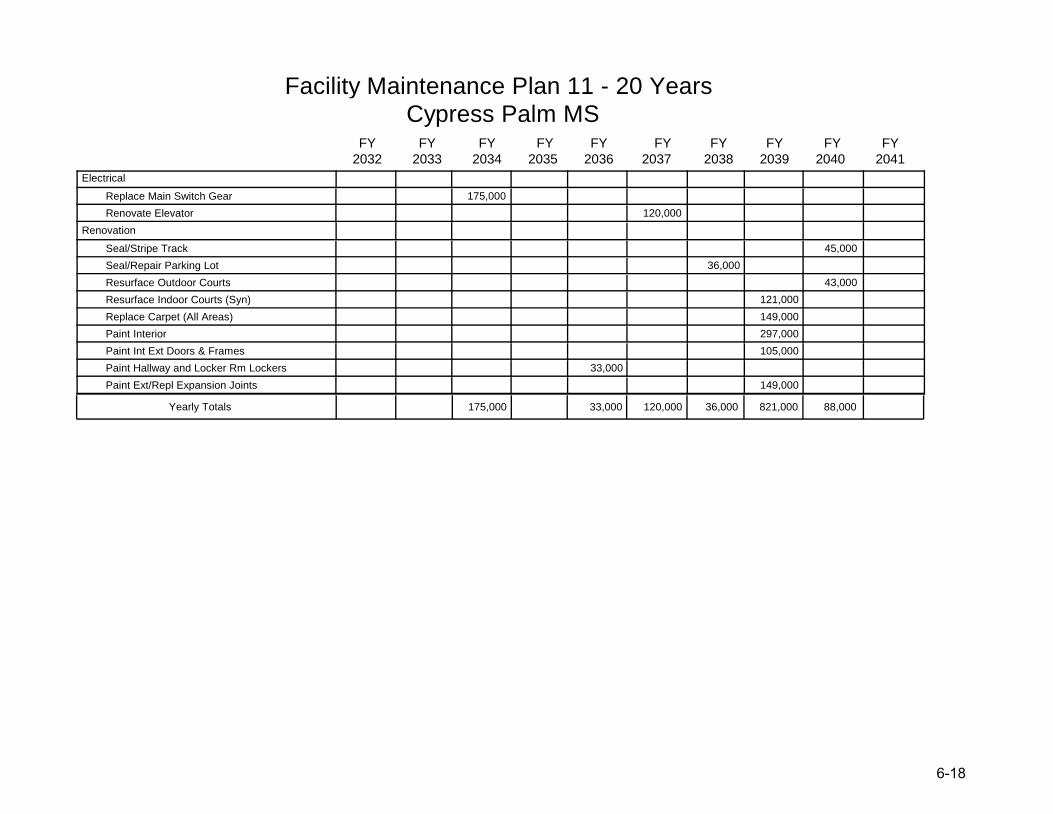
Facility Maintenance Plan 11 - 20 Years Cypress Palm MS
2032 2033 2034 2035 2036
FY FY FY FY FY
2037 2038 2039 2040 2041
FY FY FY FY FY
175,000 33,000 120,000 36,000 821,000 88,000Yearly Totals
Electrical
Replace Main Switch Gear 175,000
Renovate Elevator 120,000
Renovation
Seal/Stripe Track 45,000
Seal/Repair Parking Lot 36,000
Resurface Outdoor Courts 43,000
Resurface Indoor Courts (Syn) 121,000
Replace Carpet (All Areas) 149,000
Paint Interior 297,000
Paint Int Ext Doors & Frames 105,000
Paint Hallway and Locker Rm Lockers 33,000
Paint Ext/Repl Expansion Joints 149,000
6-1818
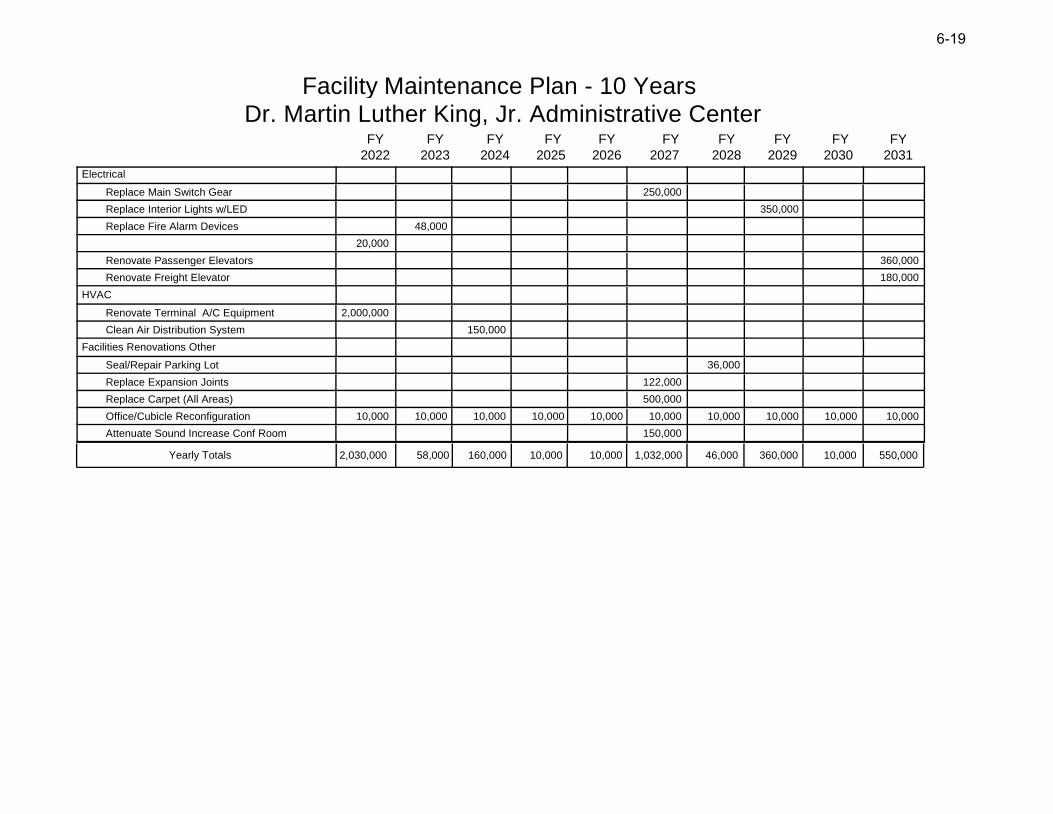
Facility Maintenance Plan - 10 Years Dr. Martin Luther King, Jr. Administrative Center
2022 2023 2024 2025 2026
FY FY FY FY FY
2027 2028 2029 2030 2031
FY FY FY FY FY
2,030,000 58,000 160,000 10,000 10,000 1,032,000 46,000 360,000 10,000 550,000Yearly Totals
Electrical
Replace Main Switch Gear 250,000
Replace Interior Lights w/LED 350,000
Replace Fire Alarm Devices 48,000
20,000
Renovate Passenger Elevators 360,000
Renovate Freight Elevator 180,000
HVAC
Renovate Terminal A/C Equipment 2,000,000
Clean Air Distribution System 150,000
Facilities Renovations Other
Seal/Repair Parking Lot 36,000
Replace Expansion Joints 122,000
Replace Carpet (All Areas) 500,000
Office/Cubicle Reconfiguration 10,000 10,000 10,000 10,000 10,000 10,000 10,000 10,000 10,000 10,000
Attenuate Sound Increase Conf Room 150,000
6-199

Facility Maintenance Plan 11 - 20 Years Dr. Martin Luther King, Jr. Administrative Center
2032 2033 2034 2035 2036
FY FY FY FY FY
2037 2038 2039 2040 2041
FY FY FY FY FY
10,000 10,000 10,000 51,000 10,000 193,000 60,000 1,010,000 10,000 10,000Yearly Totals
HVAC
Clean Air Distribution System 183,000
Roofing
Replace Roof 1,000,000
Design Roof Replacement Project 50,000
Facilities Renovations Other
Seal/Repair Parking Lot 41,000
Office/Cubicle Reconfiguration 10,000 10,000 10,000 10,000 10,000 10,000 10,000 10,000 10,000 10,000
6-200
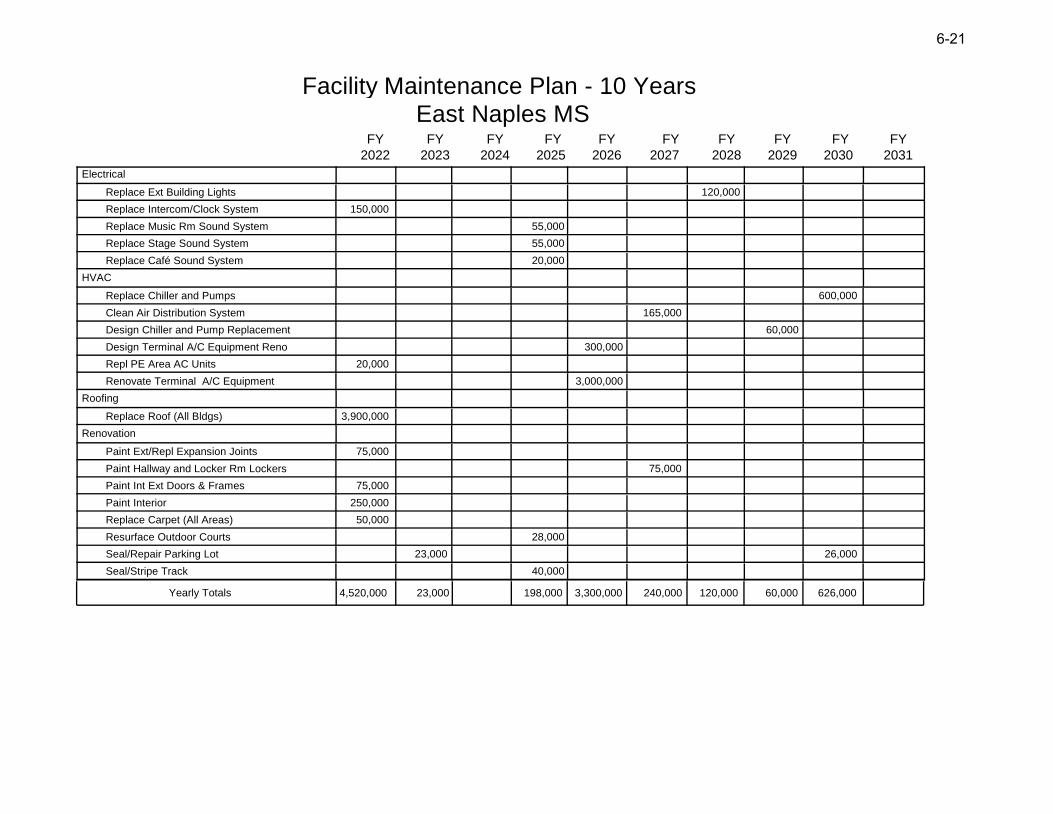
Facility Maintenance Plan - 10 Years East Naples MS
2022 2023 2024 2025 2026
FY FY FY FY FY
2027 2028 2029 2030 2031
FY FY FY FY FY
4,520,000 23,000 198,000 3,300,000 240,000 120,000 60,000 626,000Yearly Totals
Electrical
Replace Ext Building Lights 120,000
Replace Intercom/Clock System 150,000
Replace Music Rm Sound System 55,000
Replace Stage Sound System 55,000
Replace Café Sound System 20,000
HVAC
Replace Chiller and Pumps 600,000
Clean Air Distribution System 165,000
Design Chiller and Pump Replacement 60,000
Design Terminal A/C Equipment Reno 300,000
Repl PE Area AC Units 20,000
Renovate Terminal A/C Equipment 3,000,000
Roofing
Replace Roof (All Bldgs) 3,900,000
Renovation
Paint Ext/Repl Expansion Joints 75,000
Paint Hallway and Locker Rm Lockers 75,000
Paint Int Ext Doors & Frames 75,000
Paint Interior 250,000
Replace Carpet (All Areas) 50,000
Resurface Outdoor Courts 28,000
Seal/Repair Parking Lot 23,000 26,000
Seal/Stripe Track 40,000
6-21
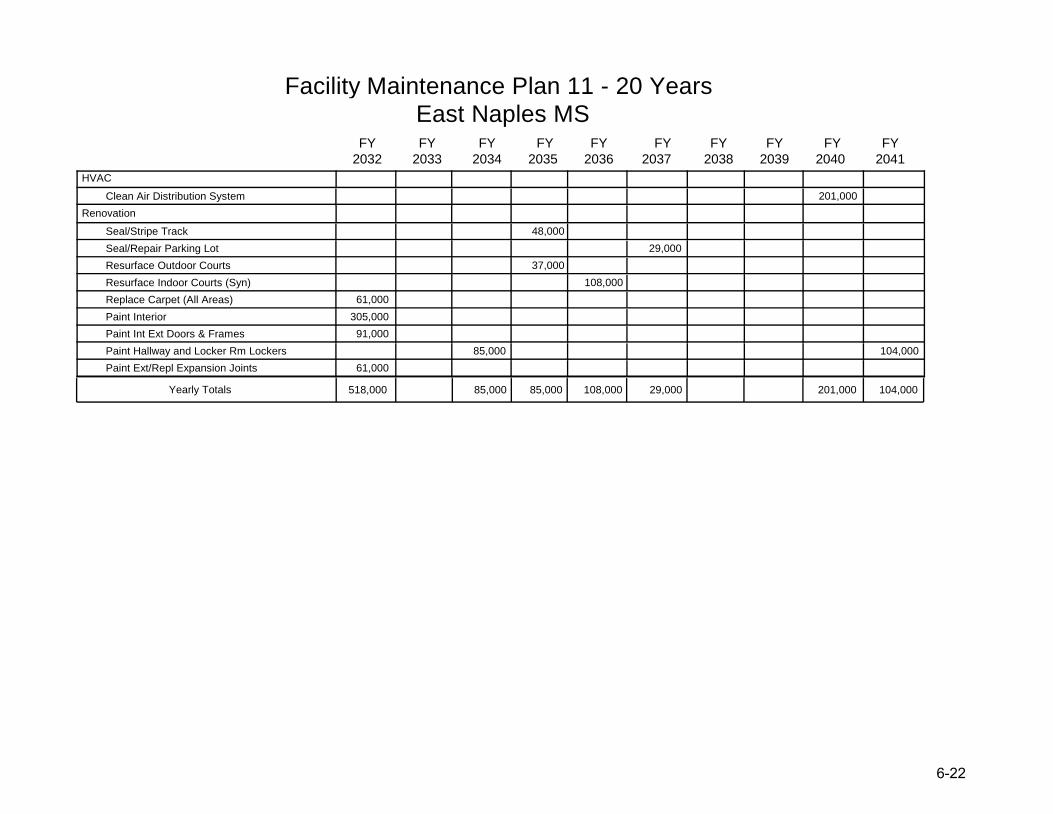
Facility Maintenance Plan 11 - 20 Years East Naples MS
2032 2033 2034 2035 2036
FY FY FY FY FY
2037 2038 2039 2040 2041
FY FY FY FY FY
518,000 85,000 85,000 108,000 29,000 201,000 104,000Yearly Totals
HVAC
Clean Air Distribution System 201,000
Renovation
Seal/Stripe Track 48,000
Seal/Repair Parking Lot 29,000
Resurface Outdoor Courts 37,000
Resurface Indoor Courts (Syn) 108,000
Replace Carpet (All Areas) 61,000
Paint Interior 305,000
Paint Int Ext Doors & Frames 91,000
Paint Hallway and Locker Rm Lockers 85,000 104,000
Paint Ext/Repl Expansion Joints 61,000
6-22
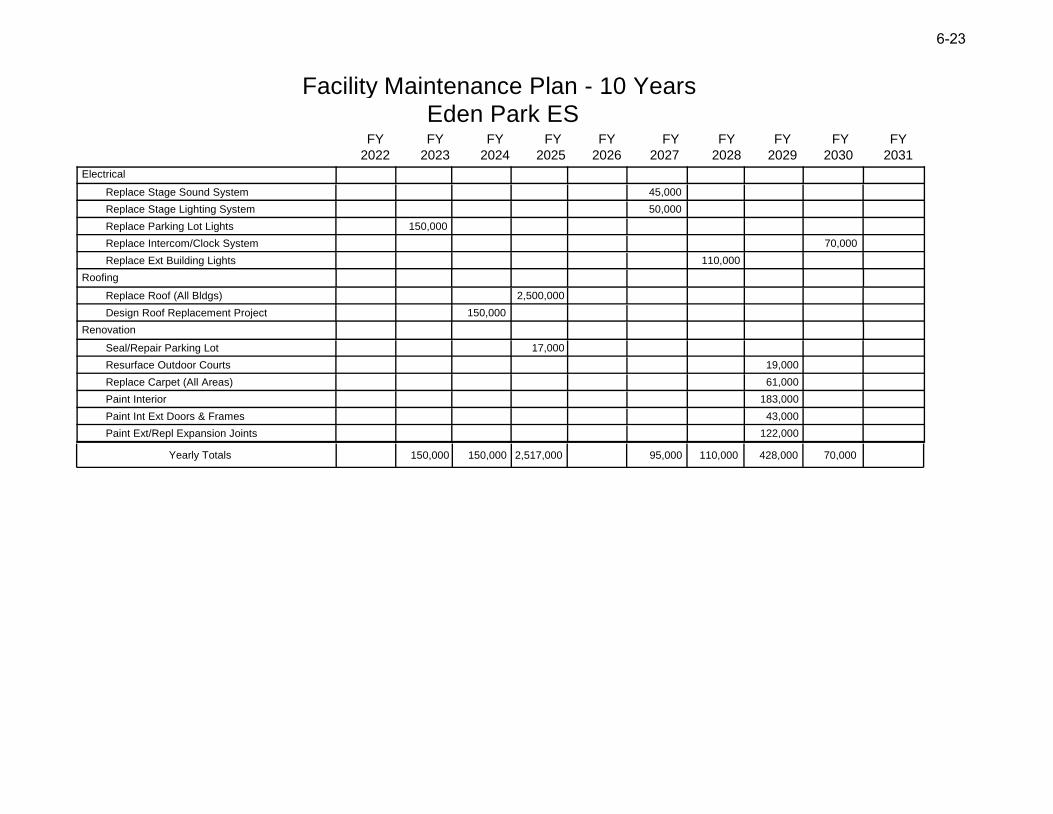
Facility Maintenance Plan - 10 Years Eden Park ES
2022 2023 2024 2025 2026
FY FY FY FY FY
2027 2028 2029 2030 2031
FY FY FY FY FY
150,000 150,000 2,517,000 95,000 110,000 428,000 70,000Yearly Totals
Electrical
Replace Stage Sound System 45,000
Replace Stage Lighting System 50,000
Replace Parking Lot Lights 150,000
Replace Intercom/Clock System 70,000
Replace Ext Building Lights 110,000
Roofing
Replace Roof (All Bldgs) 2,500,000
Design Roof Replacement Project 150,000
Renovation
Seal/Repair Parking Lot 17,000
Resurface Outdoor Courts 19,000
Replace Carpet (All Areas) 61,000
Paint Interior 183,000
Paint Int Ext Doors & Frames 43,000
Paint Ext/Repl Expansion Joints 122,000
6-23
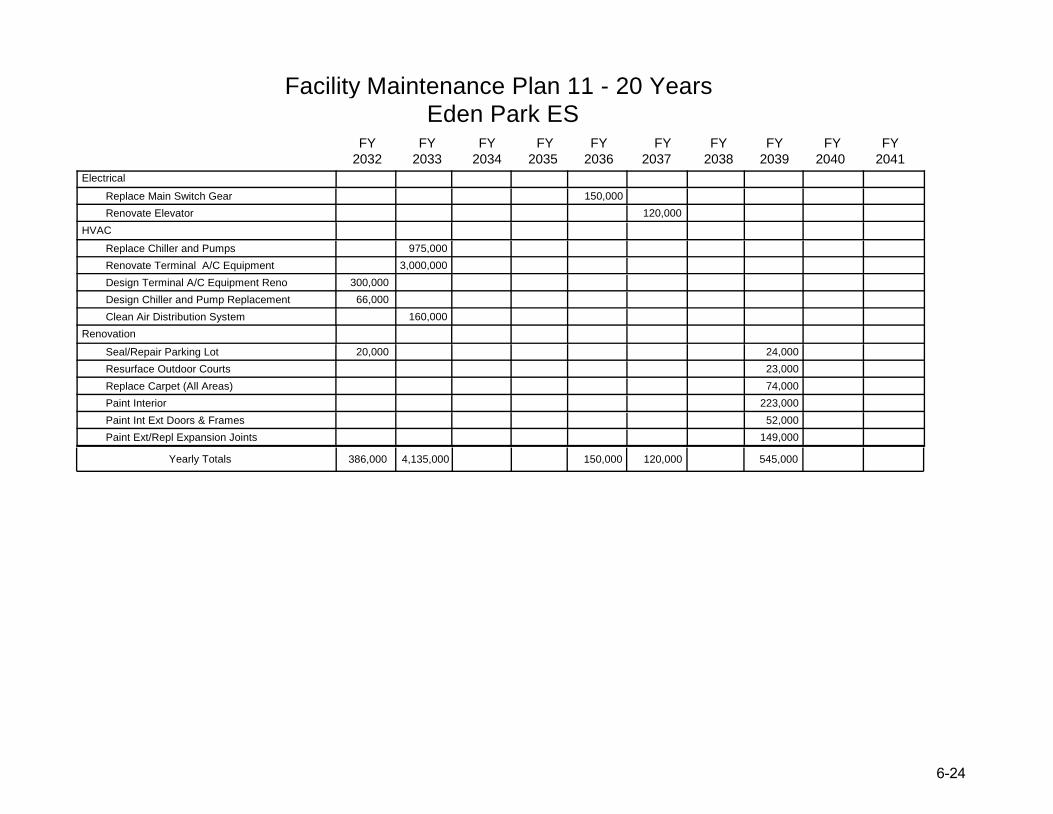
Facility Maintenance Plan 11 - 20 Years Eden Park ES
2032 2033 2034 2035 2036
FY FY FY FY FY
2037 2038 2039 2040 2041
FY FY FY FY FY
386,000 4,135,000 150,000 120,000 545,000Yearly Totals
Electrical
Replace Main Switch Gear 150,000
Renovate Elevator 120,000
HVAC
Replace Chiller and Pumps 975,000
Renovate Terminal A/C Equipment 3,000,000
Design Terminal A/C Equipment Reno 300,000
Design Chiller and Pump Replacement 66,000
Clean Air Distribution System 160,000
Renovation
Seal/Repair Parking Lot 20,000 24,000
Resurface Outdoor Courts 23,000
Replace Carpet (All Areas) 74,000
Paint Interior 223,000
Paint Int Ext Doors & Frames 52,000
Paint Ext/Repl Expansion Joints 149,000
6-244
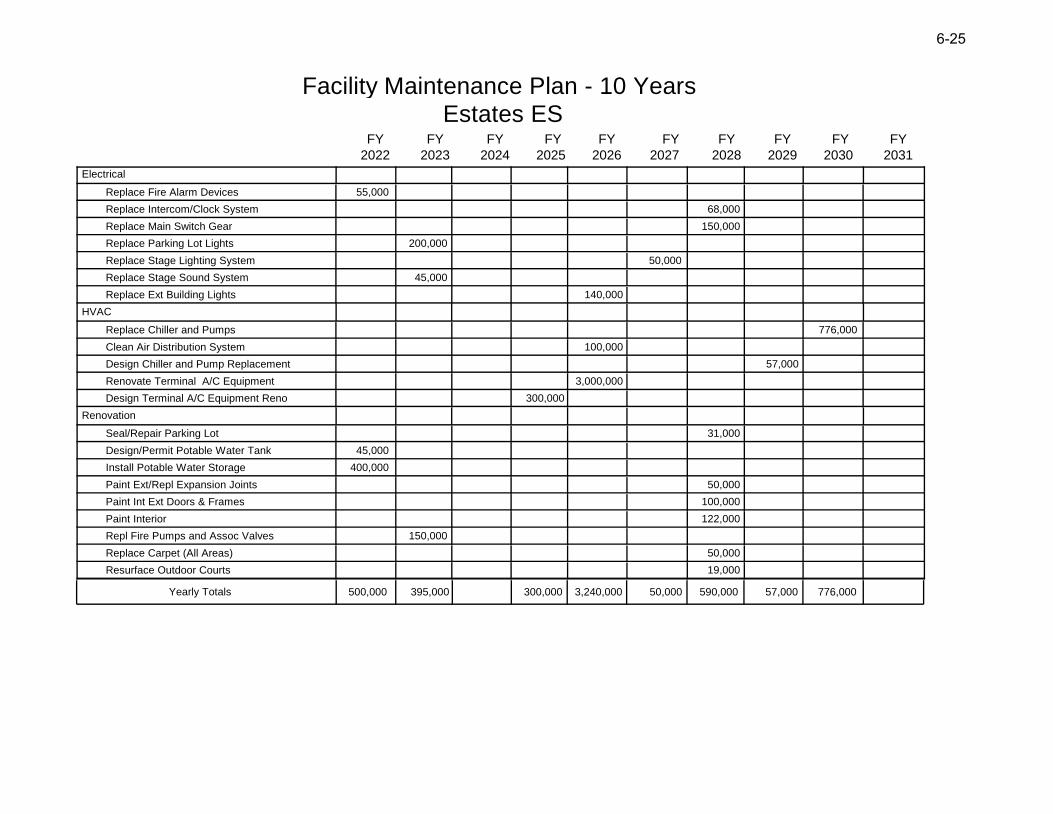
Facility Maintenance Plan - 10 Years Estates ES
2022 2023 2024 2025 2026
FY FY FY FY FY
2027 2028 2029 2030 2031
FY FY FY FY FY
500,000 395,000 300,000 3,240,000 50,000 590,000 57,000 776,000Yearly Totals
Electrical
Replace Fire Alarm Devices 55,000
Replace Intercom/Clock System 68,000
Replace Main Switch Gear 150,000
Replace Parking Lot Lights 200,000
Replace Stage Lighting System 50,000
Replace Stage Sound System 45,000
Replace Ext Building Lights 140,000
HVAC
Replace Chiller and Pumps 776,000
Clean Air Distribution System 100,000
Design Chiller and Pump Replacement 57,000
Renovate Terminal A/C Equipment 3,000,000
Design Terminal A/C Equipment Reno 300,000
Renovation
Seal/Repair Parking Lot 31,000
Design/Permit Potable Water Tank 45,000
Install Potable Water Storage 400,000
Paint Ext/Repl Expansion Joints 50,000
Paint Int Ext Doors & Frames 100,000
Paint Interior 122,000
Repl Fire Pumps and Assoc Valves 150,000
Replace Carpet (All Areas) 50,000
Resurface Outdoor Courts 19,000
6-2525

Facility Maintenance Plan 11 - 20 Years Estates ES
2032 2033 2034 2035 2036
FY FY FY FY FY
2037 2038 2039 2040 2041
FY FY FY FY FY
35,000 416,000 120,000Yearly Totals
HVAC
Clean Air Distribution System 120,000
Renovation
Seal/Repair Parking Lot 35,000
Resurface Outdoor Courts 23,000
Replace Carpet (All Areas) 61,000
Paint Interior 149,000
Paint Int Ext Doors & Frames 122,000
Paint Ext/Repl Expansion Joints 61,000
6-266
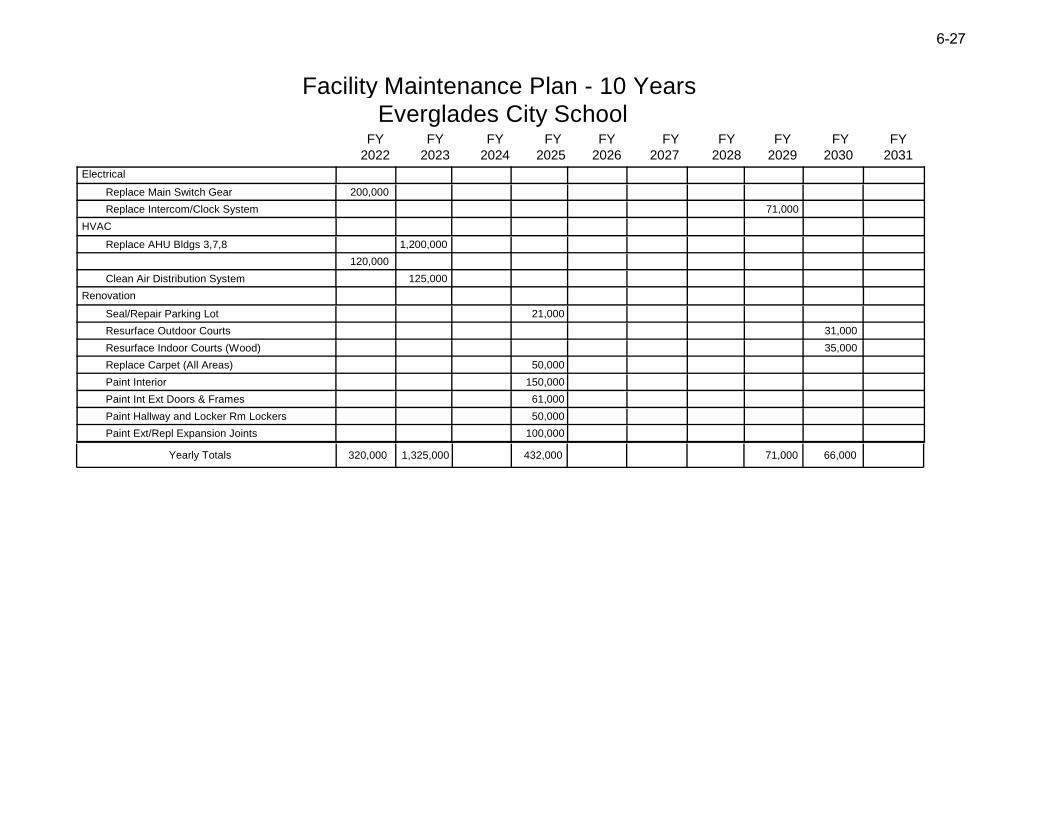
Facility Maintenance Plan - 10 Years Everglades City School
2022 2023 2024 2025 2026
FY FY FY FY FY
2027 2028 2029 2030 2031
FY FY FY FY FY
320,000 1,325,000 432,000 71,000 66,000Yearly Totals
Electrical
Replace Main Switch Gear 200,000
Replace Intercom/Clock System 71,000
HVAC
Replace AHU Bldgs 3,7,8 1,200,000
120,000
Clean Air Distribution System 125,000
Renovation
Seal/Repair Parking Lot 21,000
Resurface Outdoor Courts 31,000
Resurface Indoor Courts (Wood) 35,000
Replace Carpet (All Areas) 50,000
Paint Interior 150,000
Paint Int Ext Doors & Frames 61,000
Paint Hallway and Locker Rm Lockers 50,000
Paint Ext/Repl Expansion Joints 100,000
6-27
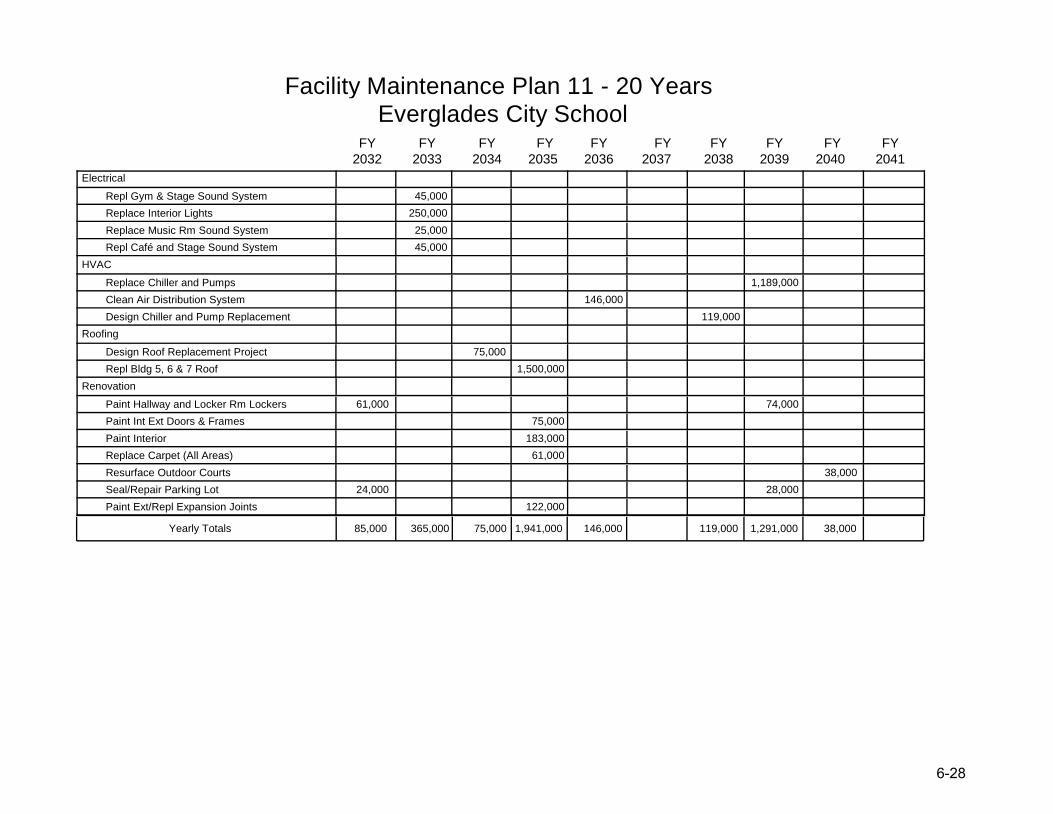
Facility Maintenance Plan 11 - 20 Years Everglades City School
2032 2033 2034 2035 2036
FY FY FY FY FY
2037 2038 2039 2040 2041
FY FY FY FY FY
85,000 365,000 75,000 1,941,000 146,000 119,000 1,291,000 38,000Yearly Totals
Electrical
Repl Gym & Stage Sound System 45,000
Replace Interior Lights 250,000
Replace Music Rm Sound System 25,000
Repl Café and Stage Sound System 45,000
HVAC
Replace Chiller and Pumps 1,189,000
Clean Air Distribution System 146,000
Design Chiller and Pump Replacement 119,000
Roofing
Design Roof Replacement Project 75,000
Repl Bldg 5, 6 & 7 Roof 1,500,000
Renovation
Paint Hallway and Locker Rm Lockers 61,000 74,000
Paint Int Ext Doors & Frames 75,000
Paint Interior 183,000
Replace Carpet (All Areas) 61,000
Resurface Outdoor Courts 38,000
Seal/Repair Parking Lot 24,000 28,000
Paint Ext/Repl Expansion Joints 122,000
6-288
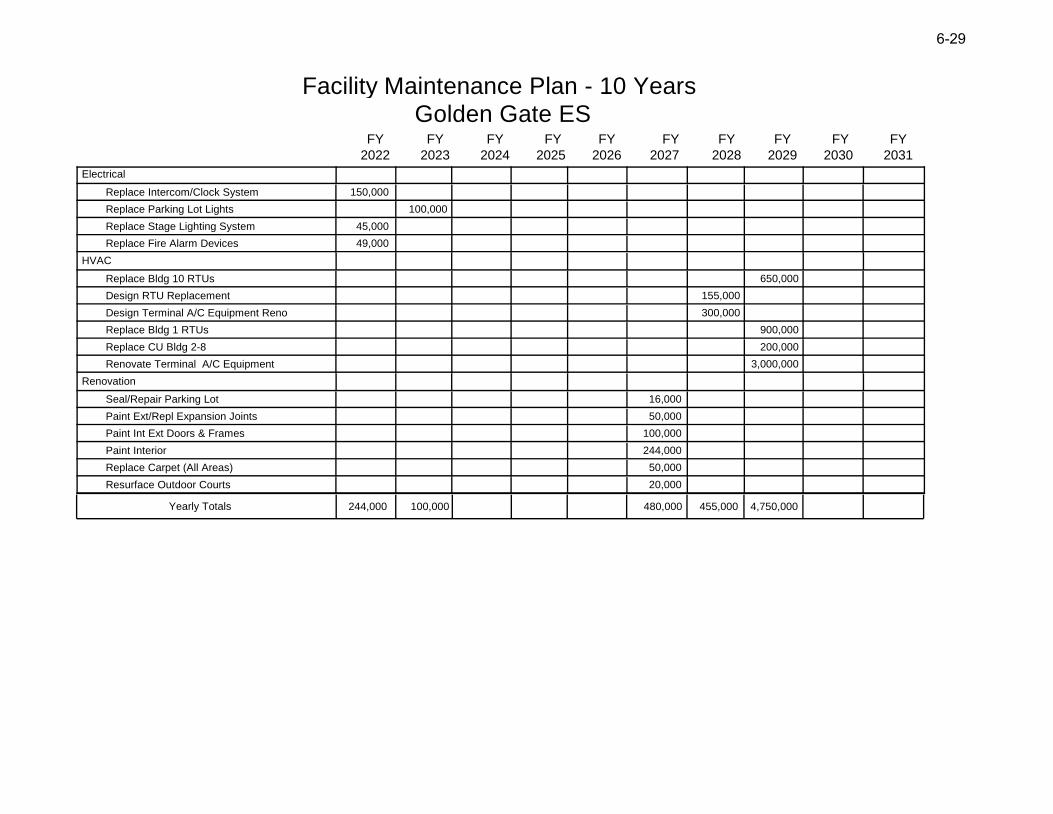
Facility Maintenance Plan - 10 Years Golden Gate ES
2022 2023 2024 2025 2026
FY FY FY FY FY
2027 2028 2029 2030 2031
FY FY FY FY FY
244,000 100,000 480,000 455,000 4,750,000Yearly Totals
Electrical
Replace Intercom/Clock System 150,000
Replace Parking Lot Lights 100,000
Replace Stage Lighting System 45,000
Replace Fire Alarm Devices 49,000
HVAC
Replace Bldg 10 RTUs 650,000
Design RTU Replacement 155,000
Design Terminal A/C Equipment Reno 300,000
Replace Bldg 1 RTUs 900,000
Replace CU Bldg 2-8 200,000
Renovate Terminal A/C Equipment 3,000,000
Renovation
Seal/Repair Parking Lot 16,000
Paint Ext/Repl Expansion Joints 50,000
Paint Int Ext Doors & Frames 100,000
Paint Interior 244,000
Replace Carpet (All Areas) 50,000
Resurface Outdoor Courts 20,000
6-2929
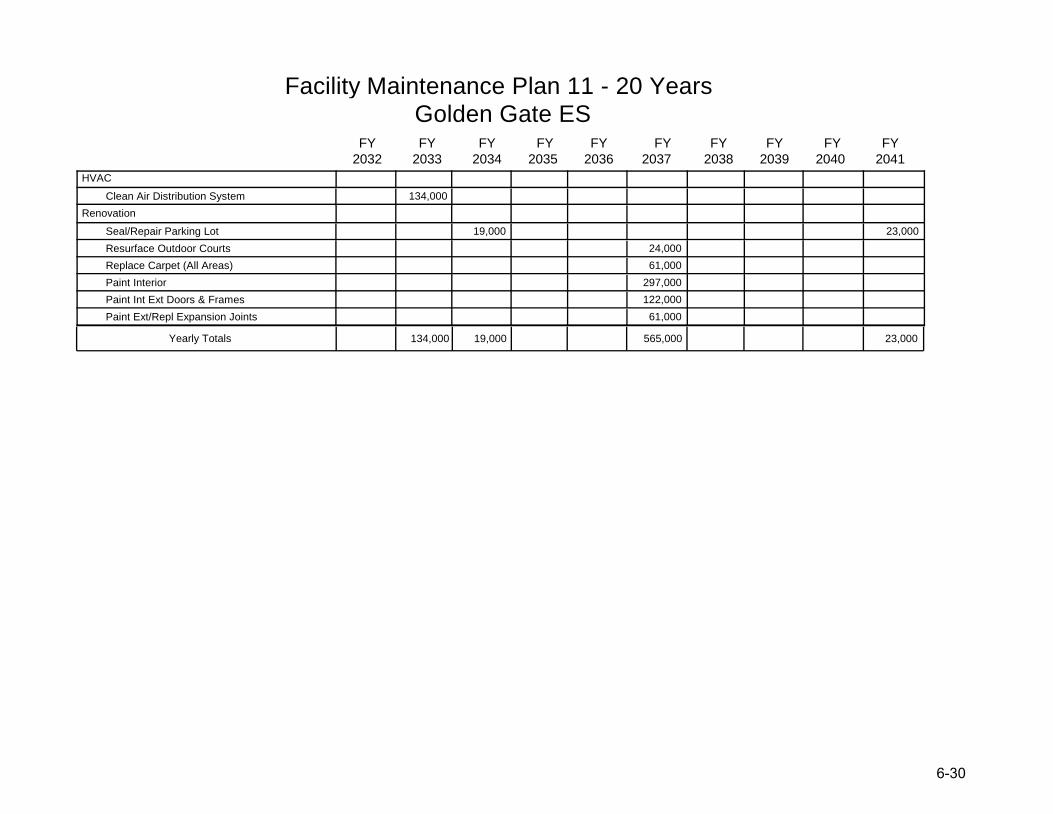
Facility Maintenance Plan 11 - 20 Years Golden Gate ES
2032 2033 2034 2035 2036
FY FY FY FY FY
2037 2038 2039 2040 2041
FY FY FY FY FY
134,000 19,000 565,000 23,000Yearly Totals
HVAC
Clean Air Distribution System 134,000
Renovation
Seal/Repair Parking Lot 19,000 23,000
Resurface Outdoor Courts 24,000
Replace Carpet (All Areas) 61,000
Paint Interior 297,000
Paint Int Ext Doors & Frames 122,000
Paint Ext/Repl Expansion Joints 61,000
6-300
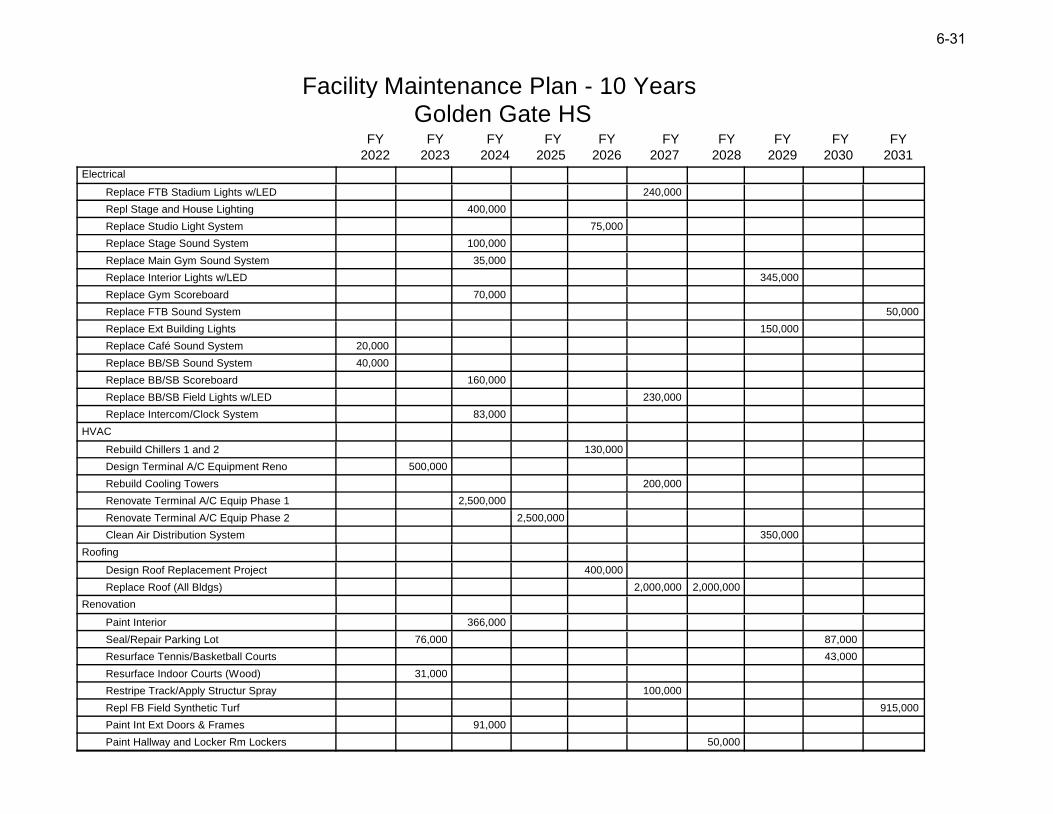
Facility Maintenance Plan - 10 Years Golden Gate HS
2022 2023 2024 2025 2026
FY FY FY FY FY
2027 2028 2029 2030 2031
FY FY FY FY FY
Electrical
Replace FTB Stadium Lights w/LED 240,000
Repl Stage and House Lighting 400,000
Replace Studio Light System 75,000
Replace Stage Sound System 100,000
Replace Main Gym Sound System 35,000
Replace Interior Lights w/LED 345,000
Replace Gym Scoreboard 70,000
Replace FTB Sound System 50,000
Replace Ext Building Lights 150,000
Replace Café Sound System 20,000
Replace BB/SB Sound System 40,000
Replace BB/SB Scoreboard 160,000
Replace BB/SB Field Lights w/LED 230,000
Replace Intercom/Clock System 83,000
HVAC
Rebuild Chillers 1 and 2 130,000
Design Terminal A/C Equipment Reno 500,000
Rebuild Cooling Towers 200,000
Renovate Terminal A/C Equip Phase 1 2,500,000
Renovate Terminal A/C Equip Phase 2 2,500,000
Clean Air Distribution System 350,000
Roofing
Design Roof Replacement Project 400,000
Replace Roof (All Bldgs) 2,000,000 2,000,000
Renovation
Paint Interior 366,000
Seal/Repair Parking Lot 76,000 87,000
Resurface Tennis/Basketball Courts 43,000
Resurface Indoor Courts (Wood) 31,000
Restripe Track/Apply Structur Spray 100,000
Repl FB Field Synthetic Turf 915,000
Paint Int Ext Doors & Frames 91,000
Paint Hallway and Locker Rm Lockers 50,000
6-31
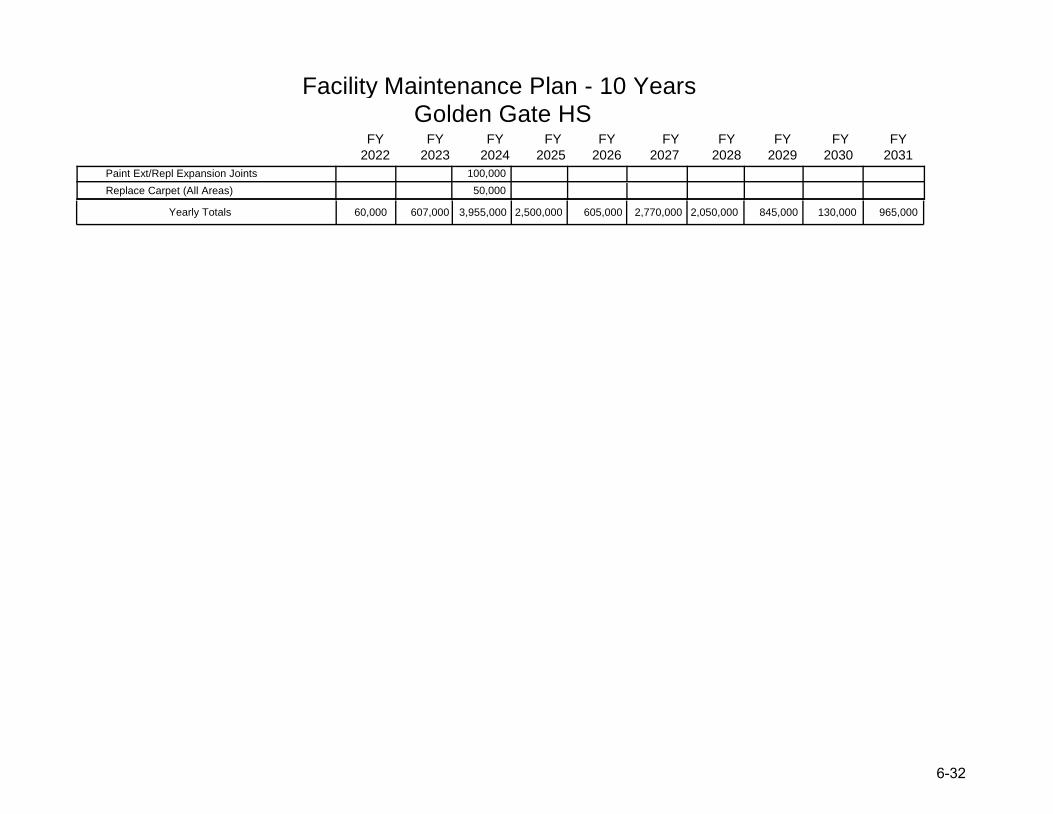
Facility Maintenance Plan - 10 Years Golden Gate HS
2022 2023 2024 2025 2026
FY FY FY FY FY
2027 2028 2029 2030 2031
FY FY FY FY FY
60,000 607,000 3,955,000 2,500,000 605,000 2,770,000 2,050,000 845,000 130,000 965,000Yearly Totals
Paint Ext/Repl Expansion Joints 100,000
Replace Carpet (All Areas) 50,000
6-32
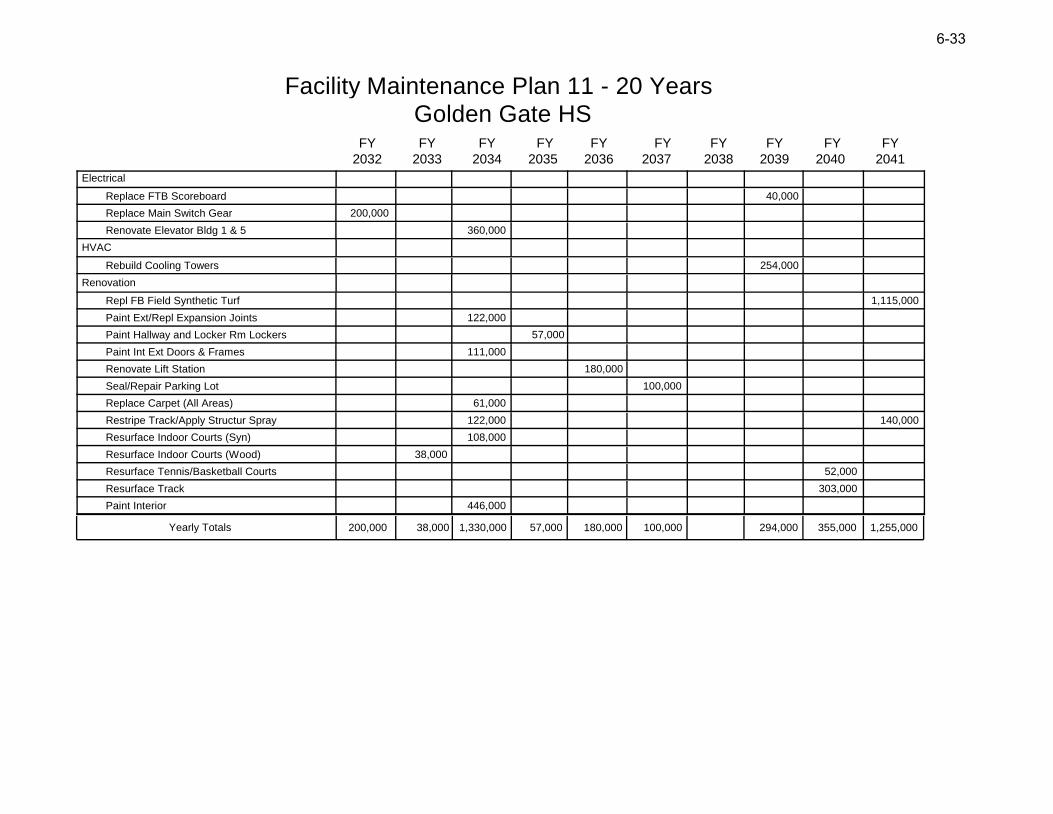
Facility Maintenance Plan 11 - 20 Years Golden Gate HS
2032 2033 2034 2035 2036
FY FY FY FY FY
2037 2038 2039 2040 2041
FY FY FY FY FY
200,000 38,000 1,330,000 57,000 180,000 100,000 294,000 355,000 1,255,000Yearly Totals
Electrical
Replace FTB Scoreboard 40,000
Replace Main Switch Gear 200,000
Renovate Elevator Bldg 1 & 5 360,000
HVAC
Rebuild Cooling Towers 254,000
Renovation
Repl FB Field Synthetic Turf 1,115,000
Paint Ext/Repl Expansion Joints 122,000
Paint Hallway and Locker Rm Lockers 57,000
Paint Int Ext Doors & Frames 111,000
Renovate Lift Station 180,000
Seal/Repair Parking Lot 100,000
Replace Carpet (All Areas) 61,000
Restripe Track/Apply Structur Spray 122,000 140,000
Resurface Indoor Courts (Syn) 108,000
Resurface Indoor Courts (Wood) 38,000
Resurface Tennis/Basketball Courts 52,000
Resurface Track 303,000
Paint Interior 446,000
6-33

THIS PAGE INTENTIONALLY LEFT BLANK
6-344
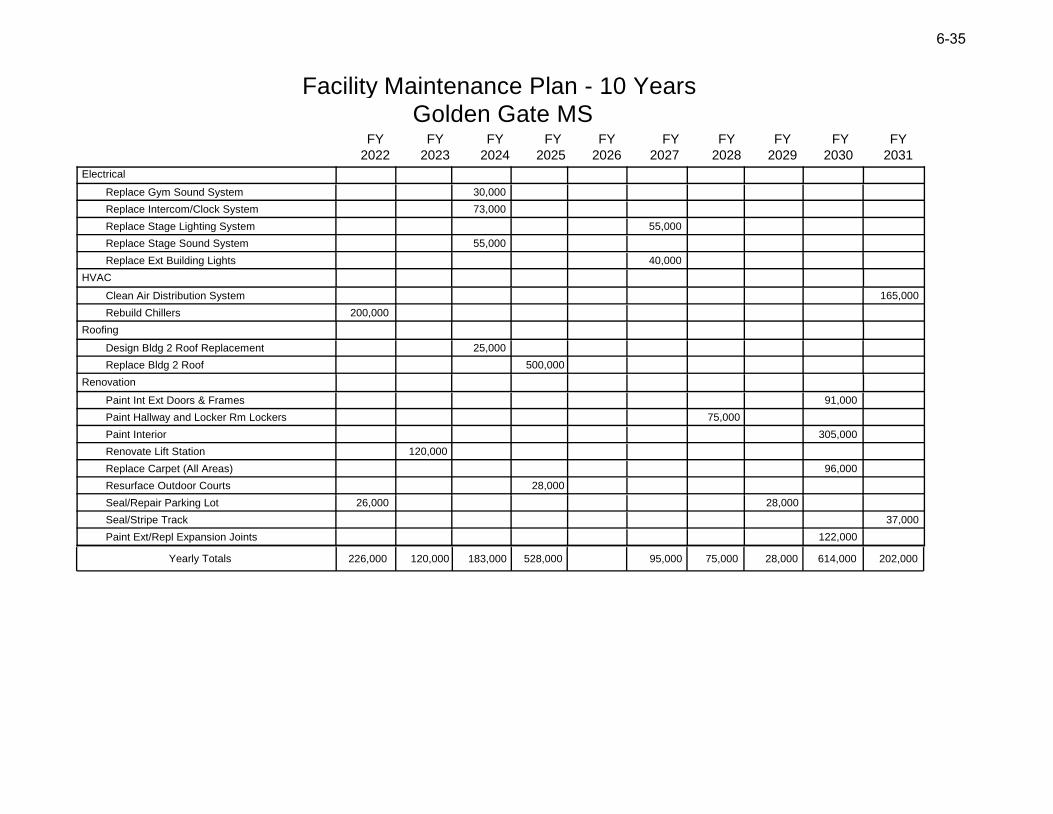
Facility Maintenance Plan - 10 Years Golden Gate MS
2022 2023 2024 2025 2026
FY FY FY FY FY
2027 2028 2029 2030 2031
FY FY FY FY FY
226,000 120,000 183,000 528,000 95,000 75,000 28,000 614,000 202,000Yearly Totals
Electrical
Replace Gym Sound System 30,000
Replace Intercom/Clock System 73,000
Replace Stage Lighting System 55,000
Replace Stage Sound System 55,000
Replace Ext Building Lights 40,000
HVAC
Clean Air Distribution System 165,000
Rebuild Chillers 200,000
Roofing
Design Bldg 2 Roof Replacement 25,000
Replace Bldg 2 Roof 500,000
Renovation
Paint Int Ext Doors & Frames 91,000
Paint Hallway and Locker Rm Lockers 75,000
Paint Interior 305,000
Renovate Lift Station 120,000
Replace Carpet (All Areas) 96,000
Resurface Outdoor Courts 28,000
Seal/Repair Parking Lot 26,000 28,000
Seal/Stripe Track 37,000
Paint Ext/Repl Expansion Joints 122,000
6-355
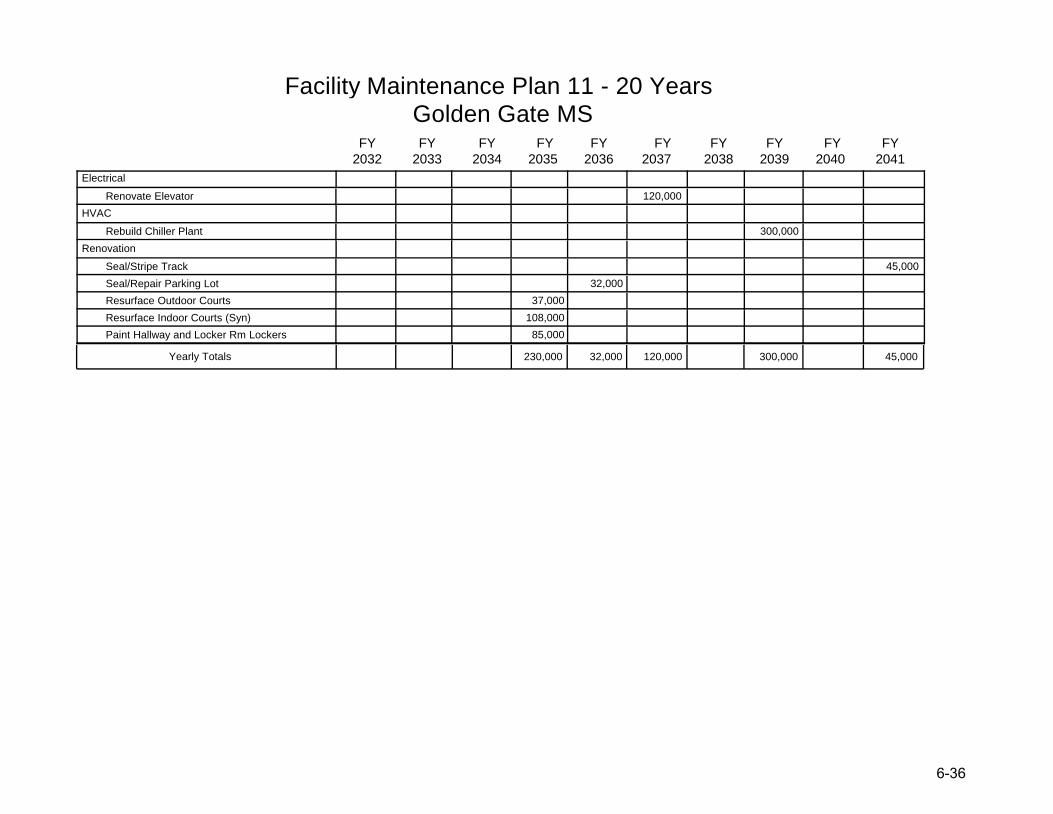
Facility Maintenance Plan 11 - 20 Years Golden Gate MS
2032 2033 2034 2035 2036
FY FY FY FY FY
2037 2038 2039 2040 2041
FY FY FY FY FY
230,000 32,000 120,000 300,000 45,000Yearly Totals
Electrical
Renovate Elevator 120,000
HVAC
Rebuild Chiller Plant 300,000
Renovation
Seal/Stripe Track 45,000
Seal/Repair Parking Lot 32,000
Resurface Outdoor Courts 37,000
Resurface Indoor Courts (Syn) 108,000
Paint Hallway and Locker Rm Lockers 85,000
6-366
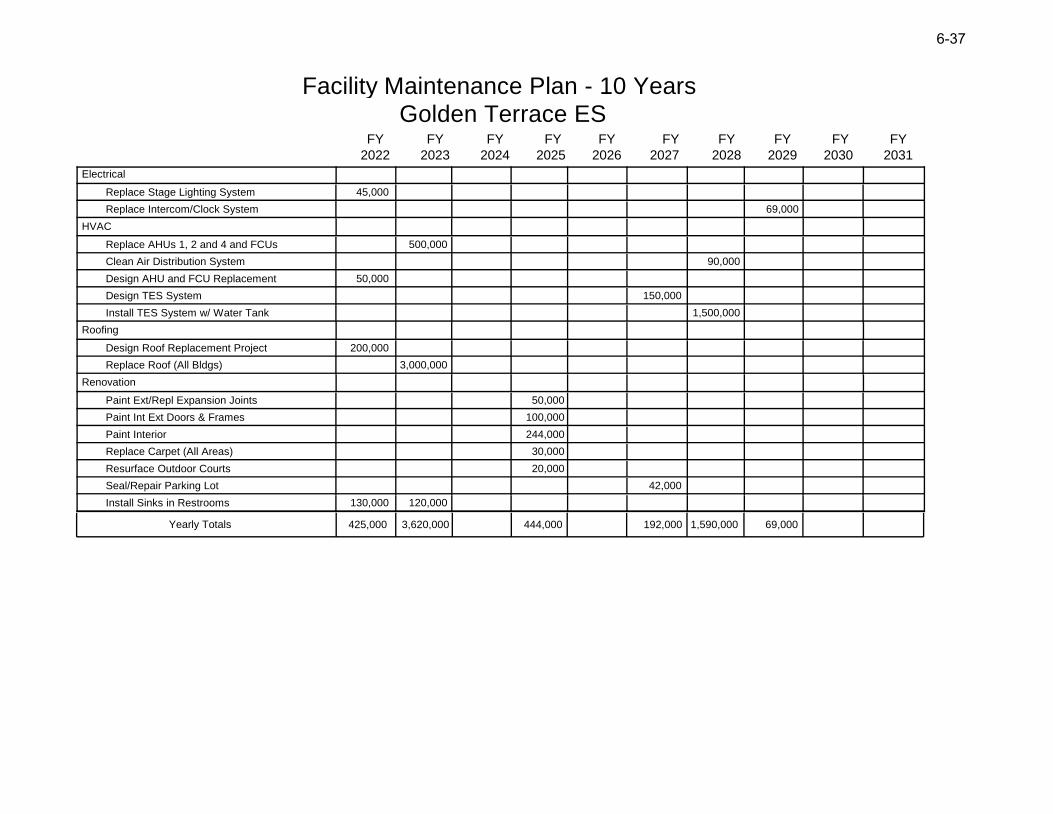
Facility Maintenance Plan - 10 Years Golden Terrace ES
2022 2023 2024 2025 2026
FY FY FY FY FY
2027 2028 2029 2030 2031
FY FY FY FY FY
425,000 3,620,000 444,000 192,000 1,590,000 69,000Yearly Totals
Electrical
Replace Stage Lighting System 45,000
Replace Intercom/Clock System 69,000
HVAC
Replace AHUs 1, 2 and 4 and FCUs 500,000
Clean Air Distribution System 90,000
Design AHU and FCU Replacement 50,000
Design TES System 150,000
Install TES System w/ Water Tank 1,500,000
Roofing
Design Roof Replacement Project 200,000
Replace Roof (All Bldgs) 3,000,000
Renovation
Paint Ext/Repl Expansion Joints 50,000
Paint Int Ext Doors & Frames 100,000
Paint Interior 244,000
Replace Carpet (All Areas) 30,000
Resurface Outdoor Courts 20,000
Seal/Repair Parking Lot 42,000
Install Sinks in Restrooms 130,000 120,000
6-37
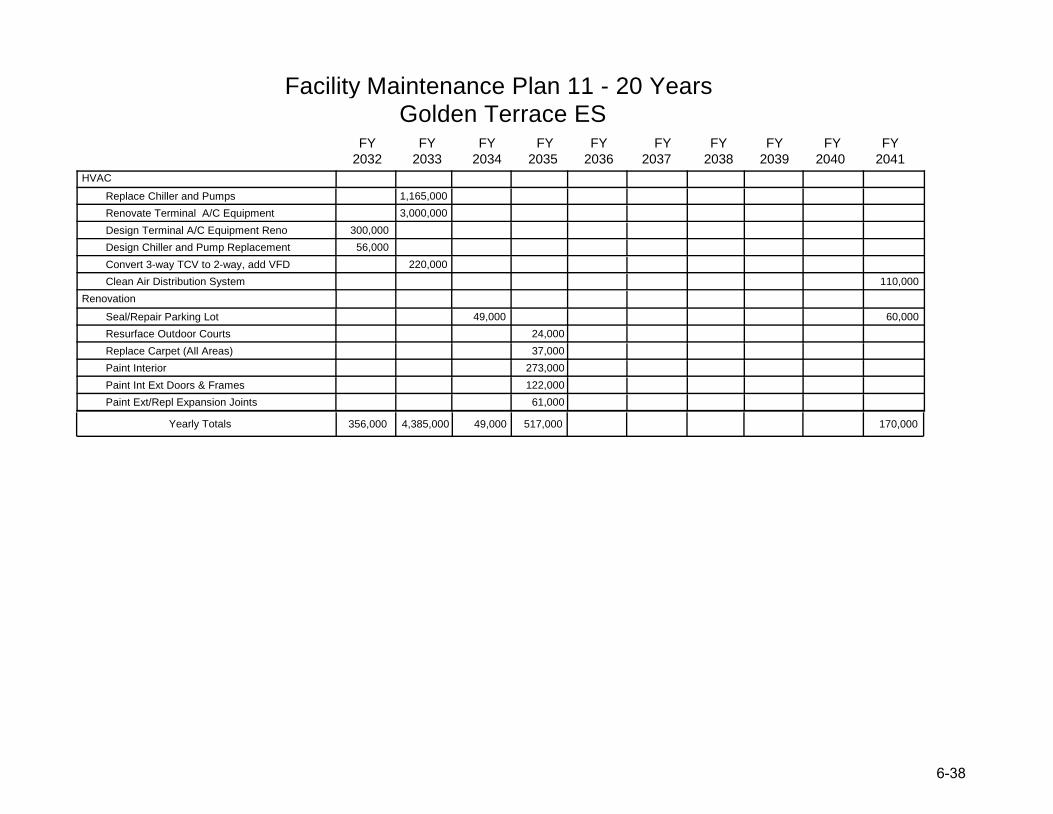
Facility Maintenance Plan 11 - 20 Years Golden Terrace ES
2032 2033 2034 2035 2036
FY FY FY FY FY
2037 2038 2039 2040 2041
FY FY FY FY FY
356,000 4,385,000 49,000 517,000 170,000Yearly Totals
HVAC
Replace Chiller and Pumps 1,165,000
Renovate Terminal A/C Equipment 3,000,000
Design Terminal A/C Equipment Reno 300,000
Design Chiller and Pump Replacement 56,000
Convert 3-way TCV to 2-way, add VFD 220,000
Clean Air Distribution System 110,000
Renovation
Seal/Repair Parking Lot 49,000 60,000
Resurface Outdoor Courts 24,000
Replace Carpet (All Areas) 37,000
Paint Interior 273,000
Paint Int Ext Doors & Frames 122,000
Paint Ext/Repl Expansion Joints 61,000
6-388
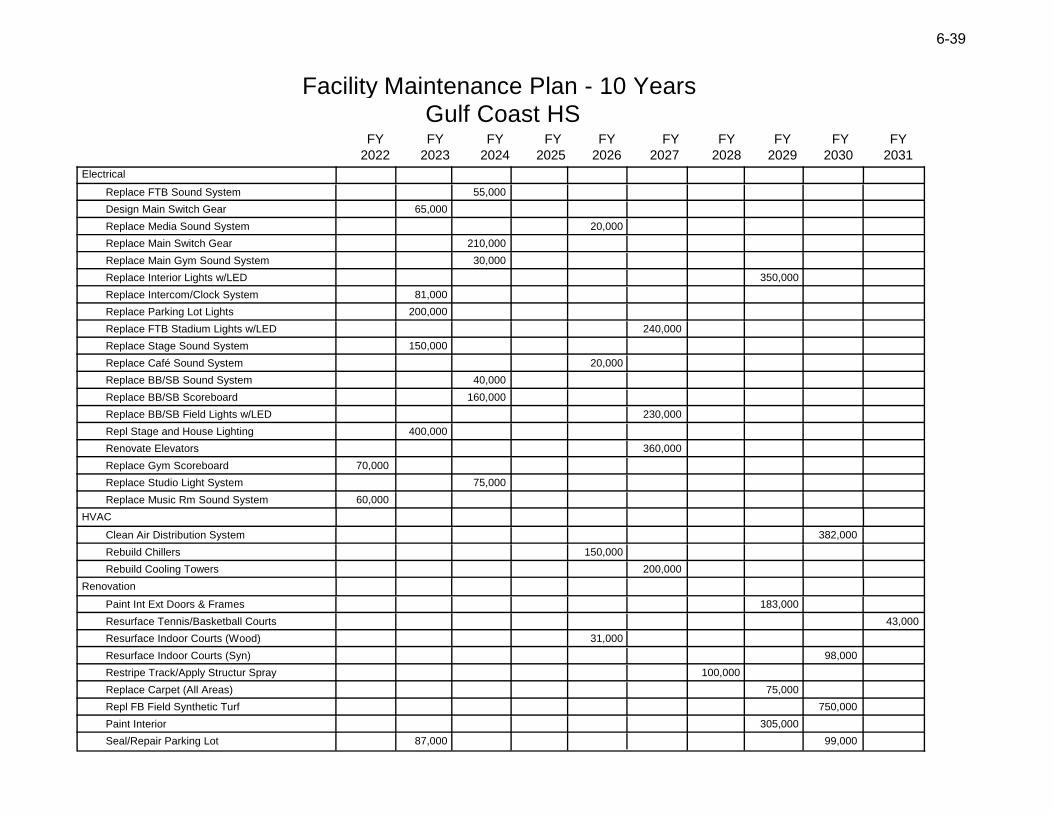
Facility Maintenance Plan - 10 Years Gulf Coast HS
2022 2023 2024 2025 2026
FY FY FY FY FY
2027 2028 2029 2030 2031
FY FY FY FY FY
Electrical
Replace FTB Sound System 55,000
Design Main Switch Gear 65,000
Replace Media Sound System 20,000
Replace Main Switch Gear 210,000
Replace Main Gym Sound System 30,000
Replace Interior Lights w/LED 350,000
Replace Intercom/Clock System 81,000
Replace Parking Lot Lights 200,000
Replace FTB Stadium Lights w/LED 240,000
Replace Stage Sound System 150,000
Replace Café Sound System 20,000
Replace BB/SB Sound System 40,000
Replace BB/SB Scoreboard 160,000
Replace BB/SB Field Lights w/LED 230,000
Repl Stage and House Lighting 400,000
Renovate Elevators 360,000
Replace Gym Scoreboard 70,000
Replace Studio Light System 75,000
Replace Music Rm Sound System 60,000
HVAC
Clean Air Distribution System 382,000
Rebuild Chillers 150,000
Rebuild Cooling Towers 200,000
Renovation
Paint Int Ext Doors & Frames 183,000
Resurface Tennis/Basketball Courts 43,000
Resurface Indoor Courts (Wood) 31,000
Resurface Indoor Courts (Syn) 98,000
Restripe Track/Apply Structur Spray 100,000
Replace Carpet (All Areas) 75,000
Repl FB Field Synthetic Turf 750,000
Paint Interior 305,000
Seal/Repair Parking Lot 87,000 99,000
6-399
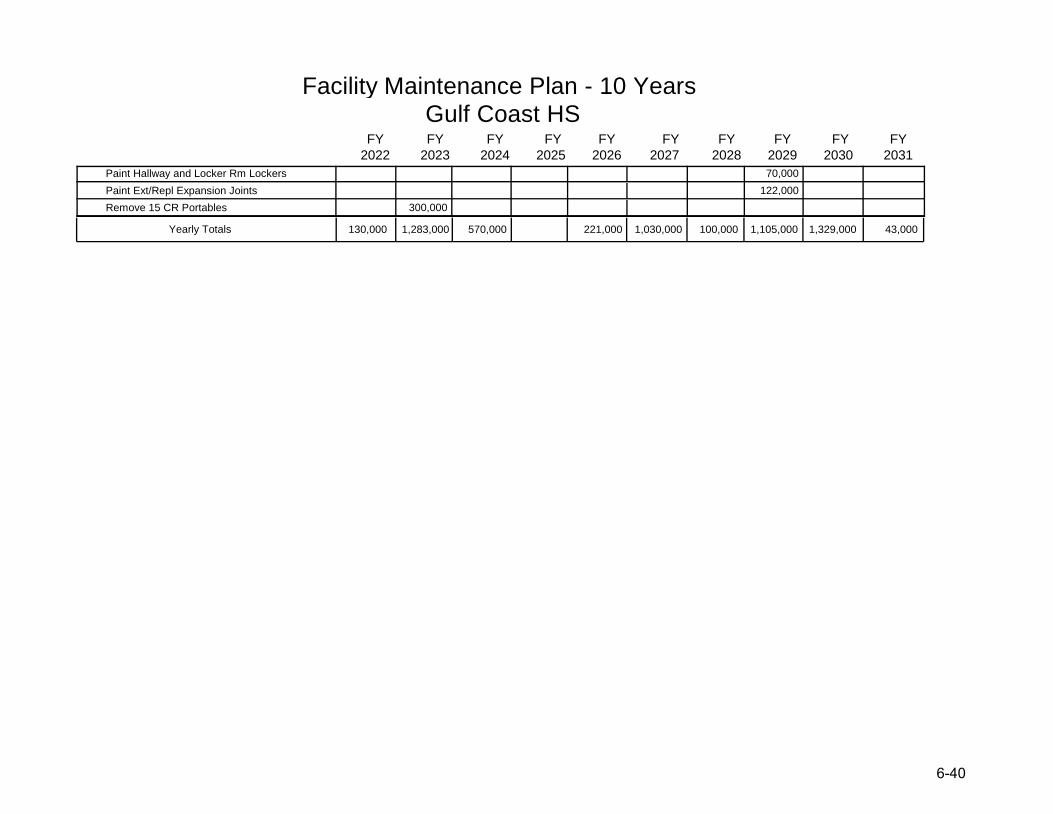
Facility Maintenance Plan - 10 Years Gulf Coast HS
2022 2023 2024 2025 2026
FY FY FY FY FY
2027 2028 2029 2030 2031
FY FY FY FY FY
130,000 1,283,000 570,000 221,000 1,030,000 100,000 1,105,000 1,329,000 43,000Yearly Totals
Paint Hallway and Locker Rm Lockers 70,000
Paint Ext/Repl Expansion Joints 122,000
Remove 15 CR Portables 300,000
6-4040

Facility Maintenance Plan 11 - 20 Years Gulf Coast HS
2032 2033 2034 2035 2036
FY FY FY FY FY
2037 2038 2039 2040 2041
FY FY FY FY FY
122,000 113,000 264,000 1,419,000 3,415,000 2,855,000Yearly Totals
Electrical
Replace FTB Scoreboard 40,000
Replace 300KW Generator 150,000
HVAC
Rebuild Cooling Towers 254,000
Roofing
Design Roof Replacement Project 290,000
Replace Roof 2,500,000 2,500,000
Renovation
Replace Carpet (All Areas) 91,000
Paint Ext/Repl Expansion Joints 149,000
Paint Hallway and Locker Rm Lockers 75,000
Paint Int Ext Doors & Frames 223,000
Repl FB Field Synthetic Turf 915,000
Restripe Track/Apply Structur Spray 122,000
Resurface Indoor Courts (Wood) 38,000
Resurface Tennis/Basketball Courts 52,000
Resurface Track 303,000
Seal/Repair Parking Lot 114,000
Paint Interior 372,000
6-41

THIS PAGE INTENTIONALLY LEFT BLANK
6-42
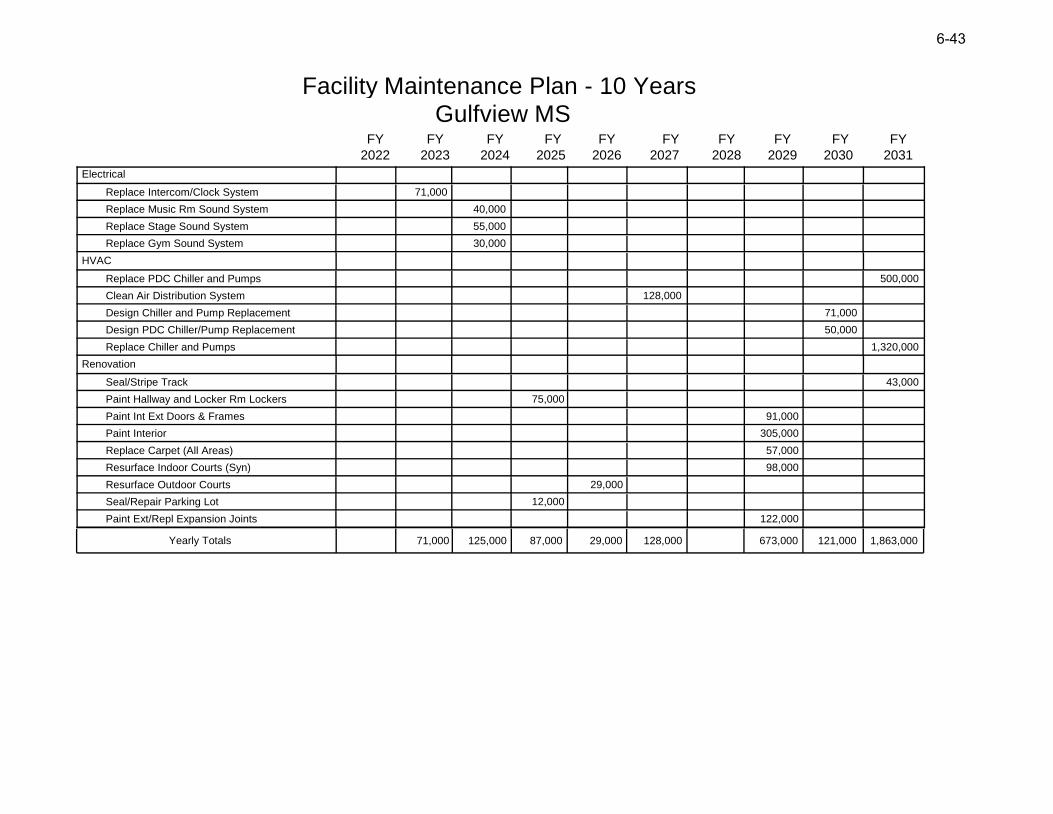
Facility Maintenance Plan - 10 Years Gulfview MS
2022 2023 2024 2025 2026
FY FY FY FY FY
2027 2028 2029 2030 2031
FY FY FY FY FY
71,000 125,000 87,000 29,000 128,000 673,000 121,000 1,863,000Yearly Totals
Electrical
Replace Intercom/Clock System 71,000
Replace Music Rm Sound System 40,000
Replace Stage Sound System 55,000
Replace Gym Sound System 30,000
HVAC
Replace PDC Chiller and Pumps 500,000
Clean Air Distribution System 128,000
Design Chiller and Pump Replacement 71,000
Design PDC Chiller/Pump Replacement 50,000
Replace Chiller and Pumps 1,320,000
Renovation
Seal/Stripe Track 43,000
Paint Hallway and Locker Rm Lockers 75,000
Paint Int Ext Doors & Frames 91,000
Paint Interior 305,000
Replace Carpet (All Areas) 57,000
Resurface Indoor Courts (Syn) 98,000
Resurface Outdoor Courts 29,000
Seal/Repair Parking Lot 12,000
Paint Ext/Repl Expansion Joints 122,000
6-43
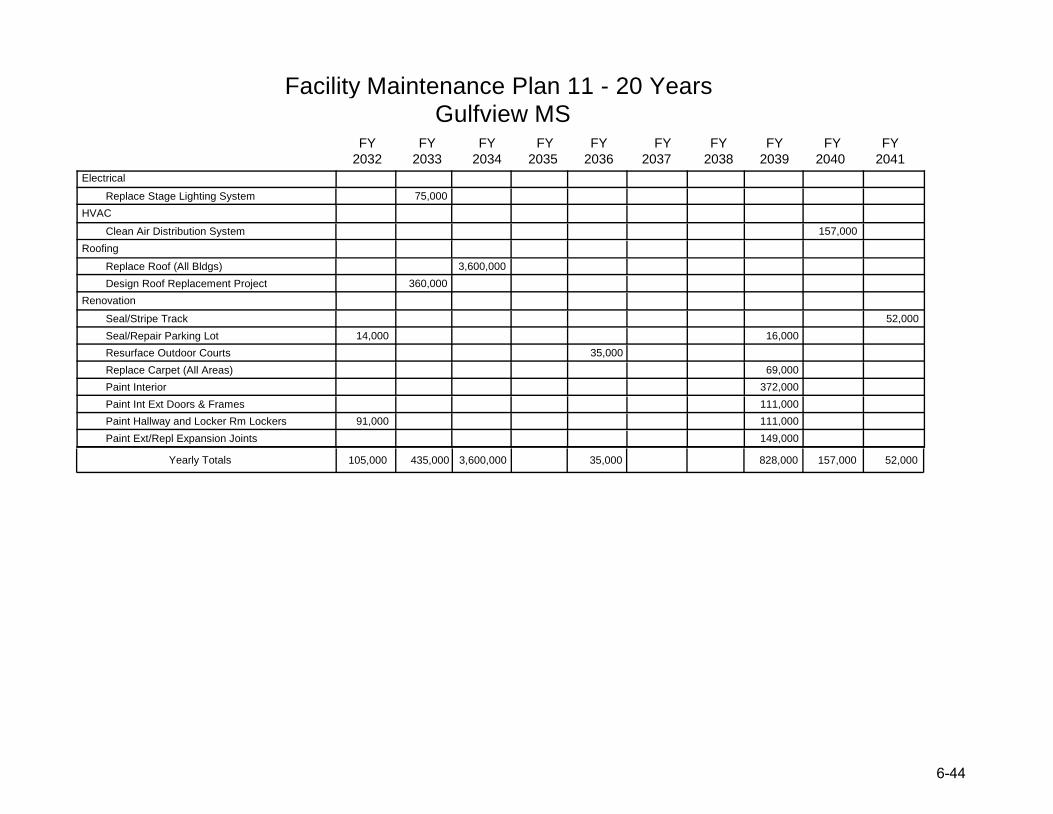
Facility Maintenance Plan 11 - 20 Years Gulfview MS
2032 2033 2034 2035 2036
FY FY FY FY FY
2037 2038 2039 2040 2041
FY FY FY FY FY
105,000 435,000 3,600,000 35,000 828,000 157,000 52,000Yearly Totals
Electrical
Replace Stage Lighting System 75,000
HVAC
Clean Air Distribution System 157,000
Roofing
Replace Roof (All Bldgs) 3,600,000
Design Roof Replacement Project 360,000
Renovation
Seal/Stripe Track 52,000
Seal/Repair Parking Lot 14,000 16,000
Resurface Outdoor Courts 35,000
Replace Carpet (All Areas) 69,000
Paint Interior 372,000
Paint Int Ext Doors & Frames 111,000
Paint Hallway and Locker Rm Lockers 91,000 111,000
Paint Ext/Repl Expansion Joints 149,000
6-4444
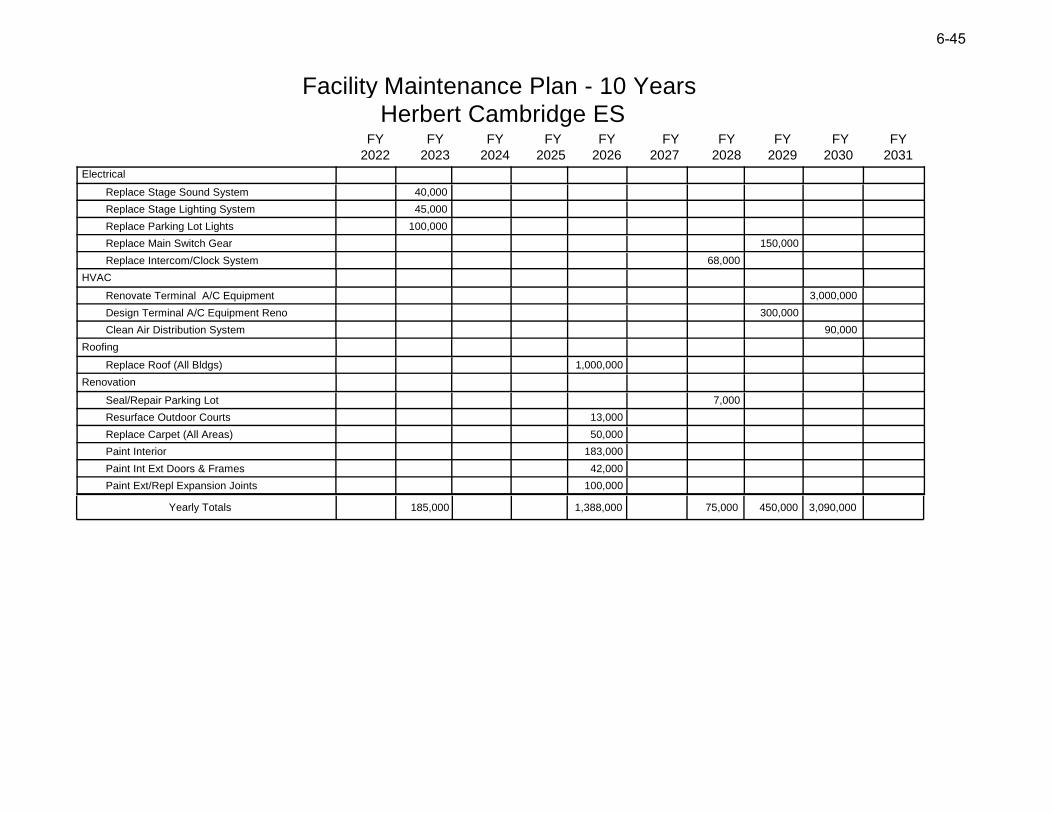
Facility Maintenance Plan - 10 Years Herbert Cambridge ES
2022 2023 2024 2025 2026
FY FY FY FY FY
2027 2028 2029 2030 2031
FY FY FY FY FY
185,000 1,388,000 75,000 450,000 3,090,000Yearly Totals
Electrical
Replace Stage Sound System 40,000
Replace Stage Lighting System 45,000
Replace Parking Lot Lights 100,000
Replace Main Switch Gear 150,000
Replace Intercom/Clock System 68,000
HVAC
Renovate Terminal A/C Equipment 3,000,000
Design Terminal A/C Equipment Reno 300,000
Clean Air Distribution System 90,000
Roofing
Replace Roof (All Bldgs) 1,000,000
Renovation
Seal/Repair Parking Lot 7,000
Resurface Outdoor Courts 13,000
Replace Carpet (All Areas) 50,000
Paint Interior 183,000
Paint Int Ext Doors & Frames 42,000
Paint Ext/Repl Expansion Joints 100,000
6-4545
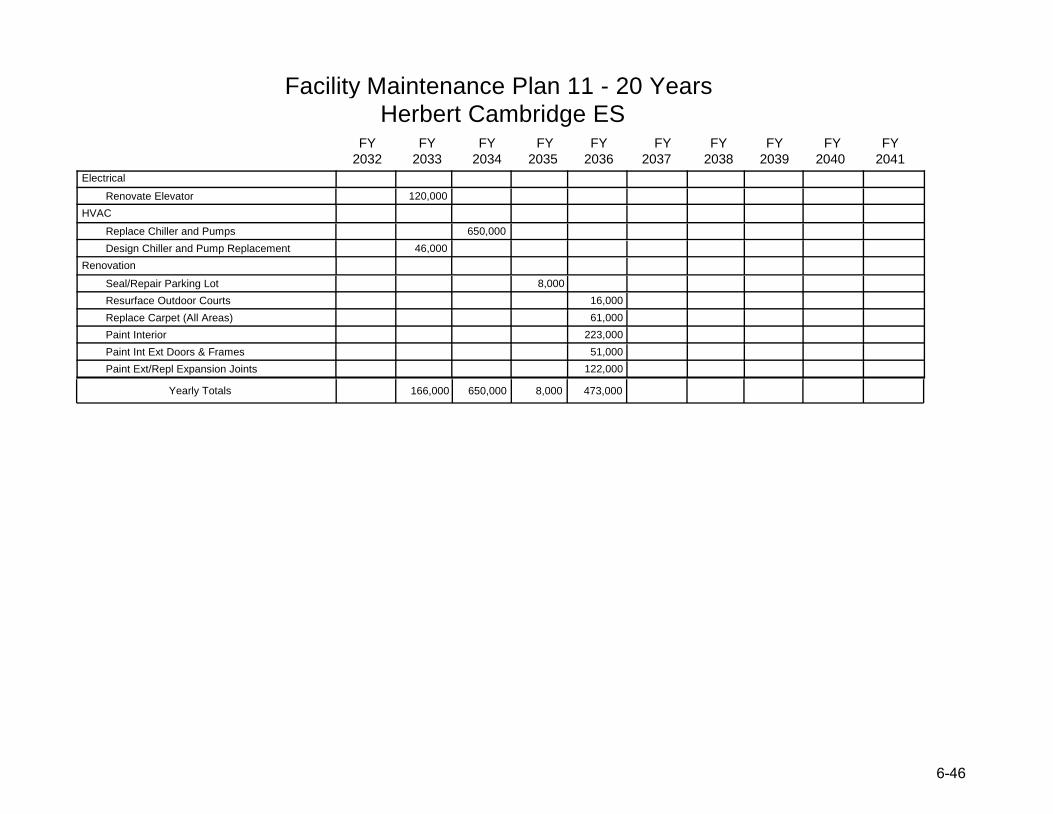
Facility Maintenance Plan 11 - 20 Years Herbert Cambridge ES
2032 2033 2034 2035 2036
FY FY FY FY FY
2037 2038 2039 2040 2041
FY FY FY FY FY
166,000 650,000 8,000 473,000Yearly Totals
Electrical
Renovate Elevator 120,000
HVAC
Replace Chiller and Pumps 650,000
Design Chiller and Pump Replacement 46,000
Renovation
Seal/Repair Parking Lot 8,000
Resurface Outdoor Courts 16,000
Replace Carpet (All Areas) 61,000
Paint Interior 223,000
Paint Int Ext Doors & Frames 51,000
Paint Ext/Repl Expansion Joints 122,000
6-4646
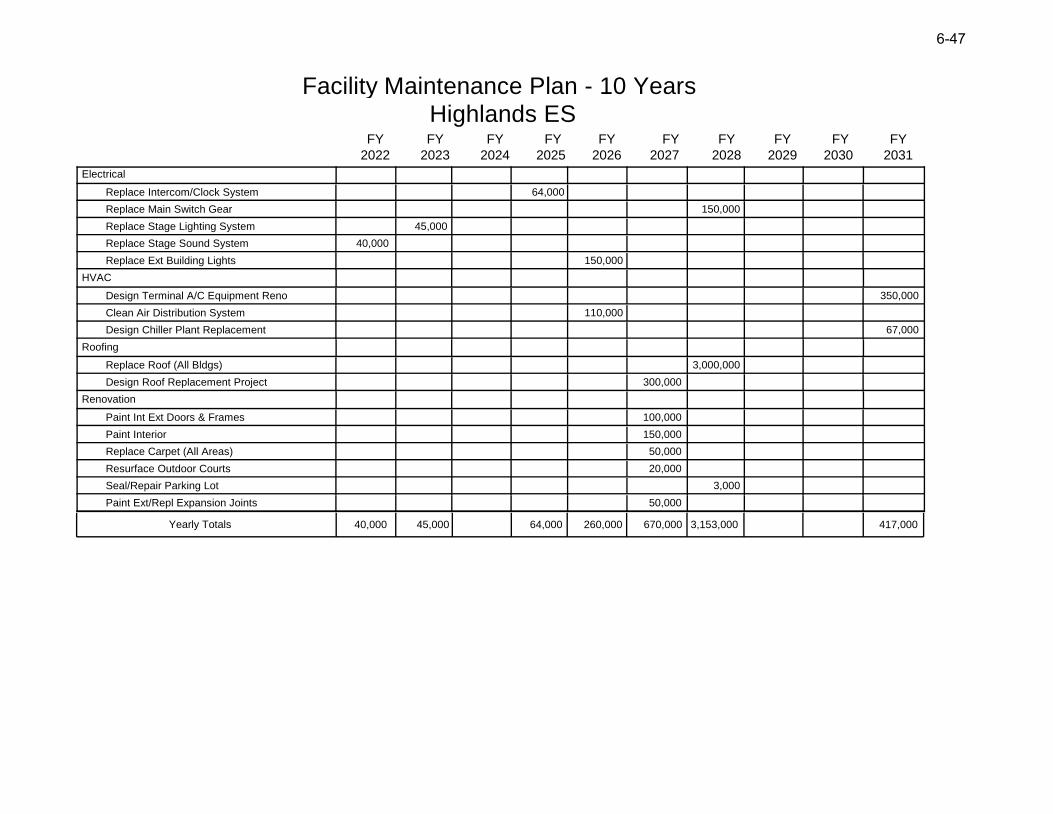
Facility Maintenance Plan - 10 Years Highlands ES
2022 2023 2024 2025 2026
FY FY FY FY FY
2027 2028 2029 2030 2031
FY FY FY FY FY
40,000 45,000 64,000 260,000 670,000 3,153,000 417,000Yearly Totals
Electrical
Replace Intercom/Clock System 64,000
Replace Main Switch Gear 150,000
Replace Stage Lighting System 45,000
Replace Stage Sound System 40,000
Replace Ext Building Lights 150,000
HVAC
Design Terminal A/C Equipment Reno 350,000
Clean Air Distribution System 110,000
Design Chiller Plant Replacement 67,000
Roofing
Replace Roof (All Bldgs) 3,000,000
Design Roof Replacement Project 300,000
Renovation
Paint Int Ext Doors & Frames 100,000
Paint Interior 150,000
Replace Carpet (All Areas) 50,000
Resurface Outdoor Courts 20,000
Seal/Repair Parking Lot 3,000
Paint Ext/Repl Expansion Joints 50,000
6-47
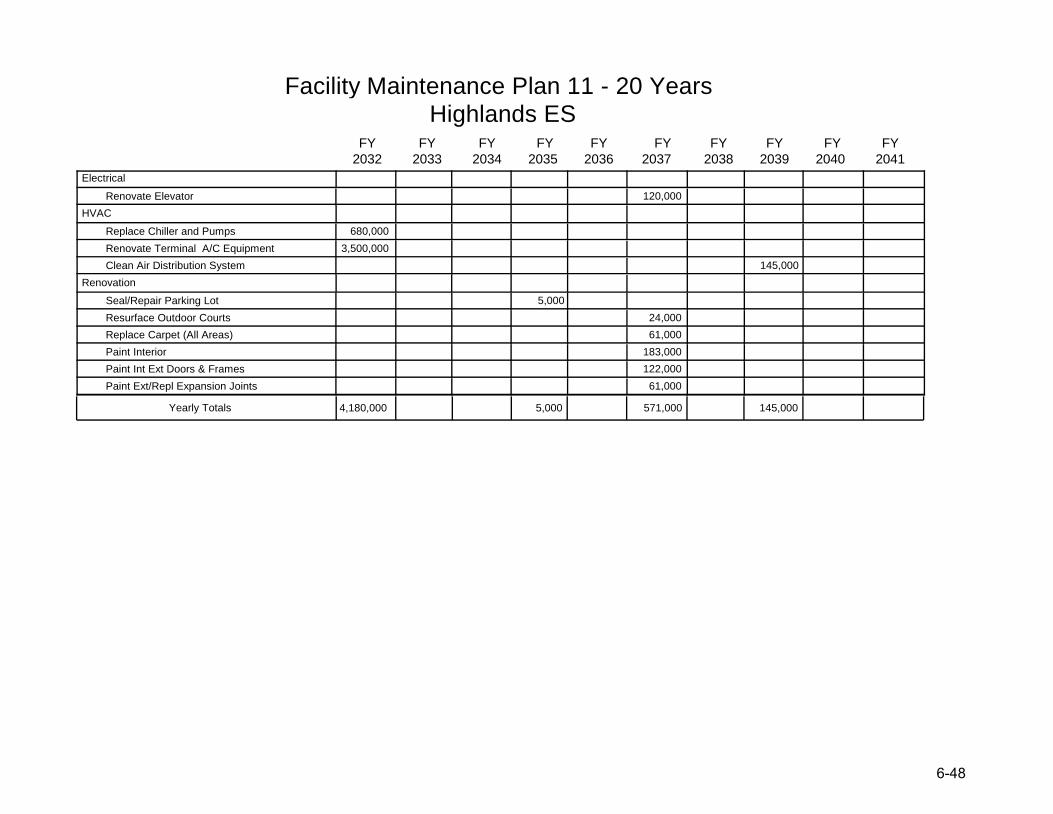
Facility Maintenance Plan 11 - 20 Years Highlands ES
2032 2033 2034 2035 2036
FY FY FY FY FY
2037 2038 2039 2040 2041
FY FY FY FY FY
4,180,000 5,000 571,000 145,000Yearly Totals
Electrical
Renovate Elevator 120,000
HVAC
Replace Chiller and Pumps 680,000
Renovate Terminal A/C Equipment 3,500,000
Clean Air Distribution System 145,000
Renovation
Seal/Repair Parking Lot 5,000
Resurface Outdoor Courts 24,000
Replace Carpet (All Areas) 61,000
Paint Interior 183,000
Paint Int Ext Doors & Frames 122,000
Paint Ext/Repl Expansion Joints 61,000
6-4848
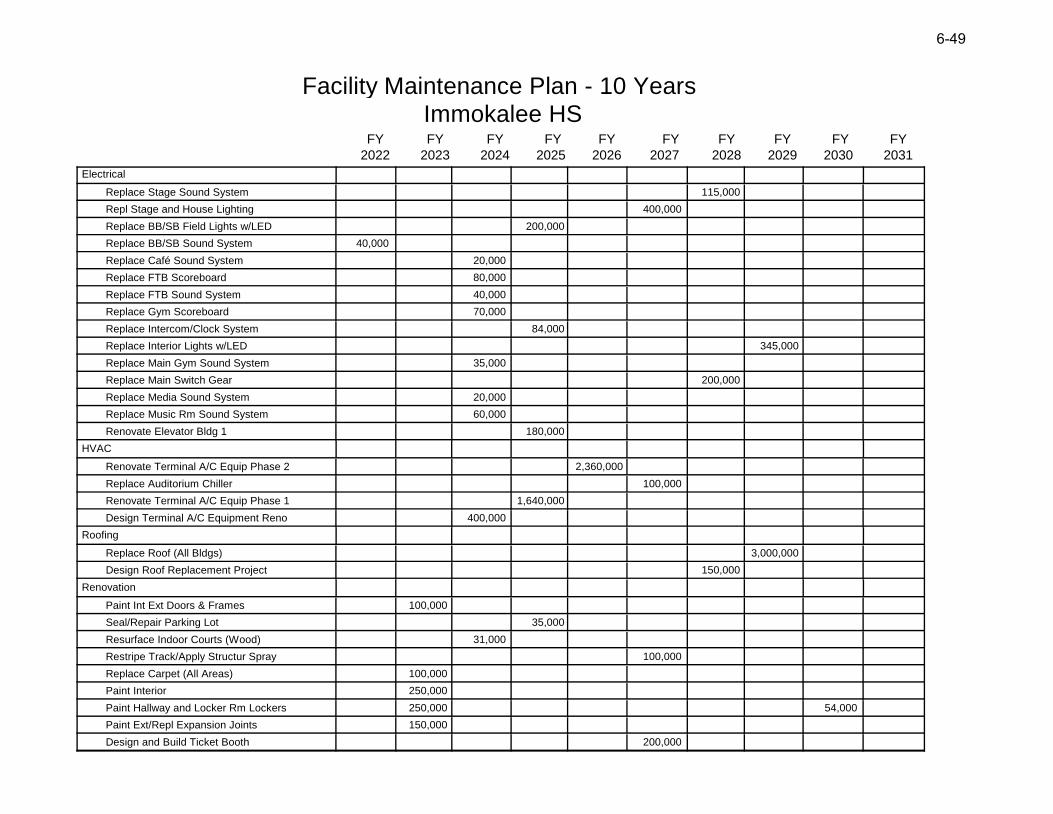
Facility Maintenance Plan - 10 Years Immokalee HS
2022 2023 2024 2025 2026
FY FY FY FY FY
2027 2028 2029 2030 2031
FY FY FY FY FY
Electrical
Replace Stage Sound System 115,000
Repl Stage and House Lighting 400,000
Replace BB/SB Field Lights w/LED 200,000
Replace BB/SB Sound System 40,000
Replace Café Sound System 20,000
Replace FTB Scoreboard 80,000
Replace FTB Sound System 40,000
Replace Gym Scoreboard 70,000
Replace Intercom/Clock System 84,000
Replace Interior Lights w/LED 345,000
Replace Main Gym Sound System 35,000
Replace Main Switch Gear 200,000
Replace Media Sound System 20,000
Replace Music Rm Sound System 60,000
Renovate Elevator Bldg 1 180,000
HVAC
Renovate Terminal A/C Equip Phase 2 2,360,000
Replace Auditorium Chiller 100,000
Renovate Terminal A/C Equip Phase 1 1,640,000
Design Terminal A/C Equipment Reno 400,000
Roofing
Replace Roof (All Bldgs) 3,000,000
Design Roof Replacement Project 150,000
Renovation
Paint Int Ext Doors & Frames 100,000
Seal/Repair Parking Lot 35,000
Resurface Indoor Courts (Wood) 31,000
Restripe Track/Apply Structur Spray 100,000
Replace Carpet (All Areas) 100,000
Paint Interior 250,000
Paint Hallway and Locker Rm Lockers 250,000 54,000
Paint Ext/Repl Expansion Joints 150,000
Design and Build Ticket Booth 200,000
6-4949
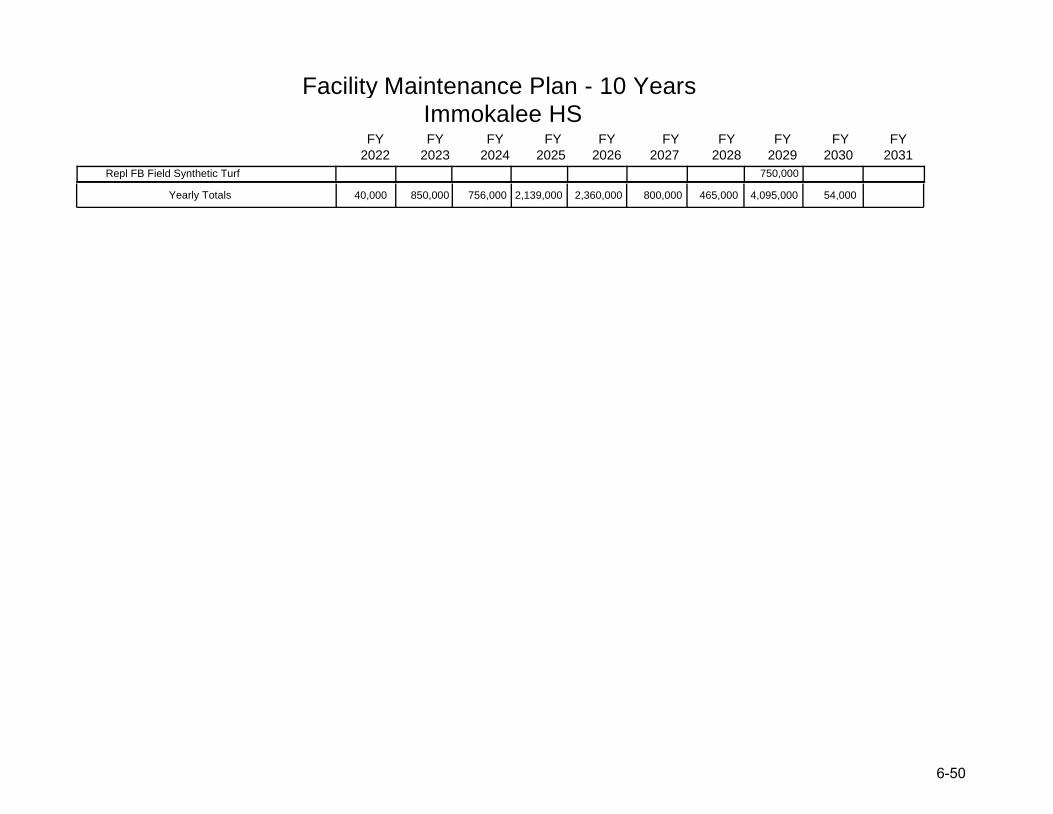
Facility Maintenance Plan - 10 Years Immokalee HS
2022 2023 2024 2025 2026
FY FY FY FY FY
2027 2028 2029 2030 2031
FY FY FY FY FY
40,000 850,000 756,000 2,139,000 2,360,000 800,000 465,000 4,095,000 54,000Yearly Totals
Repl FB Field Synthetic Turf 750,000
6-5050
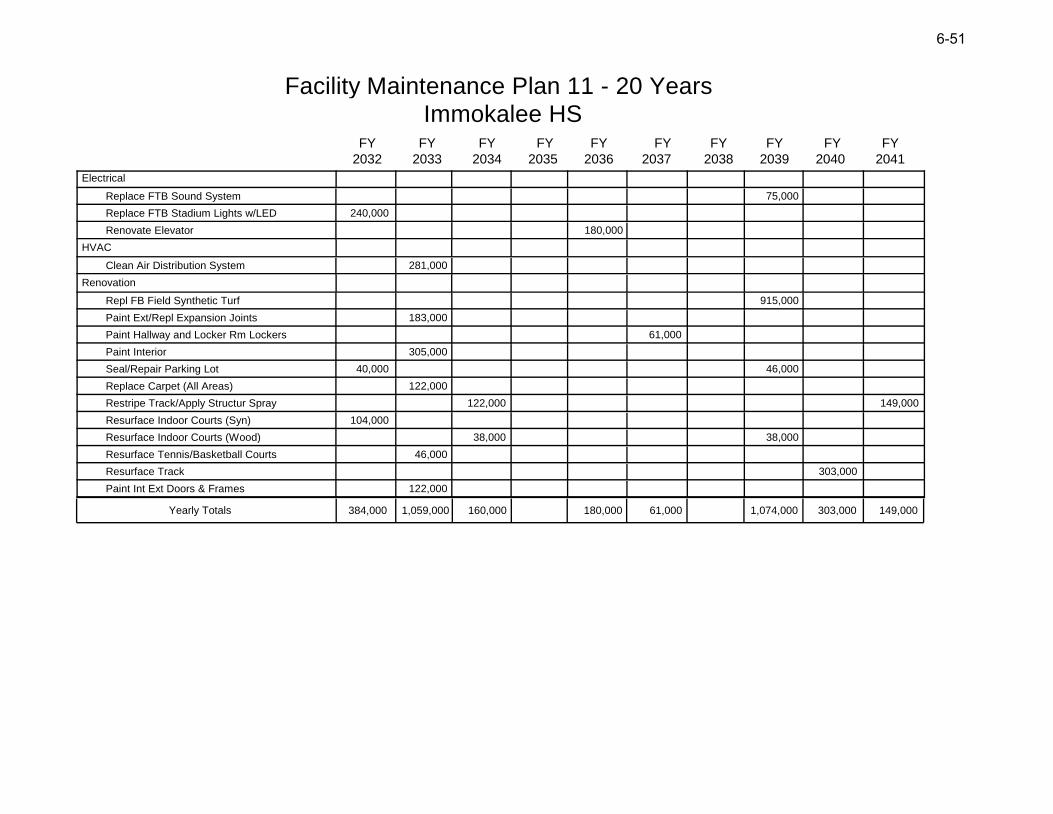
Facility Maintenance Plan 11 - 20 Years Immokalee HS
2032 2033 2034 2035 2036
FY FY FY FY FY
2037 2038 2039 2040 2041
FY FY FY FY FY
384,000 1,059,000 160,000 180,000 61,000 1,074,000 303,000 149,000Yearly Totals
Electrical
Replace FTB Sound System 75,000
Replace FTB Stadium Lights w/LED 240,000
Renovate Elevator 180,000
HVAC
Clean Air Distribution System 281,000
Renovation
Repl FB Field Synthetic Turf 915,000
Paint Ext/Repl Expansion Joints 183,000
Paint Hallway and Locker Rm Lockers 61,000
Paint Interior 305,000
Seal/Repair Parking Lot 40,000 46,000
Replace Carpet (All Areas) 122,000
Restripe Track/Apply Structur Spray 122,000 149,000
Resurface Indoor Courts (Syn) 104,000
Resurface Indoor Courts (Wood) 38,000 38,000
Resurface Tennis/Basketball Courts 46,000
Resurface Track 303,000
Paint Int Ext Doors & Frames 122,000
6-51

THIS PAGE INTENTIONALLY LEFT BLANK
6-52
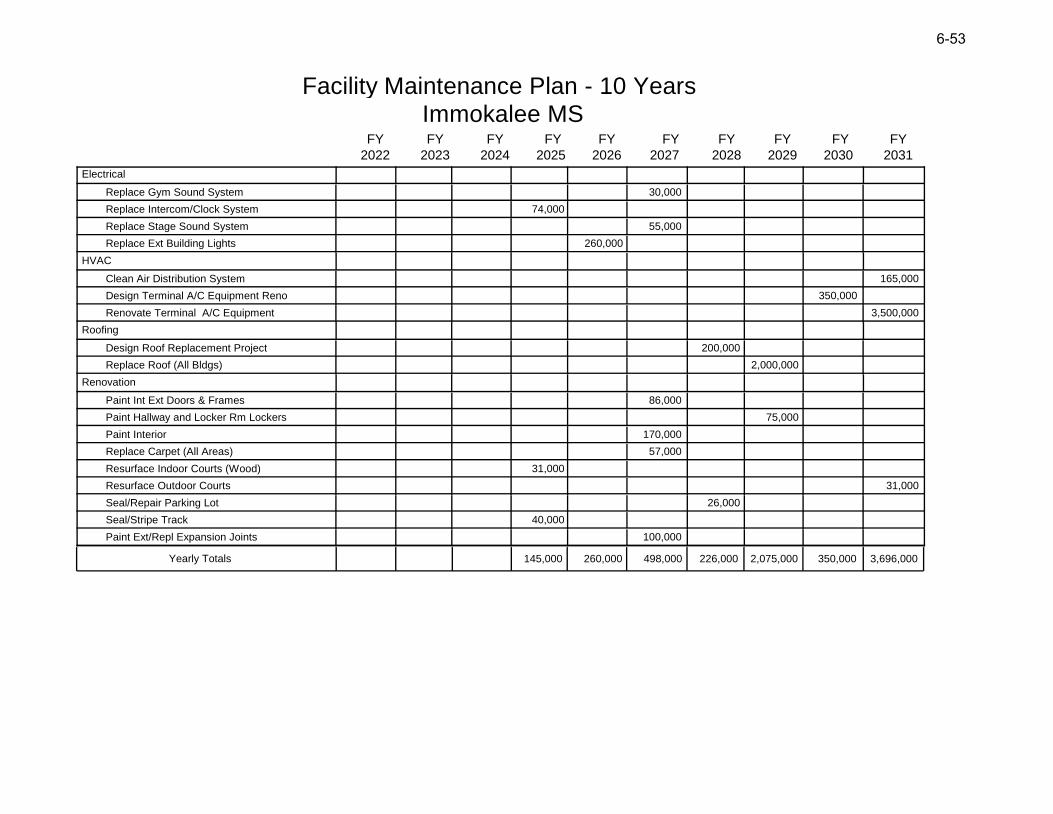
Facility Maintenance Plan - 10 Years Immokalee MS
2022 2023 2024 2025 2026
FY FY FY FY FY
2027 2028 2029 2030 2031
FY FY FY FY FY
145,000 260,000 498,000 226,000 2,075,000 350,000 3,696,000Yearly Totals
Electrical
Replace Gym Sound System 30,000
Replace Intercom/Clock System 74,000
Replace Stage Sound System 55,000
Replace Ext Building Lights 260,000
HVAC
Clean Air Distribution System 165,000
Design Terminal A/C Equipment Reno 350,000
Renovate Terminal A/C Equipment 3,500,000
Roofing
Design Roof Replacement Project 200,000
Replace Roof (All Bldgs) 2,000,000
Renovation
Paint Int Ext Doors & Frames 86,000
Paint Hallway and Locker Rm Lockers 75,000
Paint Interior 170,000
Replace Carpet (All Areas) 57,000
Resurface Indoor Courts (Wood) 31,000
Resurface Outdoor Courts 31,000
Seal/Repair Parking Lot 26,000
Seal/Stripe Track 40,000
Paint Ext/Repl Expansion Joints 100,000
6-53

Facility Maintenance Plan 11 - 20 Years Immokalee MS
2032 2033 2034 2035 2036
FY FY FY FY FY
2037 2038 2039 2040 2041
FY FY FY FY FY
116,000 85,000 503,000 38,000Yearly Totals
Renovation
Seal/Stripe Track 49,000
Seal/Repair Parking Lot 29,000
Resurface Outdoor Courts 38,000
Resurface Indoor Courts (Wood) 38,000
Replace Carpet (All Areas) 69,000
Paint Interior 207,000
Paint Int Ext Doors & Frames 105,000
Paint Hallway and Locker Rm Lockers 85,000
Paint Ext/Repl Expansion Joints 122,000
6-544
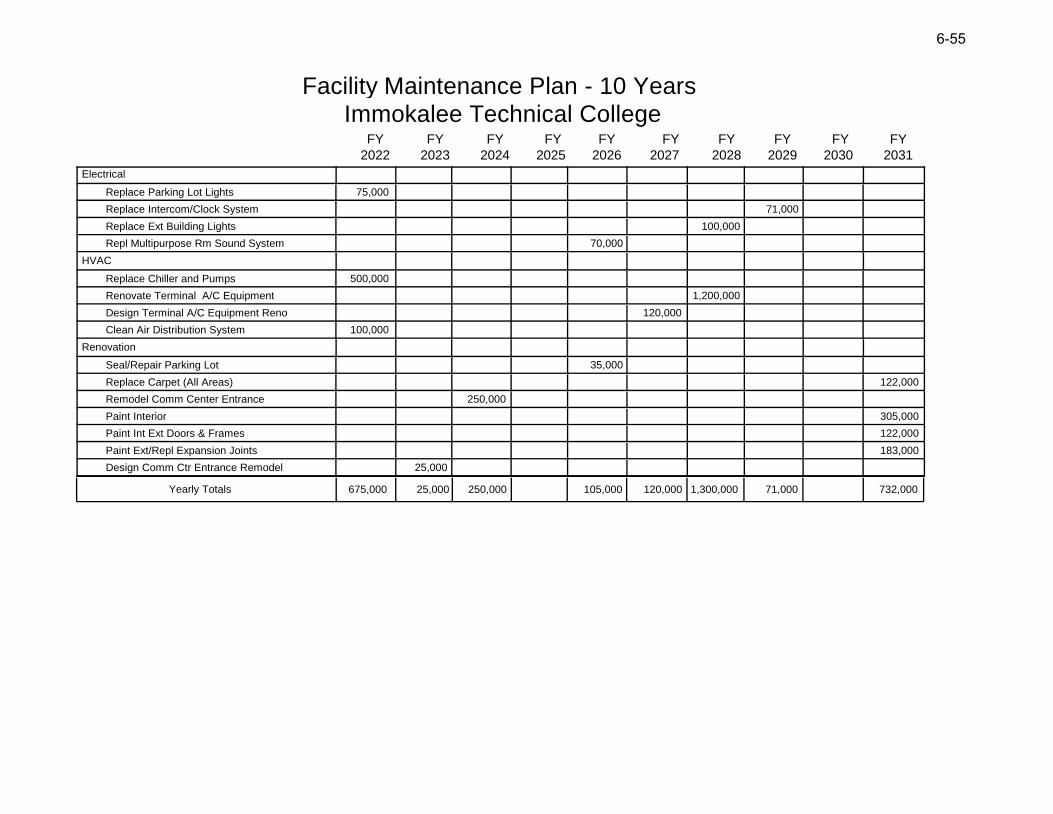
Facility Maintenance Plan - 10 Years Immokalee Technical College
2022 2023 2024 2025 2026
FY FY FY FY FY
2027 2028 2029 2030 2031
FY FY FY FY FY
675,000 25,000 250,000 105,000 120,000 1,300,000 71,000 732,000Yearly Totals
Electrical
Replace Parking Lot Lights 75,000
Replace Intercom/Clock System 71,000
Replace Ext Building Lights 100,000
Repl Multipurpose Rm Sound System 70,000
HVAC
Replace Chiller and Pumps 500,000
Renovate Terminal A/C Equipment 1,200,000
Design Terminal A/C Equipment Reno 120,000
Clean Air Distribution System 100,000
Renovation
Seal/Repair Parking Lot 35,000
Replace Carpet (All Areas) 122,000
Remodel Comm Center Entrance 250,000
Paint Interior 305,000
Paint Int Ext Doors & Frames 122,000
Paint Ext/Repl Expansion Joints 183,000
Design Comm Ctr Entrance Remodel 25,000
6-555
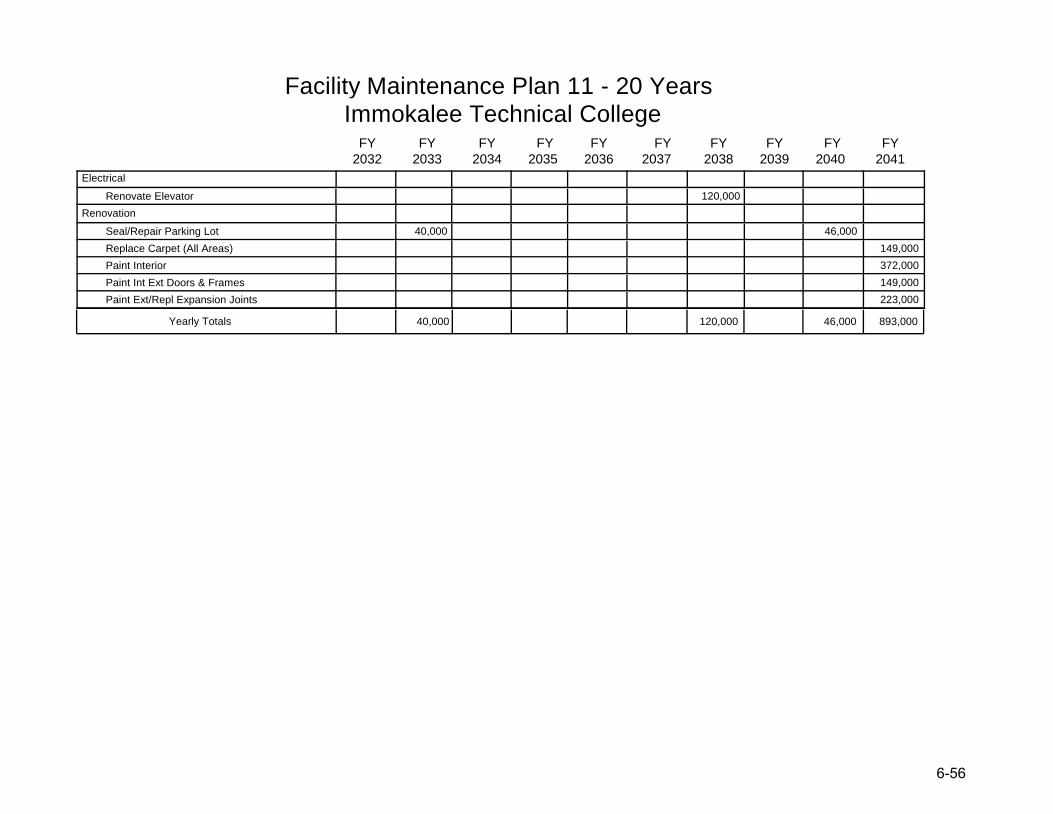
Facility Maintenance Plan 11 - 20 Years Immokalee Technical College
2032 2033 2034 2035 2036
FY FY FY FY FY
2037 2038 2039 2040 2041
FY FY FY FY FY
40,000 120,000 46,000 893,000Yearly Totals
Electrical
Renovate Elevator 120,000
Renovation
Seal/Repair Parking Lot 40,000 46,000
Replace Carpet (All Areas) 149,000
Paint Interior 372,000
Paint Int Ext Doors & Frames 149,000
Paint Ext/Repl Expansion Joints 223,000
6-5656
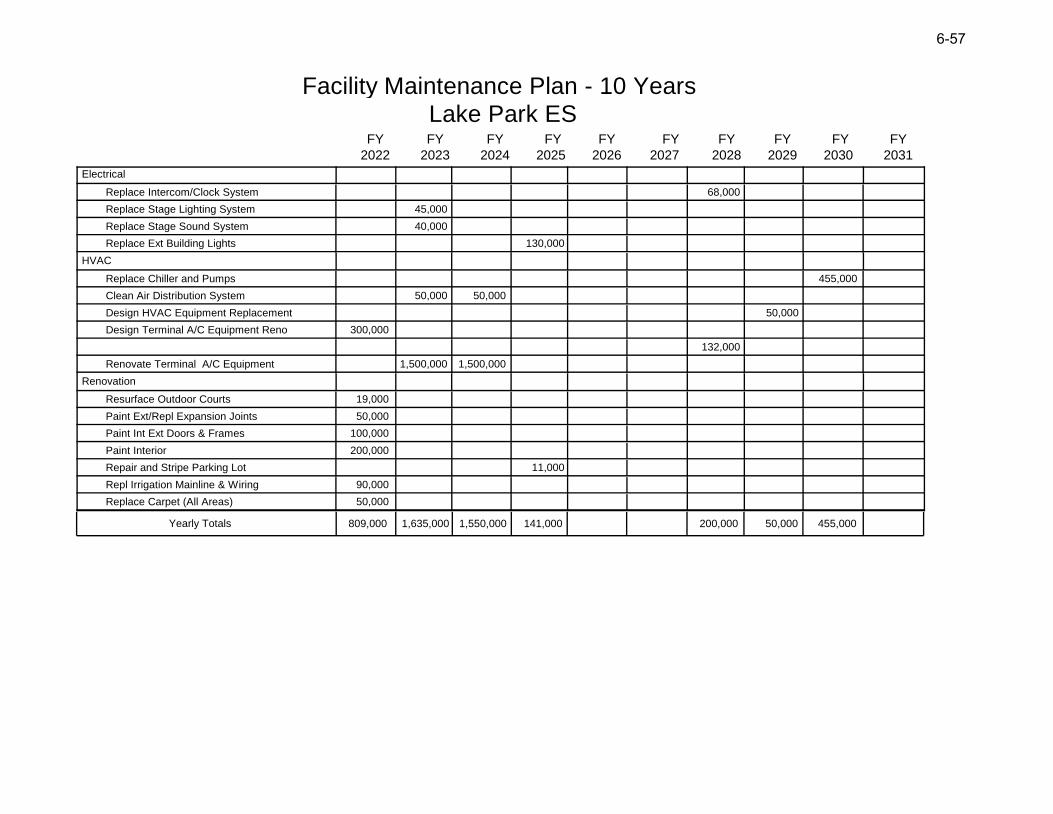
Facility Maintenance Plan - 10 Years Lake Park ES
2022 2023 2024 2025 2026
FY FY FY FY FY
2027 2028 2029 2030 2031
FY FY FY FY FY
809,000 1,635,000 1,550,000 141,000 200,000 50,000 455,000Yearly Totals
Electrical
Replace Intercom/Clock System 68,000
Replace Stage Lighting System 45,000
Replace Stage Sound System 40,000
Replace Ext Building Lights 130,000
HVAC
Replace Chiller and Pumps 455,000
Clean Air Distribution System 50,000 50,000
Design HVAC Equipment Replacement 50,000
Design Terminal A/C Equipment Reno 300,000
132,000
Renovate Terminal A/C Equipment 1,500,000 1,500,000
Renovation
Resurface Outdoor Courts 19,000
Paint Ext/Repl Expansion Joints 50,000
Paint Int Ext Doors & Frames 100,000
Paint Interior 200,000
Repair and Stripe Parking Lot 11,000
Repl Irrigation Mainline & Wiring 90,000
Replace Carpet (All Areas) 50,000
6-57
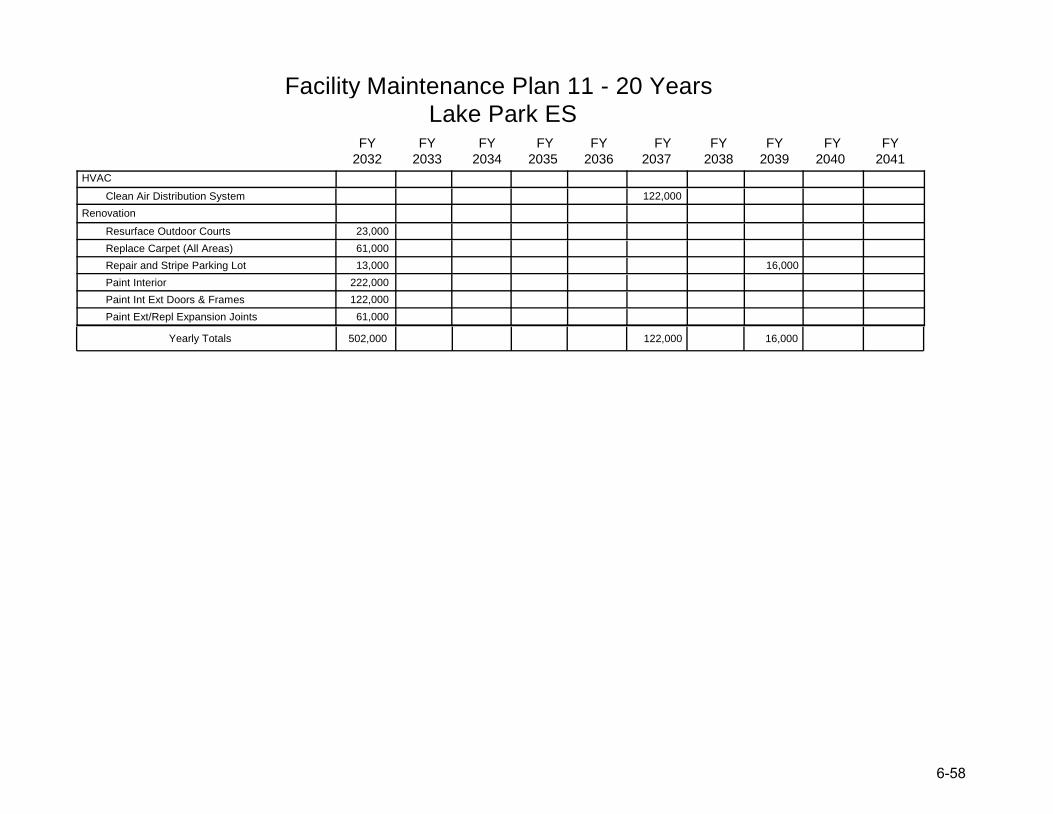
Facility Maintenance Plan 11 - 20 Years Lake Park ES
2032 2033 2034 2035 2036
FY FY FY FY FY
2037 2038 2039 2040 2041
FY FY FY FY FY
502,000 122,000 16,000Yearly Totals
HVAC
Clean Air Distribution System 122,000
Renovation
Resurface Outdoor Courts 23,000
Replace Carpet (All Areas) 61,000
Repair and Stripe Parking Lot 13,000 16,000
Paint Interior 222,000
Paint Int Ext Doors & Frames 122,000
Paint Ext/Repl Expansion Joints 61,000
6-5858
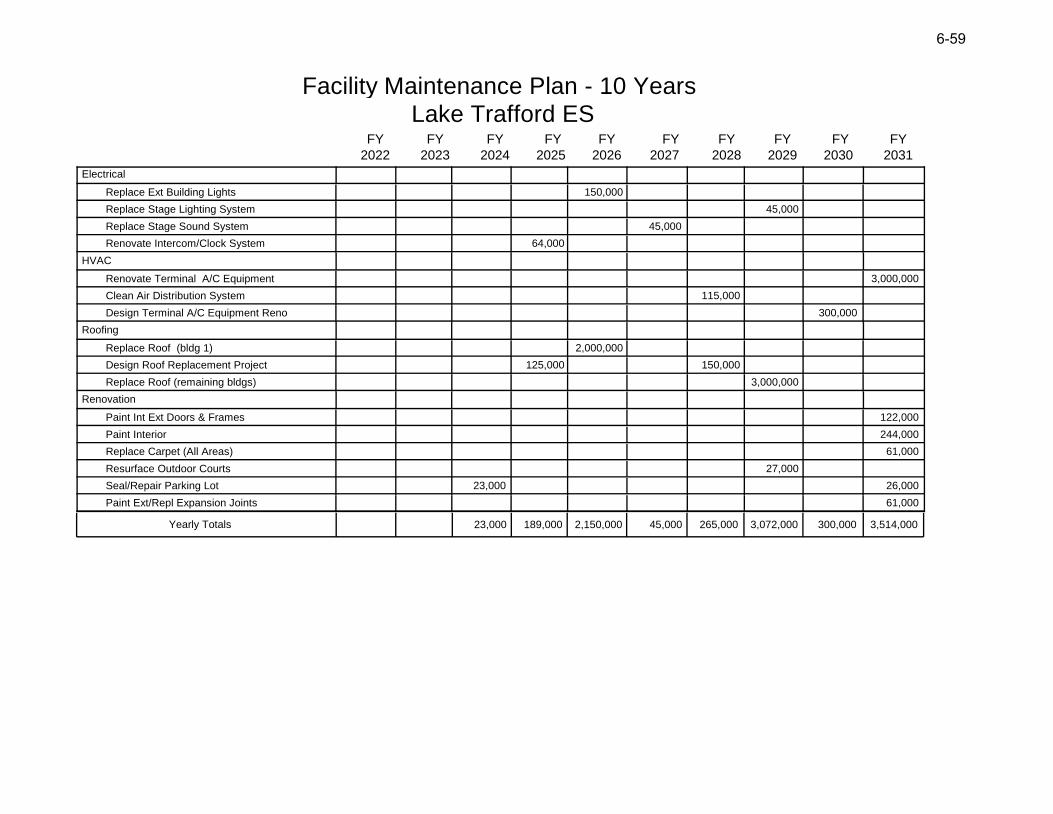
Facility Maintenance Plan - 10 Years Lake Trafford ES
2022 2023 2024 2025 2026
FY FY FY FY FY
2027 2028 2029 2030 2031
FY FY FY FY FY
23,000 189,000 2,150,000 45,000 265,000 3,072,000 300,000 3,514,000Yearly Totals
Electrical
Replace Ext Building Lights 150,000
Replace Stage Lighting System 45,000
Replace Stage Sound System 45,000
Renovate Intercom/Clock System 64,000
HVAC
Renovate Terminal A/C Equipment 3,000,000
Clean Air Distribution System 115,000
Design Terminal A/C Equipment Reno 300,000
Roofing
Replace Roof (bldg 1) 2,000,000
Design Roof Replacement Project 125,000 150,000
Replace Roof (remaining bldgs) 3,000,000
Renovation
Paint Int Ext Doors & Frames 122,000
Paint Interior 244,000
Replace Carpet (All Areas) 61,000
Resurface Outdoor Courts 27,000
Seal/Repair Parking Lot 23,000 26,000
Paint Ext/Repl Expansion Joints 61,000
6-5959

Facility Maintenance Plan 11 - 20 Years Lake Trafford ES
2032 2033 2034 2035 2036
FY FY FY FY FY
2037 2038 2039 2040 2041
FY FY FY FY FY
56,000 780,000 32,000 33,000 733,000Yearly Totals
HVAC
Replace Chiller and Pumps 780,000
Design Chiller and Pump Replacement 56,000
Clean Air Distribution System 138,000
Renovation
Seal/Repair Parking Lot 32,000
Resurface Outdoor Courts 33,000
Replace Carpet (All Areas) 74,000
Paint Interior 298,000
Paint Int Ext Doors & Frames 149,000
Paint Ext/Repl Expansion Joints 74,000
6-6060
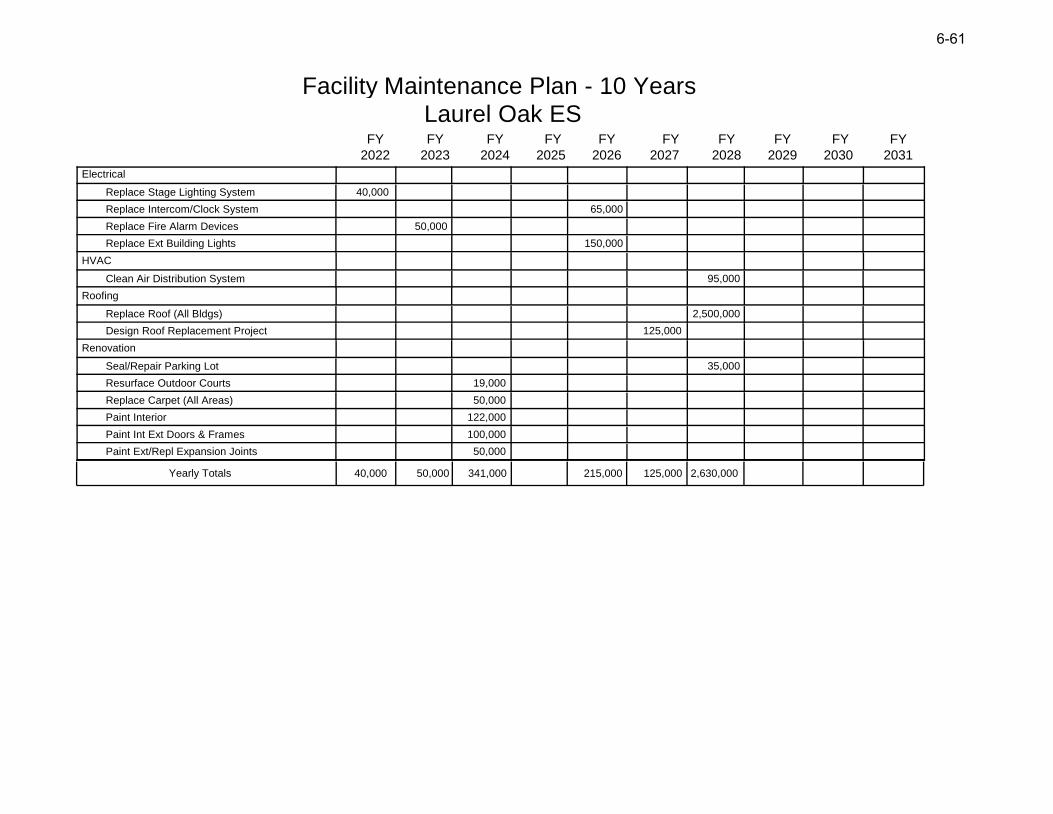
Facility Maintenance Plan - 10 Years Laurel Oak ES
2022 2023 2024 2025 2026
FY FY FY FY FY
2027 2028 2029 2030 2031
FY FY FY FY FY
40,000 50,000 341,000 215,000 125,000 2,630,000Yearly Totals
Electrical
Replace Stage Lighting System 40,000
Replace Intercom/Clock System 65,000
Replace Fire Alarm Devices 50,000
Replace Ext Building Lights 150,000
HVAC
Clean Air Distribution System 95,000
Roofing
Replace Roof (All Bldgs) 2,500,000
Design Roof Replacement Project 125,000
Renovation
Seal/Repair Parking Lot 35,000
Resurface Outdoor Courts 19,000
Replace Carpet (All Areas) 50,000
Paint Interior 122,000
Paint Int Ext Doors & Frames 100,000
Paint Ext/Repl Expansion Joints 50,000
6-61
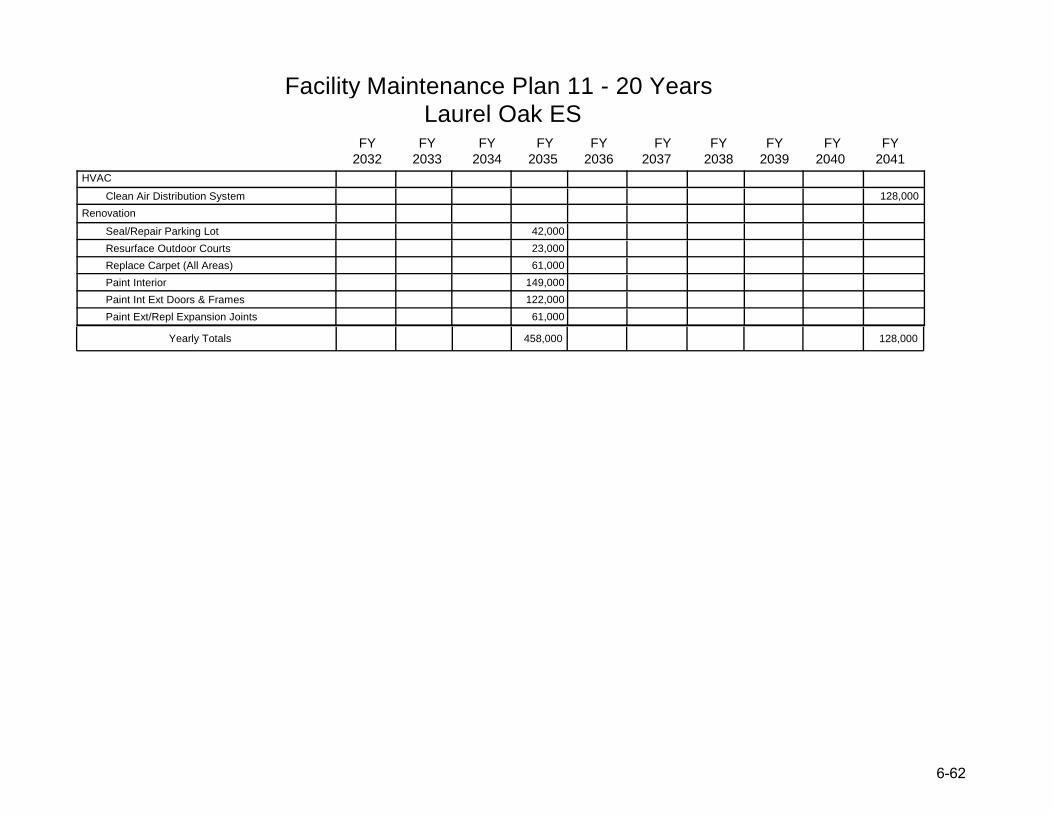
Facility Maintenance Plan 11 - 20 Years Laurel Oak ES
2032 2033 2034 2035 2036
FY FY FY FY FY
2037 2038 2039 2040 2041
FY FY FY FY FY
458,000 128,000Yearly Totals
HVAC
Clean Air Distribution System 128,000
Renovation
Seal/Repair Parking Lot 42,000
Resurface Outdoor Courts 23,000
Replace Carpet (All Areas) 61,000
Paint Interior 149,000
Paint Int Ext Doors & Frames 122,000
Paint Ext/Repl Expansion Joints 61,000
6-62
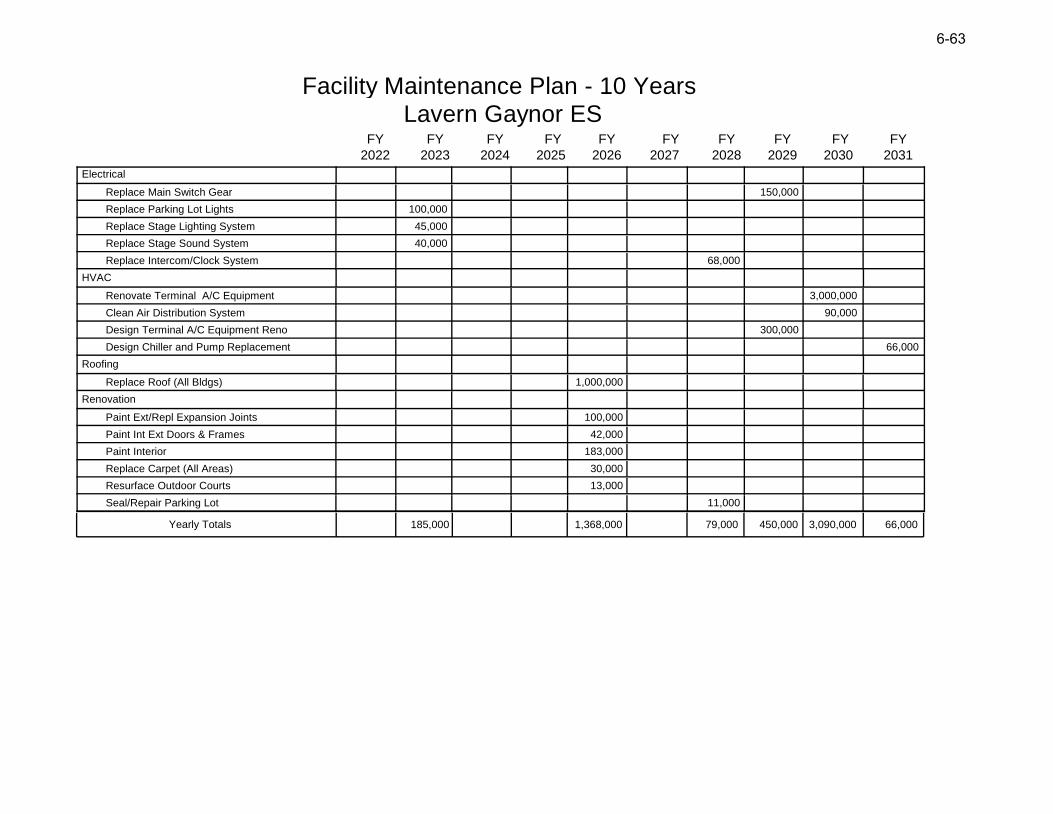
Facility Maintenance Plan - 10 Years Lavern Gaynor ES
2022 2023 2024 2025 2026
FY FY FY FY FY
2027 2028 2029 2030 2031
FY FY FY FY FY
185,000 1,368,000 79,000 450,000 3,090,000 66,000Yearly Totals
Electrical
Replace Main Switch Gear 150,000
Replace Parking Lot Lights 100,000
Replace Stage Lighting System 45,000
Replace Stage Sound System 40,000
Replace Intercom/Clock System 68,000
HVAC
Renovate Terminal A/C Equipment 3,000,000
Clean Air Distribution System 90,000
Design Terminal A/C Equipment Reno 300,000
Design Chiller and Pump Replacement 66,000
Roofing
Replace Roof (All Bldgs) 1,000,000
Renovation
Paint Ext/Repl Expansion Joints 100,000
Paint Int Ext Doors & Frames 42,000
Paint Interior 183,000
Replace Carpet (All Areas) 30,000
Resurface Outdoor Courts 13,000
Seal/Repair Parking Lot 11,000
6-63
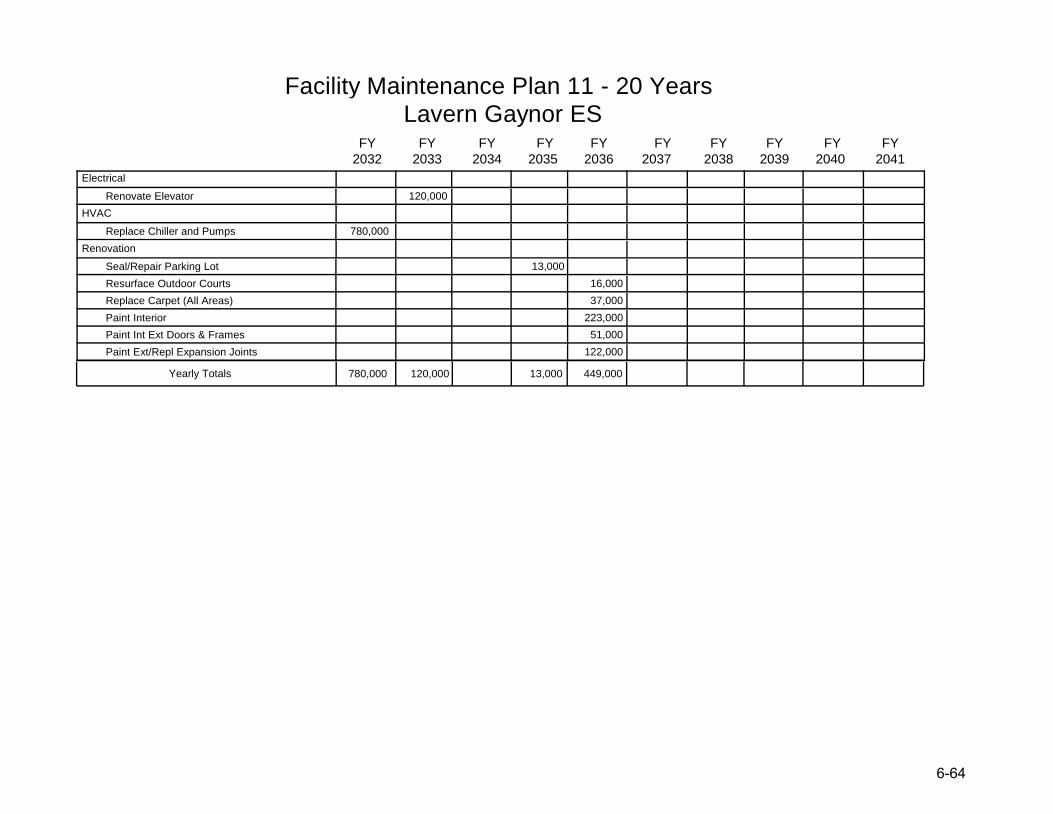
Facility Maintenance Plan 11 - 20 Years Lavern Gaynor ES
2032 2033 2034 2035 2036
FY FY FY FY FY
2037 2038 2039 2040 2041
FY FY FY FY FY
780,000 120,000 13,000 449,000Yearly Totals
Electrical
Renovate Elevator 120,000
HVAC
Replace Chiller and Pumps 780,000
Renovation
Seal/Repair Parking Lot 13,000
Resurface Outdoor Courts 16,000
Replace Carpet (All Areas) 37,000
Paint Interior 223,000
Paint Int Ext Doors & Frames 51,000
Paint Ext/Repl Expansion Joints 122,000
6-6464
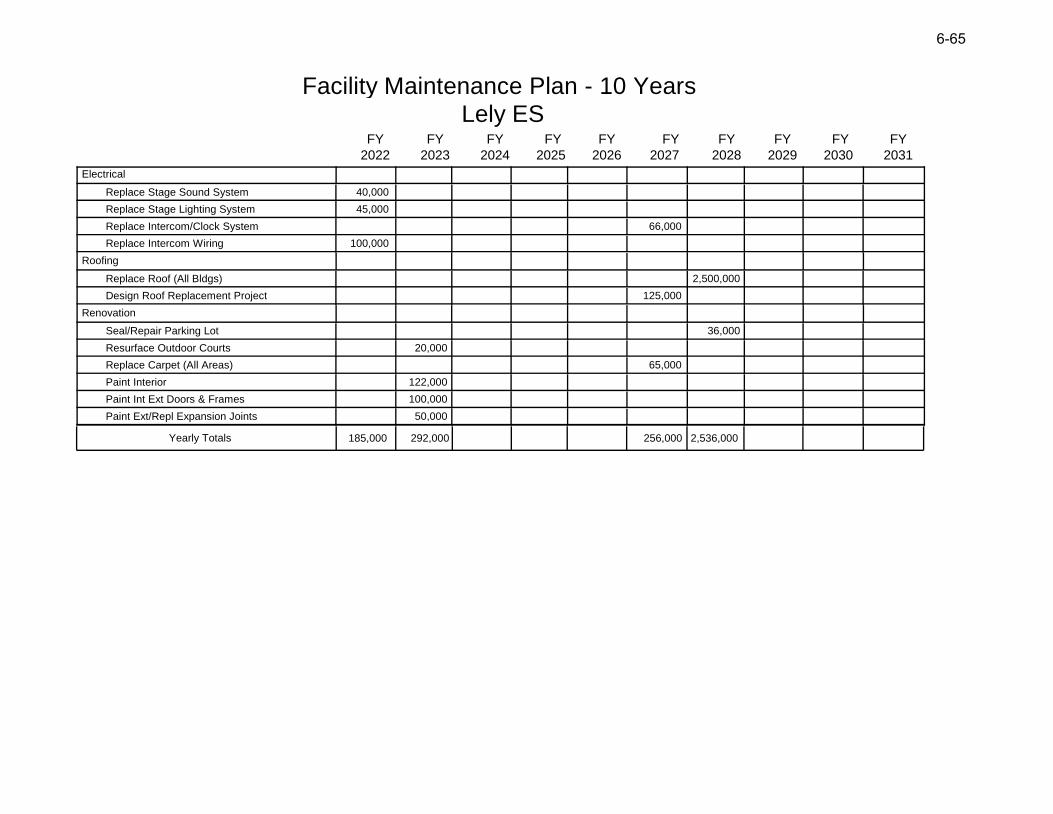
Facility Maintenance Plan - 10 Years Lely ES
2022 2023 2024 2025 2026
FY FY FY FY FY
2027 2028 2029 2030 2031
FY FY FY FY FY
185,000 292,000 256,000 2,536,000Yearly Totals
Electrical
Replace Stage Sound System 40,000
Replace Stage Lighting System 45,000
Replace Intercom/Clock System 66,000
Replace Intercom Wiring 100,000
Roofing
Replace Roof (All Bldgs) 2,500,000
Design Roof Replacement Project 125,000
Renovation
Seal/Repair Parking Lot 36,000
Resurface Outdoor Courts 20,000
Replace Carpet (All Areas) 65,000
Paint Interior 122,000
Paint Int Ext Doors & Frames 100,000
Paint Ext/Repl Expansion Joints 50,000
6-6565
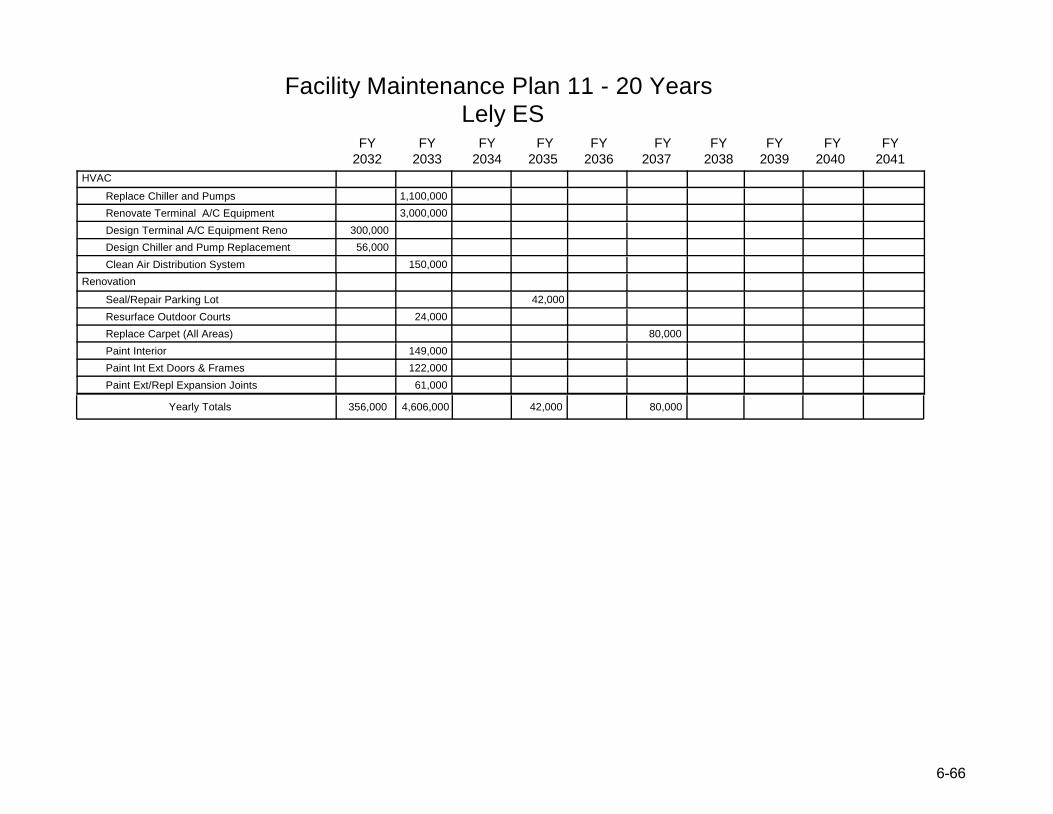
Facility Maintenance Plan 11 - 20 Years Lely ES
2032 2033 2034 2035 2036
FY FY FY FY FY
2037 2038 2039 2040 2041
FY FY FY FY FY
356,000 4,606,000 42,000 80,000Yearly Totals
HVAC
Replace Chiller and Pumps 1,100,000
Renovate Terminal A/C Equipment 3,000,000
Design Terminal A/C Equipment Reno 300,000
Design Chiller and Pump Replacement 56,000
Clean Air Distribution System 150,000
Renovation
Seal/Repair Parking Lot 42,000
Resurface Outdoor Courts 24,000
Replace Carpet (All Areas) 80,000
Paint Interior 149,000
Paint Int Ext Doors & Frames 122,000
Paint Ext/Repl Expansion Joints 61,000
6-6666
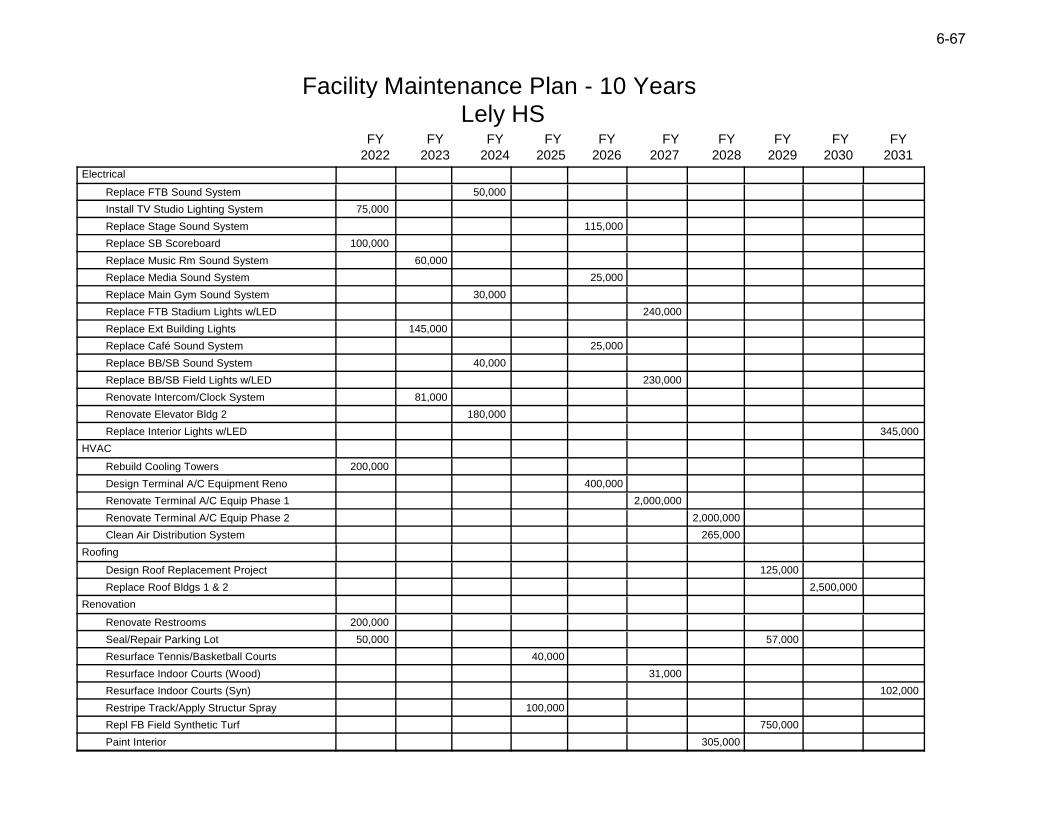
Facility Maintenance Plan - 10 Years Lely HS
2022 2023 2024 2025 2026
FY FY FY FY FY
2027 2028 2029 2030 2031
FY FY FY FY FY
Electrical
Replace FTB Sound System 50,000
Install TV Studio Lighting System 75,000
Replace Stage Sound System 115,000
Replace SB Scoreboard 100,000
Replace Music Rm Sound System 60,000
Replace Media Sound System 25,000
Replace Main Gym Sound System 30,000
Replace FTB Stadium Lights w/LED 240,000
Replace Ext Building Lights 145,000
Replace Café Sound System 25,000
Replace BB/SB Sound System 40,000
Replace BB/SB Field Lights w/LED 230,000
Renovate Intercom/Clock System 81,000
Renovate Elevator Bldg 2 180,000
Replace Interior Lights w/LED 345,000
HVAC
Rebuild Cooling Towers 200,000
Design Terminal A/C Equipment Reno 400,000
Renovate Terminal A/C Equip Phase 1 2,000,000
Renovate Terminal A/C Equip Phase 2 2,000,000
Clean Air Distribution System 265,000
Roofing
Design Roof Replacement Project 125,000
Replace Roof Bldgs 1 & 2 2,500,000
Renovation
Renovate Restrooms 200,000
Seal/Repair Parking Lot 50,000 57,000
Resurface Tennis/Basketball Courts 40,000
Resurface Indoor Courts (Wood) 31,000
Resurface Indoor Courts (Syn) 102,000
Restripe Track/Apply Structur Spray 100,000
Repl FB Field Synthetic Turf 750,000
Paint Interior 305,000
6-67
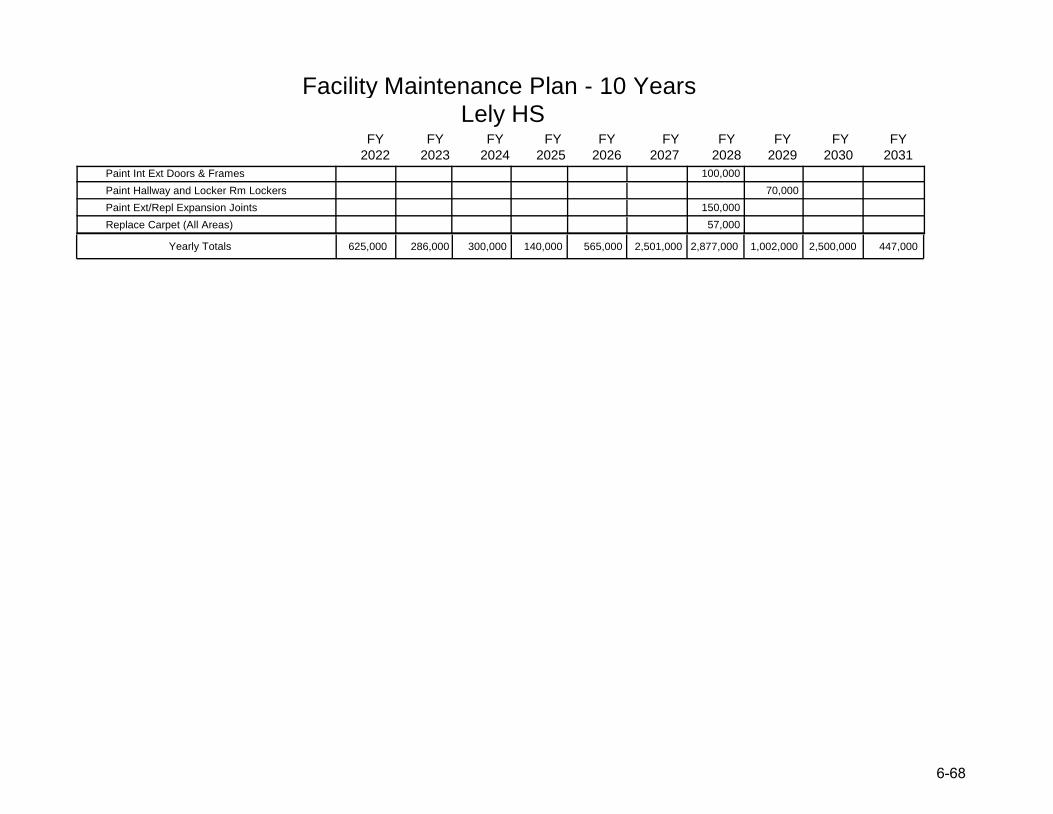
Facility Maintenance Plan - 10 Years Lely HS
2022 2023 2024 2025 2026
FY FY FY FY FY
2027 2028 2029 2030 2031
FY FY FY FY FY
625,000 286,000 300,000 140,000 565,000 2,501,000 2,877,000 1,002,000 2,500,000 447,000Yearly Totals
Paint Int Ext Doors & Frames 100,000
Paint Hallway and Locker Rm Lockers 70,000
Paint Ext/Repl Expansion Joints 150,000
Replace Carpet (All Areas) 57,000
6-6868
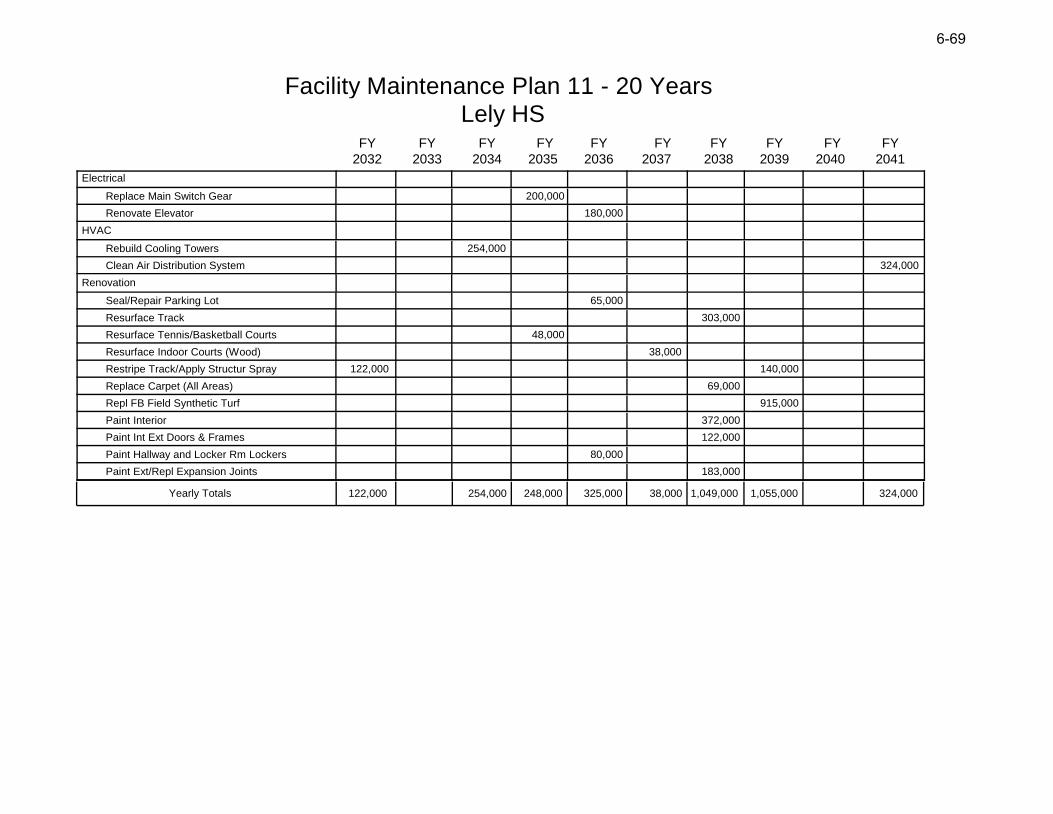
Facility Maintenance Plan 11 - 20 Years Lely HS
2032 2033 2034 2035 2036
FY FY FY FY FY
2037 2038 2039 2040 2041
FY FY FY FY FY
122,000 254,000 248,000 325,000 38,000 1,049,000 1,055,000 324,000Yearly Totals
Electrical
Replace Main Switch Gear 200,000
Renovate Elevator 180,000
HVAC
Rebuild Cooling Towers 254,000
Clean Air Distribution System 324,000
Renovation
Seal/Repair Parking Lot 65,000
Resurface Track 303,000
Resurface Tennis/Basketball Courts 48,000
Resurface Indoor Courts (Wood) 38,000
Restripe Track/Apply Structur Spray 122,000 140,000
Replace Carpet (All Areas) 69,000
Repl FB Field Synthetic Turf 915,000
Paint Interior 372,000
Paint Int Ext Doors & Frames 122,000
Paint Hallway and Locker Rm Lockers 80,000
Paint Ext/Repl Expansion Joints 183,000
6-6969
THIS PAGE INTENTIONALLY LEFT BLANK
6-700
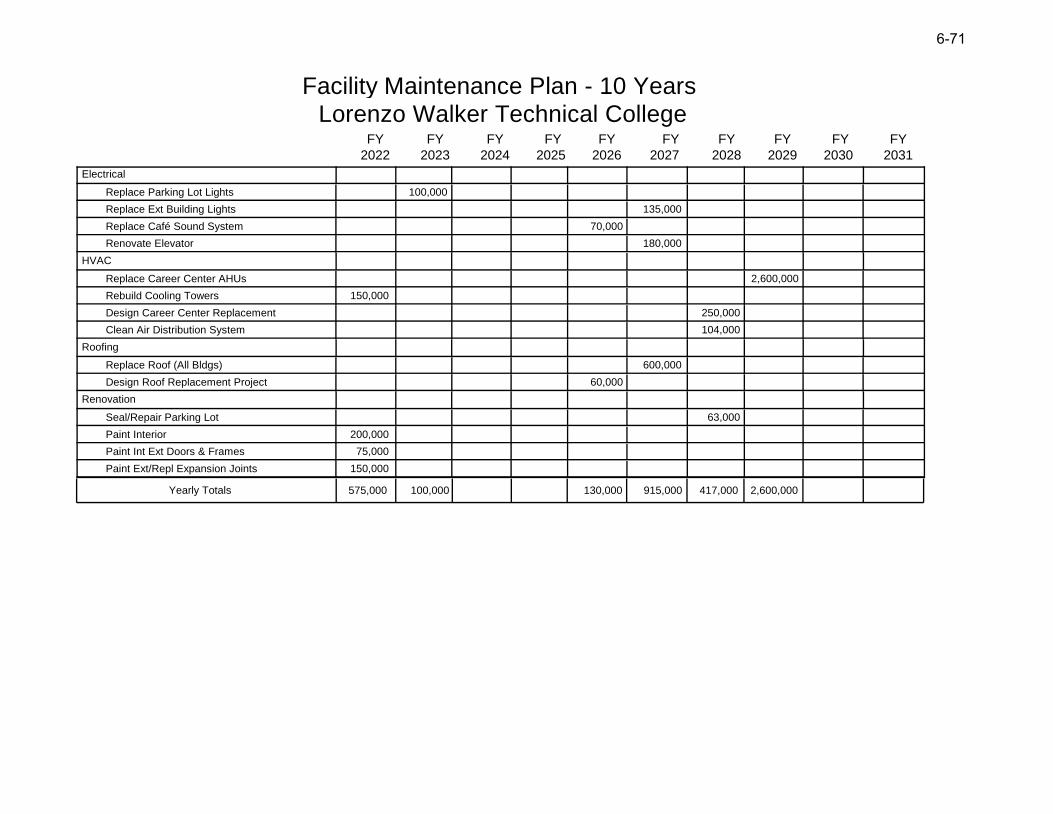
Facility Maintenance Plan - 10 Years Lorenzo Walker Technical College
2022 2023 2024 2025 2026
FY FY FY FY FY
2027 2028 2029 2030 2031
FY FY FY FY FY
575,000 100,000 130,000 915,000 417,000 2,600,000Yearly Totals
Electrical
Replace Parking Lot Lights 100,000
Replace Ext Building Lights 135,000
Replace Café Sound System 70,000
Renovate Elevator 180,000
HVAC
Replace Career Center AHUs 2,600,000
Rebuild Cooling Towers 150,000
Design Career Center Replacement 250,000
Clean Air Distribution System 104,000
Roofing
Replace Roof (All Bldgs) 600,000
Design Roof Replacement Project 60,000
Renovation
Seal/Repair Parking Lot 63,000
Paint Interior 200,000
Paint Int Ext Doors & Frames 75,000
Paint Ext/Repl Expansion Joints 150,000
6-71
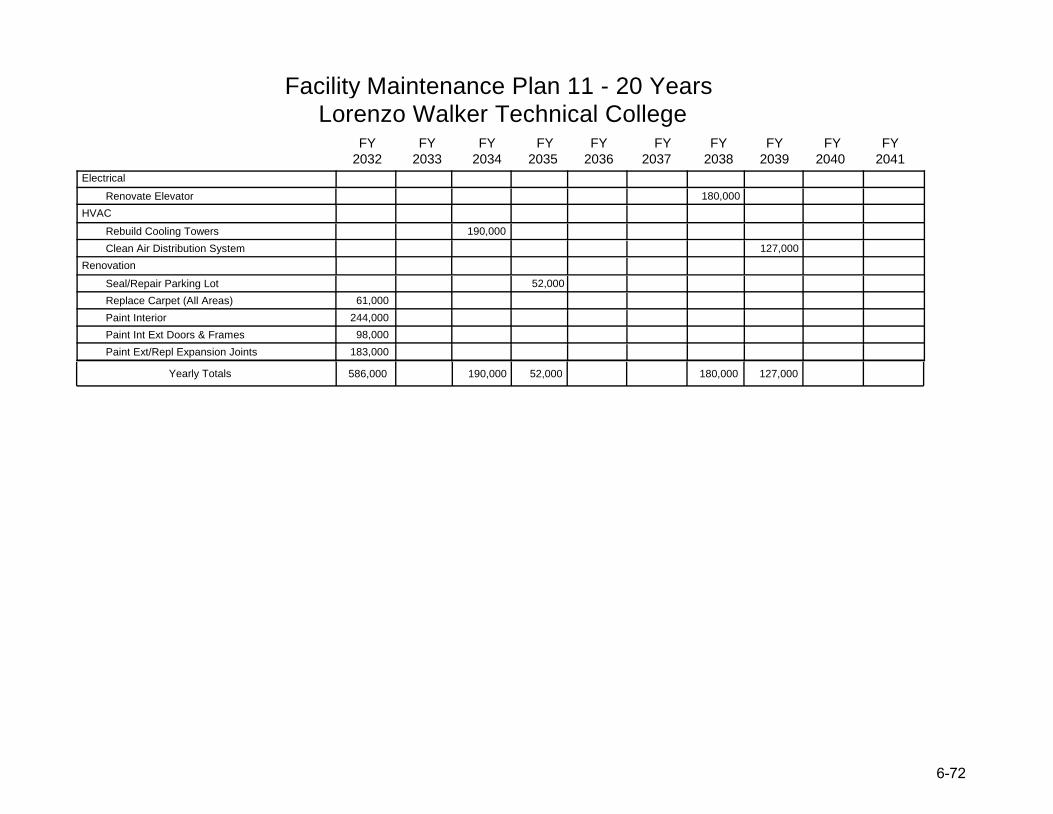
Facility Maintenance Plan 11 - 20 Years Lorenzo Walker Technical College
2032 2033 2034 2035 2036
FY FY FY FY FY
2037 2038 2039 2040 2041
FY FY FY FY FY
586,000 190,000 52,000 180,000 127,000Yearly Totals
Electrical
Renovate Elevator 180,000
HVAC
Rebuild Cooling Towers 190,000
Clean Air Distribution System 127,000
Renovation
Seal/Repair Parking Lot 52,000
Replace Carpet (All Areas) 61,000
Paint Interior 244,000
Paint Int Ext Doors & Frames 98,000
Paint Ext/Repl Expansion Joints 183,000
6-72
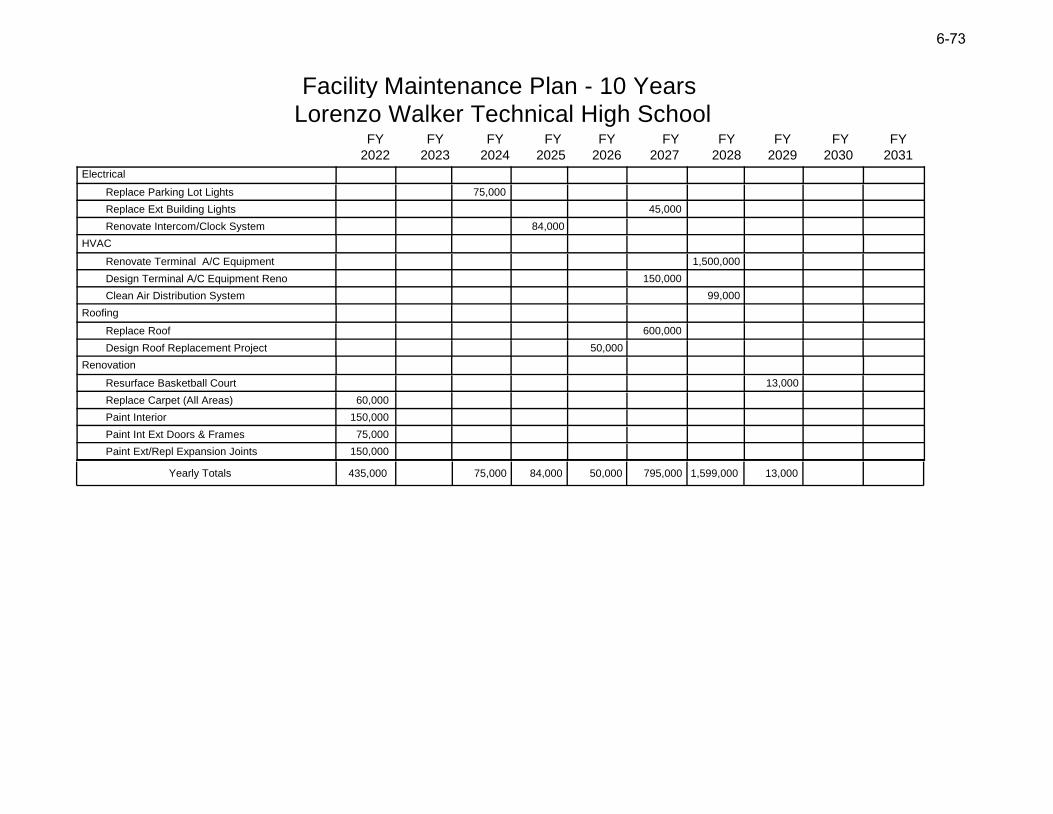
Facility Maintenance Plan - 10 Years Lorenzo Walker Technical High School
2022 2023 2024 2025 2026
FY FY FY FY FY
2027 2028 2029 2030 2031
FY FY FY FY FY
435,000 75,000 84,000 50,000 795,000 1,599,000 13,000Yearly Totals
Electrical
Replace Parking Lot Lights 75,000
Replace Ext Building Lights 45,000
Renovate Intercom/Clock System 84,000
HVAC
Renovate Terminal A/C Equipment 1,500,000
Design Terminal A/C Equipment Reno 150,000
Clean Air Distribution System 99,000
Roofing
Replace Roof 600,000
Design Roof Replacement Project 50,000
Renovation
Resurface Basketball Court 13,000
Replace Carpet (All Areas) 60,000
Paint Interior 150,000
Paint Int Ext Doors & Frames 75,000
Paint Ext/Repl Expansion Joints 150,000
6-73
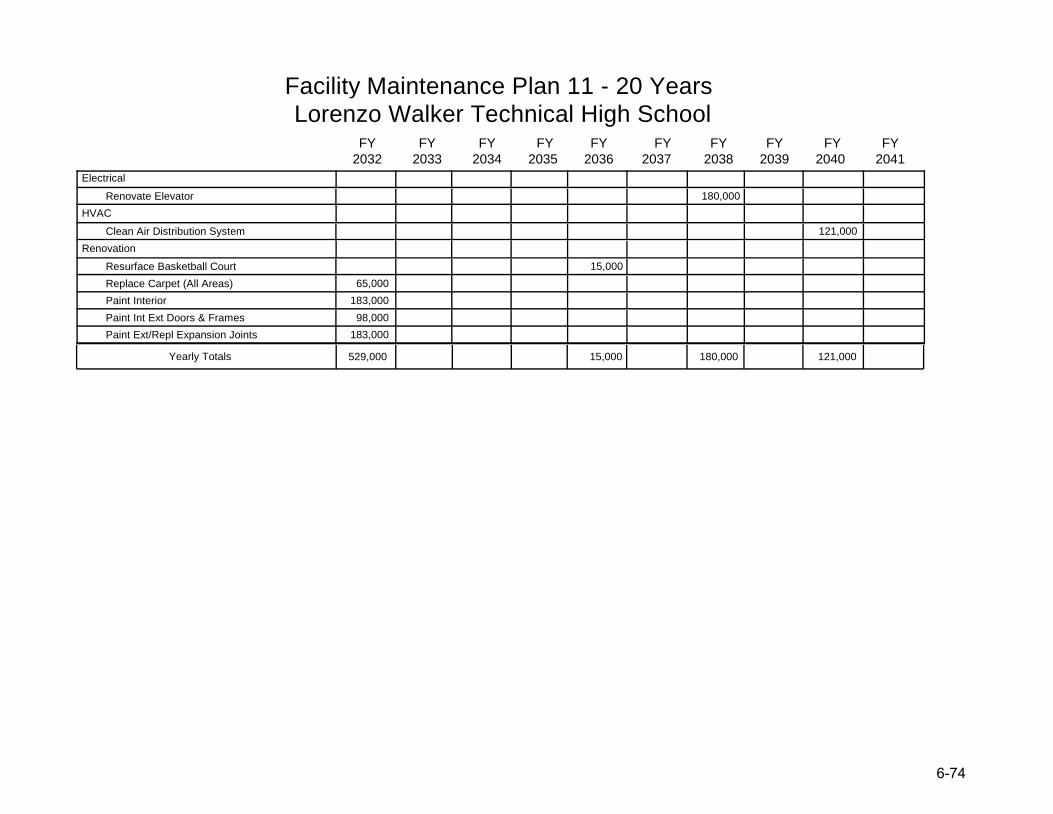
Facility Maintenance Plan 11 - 20 Years Lorenzo Walker Technical High School
2032 2033 2034 2035 2036
FY FY FY FY FY
2037 2038 2039 2040 2041
FY FY FY FY FY
529,000 15,000 180,000 121,000Yearly Totals
Electrical
Renovate Elevator 180,000
HVAC
Clean Air Distribution System 121,000
Renovation
Resurface Basketball Court 15,000
Replace Carpet (All Areas) 65,000
Paint Interior 183,000
Paint Int Ext Doors & Frames 98,000
Paint Ext/Repl Expansion Joints 183,000
6-744
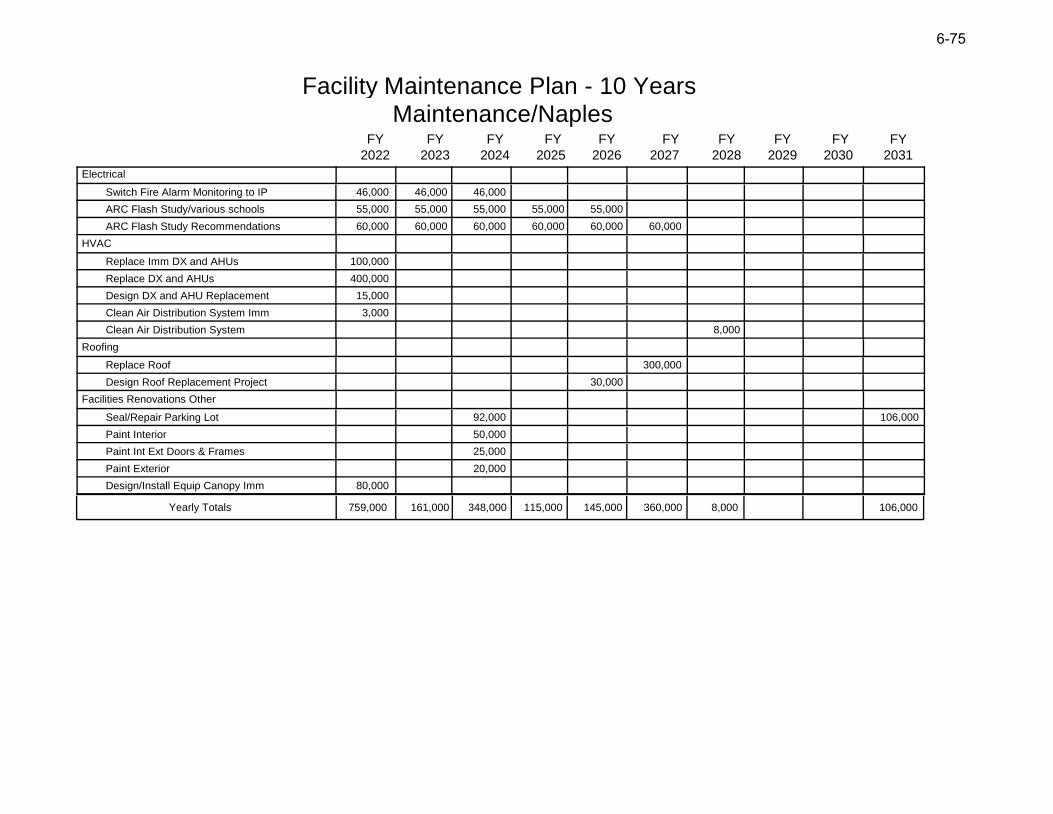
Facility Maintenance Plan - 10 Years Maintenance/Naples
2022 2023 2024 2025 2026
FY FY FY FY FY
2027 2028 2029 2030 2031
FY FY FY FY FY
759,000 161,000 348,000 115,000 145,000 360,000 8,000 106,000Yearly Totals
Electrical
Switch Fire Alarm Monitoring to IP 46,000 46,000 46,000
ARC Flash Study/various schools 55,000 55,000 55,000 55,000 55,000
ARC Flash Study Recommendations 60,000 60,000 60,000 60,000 60,000 60,000
HVAC
Replace Imm DX and AHUs 100,000
Replace DX and AHUs 400,000
Design DX and AHU Replacement 15,000
Clean Air Distribution System Imm 3,000
Clean Air Distribution System 8,000
Roofing
Replace Roof 300,000
Design Roof Replacement Project 30,000
Facilities Renovations Other
Seal/Repair Parking Lot 92,000 106,000
Paint Interior 50,000
Paint Int Ext Doors & Frames 25,000
Paint Exterior 20,000
Design/Install Equip Canopy Imm 80,000
6-755

Facility Maintenance Plan 11 - 20 Years Maintenance/Naples
2032 2033 2034 2035 2036
FY FY FY FY FY
2037 2038 2039 2040 2041
FY FY FY FY FY
4,000 103,000 167,000 446,000 10,000Yearly Totals
HVAC
Clean Air Distribution System Imm 4,000
Clean Air Distribution System 10,000
Roofing
Replace Roof 446,000
Design Roof Replacement Project 45,000
Facilities Renovations Other
Seal/Repair Parking Lot 122,000
Paint Interior 61,000
Paint Int Ext Doors & Frames 18,000
Paint Exterior 24,000
6-766
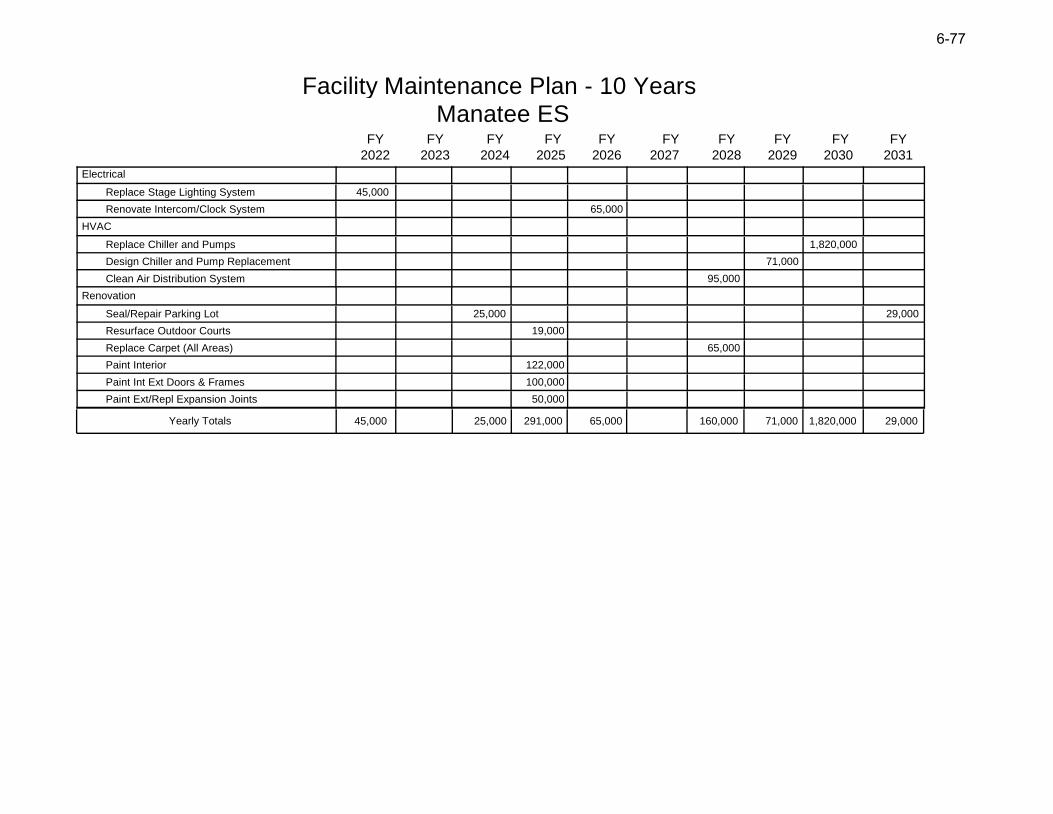
Facility Maintenance Plan - 10 Years Manatee ES
2022 2023 2024 2025 2026
FY FY FY FY FY
2027 2028 2029 2030 2031
FY FY FY FY FY
45,000 25,000 291,000 65,000 160,000 71,000 1,820,000 29,000Yearly Totals
Electrical
Replace Stage Lighting System 45,000
Renovate Intercom/Clock System 65,000
HVAC
Replace Chiller and Pumps 1,820,000
Design Chiller and Pump Replacement 71,000
Clean Air Distribution System 95,000
Renovation
Seal/Repair Parking Lot 25,000 29,000
Resurface Outdoor Courts 19,000
Replace Carpet (All Areas) 65,000
Paint Interior 122,000
Paint Int Ext Doors & Frames 100,000
Paint Ext/Repl Expansion Joints 50,000
6-77
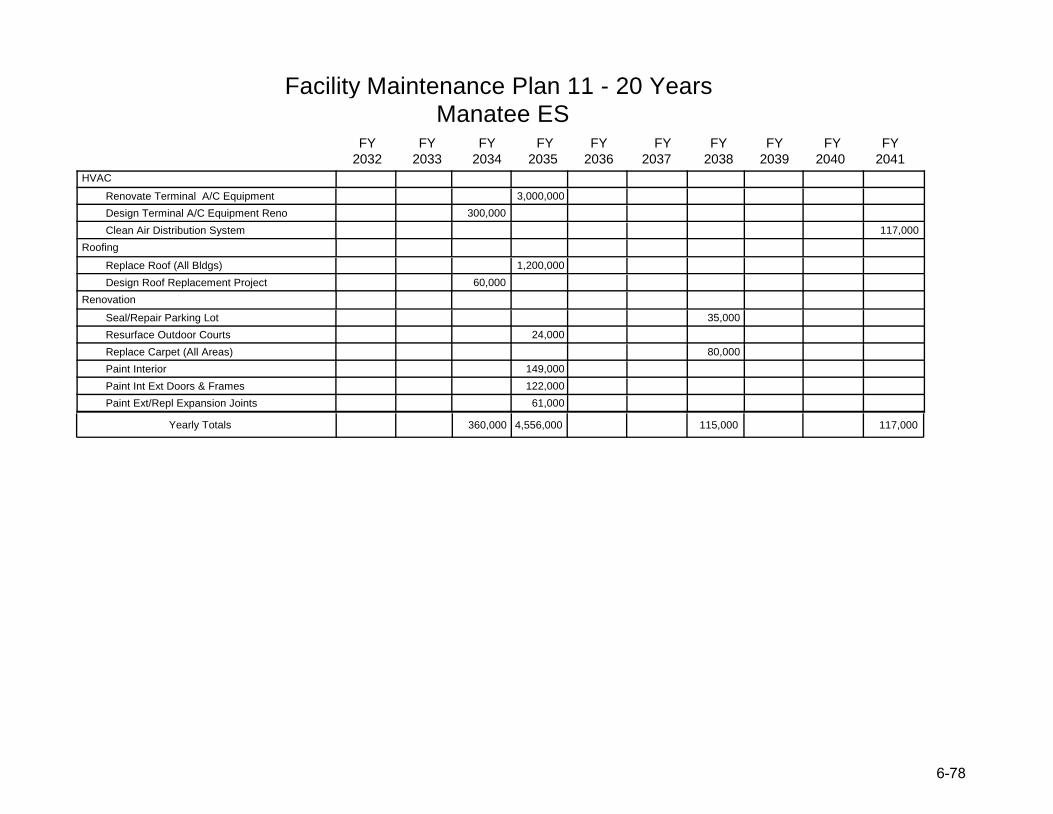
Facility Maintenance Plan 11 - 20 Years Manatee ES
2032 2033 2034 2035 2036
FY FY FY FY FY
2037 2038 2039 2040 2041
FY FY FY FY FY
360,000 4,556,000 115,000 117,000Yearly Totals
HVAC
Renovate Terminal A/C Equipment 3,000,000
Design Terminal A/C Equipment Reno 300,000
Clean Air Distribution System 117,000
Roofing
Replace Roof (All Bldgs) 1,200,000
Design Roof Replacement Project 60,000
Renovation
Seal/Repair Parking Lot 35,000
Resurface Outdoor Courts 24,000
Replace Carpet (All Areas) 80,000
Paint Interior 149,000
Paint Int Ext Doors & Frames 122,000
Paint Ext/Repl Expansion Joints 61,000
6-788
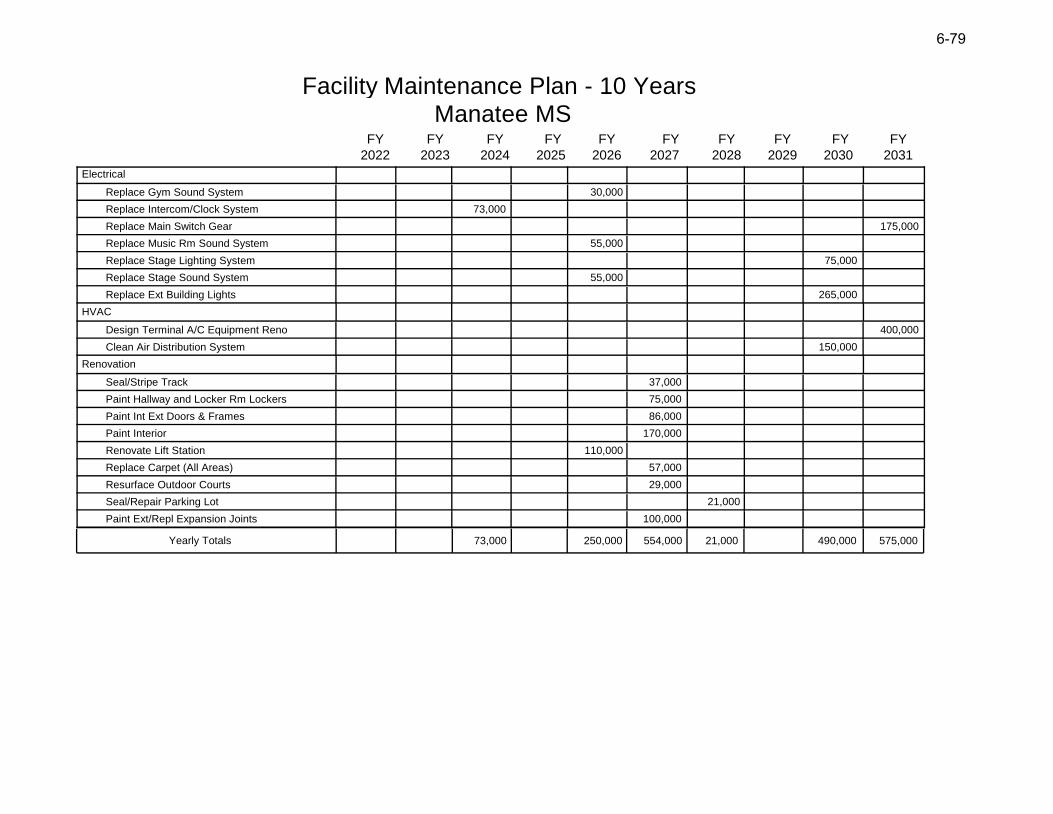
Facility Maintenance Plan - 10 Years Manatee MS
2022 2023 2024 2025 2026
FY FY FY FY FY
2027 2028 2029 2030 2031
FY FY FY FY FY
73,000 250,000 554,000 21,000 490,000 575,000Yearly Totals
Electrical
Replace Gym Sound System 30,000
Replace Intercom/Clock System 73,000
Replace Main Switch Gear 175,000
Replace Music Rm Sound System 55,000
Replace Stage Lighting System 75,000
Replace Stage Sound System 55,000
Replace Ext Building Lights 265,000
HVAC
Design Terminal A/C Equipment Reno 400,000
Clean Air Distribution System 150,000
Renovation
Seal/Stripe Track 37,000
Paint Hallway and Locker Rm Lockers 75,000
Paint Int Ext Doors & Frames 86,000
Paint Interior 170,000
Renovate Lift Station 110,000
Replace Carpet (All Areas) 57,000
Resurface Outdoor Courts 29,000
Seal/Repair Parking Lot 21,000
Paint Ext/Repl Expansion Joints 100,000
6-799
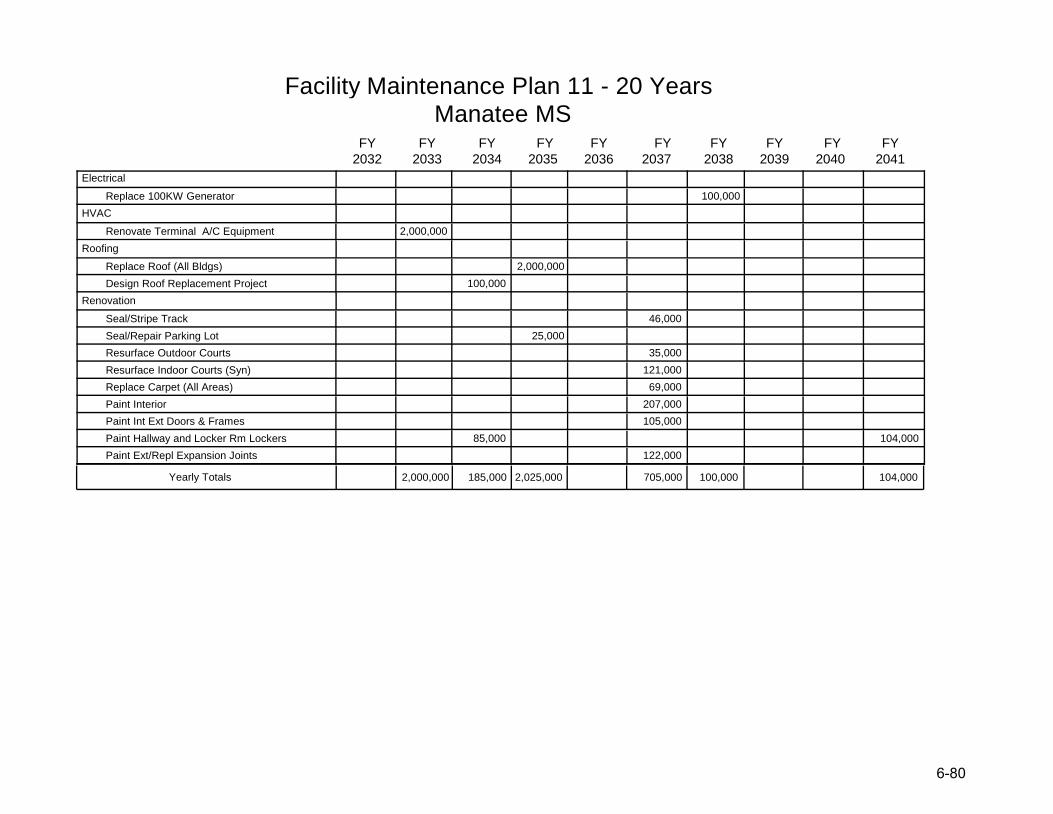
Facility Maintenance Plan 11 - 20 Years Manatee MS
2032 2033 2034 2035 2036
FY FY FY FY FY
2037 2038 2039 2040 2041
FY FY FY FY FY
2,000,000 185,000 2,025,000 705,000 100,000 104,000Yearly Totals
Electrical
Replace 100KW Generator 100,000
HVAC
Renovate Terminal A/C Equipment 2,000,000
Roofing
Replace Roof (All Bldgs) 2,000,000
Design Roof Replacement Project 100,000
Renovation
Seal/Stripe Track 46,000
Seal/Repair Parking Lot 25,000
Resurface Outdoor Courts 35,000
Resurface Indoor Courts (Syn) 121,000
Replace Carpet (All Areas) 69,000
Paint Interior 207,000
Paint Int Ext Doors & Frames 105,000
Paint Hallway and Locker Rm Lockers 85,000 104,000
Paint Ext/Repl Expansion Joints 122,000
6-800
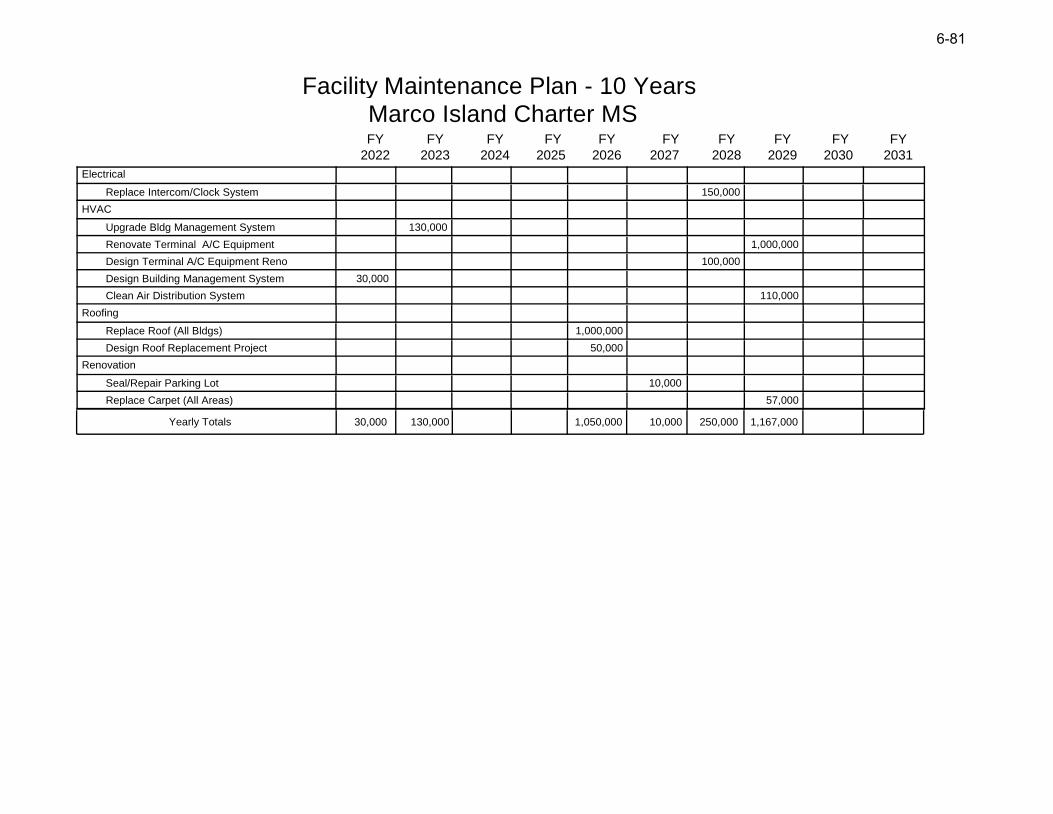
Facility Maintenance Plan - 10 Years Marco Island Charter MS
2022 2023 2024 2025 2026
FY FY FY FY FY
2027 2028 2029 2030 2031
FY FY FY FY FY
30,000 130,000 1,050,000 10,000 250,000 1,167,000Yearly Totals
Electrical
Replace Intercom/Clock System 150,000
HVAC
Upgrade Bldg Management System 130,000
Renovate Terminal A/C Equipment 1,000,000
Design Terminal A/C Equipment Reno 100,000
Design Building Management System 30,000
Clean Air Distribution System 110,000
Roofing
Replace Roof (All Bldgs) 1,000,000
Design Roof Replacement Project 50,000
Renovation
Seal/Repair Parking Lot 10,000
Replace Carpet (All Areas) 57,000
6-81
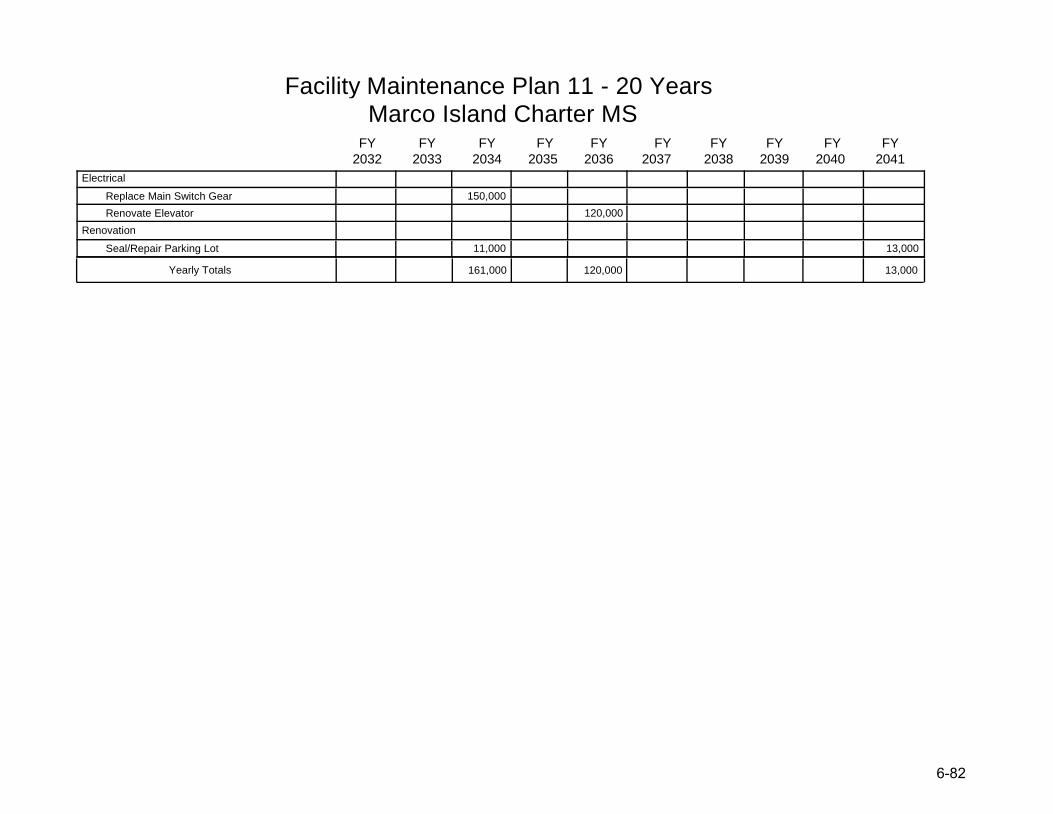
Facility Maintenance Plan 11 - 20 Years Marco Island Charter MS
2032 2033 2034 2035 2036
FY FY FY FY FY
2037 2038 2039 2040 2041
FY FY FY FY FY
161,000 120,000 13,000Yearly Totals
Electrical
Replace Main Switch Gear 150,000
Renovate Elevator 120,000
Renovation
Seal/Repair Parking Lot 11,000 13,000
6-82
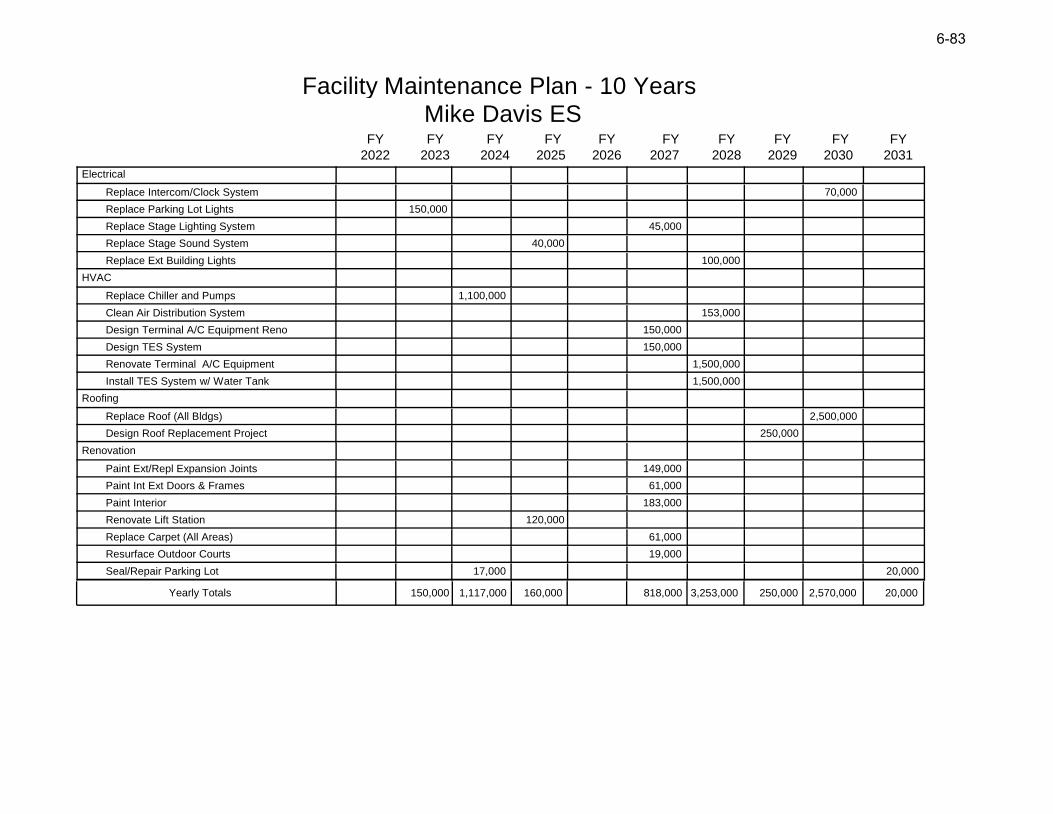
Facility Maintenance Plan - 10 Years Mike Davis ES
2022 2023 2024 2025 2026
FY FY FY FY FY
2027 2028 2029 2030 2031
FY FY FY FY FY
150,000 1,117,000 160,000 818,000 3,253,000 250,000 2,570,000 20,000Yearly Totals
Electrical
Replace Intercom/Clock System 70,000
Replace Parking Lot Lights 150,000
Replace Stage Lighting System 45,000
Replace Stage Sound System 40,000
Replace Ext Building Lights 100,000
HVAC
Replace Chiller and Pumps 1,100,000
Clean Air Distribution System 153,000
Design Terminal A/C Equipment Reno 150,000
Design TES System 150,000
Renovate Terminal A/C Equipment 1,500,000
Install TES System w/ Water Tank 1,500,000
Roofing
Replace Roof (All Bldgs) 2,500,000
Design Roof Replacement Project 250,000
Renovation
Paint Ext/Repl Expansion Joints 149,000
Paint Int Ext Doors & Frames 61,000
Paint Interior 183,000
Renovate Lift Station 120,000
Replace Carpet (All Areas) 61,000
Resurface Outdoor Courts 19,000
Seal/Repair Parking Lot 17,000 20,000
6-83
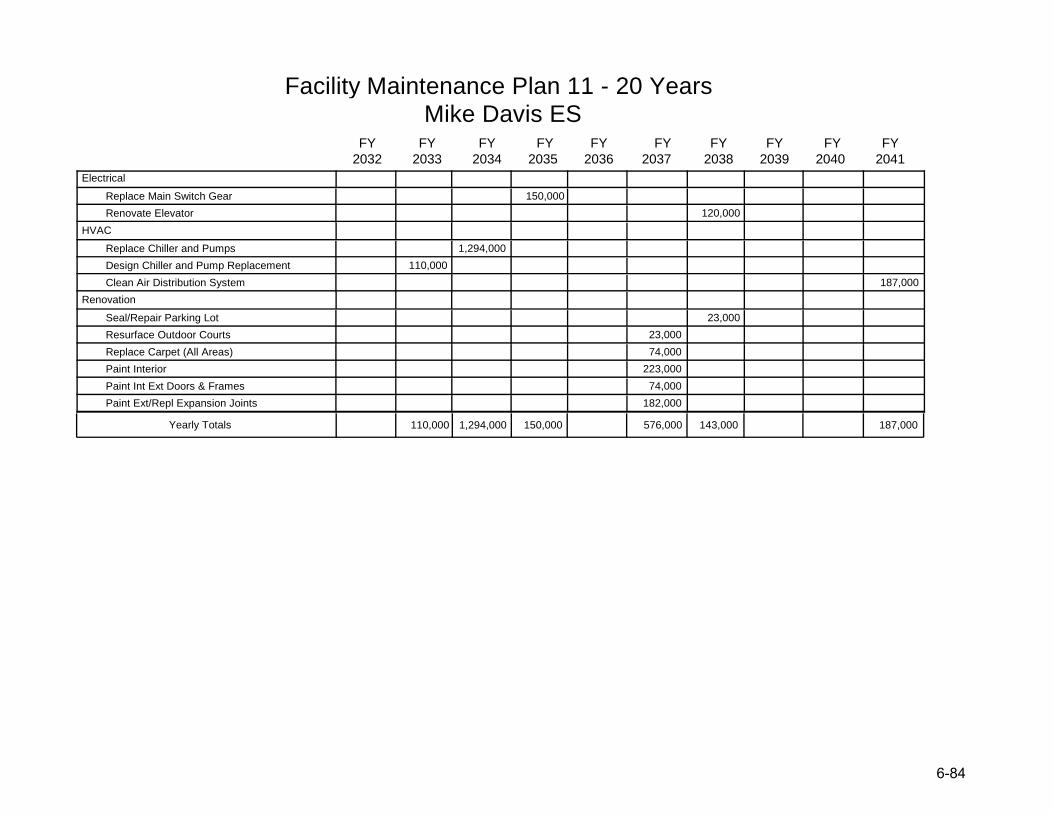
Facility Maintenance Plan 11 - 20 Years Mike Davis ES
2032 2033 2034 2035 2036
FY FY FY FY FY
2037 2038 2039 2040 2041
FY FY FY FY FY
110,000 1,294,000 150,000 576,000 143,000 187,000Yearly Totals
Electrical
Replace Main Switch Gear 150,000
Renovate Elevator 120,000
HVAC
Replace Chiller and Pumps 1,294,000
Design Chiller and Pump Replacement 110,000
Clean Air Distribution System 187,000
Renovation
Seal/Repair Parking Lot 23,000
Resurface Outdoor Courts 23,000
Replace Carpet (All Areas) 74,000
Paint Interior 223,000
Paint Int Ext Doors & Frames 74,000
Paint Ext/Repl Expansion Joints 182,000
6-8484

Facility Maintenance Plan - 10 Years Naples HS
2022 2023 2024 2025 2026
FY FY FY FY FY
2027 2028 2029 2030 2031
FY FY FY FY FY
Electrical
Replace FTB Stadium Lights w/LED 240,000
Replace Stage Lighting System 250,000
Replace Parking Lot Lights 150,000
Replace Music Rm Sound System 60,000
Replace Main Gym Sound System 30,000
Replace Interior Lights w/LED 345,000
Replace Intercom/Clock System 83,000
Renovate Elevator Bldgs 2, 6 and 11 360,000
Replace Gym Scoreboard 70,000
Replace Stage Sound System 115,000
Replace FTB Sound System 75,000
Replace FTB Scoreboard 80,000
Replace Ext Building Lights 450,000
Replace Café Sound System 20,000
Replace BB/SB Sound System 40,000
Replace BB/SB Field Lights w/LED 230,000
Replace House Lighting System 150,000
HVAC
Design Cooling Tower Rebuild 60,000
Rebuild Chillers 200,000
Renovate Cooling Towers 200,000
Replace Balance of Campus AHUs 3,000,000
Replace Bldgs 2, 6, 11 AHUs 1,500,000
Design AHU Replacement Project 150,000 300,000
Clean Air Distribution System 269,000
Renovation
Paint Hallway and Locker Rm Lockers 52,000
Resurface Tennis/Basketball Courts 39,000
Resurface Indoor Courts (Wood) 32,000
Resurface Indoor Courts (Syn) 100,000
Restripe Track/Apply Structur Spray 100,000 122,000
Replace Carpet (All Areas) 65,000
Repl FB Field Synthetic Turf 750,000
6-8585
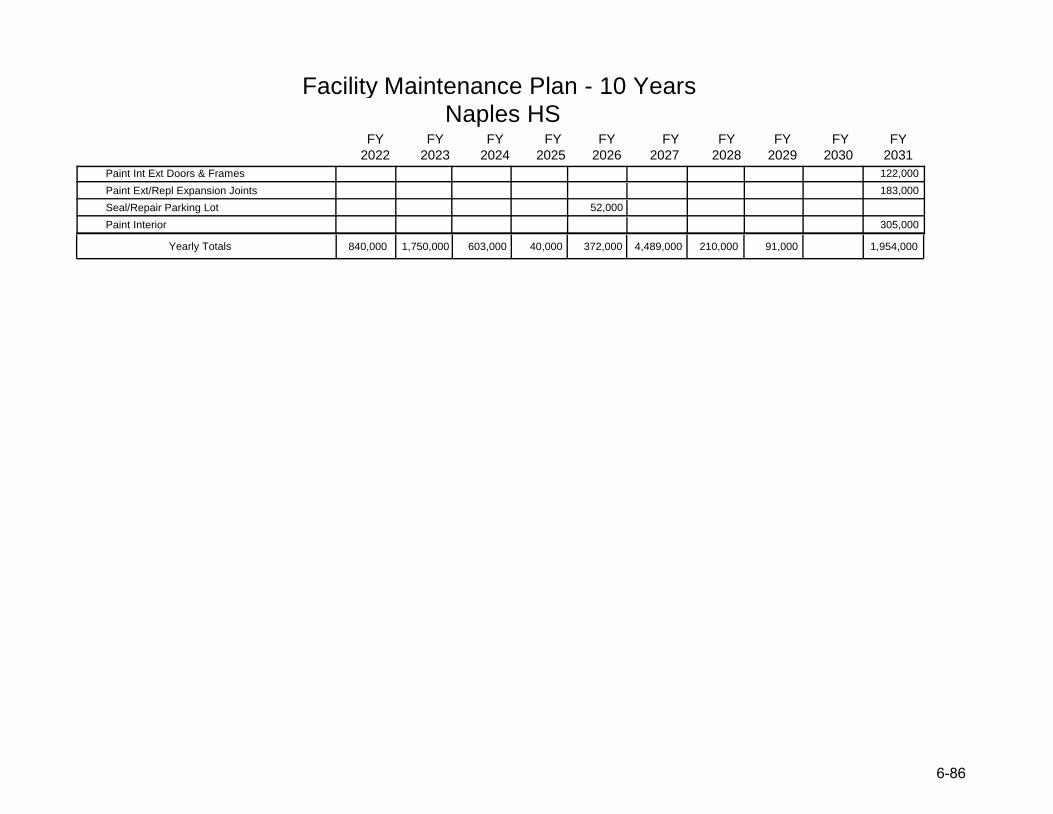
Facility Maintenance Plan - 10 Years Naples HS
2022 2023 2024 2025 2026
FY FY FY FY FY
2027 2028 2029 2030 2031
FY FY FY FY FY
840,000 1,750,000 603,000 40,000 372,000 4,489,000 210,000 91,000 1,954,000Yearly Totals
Paint Int Ext Doors & Frames 122,000
Paint Ext/Repl Expansion Joints 183,000
Seal/Repair Parking Lot 52,000
Paint Interior 305,000
6-8686
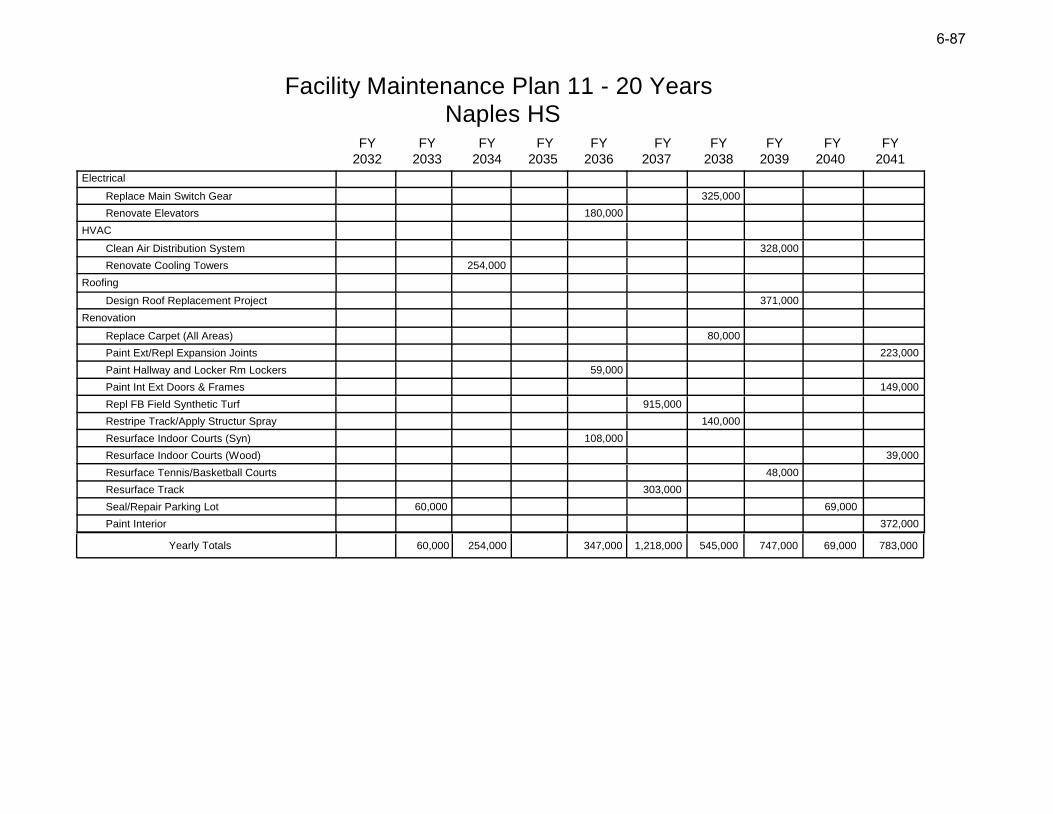
Facility Maintenance Plan 11 - 20 Years Naples HS
2032 2033 2034 2035 2036
FY FY FY FY FY
2037 2038 2039 2040 2041
FY FY FY FY FY
60,000 254,000 347,000 1,218,000 545,000 747,000 69,000 783,000Yearly Totals
Electrical
Replace Main Switch Gear 325,000
Renovate Elevators 180,000
HVAC
Clean Air Distribution System 328,000
Renovate Cooling Towers 254,000
Roofing
Design Roof Replacement Project 371,000
Renovation
Replace Carpet (All Areas) 80,000
Paint Ext/Repl Expansion Joints 223,000
Paint Hallway and Locker Rm Lockers 59,000
Paint Int Ext Doors & Frames 149,000
Repl FB Field Synthetic Turf 915,000
Restripe Track/Apply Structur Spray 140,000
Resurface Indoor Courts (Syn) 108,000
Resurface Indoor Courts (Wood) 39,000
Resurface Tennis/Basketball Courts 48,000
Resurface Track 303,000
Seal/Repair Parking Lot 60,000 69,000
Paint Interior 372,000
6-87

THIS PAGE INTENTIONALLY LEFT BLANK
6-8888
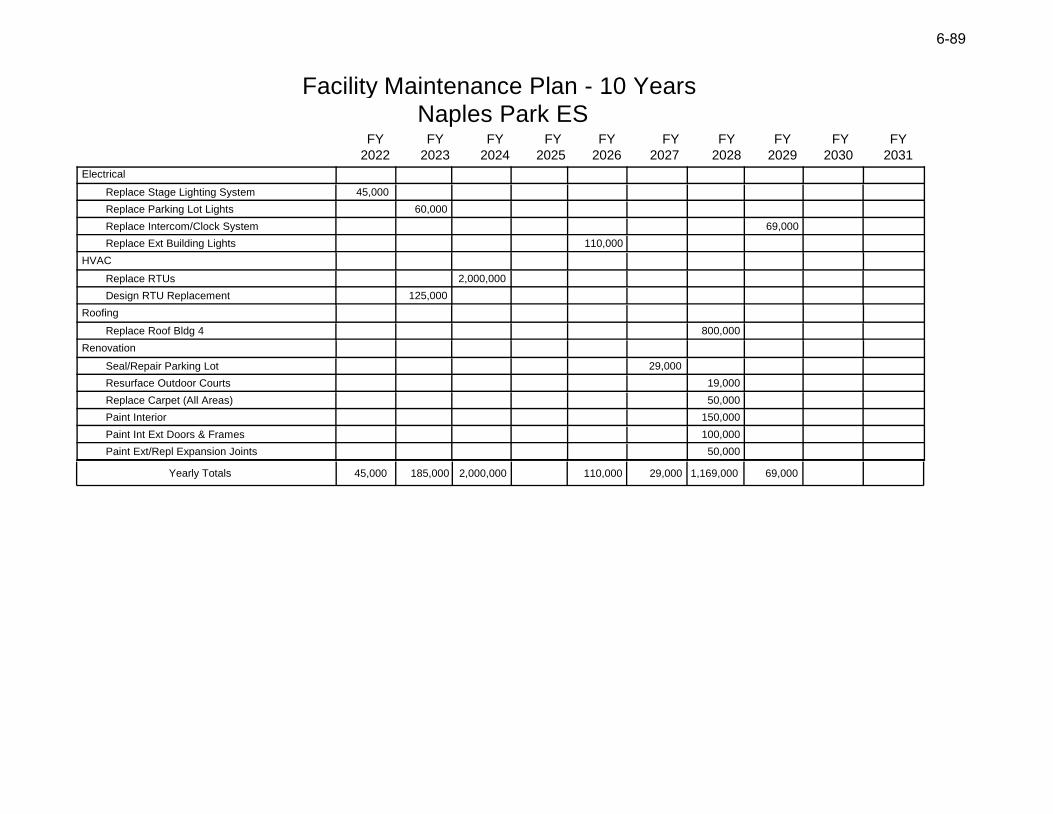
Facility Maintenance Plan - 10 Years Naples Park ES
2022 2023 2024 2025 2026
FY FY FY FY FY
2027 2028 2029 2030 2031
FY FY FY FY FY
45,000 185,000 2,000,000 110,000 29,000 1,169,000 69,000Yearly Totals
Electrical
Replace Stage Lighting System 45,000
Replace Parking Lot Lights 60,000
Replace Intercom/Clock System 69,000
Replace Ext Building Lights 110,000
HVAC
Replace RTUs 2,000,000
Design RTU Replacement 125,000
Roofing
Replace Roof Bldg 4 800,000
Renovation
Seal/Repair Parking Lot 29,000
Resurface Outdoor Courts 19,000
Replace Carpet (All Areas) 50,000
Paint Interior 150,000
Paint Int Ext Doors & Frames 100,000
Paint Ext/Repl Expansion Joints 50,000
6-899
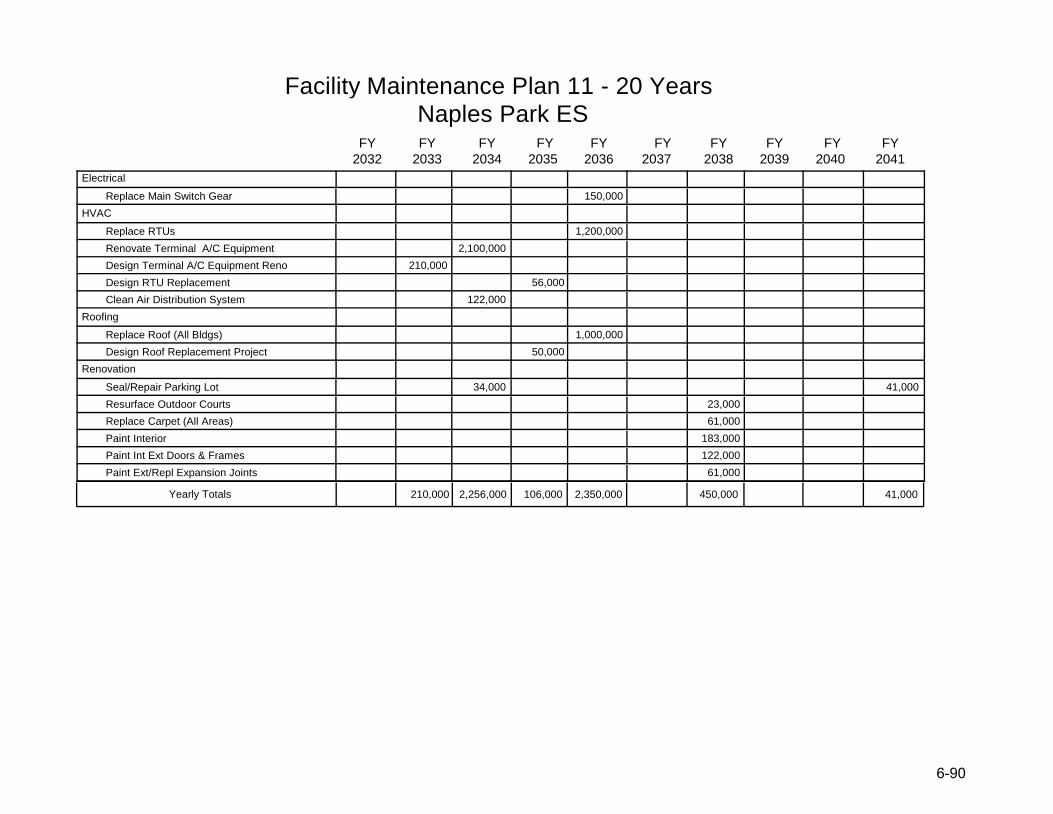
Facility Maintenance Plan 11 - 20 Years Naples Park ES
2032 2033 2034 2035 2036
FY FY FY FY FY
2037 2038 2039 2040 2041
FY FY FY FY FY
210,000 2,256,000 106,000 2,350,000 450,000 41,000Yearly Totals
Electrical
Replace Main Switch Gear 150,000
HVAC
Replace RTUs 1,200,000
Renovate Terminal A/C Equipment 2,100,000
Design Terminal A/C Equipment Reno 210,000
Design RTU Replacement 56,000
Clean Air Distribution System 122,000
Roofing
Replace Roof (All Bldgs) 1,000,000
Design Roof Replacement Project 50,000
Renovation
Seal/Repair Parking Lot 34,000 41,000
Resurface Outdoor Courts 23,000
Replace Carpet (All Areas) 61,000
Paint Interior 183,000
Paint Int Ext Doors & Frames 122,000
Paint Ext/Repl Expansion Joints 61,000
6-900
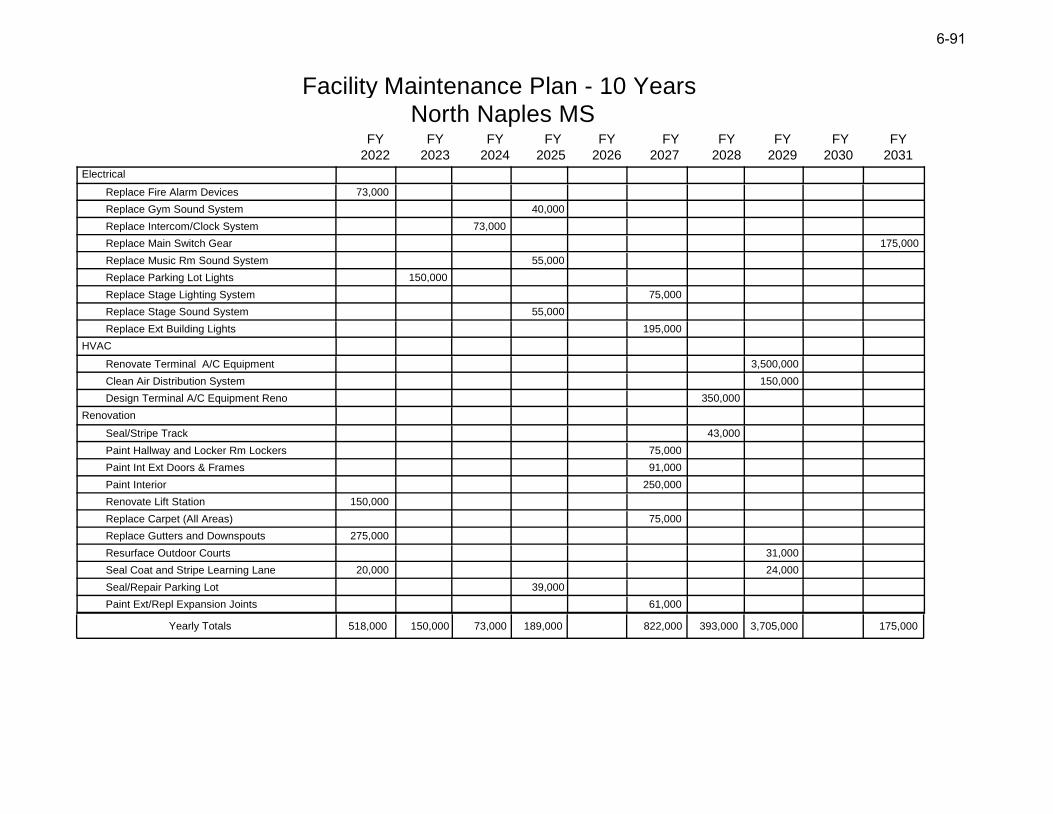
Facility Maintenance Plan - 10 Years North Naples MS
2022 2023 2024 2025 2026
FY FY FY FY FY
2027 2028 2029 2030 2031
FY FY FY FY FY
518,000 150,000 73,000 189,000 822,000 393,000 3,705,000 175,000Yearly Totals
Electrical
Replace Fire Alarm Devices 73,000
Replace Gym Sound System 40,000
Replace Intercom/Clock System 73,000
Replace Main Switch Gear 175,000
Replace Music Rm Sound System 55,000
Replace Parking Lot Lights 150,000
Replace Stage Lighting System 75,000
Replace Stage Sound System 55,000
Replace Ext Building Lights 195,000
HVAC
Renovate Terminal A/C Equipment 3,500,000
Clean Air Distribution System 150,000
Design Terminal A/C Equipment Reno 350,000
Renovation
Seal/Stripe Track 43,000
Paint Hallway and Locker Rm Lockers 75,000
Paint Int Ext Doors & Frames 91,000
Paint Interior 250,000
Renovate Lift Station 150,000
Replace Carpet (All Areas) 75,000
Replace Gutters and Downspouts 275,000
Resurface Outdoor Courts 31,000
Seal Coat and Stripe Learning Lane 20,000 24,000
Seal/Repair Parking Lot 39,000
Paint Ext/Repl Expansion Joints 61,000
6-91
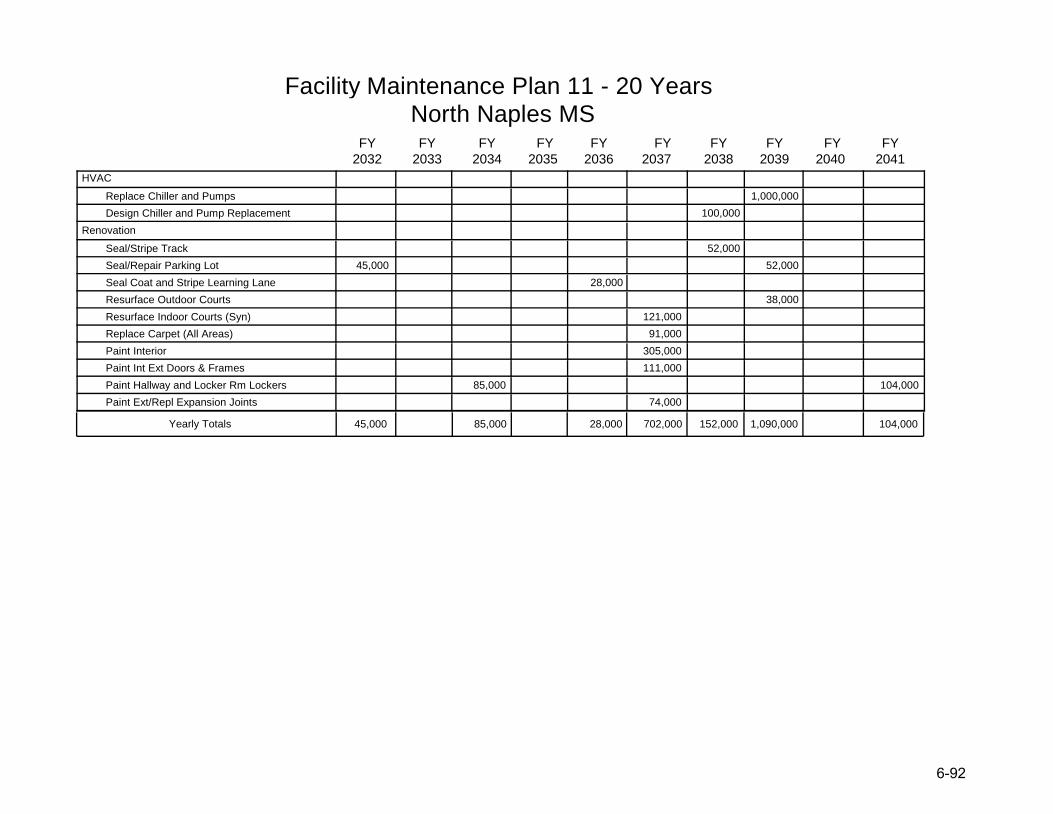
Facility Maintenance Plan 11 - 20 Years North Naples MS
2032 2033 2034 2035 2036
FY FY FY FY FY
2037 2038 2039 2040 2041
FY FY FY FY FY
45,000 85,000 28,000 702,000 152,000 1,090,000 104,000Yearly Totals
HVAC
Replace Chiller and Pumps 1,000,000
Design Chiller and Pump Replacement 100,000
Renovation
Seal/Stripe Track 52,000
Seal/Repair Parking Lot 45,000 52,000
Seal Coat and Stripe Learning Lane 28,000
Resurface Outdoor Courts 38,000
Resurface Indoor Courts (Syn) 121,000
Replace Carpet (All Areas) 91,000
Paint Interior 305,000
Paint Int Ext Doors & Frames 111,000
Paint Hallway and Locker Rm Lockers 85,000 104,000
Paint Ext/Repl Expansion Joints 74,000
6-92
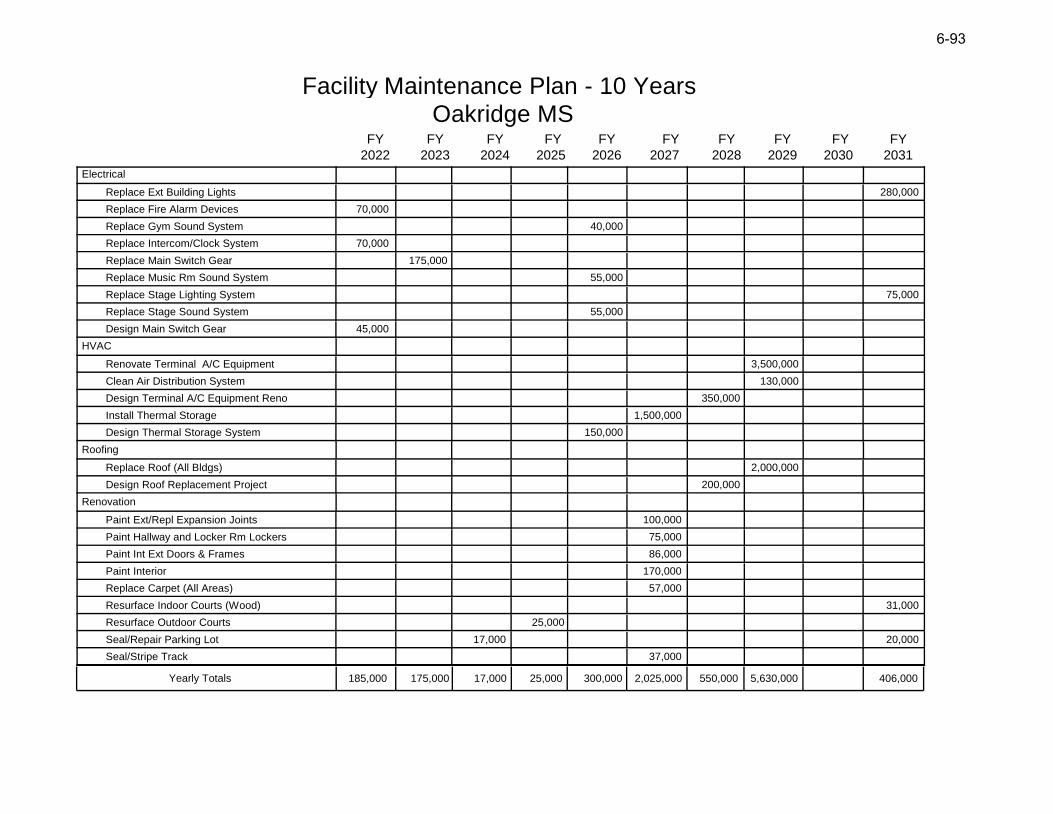
Facility Maintenance Plan - 10 Years Oakridge MS
2022 2023 2024 2025 2026
FY FY FY FY FY
2027 2028 2029 2030 2031
FY FY FY FY FY
185,000 175,000 17,000 25,000 300,000 2,025,000 550,000 5,630,000 406,000Yearly Totals
Electrical
Replace Ext Building Lights 280,000
Replace Fire Alarm Devices 70,000
Replace Gym Sound System 40,000
Replace Intercom/Clock System 70,000
Replace Main Switch Gear 175,000
Replace Music Rm Sound System 55,000
Replace Stage Lighting System 75,000
Replace Stage Sound System 55,000
Design Main Switch Gear 45,000
HVAC
Renovate Terminal A/C Equipment 3,500,000
Clean Air Distribution System 130,000
Design Terminal A/C Equipment Reno 350,000
Install Thermal Storage 1,500,000
Design Thermal Storage System 150,000
Roofing
Replace Roof (All Bldgs) 2,000,000
Design Roof Replacement Project 200,000
Renovation
Paint Ext/Repl Expansion Joints 100,000
Paint Hallway and Locker Rm Lockers 75,000
Paint Int Ext Doors & Frames 86,000
Paint Interior 170,000
Replace Carpet (All Areas) 57,000
Resurface Indoor Courts (Wood) 31,000
Resurface Outdoor Courts 25,000
Seal/Repair Parking Lot 17,000 20,000
Seal/Stripe Track 37,000
6-93
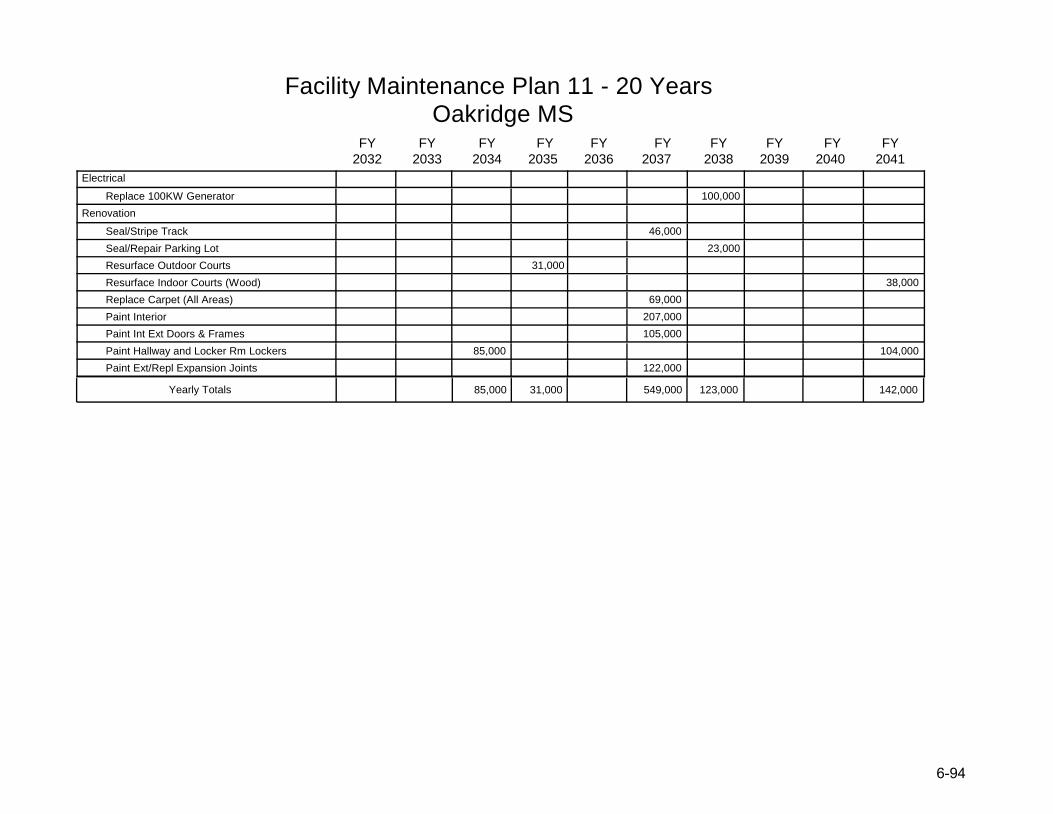
Facility Maintenance Plan 11 - 20 Years Oakridge MS
2032 2033 2034 2035 2036
FY FY FY FY FY
2037 2038 2039 2040 2041
FY FY FY FY FY
85,000 31,000 549,000 123,000 142,000Yearly Totals
Electrical
Replace 100KW Generator 100,000
Renovation
Seal/Stripe Track 46,000
Seal/Repair Parking Lot 23,000
Resurface Outdoor Courts 31,000
Resurface Indoor Courts (Wood) 38,000
Replace Carpet (All Areas) 69,000
Paint Interior 207,000
Paint Int Ext Doors & Frames 105,000
Paint Hallway and Locker Rm Lockers 85,000 104,000
Paint Ext/Repl Expansion Joints 122,000
6-9494
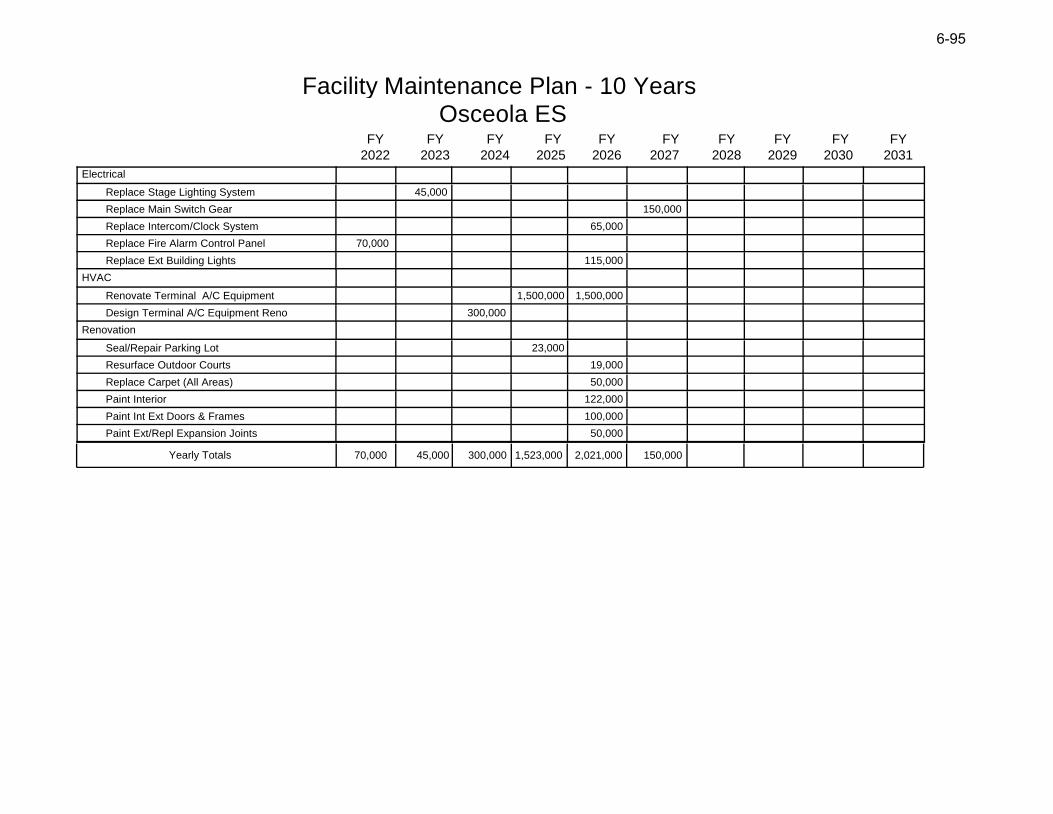
Facility Maintenance Plan - 10 Years Osceola ES
2022 2023 2024 2025 2026
FY FY FY FY FY
2027 2028 2029 2030 2031
FY FY FY FY FY
70,000 45,000 300,000 1,523,000 2,021,000 150,000Yearly Totals
Electrical
Replace Stage Lighting System 45,000
Replace Main Switch Gear 150,000
Replace Intercom/Clock System 65,000
Replace Fire Alarm Control Panel 70,000
Replace Ext Building Lights 115,000
HVAC
Renovate Terminal A/C Equipment 1,500,000 1,500,000
Design Terminal A/C Equipment Reno 300,000
Renovation
Seal/Repair Parking Lot 23,000
Resurface Outdoor Courts 19,000
Replace Carpet (All Areas) 50,000
Paint Interior 122,000
Paint Int Ext Doors & Frames 100,000
Paint Ext/Repl Expansion Joints 50,000
6-9595
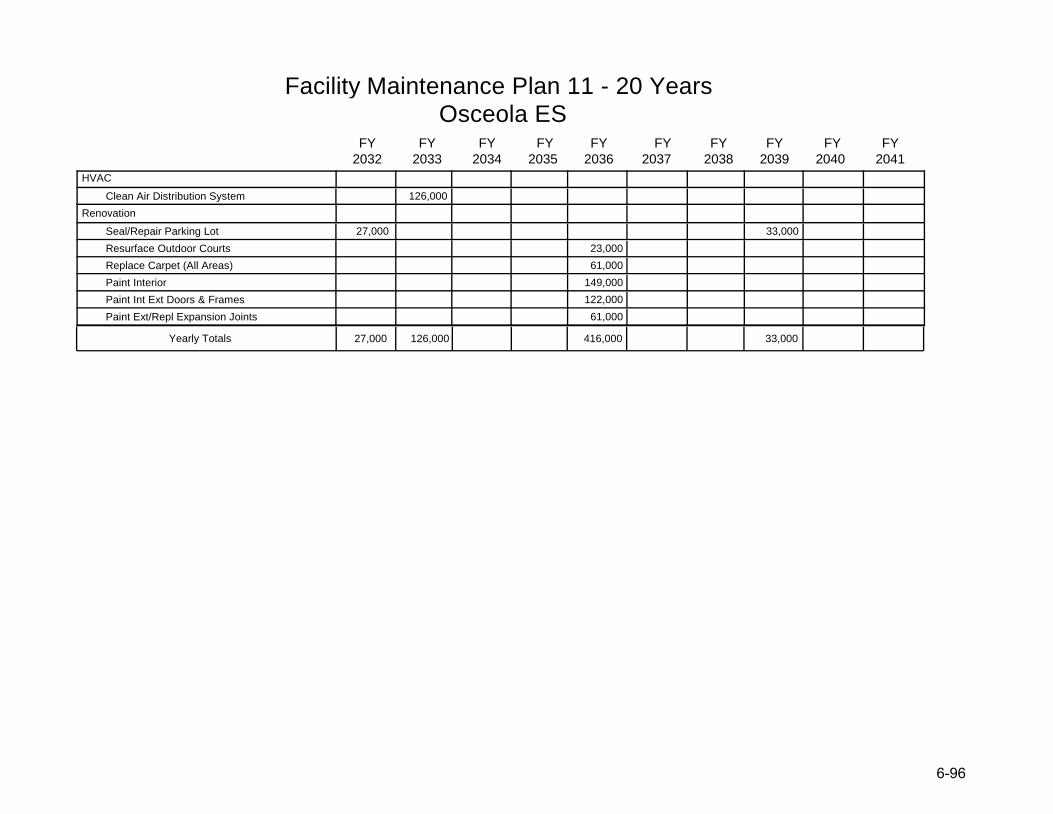
Facility Maintenance Plan 11 - 20 Years Osceola ES
2032 2033 2034 2035 2036
FY FY FY FY FY
2037 2038 2039 2040 2041
FY FY FY FY FY
27,000 126,000 416,000 33,000Yearly Totals
HVAC
Clean Air Distribution System 126,000
Renovation
Seal/Repair Parking Lot 27,000 33,000
Resurface Outdoor Courts 23,000
Replace Carpet (All Areas) 61,000
Paint Interior 149,000
Paint Int Ext Doors & Frames 122,000
Paint Ext/Repl Expansion Joints 61,000
6-9696
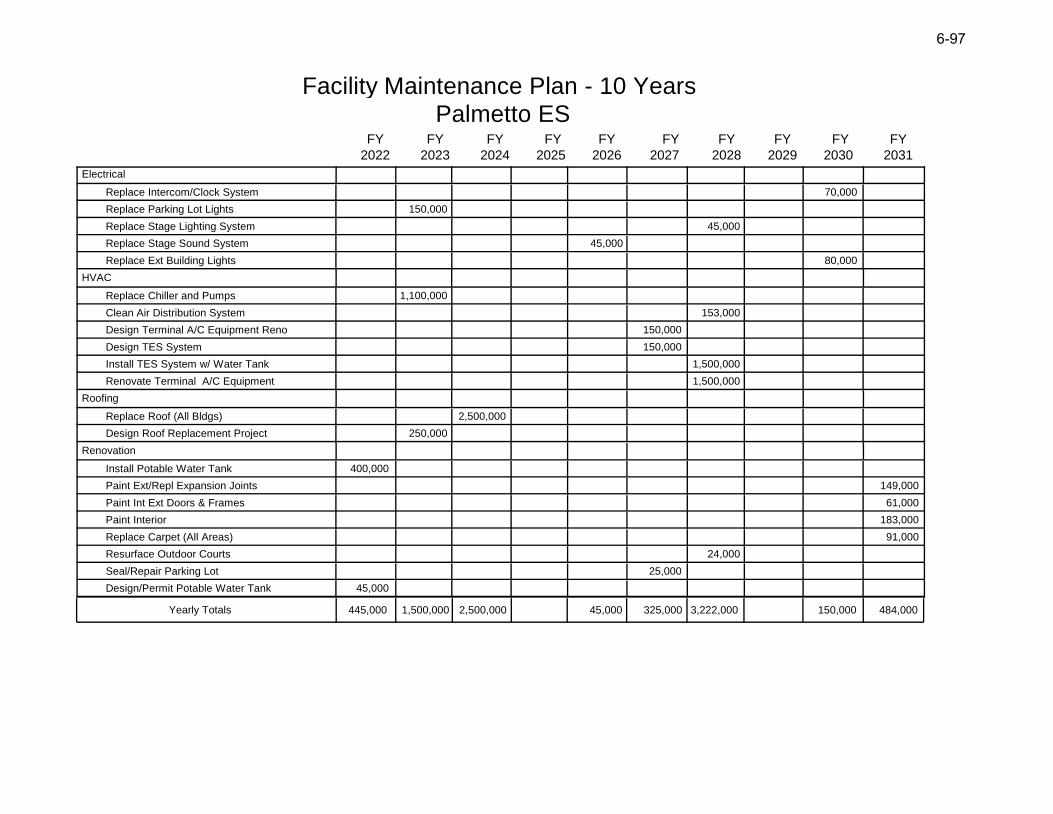
Facility Maintenance Plan - 10 Years Palmetto ES
2022 2023 2024 2025 2026
FY FY FY FY FY
2027 2028 2029 2030 2031
FY FY FY FY FY
445,000 1,500,000 2,500,000 45,000 325,000 3,222,000 150,000 484,000Yearly Totals
Electrical
Replace Intercom/Clock System 70,000
Replace Parking Lot Lights 150,000
Replace Stage Lighting System 45,000
Replace Stage Sound System 45,000
Replace Ext Building Lights 80,000
HVAC
Replace Chiller and Pumps 1,100,000
Clean Air Distribution System 153,000
Design Terminal A/C Equipment Reno 150,000
Design TES System 150,000
Install TES System w/ Water Tank 1,500,000
Renovate Terminal A/C Equipment 1,500,000
Roofing
Replace Roof (All Bldgs) 2,500,000
Design Roof Replacement Project 250,000
Renovation
Install Potable Water Tank 400,000
Paint Ext/Repl Expansion Joints 149,000
Paint Int Ext Doors & Frames 61,000
Paint Interior 183,000
Replace Carpet (All Areas) 91,000
Resurface Outdoor Courts 24,000
Seal/Repair Parking Lot 25,000
Design/Permit Potable Water Tank 45,000
6-97
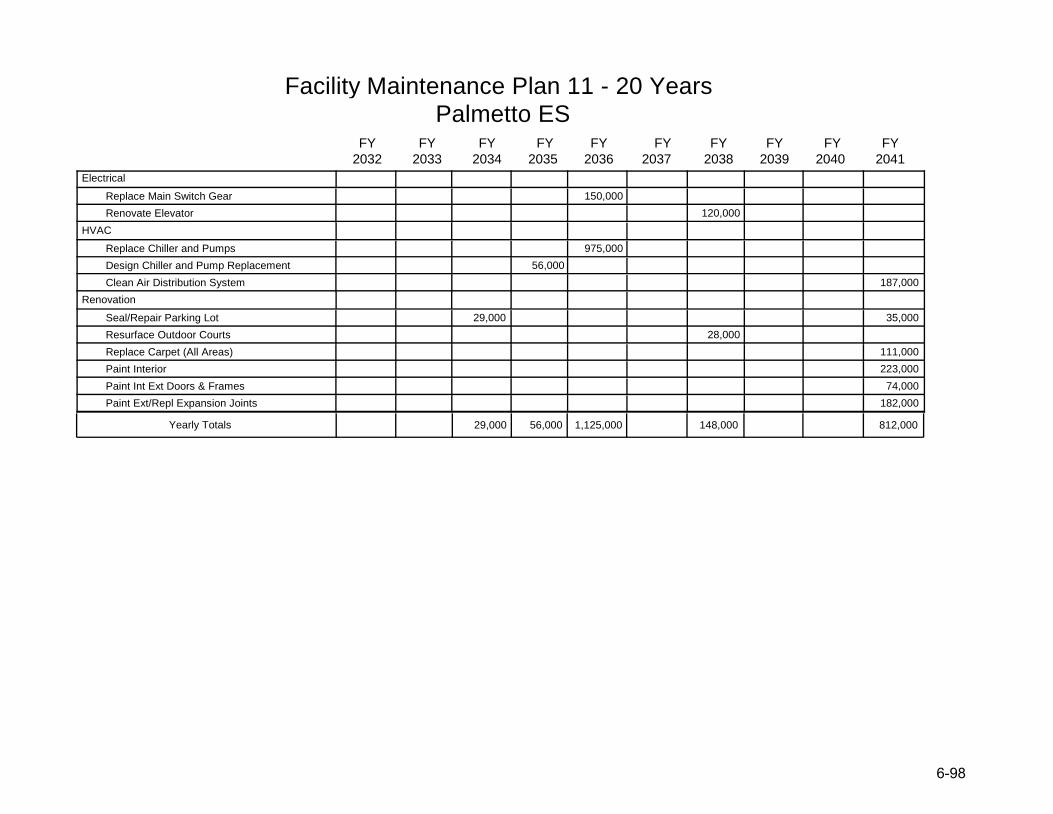
Facility Maintenance Plan 11 - 20 Years Palmetto ES
2032 2033 2034 2035 2036
FY FY FY FY FY
2037 2038 2039 2040 2041
FY FY FY FY FY
29,000 56,000 1,125,000 148,000 812,000Yearly Totals
Electrical
Replace Main Switch Gear 150,000
Renovate Elevator 120,000
HVAC
Replace Chiller and Pumps 975,000
Design Chiller and Pump Replacement 56,000
Clean Air Distribution System 187,000
Renovation
Seal/Repair Parking Lot 29,000 35,000
Resurface Outdoor Courts 28,000
Replace Carpet (All Areas) 111,000
Paint Interior 223,000
Paint Int Ext Doors & Frames 74,000
Paint Ext/Repl Expansion Joints 182,000
6-9898
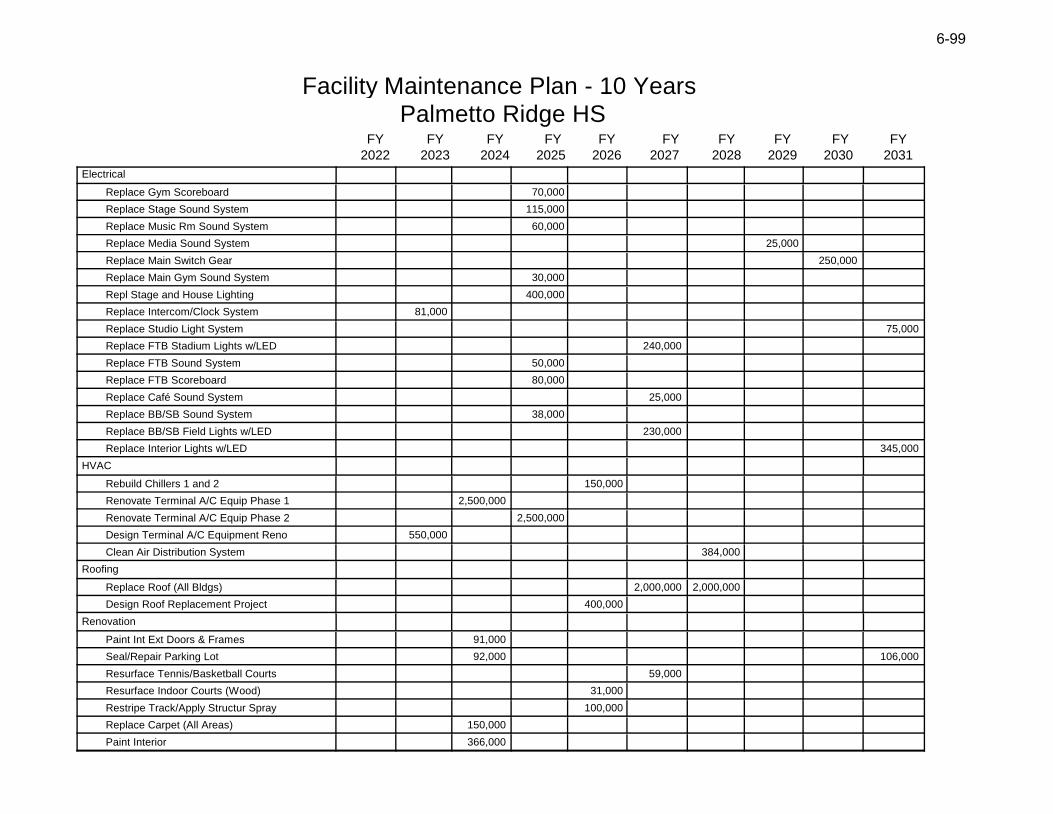
Facility Maintenance Plan - 10 Years Palmetto Ridge HS
2022 2023 2024 2025 2026
FY FY FY FY FY
2027 2028 2029 2030 2031
FY FY FY FY FY
Electrical
Replace Gym Scoreboard 70,000
Replace Stage Sound System 115,000
Replace Music Rm Sound System 60,000
Replace Media Sound System 25,000
Replace Main Switch Gear 250,000
Replace Main Gym Sound System 30,000
Repl Stage and House Lighting 400,000
Replace Intercom/Clock System 81,000
Replace Studio Light System 75,000
Replace FTB Stadium Lights w/LED 240,000
Replace FTB Sound System 50,000
Replace FTB Scoreboard 80,000
Replace Café Sound System 25,000
Replace BB/SB Sound System 38,000
Replace BB/SB Field Lights w/LED 230,000
Replace Interior Lights w/LED 345,000
HVAC
Rebuild Chillers 1 and 2 150,000
Renovate Terminal A/C Equip Phase 1 2,500,000
Renovate Terminal A/C Equip Phase 2 2,500,000
Design Terminal A/C Equipment Reno 550,000
Clean Air Distribution System 384,000
Roofing
Replace Roof (All Bldgs) 2,000,000 2,000,000
Design Roof Replacement Project 400,000
Renovation
Paint Int Ext Doors & Frames 91,000
Seal/Repair Parking Lot 92,000 106,000
Resurface Tennis/Basketball Courts 59,000
Resurface Indoor Courts (Wood) 31,000
Restripe Track/Apply Structur Spray 100,000
Replace Carpet (All Areas) 150,000
Paint Interior 366,000
6-9999

Facility Maintenance Plan - 10 Years Palmetto Ridge HS
2022 2023 2024 2025 2026
FY FY FY FY FY
2027 2028 2029 2030 2031
FY FY FY FY FY
150,000 631,000 3,299,000 3,343,000 681,000 2,554,000 2,384,000 100,000 250,000 526,000Yearly Totals
Paint Hallway and Locker Rm Lockers 75,000
Paint Ext/Repl Expansion Joints 100,000
Renovate Lift Station 150,000
6-100100
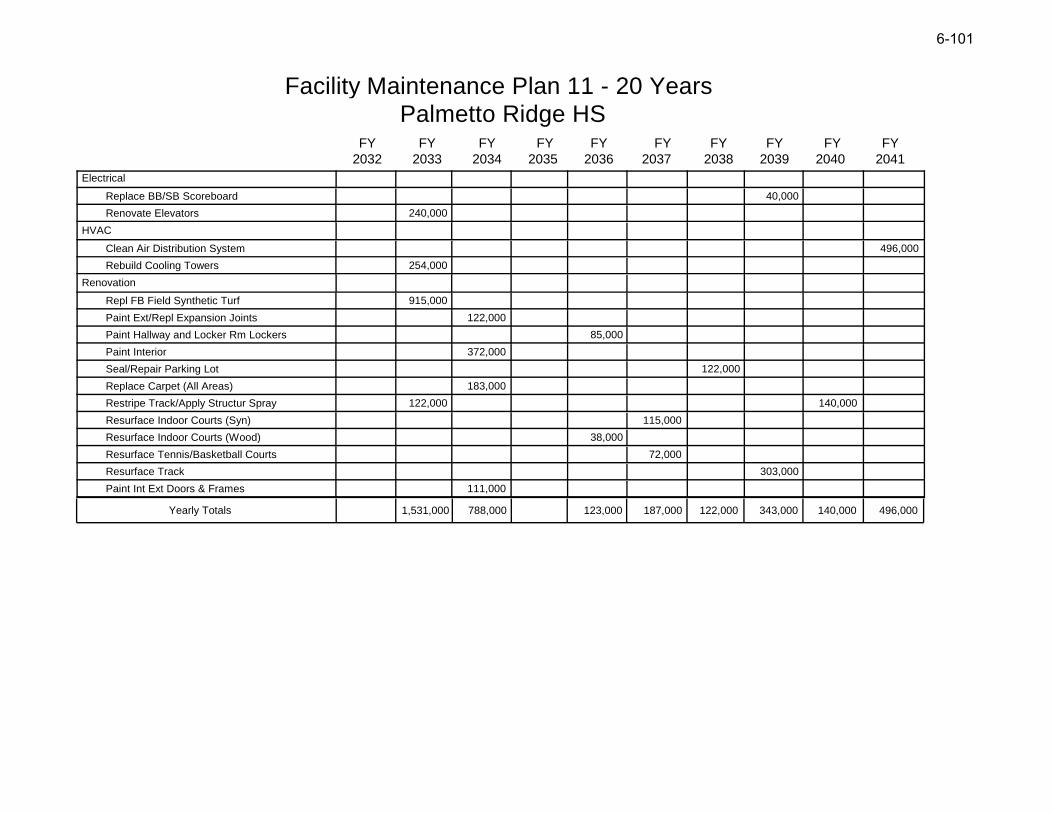
Facility Maintenance Plan 11 - 20 Years Palmetto Ridge HS
2032 2033 2034 2035 2036
FY FY FY FY FY
2037 2038 2039 2040 2041
FY FY FY FY FY
1,531,000 788,000 123,000 187,000 122,000 343,000 140,000 496,000Yearly Totals
Electrical
Replace BB/SB Scoreboard 40,000
Renovate Elevators 240,000
HVAC
Clean Air Distribution System 496,000
Rebuild Cooling Towers 254,000
Renovation
Repl FB Field Synthetic Turf 915,000
Paint Ext/Repl Expansion Joints 122,000
Paint Hallway and Locker Rm Lockers 85,000
Paint Interior 372,000
Seal/Repair Parking Lot 122,000
Replace Carpet (All Areas) 183,000
Restripe Track/Apply Structur Spray 122,000 140,000
Resurface Indoor Courts (Syn) 115,000
Resurface Indoor Courts (Wood) 38,000
Resurface Tennis/Basketball Courts 72,000
Resurface Track 303,000
Paint Int Ext Doors & Frames 111,000
6-10101
THIS PAGE INTENTIONALLY LEFT BLANK
6-102
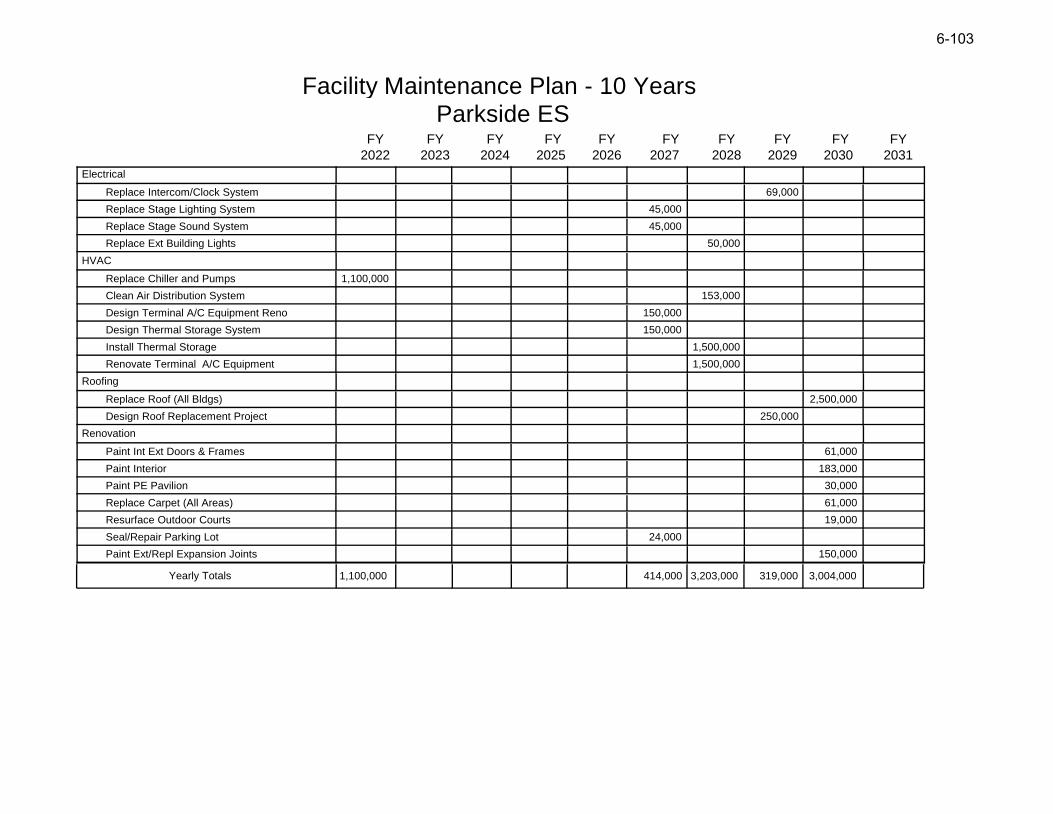
Facility Maintenance Plan - 10 Years Parkside ES
2022 2023 2024 2025 2026
FY FY FY FY FY
2027 2028 2029 2030 2031
FY FY FY FY FY
1,100,000 414,000 3,203,000 319,000 3,004,000Yearly Totals
Electrical
Replace Intercom/Clock System 69,000
Replace Stage Lighting System 45,000
Replace Stage Sound System 45,000
Replace Ext Building Lights 50,000
HVAC
Replace Chiller and Pumps 1,100,000
Clean Air Distribution System 153,000
Design Terminal A/C Equipment Reno 150,000
Design Thermal Storage System 150,000
Install Thermal Storage 1,500,000
Renovate Terminal A/C Equipment 1,500,000
Roofing
Replace Roof (All Bldgs) 2,500,000
Design Roof Replacement Project 250,000
Renovation
Paint Int Ext Doors & Frames 61,000
Paint Interior 183,000
Paint PE Pavilion 30,000
Replace Carpet (All Areas) 61,000
Resurface Outdoor Courts 19,000
Seal/Repair Parking Lot 24,000
Paint Ext/Repl Expansion Joints 150,000
6-103
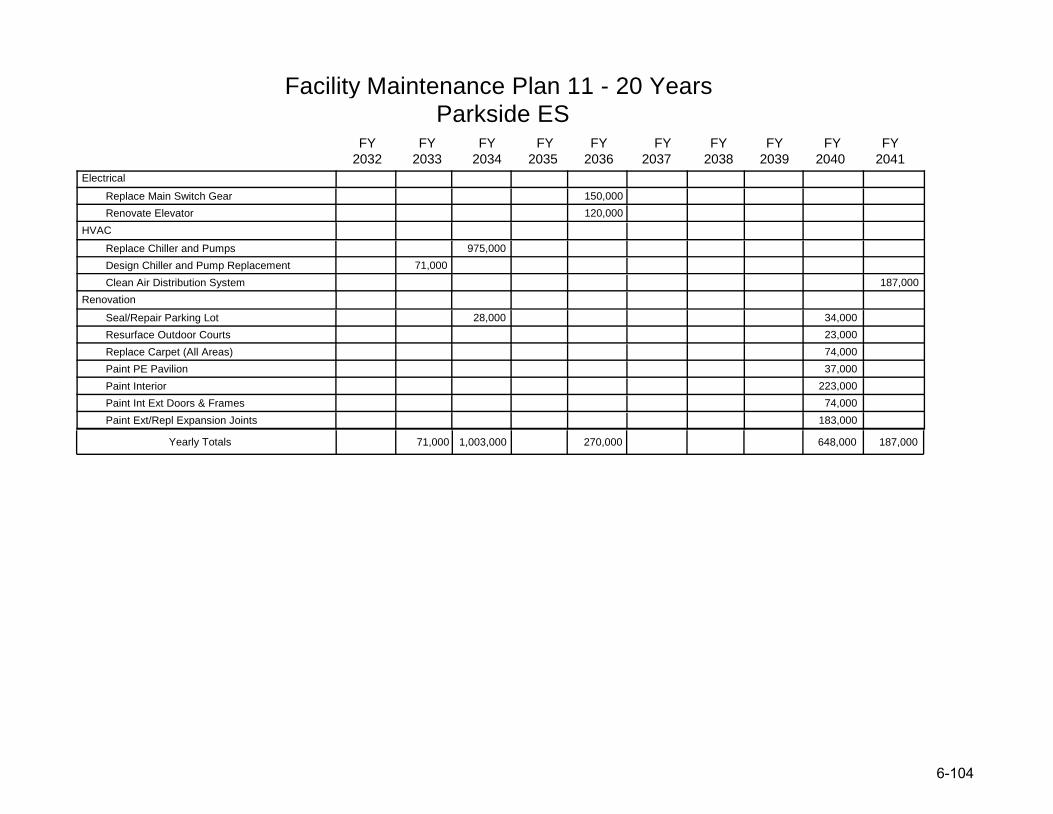
Facility Maintenance Plan 11 - 20 Years Parkside ES
2032 2033 2034 2035 2036
FY FY FY FY FY
2037 2038 2039 2040 2041
FY FY FY FY FY
71,000 1,003,000 270,000 648,000 187,000Yearly Totals
Electrical
Replace Main Switch Gear 150,000
Renovate Elevator 120,000
HVAC
Replace Chiller and Pumps 975,000
Design Chiller and Pump Replacement 71,000
Clean Air Distribution System 187,000
Renovation
Seal/Repair Parking Lot 28,000 34,000
Resurface Outdoor Courts 23,000
Replace Carpet (All Areas) 74,000
Paint PE Pavilion 37,000
Paint Interior 223,000
Paint Int Ext Doors & Frames 74,000
Paint Ext/Repl Expansion Joints 183,000
6-104104
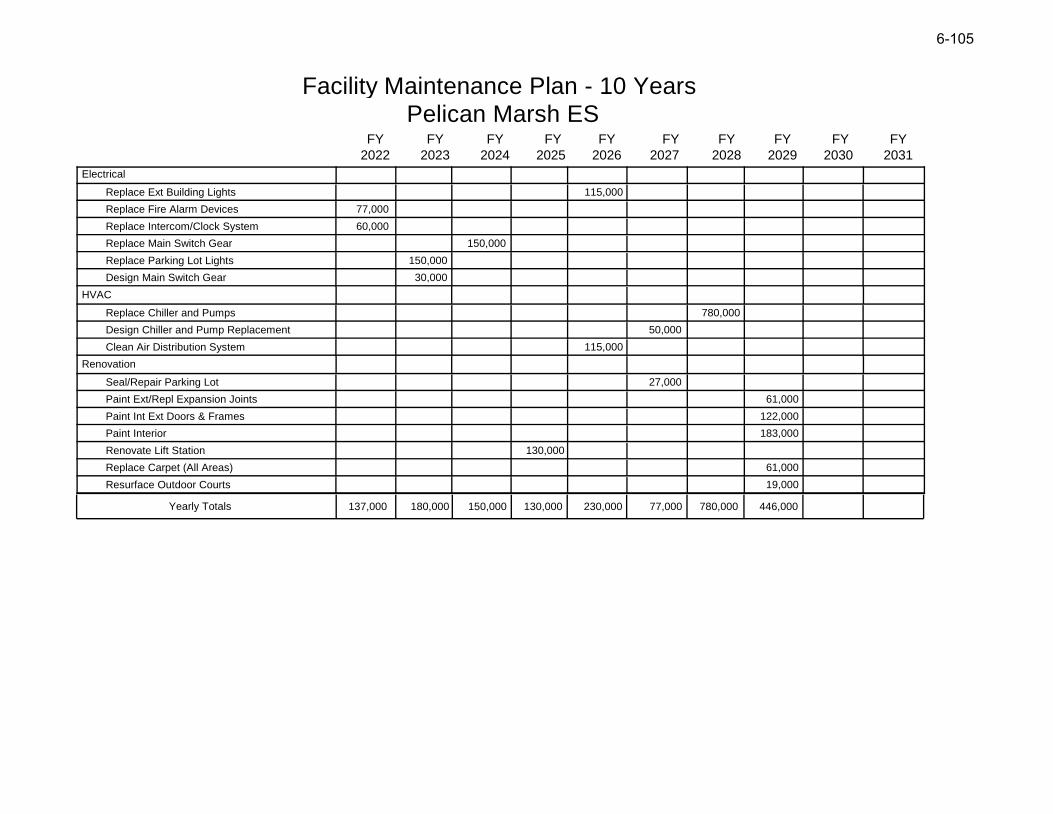
Facility Maintenance Plan - 10 Years Pelican Marsh ES
2022 2023 2024 2025 2026
FY FY FY FY FY
2027 2028 2029 2030 2031
FY FY FY FY FY
137,000 180,000 150,000 130,000 230,000 77,000 780,000 446,000Yearly Totals
Electrical
Replace Ext Building Lights 115,000
Replace Fire Alarm Devices 77,000
Replace Intercom/Clock System 60,000
Replace Main Switch Gear 150,000
Replace Parking Lot Lights 150,000
Design Main Switch Gear 30,000
HVAC
Replace Chiller and Pumps 780,000
Design Chiller and Pump Replacement 50,000
Clean Air Distribution System 115,000
Renovation
Seal/Repair Parking Lot 27,000
Paint Ext/Repl Expansion Joints 61,000
Paint Int Ext Doors & Frames 122,000
Paint Interior 183,000
Renovate Lift Station 130,000
Replace Carpet (All Areas) 61,000
Resurface Outdoor Courts 19,000
6-1055
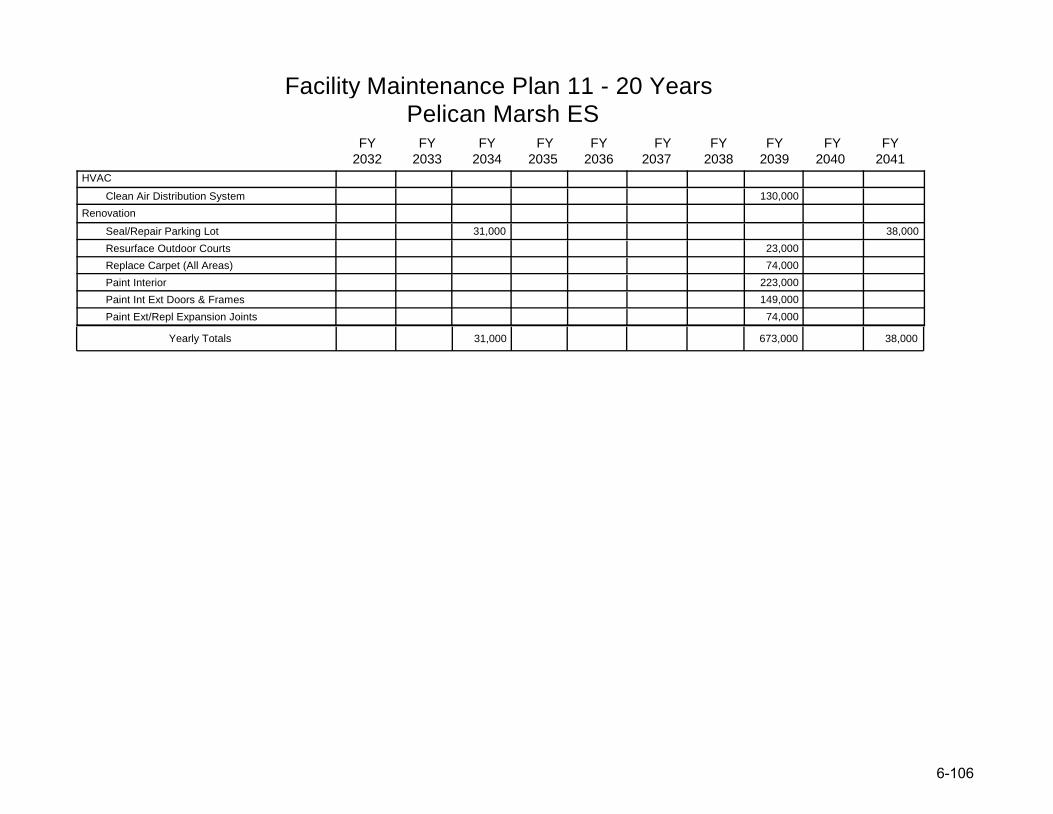
Facility Maintenance Plan 11 - 20 Years Pelican Marsh ES
2032 2033 2034 2035 2036
FY FY FY FY FY
2037 2038 2039 2040 2041
FY FY FY FY FY
31,000 673,000 38,000Yearly Totals
HVAC
Clean Air Distribution System 130,000
Renovation
Seal/Repair Parking Lot 31,000 38,000
Resurface Outdoor Courts 23,000
Replace Carpet (All Areas) 74,000
Paint Interior 223,000
Paint Int Ext Doors & Frames 149,000
Paint Ext/Repl Expansion Joints 74,000
6-106106
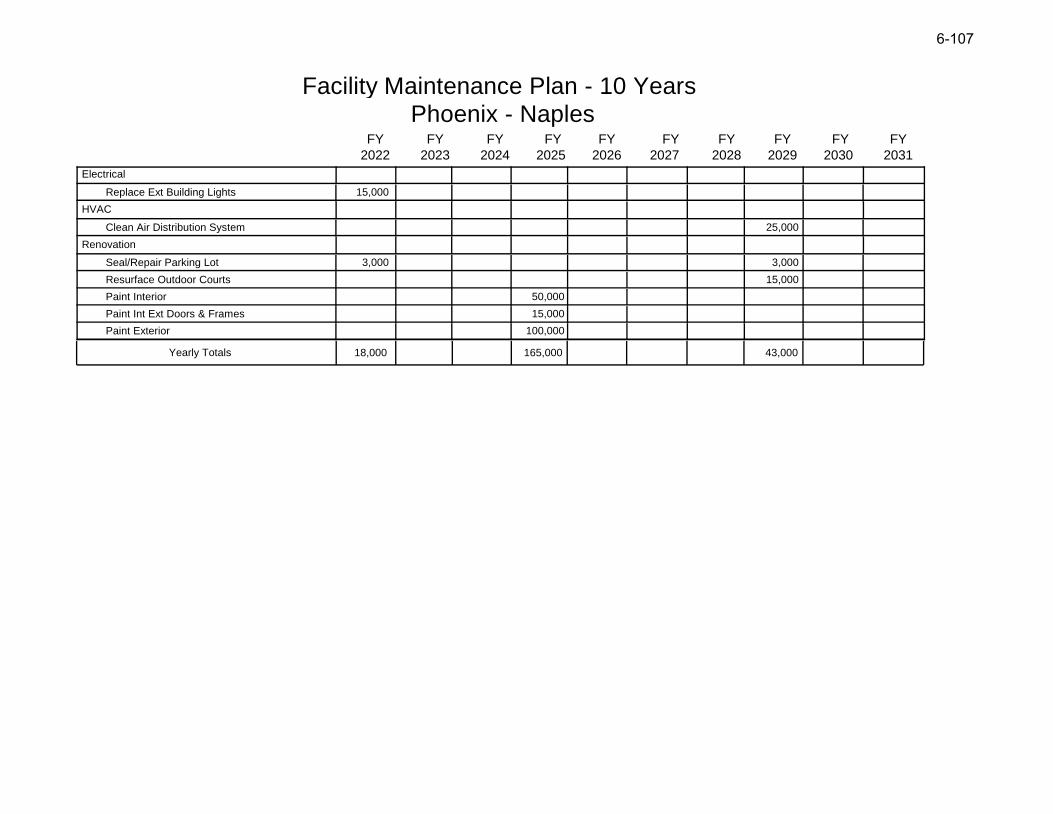
Facility Maintenance Plan - 10 Years Phoenix - Naples
2022 2023 2024 2025 2026
FY FY FY FY FY
2027 2028 2029 2030 2031
FY FY FY FY FY
18,000 165,000 43,000Yearly Totals
Electrical
Replace Ext Building Lights 15,000
HVAC
Clean Air Distribution System 25,000
Renovation
Seal/Repair Parking Lot 3,000 3,000
Resurface Outdoor Courts 15,000
Paint Interior 50,000
Paint Int Ext Doors & Frames 15,000
Paint Exterior 100,000
6-107
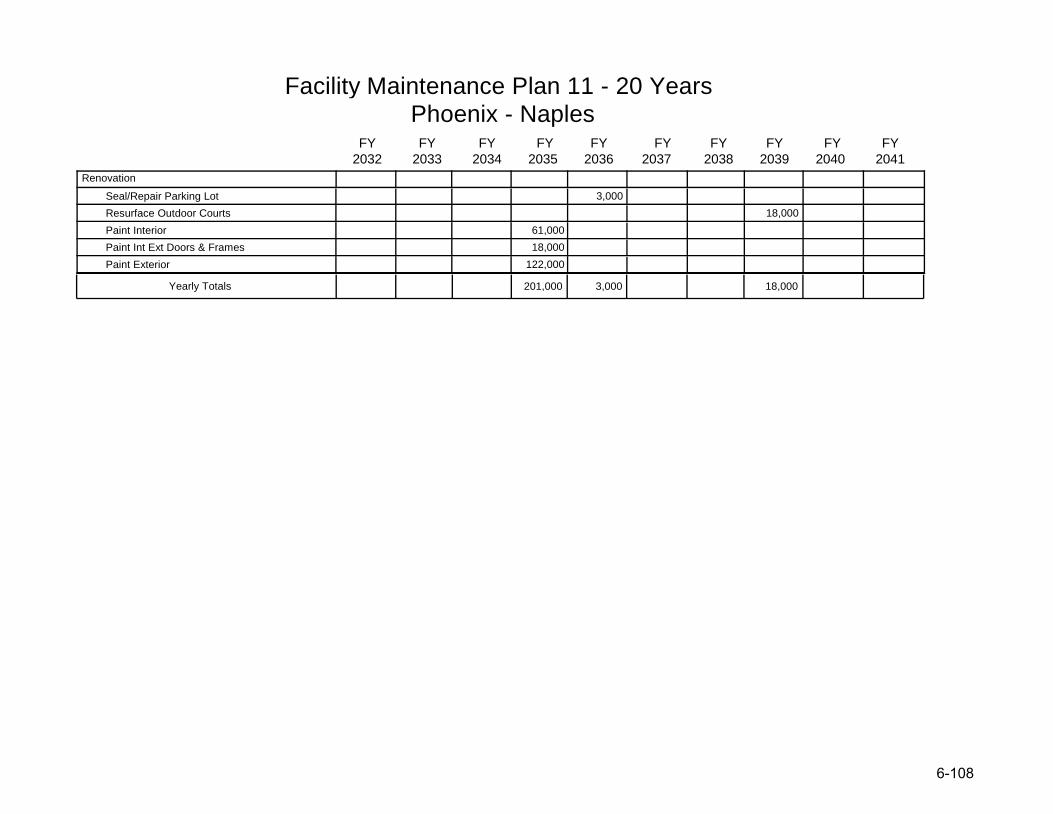
Facility Maintenance Plan 11 - 20 Years Phoenix - Naples
2032 2033 2034 2035 2036
FY FY FY FY FY
2037 2038 2039 2040 2041
FY FY FY FY FY
201,000 3,000 18,000Yearly Totals
Renovation
Seal/Repair Parking Lot 3,000
Resurface Outdoor Courts 18,000
Paint Interior 61,000
Paint Int Ext Doors & Frames 18,000
Paint Exterior 122,000
6-108108
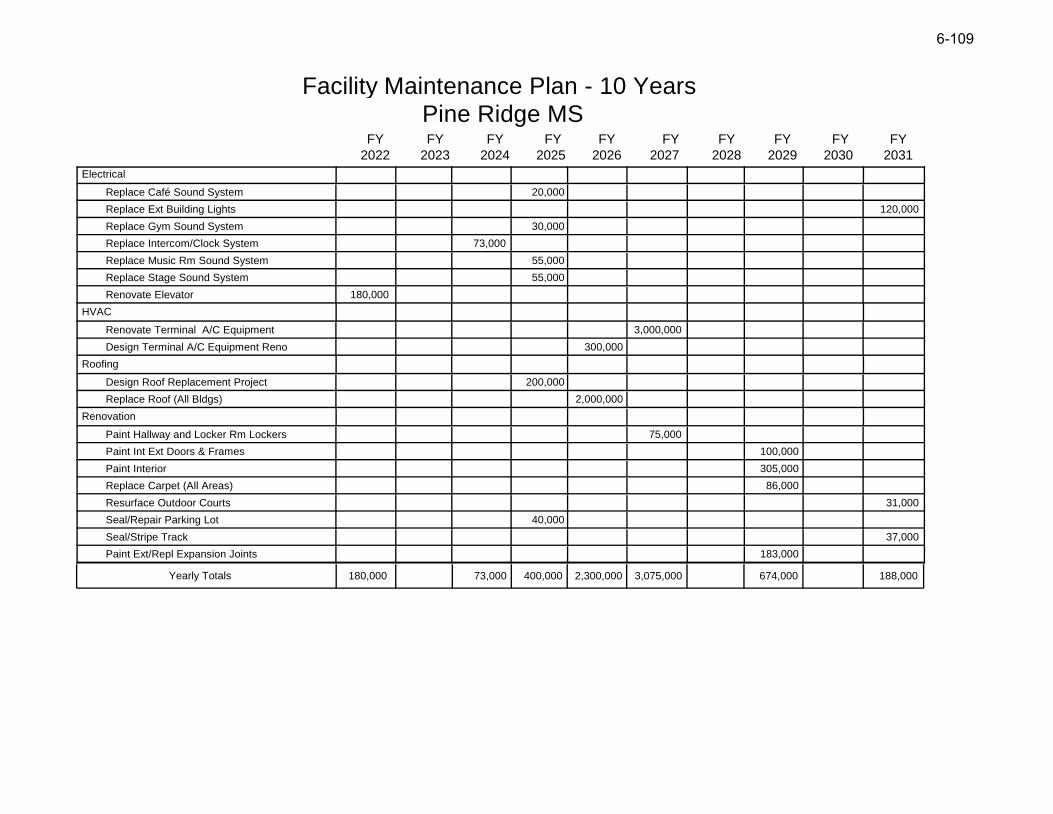
Facility Maintenance Plan - 10 Years Pine Ridge MS
2022 2023 2024 2025 2026
FY FY FY FY FY
2027 2028 2029 2030 2031
FY FY FY FY FY
180,000 73,000 400,000 2,300,000 3,075,000 674,000 188,000Yearly Totals
Electrical
Replace Café Sound System 20,000
Replace Ext Building Lights 120,000
Replace Gym Sound System 30,000
Replace Intercom/Clock System 73,000
Replace Music Rm Sound System 55,000
Replace Stage Sound System 55,000
Renovate Elevator 180,000
HVAC
Renovate Terminal A/C Equipment 3,000,000
Design Terminal A/C Equipment Reno 300,000
Roofing
Design Roof Replacement Project 200,000
Replace Roof (All Bldgs) 2,000,000
Renovation
Paint Hallway and Locker Rm Lockers 75,000
Paint Int Ext Doors & Frames 100,000
Paint Interior 305,000
Replace Carpet (All Areas) 86,000
Resurface Outdoor Courts 31,000
Seal/Repair Parking Lot 40,000
Seal/Stripe Track 37,000
Paint Ext/Repl Expansion Joints 183,000
6-10909
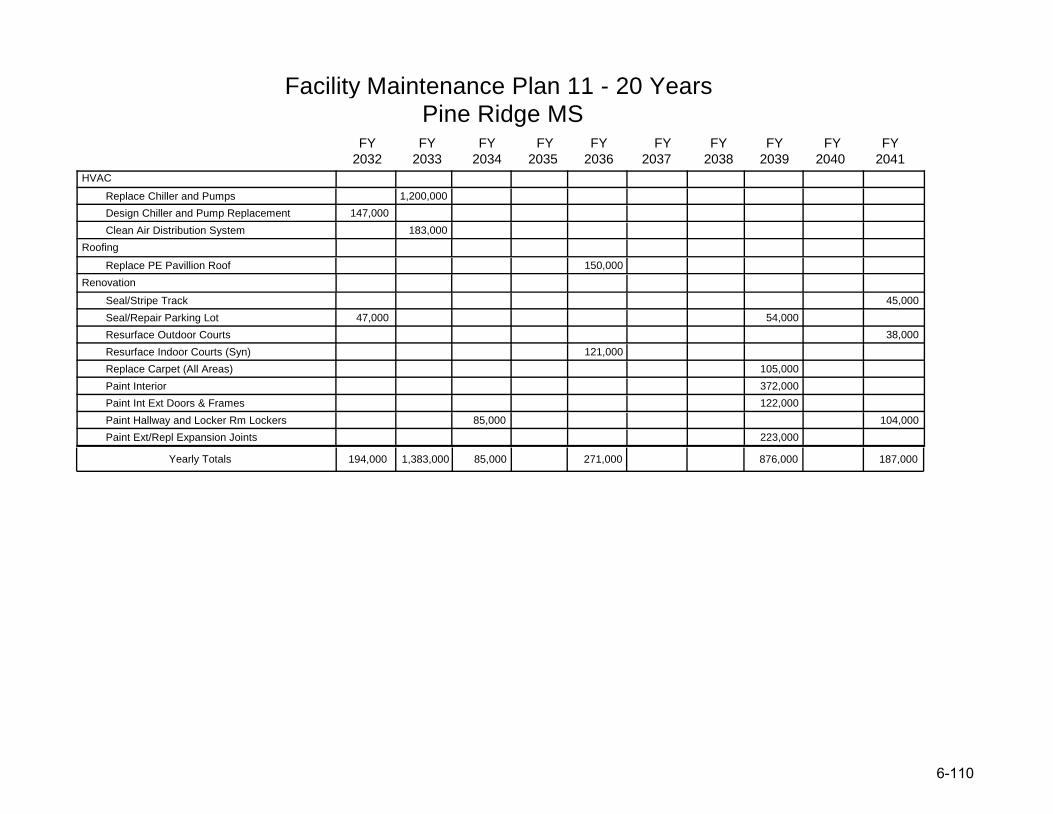
Facility Maintenance Plan 11 - 20 Years Pine Ridge MS
2032 2033 2034 2035 2036
FY FY FY FY FY
2037 2038 2039 2040 2041
FY FY FY FY FY
194,000 1,383,000 85,000 271,000 876,000 187,000Yearly Totals
HVAC
Replace Chiller and Pumps 1,200,000
Design Chiller and Pump Replacement 147,000
Clean Air Distribution System 183,000
Roofing
Replace PE Pavillion Roof 150,000
Renovation
Seal/Stripe Track 45,000
Seal/Repair Parking Lot 47,000 54,000
Resurface Outdoor Courts 38,000
Resurface Indoor Courts (Syn) 121,000
Replace Carpet (All Areas) 105,000
Paint Interior 372,000
Paint Int Ext Doors & Frames 122,000
Paint Hallway and Locker Rm Lockers 85,000 104,000
Paint Ext/Repl Expansion Joints 223,000
6-110110
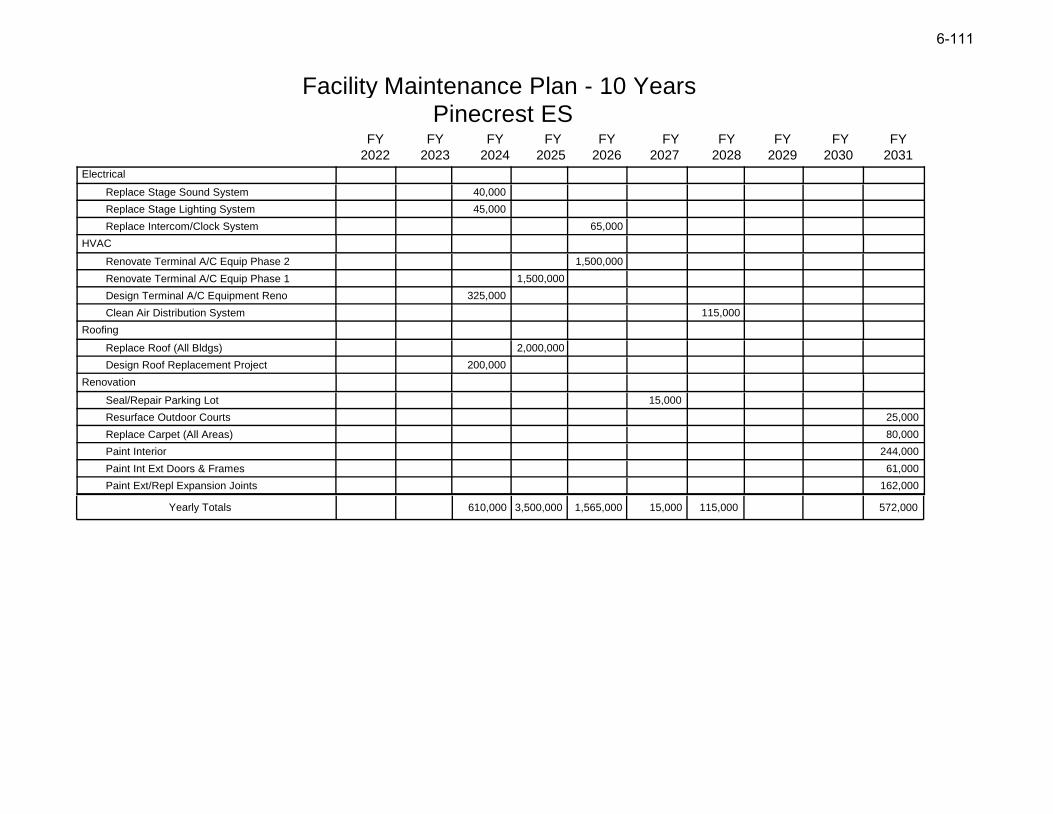
Facility Maintenance Plan - 10 Years Pinecrest ES
2022 2023 2024 2025 2026
FY FY FY FY FY
2027 2028 2029 2030 2031
FY FY FY FY FY
610,000 3,500,000 1,565,000 15,000 115,000 572,000Yearly Totals
Electrical
Replace Stage Sound System 40,000
Replace Stage Lighting System 45,000
Replace Intercom/Clock System 65,000
HVAC
Renovate Terminal A/C Equip Phase 2 1,500,000
Renovate Terminal A/C Equip Phase 1 1,500,000
Design Terminal A/C Equipment Reno 325,000
Clean Air Distribution System 115,000
Roofing
Replace Roof (All Bldgs) 2,000,000
Design Roof Replacement Project 200,000
Renovation
Seal/Repair Parking Lot 15,000
Resurface Outdoor Courts 25,000
Replace Carpet (All Areas) 80,000
Paint Interior 244,000
Paint Int Ext Doors & Frames 61,000
Paint Ext/Repl Expansion Joints 162,000
6-11111
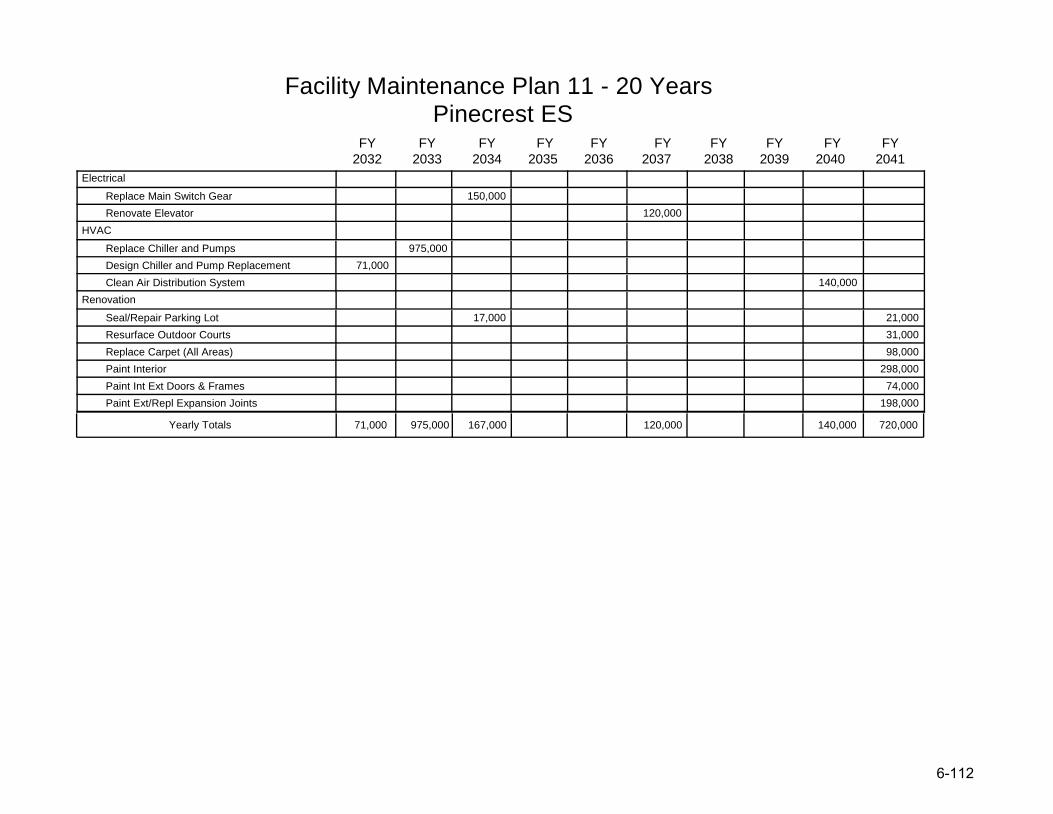
Facility Maintenance Plan 11 - 20 Years Pinecrest ES
2032 2033 2034 2035 2036
FY FY FY FY FY
2037 2038 2039 2040 2041
FY FY FY FY FY
71,000 975,000 167,000 120,000 140,000 720,000Yearly Totals
Electrical
Replace Main Switch Gear 150,000
Renovate Elevator 120,000
HVAC
Replace Chiller and Pumps 975,000
Design Chiller and Pump Replacement 71,000
Clean Air Distribution System 140,000
Renovation
Seal/Repair Parking Lot 17,000 21,000
Resurface Outdoor Courts 31,000
Replace Carpet (All Areas) 98,000
Paint Interior 298,000
Paint Int Ext Doors & Frames 74,000
Paint Ext/Repl Expansion Joints 198,000
6-112
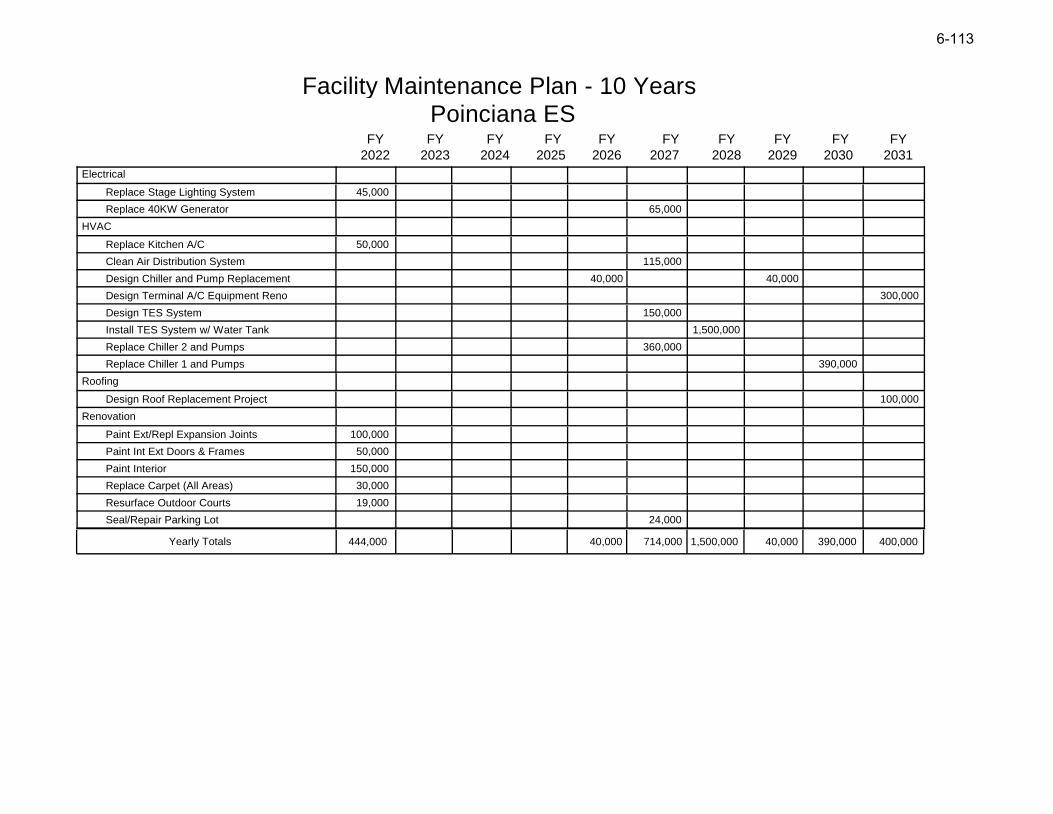
Facility Maintenance Plan - 10 Years Poinciana ES
2022 2023 2024 2025 2026
FY FY FY FY FY
2027 2028 2029 2030 2031
FY FY FY FY FY
444,000 40,000 714,000 1,500,000 40,000 390,000 400,000Yearly Totals
Electrical
Replace Stage Lighting System 45,000
Replace 40KW Generator 65,000
HVAC
Replace Kitchen A/C 50,000
Clean Air Distribution System 115,000
Design Chiller and Pump Replacement 40,000 40,000
Design Terminal A/C Equipment Reno 300,000
Design TES System 150,000
Install TES System w/ Water Tank 1,500,000
Replace Chiller 2 and Pumps 360,000
Replace Chiller 1 and Pumps 390,000
Roofing
Design Roof Replacement Project 100,000
Renovation
Paint Ext/Repl Expansion Joints 100,000
Paint Int Ext Doors & Frames 50,000
Paint Interior 150,000
Replace Carpet (All Areas) 30,000
Resurface Outdoor Courts 19,000
Seal/Repair Parking Lot 24,000
6-113
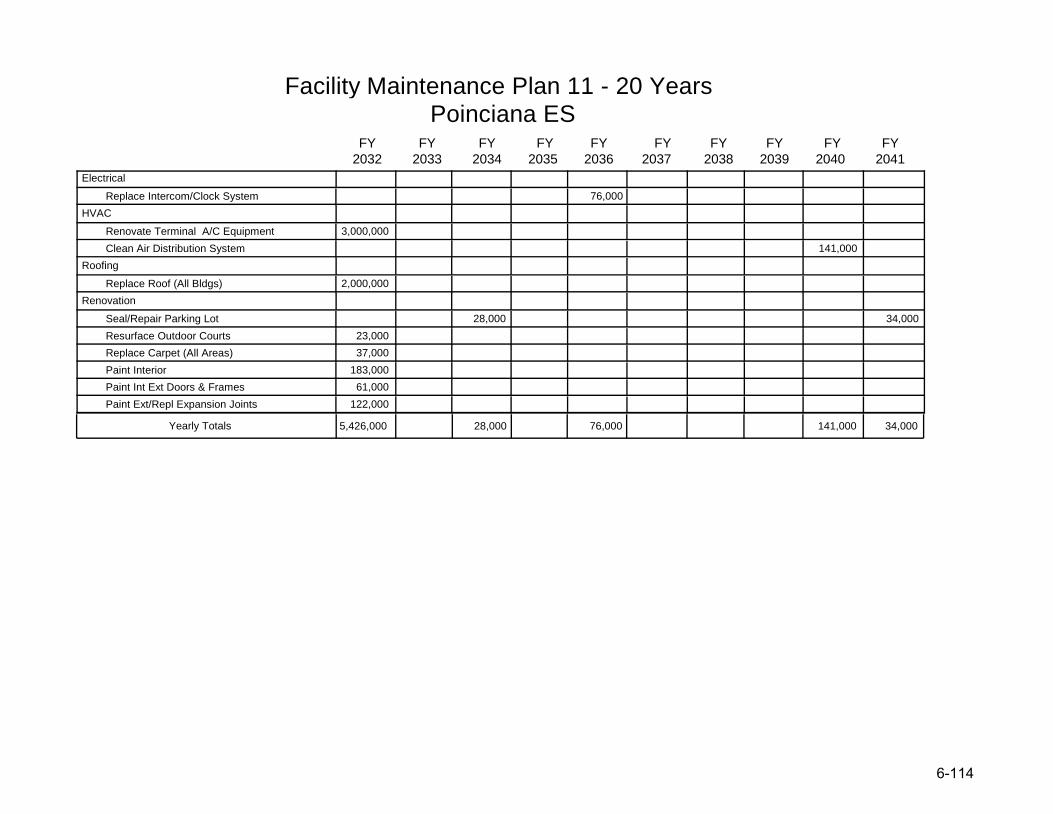
Facility Maintenance Plan 11 - 20 Years Poinciana ES
2032 2033 2034 2035 2036
FY FY FY FY FY
2037 2038 2039 2040 2041
FY FY FY FY FY
5,426,000 28,000 76,000 141,000 34,000Yearly Totals
Electrical
Replace Intercom/Clock System 76,000
HVAC
Renovate Terminal A/C Equipment 3,000,000
Clean Air Distribution System 141,000
Roofing
Replace Roof (All Bldgs) 2,000,000
Renovation
Seal/Repair Parking Lot 28,000 34,000
Resurface Outdoor Courts 23,000
Replace Carpet (All Areas) 37,000
Paint Interior 183,000
Paint Int Ext Doors & Frames 61,000
Paint Ext/Repl Expansion Joints 122,000
6-114
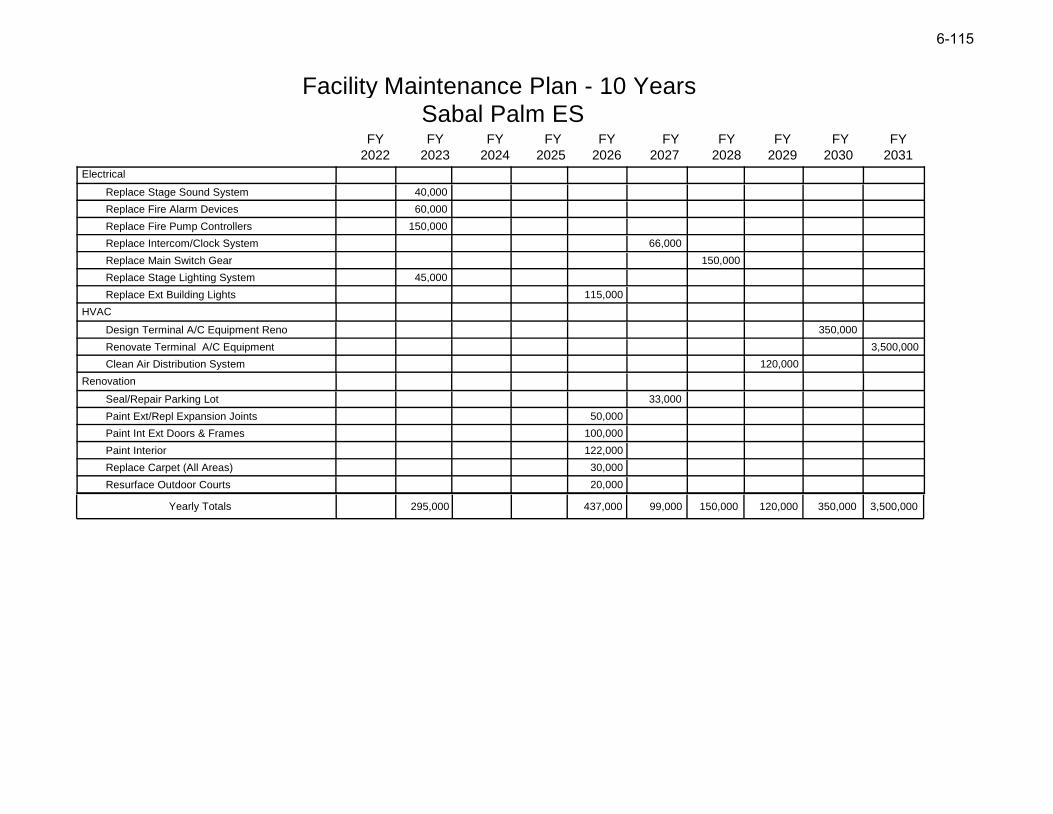
Facility Maintenance Plan - 10 Years Sabal Palm ES
2022 2023 2024 2025 2026
FY FY FY FY FY
2027 2028 2029 2030 2031
FY FY FY FY FY
295,000 437,000 99,000 150,000 120,000 350,000 3,500,000Yearly Totals
Electrical
Replace Stage Sound System 40,000
Replace Fire Alarm Devices 60,000
Replace Fire Pump Controllers 150,000
Replace Intercom/Clock System 66,000
Replace Main Switch Gear 150,000
Replace Stage Lighting System 45,000
Replace Ext Building Lights 115,000
HVAC
Design Terminal A/C Equipment Reno 350,000
Renovate Terminal A/C Equipment 3,500,000
Clean Air Distribution System 120,000
Renovation
Seal/Repair Parking Lot 33,000
Paint Ext/Repl Expansion Joints 50,000
Paint Int Ext Doors & Frames 100,000
Paint Interior 122,000
Replace Carpet (All Areas) 30,000
Resurface Outdoor Courts 20,000
6-11515
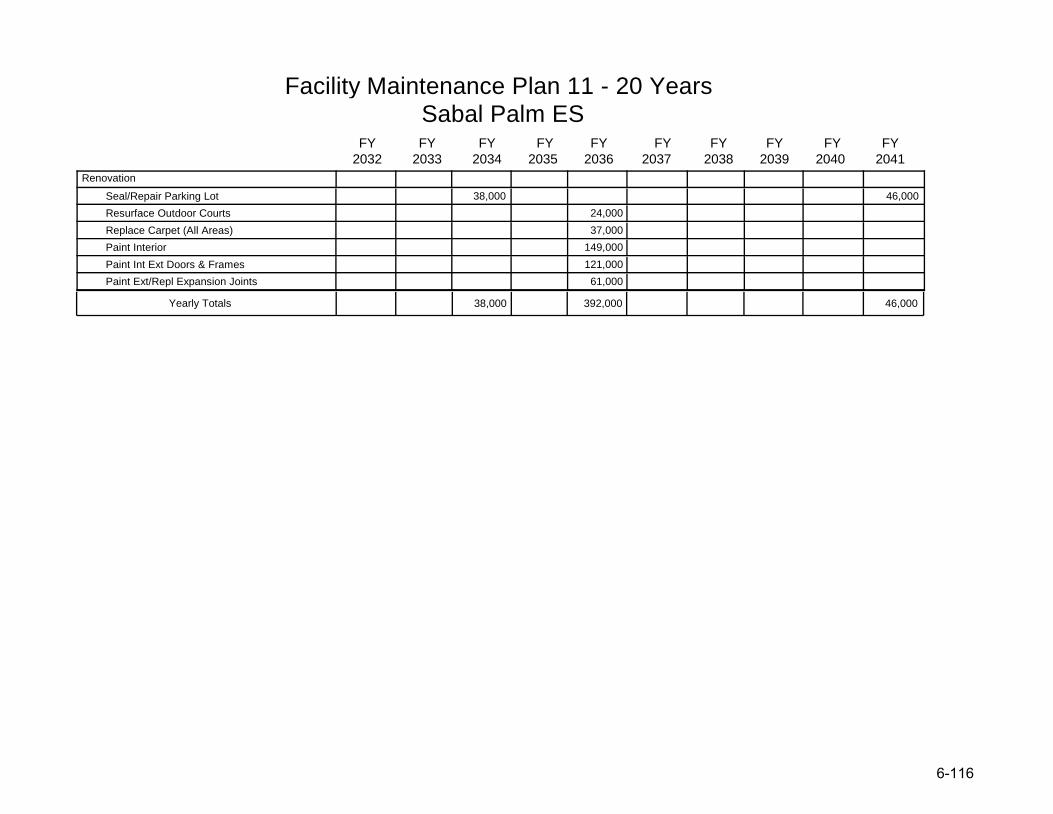
Facility Maintenance Plan 11 - 20 Years Sabal Palm ES
2032 2033 2034 2035 2036
FY FY FY FY FY
2037 2038 2039 2040 2041
FY FY FY FY FY
38,000 392,000 46,000Yearly Totals
Renovation
Seal/Repair Parking Lot 38,000 46,000
Resurface Outdoor Courts 24,000
Replace Carpet (All Areas) 37,000
Paint Interior 149,000
Paint Int Ext Doors & Frames 121,000
Paint Ext/Repl Expansion Joints 61,000
6-116116
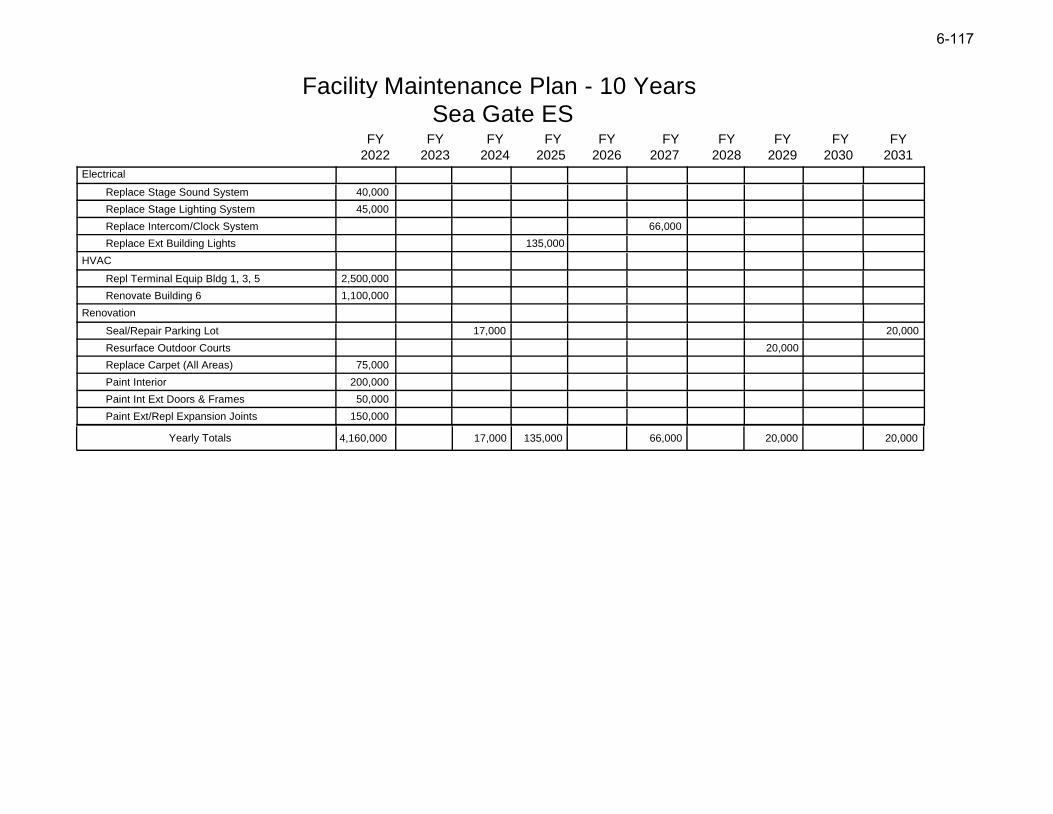
Facility Maintenance Plan - 10 Years Sea Gate ES
2022 2023 2024 2025 2026
FY FY FY FY FY
2027 2028 2029 2030 2031
FY FY FY FY FY
4,160,000 17,000 135,000 66,000 20,000 20,000Yearly Totals
Electrical
Replace Stage Sound System 40,000
Replace Stage Lighting System 45,000
Replace Intercom/Clock System 66,000
Replace Ext Building Lights 135,000
HVAC
Repl Terminal Equip Bldg 1, 3, 5 2,500,000
Renovate Building 6 1,100,000
Renovation
Seal/Repair Parking Lot 17,000 20,000
Resurface Outdoor Courts 20,000
Replace Carpet (All Areas) 75,000
Paint Interior 200,000
Paint Int Ext Doors & Frames 50,000
Paint Ext/Repl Expansion Joints 150,000
6-117
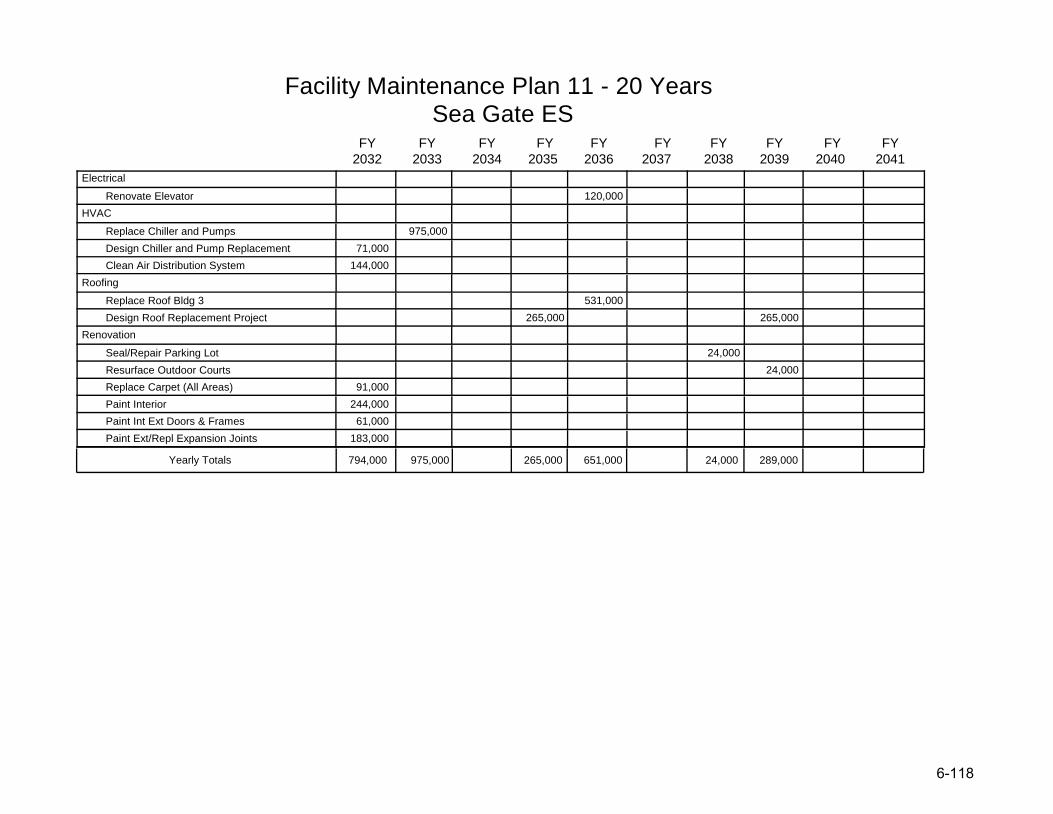
Facility Maintenance Plan 11 - 20 Years Sea Gate ES
2032 2033 2034 2035 2036
FY FY FY FY FY
2037 2038 2039 2040 2041
FY FY FY FY FY
794,000 975,000 265,000 651,000 24,000 289,000Yearly Totals
Electrical
Renovate Elevator 120,000
HVAC
Replace Chiller and Pumps 975,000
Design Chiller and Pump Replacement 71,000
Clean Air Distribution System 144,000
Roofing
Replace Roof Bldg 3 531,000
Design Roof Replacement Project 265,000 265,000
Renovation
Seal/Repair Parking Lot 24,000
Resurface Outdoor Courts 24,000
Replace Carpet (All Areas) 91,000
Paint Interior 244,000
Paint Int Ext Doors & Frames 61,000
Paint Ext/Repl Expansion Joints 183,000
6-118118
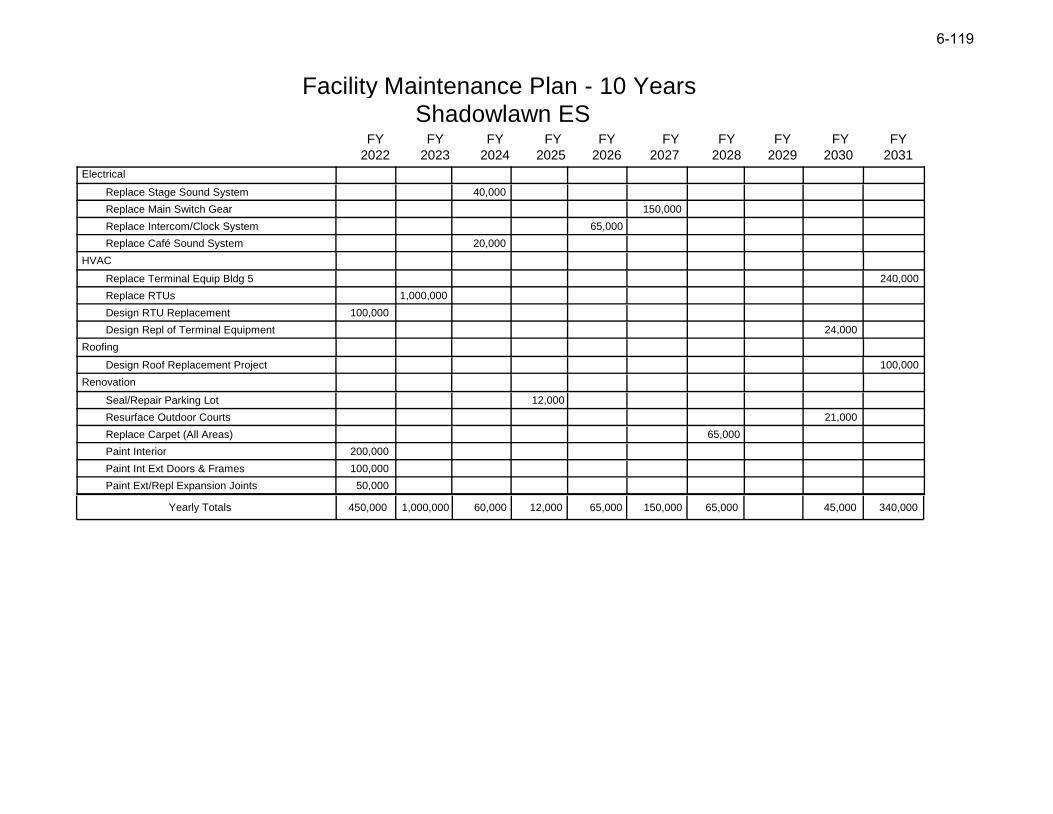
Facility Maintenance Plan - 10 Years Shadowlawn ES
2022 2023 2024 2025 2026
FY FY FY FY FY
2027 2028 2029 2030 2031
FY FY FY FY FY
450,000 1,000,000 60,000 12,000 65,000 150,000 65,000 45,000 340,000Yearly Totals
Electrical
Replace Stage Sound System 40,000
Replace Main Switch Gear 150,000
Replace Intercom/Clock System 65,000
Replace Café Sound System 20,000
HVAC
Replace Terminal Equip Bldg 5 240,000
Replace RTUs 1,000,000
Design RTU Replacement 100,000
Design Repl of Terminal Equipment 24,000
Roofing
Design Roof Replacement Project 100,000
Renovation
Seal/Repair Parking Lot 12,000
Resurface Outdoor Courts 21,000
Replace Carpet (All Areas) 65,000
Paint Interior 200,000
Paint Int Ext Doors & Frames 100,000
Paint Ext/Repl Expansion Joints 50,000
6-11919
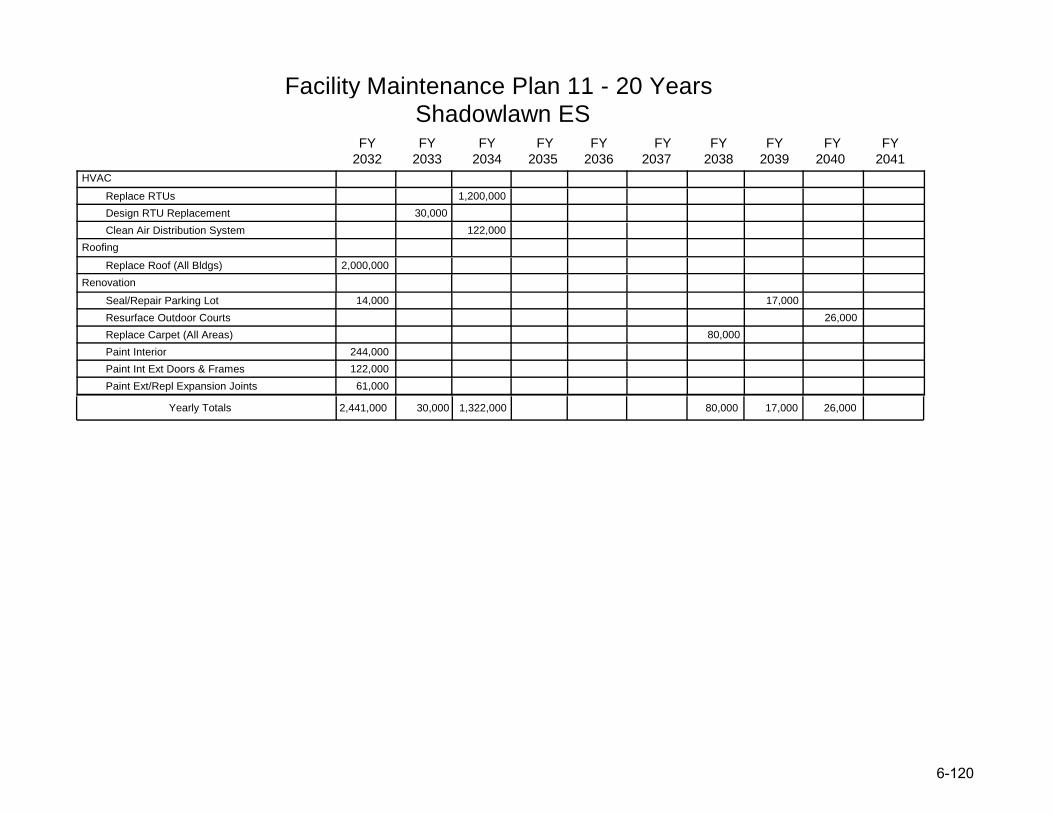
Facility Maintenance Plan 11 - 20 Years Shadowlawn ES
2032 2033 2034 2035 2036
FY FY FY FY FY
2037 2038 2039 2040 2041
FY FY FY FY FY
2,441,000 30,000 1,322,000 80,000 17,000 26,000Yearly Totals
HVAC
Replace RTUs 1,200,000
Design RTU Replacement 30,000
Clean Air Distribution System 122,000
Roofing
Replace Roof (All Bldgs) 2,000,000
Renovation
Seal/Repair Parking Lot 14,000 17,000
Resurface Outdoor Courts 26,000
Replace Carpet (All Areas) 80,000
Paint Interior 244,000
Paint Int Ext Doors & Frames 122,000
Paint Ext/Repl Expansion Joints 61,000
6-1200
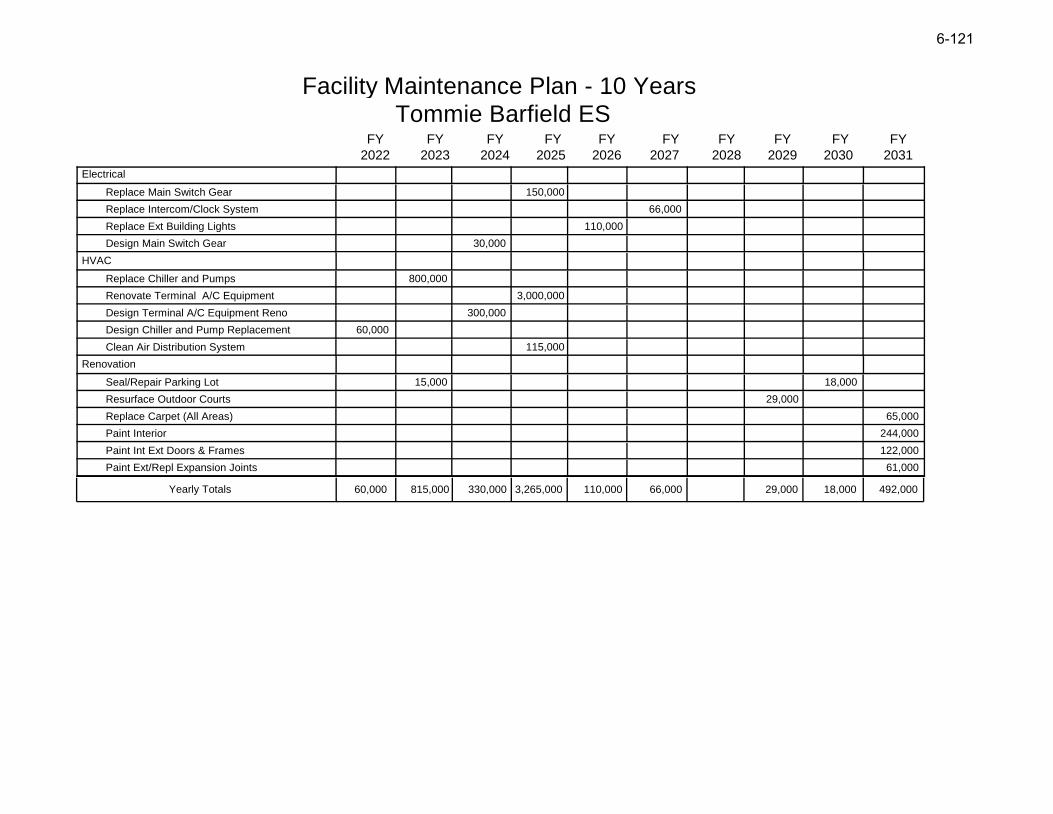
Facility Maintenance Plan - 10 Years Tommie Barfield ES
2022 2023 2024 2025 2026
FY FY FY FY FY
2027 2028 2029 2030 2031
FY FY FY FY FY
60,000 815,000 330,000 3,265,000 110,000 66,000 29,000 18,000 492,000Yearly Totals
Electrical
Replace Main Switch Gear 150,000
Replace Intercom/Clock System 66,000
Replace Ext Building Lights 110,000
Design Main Switch Gear 30,000
HVAC
Replace Chiller and Pumps 800,000
Renovate Terminal A/C Equipment 3,000,000
Design Terminal A/C Equipment Reno 300,000
Design Chiller and Pump Replacement 60,000
Clean Air Distribution System 115,000
Renovation
Seal/Repair Parking Lot 15,000 18,000
Resurface Outdoor Courts 29,000
Replace Carpet (All Areas) 65,000
Paint Interior 244,000
Paint Int Ext Doors & Frames 122,000
Paint Ext/Repl Expansion Joints 61,000
6-121
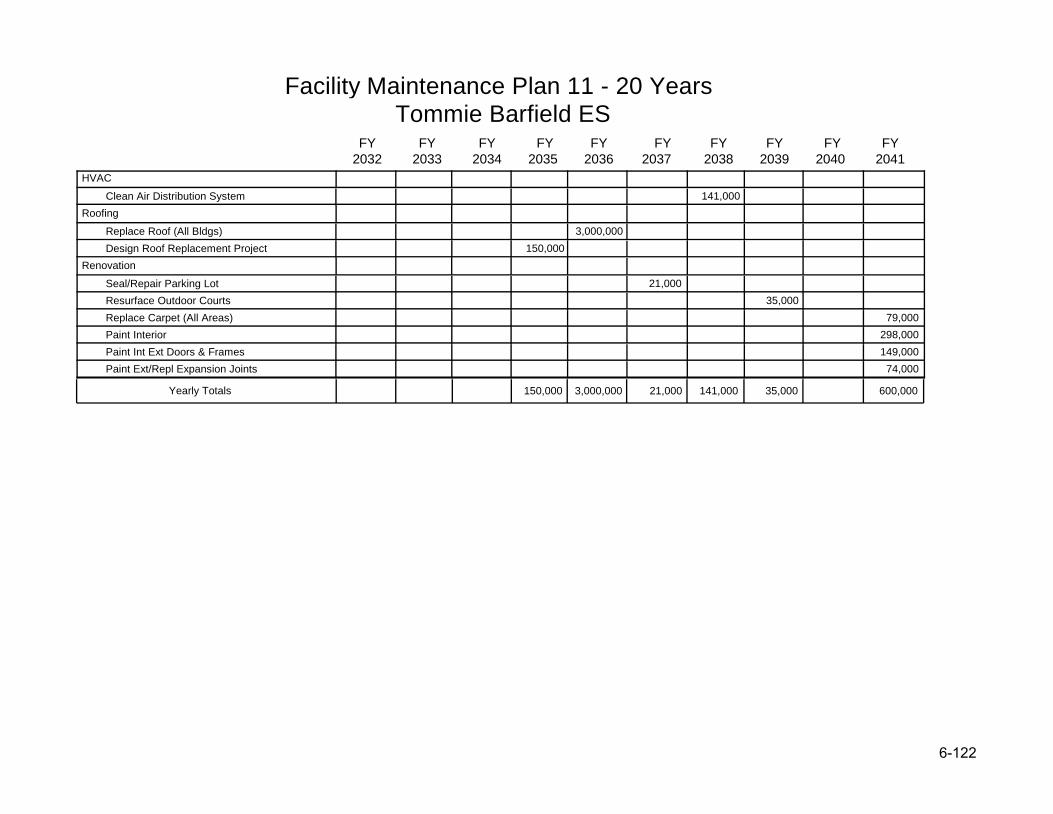
Facility Maintenance Plan 11 - 20 Years Tommie Barfield ES
2032 2033 2034 2035 2036
FY FY FY FY FY
2037 2038 2039 2040 2041
FY FY FY FY FY
150,000 3,000,000 21,000 141,000 35,000 600,000Yearly Totals
HVAC
Clean Air Distribution System 141,000
Roofing
Replace Roof (All Bldgs) 3,000,000
Design Roof Replacement Project 150,000
Renovation
Seal/Repair Parking Lot 21,000
Resurface Outdoor Courts 35,000
Replace Carpet (All Areas) 79,000
Paint Interior 298,000
Paint Int Ext Doors & Frames 149,000
Paint Ext/Repl Expansion Joints 74,000
6-122
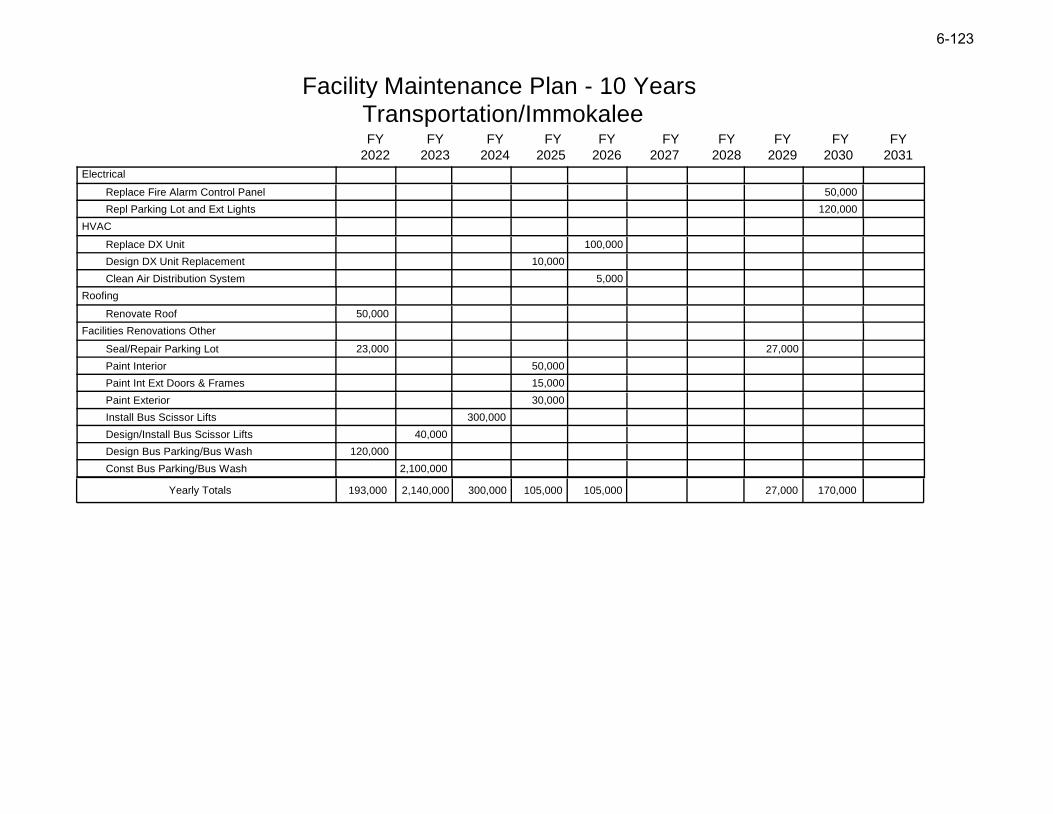
Facility Maintenance Plan - 10 Years Transportation/Immokalee
2022 2023 2024 2025 2026
FY FY FY FY FY
2027 2028 2029 2030 2031
FY FY FY FY FY
193,000 2,140,000 300,000 105,000 105,000 27,000 170,000Yearly Totals
Electrical
Replace Fire Alarm Control Panel 50,000
Repl Parking Lot and Ext Lights 120,000
HVAC
Replace DX Unit 100,000
Design DX Unit Replacement 10,000
Clean Air Distribution System 5,000
Roofing
Renovate Roof 50,000
Facilities Renovations Other
Seal/Repair Parking Lot 23,000 27,000
Paint Interior 50,000
Paint Int Ext Doors & Frames 15,000
Paint Exterior 30,000
Install Bus Scissor Lifts 300,000
Design/Install Bus Scissor Lifts 40,000
Design Bus Parking/Bus Wash 120,000
Const Bus Parking/Bus Wash 2,100,000
6-123

Facility Maintenance Plan 11 - 20 Years Transportation/Immokalee
2032 2033 2034 2035 2036
FY FY FY FY FY
2037 2038 2039 2040 2041
FY FY FY FY FY
116,000 31,000 67,000 6,000Yearly Totals
HVAC
Clean Air Distribution System 6,000
Roofing
Renovate Roof 67,000
Facilities Renovations Other
Seal/Repair Parking Lot 31,000
Paint Interior 61,000
Paint Int Ext Doors & Frames 18,000
Paint Exterior 37,000
6-1244
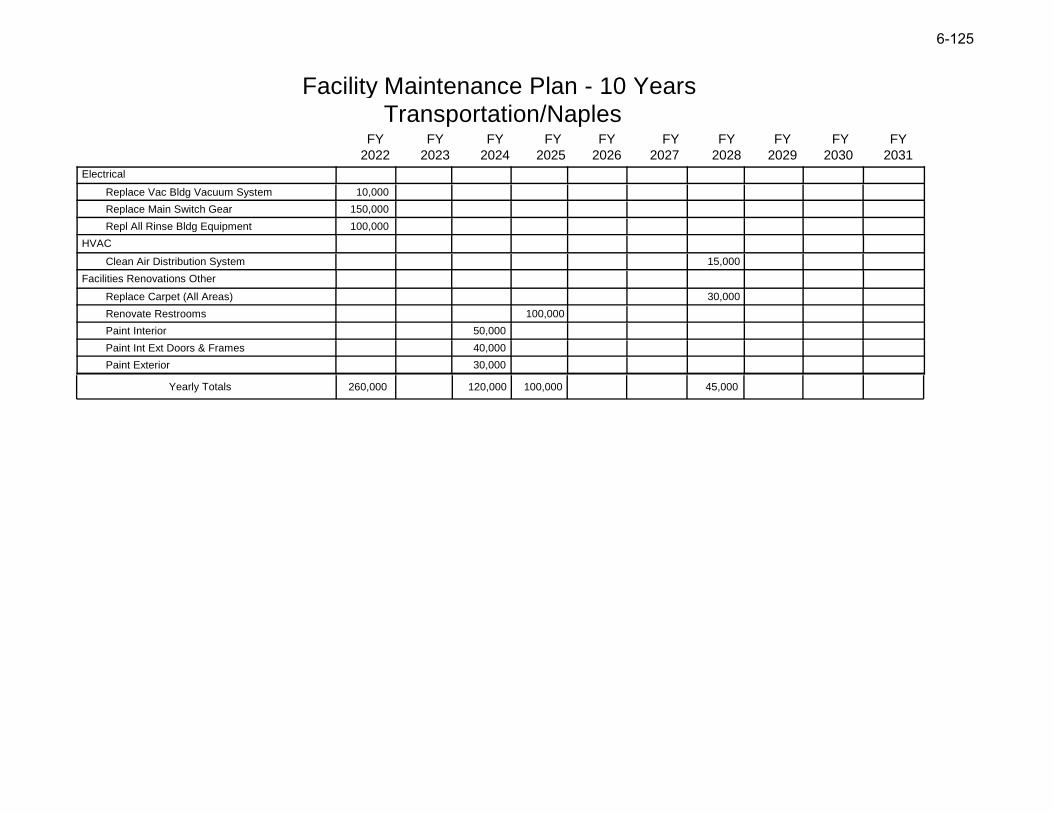
Facility Maintenance Plan - 10 Years Transportation/Naples
2022 2023 2024 2025 2026
FY FY FY FY FY
2027 2028 2029 2030 2031
FY FY FY FY FY
260,000 120,000 100,000 45,000Yearly Totals
Electrical
Replace Vac Bldg Vacuum System 10,000
Replace Main Switch Gear 150,000
Repl All Rinse Bldg Equipment 100,000
HVAC
Clean Air Distribution System 15,000
Facilities Renovations Other
Replace Carpet (All Areas) 30,000
Renovate Restrooms 100,000
Paint Interior 50,000
Paint Int Ext Doors & Frames 40,000
Paint Exterior 30,000
6-12525
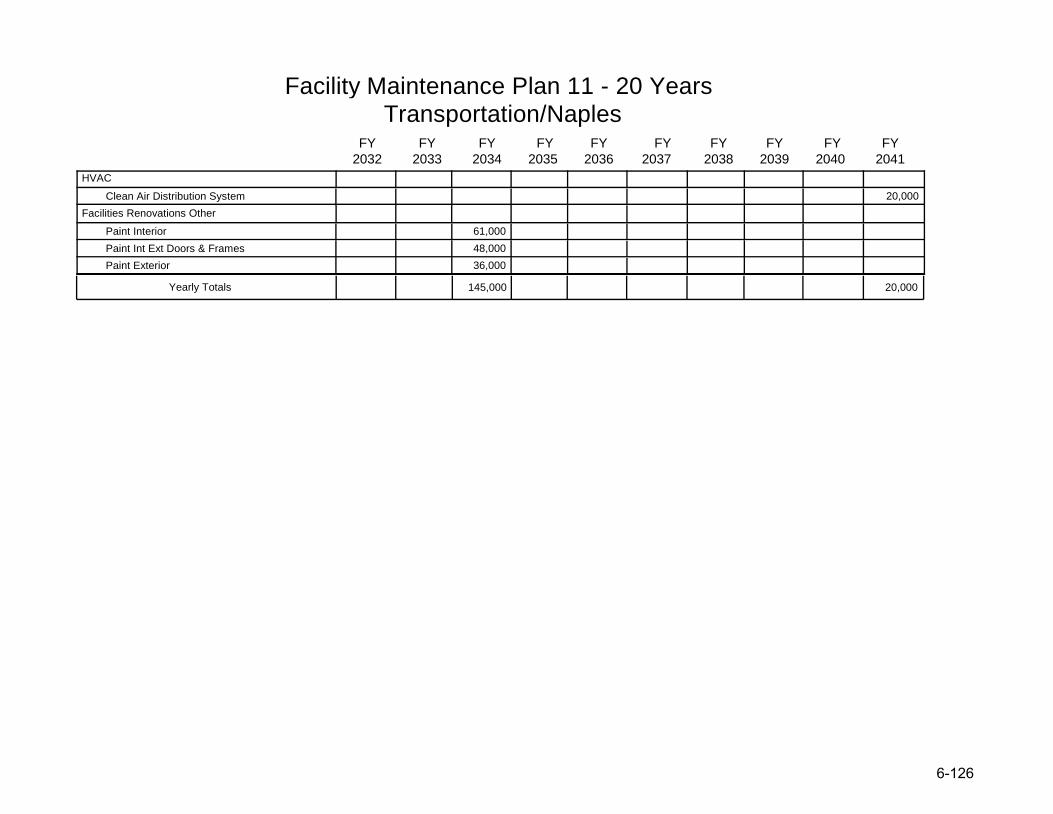
Facility Maintenance Plan 11 - 20 Years Transportation/Naples
2032 2033 2034 2035 2036
FY FY FY FY FY
2037 2038 2039 2040 2041
FY FY FY FY FY
145,000 20,000Yearly Totals
HVAC
Clean Air Distribution System 20,000
Facilities Renovations Other
Paint Interior 61,000
Paint Int Ext Doors & Frames 48,000
Paint Exterior 36,000
6-1266
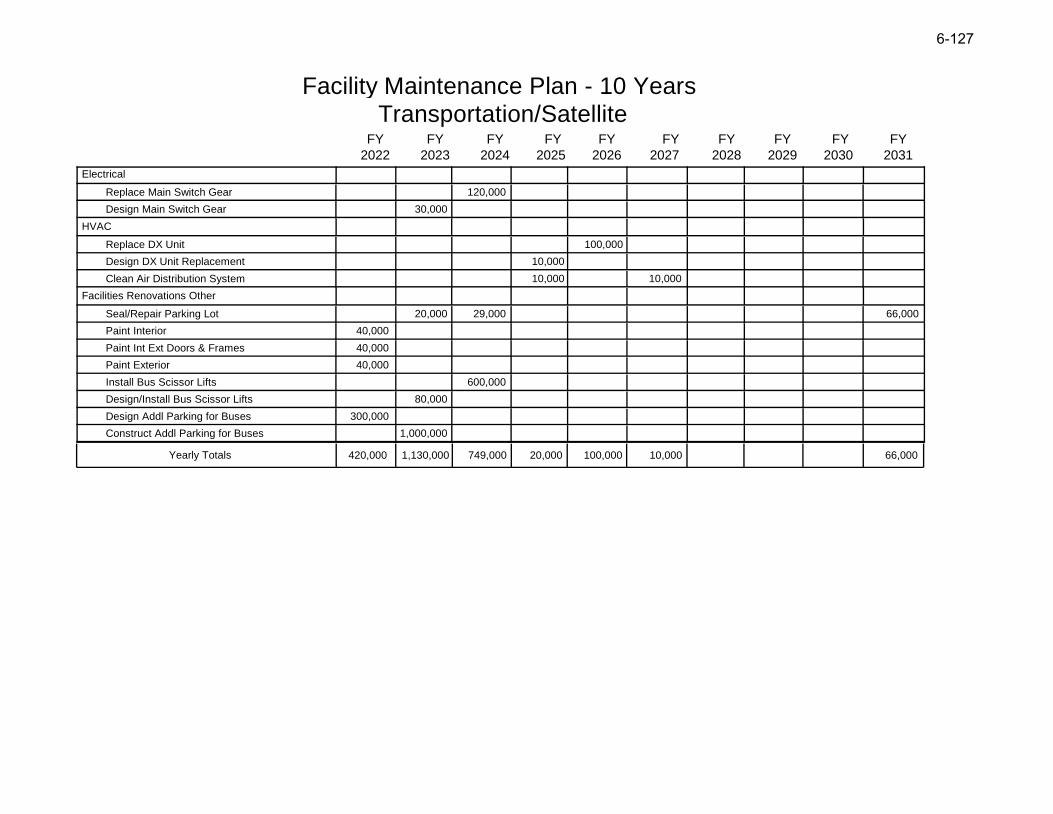
Facility Maintenance Plan - 10 Years Transportation/Satellite
2022 2023 2024 2025 2026
FY FY FY FY FY
2027 2028 2029 2030 2031
FY FY FY FY FY
420,000 1,130,000 749,000 20,000 100,000 10,000 66,000Yearly Totals
Electrical
Replace Main Switch Gear 120,000
Design Main Switch Gear 30,000
HVAC
Replace DX Unit 100,000
Design DX Unit Replacement 10,000
Clean Air Distribution System 10,000 10,000
Facilities Renovations Other
Seal/Repair Parking Lot 20,000 29,000 66,000
Paint Interior 40,000
Paint Int Ext Doors & Frames 40,000
Paint Exterior 40,000
Install Bus Scissor Lifts 600,000
Design/Install Bus Scissor Lifts 80,000
Design Addl Parking for Buses 300,000
Construct Addl Parking for Buses 1,000,000
6-127
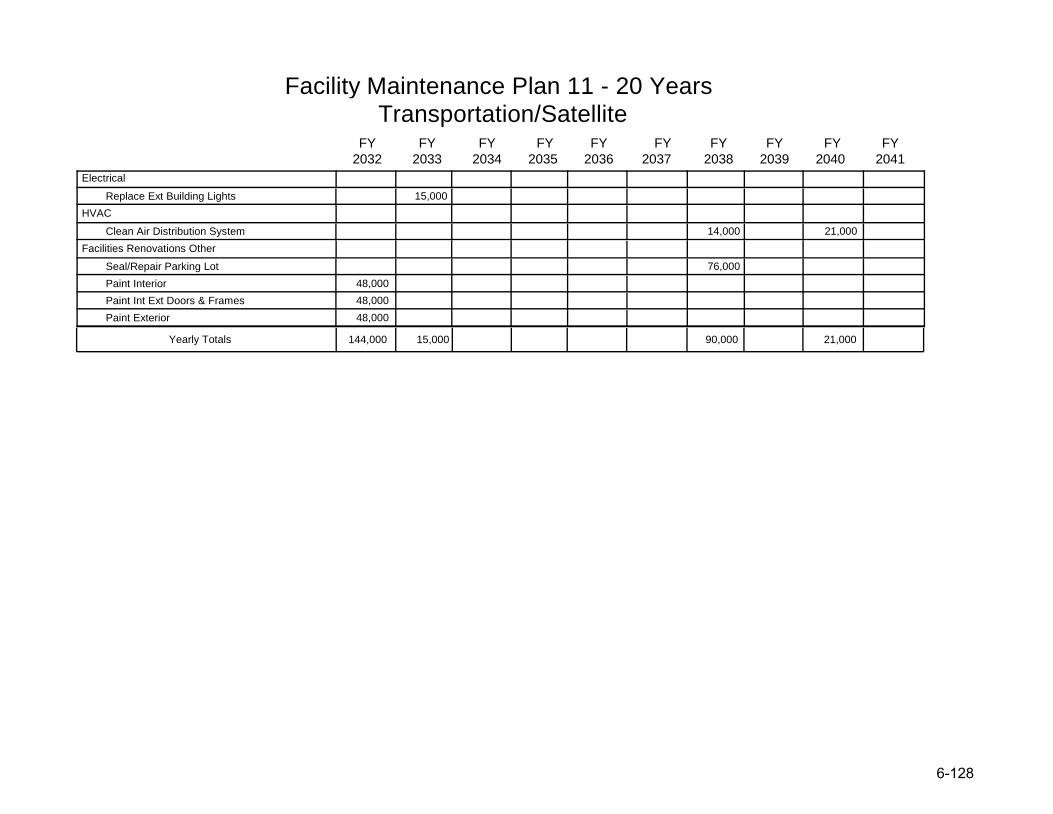
Facility Maintenance Plan 11 - 20 Years Transportation/Satellite
2032 2033 2034 2035 2036
FY FY FY FY FY
2037 2038 2039 2040 2041
FY FY FY FY FY
144,000 15,000 90,000 21,000Yearly Totals
Electrical
Replace Ext Building Lights 15,000
HVAC
Clean Air Distribution System 14,000 21,000
Facilities Renovations Other
Seal/Repair Parking Lot 76,000
Paint Interior 48,000
Paint Int Ext Doors & Frames 48,000
Paint Exterior 48,000
6-1288
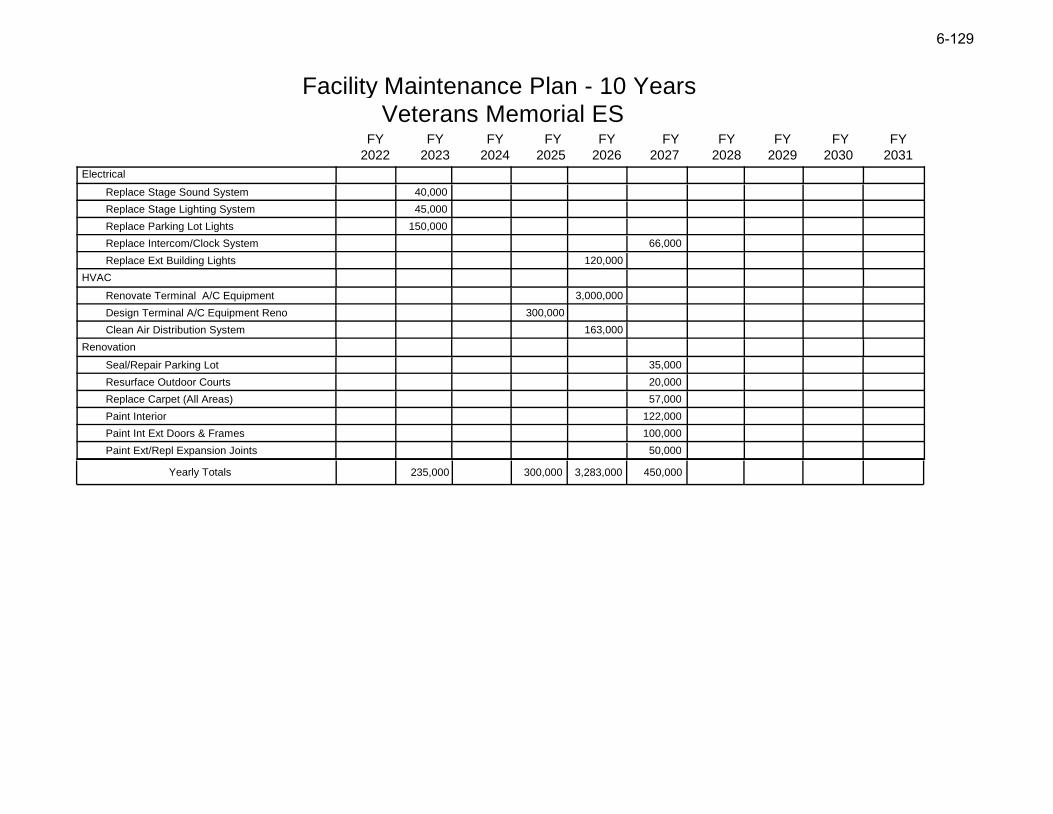
Facility Maintenance Plan - 10 Years Veterans Memorial ES
2022 2023 2024 2025 2026
FY FY FY FY FY
2027 2028 2029 2030 2031
FY FY FY FY FY
235,000 300,000 3,283,000 450,000Yearly Totals
Electrical
Replace Stage Sound System 40,000
Replace Stage Lighting System 45,000
Replace Parking Lot Lights 150,000
Replace Intercom/Clock System 66,000
Replace Ext Building Lights 120,000
HVAC
Renovate Terminal A/C Equipment 3,000,000
Design Terminal A/C Equipment Reno 300,000
Clean Air Distribution System 163,000
Renovation
Seal/Repair Parking Lot 35,000
Resurface Outdoor Courts 20,000
Replace Carpet (All Areas) 57,000
Paint Interior 122,000
Paint Int Ext Doors & Frames 100,000
Paint Ext/Repl Expansion Joints 50,000
6-12929
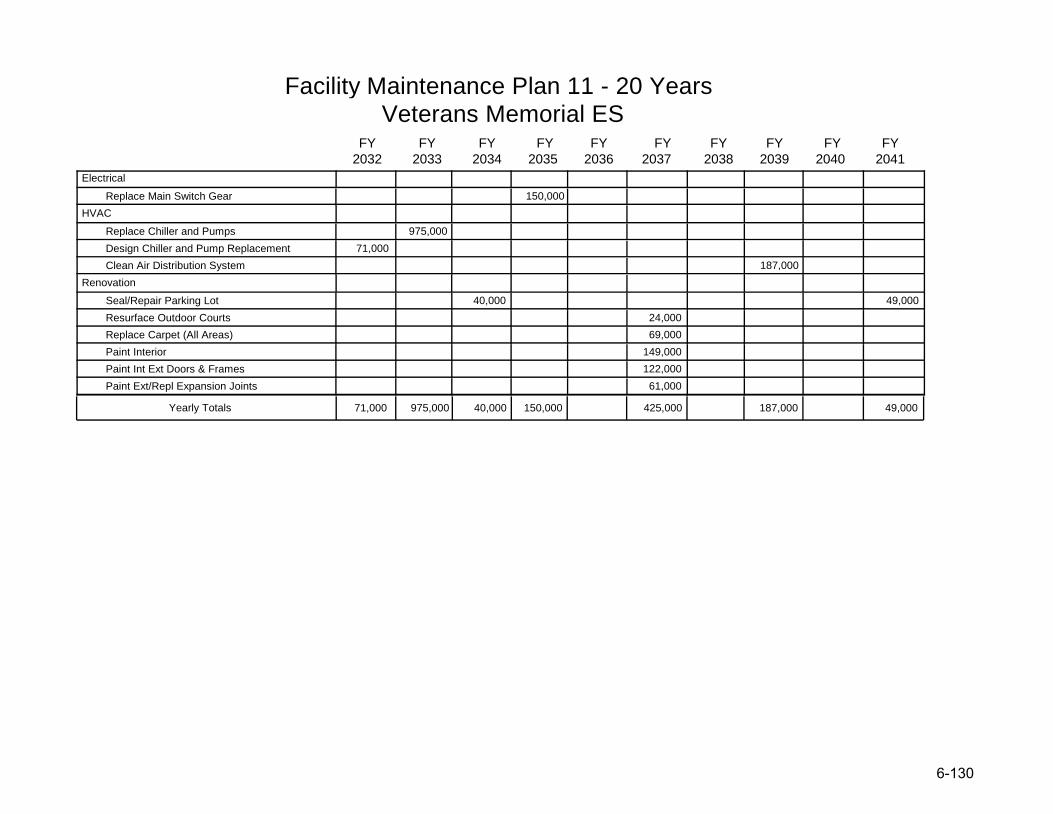
Facility Maintenance Plan 11 - 20 Years Veterans Memorial ES
2032 2033 2034 2035 2036
FY FY FY FY FY
2037 2038 2039 2040 2041
FY FY FY FY FY
71,000 975,000 40,000 150,000 425,000 187,000 49,000Yearly Totals
Electrical
Replace Main Switch Gear 150,000
HVAC
Replace Chiller and Pumps 975,000
Design Chiller and Pump Replacement 71,000
Clean Air Distribution System 187,000
Renovation
Seal/Repair Parking Lot 40,000 49,000
Resurface Outdoor Courts 24,000
Replace Carpet (All Areas) 69,000
Paint Interior 149,000
Paint Int Ext Doors & Frames 122,000
Paint Ext/Repl Expansion Joints 61,000
6-1300
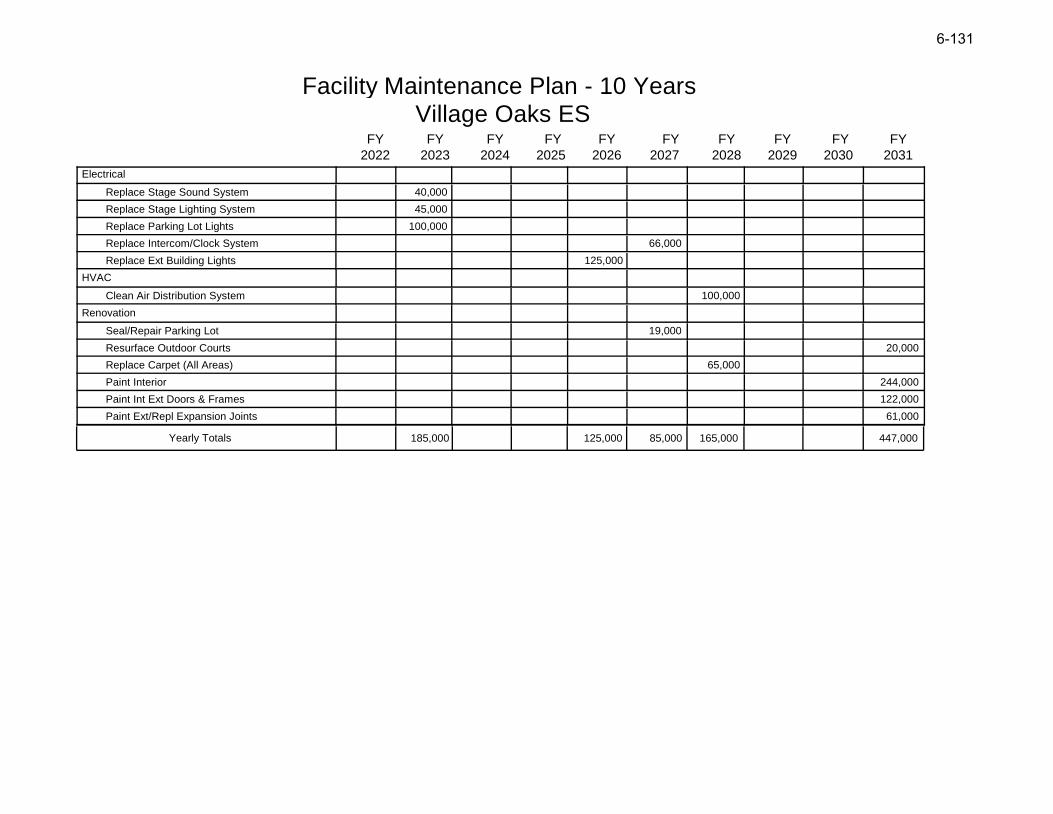
Facility Maintenance Plan - 10 Years Village Oaks ES
2022 2023 2024 2025 2026
FY FY FY FY FY
2027 2028 2029 2030 2031
FY FY FY FY FY
185,000 125,000 85,000 165,000 447,000Yearly Totals
Electrical
Replace Stage Sound System 40,000
Replace Stage Lighting System 45,000
Replace Parking Lot Lights 100,000
Replace Intercom/Clock System 66,000
Replace Ext Building Lights 125,000
HVAC
Clean Air Distribution System 100,000
Renovation
Seal/Repair Parking Lot 19,000
Resurface Outdoor Courts 20,000
Replace Carpet (All Areas) 65,000
Paint Interior 244,000
Paint Int Ext Doors & Frames 122,000
Paint Ext/Repl Expansion Joints 61,000
6-1311
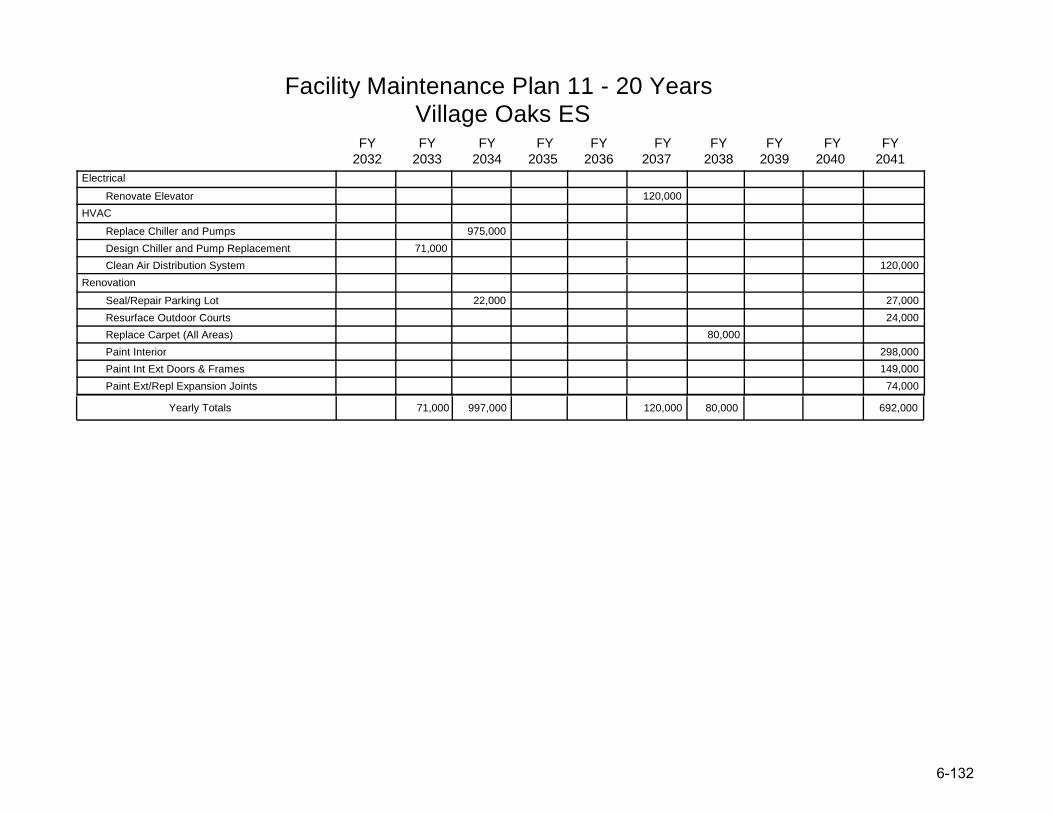
Facility Maintenance Plan 11 - 20 Years Village Oaks ES
2032 2033 2034 2035 2036
FY FY FY FY FY
2037 2038 2039 2040 2041
FY FY FY FY FY
71,000 997,000 120,000 80,000 692,000Yearly Totals
Electrical
Renovate Elevator 120,000
HVAC
Replace Chiller and Pumps 975,000
Design Chiller and Pump Replacement 71,000
Clean Air Distribution System 120,000
Renovation
Seal/Repair Parking Lot 22,000 27,000
Resurface Outdoor Courts 24,000
Replace Carpet (All Areas) 80,000
Paint Interior 298,000
Paint Int Ext Doors & Frames 149,000
Paint Ext/Repl Expansion Joints 74,000
6-132
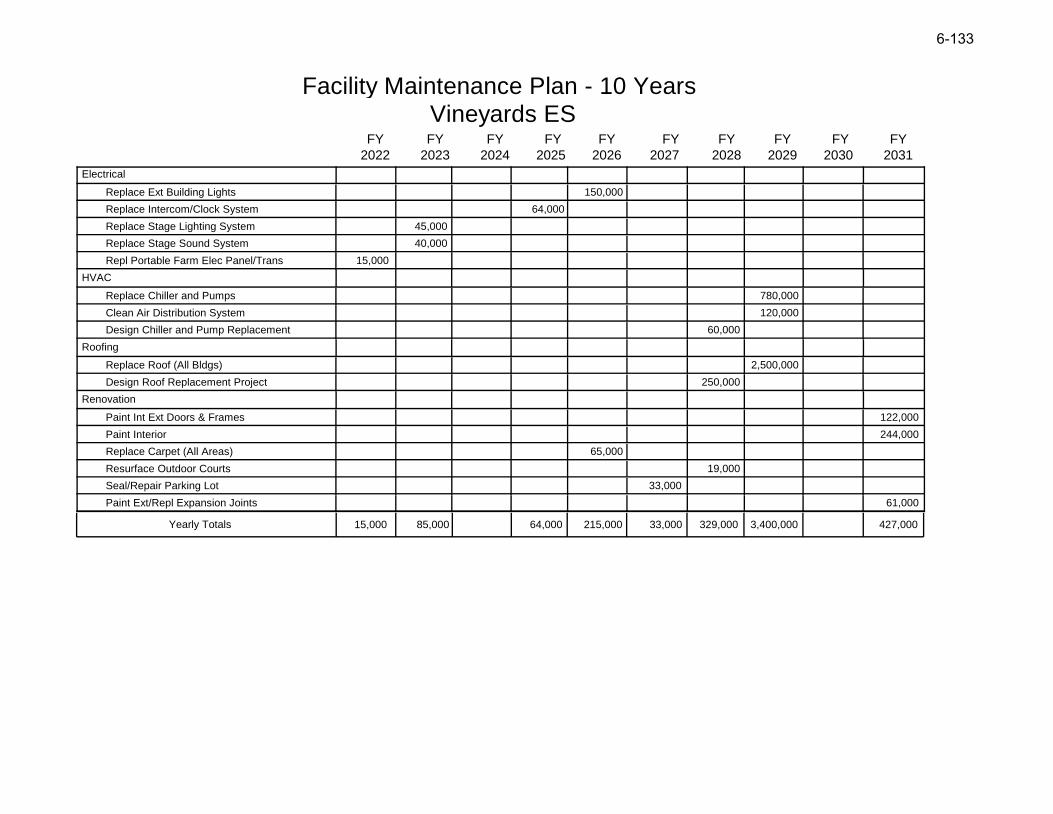
Facility Maintenance Plan - 10 Years Vineyards ES
2022 2023 2024 2025 2026
FY FY FY FY FY
2027 2028 2029 2030 2031
FY FY FY FY FY
15,000 85,000 64,000 215,000 33,000 329,000 3,400,000 427,000Yearly Totals
Electrical
Replace Ext Building Lights 150,000
Replace Intercom/Clock System 64,000
Replace Stage Lighting System 45,000
Replace Stage Sound System 40,000
Repl Portable Farm Elec Panel/Trans 15,000
HVAC
Replace Chiller and Pumps 780,000
Clean Air Distribution System 120,000
Design Chiller and Pump Replacement 60,000
Roofing
Replace Roof (All Bldgs) 2,500,000
Design Roof Replacement Project 250,000
Renovation
Paint Int Ext Doors & Frames 122,000
Paint Interior 244,000
Replace Carpet (All Areas) 65,000
Resurface Outdoor Courts 19,000
Seal/Repair Parking Lot 33,000
Paint Ext/Repl Expansion Joints 61,000
6-133

Facility Maintenance Plan 11 - 20 Years Vineyards ES
2032 2033 2034 2035 2036
FY FY FY FY FY
2037 2038 2039 2040 2041
FY FY FY FY FY
38,000 80,000 23,000 567,000Yearly Totals
Renovation
Seal/Repair Parking Lot 38,000 46,000
Resurface Outdoor Courts 23,000
Replace Carpet (All Areas) 80,000
Paint Interior 298,000
Paint Int Ext Doors & Frames 149,000
Paint Ext/Repl Expansion Joints 74,000
6-1344
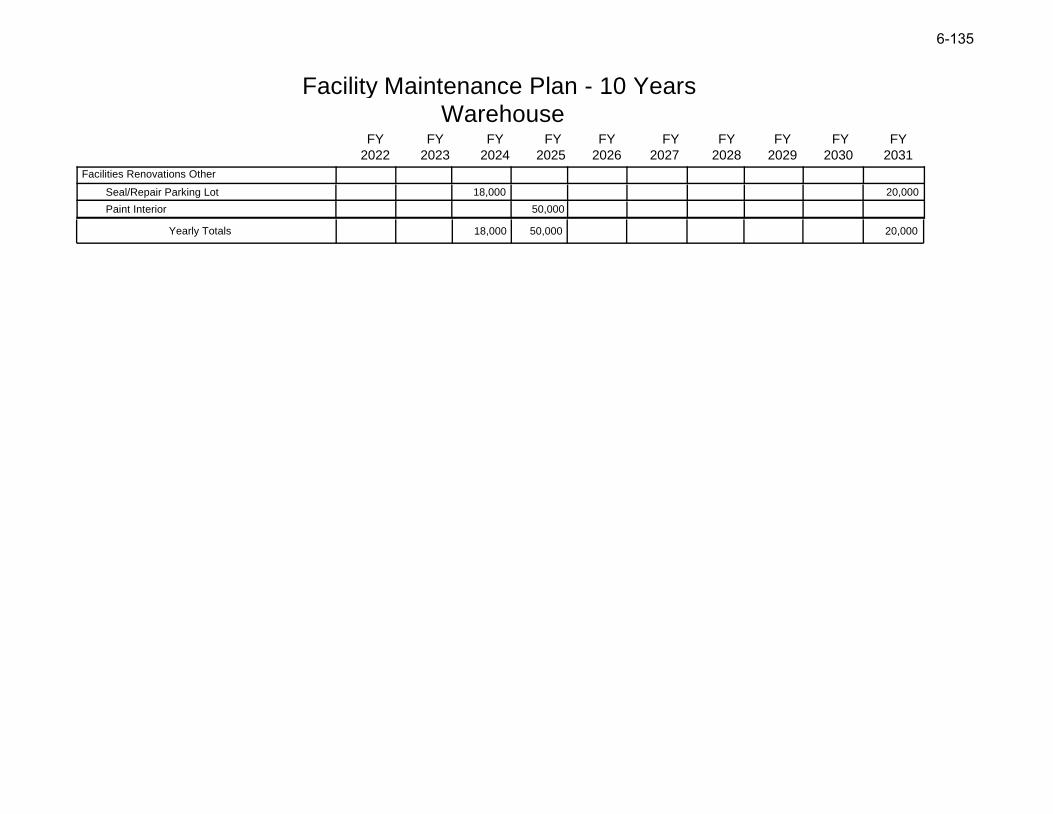
Facility Maintenance Plan - 10 Years Warehouse
2022 2023 2024 2025 2026
FY FY FY FY FY
2027 2028 2029 2030 2031
FY FY FY FY FY
18,000 50,000 20,000Yearly Totals
Facilities Renovations Other
Seal/Repair Parking Lot 18,000 20,000
Paint Interior 50,000
6-1355

Facility Maintenance Plan 11 - 20 Years Warehouse
2032 2033 2034 2035 2036
FY FY FY FY FY
2037 2038 2039 2040 2041
FY FY FY FY FY
20,000 61,000 23,000Yearly Totals
Electrical
Replace Ext Building Lights 20,000
Facilities Renovations Other
Seal/Repair Parking Lot 23,000
Paint Interior 61,000
6-1366
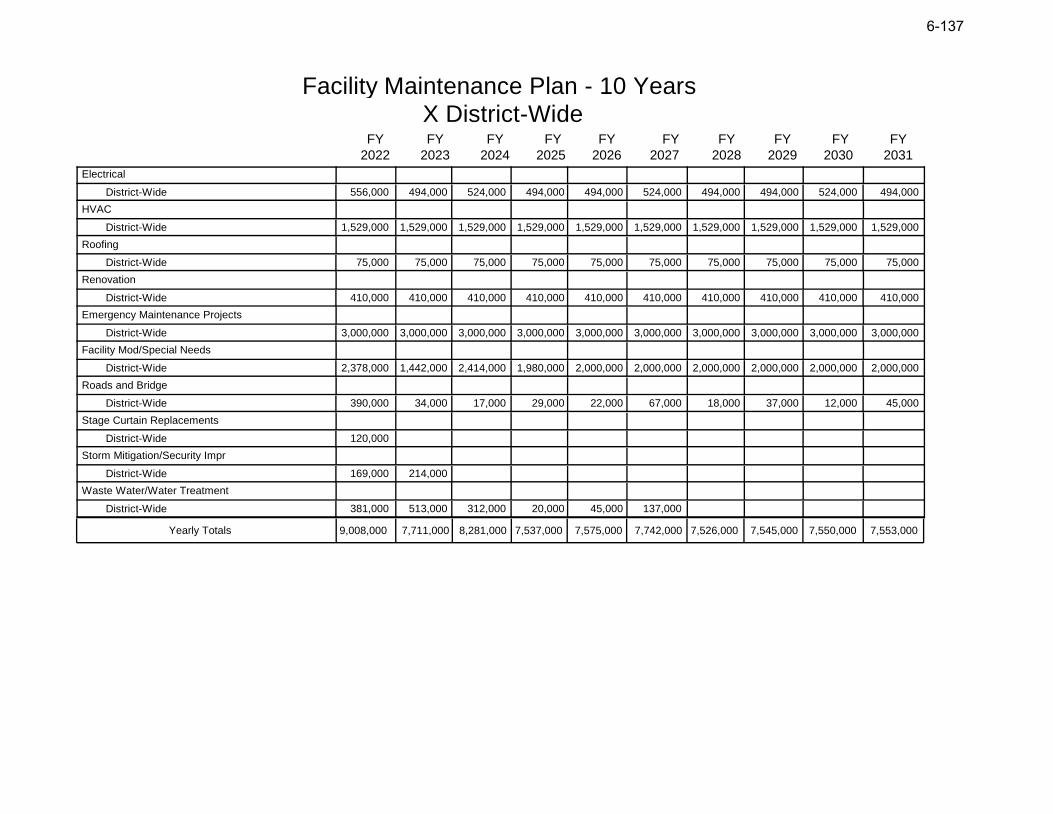
Facility Maintenance Plan - 10 Years X District-Wide
2022 2023 2024 2025 2026
FY FY FY FY FY
2027 2028 2029 2030 2031
FY FY FY FY FY
9,008,000 7,711,000 8,281,000 7,537,000 7,575,000 7,742,000 7,526,000 7,545,000 7,550,000 7,553,000Yearly Totals
Electrical
District-Wide 556,000 494,000 524,000 494,000 494,000 524,000 494,000 494,000 524,000 494,000
HVAC
District-Wide 1,529,000 1,529,000 1,529,000 1,529,000 1,529,000 1,529,000 1,529,000 1,529,000 1,529,000 1,529,000
Roofing
District-Wide 75,000 75,000 75,000 75,000 75,000 75,000 75,000 75,000 75,000 75,000
Renovation
District-Wide 410,000 410,000 410,000 410,000 410,000 410,000 410,000 410,000 410,000 410,000
Emergency Maintenance Projects
District-Wide 3,000,000 3,000,000 3,000,000 3,000,000 3,000,000 3,000,000 3,000,000 3,000,000 3,000,000 3,000,000
Facility Mod/Special Needs
District-Wide 2,378,000 1,442,000 2,414,000 1,980,000 2,000,000 2,000,000 2,000,000 2,000,000 2,000,000 2,000,000
Roads and Bridge
District-Wide 390,000 34,000 17,000 29,000 22,000 67,000 18,000 37,000 12,000 45,000
Stage Curtain Replacements
District-Wide 120,000
Storm Mitigation/Security Impr
District-Wide 169,000 214,000
Waste Water/Water Treatment
District-Wide 381,000 513,000 312,000 20,000 45,000 137,000
6-137
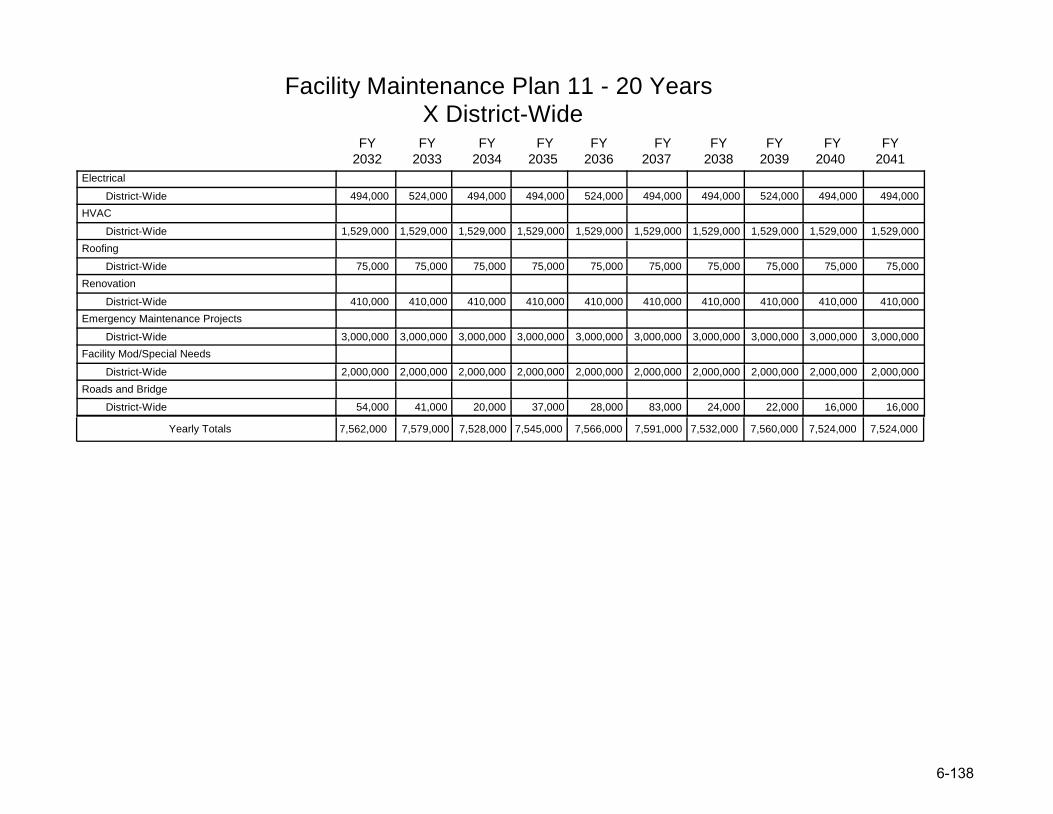
Facility Maintenance Plan 11 - 20 Years X District-Wide
2032 2033 2034 2035 2036
FY FY FY FY FY
2037 2038 2039 2040 2041
FY FY FY FY FY
7,562,000 7,579,000 7,528,000 7,545,000 7,566,000 7,591,000 7,532,000 7,560,000 7,524,000 7,524,000Yearly Totals
Electrical
District-Wide 494,000 524,000 494,000 494,000 524,000 494,000 494,000 524,000 494,000 494,000
HVAC
District-Wide 1,529,000 1,529,000 1,529,000 1,529,000 1,529,000 1,529,000 1,529,000 1,529,000 1,529,000 1,529,000
Roofing
District-Wide 75,000 75,000 75,000 75,000 75,000 75,000 75,000 75,000 75,000 75,000
Renovation
District-Wide 410,000 410,000 410,000 410,000 410,000 410,000 410,000 410,000 410,000 410,000
Emergency Maintenance Projects
District-Wide 3,000,000 3,000,000 3,000,000 3,000,000 3,000,000 3,000,000 3,000,000 3,000,000 3,000,000 3,000,000
Facility Mod/Special Needs
District-Wide 2,000,000 2,000,000 2,000,000 2,000,000 2,000,000 2,000,000 2,000,000 2,000,000 2,000,000 2,000,000
Roads and Bridge
District-Wide 54,000 41,000 20,000 37,000 28,000 83,000 24,000 22,000 16,000 16,000
6-1388
THIS PAGE INTENTIONALLY LEFT BLANK
Chapter
7
Chapter 7
Concurrency Service Areas
7-1
Chapter 7
CONCURRENCY SERVICE AREAS
Collier County Public Schools (CCPS) has 15 concurrency service areas (CSAs) for elementary schools, eight for middle schools, and eight for high schools. These service areas were established by interlocal agreement to manage level of service standards for the county’s public schools. The CSAs have been established to maximize available school capacity, taking into account transportation costs, district policies affecting student assignment, and geographically isolated areas of the county such as Everglades City and Immokalee. Schools that do not have a specific geographic attendance boundary do not have a concurrency service area. CCPS has a district-wide level of service standard of 95% of the permanent Florida Inventory of School Houses (FISH) capacity for
elementary and middle schools, and 100% of permanent FISH capacity for high schools. High school enrollment exceeded permanent capacity in the 2018/19 school year. To address overcrowding additional temporary and permanent capacity at the high school level is included in this plan. In addition, while overall enrollment at the elementary level is not projected to exceed total elementary FISH capacity, this plan projects that some elementary and middle schools may exceed their capacities during the next 5 years. For any elementary school that exceeds its capacity, enrollments will be closely monitored and alternative steps will be planned to address overcrowding as needed. Maps 7-1 through 7-3 on the following pages provide a geographic representation of the CSAs by elementary, middle and high school zones.
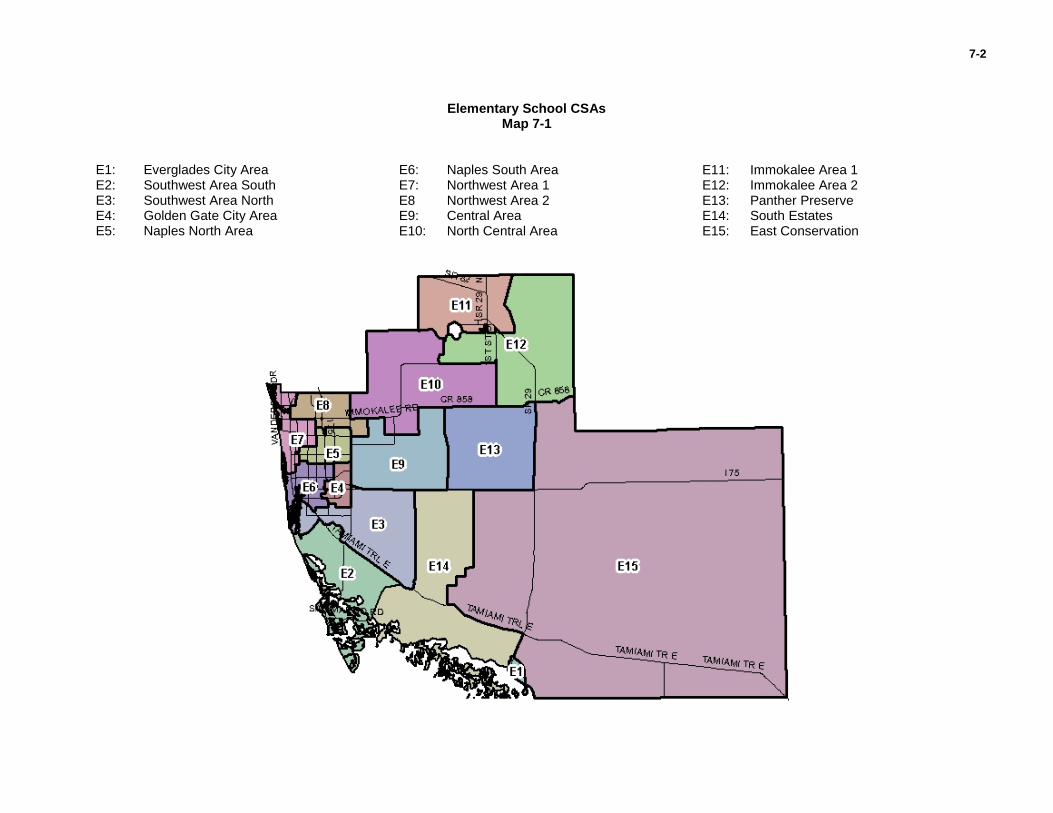
7-2
Elementary School CSAs
Map 7-1
E1: Everglades City Area E2: Southwest Area South E3: Southwest Area North E4: Golden Gate City Area E5: Naples North Area
E6: Naples South Area E7: Northwest Area 1 E8 Northwest Area 2 E9: Central Area E10: North Central Area
E11: Immokalee Area 1 E12: Immokalee Area 2 E13: Panther Preserve E14: South Estates E15: East Conservation
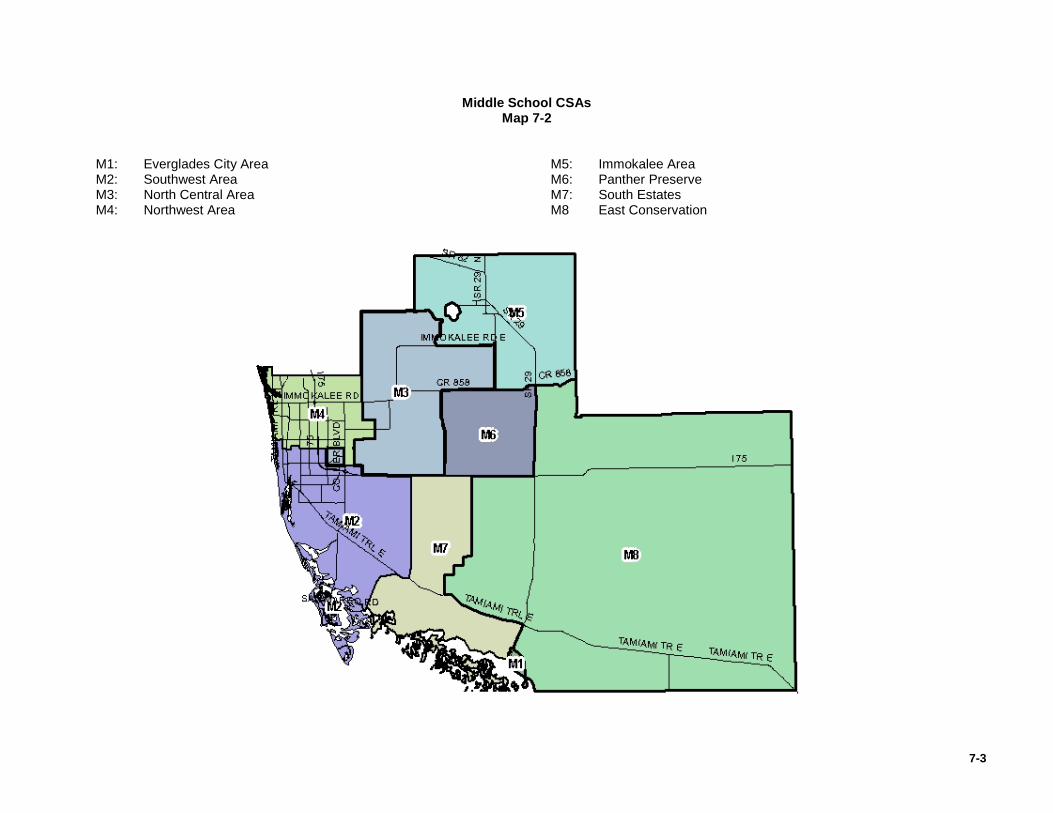
7-3
Middle School CSAs Map 7-2
M1: Everglades City Area M2: Southwest Area M3: North Central Area M4: Northwest Area
M5: Immokalee Area M6: Panther Preserve M7: South Estates M8 East Conservation
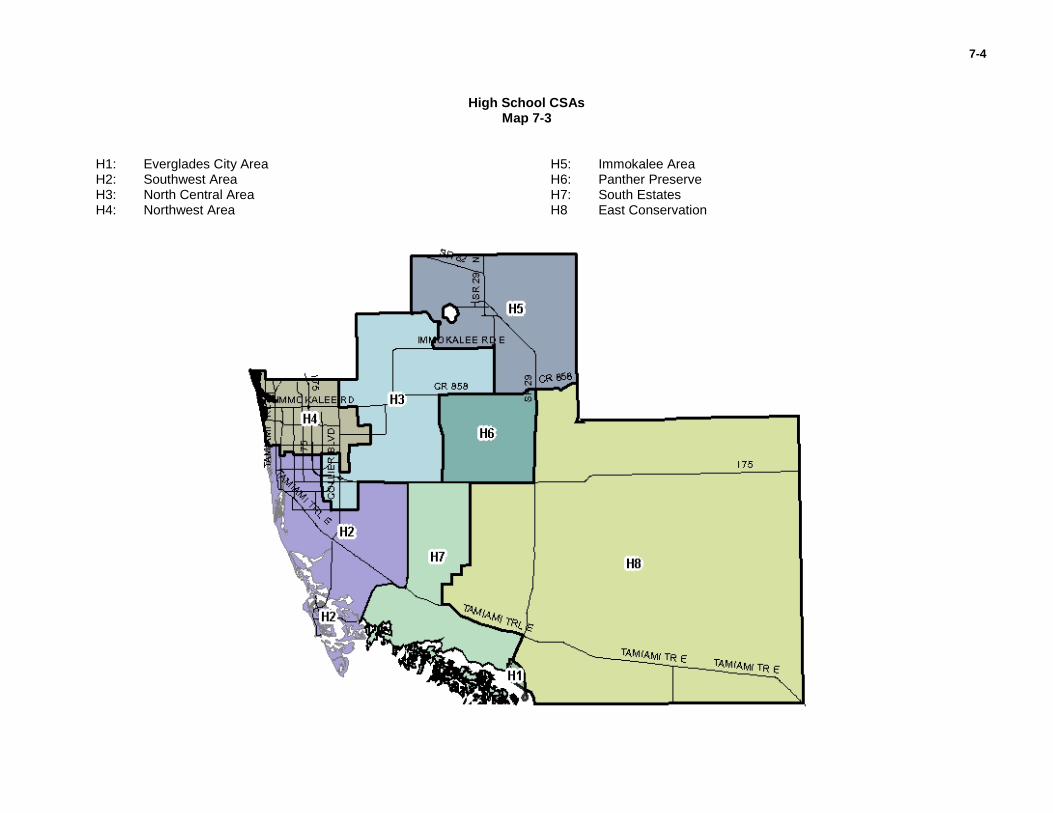
7-4
High School CSAs Map 7-3
H1: Everglades City Area H2: Southwest Area H3: North Central Area H4: Northwest Area
H5: Immokalee Area H6: Panther Preserve H7: South Estates H8 East Conservation

E2 Southwest Area SouthConcurrency Analysis
Elementary Schools Manatee ES – No change Parkside ES – No change Tommie Barfield ES – No change
School
Enroll Cap Util %
Projected
Enroll Cap Util % Enroll Cap Util % Enroll Cap Util % Enroll Cap Util %
2020 / 2021 2021 / 2022 2022 / 2023 2023 / 2024 2024 / 2025 2025 / 2026 Enroll Cap Util %
FISH Capacity
Manatee ES 706 549 600 615 620 63678% 85% 87% 88% 90% 645 91%706706706706706706
Parkside ES 919 578 693 701 699 72463% 75% 76% 76% 79% 735 80%919919919919919919
Tommie Barfield ES 600 452 491 482 489 50075% 82% 80% 82% 83% 526 88%600600600600600600
1784 1798 1808 1860Elementary Total 2225 71% 80% 81% 81% 84% 1906 86%1579 2225 2225 2225 2225 2225 2225
7-5
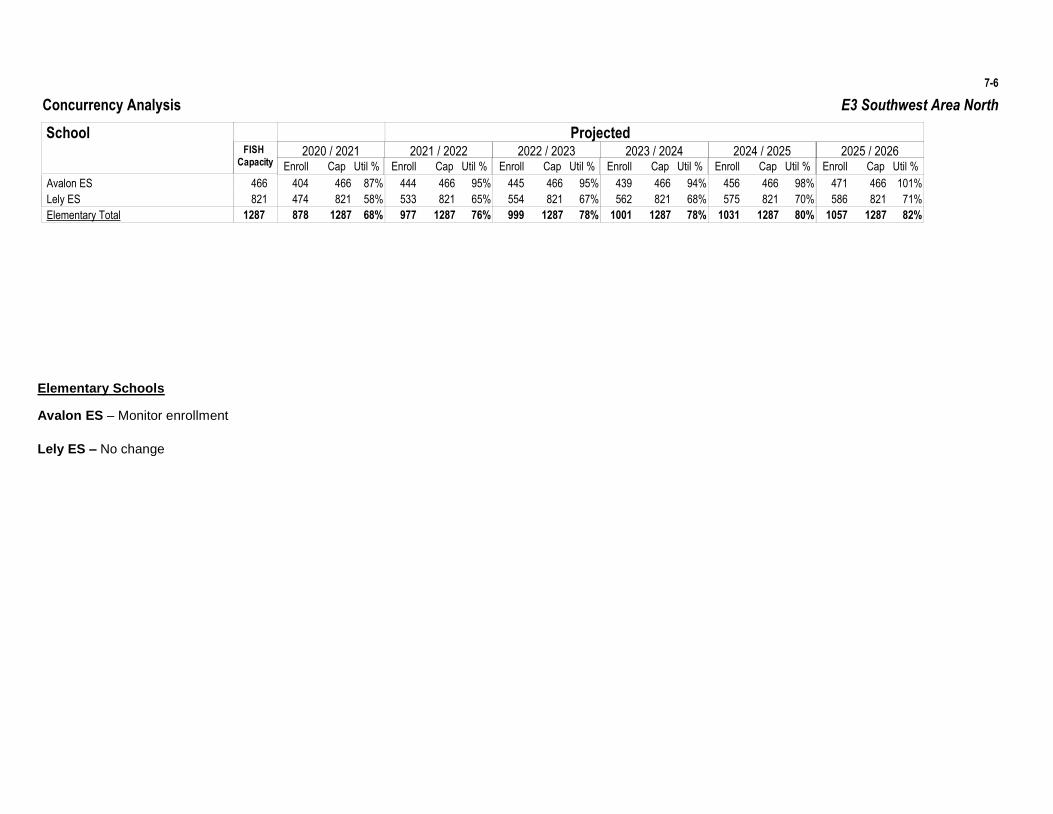
E3 Southwest Area NorthConcurrency Analysis
7-6
Elementary Schools
Avalon ES – Monitor enrollment
Lely ES – No change
School
Enroll Cap Util %
Projected
Enroll Cap Util % Enroll Cap Util % Enroll Cap Util % Enroll Cap Util %
2020 / 2021 2021 / 2022 2022 / 2023 2023 / 2024 2024 / 2025 2025 / 2026 Enroll Cap Util %
FISH Capacity
Avalon ES 466 404 444 445 439 45687% 95% 95% 94% 98% 471 101%466466466466466466
Lely ES 821 474 533 554 562 57558% 65% 67% 68% 70% 586 71%821821821821821821
977 999 1001 1031Elementary Total 1287 68% 76% 78% 78% 80% 1057 82%878 1287 1287 1287 1287 1287 1287
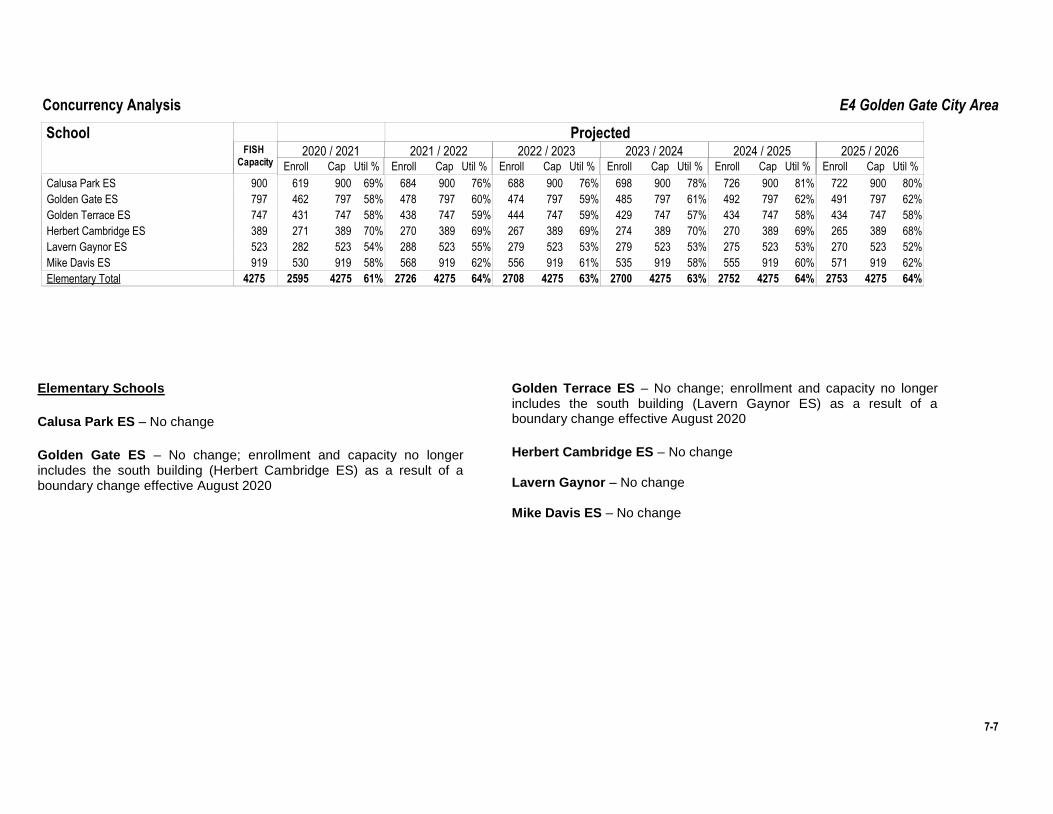
E4 Golden Gate City AreaConcurrency Analysis
Elementary Schools
Calusa Park ES – No change
Golden Gate ES – No change; enrollment and capacity no longer includes the south building (Herbert Cambridge ES) as a result of a boundary change effective August 2020
Golden Terrace ES – No change; enrollment and capacity no longer includes the south building (Lavern Gaynor ES) as a result of a boundary change effective August 2020
Herbert Cambridge ES – No change Lavern Gaynor – No change Mike Davis ES – No change
School
Enroll Cap Util %
Projected
Enroll Cap Util % Enroll Cap Util % Enroll Cap Util % Enroll Cap Util %
2020 / 2021 2021 / 2022 2022 / 2023 2023 / 2024 2024 / 2025 2025 / 2026 Enroll Cap Util %
FISH Capacity
Calusa Park ES 900 619 684 688 698 72669% 76% 76% 78% 81% 722 80%900900900900900900
Golden Gate ES 797 462 478 474 485 49258% 60% 59% 61% 62% 491 62%797797797797797797
Golden Terrace ES 747 431 438 444 429 43458% 59% 59% 57% 58% 434 58%747747747747747747
Herbert Cambridge ES 389 271 270 267 274 27070% 69% 69% 70% 69% 265 68%389389389389389389
Lavern Gaynor ES 523 282 288 279 279 27554% 55% 53% 53% 53% 270 52%523523523523523523
Mike Davis ES 919 530 568 556 535 55558% 62% 61% 58% 60% 571 62%919919919919919919
2726 2708 2700 2752Elementary Total 4275 61% 64% 63% 63% 64% 2753 64%2595 4275 4275 4275 4275 4275 4275
7-7
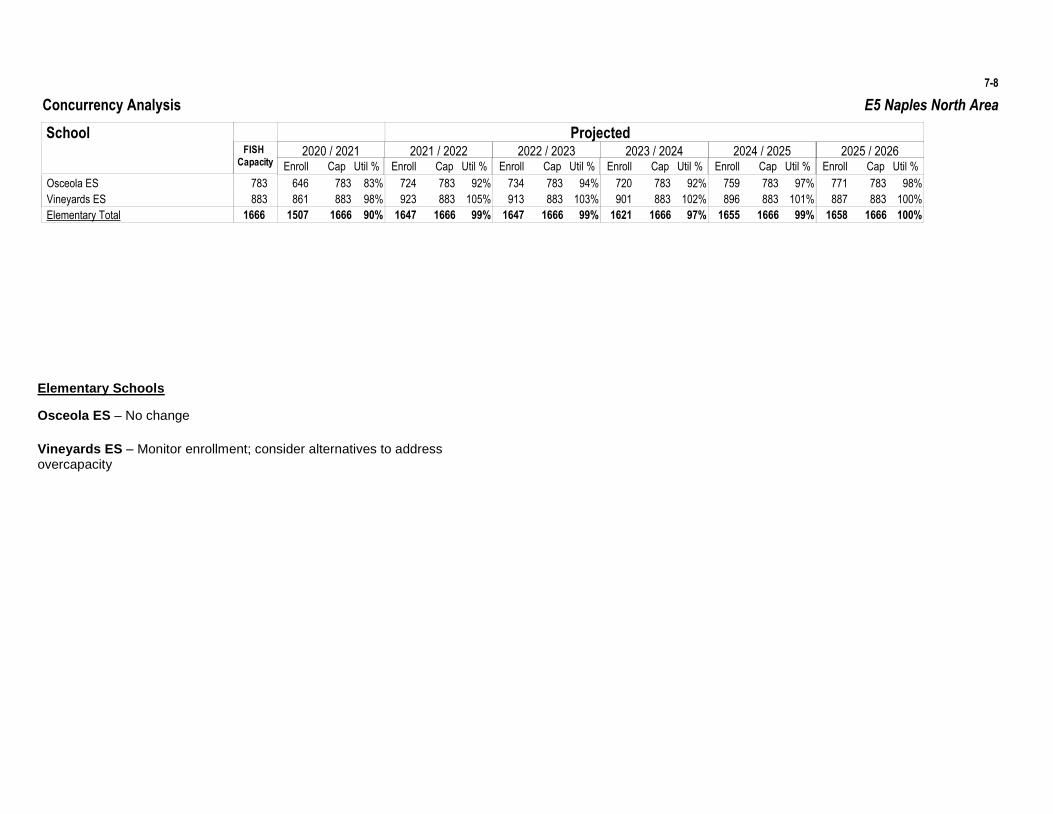
E5 Naples North AreaConcurrency Analysis
7-8
Elementary Schools
Osceola ES – No change
Vineyards ES – Monitor enrollment; consider alternatives to address overcapacity
School
Enroll Cap Util %
Projected
Enroll Cap Util % Enroll Cap Util % Enroll Cap Util % Enroll Cap Util %
2020 / 2021 2021 / 2022 2022 / 2023 2023 / 2024 2024 / 2025 2025 / 2026 Enroll Cap Util %
FISH Capacity
Osceola ES 783 646 724 734 720 75983% 92% 94% 92% 97% 771 98%783783783783783783
Vineyards ES 883 861 923 913 901 89698% 105% 103% 102% 101% 887 100%883883883883883883
1647 1647 1621 1655Elementary Total 1666 90% 99% 99% 97% 99% 1658 100%1507 1666 1666 1666 1666 1666 1666

E6 Naples South AreaConcurrency Analysis
Elementary Schools Lake Park ES – No change
Poinciana ES – No change Shadowlawn ES – No change
School
Enroll Cap Util %
Projected
Enroll Cap Util % Enroll Cap Util % Enroll Cap Util % Enroll Cap Util %
2020 / 2021 2021 / 2022 2022 / 2023 2023 / 2024 2024 / 2025 2025 / 2026 Enroll Cap Util %
FISH Capacity
Lake Park ES 570 514 540 537 539 51590% 95% 94% 95% 90% 520 91%570570570570570570
Poinciana ES 763 500 586 571 574 57066% 77% 75% 75% 75% 584 77%763763763763763763
Shadowlawn ES 660 415 527 516 530 56763% 80% 78% 80% 86% 551 83%660660660660660660
1653 1624 1643 1652Elementary Total 1993 72% 83% 81% 82% 83% 1655 83%1429 1993 1993 1993 1993 1993 1993
7-9

E7 Northwest Area 1Concurrency Analysis
7-10
Elementary Schools
Naples Park ES – No change Pelican Marsh ES – No change
Sea Gate ES – No change
School
Enroll Cap Util %
Projected
Enroll Cap Util % Enroll Cap Util % Enroll Cap Util % Enroll Cap Util %
2020 / 2021 2021 / 2022 2022 / 2023 2023 / 2024 2024 / 2025 2025 / 2026 Enroll Cap Util %
FISH Capacity
Naples Park ES 750 351 416 415 409 41347% 55% 55% 55% 55% 427 57%750750750750750750
Pelican Marsh ES 846 641 739 727 732 73476% 87% 86% 87% 87% 753 89%846846846846846846
Sea Gate ES 854 684 760 764 762 76780% 89% 89% 89% 90% 771 90%854854854854854854
1915 1906 1903 1914Elementary Total 2450 68% 78% 78% 78% 78% 1951 80%1676 2450 2450 2450 2450 2450 2450
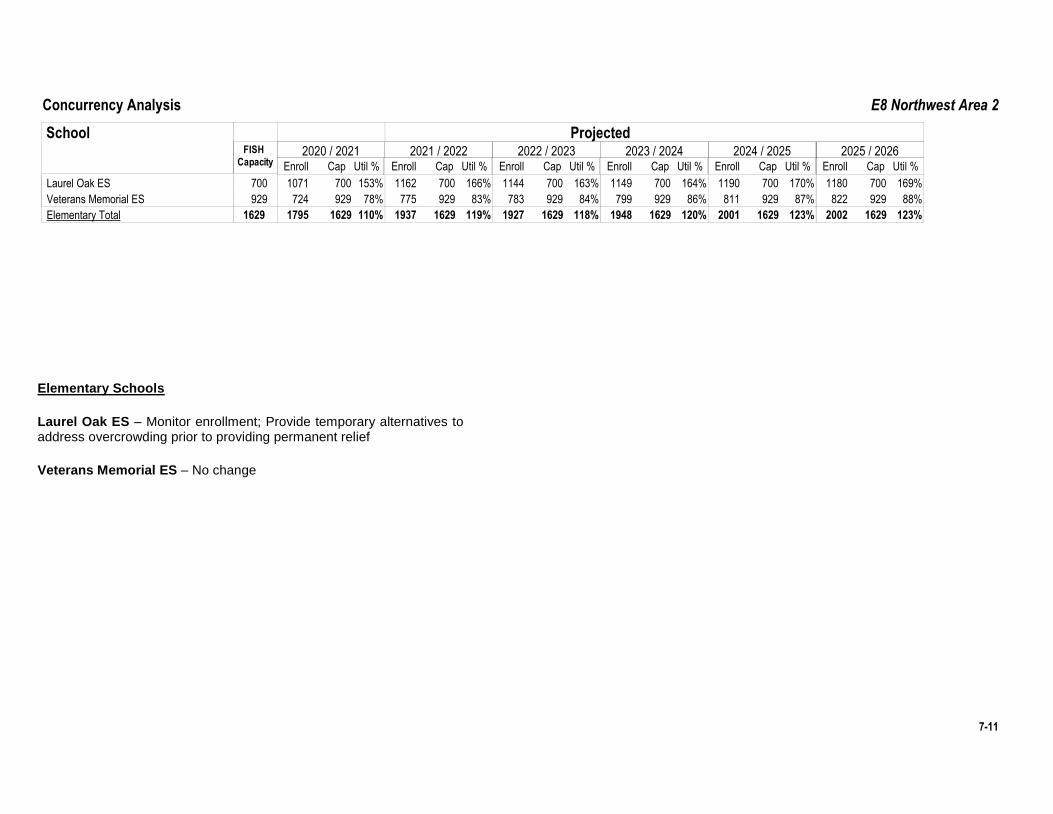
E8 Northwest Area 2Concurrency Analysis
Elementary Schools
Laurel Oak ES – Monitor enrollment; Provide temporary alternatives to address overcrowding prior to providing permanent relief
Veterans Memorial ES – No change
School
Enroll Cap Util %
Projected
Enroll Cap Util % Enroll Cap Util % Enroll Cap Util % Enroll Cap Util %
2020 / 2021 2021 / 2022 2022 / 2023 2023 / 2024 2024 / 2025 2025 / 2026 Enroll Cap Util %
FISH Capacity
Laurel Oak ES 700 1071 1162 1144 1149 1190153% 166% 163% 164% 170% 1180 169%700700700700700700
Veterans Memorial ES 929 724 775 783 799 81178% 83% 84% 86% 87% 822 88%929929929929929929
1937 1927 1948 2001Elementary Total 1629 110% 119% 118% 120% 123% 2002 123%1795 1629 1629 1629 1629 1629 1629
7-11
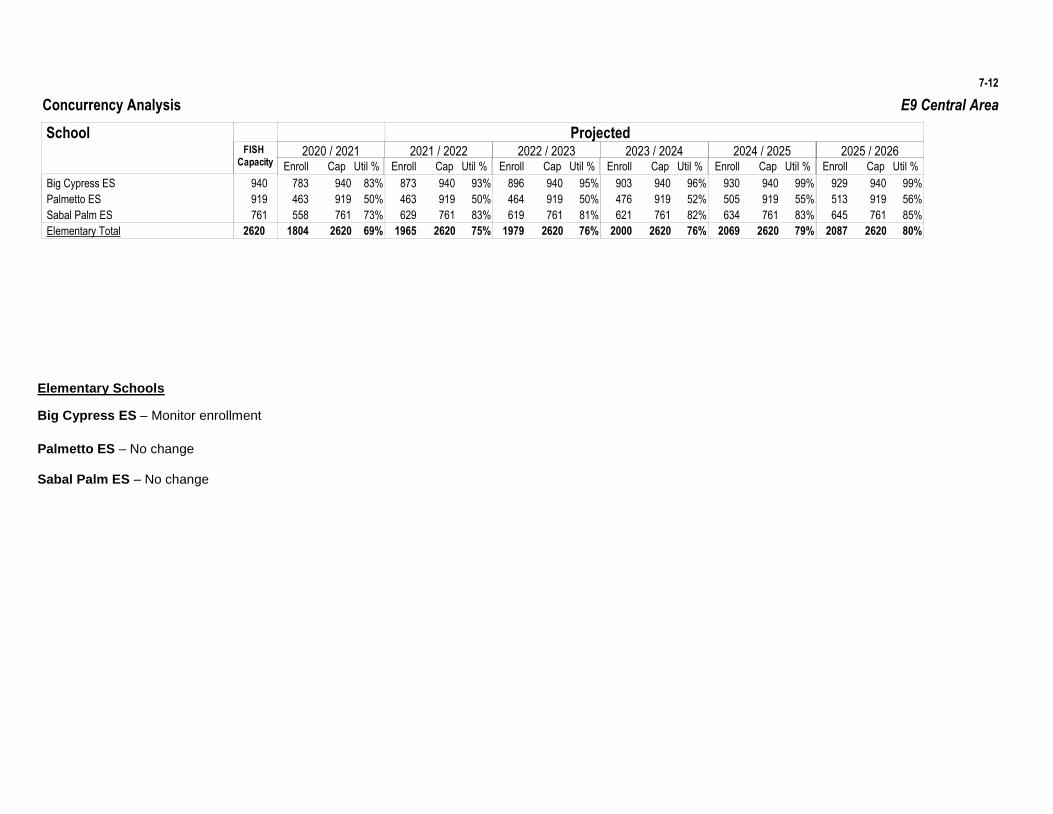
E9 Central AreaConcurrency Analysis
7-12
Elementary Schools
Big Cypress ES – Monitor enrollment
Palmetto ES – No change Sabal Palm ES – No change
School
Enroll Cap Util %
Projected
Enroll Cap Util % Enroll Cap Util % Enroll Cap Util % Enroll Cap Util %
2020 / 2021 2021 / 2022 2022 / 2023 2023 / 2024 2024 / 2025 2025 / 2026 Enroll Cap Util %
FISH Capacity
Big Cypress ES 940 783 873 896 903 93083% 93% 95% 96% 99% 929 99%940940940940940940
Palmetto ES 919 463 463 464 476 50550% 50% 50% 52% 55% 513 56%919919919919919919
Sabal Palm ES 761 558 629 619 621 63473% 83% 81% 82% 83% 645 85%761761761761761761
1965 1979 2000 2069Elementary Total 2620 69% 75% 76% 76% 79% 2087 80%1804 2620 2620 2620 2620 2620 2620
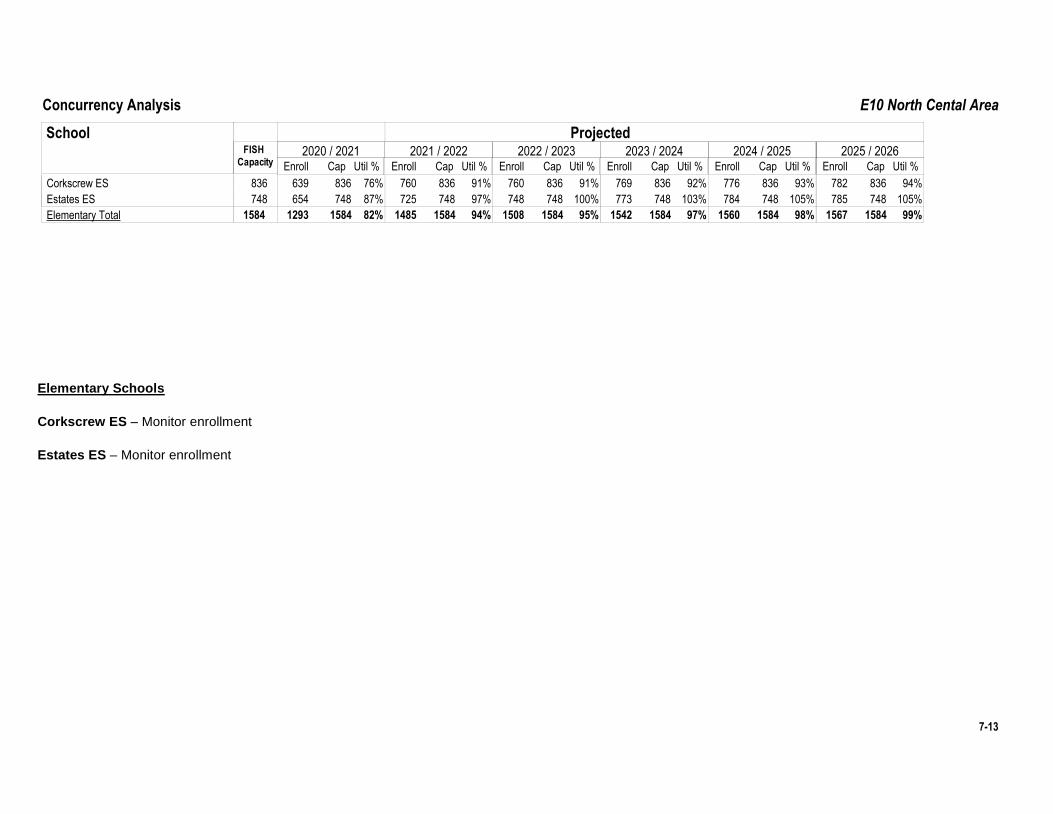
E10 North Cental AreaConcurrency Analysis
Elementary Schools
Corkscrew ES – Monitor enrollment
Estates ES – Monitor enrollment
School
Enroll Cap Util %
Projected
Enroll Cap Util % Enroll Cap Util % Enroll Cap Util % Enroll Cap Util %
2020 / 2021 2021 / 2022 2022 / 2023 2023 / 2024 2024 / 2025 2025 / 2026 Enroll Cap Util %
FISH Capacity
Corkscrew ES 836 639 760 760 769 77676% 91% 91% 92% 93% 782 94%836836836836836836
Estates ES 748 654 725 748 773 78487% 97% 100% 103% 105% 785 105%748748748748748748
1485 1508 1542 1560Elementary Total 1584 82% 94% 95% 97% 98% 1567 99%1293 1584 1584 1584 1584 1584 1584
7-13

E11 Immokalee Area 1Concurrency Analysis
7-14
Elementary Schools (K-6)
Eden Park ES – No change
Highlands ES – No change Lake Trafford ES – No change
School
Enroll Cap Util %
Projected
Enroll Cap Util % Enroll Cap Util % Enroll Cap Util % Enroll Cap Util %
2020 / 2021 2021 / 2022 2022 / 2023 2023 / 2024 2024 / 2025 2025 / 2026 Enroll Cap Util %
FISH Capacity
Eden Park ES 824 634 682 664 661 66177% 83% 81% 80% 80% 680 83%824824824824824824
Highlands ES 812 544 617 623 632 61867% 76% 77% 78% 76% 606 75%812812812812812812
Lake Trafford ES 881 667 762 764 757 76676% 86% 87% 86% 87% 772 88%881881881881881881
2061 2051 2050 2045Elementary Total 2517 73% 82% 81% 81% 81% 2058 82%1845 2517 2517 2517 2517 2517 2517
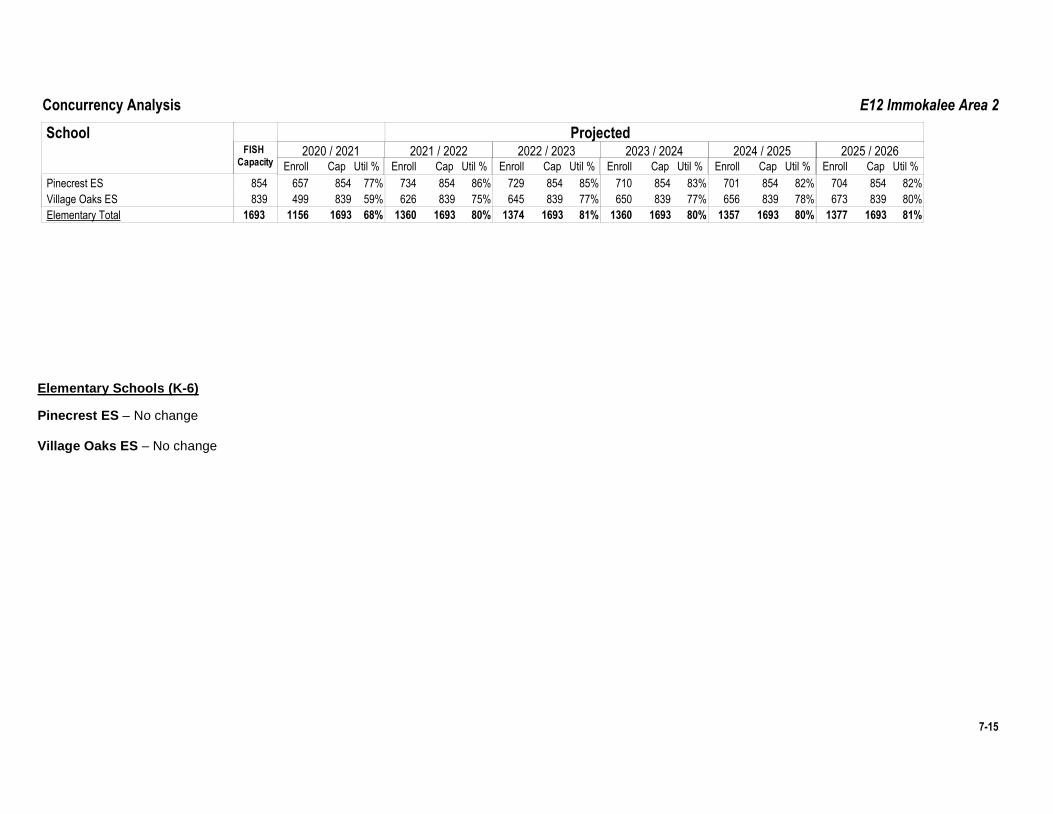
E12 Immokalee Area 2Concurrency Analysis
Elementary Schools (K-6)
Pinecrest ES – No change Village Oaks ES – No change
School
Enroll Cap Util %
Projected
Enroll Cap Util % Enroll Cap Util % Enroll Cap Util % Enroll Cap Util %
2020 / 2021 2021 / 2022 2022 / 2023 2023 / 2024 2024 / 2025 2025 / 2026 Enroll Cap Util %
FISH Capacity
Pinecrest ES 854 657 734 729 710 70177% 86% 85% 83% 82% 704 82%854854854854854854
Village Oaks ES 839 499 626 645 650 65659% 75% 77% 77% 78% 673 80%839839839839839839
1360 1374 1360 1357Elementary Total 1693 68% 80% 81% 80% 80% 1377 81%1156 1693 1693 1693 1693 1693 1693
7-15
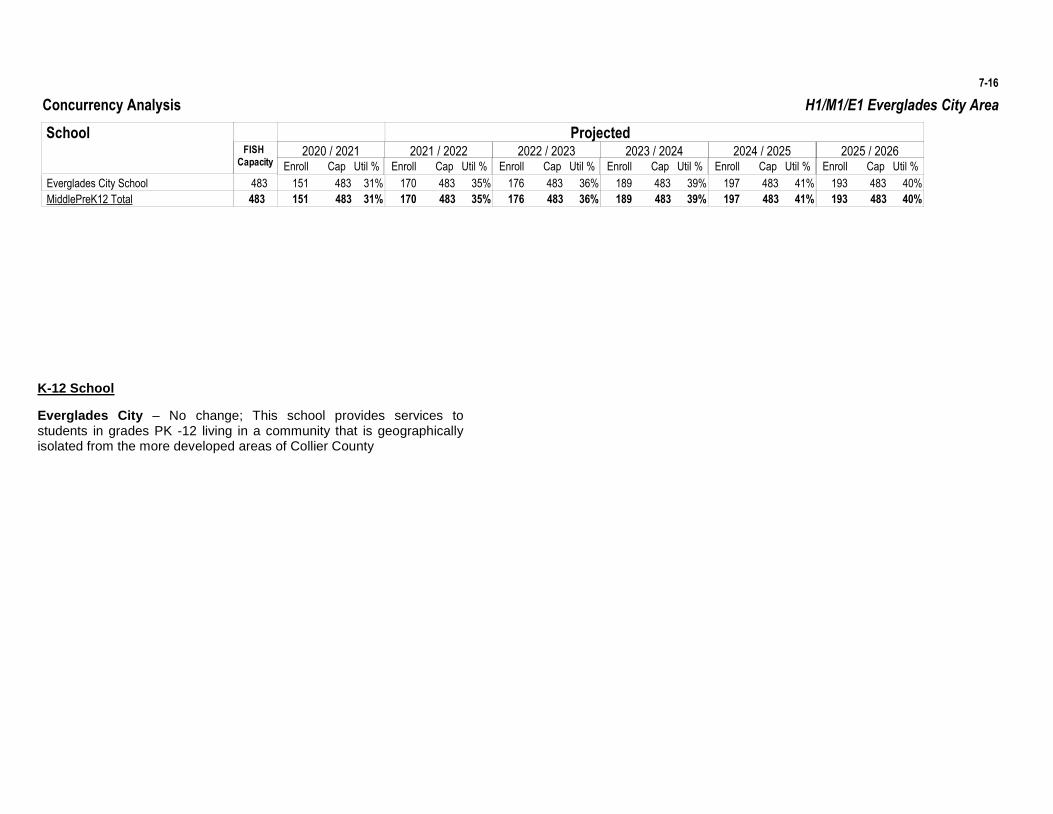
H1/M1/E1 Everglades City AreaConcurrency Analysis
7-16
K-12 School
Everglades City – No change; This school provides services to students in grades PK -12 living in a community that is geographically isolated from the more developed areas of Collier County
School
Enroll Cap Util %
Projected
Enroll Cap Util % Enroll Cap Util % Enroll Cap Util % Enroll Cap Util %
2020 / 2021 2021 / 2022 2022 / 2023 2023 / 2024 2024 / 2025 2025 / 2026 Enroll Cap Util %
FISH Capacity
Everglades City School 483 151 170 176 189 19731% 35% 36% 39% 41% 193 40%483483483483483483
170 176 189 197MiddlePreK12 Total 483 31% 35% 36% 39% 41% 193 40%151 483 483 483 483 483 483
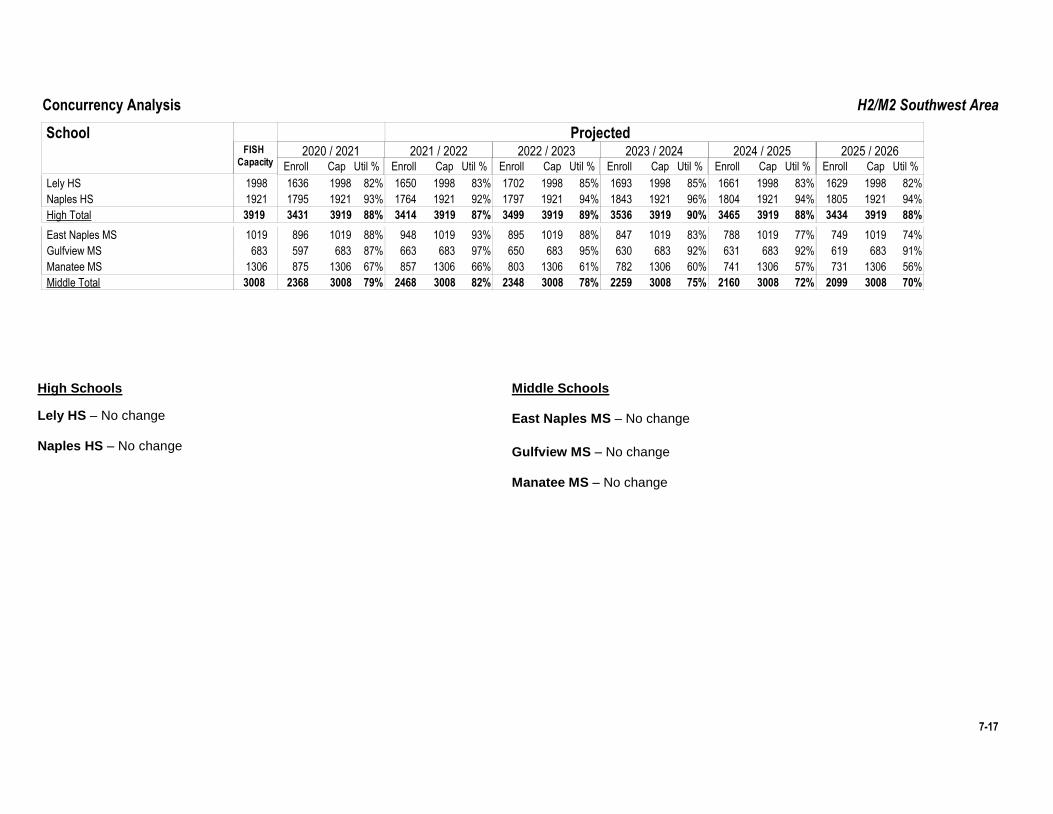
H2/M2 Southwest AreaConcurrency Analysis
High Schools
Lely HS – No change Naples HS – No change
Middle Schools East Naples MS – No change
Gulfview MS – No change Manatee MS – No change
School
Enroll Cap Util %
Projected
Enroll Cap Util % Enroll Cap Util % Enroll Cap Util % Enroll Cap Util %
2020 / 2021 2021 / 2022 2022 / 2023 2023 / 2024 2024 / 2025 2025 / 2026 Enroll Cap Util %
FISH Capacity
Lely HS 1998 1636 1650 1702 1693 166182% 83% 85% 85% 83% 1629 82%199819981998199819981998
Naples HS 1921 1795 1764 1797 1843 180493% 92% 94% 96% 94% 1805 94%192119211921192119211921
3414 3499 3536 3465High Total 3919 88% 87% 89% 90% 88% 3434 88%3431 3919 3919 3919 3919 3919 3919
East Naples MS 1019 896 948 895 847 78888% 93% 88% 83% 77% 749 74%101910191019101910191019
Gulfview MS 683 597 663 650 630 63187% 97% 95% 92% 92% 619 91%683683683683683683
Manatee MS 1306 875 857 803 782 74167% 66% 61% 60% 57% 731 56%130613061306130613061306
2468 2348 2259 2160Middle Total 3008 79% 82% 78% 75% 72% 2099 70%2368 3008 3008 3008 3008 3008 3008
7-17
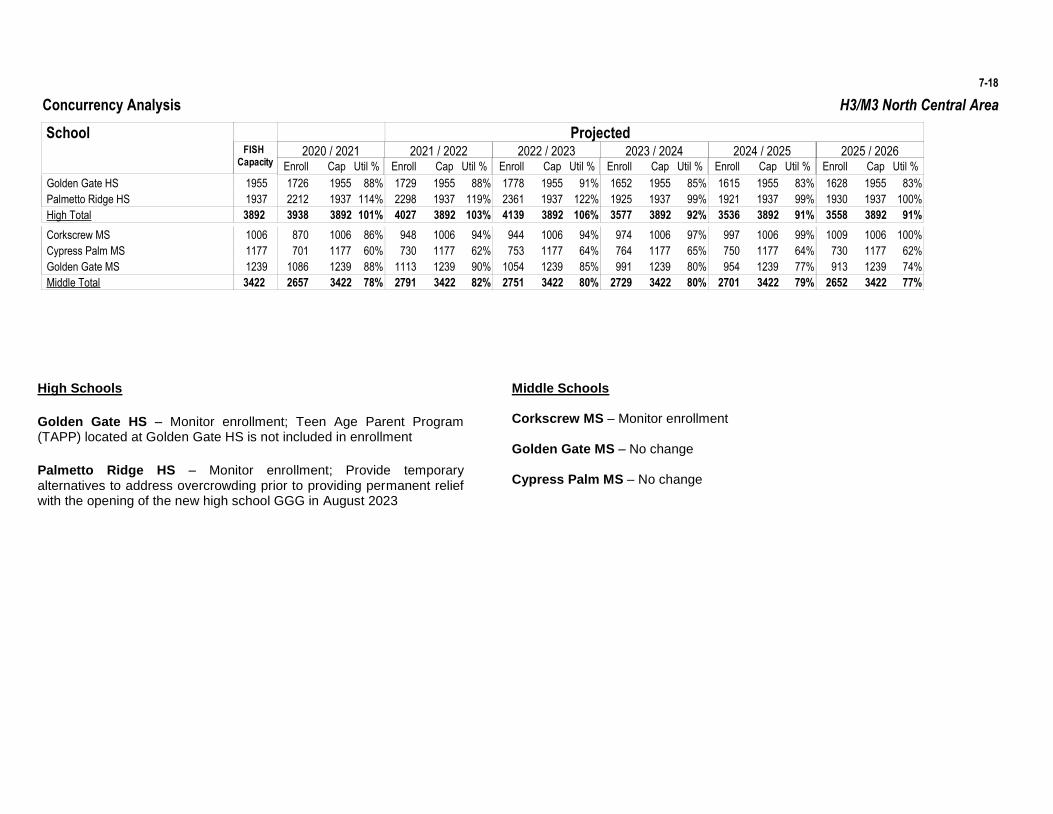
H3/M3 North Central AreaConcurrency Analysis
7-18
High Schools
Golden Gate HS – Monitor enrollment; Teen Age Parent Program (TAPP) located at Golden Gate HS is not included in enrollment
Palmetto Ridge HS – Monitor enrollment; Provide temporary alternatives to address overcrowding prior to providing permanent relief with the opening of the new high school GGG in August 2023
Middle Schools Corkscrew MS – Monitor enrollment Golden Gate MS – No change Cypress Palm MS – No change
School
Enroll Cap Util %
Projected
Enroll Cap Util % Enroll Cap Util % Enroll Cap Util % Enroll Cap Util %
2020 / 2021 2021 / 2022 2022 / 2023 2023 / 2024 2024 / 2025 2025 / 2026 Enroll Cap Util %
FISH Capacity
Golden Gate HS 1955 1726 1729 1778 1652 161588% 88% 91% 85% 83% 1628 83%195519551955195519551955
Palmetto Ridge HS 1937 2212 2298 2361 1925 1921114% 119% 122% 99% 99% 1930 100%193719371937193719371937
4027 4139 3577 3536High Total 3892 101% 103% 106% 92% 91% 3558 91%3938 3892 3892 3892 3892 3892 3892
Corkscrew MS 1006 870 948 944 974 99786% 94% 94% 97% 99% 1009 100%100610061006100610061006
Cypress Palm MS 1177 701 730 753 764 75060% 62% 64% 65% 64% 730 62%117711771177117711771177
Golden Gate MS 1239 1086 1113 1054 991 95488% 90% 85% 80% 77% 913 74%123912391239123912391239
2791 2751 2729 2701Middle Total 3422 78% 82% 80% 80% 79% 2652 77%2657 3422 3422 3422 3422 3422 3422
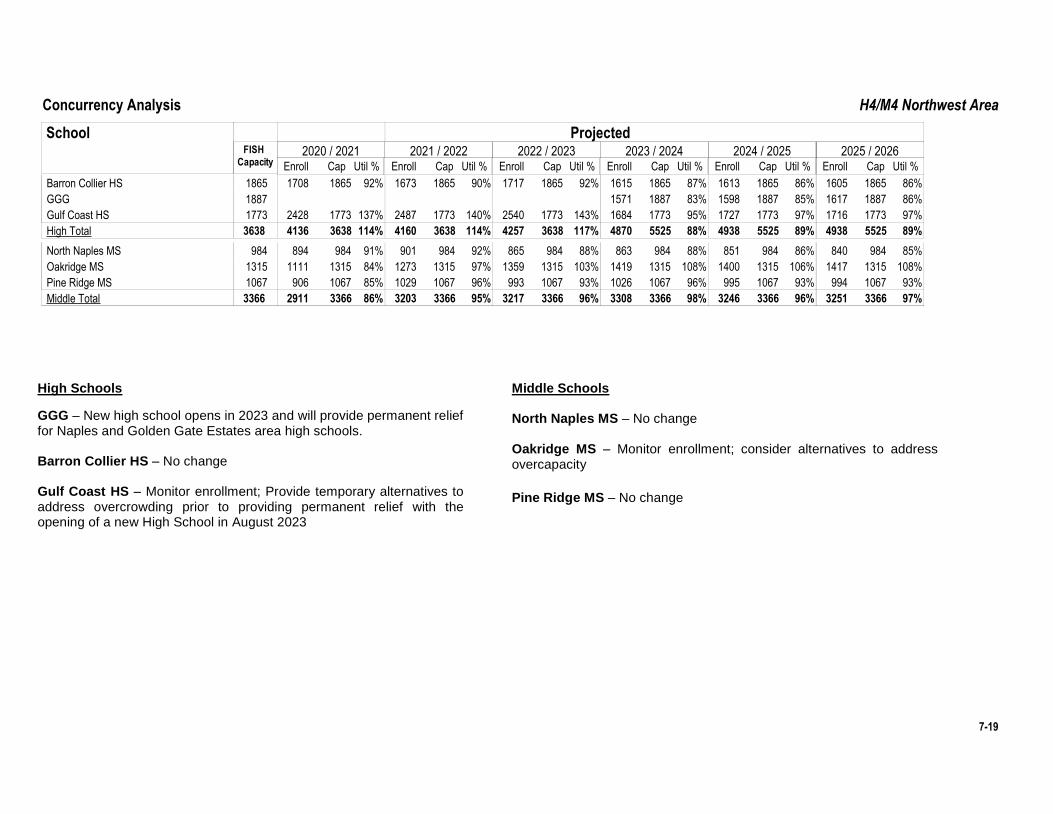
H4/M4 Northwest AreaConcurrency Analysis
High Schools
GGG – New high school opens in 2023 and will provide permanent relief for Naples and Golden Gate Estates area high schools.
Barron Collier HS – No change
Gulf Coast HS – Monitor enrollment; Provide temporary alternatives to address overcrowding prior to providing permanent relief with the opening of a new High School in August 2023
Middle Schools
North Naples MS – No change
Oakridge MS – Monitor enrollment; consider alternatives to address overcapacity
Pine Ridge MS – No change
School
Enroll Cap Util %
Projected
Enroll Cap Util % Enroll Cap Util % Enroll Cap Util % Enroll Cap Util %
2020 / 2021 2021 / 2022 2022 / 2023 2023 / 2024 2024 / 2025 2025 / 2026 Enroll Cap Util %
FISH Capacity
Barron Collier HS 1865 1708 1673 1717 1615 161392% 90% 92% 87% 86% 1605 86%186518651865186518651865
GGG 1571 159883% 85% 1617 86%188718871887
Gulf Coast HS 1773 2428 2487 2540 1684 1727137% 140% 143% 95% 97% 1716 97%177317731773177317731773
4160 4257 4870 4938High Total 3638 114% 114% 117% 88% 89% 4938 89%4136 3638 3638 3638 5525 5525 5525
North Naples MS 984 894 901 865 863 85191% 92% 88% 88% 86% 840 85%984984984984984984
Oakridge MS 1315 1111 1273 1359 1419 140084% 97% 103% 108% 106% 1417 108%131513151315131513151315
Pine Ridge MS 1067 906 1029 993 1026 99585% 96% 93% 96% 93% 994 93%106710671067106710671067
3203 3217 3308 3246Middle Total 3366 86% 95% 96% 98% 96% 3251 97%2911 3366 3366 3366 3366 3366 3366
7-19
1887
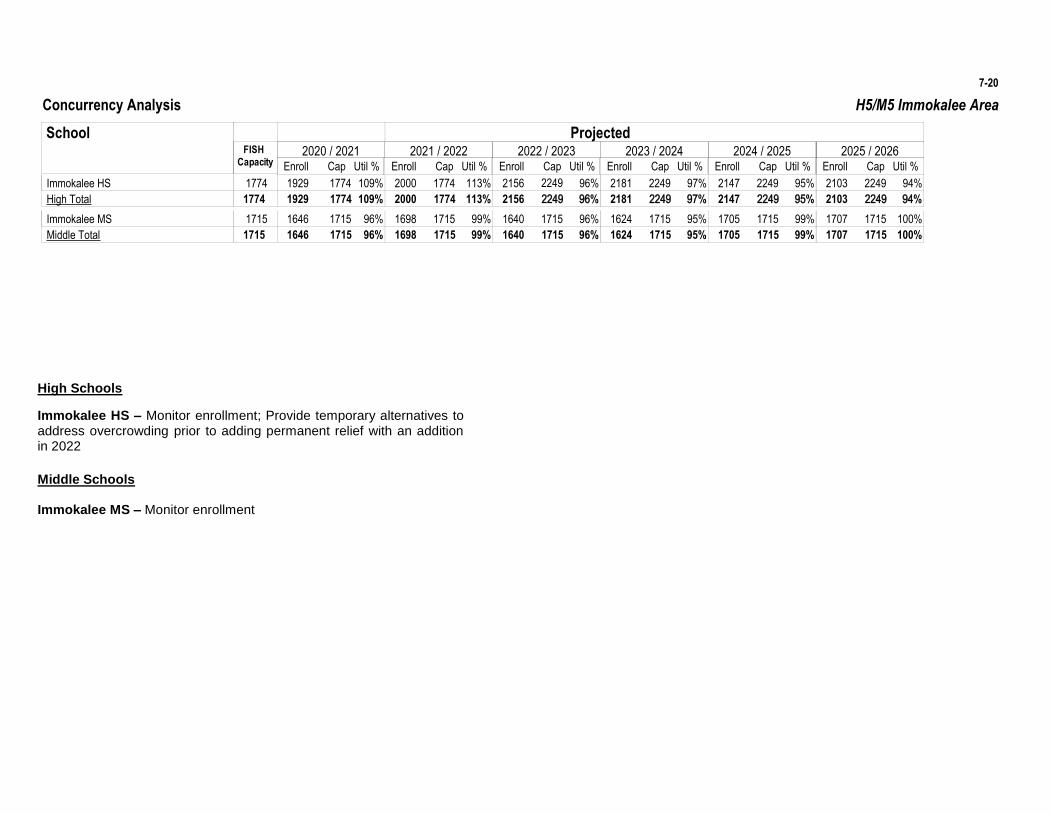
H5/M5 Immokalee AreaConcurrency Analysis
7-20
High Schools
Immokalee HS – Monitor enrollment; Provide temporary alternatives to address overcrowding prior to adding permanent relief with an addition in 2022
Middle Schools
Immokalee MS – Monitor enrollment
School
Enroll Cap Util %
Projected
Enroll Cap Util % Enroll Cap Util % Enroll Cap Util % Enroll Cap Util %
2020 / 2021 2021 / 2022 2022 / 2023 2023 / 2024 2024 / 2025 2025 / 2026 Enroll Cap Util %
FISH Capacity
Immokalee HS 1774 1929 2000 2156 2181 2147109% 113% 96% 97% 95% 2103 94%22492249224917741774
2000 2156 2181 2147High Total 1774 109% 113% 96% 97% 95% 2103 94%1929 1774 1774 2249 2249 2249 2249Immokalee MS 1715 1646 1698 1640 1624 170596% 99% 96% 95% 99% 1707 100%171517151715171517151715
1698 1640 1624 1705Middle Total 1715 96% 99% 96% 95% 99% 1707 100%1646 1715 1715 1715 1715 1715 1715
2249
H6/M6/E13 Panther PreserveConcurrency Analysis
No existing schools are located within this concurrency service area at this time. Capacity in adjacent areas will be used for residential development subject to concurrency.
7-21
H7/M7/E14 South EstatesConcurrency Analysis
7-22
No existing schools are located within this concurrency service area at this time. Capacity in adjacent areas will be used for residential development subject to concurrency.
H8/M8/E15 East ConservationConcurrency Analysis
No existing schools are located within this concurrency service area at this time. Capacity in adjacent areas will be used for residential development subject to concurrency.
7-23

THIS PAGE INTENTIONALLY LEFT BLANK
Chapter
8
Chapter 8
Appendices
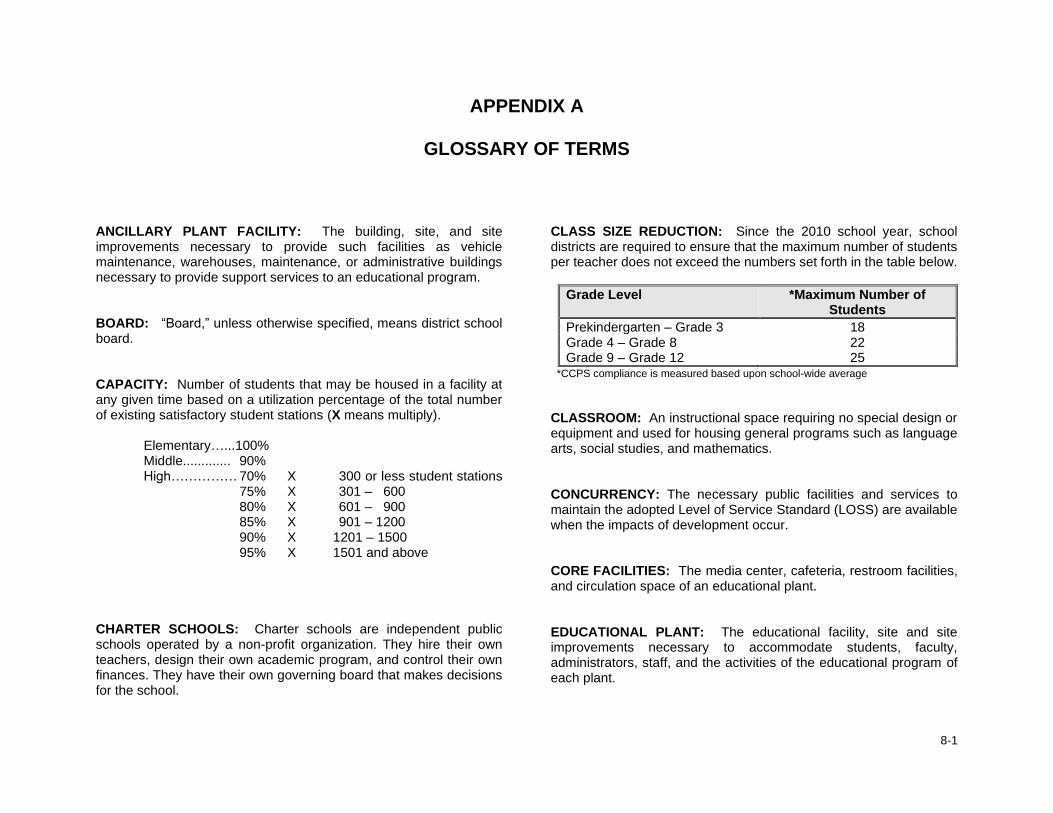
8-1
APPENDIX A
GLOSSARY OF TERMS ANCILLARY PLANT FACILITY: The building, site, and site improvements necessary to provide such facilities as vehicle maintenance, warehouses, maintenance, or administrative buildings necessary to provide support services to an educational program. BOARD: “Board,” unless otherwise specified, means district school board. CAPACITY: Number of students that may be housed in a facility at any given time based on a utilization percentage of the total number of existing satisfactory student stations (X means multiply). Elementary…...100% Middle............. 90% High…………… 70% X 300 or less student stations 75% X 301 – 600 80% X 601 – 900 85% X 901 – 1200 90% X 1201 – 1500 95% X 1501 and above CHARTER SCHOOLS: Charter schools are independent public schools operated by a non-profit organization. They hire their own teachers, design their own academic program, and control their own finances. They have their own governing board that makes decisions for the school.
CLASS SIZE REDUCTION: Since the 2010 school year, school districts are required to ensure that the maximum number of students per teacher does not exceed the numbers set forth in the table below.
Grade Level *Maximum Number of Students
Prekindergarten – Grade 3 18 Grade 4 – Grade 8 22 Grade 9 – Grade 12 25
*CCPS compliance is measured based upon school-wide average
CLASSROOM: An instructional space requiring no special design or equipment and used for housing general programs such as language arts, social studies, and mathematics. CONCURRENCY: The necessary public facilities and services to maintain the adopted Level of Service Standard (LOSS) are available when the impacts of development occur. CORE FACILITIES: The media center, cafeteria, restroom facilities, and circulation space of an educational plant. EDUCATIONAL PLANT: The educational facility, site and site improvements necessary to accommodate students, faculty, administrators, staff, and the activities of the educational program of each plant.
8-2
EDUCATIONAL PLANT SURVEY: A systematic study of educational and ancillary plants and the determination of future needs to provide appropriate educational programs and services for each student. EXCEPTIONAL STUDENT EDUCATION (ESE): Autism Spectrum Disorder Deaf or Hard of Hearing Developmentally Delayed Dual Sensory Impaired
Emotional/Behavioral Disability Gifted
Hospital Homebound Intellectual Disabilities Orthopedically Impaired Other Health Impairments Specific Learning Disabilities Speech and Language Impaired Visually Impaired EXCEPTIONAL STUDENT EDUCATION CLASSROOM: A classroom designed to provide instruction for exceptional students according to specific needs. FEASIBILITY STUDY: The examination and analysis of information related to projected educational facilities to determine whether they are reasonable and possible. FLORIDA EDUCATION FINANCE PROGRAM (FEFP): The Florida Education Finance Program (FEFP) is the basic source of State revenues for general operations of the school district. The key feature of the (FEFP) program is to base financial support for education upon the individual student participating in a particular program. The complex FEFP formula for distribution of the State revenues to the school district takes into consideration the full-time equivalent (FTE)
membership of the student, base student allocation, program cost factor weights, and local cost differentials. FLORIDA INVENTORY OF SCHOOL HOUSES (FISH): An official inventory, based on design, of all District owned facilities. INTERMEDIATE CLASSROOM: A general classroom designed for students in grades 4 through 8. LEVEL OF SERVICE STANDARD (LOSS): an indicator of the extent or degree of service provided by a facility based on and related to the operational characteristics of the facility.
MAINTENANCE AND REPAIRS: The upkeep of educational and ancillary plants, including, but not limited to, roof or roofing replacement short of complete replacement of membrane or structure; repainting of interior or exterior surfaces; resurfacing of floors; repair or replacement of glass; repair of hardware, furniture, equipment, electrical fixtures, and plumbing fixtures; and repair or resurfacing of parking lots, roads, and walkways. “Maintenance and repair” shall not include renovation except for the replacement of equipment with new equipment or equal systems meeting current code requirements, provided that the replacement item neither places increased demand upon utility services or structural supports nor adversely affects the function of safety to life systems. NEW CONSTRUCTION: Any construction of a building or unit of a building in which the entire work is new or an entirely new addition connected to an existing building. PRIMARY CLASSROOM: A special classroom designed for children in grades Pre-K through 3. These classrooms have restrooms and hand washing facilities located within the classroom or in adjoining spaces that may be a part of two or more classrooms.
8-3
REMODELING: The changing of existing facilities by rearrangement of spaces and their use and, as an example, includes, but is not limited to, the conversion of two classrooms to a science laboratory or the conversion of an open plan arrangement to a closed plan configuration. RENOVATION: The rejuvenating or upgrading of existing facilities by installation or replacement of materials and equipment and includes, but is not limited to, interior or exterior reconditioning of facilities and spaces; air conditioning, heating, or ventilating equipment; fire alarm systems; emergency lighting; electrical systems; and complete roofing or roof replacement, including replacement of membrane or structure. REVENUE SOURCES:
Beginning Balance: represents the unencumbered and unspent funds available after all accounting records have been closed for a given fiscal year. Some of the beginning fund balance may represent rollover of unspent funds from the prior year for which projects have not yet been completed or encumbered. Capital Improvement Tax: an ad-valorem tax authorized by section 1011.71(2), F.S., and allows School Boards to levy up to 1.50 mils for construction projects, remodeling and renovation, purchase of school buses and other eligible equipment purchases. This 5-year capital plan is based on a millage rate of 1.50 mils in year one and 1.15 mils in the remaining four years in anticipation of a tax neutral voter approved referendum that would shift the tax burden between capital and operating funds. Capital Outlay and Debt Service (CO&DS): funds derived from the motor vehicle license tax collected and distributed by the state.
CFWD of Designated Reserves: reserves set aside for designated purposes being carried forward for future years.
Charter Capital Flow Thru: State funds that are received on behalf of Charter Schools Impact Fees: a charge on new development to pay for the construction or expansion of schools related to growth created by new residential construction. Impact fees are levied against the construction of a dwelling unit at the same time that a permit is issued. Interest Income: interest earned on (idle) funds invested by the District in accordance with Board policy on investments. Other: Other income represents the refund of fuel taxes and any other miscellaneous revenue that could be received during the year. Public Education Capital Outlay (PECO) Maintenance: gross receipts utility taxes are the source of revenues for Public Education Capital Outlay (PECO) funding. School Districts have not been allocated these funds in recent years. Reserve Usage: designated reserves being utilized to fund projects.
S.R.E.F.: State Requirements for Education Facilities (SREF) contains the state’s standards for planning and construction of educational facilities and ancillary spaces. SENIOR HIGH CLASSROOM: A general classroom designed for students in grades 9 through 12. STUDENT STATION: Square footage required per student (as defined in Section 6.1, SREF) for instructional program based on the particular course content to be offered.
8-4
VOCATIONAL CLASSROOM: An instructional area designed for, or provided with, special built-in equipment for industrial arts and vocational or trade learning activities, e.g. mechanics, machine tools, sheet metal work, wood working, electrical trades, radio, plumbing, masonry, aviation, printing/graphics, refrigeration, air conditioning, commercial food preparation, health services, cosmetology, and agriculture/horticulture.
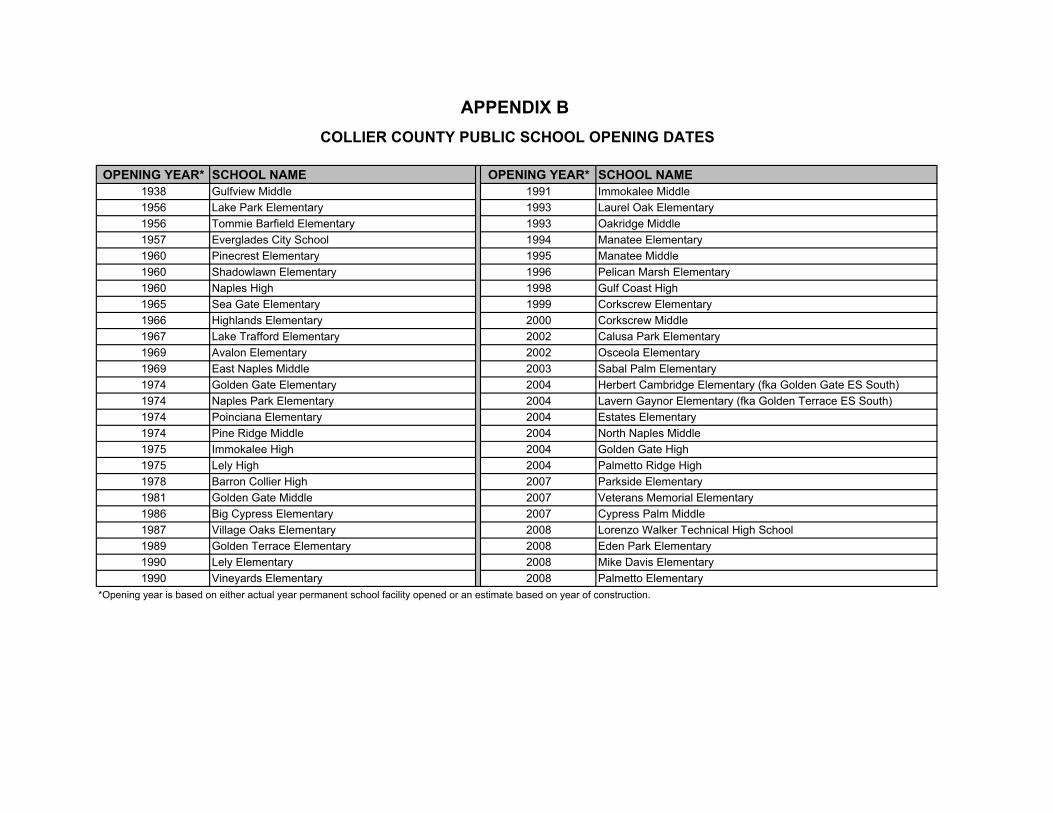
OPENING YEAR* SCHOOL NAME OPENING YEAR* SCHOOL NAME1938 Gulfview Middle 1991 Immokalee Middle1956 Lake Park Elementary 1993 Laurel Oak Elementary1956 Tommie Barfield Elementary 1993 Oakridge Middle1957 Everglades City School 1994 Manatee Elementary1960 Pinecrest Elementary 1995 Manatee Middle1960 Shadowlawn Elementary 1996 Pelican Marsh Elementary1960 Naples High 1998 Gulf Coast High1965 Sea Gate Elementary 1999 Corkscrew Elementary1966 Highlands Elementary 2000 Corkscrew Middle1967 Lake Trafford Elementary 2002 Calusa Park Elementary1969 Avalon Elementary 2002 Osceola Elementary1969 East Naples Middle 2003 Sabal Palm Elementary1974 Golden Gate Elementary 2004 Herbert Cambridge Elementary (fka Golden Gate ES South)1974 Naples Park Elementary 2004 Lavern Gaynor Elementary (fka Golden Terrace ES South)1974 Poinciana Elementary 2004 Estates Elementary1974 Pine Ridge Middle 2004 North Naples Middle1975 Immokalee High 2004 Golden Gate High1975 Lely High 2004 Palmetto Ridge High1978 Barron Collier High 2007 Parkside Elementary1981 Golden Gate Middle 2007 Veterans Memorial Elementary1986 Big Cypress Elementary 2007 Cypress Palm Middle1987 Village Oaks Elementary 2008 Lorenzo Walker Technical High School1989 Golden Terrace Elementary 2008 Eden Park Elementary1990 Lely Elementary 2008 Mike Davis Elementary1990 Vineyards Elementary 2008 Palmetto Elementary
*Opening year is based on either actual year permanent school facility opened or an estimate based on year of construction.
COLLIER COUNTY PUBLIC SCHOOL OPENING DATES
APPENDIX B
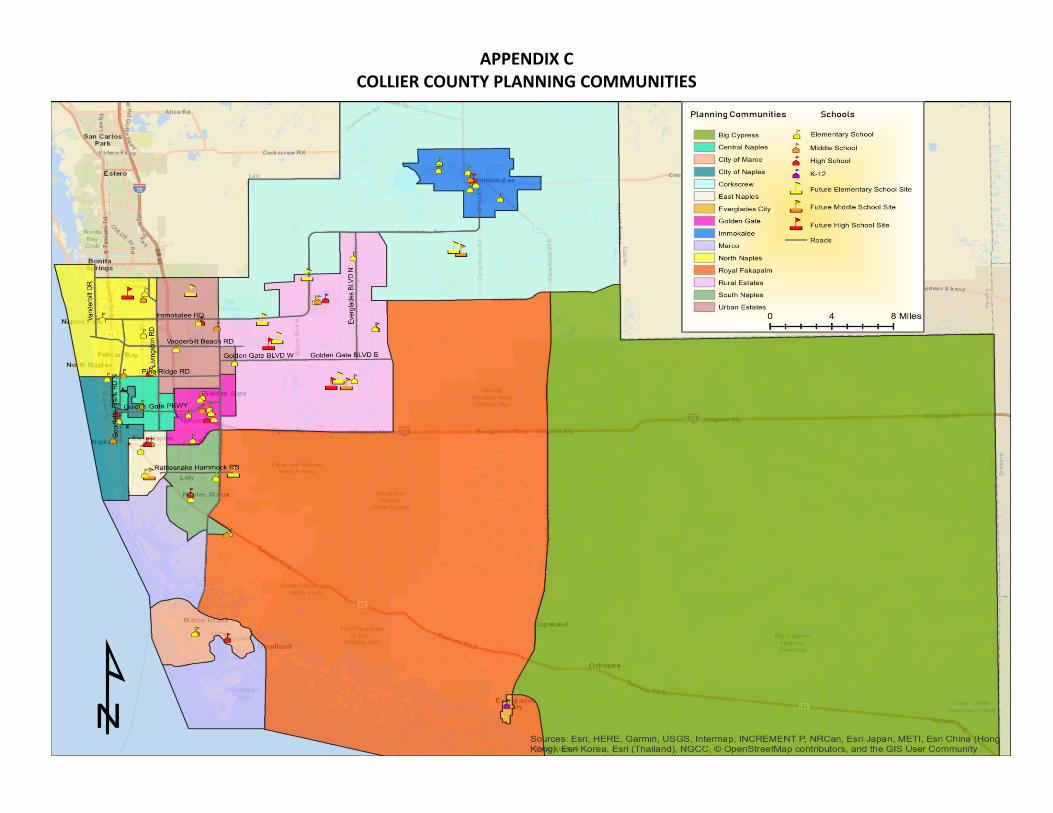
APPENDIX C COLLIER COUNTY PLANNING COMMUNITIES