Embed Size (px)
Citation preview

Am. J. Trop. Med. Hyg., 81(6), 2009, pp. 950–960doi:10.4269/ajtmh.2009.09-0132Copyright © 2009 by The American Society of Tropical Medicine and Hygiene
950
*Address correspondence to OraLee H. Branch, Department of Medical Parasitology, New York University, 341 E. 25th Street, OPH, New York, NY 10010. E-mail: [email protected]
Plasmodium falciparum and Plasmodium vivax Infections in the Peruvian Amazon: Propagation of Complex, Multiple Allele-Type Infections without Super-Infection
Patrick L. Sutton , Victor Neyra , Jean N. Hernandez , and OraLee H. Branch * Department of Infectious Diseases, University of Alabama at Birmingham, Birmingham, Alabama; Instituto
de Medicina Tropical “Alexander von Humboldt,” Universidad Peruana Cayetano Heredia, Lima, Peru; Universidad Nacional de la Amazonia Peruana–Laboratorio de Investigaciones Productos Naturales Anti-parasitarios, Iquitos,
Peru; Department of Medical Parasitology, New York University School of Medicine, New York, New York
Abstract. Outcrossing potential between Plasmodium parasites is defined by the population-level diversity (PLD) and complexity of infection (COI). There have been few studies of PLD and COI in low transmission regions. Since the 1995–1998 Peruvian Amazon epidemic, there has been sustained transmission with < 0.5 P. falciparum and < 1.6 P. vivax infections/person/year. Using weekly active case detection, we described PLD by heterozygosity (H e ) and COI using P. falciparum Pf msp1-B2 and P. vivax Pv msp3α. Not being homologous genes, we limited comparisons to within species. P. falciparum ( N = 293) had low (H e = 0.581) and P. vivax ( N = 186) had high (H e = 0.845) PLD. A total of 9.5% P. falciparum infections and 26.3% P. vivax infections had COI > 1. Certain allele types were in more mixed infec-tions than expected by chance. The few appearances of new alleles could be explained by stochastic polymerase chain reaction detection or synchronization/sequestration. The results suggest propagation of mixed infections by multiple inoc-ula, not super-infection, implying decade-long opportunity for outcrossing in these mixed infections.
INTRODUCTION
Despite near eradication of human malaria pathogens from the Peruvian Amazon between 1960 and 1990, Plasmodium falciparum and Plasmodium vivax re-emerged in 1991 and 1994, respectively. The brunt of the epidemic occurred between 1995 and 1998, when P. falciparum malaria dominated P. vivax malaria transmission 2:1. However, as the epidemic was curbed, likely because of effective intervention efforts of fumigation combined with free and highly controlled drug treatment, P. falciparum accounted for less than one third of the malaria infections in this region (1:3 ratio of P. falciparum infections compared with P. vivax ). 1,2 Since 2000, there has been sustained low transmission. Active and passive case detection from 2003 to 2004, in one of the highest malaria-endemic regions dur-ing the malaria transmission season, showed a prevalence rate of P. falciparum = 0.13 and P. vivax = 0.39 infections/person/malaria season. 2
Several features of malaria transmission at this study site make it particularly interesting. First, the low transmission rates enable us to determine the malaria parasite genetic diversity in discrete (non-overlapping) infections within a rel-atively newly exposed population. 2 Second, the independent characterization of P. falciparum and P. vivax genetic diversity in a sympatric population where there is only one mosquito vector, Anopheles darlingi , allows for more direct interspecies comparisons. 1,2 Finally, malaria infections in this geographic region are surprisingly mild, with > 50% of both P. falciparum and P. vivax infections detected by active case detection being asymptomatic. 2 Together, the unique features of malaria in this study region may provide clues to how malaria genetic diver-sity is maintained in low transmission and the relationship between genetic diversity and the development of immunity and possible drug resistance.
Population-level diversity (PLD) is typically defined by examining genetic variation occurring in variable antigenic loci and/or neutral (purportedly non-antigenic) loci. Because
of the low transmission in the Peruvian Amazon, it is also possible to examine PLD occurring in a single mixed-clone infection. Genotyping methods that identify one or more poly-morphic, single-copy loci can be used to assess the minimum number of parasite allele-types present within a given infec-tion; this is termed the complexity of infection (COI). 3–8 In this study, we studied the PLD and COI for P. falciparum and P. vivax independently, using the P. falciparum merozoite surface protein-1 block 2 region ( Pf msp1-B2) and P. vivax merozoite surface protein-3α ( Pv msp3α), respectively.
Pf MSP1-B2 is a highly variable repeat-length region near the N terminus of Pf MSP1 (PlasmoDB gene ID: PF1475w). Three allelic families (K1, Mad20, and RO33), identifiable by polymerase chain reaction (PCR) of the encoding single copy gene using respective conserved flanking sequences, have been detected globally in all transmission regions. 3–13 K1 and Mad20 allelic families can be further distilled by base pair length/size differences observed after electrophoresis because of the expansion and contraction of internal repeating motifs, whereas RO33 is monomorphic in size. 8,9 Both PLD and COI can be defined by the identification of size-specific alleles within each allelic family.
Pv MSP3α also contains an internal region comprised of repeating motifs of varying length (PlasmoDB gene ID: PVX_097720). 14,15 Three allelic families have been observed after PCR using P. vivax conserved primers that broadly char-acterize Pv msp3α: A = 1.8–1.9 kb, B = 1.5 kb, and C = 1.1–1.2 kb. 16–22 Diversity within these allelic families can be further exposed by digesting the PCR product with the restriction enzymes Hha I and Alu I. 18 Pv msp3α genotyping patterns can be compiled by using both PCR and restriction fragment length polymorphism (RFLP) to identify infecting alleles and define the PLD and COI.
High PLD (high levels of polymorphism) in both Pf msp1-B2 and Pv msp3α has been suspected to arise because of variant-specific immunity, resulting in diversifying selection in the population of parasites. 14,19,21,23–26 Alternatively or additionally, the high PLD could be attributable to asexual rapid diversifi-cation of repeat motifs and modest functional constraints on the encoding merozoite surface protein repeat regions. 10,27–31 The high levels of polymorphism in these antigenic loci

951DIVERSITY OF PLASMODIUM SPECIES IN PERU
results in a fine characterization of infecting parasites, which explains their frequent use in malaria genetic diversity studies. Further characterization of the PLD and COI can be achieved by sequencing these regions. Determining PLD and COI of P. falciparum and P. vivax provides insight into the transmis-sion dynamics, population structure, and potential for sexual recombination within the mosquito vector.
In this study, we examined PLD and COI using Pf msp1-B2 and Pv msp3α. Uniquely, we have weekly sampling to consider the changing parasite genotypes overtime. The low transmis-sion in this Peruvian population suggests that a COI > 1 is caused by one inocula; that is, two genotypes inoculated by one mosquito versus overlapping infections (super-infection). The purpose of this study is to establish the baseline genetic diversity levels in this region of the Peruvian Amazon. We hypothesized that there would be low P. falciparum and low P. vivax PLD and COI. We propose a molecular test and discuss the evolutionary consequence of mixed infections without super-infection.
MATERIALS AND METHODS
Study design. Our study was conducted in Iquitos, Peru (Zungarococha community, N = 1907). 2 Blood samples were collected during the malaria transmission season (January–July) in 2003 and 2004, for a total of 10 months of active case detection. 2 All the samples were obtained after informed consent. Details on the study site and design are described in Branch and others. 2 In brief, active case detection and passive case detection obtained 3,574 samples from 1,735 individuals participating in this study. Active case detection included a beginning and ending malaria season community-wide cross-sectional survey and also a selection of ~200 individuals each month during the malaria season for weekly visits for 1 month. Additionally, there was passive case detection executed in the health center; therefore, it is possible that a detected malaria infection did not have weekly sampling available.
In the active case detection, blood slides from individu-als who had a body temperature of ≥ 38.3°C, reported hav-ing a high fever within 2 days, or had hematocrit < 30% pcv, had their blood slides read by expert microscopists within 1 day and were treated within 1 day if positive. If an individual was asymptomatic, there could be 6 days before reading the microscopy slide. At the next scheduled visit (1 week later), another blood sample was collected, and any individual who was found with malaria parasites on the week before visit had their blood slide read immediately. Therefore, asymptomatic individuals had more than one blood slide collected during a given infection before treatment. Treatment regimens are reported in Branch and others. 2
DNA extraction and testing for Plasmodium species. All blood samples, positive or negative by microscopy, underwent DNA extraction by Qiagen DNeasy Blood and Tissue Kits and were tested for presence of Plasmodium species using a nested-multiplex PCR method targeting DNA encoding the small subunit ribosomal protein (ssrDNA) (Qiagen Inc., Valencia, CA). 32 For this species-specific ssrDNA PCR diagnosis and PCR for genotyping (described below), PCR mastermixes were comprised of primers at the indicated concentration (Integrated DNA Technologies, Coralville, IA): 2.0 mmol/L concentration of deoxynucleoside triphosphate (dNTP) mixture (Invitrogen, Carlsbad, CA); MgCl 2 at a concentration of 1 mmol/L
(Promega, Madison, WI); 5× PCR buffer, Taq polymerase (Go Taq Flexi; Promega), molecular grade water, and blood extracted DNA (genomic DNA adjusted to 10–20 ng/μL) or externally amplified (PCR amplicon) DNA. All PCRs were conducted in an Eppendorf Mastercycler ep (Westbury, NY).
PCR genotyping Pf msp1-B2. Pf msp1-B2 genotyping was attempted on all available samples that were microscopy and/or PCR positive for P. falciparum (293 P. falciparum infection-months). Previously reported genotyping methods were used for main allelic family analysis, using all permutations of primers to detect any allele families that were one allele type in the 5′ direction and a different allele type in the 3′ direction. 8,10
PCR products for the K1, Mad20, and R033 allelic families were observed; we did not observe the Mad20-R033 recom-binant (MRrec) allele. 10 The amplicons from each PCR reac-tion were individually visualized by electrophoresis using a 1.5% concentration of UltraPure Agarose 1000 (Invitrogen). The alleles were characterized by allelic family and size of the amplified product using the Gel Doc gel analysis system (Bio-Rad Laboratories, Hercules, CA ). The lengths were assigned by rounding up or down to the nearest 10 bp characterization based on the 25 bp ladder (Invitrogen, Carlsbad, CA). Final allele assignment was determined by performing electropho-resis a second time, arranging the samples in order of base pair length determined from the first electrophoresis and con-firmed by sequencing. Samples with band sizes between 250 and 300 bp for both K1 and Mad20 allelic families (not shown) were found to be artifacts of the first external PCR and there-fore were removed from the analysis.
PCR genotyping Pv msp3a. The nested-PCR protocol of Bruce and others 16 was used on samples P. vivax positive by microscopy and/or PCR. Primers were used at a concentration of 5 μmol/L. For the further-discerning RFLP assay, 8 μL of the PCR products was digested with Hha I and Alu I enzymes, individually, overnight at 37°C (4 units of enzyme/reaction; Promega). The PCR-amplified products underwent electrophoresis on a 1.8% agarose gel (Low Range Ultra Agarose; Bio-Rad). Fragment sizes were determined using the Gel Doc gel analysis system (Bio-Rad). Additionally, gel images were evaluated by hand and compared with the software-based analysis to ensure fragment calling consistency. The resulting fragment sizes were assembled into an Excel file where there was a column for all possible sizes (one bin for every 10 bp). Each RFLP pattern was represented by having fragment sizes present/absent in the array of bins. Patterns with fragment sizes that overlapped or were within 20 bp across fragments were considered to be the same pattern.
Sequencing of Pf msp1-B2 and Pv msp3a. We sequenced a selection of infections (selecting without any apparent bias) representing the alleles detected for both P. falciparum and P. vivax . Using the product of the second PCR reaction (second in the two-step nested method), the amplified PCR products were isolated (Gel Extraction Kits; Qiagen). In all cases, the 5′ and 3′ nested-PCR primers were used in the sequencing reaction at a concentration of 2 μmol/L. Sequencing was performed on an ABI 3730 Genetic Analyzer (Applied Biosystems, Foster, CA).
Analysis of PLD and COI. We defined infections as one or more malaria-positive sample point(s) during the follow-up, which in many cases included time periods of the weekly active case detection. We considered all sampled time points within 1 month before and after the infection. The sampling

952 SUTTON AND OTHERS
could begin before the initial malaria positive sample or after, with an overall sampling time frame of ≤ 30 days (4 weeks of sampling follow-up planned). For this reason, infections are called “infection-months,” and this is the denominator used when considering number of infections followed and frequency of the different parasite alleles detected.
The expected heterozygosity, a measurement PLD, was cal-culated by the following formula: H e = 1/(1 − N )(1 – Σ p 2 i ) , with p equal to allele frequency and N equal to the number of alleles detected. The H e was used to quantify the overall genetic diver-sity in each species using the respective genotyping targets and also to compare the genetic diversity within each allelic family within each species. A COI > 1 could be determined by observ-ing multiple alleles within a single sample or by concatenating alleles observed in an infection-month.
We considered the transmission level by using both the active and passive case detection prevalence determined for the whole Zungarococha community in an earlier study 2 and by calculating the maximum transmission rate from the active and passive case detection prevalence in these 1,735 individu-als (dividing infections detected in these individuals by 1,735, with the actual rate being calculated by determining the rate of becoming infected during the active sampling). The range of these measures was 0.022–0.069 infections/person/month for P. falciparum and 0.065–0.107 infections/person/month for P. vivax. The highest transmission level was when considering the active case detection transmission rate calculation, which was 0.069 and 0.107 infections/person/month for P. falciparum and P. vivax, respectively. Therefore, to test the probability of mixed infections, we used this high-end transmission rate calculation.
RESULTS
Plasmodium falciparum and P. vivax infections detected. Between 2003 and 2004, there were 1,735 individuals contributing to 3,574 visits, including both active case detection and passive case detection. Species-specific PCR analysis targeting the genes encoding 18 ssrDNA was conducted on all sample visits (microscopy positive and negative). Given the design of the study, with frequent follow-up sampling after infections are detected as well as active case detection visits in the absence of symptoms, it was possible that a single infection could be sampled multiple times. To allow for this possibility in our analysis, we used the term infection-months instead of infections. Infection-months were defined from the sampling protocol: individuals were followed for up to 30 days with weekly sampling over 1 month. The dynamics within this unit-month is used to describe the PLD and COI and determine
whether any detection of new alleles might suggest that there was a super-infection during this infection-month.
There were 308 P. falciparum infection-months identified within 2003–2004, of which 293 were selected for genotyping in this study. Of these 293 infection-months selected, 180 were identified by microscopy through active case detection, 63 were sub-microscopic and identified by 18 ssrDNA methods through active case detection, and an additional 50 infection-months were identified by microscopy and/or 18 ssrDNA methods through passive case detection (passive case detected infection-months do not have follow-up data; Table 1 ).
For P. vivax , there were 752 infection-months identified within 2003–2004, of which 186 (~25%) were selected for genotyping in this study. Of these 186 infection-months, 136 were identified through active case detection and 50 were identified through passive case detection. Seventy-one of the 136 active case detected infection-months were identified by microscopy and 65 were sub-microscopic and identified by 18 ssrDNA methods. The 50 passive case detected infection-months were detected by microscopy and/or 18 ssrDNA meth-ods ( Table 1 ).
Of those infection-months that had multiple sample points, new alleles were detected in the successive sample points in only 2 of the 243 P. falciparum (0.8%) and 17 of the 136 P. vivax (12.5%) infection-months where there were multiple sample points. Most P. falciparum and P. vivax infection-months were single allele infections and/or did not have new alleles detected over time; as will be described in detail below, this could be explained by stochastic PCR detection, allele synchronization/sequestration, or, in the case of P. vivax, relapse.
Pf msp1-B2, population diversity. The K1, Mad20, and RO33 allele families that have been detected globally in prior studies were detected in Zungarococha. We observed two K1 allele types (170 and 195 bp), two Mad20 allele types (200 and 210 bp), and one R033 allele type (140 bp). There were a total of 322 parasite allele detections: 202 (62.7%) K1, 112 (34.8%) Mad20, and 8 (2.5%) RO33. The most frequent K1 allele type detected in this population was K1-195 ( N = 176; 54.7%); K1-170 was observed less frequently ( N = 26; 8.1%). Of the Mad20 allelic family, the Mad20-210 allele type was most frequent ( N = 87, 27.0%), whereas Mad20-200 was observed less frequently ( N = 25, 7.8%; Figure 1 ).
To quantify the PLD, H e was calculated for the entire pop-ulation (including all three allelic families) and within each allelic family. When considering the entire population, H e was 0.581, whereas individually, the H e within K1, Mad20, and RO33 allelic families was 0.221, 0.283, and 0.000, respectively.
To consider accuracy/resolution of the genotyping results, we sequenced 11 K1-170 (GenBank accession numbers:
Table 1 Plasmodium falciparum and P. vivax infections detected and genotyped between 2003 and 2004
Species Sample collection specification N No. included in
genotyping studyNo. with genotype present
in > 1 sample of infection-monthNo. with new alleles
detected in follow-up
P. falciparum Mx+ with weekly follow-up 182 180 51 2PCR+ (Mx−) with weekly follow-up 63 63 7 –Missing weekly follow-up 63 50 – – Total 308 293 58 2
P. vivax Mx+ with weekly follow-up 265 71 35 7PCR+ (Mx−) with weekly follow-up 97 65 5 10Missing weekly follow-up 390 50 – – Total 752 186 40 17
Mx+ = microscopy positive; Mx− = microscopy negative.

953DIVERSITY OF PLASMODIUM SPECIES IN PERU
FJ612009–FJ612019), 18 K1-195 (FJ612020–FJ612037), 2 Mad20-200 (FJ612038 and FJ612039), 24 Mad20-210 (FJ612040–FJ612063), and 2 RO33-140 (FJ612064 and FJ612065). The sequences coincided with the genotyping results; there was only one polymorphism, a synonymous nucleotide substitution within a Mad20-210 variant at position 101 (FJ612041).
Pf msp1-B2, complexity of infection. Of 293 genotyped P. falciparum infection-months, there were 265 (90.5%) single genotype infections and 28 (9.5%) mixed genotype infections ( Table 2 ). Of the mixed infections, 4 (1.4%) were mixed alleles of the same allelic family and 24 (8.2%) were mixed alleles of at least two allelic families. The COI was equal to 1 in 90.5% of infection-months, COI = 2 in 9.2% of infection-months, and COI = 3 in 0.3% of infection months.
Certain mixed infections were detected at a rate more than expected by super-infection based on the allelic frequencies of the single counterparts as a factor of the transmission rate ( Table 2 ). The Mad20-200 allele type was observed 24 times in this population; of those, it was observed mixed with the K1-195 allele-type in seven instances. The expected rate of a K1-195 + Mad20-200 mixed infection occurring by super-infection would be 0.0018 (or [(0.5222 × 0.0512) × 0.069]), respectively. The
observed rate of these two alleles occurring concurrently in the same infection-month was 0.0239, which was significantly greater than the expected rate of two separate inoculating events ( P < 0.01, Fisher exact test). Similarly, of the eight times R033 was observed in this population, six times was in a mixed infection with K1-195. The expected rate for a K1-195 + RO33 mixed infection occurring by super-infection would be 0.0001 (or [(0.5222 × 0.0034) × 0.069]); yet, this combination was observed in 0.0204 of the infections, which was significantly greater than expected ( P < 0.01, Fisher exact test). Overall, inter-family mixed infections (mixed alleles of different allelic fami-lies) were observed 8.64 times more frequently than intrafamily mixed infection (mixed alleles of the same allelic family).
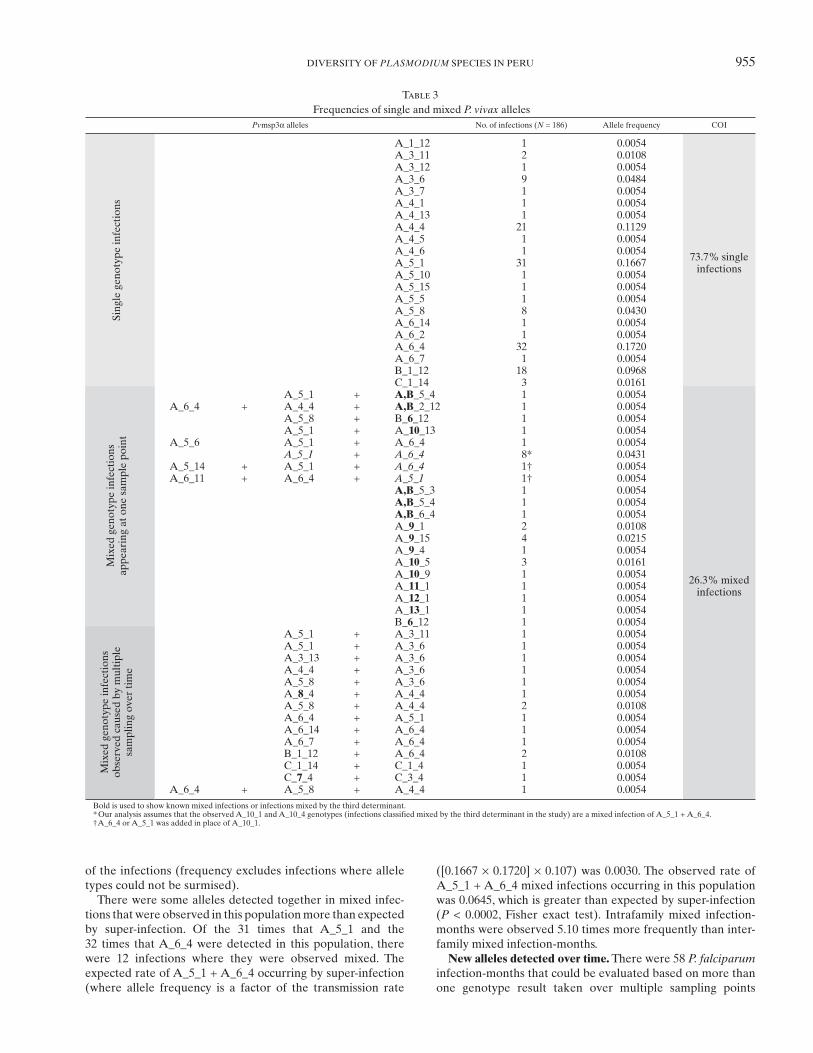
Pv msp3a population diversity. Initially, we identified allelic families by size differences in the undigested PCR product. Further characterization was made by RFLP digestion of these amplified products with Hha I and Alu I digestive enzymes. Genotyping results (allele types) were described by a combination of both PCR and RFLP pattern codes: “ Allelic Family_Hha I pattern_Alu I pattern ” ( Figure 2A and 2B ). By this method we observed all three Pv msp3α allelic families found globally (A = 1.9 kb, B = 1.5 kb, C = 1.2 kb). There were 198 of 222 allele detections (from 168 of 186 infection-months) where the PCR-RFLP combination pattern ( Allelic Family_Hha I pattern_Alu I pattern ) suggested a single, discernible allele present. These 198 alleles were used when considering the allele frequency ( Table 3 ). We did not include patterns suggesting multiallele detections (the 24 allele detections shown in bold in Table 3 ) when we could not discern the components of mixed infections.
In the 168 infection-months considered in the Pv msp3α allele frequency calculation (excluding 18 individuals who had a RFLP pattern that could not be discerned to a single allele type), there were 172 (86.9%) A-type, 20 (10.1%) B-type, and 6 (3.0%) C-type alleles found (number exceeds total because there were identifiable mixed infections; Figure 3 ). In this analysis, significant intrafamily diversity was found within the A-type allelic family (23 alleles), whereas little diversity was observed in the B- and C-types (1 and 3, respectively).
As with Pf msp1-B2, the H e was calculated to determine the overall PLD and the PLD within each allelic family. Because the Hha I fragments were more discernible, we calculated H e based solely on the Allelic Family_Hha I combination. The overall H e observed within the population was 0.845, whereas individually, the H e values were 0.808 and 0.600 for the A-type and C-type allelic families, respectively.
To determine how the 44 PCR-RFLP genotype combi-nations reflected sequence differences, we sequenced 68 samples representing 14 of the 44 different allele types. Of the 68 samples, there were 40 different sequences observed (FJ612066–FJ612105), where the presence of at least one non-synonymous substitution defined a sequence as “unique.” Sequences were correlated to the original PCR-RFLP allele types observed by the selection of eight regions of variabil-ity ( Figure 4 Supplementary Data Figure 1 available online at www.ajtmh.org ). Of the 40 sequences, there were eight dis-tinct groups. These eight sequence groups were well described by the PCR-RFLP study (six sequences could not be included because of incomplete sequencing data). If a sequence within a group defined a unique allele type or if a genotype defined a sequence, this was considered concordant. The PCR-RFLP genotype combination and sequencing data was 84.9% concor-dant ( Figure 4 ; Supplementary Data Figure 1 ), indicating that
Table 2 Frequencies of single and mixed P. falciparum alleles
Pf msp1-B2 alleles
No. of infection-months
( N = 293)Allele
frequency COI
Sing
le
geno
type
in
fect
ions K1-170 22 0.0751
90.5% single
infections
K1-195 153 0.5222Mad20-200 15 0.0512Mad20-210 74 0.2526RO33-140 1 0.0034
Mix
ed g
enot
ype
infe
ctio
ns
K1-170, K1-195 2 0.0068
9.5% mixed infections
K1-170, Mad20-200 1 0.0034K1-170, Mad20-210 1 0.0034K1-195, Mad20-200 7 0.0239K1-195, Mad20-210 8 0.0273Mad20-200, Mad20-210 2 0.0068K1-195, RO33-140 5 0.0171Mad20-210, RO33-140 1 0.0034K1-195, Mad20-210,
RO33-1401 0.0034
Figure 1. Frequencies of Pf msp1-B2 allele types. Shading is used to discriminate between individual alleles within each bar on the graph. Individual allele frequencies are shown, with allelic families on the x -axis and respective frequencies on the y -axis.

954 SUTTON AND OTHERS
Figure 2. RFLP patterns by ( A ) Hha I and ( B ) Alu I. Represented are the fragment patterns as found by observing RFLP fragments on an elec-trophoresis gel and placing the fragment patterns in 20 bp bins for comparison. Patterns were described as waves, where the bands were detected. If a pattern was of bands that overlapped within 1 SD of another pattern in more than three waves, it was considered the same. *It was explained by a mix of Hha I Patterns 5 and 6. Alu I was less allele-type discriminating because of lower size range and variation; the lines separating Waves 5–7 were removed because of overlapping patterns. Hatch marked blocks are where there were two fragments in the same 20 bp bin.
> 80% of the variation within the sequence is reflected in our PCR-RFLP pattern. Although sequencing methods provide a more accurate assessment of the PLD present in Pv msp3α, this PCR-RFLP genotyping method allows for the differentia-tion between single genotype and mixed genotype infections, which cannot be resolved by sequencing methods alone.
Pv msp3a complexity of infection. In total, there were 137 (73.7%) single genotype infections and 49 (26.3%) mixed
genotype infections ( Table 3 ). Of the mixed infections detected, 11 (5.9%) were due to the detection of more than one allelic family (determinant 1), 23 (12.4%) were due to alternating alleles concatenated into the same infection-month (determinant 2), and 15 (8.07%) were mixed as a result of the summation of RFLP fragments exceeding the allelic family size by 2 SD (determinant 3). A COI = 1 was observed in 73.7%, a COI = 2 in 15.6%, and a COI = 3 in 2.7%
955DIVERSITY OF PLASMODIUM SPECIES IN PERU
of the infections (frequency excludes infections where allele types could not be surmised).
There were some alleles detected together in mixed infec-tions that were observed in this population more than expected by super-infection. Of the 31 times that A_5_1 and the 32 times that A_6_4 were detected in this population, there were 12 infections where they were observed mixed. The expected rate of A_5_1 + A_6_4 occurring by super-infection (where allele frequency is a factor of the transmission rate
([0.1667 × 0.1720] × 0.107) was 0.0030. The observed rate of A_5_1 + A_6_4 mixed infections occurring in this population was 0.0645, which is greater than expected by super-infection ( P < 0.0002, Fisher exact test). Intrafamily mixed infection-months were observed 5.10 times more frequently than inter-family mixed infection-months.
New alleles detected over time. There were 58 P. falciparum infection-months that could be evaluated based on more than one genotype result taken over multiple sampling points
Table 3 Frequencies of single and mixed P. vivax alleles
Pv msp3α alleles No. of infections ( N = 186) Allele frequency COISi
ngle
gen
otyp
e in
fect
ions
A_1_12 1 0.0054
73.7% single infections
A_3_11 2 0.0108A_3_12 1 0.0054A_3_6 9 0.0484A_3_7 1 0.0054A_4_1 1 0.0054A_4_13 1 0.0054A_4_4 21 0.1129A_4_5 1 0.0054A_4_6 1 0.0054A_5_1 31 0.1667A_5_10 1 0.0054A_5_15 1 0.0054A_5_5 1 0.0054A_5_8 8 0.0430A_6_14 1 0.0054A_6_2 1 0.0054A_6_4 32 0.1720A_6_7 1 0.0054B_1_12 18 0.0968C_1_14 3 0.0161
Mix
ed g
enot
ype
infe
ctio
ns
appe
arin
g at
one
sam
ple
poin
t
A_5_1 + A,B _5_4 1 0.0054
26.3% mixed infections
A_6_4 + A_4_4 + A,B _2_12 1 0.0054A_5_8 + B_ 6 _12 1 0.0054A_5_1 + A_ 10 _13 1 0.0054
A_5_6 A_5_1 + A_6_4 1 0.0054 A_5_1 + A_6_4 8 * 0.0431
A_5_14 + A_5_1 + A_6_4 1 † 0.0054A_6_11 + A_6_4 + A_5_1 1 † 0.0054
A,B _5_3 1 0.0054 A,B _5_4 1 0.0054 A,B _6_4 1 0.0054A_ 9 _1 2 0.0108A_ 9 _15 4 0.0215A_ 9 _4 1 0.0054A_ 10 _5 3 0.0161A_ 10 _9 1 0.0054A_ 11 _1 1 0.0054A_ 12 _1 1 0.0054A_ 13 _1 1 0.0054B_ 6 _12 1 0.0054
Mix
ed g
enot
ype
infe
ctio
ns
obse
rved
cau
sed
by m
ulti
ple
sam
plin
g ov
er ti
me
A_5_1 + A_3_11 1 0.0054A_5_1 + A_3_6 1 0.0054A_3_13 + A_3_6 1 0.0054A_4_4 + A_3_6 1 0.0054A_5_8 + A_3_6 1 0.0054A_ 8 _4 + A_4_4 1 0.0054A_5_8 + A_4_4 2 0.0108A_6_4 + A_5_1 1 0.0054A_6_14 + A_6_4 1 0.0054A_6_7 + A_6_4 1 0.0054B_1_12 + A_6_4 2 0.0108C_1_14 + C_1_4 1 0.0054C_ 7 _4 + C_3_4 1 0.0054
A_6_4 + A_5_8 + A_4_4 1 0.0054 Bold is used to show known mixed infections or infections mixed by the third determinant. * Our analysis assumes that the observed A_10_1 and A_10_4 genotypes (infections classified mixed by the third determinant in the study) are a mixed infection of A_5_1 + A_6_4. † A_6_4 or A_5_1 was added in place of A_10_1.

956 SUTTON AND OTHERS
( Table 1 ). Forty-eight (82.8%) of these had a COI = 1, 8 (13.8%) has a COI > 1 with no new allele types detected over time, and 2 (3.5%) had a COI > 1 with new allele types detected over time ( Table 4, left ). Of the 40 P. vivax infections we could evaluate over time, there were 19 (47.5%) that had a COI = 1 ( Allelic family_Hha I PCR-RFLP patterns), 4 (21.1%) with a COI > 1 with no new allele types detected over time, and 17 (42.5%) with new allele types detected over time (Table 4, right).
We hypothesized that the detection of new alleles over time was attributable to a multiple inoculation event from one mosquito, resulting in the stochastic PCR detection of alleles/alternating alleles based on parasite density rather than super-infection. To test this, we calculated the expected mixed geno-type infection frequency occurring by super-infection, using the formula Σ i [ p (1 − p ) × x ], with p equal to allele frequency of the i th allele and x equal to the maximum transmission rate observed in this study ( P. falciparum = 0.069; P. vivax = 0.107). The expected frequency of super-infection for P. falciparum and P. vivax was 4.24% and 9.01%, respectively. Testing the hypoth-esis of no super-infection (0), neither the P. falciparum nor the P. vivax expected frequency of super-infection was significantly dif-ferent from zero ( P = 0.24 and P = 0.12, respectively, Fisher exact test). The possibility of relapsing infections in P. vivax does not limit our conclusion that, over the infection-month, the appear-ance of new alleles by super-infection is expected to be rare.
DISCUSSION
The low transmission rates of both P. falciparum and P. vivax (0.13 and 0.39 infections/person/month, respectively) in the Peruvian Amazon prompted us to test the hypothesis that there would be low PLD and COI in both species. Here we independently compare the PLD and COI within P. falci-parum and P. vivax using the polymorphic antigens Pf msp1-B2 and Pv msp3α, respectively. This genetic diversity study was not meant to compare PLD between infecting species as in Ord and others, 33 which used homologous apical membrane antigen-1 (AMA1) encoding genes to elegantly characterize
Figure 4. Regions of Pvmsp3α sequence diversity correlated to PCR-RFLP genotyping data. Groupings were made based on a sim-ilarity of 90% between each region. Varying shades of gray within these PCR-RFLP patterns indicate relatedness within the group. Group numbers are given such that the smallest numbers represent the most frequent sequence code in the region. Differences of a single amino acid within a group are denoted by the grouping number fol-lowed by a lowercase letter. Numbers in bold indicate a difference greater than a single amino acid change. GenBank accession numbers: FJ612066–FJ612105.
Figure 3. Frequencies of Pv msp3α allele types. Shading is used to discriminate between individual alleles within each bar on the graph. Individual allele frequencies are shown, with allelic families on the x -axis and respective frequencies on the y -axis. Frequencies exclude alleles that are part of indiscriminable mixed infections.

957DIVERSITY OF PLASMODIUM SPECIES IN PERU
Table 4 Analysis of successive genotypes over infection-months for P. falciparum (left) and P. vivax (right)
Tx = treatment; Part. anon ID no. = participant anonymous ID number; ASYM = asymptomatic (no reported or measured fever > 37.5°C, hematocrit > 30%, parasitemia < 5,000/mL); M20, Mad20; R0, RO33; FU = follow-up.

958 SUTTON AND OTHERS
and compare the PLD between species in the mesoendemic Venezuelan Amazon. Although Pf msp1-B2 and Pv msp3α are not homologous encoding genes, we used these mark-ers because of their frequent use in earlier studies and their shown value as highly polymorphic markers that make fine distinctions between different parasites to define allele types. By defining the PLD and COI of P. falciparum and P. vivax species, correlative studies can be performed by drawing on this reported diversity as a baseline; for example, it provided the foundation for the future characterization of PLD and COI using neutral (purportedly non-antigenic) loci markers.
Using Pf msp1-B2 as a marker for genetic diversity in P. fal-ciparum , we quantified PLD and found low levels of genetic diversity within the entire population (H e = 0.581) and within each allelic family (K1 = 0.221, Mad20 = 0.283, and RO33 = 0.000). The Pf msp1-B2 diversity was significantly less in this Peruvian cohort than has been observed in hyper/holoendemic geographic regions, such as Senegal, 7 Papua New Guinea, 3 and western Kenya. 8 For example, in western Kenya, during a time with > 300 infected P. falciparum bites/person/night, there were as many as 21 P. falciparum allele types defined by Pf msp1-B2 at a population-level and up to 6 Pf msp1-B2 allele types detected in one infection. 8 Other studies in South America have reported similar or even lower PLD than observed in this study. 9,12–14,34 Recently, increased Pf msp1-B2 diversity was reported in a collaborative study using some samples from our cohort. 12 However, the results from this collaboration are not directly comparable because the previous study 1) included samples from different communities and years and 2) only reported genetic diversity based on sequencing methods. Defining PLD solely by sequencing eliminates the possibility of detecting mixed genotype infections and may result in the exclusion of rare alleles that are found paired in the population, such as RO33-140 paired with K1-195. In our study, sequenc-ing was used to further characterize the genetic diversity on a codon level and not as the primary method of allele detection.
We found high overall P. vivax PLD, quantified by expected heterozygosity (H e = 0.845) and similarly high levels of intra-family PLD (A-type = 0.808, C-type = 0.600) with the excep-tion of the B-type allelic family (H e = 0.000). Our results were consistent with other Pv msp3α PLD studies. 16–22 Relatively high PLD is expected within this polymorphic marker even in hypoendemic regions; from non-synonymous amino acid sub-stitutions to the expansion and contraction of the sequence by inclusion or exclusion of minor indels, increased diversity in Pv msp3α is a consequence of balancing selection or slipped-strand mismatch repair during replication. 21 In hyperendemic regions like Papua New Guinea (PNG), Bruce and others 16 reported that there were as many as 11 different alleles types detected in only 12 infections (133 bites/person/year) by a PCR-RFLP pattern defining method. More recently, Ord and others reported nine different Pv msp3α alleles from 131 infec-tions in the mesoendemic Venezuelan Amazon using sequenc-ing methods. In our study, we found 44 different allele types from 186 infection-months defined by the PCR-RFLP method and were even able to identify many complex infections. Sequencing confirmed the high P. vivax PLD and also showed additional genetic variation, permitting the identification of sub-alleles. Based on sequence results, we were able to cluster the 34 strains into eight different groups based on relatedness. Ord and others 21 suggested that A-type alleles are the puta-tive progenitors of the smaller B- and C-type alleles. Based on
the correlative PCR-RFLP/sequencing methods in this study, we clearly observed relatedness between these allelic fami-lies ( Figure 3 ) and submit that perhaps increased selection on A-type alleles decreases selection on the B- and C-type alleles, explaining their lack of diversity.
The few detections of new genotypes over the month sam-pling in this study might be attributable to 1) a new infection (super-infection), 2) relapsing infection, or 3) PCR not detect-ing all alleles that were inoculated in one mosquito bite (sto-chastic PCR results or alternating alleles caused by parasite densities in the host at the time of sample collection). 18,35,36 The increased frequency of new alleles detected over time in P. vivax might be attributable to infection by relapse, despite treatment with Primaquine. However, because of 1) the low transmission rate ( P. falciparum = 0.13 and P. vivax = 0.39 infections/person/malaria season), 2) high frequency of single genotype infec-tions ( P. falciparum = 90.5%, P. vivax = 73.7%), 3) the obser-vation of allelic pairs appearing together more frequently that expected by chance, and 4) the few observations of new alleles introduced over time ( P. falciparum = 2/58, P. vivax = 17/40), we predict that mixed genotype infections are likely the result of a multiple inoculation event. We calculated the expected rate of super-infection causing mixed genotype infections in this population based on the observed allele type frequencies and transmission rate; this calculation was even biased toward the null hypothesis by using the maximum observed transmis-sion rate in this study. We found that the mixed genotype infec-tions in this study are likely propagated by a single multiple inoculation event rather than by super-infection. Further study of the propagation of mixed genotype infections by a single inoculation event is necessary to confirm the intermittent role of super-infection in this region. Our future studies will investigate the homogenization of genomes as a consequence of alleles existing together over time and the role of natural selection on the alleles within these mixed infections.
Received March 13, 2009. Accepted for publication July 4, 2009.
Acknowledgments: The authors thank the Zungarococha commu-nity members and authorities for their ongoing commitment to the Malaria Immunology and Genetics in the Amazon (MIGIA) Study. The authors thank the Director of the Universidad Cayetano Heredia, Instituto de Medicina Tropical Alexander von Humboldt, Dr. Eduardo Gotuzzo, as well as Dr. Alejandro Llanos and Dr. Humberto Guerra, for their coordination and guidance. The authors thank the Universidad Nacional de la Amazonía Peruana, Laboratorio Naturales Antiparasitarios de la Amazonía, Dr. Lastenia Ruiz, and investigators for their coordination and technical assistance in completing a portion of the Pf msp1-B2 genotyping. The authors thank Dr. Willy Diaz for patient care and follow-up, Freddy Alava for enrollment and follow-up, Ever Alvarez and Anibal Sanchez for microscopy, Zoila Reategui and Elva Sanchez for patient visits, Dania Vela and Noelia Escobar for preparation of materials, separation and storage of blood samples, and data entry, Dr. Julian Rayner for consultation and manuscript review, and Dr. Robert Oster for his review of the statistics reported in this manuscript.
Financial support: This study was supported by RO1 Grant AI064831 from the National Institute of Health/National Institute of Allergy and Infectious Disease (2005–present) and pilot funding from the Gorgas Memorial Institute (2003) and Sparkman International Center for Public Health (2003).
Note: Supplementary Data Figure 1 can be found online at www.ajtmh.org .
Authors’ addresses: Patrick L. Sutton and OraLee H. Branch, Depart-ment of Infectious Diseases, University of Alabama at Birmingham, Birmingham, AL 35294. Victor Neyra, Instituto de Medicina Tropical

959DIVERSITY OF PLASMODIUM SPECIES IN PERU
“Alexander von Humboldt,” Universidad Peruana Cayetano Heredia, Lima, Peru. Jean N. Hernandez, Universidad Nacional de la Amazonia Peruana–Laboratorio de Investigaciones Productos Naturales Anti-parasitarios, Iquitos, Peru. OraLee H. Branch, Department of Medical Parasitology, New York University School of Medicine, New York, NY 10010.
REFERENCES
1. Aramburu GJ, Ramal AC, Witzig R, 1999. Malaria reemergence in the Peruvian Amazon region. Emerg Infect Dis 5: 209–215.
2. Branch OH, Casapia WM, Gamboa DV, Hernandez JN, Alava FF, Roncal N, Alvarez E, Perez EJ, Gotuzzo E, 2005. Clustered local transmission and asymptomatic Plasmodium falciparum and Plasmodium vivax malaria infections in recently emerged, hypoendemic Peruvian Amazon community. Malar J 4: 27.
3. Paul REL, Packer MJ, Walmsley M, Lagog M, Ranford-Cartwright LC, Paru R, Day KP, 1995. Mating patterns in malaria parasite populations of Papua New Guinea. Science 269: 1709–1711.
4. Robert F, Ntoumi F, Angel G, Candito D, Rogier C, Fandeur T, Sarthou JL, Mercereau-Puijalon O, 1996. Extensive genetic diversity of Plasmodium falciparum isolates collected from patients with severe malaria in Dakar, Senegal. Trans R Soc Trop Med Hyg 90: 704–711.
5. Paul RE, Hackford I, Brockman A, Muller-Graf C, Price R, Luxemburger C, White NJ, Nosten F, Day KP, 1998. Transmis-sion intensity and Plasmodium falciparum diversity on the northwestern border of Thailand. Am J Trop Med Hyg 58: 195–203.
6. Ariey F, Chalvet W, Hommel D, Peneau C, Hulin A, Mercereau-Puijalon O, Duchemin JB, Sarthou JL, Reynes JM, Fandeur T, 1999. Plasmodium falciparum parasites in French Guiana: lim-ited genetic diversity and high selfing rate. Am J Trop Med Hyg 61: 978–985.
7. Konate L, Zwetyenga J, Rogier C, Bischoff E, Fontenille D, Tall A, Spiegel A, Trape JF, Mercereau-Puijalon O, 1999. Variation of Plasmodium falciparum msp1 block 2 and msp2 allele preva-lence and of infection complexity in two neighbouring Senegalese villages with different transmission conditions. Trans R Soc Trop Med Hyg 93 (Suppl 1): 21–28.
8. Branch OH, Takala S, Kariuki S, Nahlen BL, Kolczak M, Hawley W, Lal AA, 2001. Plasmodium falciparum genotypes, low complex-ity of infection, and resistance to subsequent malaria in partici-pants in the Asembo Bay Cohort Project. Infect Immun 69: 7783–7792.
9. Da Silveira LA, Dorta ML, Kimura EAS, Katzin AM, Kawamoto F, Tanabe K, Ferreira MU, 1999. Allelic diversity and antibody recognition of Plasmodium falciparum merozoite surface pro-tein 1 during hypoendemic malaria transmission in the Brazilian Amazon Region. Infect Immun 67: 5906–5916.
10. Takala S, Branch O, Escalante AA, Kariuki S, Wootton J, Lal AA, 2002. Evidence for intragenic recombination in Plasmodium falciparum : identification of a novel allele family in Block 2 of merozoite surface protein-1: Asembo Bay Area Cohort Project XIV. Mol Biochem Parasitol 125: 163–171.
11. Tetteh KK, Cavanagh DR, Corran P, Musonda R, McBride JS, Conway DJ, 2005. Extensive antigenic polymorphism within the repeat sequence of the Plasmodium falciparum merozoite surface protein 1 block 2 is incorporated in a minimal polyva-lent immunogen. Infect Immun 73: 5928–5935.
12. Chenet SM, Branch OH, Escalante AA, Lucas CM, Bacon DJ, 2008. Genetic diversity of vaccine candidate antigens in Plasmodium falciparum isolates from the Amazon basin of Peru. Malar J 7: 93.
13. Tami A, Grundmann H, Sutherland C, McBride JS, Cavanagh DR, Campos E, Snounou G, Barnabe C, Tibayrenc M, Warhurst DC, 2002. Restricted genetic and antigenic diversity of Plasmodium falciparum under mesoendemic transmission in the Venezuelan Amazon. Parasitology 124: 569–581.
14. Galinski MR, Corredor-Medina C, Povoa M, Crosby J, Ingravallo P, Barnwell JW, 1999. Plasmodium vivax merozoite surface pro-tein-3 contains coiled-coil motifs in an alanine-rich central domain. Mol Biochem Parasitol 101: 131–147.
15. Cohen C, Parray DA, 1994. Alpha-helical coiled coils: more facts and better predictions. Science 263: 488–489.
16. Bruce MC, Galinski MR, Barnwell JW, Snounou G, Day KP, 1999. Polymorphism at the merozoite surface protein-3a locus of Plasmodium vivax : global and local diversity. Am J Trop Med Hyg 61: 518–525.
17. Rayner JC, Corredor V, Feldman D, Ingravallo P, Iderabdullah F, Galinski MR, Barnwell JW, 2002. Extensive polymorphism in the Plasmodium vivax merozoite surface coat protein MSP-3a is limited to specific domains. Parasitology 125: 393–405.
18. Bruce MC, Galinski MR, Barnwell JW, Donnelly CA, Walmsley M, Alpers MP, Walliker D, Day KP, 2000. Genetic diversity and dynamics of Plasmodium falciparum and P. vivax populations in multiply infected children with asymptomatic malaria infec-tions in Papua New Guinea. Parasitology 121: 257–272.
19. Cui L, Mascorro CN, Fan Q, Rzomp KA, Khuntirat B, Zhou G, Chen H, Yan G, Sattabongkot J, 2003. Genetic diversity and multiple infections of Plasmodium vivax malaria in Western Thailand. Am J Trop Med Hyg 68: 613–619.
20. Zakeri S, Barjesteh H, Djadid ND, 2006. Merozoite surface pro-tein-3a is a reliable marker for population genetic analysis of Plasmodium vivax. Malar J 5: 53.
21. Ord R, Olley S, Tami A, Sutherland CJ, 2005. High sequence diver-sity and evidence of balancing selection in the Pvmsp3alpha gene of Plasmodium vivax in the Venezuelan Amazon. Mol Biochem Parasitol 144: 86–93.
22. Imwong M, Nair S, Pukrittayakamee S, Sudimack D, Williams JT, Mayxay M, Newton PN, Kim JR, Nandy A, Osorio L, Carlton JM, White NJ, Day NP, Anderson TJ, 2007. Contrasting genetic structure in Plasmodium vivax populations from Asia and South America. Int J Parasitol 37: 1013–1022.
23. Polley SD, Tetteh KK, Cavanagh DR, Pearce RJ, Lloyd JM, Bojang KA, Okenu DM, Greenwood BM, McBride JS, Conway DJ, 2003. Repeat sequences in Block 2 of Plasmodium falciparum merozoite surface protein 1 are targets of antibodies associates with protection from malaria. Infect Immun 71: 1833–1842.
24. Cavanagh DR, Dodoo D, Hviid L, Kurtzhals JA, Theander TG, Akanmori BD, Polley S, Conway DJ, Koram K, McBride JS, 2004. Antibodies to the N-terminal block 2 of Plasmodium fal-ciparum merozoite surface protein 1 are associated with pro-tection against clinical malaria. Infect Immun 72: 6492–6502.
25. Mascorro CN, Zhao K, Khuntirat B, Sattabongkot J, Yan G, Escalante AA, Cui L, 2005. Molecular evolution and intragenic recombination of the merozoite surface protein MSP-3alpha from the malaria parasite Plasmodium vivax in Thailand. Parasitology 131: 25–35.
26. Wellems TE, Walliker D, Smith CL, do Rosario VE, Maloy WL, Howard RJ, Carter R, McCutchan TF, 1987. A histidine-rich protein gene marks a linkage group favored strongly in a genetic cross of Plasmodium falciparum. Cell 49: 633–642.
27. Walliker D, Quakyi IA, Wellems TE, McCutchan TF, Szarfman A, London WT, Corcoran LM, Burkot TR, Carter R, 1987. Genetic analysis of the human malaria parasite Plasmodium falciparum. Science 236: 1661–1666.
28. McCutchan TF, de la Cruz VF, Good MF, Wellems TE, 1988. Antigenic diversity in Plasmodium falciparum. Prog Allergy 41: 173–192.
29. Conway DJ, McBride JS, 1991. Population genetics of Plasmodium falciparum within a malaria hyperendemic area. Parasitology 103: 7–16.
30. Conway DJ, Cavanagh DR, Tanabe K, Roper C, Mikes ZS, Sakihama N, Bojang KA, Oduola AM, Kremsner PG, Arnot DE, Greenwood BM, McBride JS, 2000. A principal target of human immunity to malaria identified by molecular popula-tion genetic and immunological analyses. Nat Med 6: 689–692.
31. Takala SL, Escalante AA, Branch OH, Kariuki S, Biswas S, Chaiyaroj SC, Lal AA, 2006. Genetic diversity in the Block 2 region of the merozoite surface protein 1 (MSP-1) of Plasmodium falciparum : additional complexity and selection and convergence in fragment size polymorphism. Infect Genet Evol 6: 417–424.
32. Rubio JM, Benito A, Roche J, Berzosa PJ, Garcia ML, Mico M, Edu M, Alvar J, 1999. Semi-nested, multiplex polymerase chain reaction for detection of human malaria parasites and evidence

960 SUTTON AND OTHERS
of Plasmodium vivax infection in Equatorial Guinea. Am J Trop Med Hyg 60: 183–187.
33. Ord RL, Tami A, Sutherland CJ, 2008. AMA1 genes of sympatric Plasmodium vivax and P. falciparum from Venezuela differ sig-nificantly in genetic diversity and recombination frequency. PLoS One 3: e3366.
34. Creasey A, Fenton B, Walker A, Thaithong S, Oliveira S, Mutambu S, Walliker D, 1990. Genetic diversity of Plasmodium falci-
parum shows geographical variation. Am J Trop Med Hyg 42: 403–413.
35. Färnert A, Snounou G, Rooth I, Bjorkman A, 1997. Daily dynam-ics of Plasmodium falciparum subpopulations in asymptomatic children in a holoendemic area. Am J Trop Med Hyg 56: 538–547.
36. Färnert A, 2008. Plasmodium falciparum population dynamics: only snapshots in time? Trends Parasitol 24: 340–344.


![Life Sciences...76 3 Contribution of Natural Products to Drug Discovery in Tropical Diseases mosquito [2]. Plasmodium falciparum, Plasmodium vivax, Plasmodium ovale, Plasmodium malariae,andPlasmodium](https://img.pdfslide.net/doc/110x75/6049cbda4f3447749747f712/life-sciences-76-3-contribution-of-natural-products-to-drug-discovery-in-tropical.jpg)


![Op Access M acteriza Plasmodium falciparum tifolat ... · Plasmodium falciparum and Plasmodium vivax has been reported as early as t[2]ulfado–pyrimeth - ()olate pathway inhibitor](https://img.pdfslide.net/doc/110x75/5fa82a31367407357973068f/op-access-m-acteriza-plasmodium-falciparum-tifolat-plasmodium-falciparum-and.jpg)