Embed Size (px)
Citation preview

Presented at International Conference of ICC-ISAE, Sanur, 24 August 2017
Plenary Session – 5:Sustainability of Global Palm Oil
Supply Chain
Diana ChalilUniversity of Sumatera Utara

Presented at International Conference of ICC-ISAE, Sanur, 24 August 2017
21.71
15.20
11.31 7.08
3.66
41.04
India
EU-27
China
Pakistan
Bangladesh
ROW
54.28 36.83
1.49
1.21 1.17 5.02 Indonesia
Malaysia
Guatemala
Benin
Papua NewGuinea
ROW
Who are the main players?
• Exporters • Importers
Source: indexmundi

Presented at International Conference of ICC-ISAE, Sanur, 24 August 2017
Global Palm Oil MarketEnvironment Vs Price Issues
• https://www.sustainablepalmoil.org/commodity-brokers-traders/

Presented at International Conference of ICC-ISAE, Sanur, 24 August 2017
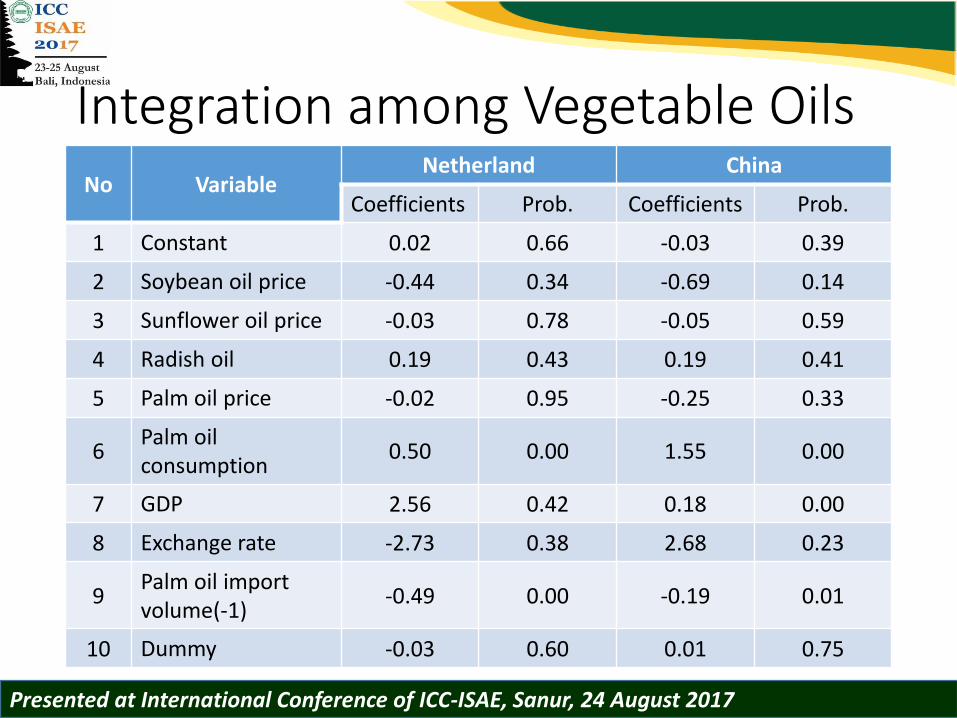
Damanik and Chalil, 2014
• Quarterly Data
• Period : 2004 - 2013
• Seemingly Unrelated Regression
Presented at International Conference of ICC-ISAE, Sanur, 24 August 2017
Integration among Vegetable OilsNo Variable
Netherland China
Coefficients Prob. Coefficients Prob.
1 Constant 0.02 0.66 -0.03 0.39
2 Soybean oil price -0.44 0.34 -0.69 0.14
3 Sunflower oil price -0.03 0.78 -0.05 0.59
4 Radish oil 0.19 0.43 0.19 0.41
5 Palm oil price -0.02 0.95 -0.25 0.33
6Palm oil consumption
0.50 0.00 1.55 0.00
7 GDP 2.56 0.42 0.18 0.00
8 Exchange rate -2.73 0.38 2.68 0.23
9Palm oil import volume(-1)
-0.49 0.00 -0.19 0.01
10 Dummy -0.03 0.60 0.01 0.75
Presented at International Conference of ICC-ISAE, Sanur, 24 August 2017
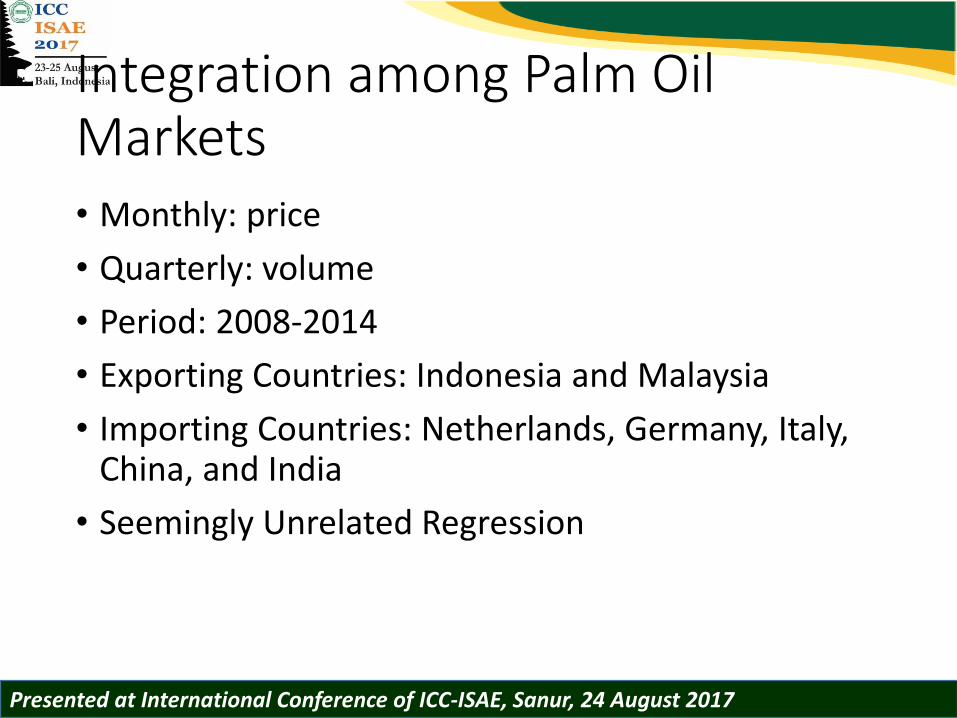
Integration among Palm Oil Markets• Monthly: price
• Quarterly: volume
• Period: 2008-2014
• Exporting Countries: Indonesia and Malaysia
• Importing Countries: Netherlands, Germany, Italy, China, and India
• Seemingly Unrelated Regression

Presented at International Conference of ICC-ISAE, Sanur, 24 August 2017
Regressand
Regressor
Indonesia Malaysia India China Jerman Italia Belanda
Konstanta 0.08 -0.07 -0.04 0.17 0.14 0.18 -0.05
Indonesia 0.85*** 0.99*** -1.48*** -0.72*** -0.08 0.31
Malaysia 0.80*** -0.18 1.71*** 0.93*** -0.03 -0.32
India 0.17 -0.05 0.18 0.42*** 0.08 0.45**
China -0.17 0.12 0.07 -0.08 0.10 0.35**
Jerman -0.04 0.12 -0.01 -0.21 0.19 0.03
Italia 0.08 0.02 0.09 0.26 -0.20** 0.19
Belanda -0.02 0.05 0.16*** 0.47 0.35*** 0.22*

Presented at International Conference of ICC-ISAE, Sanur, 24 August 2017
Global Demand: Certification
• Global vs Domestic
• Private vs Government
• Acceptance
• What are really matters?• Implementation vs documentation
• Economic vs environment
• General and National context

Presented at International Conference of ICC-ISAE, Sanur, 24 August 2017
CSSPO Market Absorption
-
2,000,000
4,000,000
6,000,000
8,000,000
10,000,000
12,000,000
14,000,000
2008 2009 2010 2011 2012 2013 2014 2015 2016
4,452 343,857
1,281,134
2,490,526
3,479,415
4,513,273 5,349,666
6,182,694 5,632,731
163,364
1,357,511
2,773,567
4,798,512
6,724,236
8,735,843
10,998,913
12,130,775 12,062,293
Sales Supply

Presented at International Conference of ICC-ISAE, Sanur, 24 August 2017
0.00%
10.00%
20.00%
30.00%
40.00%
50.00%
60.00%
2008 2009 2010 2011 2012 2013 2014 2015 2016
2.73%
25.33%
46.19%
51.90% 51.74% 51.66%48.64%
50.97%
46.70%

Presented at International Conference of ICC-ISAE, Sanur, 24 August 2017
Why?
• India and China consumers are likely highly price sensitive.
• 77% share of the total vegetable oil consumption in India
• Due to the competitive price: 90% of the edible oil in India is sold in loss rather than branded form which means no premium is available to be paid as the "branded sustainable palm oil".
• Companies in India have started to obtain RSPO certificates in 2012, but until 2014 their CSPO consumption was still very low (WWF, 2013; Arora et al. 2014).
• Indonesia also uses most of the CPO for edible oil and most of the end consumers would use the certified product only if the prices are the same or lower than those of their current uncertified product (Daemeter, 2015).

Presented at International Conference of ICC-ISAE, Sanur, 24 August 2017
Who are the producers/growers
2%
68%
30%
1980
26%
33%
41%
1990
Rakyat Negara Swasta
41%
7%52%
2015

Presented at International Conference of ICC-ISAE, Sanur, 24 August 2017
What are the main concerns?
No Types of
Sustainability
Sub Criteria
1 Economics 3.1; 6.10
2 Social2.2; 2.3; 5.3; 6.1; 6.2; 6.3; 6.4; 6.5;
6.7; 6.8; 6.11; 7.5; 7.6
3 Environmental4.1; 4.2; 4.3; 4.4; 4.5; 4.6; 5.1; 5.2;
5.5; 7.1; 7.2; 7.3; 7.4 ; 7.7
Type of Sustainability in the RSPO Sub Criteria

Presented at International Conference of ICC-ISAE, Sanur, 24 August 2017
RSPO P&C Adoption
• North Sumatra Case (2012, n= 320)
• Independent• 28.94%
• 1.94 (1-5)
• Schemed• 37.91%
• 2.49 (1-5)

Presented at International Conference of ICC-ISAE, Sanur, 24 August 2017

Presented at International Conference of ICC-ISAE, Sanur, 24 August 2017
Influencing Factors
Independent
VariablesB Wald Sig. Exp(B) p
Age -.006 .067 .795 .994
Education .043 .327 .567 1.044
Experience* .050 2.818 .093 1.052 0.52
Dependent .077 .378 .539 1.081
Land size .195 1.663 .197 1.216
Income* .193 2.882 .090 1.213 0.59
Group
Participation(1)*-2.078 27.498 .000 .125 0.19
Constant -2.187 2.122 .145 .112

Presented at International Conference of ICC-ISAE, Sanur, 24 August 2017
How much smallholders need to pay?
Description Average cost (IDR/ha)
Initial certification and necessarystaffing
20,000 - 40,000
Training of staff and smallholders 1,000 - 25,000
Corrective actions typically 40,000 - 100,000
Ongoing certification andmaintenance
25,000 - 130,000
Total 86,000 - 295,000
Source: WWF, 2012

Presented at International Conference of ICC-ISAE, Sanur, 24 August 2017
WTP (2013)
• Riau and Jambi Cases
• n = 142
• Average land size: 2.92 ha
• Binary Logistic Model

Presented at International Conference of ICC-ISAE, Sanur, 24 August 2017
WTP Influencing Factors
β S.E. Wald Sig. Exp(β) P
sales continuity 3.31 0.73 20.37 0.00* 27.51 0.96
sales price increase
0.79 0.75 1.09 0.30 2.20 0.69
certainty to get fertilizers
-0.03 0.54 0.00 0.95 0.97 0.49
production increase
-1.41 0.56 6.46 0.01* 0.24 0.20
participation in smallholders’
group 0.34 0.52 0.44 0.51 1.41 0.59
trainings related to oil palm best
practices1.20 0.58 4.28 0.04* 3.31 0.77
* = significant at α = 0.05

Presented at International Conference of ICC-ISAE, Sanur, 24 August 2017
β S.E. Wald Sig. Exp(β) P ME
level of education
0.03 0.09 0.09 0.77 1.03 0.51 0.01
age 0.05 0.03 3.22 0.07* 1.05 0.51 0.01
land area -0.09 0.13 0.52 0.47 0.91 0.48 -0.02
period of knowing RSPO
0.55 0.21 6.76 0.01* 1.73 0.63 0.13

Presented at International Conference of ICC-ISAE, Sanur, 24 August 2017
Challenge
WTP is still not enough to cover the whole certification costs.
could be improved if smallholders receive higher benefit from the certification

Presented at International Conference of ICC-ISAE, Sanur, 24 August 2017
Certification Income Impact (2016)
Statust-stat
Certified Uncertified
South Sumatra
Productivity (ton/ha/year) 13.99 6.55 -8,54*
Selling Price (IDR/kg) 1,466.00 1,474.38 0,35
Production Costs (IDR/ha) 5,103,954.84 1,225,248.86 2,79*
Income (IDR/ha) 15,169,730.00 3,599,232.00 -6,72*
Riau
Productivity (ton/ha/year) 9.32 6.24 -3,77*
Selling Price (IDR/kg) 1,694.06 1,474.38 -4,53*
Production Costs (IDR/ha) 3,453,737.72 1,254,969.61 2,46*
Income (Rp/ha) 12,462,659.70 3,707,731.37 4.05*

Presented at International Conference of ICC-ISAE, Sanur, 24 August 2017
Smallholders’ Inclusiveness?
• Trade off between income and management / entrepreneurial ability (POAC)

Presented at International Conference of ICC-ISAE, Sanur, 24 August 2017
Alternatives?
• Less Demanding Market: Pakistan Case

Presented at International Conference of ICC-ISAE, Sanur, 24 August 2017
Volume of Pakistan’s palm oil import (HS Code 151190)
-
50,000,000
100,000,000
150,000,000
200,000,000
250,000,000
300,000,000
1 3 5 7 9 11 13 15 17 19 21 23 25 27 29 31 33 35 37 39 41 43 45 47 49 51 53 55 57 59 61 63 65 67 69 71 73 75 77 79 81 83
151190_ind 151190_malay

Presented at International Conference of ICC-ISAE, Sanur, 24 August 2017
France Case: Indirect Import HS 151190 2010-2015 (Ton)
No Partner country 2010 2011 2012 2013 2014 2015 Average
1 Netherlands 60.35 51.28 65.61 72.39 69.58 68.29 64.58
2 Indonesia 8.83 10.07 8.25 8.16 7.11 11.96 9.06
3 Germany 4.44 6.15 11.05 7.20 7.42 4.90 6.86
4 Italy 7.03 8.86 4.76 4.05 5.11 5.30 5.85
5 Belgium 10.85 14.03 4.86 2.38 0.83 0.94 5.65
6 Malaysia 2.41 4.23 2.31 2.93 7.39 6.43 4.28
7 Spain 4.83 4.01 2.59 2.47 2.02 1.64 2.93
8 UK 1.24 1.27 0.56 0.39 0.43 0.46 0.72
9 Guinea 0.01 - - 0.02 0.05 0.05 0.02
10 Sweden - - 0.00 - 0.02 0.01 0.01
11 Others 0.03 0.10 0.01 0.01 0.03 0.01 0.03

Presented at International Conference of ICC-ISAE, Sanur, 24 August 2017
Import Influencing
• Autoregressive Distributed Lag Approach
• Monthly and Quarterly Data
• 2010-2016

Presented at International Conference of ICC-ISAE, Sanur, 24 August 2017
Pakistan
Variable Coefficient t-Statistic Prob.*
q_m(-1) 0.35 3.37 0.00
p_m_ind -124.34 -3.95 0.00
p_m_soy 37.27 2.15 0.03
tb 0.06 0.56 0.57
tb(-1) 0.40 3.78 0.00
c 59.02 1.53 0.13
R-squared 0.79
F-statistic 47.82

Presented at International Conference of ICC-ISAE, Sanur, 24 August 2017
French
Variable Coefficient Std. Error t-Statistic Prob.*
qm(-1) 0.075 0.270 0.278 0.786
Gdp 0.046 0.027 1.677 0.119
gdp(-1) -0.101 0.024 -4.267 0.001
p_m_ind -15.079 8.016 -1.881 0.084
p_m_ind(-1) -21.518 9.217 -2.335 0.038
p_m_malay 15.068 4.420 3.409 0.005
p_m_net 9.162 5.231 1.751 0.105
p_m_ger 12.342 3.769 3.274 0.007
p_m_gnut 7.304 2.545 2.870 0.014
C 31.734 10.359 3.063 0.010
R-squared 0.834
Adjusted R-squared 0.709
F-statistic 6.690

Presented at International Conference of ICC-ISAE, Sanur, 24 August 2017
Indonesia export price
Indonesia smallholder priceIndonesia local mill price
Pakistan import pricePakistan retail price

Presented at International Conference of ICC-ISAE, Sanur, 24 August 2017
PakistanSeries Eigenvalue Prob. Lag interval
p_m_ind co_pak& ghee_pak
0.26 0.04 1 to 2
p_cpo_blwn_ind p_m_ind & p_m_malay
0.28 0.01 1 to 2
p_cpo_mill_ind p_cpo_blwn_ind
0.15 0.06 1 to 4
ffb_schp_cpo_mill_ind & p_cpo_blwn_ind
0.19 0.04 1 to 4

Presented at International Conference of ICC-ISAE, Sanur, 24 August 2017
France
Price SeriesBounds Test
CointEq(-1)* Prob.F t
p_m_ind - p_m_net 44.89*** -9.58*** -1.18 0.00
p_m_net - p_x_ind 1.13 -1.51 -0.00 0.13
P_m_ind – p_x_ind 1.24 1.59 0.02 0.12
p_m_ind - p_m_ger 33.11*** -8.21*** -0.70 0.00
p_m_ger - p_x_ind 5.18** -3.24** -0.01 0.00
p_x_ind - p_cpo_sumut 7.48*** -3.89 -0.42 0.00
p_cpo_sumut - p_sch_ffb 2.05 -2.04 -0.08 0.05
p_cpo_sumut - p_ind_ffb 3.75 2.76* -0.18 0.00

Presented at International Conference of ICC-ISAE, Sanur, 24 August 2017
Sustainable Global Supply Chain
• Long Chain
• Uneven Power
• Market Mechanism vs Government Intervention