Embed Size (px)
Citation preview

P n w a v e v e l o c i t y and M o h o g e o m e t r y in nor th eas tern India
S S RAI ], K S PRAKASAM 1 and N AGRAWAL 2
1 National Geophysical Research Institute, Uppal Road, Hyderabad 500007; e mail:[email protected] 2 Pan India Consultants Pvt. Ltd., Gurgaon, Haryana
Pn velocity has been computed across the NE India and Moho geometry constrained, using regional earthquake travel times recorded by a network of 30 seismological stations operated during February- May 1993. Using an appropriate velocity model and the arrival times at the network stations, preliminary hypocentres of 16 regional earthquakes provided by NEIC were also improved. The average Pn wave velocity in NE India has been found to be 8.5 + 0.2 km/s. It varies from 8.3 to 8.5 km/s beneath the Shillong Plateau, Mikhir hills and Assam valley, which is significantly higher than those in other parts of India. The crustal thickness in NE India is also high, varying from 45-49 km under the Shillong plateau and the adjoining region to 55-65 km in the convergence zone. The presence of a thick crust and high Pn velocity suggests that the lithosphere in NE India is colder, as also indicated by the observed deeper level (45-51 km) seismicity of the region.
1. I n t r o d u c t i o n
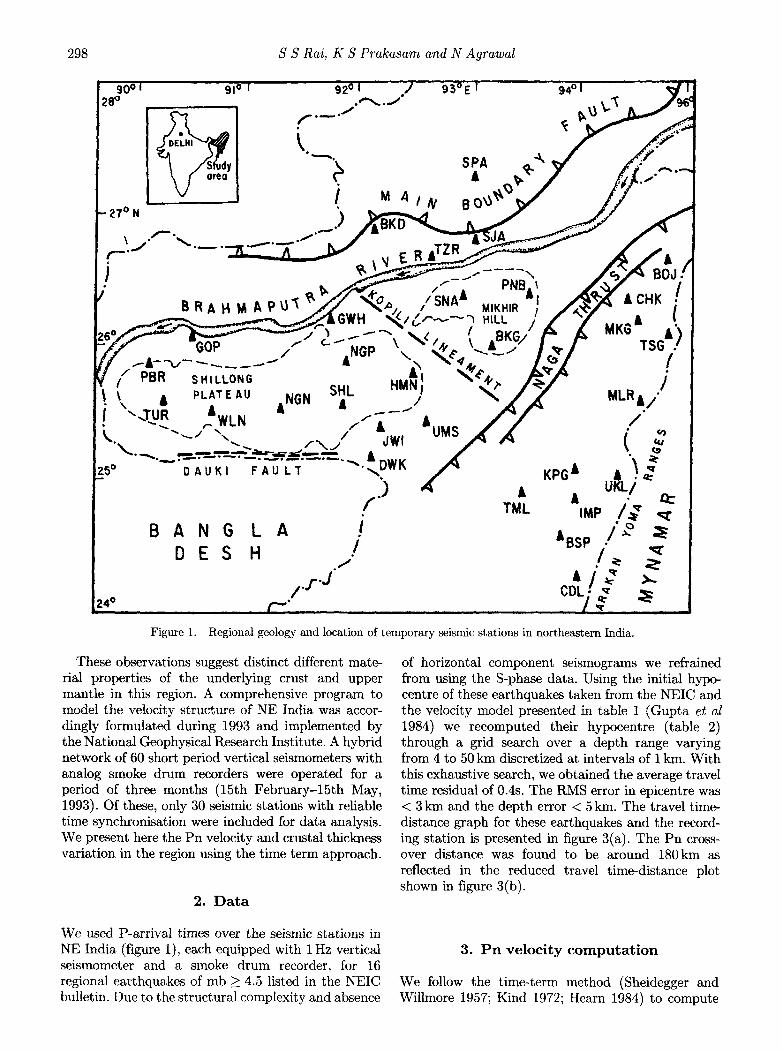
North eastern India is composed of diverse geological terranes ranging in age from Archean to young orogenies. These are (figure 1): the Shillong massif, the eastern Himalaya, the Assam syntaxis, the Arakan Yoma ranges, the Brahmaputra valley and the Bengal basin, all fashioned in this assembly by the complex geological processes that followed the penetration of the Indian continent in to Eurasia and later in to the wedge that evolved with the wrapping of the Himalayan collision front around its northeastern edge to form the Arakan Yoma ranges. The narrow region intervening between these two ranges is the Brahmaputra valley, confined at its southern edge by the Shillong massif, an elevated Archean block that rises abruptly above the Bangladesh plains. The detailed tectonic set up of the region is described by Evans (1964), Nandy (1980).
During the last one hundred years, this region has witnessed over a dozen devastating earthquakes, including the great earthquakes of 1897 and 1950, each of magnitude greater than 8.7. A special feature of the region's seismicity is the occurrence of deep crustal (45-51 km) earthquakes beneath the Shillong plateau
(Chen and Molnar 1990) pointing to the existence of a relatively colder lithosphere in this region. Investiga- tion of the crustal structure of NE India has been a subject of numerous studies over the last four decades (Tandon 1954; Kayal and De 1987; Sitaram and Saikia 1992; Mukhopadhyay et al 1995). Estimates of the P-wave velocity for the upper crust range from 5.6 to 5.99 km/s and 6.5 km/s for the lower crust. The Pn velocity is inferred to vary between 7.94 and 8.7 km/s, and estimates for the Vp/Vs ratio for the upper and lower crust are 1.74 and 1.76 respectively.
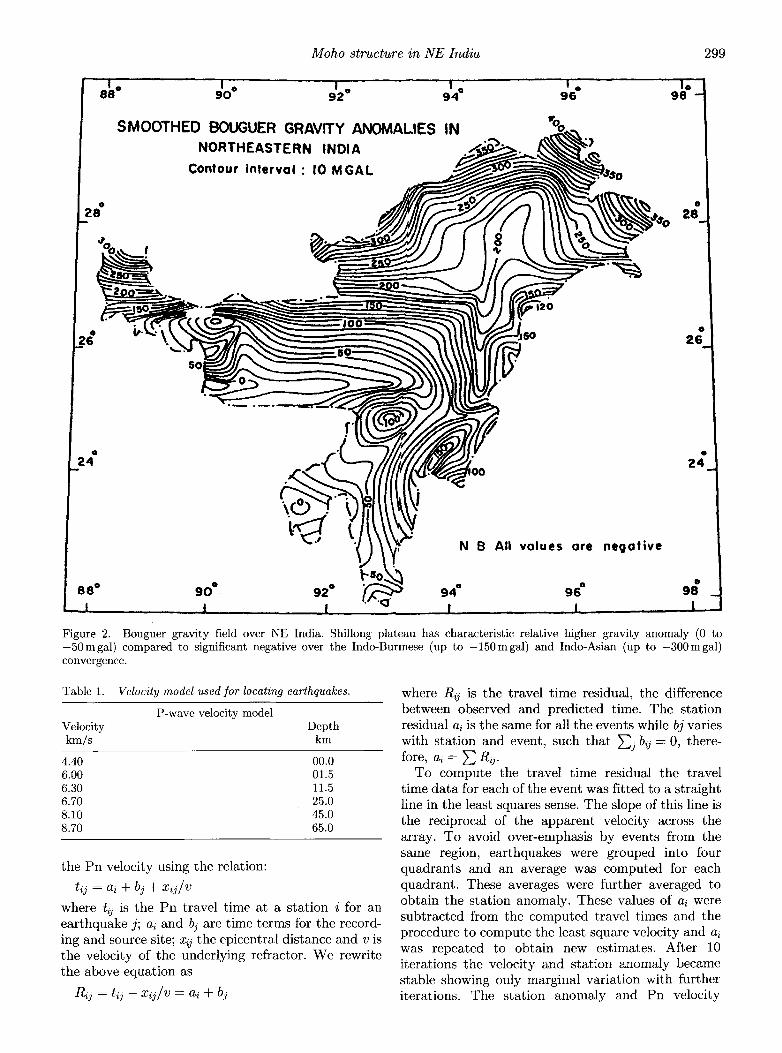
Most part of NE India shows lower heat flow with an average of ,,~ 45 mwm -2 (Ravi Shankar 1988) simi- lar to that observed over the Archean terranes of south India. The Bouguer gravity anomaly (figure 2) in the region varies from ~ - 2 0 m gal over Shillong plateau to - 2 5 0 m gal in the Brahmaputra valley. Verma and Mukhopadhyay (1977) suggest that the crust underlying the Shillong massif is probably denser as well as thicker than the normal, while the Assam valley is underlain by a thicker crust. Estimates of the crustal thickness of the region derived from modelling of Bouguer gravity anomalies (Verma and Mukhopadhyay 1977; Gaur and Bhattacharji 1983) also show a variation from 45 to 63 km.
Keywords. NE India; seismicity; crust; travel time; time term.
Proc. Indian Acad. Sci. (Earth Planet. Sci.), 108, No. 4, December 1999, pp. 297-304 �9 Printed in India 297
298 S S Rai, K S Prakasam and N Agrawal
28 ~
,o N
91 o
f . m . J
L. C~ SPA �9 &
/ M A / / V BO\
\ o P - . . J ~ .
/
B R A H k ~ A P ~ X
- ,... . . . . ,.,,. / A NGP \
S HILLONG HMNA/ SHL ~ A PLATE AU ANGN /
�9 z" �9 &UMS " . ._ J ~,... / k..~, . _ - . . . f \ j JWI
?.5 ~ DAUKI FAULT "~. DWK /.-)
B A N G L A i D E S H / , I
/../,-.J 4o . . . . ,[7"'
/1" . PNB. '.. r / , //SNAI MIKHIR l j
'~ r =v,, ./
Figure 1.
94ot
- J /
& TML
M L R j I / , / /
~u
KPGJ I ") : UKLI ~ �9 ~.
AtMP /g ABS P /'2
/'~
, , , , , i , ,
Regional geology and location of temporary seismic stations in northeastern India.
These observations suggest distinct different mate- rim properties of the underlying crust and upper mantle in this region. A comprehensive program to model the velocity structure of NE India was accor- dingly formulated during 1993 and implemented by the National Geophysical Research Institute. A hybrid network of 60 short period vertical seismometers with analog smoke drum recorders were operated for a period of three months (15th February-15th May, 1993). Of these, only 30 seismic stations with reliable time synchronisation were included for data analysis. We present here the Pn velocity and crustal thickness variation in the region using the time term approach.
2. Data
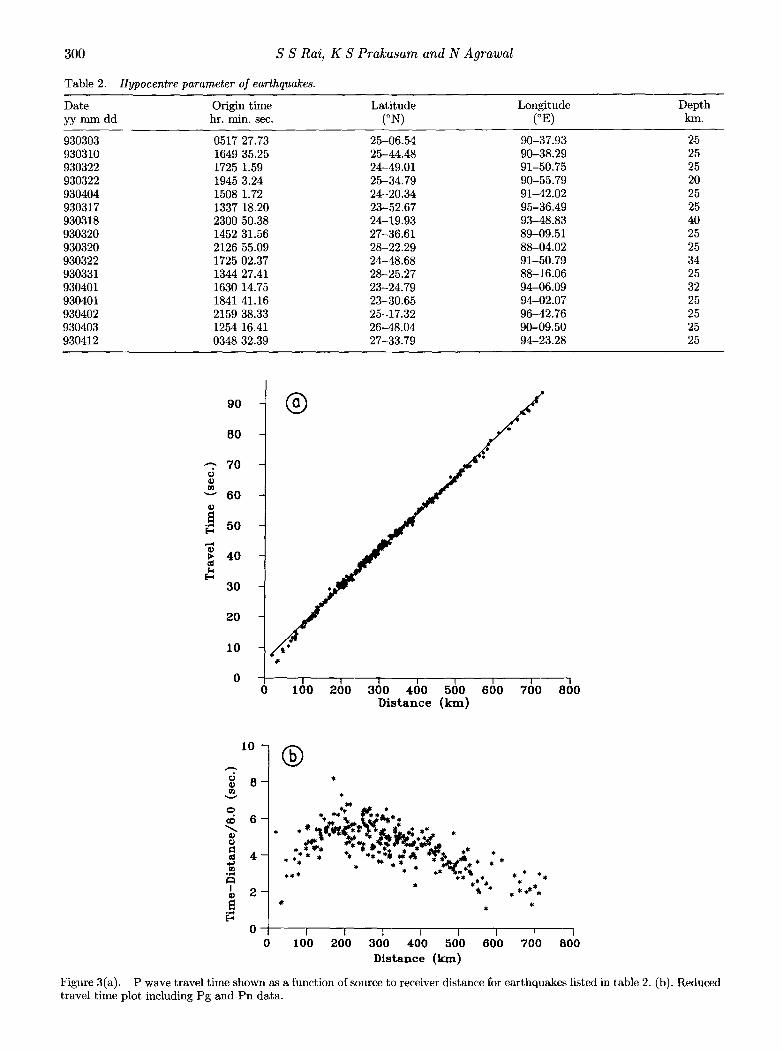
of horizontal component seismograms we refrained from using the S-phase data. Using the initial hypo- centre of these earthquakes taken from the NEIC and the velocity model presented in table 1 (Gupta et al 1984) we recomputed their hypocentre (table 2) through a grid search over a depth range varying from 4 to 50 km discretized at intervals of 1 km. With this exhaustive search, we obtained the average travel time residual of 0.4s. The RMS error in epicentre was < 3 km and the depth error < 5 km. The travel time- distance graph for these earthquakes and the record- ing station is presented in figure 3(a). The Pn cross- over distance was found to be around 180km as reflected in the reduced travel time-distance plot shown in figure 3(b).
We used P-arrival times over the seismic stations in NE India (figure 1), each equipped with 1 Hz vertical seismometer and a smoke drum recorder, for 16 regional earthquakes of mb > 4.5 listed in the NEIC bulletin. Due to the structural complexity and absence
3. Pn velocity computation
We follow the time-term method (Sheidegger and Willmore 1957; Kind 1972; Hearn 1984) to compute
Moho structure in N E India
' ;o" S M O O T H E D B O U G U E R G R A V f f Y A N O M A L I E S I N
NORTHEASTERN INDIA ~jl,
Contour interval : I0 M G A L . ~
| t l I~ 96 98
299
@ 0
i,. ~ ~
SO
( I 0
z4 . . . t " t - - - , , , ,
N B All values are negat ive
8 8 ~ 9 0 92 ~ ~ ' ~ . 9 4 ~ 9 6 i I I . I . . . . I, I
Figure 2. Bouguer gravity field over NE India. Shillong plateau has characteristic relative higher gravity anomaly (0 to -50regal) compared to significant negative over the Indo-Burmese (up to -150mgal) and Indo-Asian (up to -300mgal) convergence.
Table 1. Velocity model used for locating earthquakes.
P-wave velocity model Velocity Depth km/s km
4.40 00.0 6.00 01.5 6.30 11.5 6.70 25.0 8.10 45.0 8.70 65.0
the Pn velocity using the relation:
tij = ai -[- bj -{- x i j / v
where tij is the Pn travel t ime at a s tat ion i for an ear thquake j; ai and bj are t ime terms for the record- ing and source site; xij the epicentral distance and v is the velocity of the underlying refractor. We rewrite the above equat ion as
Rij = tij - - X i j / V ---- ai + bj
where R/j is the travel t ime residual, the difference between observed and predicted time. The stat ion residual ai is the same for all the events while bj varies with s tat ion and event, such that Ej bij ~-O, there- fore, ai = ~ Rij.
To compute the t ravel t ime residual the t ravel t ime d a t a for each of the event was fitted to a straight line in the least squares sense. The slope of this line is the reciprocal of the apparent velocity across the array. To avoid over-emphasis by events from the same region, ear thquakes were grouped into four quadrants and an average was computed for each quadrant . These averages were further averaged to obtain the stat ion anomaly. These values of ai were subtracted from the computed travel times and the procedure to compute the least square velocity and ai was repeated to obtain new estimates. After 10 i terations the velocity and s ta t ion anomaly became stable showing only marginal variat ion with fur ther i terations. The stat ion anomaly and Pn velocity
300 S S Rai, K S Prakasam and N Agrawal
Table 2. Hypocentre parameter of earthquakes.
Date Origin time Latitude Longitude Depth yy mm dd hr. min. sec. (~ (~ km.
930303 0517 27.73 25-06.54 90-37.93 25 930310 1649 35.25 25-44.48 90-38.29 25 930322 1725 1.59 24-49.01 91-50.75 25 930322 1945 3.24 25-34.79 90-55.79 20 930404 1508 1.72 24-20.34 91-42.02 25 930317 1337 18.20 23-52.67 95-36.49 25 930318 2300 50.38 24-19.93 93-48.83 40 930320 1452 31.56 27-36.61 89-09.51 25 930320 2126 55.09 28-22.29 88-04.02 25 930322 1725 02.37 24-48.68 91-50.79 34 930331 1344 27.41 28-25.27 88-16.06 25 930401 1630 14.75 23-24.79 94-06.09 32 930401 1841 41.16 23-30.65 94-02.07 25 930402 2159 38.33 25-17.32 96-42.76 25 930403 1254 16.41 26-48.04 90-09.50 25 930412 0348 32.39 27-33.79 94-23.28 25
90
8 0
~', 7O 5 m
"-" 6 0 r
N 50
~ 4 0
3 0
20
10
$ $ $
I I I I I I I I 0 100 200 300 400 500 600 700 O00
D i s t a n c e (k in )
O
v
O
O
I
1 o -
8 -
4 *** �9 ** ****~ J ~ ~$*~ ~* *
2 * **' **
0 I l 1 I I I 0 1 0 0 2 0 0 3 0 0 4 0 0 5 0 0 6 0 0
D i s t a n c e ( k i n )
, $ * *
, **~** *
700 800
Figure 3(a). P wave travel time shown as a function of source to receiver distance for earthquakes listed in table 2. (b). Reduced travel time plot including Pg and Pn data.
Moho structure in N E India
Table 3. Sector wise residual pattern, station anomaly and Pn velocity at different stations.
301
Station code 0-90 90-180
Station anomaly sector wise
180-270 270-360 AVR.
Average Pn velocity
km/s
BKD NA 1.09 NA 1.14 BKG - 0.67 NA 0.24 - 0.07 BOJ - 0.54 NA NA 1.15 BSP NA NA 1.63 1.17 CDL NA - 0.12 - 0.01 NA CHK 0.39 - 0.91 NA NA DWK NA 0.06 0.17 0.09 GAU NA 0.02 - 0.30 - 0.32 GOP NA 0.80 NA - 0.48 GWH - 0.12 0.36 0.13 - 0.18 HMN 1.23 0.35 1.27 0.25 IMP - 1.62 - 0.96 1.14 0.35 JWI NA 0.67 NA 0.41 KPG - 0.16 0.28 NA NA MKG - 0.76 - 0.62 NA 0.06 MLR 0.53 0.33 NA NA NGN NA 0.69 NA - 0.22 NGP NA 0.07 0.07 - 0.50 PBR NA 0.23 NA - 0.60 PNB 0.80 NA NA - 0.42 SHL NA 0.18 NA - 0.06 SJA 0.24 0.21 NA 0.54 SNA 0.99 0.34 NA 0.05 SPA NA - 0.47 NA - 0.22 TML NA 0.44 1.20 0.64 TSG - 0.56 - 0.54 NA 0.35 TUR NA 0.46 NA - 0.07 TZR - 0.32 0.31 NA 0.08 UKL 0.30 0.92 - 0.71 NA UMS NA - 0.27 0.28 0.02 WLN NA 0.54 NA 0.09
1.11 8.23 - 0.16 8.42
0.31 8.80 1.40 8.15
- 0.07 8.37 - 0.26 8.71
0.11 8.59 - 0.20 8.29
0.16 8.51 0.05 8.52 0.78 8.55
- 0.27 8.57 0.54 8.39 0.06 8.39
- 0.44 8.50 0.43 8.51 0.24 8.37
-0 .12 8.52 -0 .18 8.68
0.19 8.74 0.06 8.57 0.46 8.42 0.46 8.59
- 0.34 8.36 0.76 8.58
- 0.24 8.54 0.20 8.46 0.02 8.26 0.17 8.33 0.01 8.57 0.32 8.11
(cor rec ted for t i m e t e r m ) for d i f ferent s t a t i o n s is
p r e s e n t e d in t ab l e 3. A n ave rage P n v e l o c i t y of
8.5 k m / s was o b t a i n e d for t he region.
4 . C r u s t a l t h i c k n e s s e s t i m a t e
T h e r e l a t i ve t r a v e l t i m e di f ference across t h e a r r a y can
be ut i l ised to m a p t h e d e p t h o f M o h o be low d i f fe ren t
po in t s (Sheare r a n d O p e n h e i m e r 1982; O p e n h e i m e r
a n d E a t o n 1984). W e cons ider a t w o layer l a t e ra l ly
h o m o g e n e o u s ve loc i t y mode l , t he d i f ference in t r a v e l
(b) E p i c e n t r e - S t a t i o n D i s t r i b u t i o n
/ 7
r , n e e 8 8 8 9 9 0 9 1 9 2 9 3 9 4 9 5 9 6 9 7
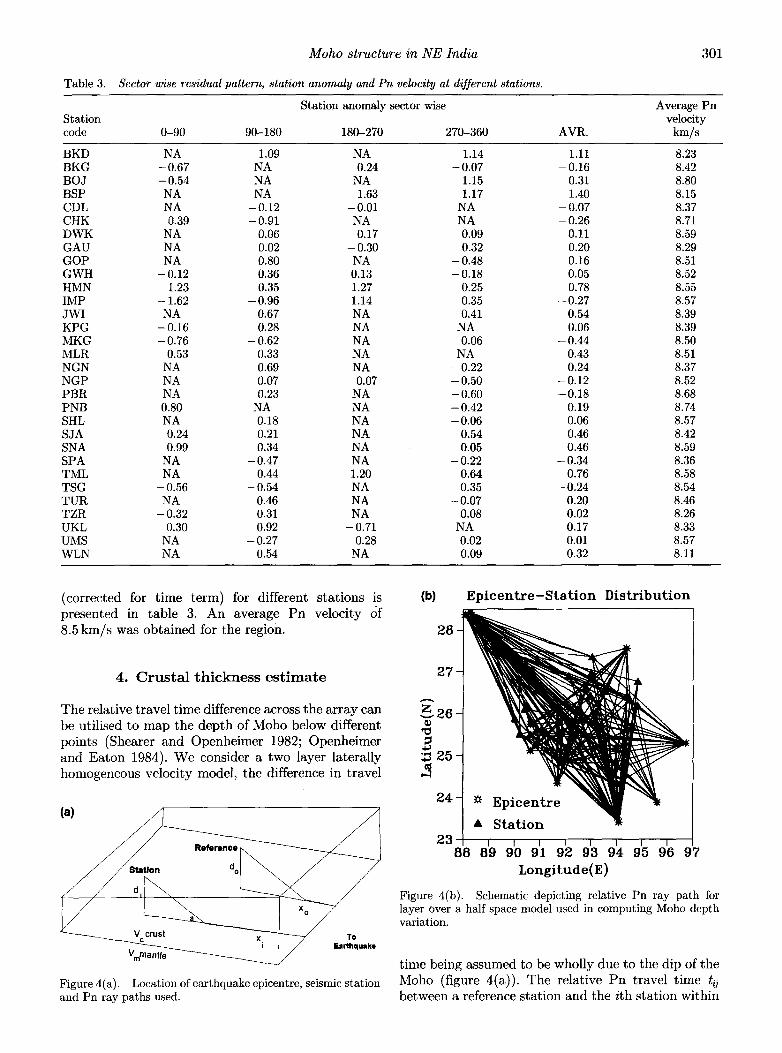
. . . . Figure 4(b). Schematic depicting relative Pn ray path for layer over a half space model used in computing Moho depth variation.
o
i I ~ E41~hq~ke
vma,tle ~ " t i m e be ing a s s u m e d to be who l ly due to the d ip of t h e
Figure4(a). Location ofearthquakeepicentre, seismic station M o h o (f igure 4(a)) . T h e r e l a t ive P n t r a v e l t i m e t/j and Pn ray paths used. b e t w e e n a re ference s t a t i o n a n d t h e i th s t a t i on w i t h i n
302
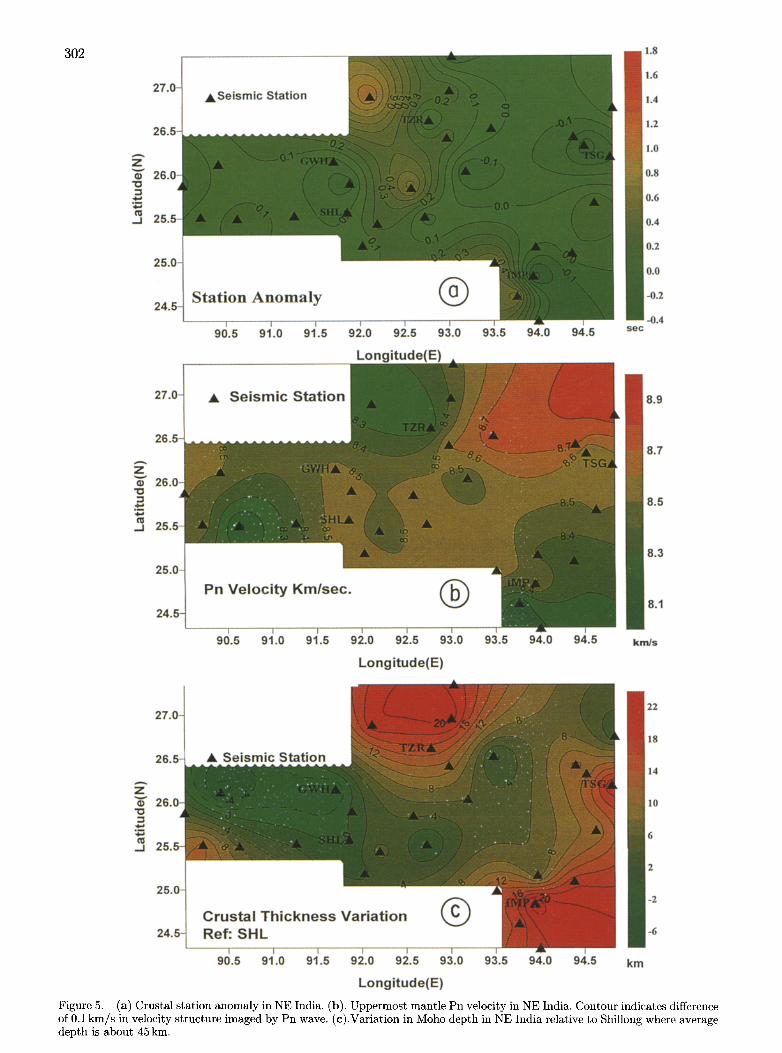
Figure 5. (a) Crustal station anomaly in NE India. (b). Uppermost mantle Pn velocity in NE India. Contour indicates difference of 0.1 km/s in velocity structure imaged by Pn wave. (c).Variation in Moho depth in NE India relative to Shillong where average depth is about 45 kin.

Moho structure in N E India 303
the array for the j th event, may be expressed as
tij = (sin ~/vc)(di j - doj) + (1 /vm)(xi j + xoj)
where a = cos-l(vc + vm). v~ represents the mean crust velocity and vm the
mean mantle velocity, d is the perpendicular distance to the Moho beneath a station, x the epicentral distance and the symbol o refers to the reference station. Considering
dij = dij -- doj and X i j : X i j - - X o j ,
we can write
dij = (tijVm - x i j ) / tan a.
Accordingly, we computed the Moho depth beneath all the 30 stations considering SHL as the reference point. Figure 4(b) shows the location of seismic stations, earthquake epicentres and the Pn ray path distribu- tion in the region. We observe fairly good illumination and hence better solution reliability for velocity and Moho depths in the geographical region enclosed by 25-26~ and 90-94~
5. R e s u l t s a n d d i s c u s s i o n
Based on the methodology presented, the travel time residual, Pn velocity and depth of the Moho were computed at 30 stations. These are presented in figure 5(a-c). Station anomaly over the ShiUong plateau
varies between 0.0 and 0.2s. A negative anomaly (-0.2 to -0 .8 s) is observed between Shillong and the Mikhir hills and its northwest extension coinciding with the Kopili lineament. This could be representative of either a faster velocity crust or a thinner Moho. Pn velocity in the NE region is found to vary betw~n 8.3 and 8.7km/s. Over the Shillong plateau and Mikhir hills Pn velocity varies between 8.3 and 8.5km/s. Similar Pn velocity pattern is observed over the Indo- Burmese region. Higher Pn velocity (upto 8.7kin/s) is observed to the east of Mikhir hills. The Moho depth variation is presented in relation to Shillong. Significant crustal thickening (~ 8kin) is observed beneath the Mikhir hills and the adjoining Assam valley. Beneath the convergence zone, Moho is observed to be thickened by 8-16km. Similar observations were reported by Gaur and Bhattacharji (1983) through modelling of Bouguer gravity field observation (figure 6).
Theoretically, we expect a relation between the crustal thickness(H) and the Pn velocity(V) as
5V 5V 5T 5V 5P
5--H = 6--T" 6H + 6P 6H
where T and P are temperature and pressure respectively.
Laboratory experiments (reviewed in Braile et al 1989) provide a working relationship between varia- tions in the upper mantle velocity with pressure and temperature. Using a pressure derivative (5 V / S P ) of
8 8 ~ 9 0 ~ 9 2 ~ 9 4 ~ 9 6 " �9 I | | I I
3 0 i
MOHO DEPTH (in Km.)IN NE INDIA ~6.~.. )
I r - ~ - ' ~ - ~ - . ~ - - - - ' ' - " ~ I . /
/ ! ",~ _~/~ / ./ . ."
~; , l ~ " - r I I 8 8 b 9 0 ~ 9 2 ~ 9 4 ~ 9 6 ~
i 98" I 3o- I
zs"l
I i
2z!
Figure 6. Moho depth deduced from Bouguer gravity anomaly (redrawn from Gaur and Bhattachaxji 1983).
304 S S Rai, K S Prakasam and N Agrawal
2.67 x 10 -4 k m / s / P a , and an average crustal densi ty of 2 . 9 g / c m 3, the pressure effect becomes 7.4 • 10 -3 k m / s / k m as a function of depth. Thus due to pressure, a 10 km increase in the thickness of the crust would result in an expected increase in the upper man t l e velocity of 0.074 km/s . Assuming an ul t ramafic com- posit ion of the uppermos t mant le , and t empe ra tu r e der ivat ive (5 V / ~ T) of - 5 . 4 • 10 -4 k m / s / ~ and abou t 12~ t empe ra tu r e gradient for the upper and sub- Moho man t l e respectively, the effect of the dep th increase on veloci ty ( ~ V / ~ H ) was found to be - 0 . 0 0 6 3 k m / s / k m . Figure 5(b) and 5(c) indicate a broad correlat ion between the crustal thickness and the respect ive Pn velocity; the sub Moho t empe ra tu r e gradient benea th the Indo-Burmese ranges and the H i m a l a y a n convergence zone, being assumed to be > 12 ~ C / k m .
This s tudy brings out two impor t an t results (i) the presence of a high Pn velocity (8.3-8.7 km/s ) in N E India possibly represent ing a colder l i thosphere and (ii) significant var ia t ions in the crustal thickness (45- 6 1 k m ) f rom the Archean blocks to the younger convergence zones. The thick crust and colder litho- sphere is possibly responsible for deeper level seismo- genesis in the sub-Moho olivine domina ted layers benea th the Shillong p la teau and Assam valley.
Acknowledgements
We are grateful to all those who contr ibuted to the opera t ion of field s ta t ions in a r a the r difficult terrane. Cri t ical review by Prof. Vinod G a u r helped to improve the manuscr ipt .
References
Braile L W, Hinze W J, Van Frese and Keller G R 1989 Seismic properties of crust and uppermost mantle of the contermi- nous United States and adjoining Canada, in Geophysical
Framework of United States (ed.) L C Parkiser and W D Mooney Mem. Geological Soc. Am. 172 655-680
Chen W P and Molnar P 1990 Source parameters of earthquakes and intraplate deformation beneath the Shil- long plateau and the northern Indo Burmese ranges; J. Geophys. Res. 95 12527-12552
Evans P 1964 The tectonic framework of Assam; J. Geol. Soc. India 5 80-96
Gaur V K and Bhattacharji J C 1983 Gravimetric determina- tion of the shape of Moho in peninsular and NE India, IUGG Assembly, Hamburg, Germany, August, 15-27
Gupta H K, Singh S C, Dutta T K and Saikia M M 1984 Recent investigation in NE Indian Seismicity, in Proc. Intl. Symp. on continental seismicity and earthquake prediction, (Beij- ing: Seismological Press) 63-71
Hearn T M 1984 Pn travel times in south California; J. Geophys. Res. 89 1843-1855
Kayal J R and De R 1987 Pn velocity study using a temporary seismographic network in the Shillong plateau, NE India; Bull. Seism. Soc. Am. 77 1718-1727
Kind R 1972 Residual and velocity of Pn waves recorded by the San Andreas seismograph network; Bull. Seism. Soc. Am. 62 85-100
Mukhopadhyay S, Khattri K N and Chander R 1995 Seismic velocity and related elastic parameters of the crust in the Shillong massif; J. Himalayan Geology 6 1-8
Nandy D R 1980 Tectonic patterns in northeastern India; Indian J. Earth Sci. 7 103-107
Openheimer D H and Eaton J P 1984 Moho orientation beneath central California from region earthquake travel times; J. Geophys. Res. 89 10267-10282
Ravi Shankar 1988 Heat flow map of India and discussion on its geological and economic significance; Indian Minerals 42 89-110
Scheidegger A E and Willmore P L 1957 The use of least squares method for the interpretation of data from seismic surveys; Geophysics 22 9-22
Shearer P M and Openheimer D H 1982 A dipping Moho and crustal low velocity zone from Pn arrivals at Geysers, Clear lake, California; Bull. Seism. Soc. Am. 72 1557-1566
Sitaram M V D and Saikia M M 1992 Results of a seismic network in NE India; Curr. Sci. 62 177-182
Tandon A N 1954 A study of Assam earthquake of August 1950 and its aftershocks; Indian J. Meteorol. Geophys 5 95- 137
Verma R K and Mukhopadhyay M 1977 An analysis of the gravity field in northeastern India; Tectonophysics 42 283- 317
MS received 2 November 1999; revised 18 November 1999