Embed Size (px)
Citation preview

Policy Analysis Exercise Pathways to academic excellence for students from low-‐income families
Ng Xiang Long and Jessie Li
24TH NOV 2014
This report is intended for Beyond Social Services and staff from Lee Kuan Yew School of Public Policy.

ACKNOWLEDGEMENTS
We would like to thank the following individuals for their contributions towards this Policy Analysis Exercise: Professor Wu Xun, for his guidance along the way. The staff at Beyond Social Services, for assisting us in so many ways. In particular, we would like to give a shout out to Chris, Pei Kwang, Raymond, Kevin for their help throughout the one year. To the VWOs who participated and provided comments on our recommendations. To the children and parents of our survey, for taking time out to answer our questions. To our friends and families for the encouragment along the way. And to the staff of LKYSPP for their assistance during the one year. In the previous version of this report, we had acknowledged a few individuals who had taken time out in their personal capacity to give comments on parts of the report. They have never seen or read the final report, and their contributions should not be seen as endorsement or acknowledgement of findings from this report. We would like to apologise for putting them and their organisations at risk of being misconstrued as endorsing this report. We would like to emphasis that all views in this report are attributable only to the co-‐authors of this report, unless explicitly cited.

TABLE OF CONTENTS
EXECUTIVE SUMMARY....................................................................................... 1 1. INTRODUCTION .............................................................................................. 2 1.1 Overview of Project 1.2 Client Information 1.3 Contribution to Literature 2. CONTEXT/BACKGROUND ............................................................................. 3 3. PROBLEM DEFINITION .................................................................................. 6 3.1 Individual-level Factors 3.2 Household-level Factors 3.3 School-level Factors 4. RESEARCH OBJECTIVES .............................................................................. 8 5. RESEARCH METHODOLOGY ........................................................................ 9 5.1 Overview of Research Process 5.2 Stage 1 5.2.1 Literature Review Process 5.2.2 Secondary Data Analysis Process 5.2.3 Literature Review Findings 5.2.4 Limitations of Literature Review 5.3 Conceptual Framework 5.3.1 Variable Definition
5.3.2 Limitations of Conceptual Framework 5.4 Stage 2 5.4.1 Survey Design 5.4.2 Limitations of Survey Design
5.4.3 Survey Analysis Methology 5.4.4 Validity of Research 5.4.4.1 Randomization 5.4.4.2 Representativeness of Sample
6. FINDINGS AND ANALYSIS ........................................................................... 22 6.1 Descriptive Statistics 6.2 Analysis of Survey Results 6.3 Inferences from Survey Results 6.4 Limitations of Findings 6.5 Anecdotal Findings 6.6 Conclusions
7. RECOMMENDATIONS ................................................................................... 34 7.1 Stakeholder Analysis 7.1.1 Stakeholders in Community-based Actions
7.1.2 Stakeholders in Policy Changes 7.2 Evaluation Criteria of Recommendations 7.3 Focus Group Discussion 7.4 Final Recommendations 7.4.1 Household and Individual-targeted Recommendations 7.4.1.1 Community-based Actions 7.4.1.2 Policy Changes 7.4.2 School and Government-Targeted Recommendations 7.4.2.1 Community-based Actions 7.4.2.2 Policy Changes
8. CONCLUSION ................................................................................................ 50 9. BIBLIOGRAPHY ............................................................................................ 51 10. APPENDIX ................................................................................................... 57

List of Appendix
Annex A: Overview of Existing Educational Assistance Programs in Singapore
Annex B: List of schools with a high proportion of low SES students
Annex C: Survey Questionnaire
Annex D: Regression Analysis
Annex E: Preliminary Recommendations and Focus Group Questions

1
EXECUTIVE SUMMARY
The high academic failing rate of primary school children from low-income families in
Singapore is a key concern for Beyond Social Services. This Policy Analysis
Exercise (PAE) seeks to investigate the factors inhibiting academic excellence for
this group of students, and suggest ways in which the community and other major
stakeholders in the education system can help improve the situation.
The conceptual framework used in this study adopts a three-tiered approach in
identifying factors relevant to academic achievement, examining individual-level,
household-level, and school-level factors respectively. A combination of in-depth
literature reviews, survey questionnaires, as well as focus group discussions is used
to identify salient factors in these three categories in order to achieve the study
objectives. We identified (1) motivational and basic skills (2) financial resources (3)
learning and teaching pace as the key factors inhibiting the academic potential of our
target group. Basic skills are daily skills essential for everyday living, such as eating
and bathing independently. Based on these factors, we propose that (1) events
targeting motivational, basic skills, and goal setting be organized (2) providing a
conducive environment for studying (3) enhancing student support and after-school
care through collaboration between voluntary welfare-organizations and the
community. Further, we recommend the government to (1) streamline financial
assistance applications (2) review teaching pace and interventions for slower-
learners and (3) revise rental housing renewal criteria as the main policy changes
that the government should look into.

2
1. INTRODUCTION
1.1 Overview of Project
This Policy Analysis Exercise (PAE) seeks to: (a) provide a critical evaluation of the
factors inhibiting academic excellence for students from low-income families and (b)
provide a call-to-action plan for the community to mobilize their resources to help
these students. This policy issue was suggested by our client, Beyond Social
Services.
1.2 Client Information
Beyond Social Services is a voluntary welfare organization (VWO) based in
Singapore whose mission is to curb delinquency among disadvantaged young
people and their families, and to move them beyond their problems. Beyond focuses
on achieving its goals through providing young people with access to social,
educational and community support programs.
1.3 Contribution to Literature
Our analysis contributes to extant literature by considering a wide range of factors
that could possibly contribute to poor academic performance of Singaporean children
from low socio-economic status households. Such wide coverage of factors has not
been attempted in depth in existing literature. Further, our study attempts to take into
account the impacts of socioeconomic status in light of Singapore’s unique cultural
context. Finally, by making suggestions to mobilize the community at large, our
recommendations stand out from traditional policy approaches that are generally top-
down in nature.

3
2. CONTEXT/BACKGROUND
Education has always been a crucial area of focus for Singapore. As a
developmental state born out of crisis, people are our one and only natural resource.
Former Prime Minister Lee Kuan Yew recognized early on that skilled human capital
was Singapore’s only path to prosperity (McKinsey & Company, 2010) and this
cemented the importance of education as a vehicle to develop world-class human
resources that can propel Singapore’s economy forward.
Singapore has seen decades of continuous school system reform since
independence and the quality of our education system today is internationally
recognized. The 2010 McKinsey Report, which examines the characteristics of
school systems that consistently produce students who perform well in international
benchmarking tests such as TIMSS, PIRLS, and PISA1, ranked Singapore’s school
system as one of the world’s best-performing ones (McKinsey & Company, 2010).
Meritocracy is a core principle of governannce in Singapore (Low & Vadaketh, 2014),
and this principle strongly guides the Singapore education system. According to the
National Education website of the Singapore government, “the system of meritocracy
in Singapore ensures that the best and brightest, regardless of race, religion and
socio-economic background, are encouraged to develop to their fullest potential”
(Ministry of Education, 2004). Clearly, education can be a leveling force against
inequality in a society that prides itself on meritocratic principles. However, a
meritocratic system that fails to take into account prior resource endownments, that
ignores the inherent inequalities in a society, can perpetuate these inequalities.
Those rewarded in said meritocratic system may be blessed with better starting
points, ignored due to the policy of non-discrimination in a meritocratic system (Tan
2008).
As such, the government has committed towards ensuring that success is
independent of social background or family circumstance (Lee 2013). While the
government does not believe that it is able to lead individuals to the same outcome, it
believes in leveling the initial playing field for all (Low & Vadaketh, 2014). In the
education system, this is done by ensuring that every child receives quality 1 Trends in Mathematics and Science Study (TIMSS), Progress in International Reading Literacy (PIRLS), Program for International Student Assessment (PISA)
4
education, regardless of their background or the schools they attend.The Ministry of
Education has reiterated its faith in the mainstream education time and again and
continually emphasized that every school is a good school (Ministry of Education,
Singapore, 2013). However, despite the government’s best efforts to provide equal
opportunities for all, certain nuances such as Singapore’s cultural context and the
fundamental structure of our education system have come to compromise the
original commitment to equality. Studies and reports (Barr 2008, Senin and Ng 2012)
have shown that there exists a pervasive performance gap between different social
classes and ethnic groups in Singapore today. Statistics from MOE corroborates the
findings, which shows that the Malay ethnicity has perenially lagged behind other
ethnic groups in national examinations (Ministry of Education 2012).
One argument posited for the phenonmenon is that the Singapore meritocracy
rewards relative performance rather than absolute performance (Low 2013). This can
be seen from the use of grading curves in national examinations to rank
performance. In such a system, individuals compete for “relative position or
advantage” (Low 2013), by being ranked ahead of others. The scarcity of top
rankings incentivizes individuals to compete on non-meritocratic means, such as
purchasing housing near good schools to gain preferential access to them, or to
compete on relative investments by investing more in their children relative to other
children. Exacerbating the issue, when educational qualifications serve as distinct
measures of merit, signalling a graduand’s potential, they become a positional good2
where individuals compete to show they are better than the rest (Gee, 2012). In such
a system, wealthier households are better able to invest in tools such as private
tutors and supplementary materials to help them achieve their desired qualifications,
thus explaining the performance gap in the education system.
Furthermore, Singapore is an Asian society backed by strong Confucian values,
where there is a strong emphasis placed on effort over ability as a factor contributing
to success. According to Bray & Lykins (2012), private tutoring is especially likely to
be widespread in cultures that stress effort. Indeed, Singapore has been dubbed a
‘tuition nation’ in virtue of the prevalence of private tuition in its society today. A study
by the Asian Development Bank found that 97 percent of all Singapore students (of
all levels) were enrolled in tuition and enrichment classes in 2008 (Today Online,
2 A positional good “is a product or service whose value (and hence its’ consumption) is primarily a function of its relative desirability or scarcity in a social context” (Gee, 2012). Examples include luxury products such as Porsches and Gucci bags.

5
2013). Of these, it is often parents from poor educational and financial backgrounds
who are more willing to enroll their children in tuition classes, as they believe in the
importance of achieving good grades to ensure future success (The Straits Times,
2013).
In its primitive sense, tutoring was meant for students whose academic performances
were relatively weaker and required extra help outside of curriculum time. However,
over the past few decades, tutoring has become more of a point of parity rather than
a point of difference, leading to the phenomenon of ‘star tutors’ who are legitimized to
charge outrageous premiums under the promise of helping students out-perform their
peers. Such services are obviously out of reach for poorer households.
This is reinforced by the competitive and results-oriented nature of our education
system, where the streaming process starts as early as 10 years old3. While statistics
have shown that streaming has indeed helped to improve overall student
performance and narrow the achievement gap between different ethnic groups
during the early years, this differentiation is increasingly seen as a function of
household resources in recent years (Goh and Gopinathan, 2008). As a result,
education has become less of an equalizing vehicle and more of an arms race in
Singapore, which contributed to a widening academic achievement gap between the
rich and the poor.
Singapore has a legal mandate for the enforcement of compulsory primary education
for all. Currently, school fees (excluding miscellaneous fees) are entirely waived for
Singaporean citizens, and subsidized for permanent residents. However, the effects
of income differentials on educational achievement have received little attention from
policy makers. The Ministry of Education (MOE) operates the Financial Assistance
Scheme (FAS) to help needy families pay for their children’s school fees, standard
miscellaneous fees and basic schooling expenses such as textbooks and school
attire (Ministry of Education, 2013). Currently, students of Singaporean citizenship
whose gross household income does not exceed $2,500 a month, or whose per
capita household income does not exceed $625 a month, are eligible for the FAS.
Besides this, a range of other assistance programs run by corporations, non-
3 The streaming policy was originally implemented in 1979, and subsequently modified in 1991 to stream students into EM1,2 and 3 when children reach Primary Four, typically at age 10. This streaming policy was abolished in 2007 and replaced with subject banding, where students take subjects at different levels of difficulty, based on parental and school decision. Information retrieved from various MOE review committee reports in 1978, 1991 and 2009.
6
government organizations, voluntary welfare organizations, ethnic support groups
and self-help groups (Annex A) also exists. This wide plethora of assistance
programs sometimes gives an illusion of choice and can often be confusing for low-
income households. Furthermore, they usually require opt-in participation, which
implies that poor households are often unaware of them, or daunted by the complex
criteria and application process required to register.

7
3. PROBLEM DEFINITION
Based on a survey they conducted, Beyond Social Services found that about 57% of
the Primary School students in the five low-income communities they were working
with were failing at least one subject, while 28% were failing two subjects. These
numbers are alarming because the lack of a strong foundation in basic subjects such
as English and Math will likely impede students’ understanding of more advanced
subjects such as Science and Humanities later on. This is particularly significant in
view of the competitive nature of Singapore’s educational landscape, where students
are regularly selected and streamed according to ability. If one falls behind from
young, there may be a multiplier effect where it becomes increasingly more difficult to
merge upwards into the system at later stages. This can potentially impact the social
mobility of children from these low-income households in later life, and perpetuate
social inequality on a national level. Henceforth, the poor academic performance of
primary school students from more disadvantaged socioeconomic backgrounds was
identified as an issue of key concern for our client.
The possible reasons behind poor academic performance of this group of students
can be classified into three main categories: individual-level factors, household-level
factors and school-level factors.
3.1 Individual-level Factors
At the individual level, we believe that both nature and nurture have a part to play in
determining academic performance. While there is extensive research to show that
intelligence is dependent on genetic background, experts have said that social and
environmental factors can have an important influence too (Cohen, 2014). In
particular, early family environment and elementary school years have proven to be
crucial in determining academic performance. Family factors such as upbringing and
environment (both physical and spiritual) can affect children’s intrinsic and extrinsic
motivational orientation, and thus impact their academic performances. Further, a
child’s personality and interests will shape the way in which he or she learns and
some children may be more artistically or physically inclined than academically.
Health conditions, such as physical or learning disabilities and even emotional well-
being, may also interfere with a child’s ability to perform academically.

8
3.2 Household-level Factors
Family members are the first educators for the child and home environment has been
recognized as having significant influence on academic performance and personal
development (Chinyoka and Naidu, 2014). Household socio-economic factors such
as income, education level and occupation of parents, and relationship with family
members may all affect academic performance. Diverging incomes among families,
for one, often imply differential access to resources. Research has found that parents
today spend more money on enrichment activities such as extra-curricular academic
lessons, home-learning materials and even pre-school education than ever before
(Mastercard, 2013). Hence, the resource gap between rich and poor households is
thought to have significant impacts on academic performance. Further, demographic
factors such as race, language and religion may also play a part. For example, if the
language spoken at home is different from the language of instruction used in the
classroom, there may be difficulties in understanding.
3.3 School-level Factors
It is possible that the average academic performance of students differs from school
to school. Despite promoting the philosophy that every school is a good school, the
Ministry of Education gives out a number of awards to ‘deserving’ primary schools in
Singapore in recognition of their pursuit of excellence (The Asian Parent, 2011).
Based on this information, there are a number of informal rankings released each
year and parents tend to use these as an indicator of the quality of the school.
Therefore, poor academic performance may be attributed to the quality of education
provided at the school level. This includes the quality of teaching, facilities and
resources available, student mix, school culture (e.g. prevalence of bullying), class
size or student to teacher ratio, teachers’ expectations, and such.
Education is clearly an issue that affects everyone in society. A concerted effort from
all the stakeholders in the system is necessary to achieve a significant departure
from the status quo. This includes the government, corporations, non-government
organizations, schools, families, individuals, and the community at large. There is no
singular easy answer to such a complex problem, but Beyond Social Services is
interested in examining how the community, in particular, can be mobilized to do
more given the nature of the problem. This helps to narrow our focus in the project
and be more specific in our recommendations.

9
4. RESEARCH OBJECTIVES
The general policy question posed by the client was: How could educational policies
take into account and cater for such struggles faced by the low income community so
that desired outcomes for education for Singaporeans can be achieved?
Based on the understanding of the wider educational landscape in Singapore, this
PAE aims to investigate the factors contributing to poor academic performance of
primary school children from low-income households and propose an integrated,
community-based action plan that our client can implement to tackle this issue.
To achieve these objectives, the paper addresses six main questions:
1. Who are the stakeholders in Singapore’s education system and what are their
existing relationships?
2. What are the main reasons behind poor academic performance for our target
group currently? What are the significant barriers they face?
3. How does existing literature suggest we can bridge the academic
achievement gap between rich and poor households? To what extent is this
applicable in Singapore’s context?
4. What are the challenges of Beyond Social Services’ current operating
environment in addressing this issue?
5. Who are the stakeholders involved in a community-based approach and what
roles do they play? In particular, what role can Beyond Social Services play in
tackling this issue?
6. What are the key challenges and opportunities for a community-based
approach?

10
5. RESEARCH METHODOLOGY
5.1 Overview of Research Process
This section describes the research process, which was conducted in two stages. In
the first stage, we conducted secondary research by reviewing the literature on
factors that affect the academic performance of children, as well as attempt to obtain
and analyze the pass-fail rate of students from our client and MOE. The aim of this
stage was to: (a) identify if school or socio-economic factors played a bigger part in
determining the academic performance of our target group, (b) identify factors of
academic performance to develop our conceptual framework for analyzing the
performance of low-income students.
In stage two, we conducted primary research on families living in rental-flat precincts
in Singapore. Using the conceptual framework developed earlier, as well as our
secondary research conclusions, we developed a survey targeting children and their
socio-economic status. The survey was conducted from July to Sept 2013, covering
90 children and their families. The aim of this stage was to collect sufficient data for
statistical analysis, in order to draw conclusions on factors influencing academic
performance of children from low-income families in Singapore.
5.2 Stage 1
This section covers the research in Stage 1.
5.2.1 Literature Review Process
We combed through the extant literature for factors that affect academic performance
of children in general, as well as factors specific to children from low-income families
and Singapore students. We began our research by identifying factors common from
the international experience, before narrowing our scope down to the Singapore
context.
Our search process is as follows. First, we used established search engines such as
Google Scholar and NUS online library catalogue to find peer-reviewed journal
articles on the topic. For journal articles that were of relevance, we went through their
bibliography to identify further articles of interest. Second, we used Google to find
reports by organizations such as OECD, as well as books by authors on the subject.
Third, we searched the publications page of MOE and the National Institute of
Education (NIE), for reports specific to the Singapore context. Last, we searched the

11
NUS Scholar Bank and approved grants of Children Society of Singapore, to find
students’ dissertations on the issue. While the last source is not peer-reviewed, they
provide a rich source of information for the Singapore context, complementing the
limited journal articles covering the Singapore scope.
5.2.2 Secondary Data Analysis Process
We sought to obtain previous survey data from our client, as well as the pass-fail rate
of schools from MOE, in order to determine the extent of the problem that is
attributable to school factors. The process required us to first, identify schools
attended by children in the low-income precinct; second, calculate the average failing
rate of each standard of low-income students for each school in the sample; third,
obtain the failing rate of each standard from each school and compare the mean
failing rate with that of step two. A statistically significant difference in mean failing
rate will indicate if family or school factors were more impactful for students of
different schools.
However, we were unable to obtain both sets of data due to various reasons. For
data from our client, we were only able to obtain a summary of the average failing
rate for each of the five estates that our client operates in, as the raw survey data
was no longer available. We contacted the schools identified from the summarized
data to request for their pass-fail rate, specifying our research need and willingness
to sign non-disclosure agreements. All schools contacted, as well as the cluster
superintendent for each school cluster, rejected our request. Lastly, we contacted
MOE to obtain the same data, but were rejected on the grounds of the sensitive
nature of the data.
As a result, we were unable to determine the extent of the problem attributable to
school factors. However, the Programme for International Assessment (PISA) 2009
report on education, which had a section on Singapore, drew various conclusions
based on their data of Singapore.
First, only 22.5% of variance in performance of a local primary school student could
be explained by the students’ family background, with 15% of the 22.5% by socio-
economic status. Second, while the variance is not high, PISA found that the slope of
the socio-economic and scores gradient for Singapore was much steeper than the
OECD average (47 vs 38), implying that a slightly increase in socio-economic status
had a significant impact on scores. Third, a school’s performance was related to the

12
socio-economic profile of the students it takes in, implying that while 77.5% of a
student’s performance was related to school factors, the number was still heavily
influenced by the composition of socio-economic backgrounds:
“Variation in performance explained by schools’ socio-economic background
between schools for Singapore is about 60%, above the OECD average of 57%”
(OECD,2010)
The PISA report concluded that while a student’s background is related to his/her
performance, the school’s student socio-economic composition may be even more
important. Hence, identifying schools with a high intake of low-SES students, and
further targeting low SES students in these schools, will have a large impact on the
scores of students.
We had identified the schools with a high proportion of low SES students, based on
data from our client (Annex B). These schools were situated in the immediate vicinity
of the low-income precincts. As such, we focused our research direction towards
identifying factors within the socio-economic and individual domains that were critical
to a students’ performance, and which we could influence to improve academic
results.
5.2.3 Literature Review Findings
A meta-analysis of research on socio-economic status and academic achievement
by Sirin (2005) found that SES had a medium to strong correlation with achievement.
The relationship is moderated by the “unit, source, range and type of SES-
achievement measure”, and contingent on grade standard, ethnic race, and school
location (Sirin 2005). The result is corroborated by the PISA 2009, (OECD 2011),
which states that there is a strong association between socio-economic background
and reading performance.
While intelligence has been established as a strong predictor of academic success,
many factors affect intelligence, including environmental, biological and even
psychological beliefs about intelligence (Neisser, et al 1996, Jensen 1998). These
factors thus affect academic performance both in a direct and indirect manner.
Wentzel, et al. (1990) found that social competence in motivational, affective, and
self-regulatory processes had concurrent effects that were strongly influential on
academic attainment in preadolescence (before age 10). Liu et. al (1992) found that

13
self-esteem and academic success had reciprocal effects, but Ross and Broh (2000)
disputed that while academic success boosts self-esteem and sense of personal
control, only the latter has an impact on future academic accomplishment. Hill, et al.
(2004) found that for parents of higher educational level, parent academic
involvement had a positive impact on child behaviour, which were then beneficial for
their achievement, but not for low-education parent groups. Marsh, et al. (2005)
found a reciprocal effect of academic self-concept on grades, based on a longitudinal
study of German students. Duckworth and Seligman (2005) found that self-discipline
was even more important than IQ in predicting the academic performance of
adolescents. Dweck and Aronson (2002) and Blackwell et al. (2007) found that
students’ belief that intelligence was malleable (incremental theory), rather than fixed
(posit theory), had a positive impact in academic achievement. Factors such as
physical health (Chomitzhomitz, et al. 2009), social-emotional factors amongst
disadvantaged students (Becker and Luthar 2010) also had a part to play in
academic achievement.
In the Singapore context, Liu, Wang and Parkins (2005) found that while streaming
had an effect on academic self concept for secondary school students, the effect was
largely short-term. Senin and Ng (2012) found that malay youths from low-income
families had lower educational aspirations. Luo, et al. (2014) found that Singapore
students attributed their academic success mainly due to internal regulation of
personal effort, interest, study skills. In particular, students of low-academic
competence believed that tuition classes were of strong importance to their success.
In summary, there are a myriad number of factors that can impact the academic
success of students, ranging from personal factors of motivation, self-esteem, to
external influences such as parental support and tuition.
5.2.4 Limitations of Literature Review
The literature established that specific factors, such as motivation, socio-economic
status, had a relation with academic achievement. However, most studies examined
only one or two causal factors, and a small minority looked at a three-factor analysis.
There are no studies that attempt a larger number of factors and their concurrent
effects on academic achievement; it may be possible that specific factors are
mediated by others when they act simultaneously.
14
While the literature on the international experience was extant, research on
Singapore students focused heavily on academic-self concept. This also fails to take
into account other mediating factors as above, as well as the unique context of
bilingual education, strong presence of tuition and other localized variables.
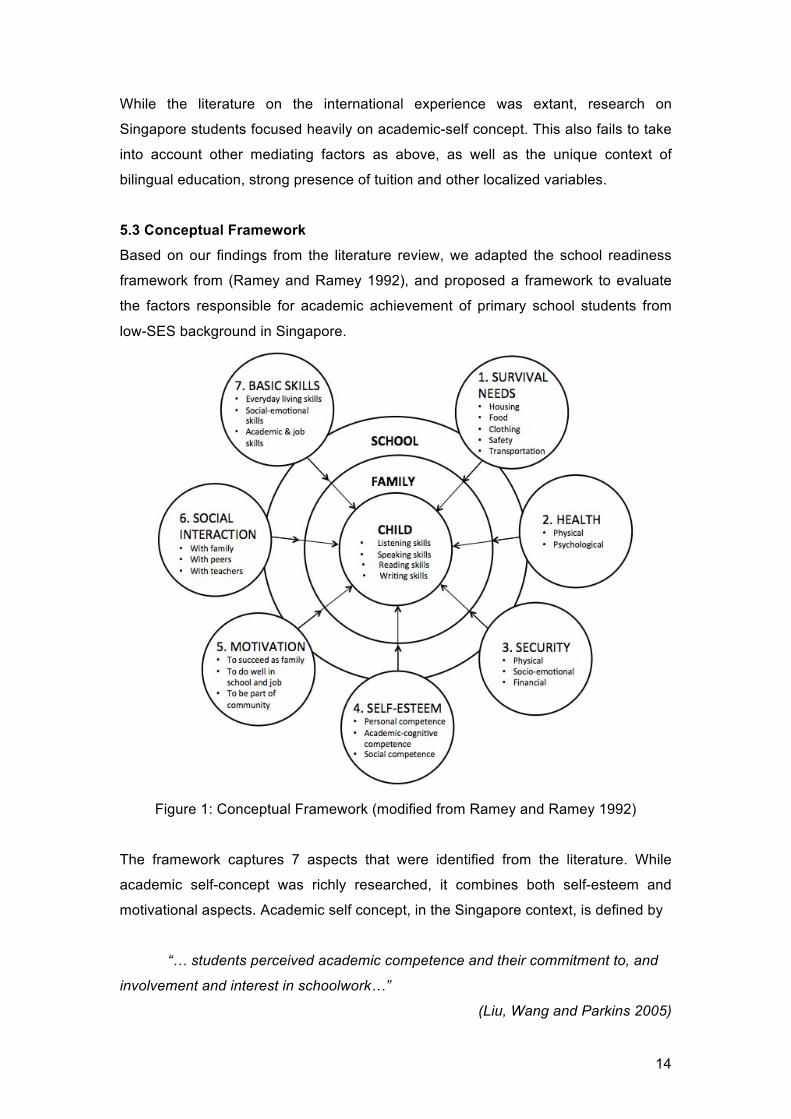
5.3 Conceptual Framework
Based on our findings from the literature review, we adapted the school readiness
framework from (Ramey and Ramey 1992), and proposed a framework to evaluate
the factors responsible for academic achievement of primary school students from
low-SES background in Singapore.
Figure 1: Conceptual Framework (modified from Ramey and Ramey 1992)
The framework captures 7 aspects that were identified from the literature. While
academic self-concept was richly researched, it combines both self-esteem and
motivational aspects. Academic self concept, in the Singapore context, is defined by
“… students perceived academic competence and their commitment to, and
involvement and interest in schoolwork…”
(Liu, Wang and Parkins 2005)

15
As such, we decided to separate out self-esteem and motivation to measure the
concurrent impact of each factor, rather than as a single factor of academic self-
concept. The 7 factors are explored in both the home and school environment to
capture the total effect of each factor on a child’s academic performance.
5.3.1 Variable Definition
1. Survival needs: refers to whether or not an individual’s basic human needs
such as food, shelter, and clothing are met. This could be measured by
incidences of hunger or other material insufficiencies.
2. Health condition: refers to whether an individual is in a state of good physical
and psychological health. This could be reflected through physical and
intellectual disabilities, incidences of illness, and levels of stress and anxiety.
3. Sense of security: refers to whether an individuals feels secure physically,
emotionally, and financially.
4. Self-esteem: refers to an individual’s self perceptions in areas of personal,
cognitive, and social competency.
5. Motivation: refers to whether an individual has positive motivation to do well in
school, family, and community lives. This could be gauged through their
attitudes and goals in these aspects of life.
6. Social interactions: refers to whether an individual has sufficient interactions
with others in their social lives. For example, one measure is the amount of
time that parents spend with their children on a daily basis.
7. Basic skills: refers to whether or not an individual has the fundamental skills
to perform basic tasks independently both at home and in out-of-home
settings. This could include traveling from home to school or helping out in
household chores.
5.3.2 Limitations of Conceptual Framework
While our conceptual framework is holistic, we may not have been able to capture
additional factors that are unique to the Singapore context, such as a bilingual
education environment, or a multi-ethnic society and it’s impact. However, we did
include questions of relevance, such as language spoken at home, as well as ethnic
race and citizenship, in our primary research.

16
5.4 Stage 2
This section provides an overview of our primary research in Stage 2.
5.4.1 Survey Design
We employed face-to-face surveys, in the form of fixed questionnaires, as our
primary research tool to gather information on the various aspects identified in our
conceptual framework. Surveys are useful as they allow us to draw inferences on a
population based on data from a sample of the population. A survey well
implemented enables researchers to draw accurate conclusions on the population
(Rea and Parker 2005).
The alternative to using surveys would be the use of semi-structured interviews with
low-income families. While interviews provide information that may not be captured
by fixed-question surveys, the factors identified may be specific to families and not of
a substantial impact across the community. Semi-structured interviews were also
prone to interviewer’s confirmation bias, where interviewers ask questions and
interpret answers that confirmed their beliefs (Powell, Hughes-Scholes and Sharman
2012). As such, we decided to use surveys to mitigate the possible biases.
We utilized existing questions from established questionnaires that measured each
aspect (Table below). For survival needs, we generated questions that measure the
fulfillment of basic needs from Maslow’s hierarchy of needs.
Health Security Self-Esteem
Motivation Social Interaction
Basic Skills
Adopted from Varni & Kurtin (2001) Pediatric Quality of Life Inventory (PedsQL) 2001
Adopted from Varni & Kurtin (2001) Pediatric Quality of Life Inventory (PedsQL) 2001
Rosenberg-Simmons Self-Esteem Scale (1972)
Hermans (1983) Achievement Motivation Test for children
Gresham & Elliot (1990) Social Skills Rating System
Adapted the Functional Disability Inventory (Walker & Greene, 1991)
Table 1: Summary of survey question sources
While the questionnaires were developed in a Western context and may not be
generalizable, Heng (2008) dissertation found that the PedsQL instrument was

17
reliable and can be used for Singapore children. In total, the survey comprised of 87
questions, with 77 questions for the child and 10 questions for their parents (Annex
C). The typical duration required to complete one survey was around 20 minutes. We
were careful to balance the number of questions and the amount of time required as
children’s attention spans tend to be shorter. Surveys were conducted in english for
uniformity. However, there were a few exception cases whereby family members, or
the researchers ourselves, had to assist in translation from English to the
participant’s spoken language because of communication difficulties. In these cases,
there may have been some understanding lost in translation despite our best efforts
to capture the original meaning. However, the overall impact on our research findings
can be considered negligible.
We pre-tested the survey with five families of different races and standards to ensure
the face validity of all questions. Questions that elucidated hesitations and ambiguity
were re-worded to ensure clarity.
We targeted children between eight and twelve years who were attending primary
school. We omitted children of seven years old, as they were in Primary One and
would not have any examination results to be recorded. The survey was conducted
on weekdays between 5.30pm and 9.30pm in the children’s homes in the presence
of a carer. This time frame allowed us to capture students who had to stay back in
schools for remedial lessons, and avoid their omission from the sample. Using our
research grant, we also gave each participant a $5 NTUC voucher upon completion
of the survey. This was not only as a token of appreciation but acted as an incentive
to encourage higher response rates.
5.4.2 Limitations of survey design
While surveys allowed us to collect a large amount of information, there are various
limitations of our surveys. Firstly, as our target audience were children between eight
and twelve years old, those with poor English skills may not fully comprehend the
questions. Despite our pre-testing, there were some children who were unable to
understand the questions. In such scenarios, we either stopped the survey, or
skipped questions that were not understood systematically. One such example was
Question 46, which was phrased in a negative response manner. The response for
question 46 was not utilized in the eventual statistical analysis.

18
The second limitation was the child’s desire to give correct answers. For example,
they may think that they should state a desire to study hard to appear correct,
despite their dislike for it. This may be even more possible, if their parents were
nearby, and they would like to please their parents. We sought to mitigate such bias
by constantly reminding the children that there are no correct answers and that they
should give an honest answer. Where hesitation was present, we would request the
children to point out their answers, instead of a verbal response, to eliminate parental
influence.
The last limitation of our survey is that it collects only cross-sectional data. There
may be other long-term influences that were not captured by a cross-sectional
survey. Due to the nature of our project, we were unable to mitigate this limitation.
5.4.3 Survey Analysis Methodology
We utilized a logistic regression model4 in our statistical analysis. The dependent
variable of interest was a student’s pass-fail rate, which was coded as a binary
variable with one indicating a pass for a particular subject and zero indicating a fail.
We had sought to use the actual test scores of the students, a continuous variable,
as the dependent variable instead, but the children’s report book detailing their
grades were kept by the school. Requesting the children to recall their exact test
scores would have lead to a much higher recall bias5, which would significantly
decrease the internal validity of our study (Coughlin, 1990). As a result, we were
limited to using a logistic regression model rather than an Ordinary-Least-Square
(OLS) regression. The pass-fail rate of students is used as a proxy for academic
performance in our analysis.
The hypothesis we were testing for was:
“Factor X” is a factor that affects the academic performance of children from low-
income families,
where factor X is each of the seven factors in our framework. Each factor is the
4 A logistics regression model calculates the probability of an event occurring given the presence of specific factors. 5 Recall bias refers to the situation where subjects of study providing responses to questions relating to their past are unable to correctly remember the happenings or conditions. As a result, the response provided is less accurate or incomplete, which leads to less valid results. (Last, 2000)
19
average score of all questions pertaining to the factor and is a continuous variable.
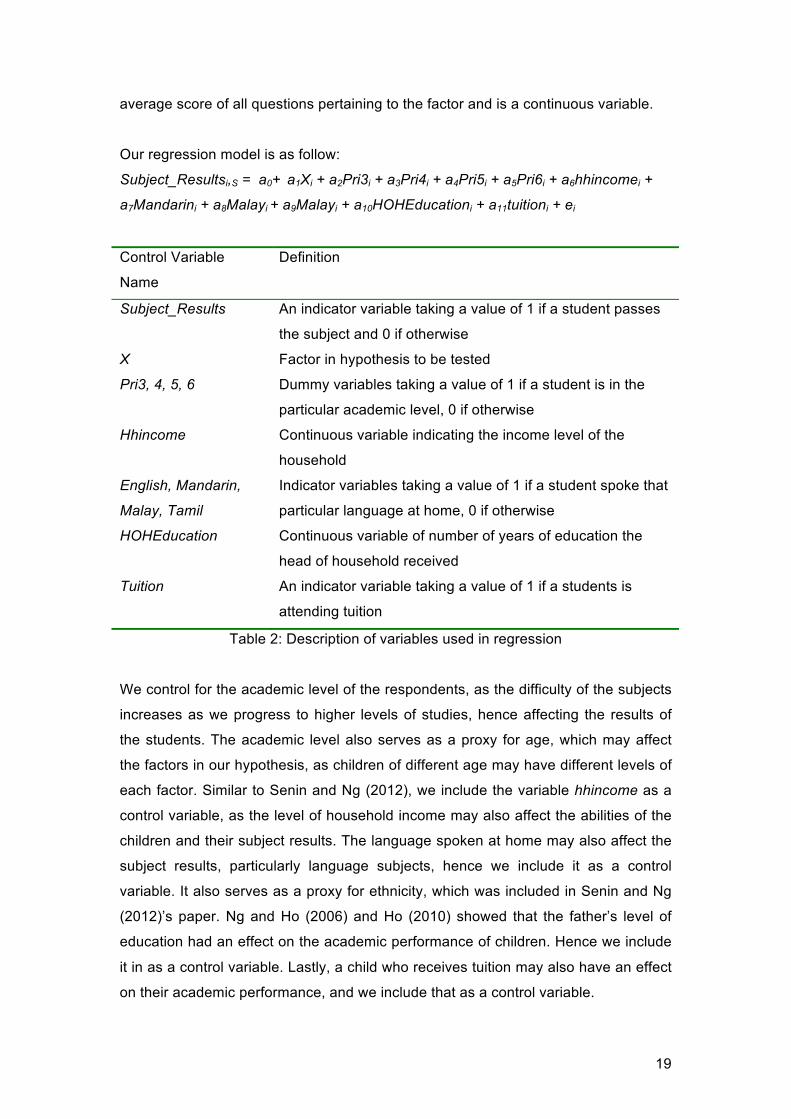
Our regression model is as follow:
Subject_Resultsi,S = a0+ a1Xi + a2Pri3i + a3Pri4i + a4Pri5i + a5Pri6i + a6hhincomei +
a7Mandarini + a8Malayi + a9Malayi + a10HOHEducationi + a11tuitioni + ei
Control Variable
Name
Definition
Subject_Results An indicator variable taking a value of 1 if a student passes
the subject and 0 if otherwise
X Factor in hypothesis to be tested
Pri3, 4, 5, 6 Dummy variables taking a value of 1 if a student is in the
particular academic level, 0 if otherwise
Hhincome Continuous variable indicating the income level of the
household
English, Mandarin,
Malay, Tamil
Indicator variables taking a value of 1 if a student spoke that
particular language at home, 0 if otherwise
HOHEducation Continuous variable of number of years of education the
head of household received
Tuition An indicator variable taking a value of 1 if a students is
attending tuition
Table 2: Description of variables used in regression
We control for the academic level of the respondents, as the difficulty of the subjects
increases as we progress to higher levels of studies, hence affecting the results of
the students. The academic level also serves as a proxy for age, which may affect
the factors in our hypothesis, as children of different age may have different levels of
each factor. Similar to Senin and Ng (2012), we include the variable hhincome as a
control variable, as the level of household income may also affect the abilities of the
children and their subject results. The language spoken at home may also affect the
subject results, particularly language subjects, hence we include it as a control
variable. It also serves as a proxy for ethnicity, which was included in Senin and Ng
(2012)’s paper. Ng and Ho (2006) and Ho (2010) showed that the father’s level of
education had an effect on the academic performance of children. Hence we include
it in as a control variable. Lastly, a child who receives tuition may also have an effect
on their academic performance, and we include that as a control variable.

20
5.4.4 Validity of Research
5.4.4.1 Randomization
We employed a stratified random sampling method. We obtained a registrar of family
records from our client, indicating families with children of primary-school attending
age. Based on the six precincts that our client operates in, we sampled between 15-
20 children from each neighborhood. This was done to mitigate any effects of living
in a particular neighborhood. For each neighborhood, the sampling was done
randomly by going door-to-door.
5.4.4.2 Representativeness of Sample
In total, our survey covered 61 households from 5 low-income communities around
Singapore. We had 90 respondents, out of which 87 responses were valid for use in
subsequent analysis. These respondents came from 25 schools across Singapore.
Table 3: Respondents Breakdown By Gender
Gender Male Female
Proportion 54.0% 46.0%
Table 4: Respondents Breakdown By Academic Level
Primary Level 2 3 4 5 6
Proportion 18.2% 14.8% 23.9% 15.9% 27.3%
Table 3 shows that our respondents are evenly distributed between boys and girls
and hence our sample is free from gender bias.
Table 4 shows a slight over-representation of Primary Six students and Primary Four
Students and a slight under-representation of Primary Three and Five students in our
sample. However, the difference in proportion is not significantly large to affect our
conclusions regarding the effect of academic level on academic performance.
Table 5 shows that the Malay ethnicity made up more than half of the total
respondents (54%), and was the dominant race in our sample. This is surprising,
Table 5: Respondents Breakdown By Ethnicity
Race Chinese Indian Malay Others
Proportion 19.5% 24.1% 54.0% 2.30%

21
given that the Housing Development Board has an ethnic quota of allocating only
25% of a rental block to Malay residents (Ministry of National Development, 2012).
This may be explained by the new policy of administratively adding up to 10% points
to a block’s ethnic quota limit, to reduce the waiting time for a rental flat for specific
ethnicity (Ministry of National Development, 2013). Interestingly, our survey is not the
only survey to find that the Malay ethnicity exceeded their quota ratio. Member of
Parliament Pritam Singh, in his blog, expressed that a check on his constituency
revealed that the Malay ethnicity proportion in rental blocks “hovered around 30%-
40% for most flats, and for one block in particular, the figure was close to 50%”
(Singh, 2012). It seems although there is a presence of an ethnic quota ratio, it is not
strictly enforced for rental flats. As a result, the high proportion of Malay families is
not that surprising after taking into account the above information and the higher
demand from this ethnic group6. Overall, we believe that the racial composition of our
sample is representative of the larger low-income community in Singapore.
The demographic breakdown by gender, ethnicity, and academic level shows that
our sample was well distributed among the categories. Hence, it can be assumed to
be largely free of bias and representative of the primary school students from low-
income families in Singapore.
The proportion of students failing one subject and two subjects in our sample is 63%
and 26% respectively. This is remarkably close to the figures of 57% and 28% from
our client’s initial survey, and allows us to confirm that this sample group is the target
group of interest. Further, it confirms the extent of the failing problem amongst
primary school children from low-income families and provides support for the
seriousness of the issue.
6 The average waiting time for a public rental flat is four months for Chinese; 6 months for Indian/Others and 7 months for Malays. (Ministry of National Development, 2012) From this result, we can infer that there is a higher demand from Malay families, and a lower supply from Malay families exiting the rental flat scheme, relative to the other races.
22
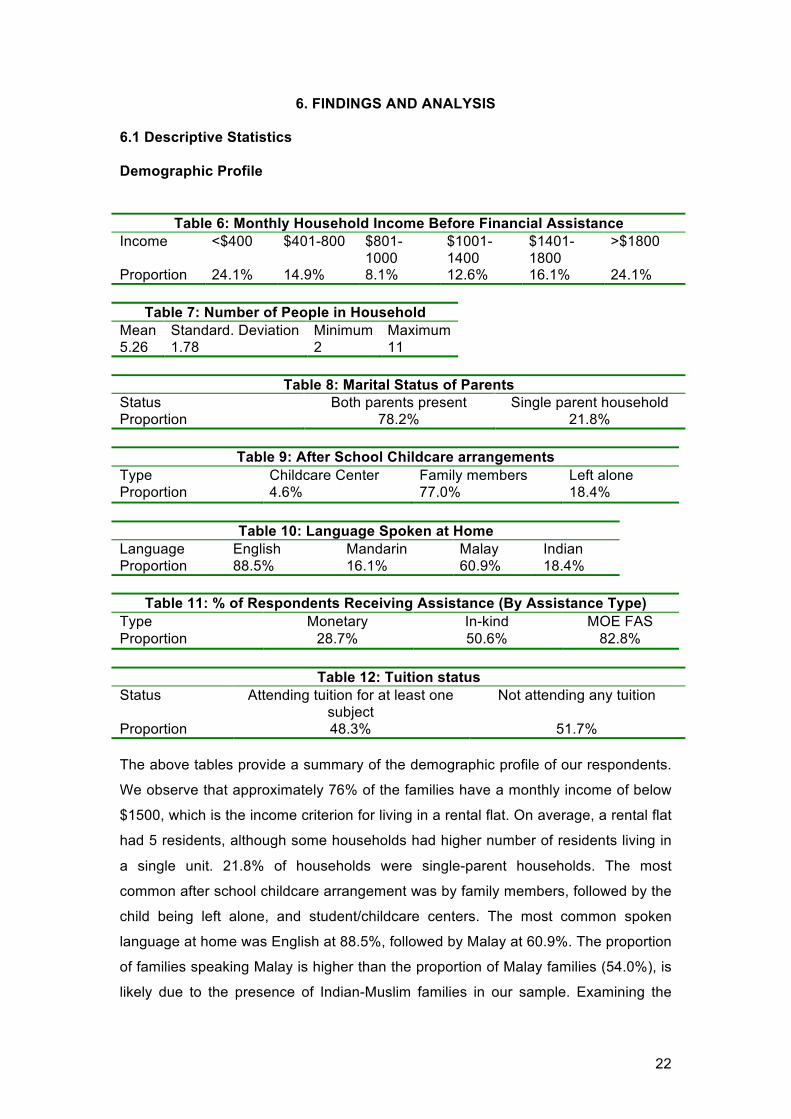
6. FINDINGS AND ANALYSIS 6.1 Descriptive Statistics Demographic Profile
Table 6: Monthly Household Income Before Financial Assistance Income <$400 $401-800 $801-
1000 $1001-1400
$1401-1800
>$1800
Proportion 24.1% 14.9% 8.1% 12.6% 16.1% 24.1%
Table 7: Number of People in Household Mean Standard. Deviation Minimum Maximum 5.26 1.78 2 11
Table 8: Marital Status of Parents Status Both parents present Single parent household Proportion 78.2% 21.8%
Table 9: After School Childcare arrangements Type Childcare Center Family members Left alone Proportion 4.6% 77.0% 18.4%
Table 10: Language Spoken at Home Language English Mandarin Malay Indian Proportion 88.5% 16.1% 60.9% 18.4%
Table 11: % of Respondents Receiving Assistance (By Assistance Type) Type Monetary In-kind MOE FAS Proportion 28.7% 50.6% 82.8%
Table 12: Tuition status Status Attending tuition for at least one
subject Not attending any tuition
Proportion 48.3% 51.7% The above tables provide a summary of the demographic profile of our respondents.
We observe that approximately 76% of the families have a monthly income of below
$1500, which is the income criterion for living in a rental flat. On average, a rental flat
had 5 residents, although some households had higher number of residents living in
a single unit. 21.8% of households were single-parent households. The most
common after school childcare arrangement was by family members, followed by the
child being left alone, and student/childcare centers. The most common spoken
language at home was English at 88.5%, followed by Malay at 60.9%. The proportion
of families speaking Malay is higher than the proportion of Malay families (54.0%), is
likely due to the presence of Indian-Muslim families in our sample. Examining the
23
proportion of respondents receiving some form of assistance, 82.8% of respondents
are on the MOE FAS Scheme. However, the proportion of respondents on other
financial assistance schemes is low at 28.7%. 42 out of 87 respondents attended
tuition, and all but two of these students who attended tuition receive their tuition
from Voluntary Welfare Organizations (VWOs) and Self-Help groups.
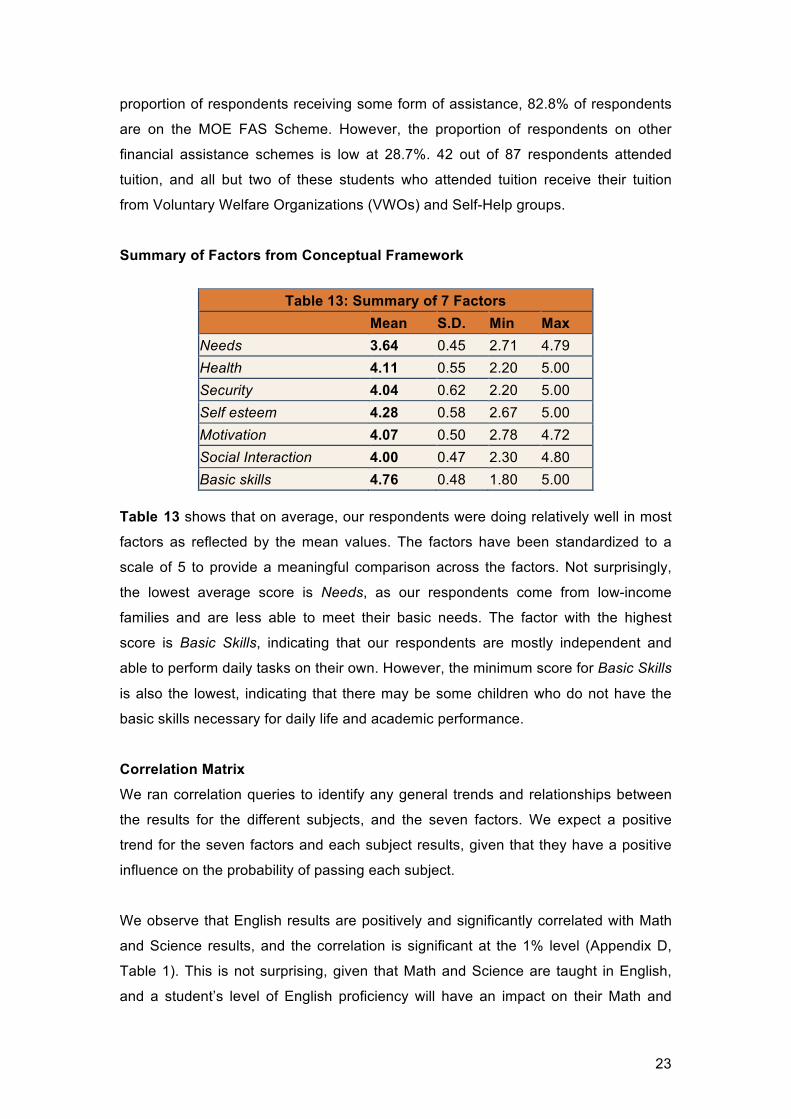
Summary of Factors from Conceptual Framework
Table 13 shows that on average, our respondents were doing relatively well in most
factors as reflected by the mean values. The factors have been standardized to a
scale of 5 to provide a meaningful comparison across the factors. Not surprisingly,
the lowest average score is Needs, as our respondents come from low-income
families and are less able to meet their basic needs. The factor with the highest
score is Basic Skills, indicating that our respondents are mostly independent and
able to perform daily tasks on their own. However, the minimum score for Basic Skills
is also the lowest, indicating that there may be some children who do not have the
basic skills necessary for daily life and academic performance.
Correlation Matrix
We ran correlation queries to identify any general trends and relationships between
the results for the different subjects, and the seven factors. We expect a positive
trend for the seven factors and each subject results, given that they have a positive
influence on the probability of passing each subject.
We observe that English results are positively and significantly correlated with Math
and Science results, and the correlation is significant at the 1% level (Appendix D,
Table 1). This is not surprising, given that Math and Science are taught in English,
and a student’s level of English proficiency will have an impact on their Math and
Table 13: Summary of 7 Factors Mean S.D. Min Max Needs 3.64 0.45 2.71 4.79 Health 4.11 0.55 2.20 5.00 Security 4.04 0.62 2.20 5.00 Self esteem 4.28 0.58 2.67 5.00 Motivation 4.07 0.50 2.78 4.72 Social Interaction 4.00 0.47 2.30 4.80 Basic skills 4.76 0.48 1.80 5.00

24
Science learning and hence academic performance (Abedi and Lord, 2001). The
effect can be more pronounced when the language load, or linguistic complexity of
the test is higher (Abedi, 2003). Mother Tongue results are not significantly
correlated with English and Math, but are positively correlated with Science results at
the 5% level. The correlation is much lower than English, at 26.8% compared to
37.7%. We are unable to sufficiently explain for this correlation, as the literature on
Singapore’s bilingual education policy has not adequately covered this relationship. It
may be possible that the students are exposed to scientific knowledge in their Mother
Tongue at home or from television programmes, and thus are able to use such input
to their advantage.
The seven factors do not exhibit any significant correlations with the various subject
results, with the exception of Basic Skills and English results, which was significant at
the 10% level. Most of the seven factors were positively correlated with the subjects,
with the exception of Self Esteem, Health and Needs, which exhibited negative
correlation for at least two of the subjects. In addition, science results also showed a
small negative correlation with four out of the seven factors. We are unable to explain
for the negative correlation, and it may be due to measurement error that resulted in
the negative correlation. As a result, we are cautious of the regression results from
the three factors that exhibited negative correlation.
Failing Rate By Subject and Academic Level
Table 14: Failing Rate By Subjects English Math Mother Tongue Science
Failing Rate 38% 62% 23% 39% We observe substantial failing rates of students in our sample across all four
subjects, with Math having the highest failing rate and Mother Tongue the lowest
failing rate.

25
Observing the failing rate of subjects across academic levels, we notice a steep
increase in failing rate from Primary three to Primary five for “English”, “Math” and
“Science”. The failing rate of the Mother Tongue subject decreases from 31% for
students in Primary Three to 13%. The group with the highest failing rate is students
from Primary Five, with 86% of Primary Five children failing their Mathematics, a
highly worrying phenomenon. Lastly, we observe that there is a general decline in
failing rate for all subjects from Primary Five to Primary Six.
Table 15: Failing Rate of Primary 5 and 6 Children By Subject Band Subject Foundation Standard English 66.7% 37.9% Math 71.4% 79.2% Mother Tongue 30.0% 11.1% Science 54.5% 28.0%
Observing the failing rate for Primary Five and Primary Six children in Table 15, we
observe that the failing rate is primarily driven by students who are taking the
subjects at foundation level7, with the exception for Math. This provides indication
that students who are taking subjects at the foundation level are still unable to meet
the demands of the examinations adequately.
7 Students and their parents choose if they would like to take a subject at a foundation or standard level after Primary 4 (MOE 2014). Subjects offered at foundation levels are at a lower difficulty compared to subjects offer at the standard level

26
Failing Rate By Ethnic Group
We observe that the ethnic group with the highest failing rate is the Indian ethnicity,
followed by the Malay and Chinese. We ignore the statistics of the “Others” group, as
the sample size is too small at two respondents. The results is slightly surprising, as
data released from the Ministry of Education indicates that the Malay ethnicity has
traditionally under-performed relative to the other ethnic groups (Appendix D, Chart
1). Even after accounting for SES factors, data from the Centre for Research in
Pedagogy and Practice (CRPP) in the National Institute of Education (NIE)
Singapore finds that Malay students still tend to underperform other ethnicities
(Bakar, 2004). We conclude that the under-performance of Indian students in our
sample is specific to our sample, and cannot be generalized for all Indian students
from low-income families in Singapore.
6.2 Analysis of Survey Results Regression Model Results We ran the regression on all seven factors, and the results were not significant for all
factors except for the factor Basic Skills on English and Math results (Appendix D).
We observe that there is a positive coefficient on the factor Basic Skills, significant at
the 5% level 8 for English results and 10% for Math results. To interpret this
coefficient, if a child’s level of basic skills decrease from five to four, the probability of
the child failing his English and Math increases by 29% and 20% respectively,
8 Significant at 5% and 10% level indicates that there is a 95% and 90% probability respectively the results is true.

27
significant at the 5% level. If the level of basic skills decreases from four to three, the
probability of failing their English and Math increases by 24% and 11% respectively.
For the English results model, we observe that there is a positive and significant
correlation on the control variable, HOHEducation, which is similar to the finding in
Ng & Ho (2006) and Ho (2010), where the education background of fathers plays a
significant factor in the academic aspirations of their children.
In the model with Math results, we observe that there is a negative and significant
coefficient on the academic levels, significant at the 5% level. Interpreting the
coefficient, those in Primary Four are 36% more likely to fail their Mathematics than
those children in Primary 3, 18.2% more likely to fail in Primary 5 than Primary 4, and
about similar chances to fail in Primary 6 when compared to P4. Similarly, in the
model with the Science results, we find a negative and significant coefficient on the
Primary 5 level. Interpreting the coefficient, those in Primary Five are 37% more likely
to fail in Science than children in Primary Three, and the result is statistically
significant at the 10% level. This indicates that as students progress to higher
academic levels, they were much more likely to fail their Math and Science, which is
evident in Figure 2.
We also find a negative and significant coefficient on the variable tuition, significant
at the 10% level for Math and at the 5% level for Mother Tongue. Interpreting the
coefficient, students who receive tuition are 27% less likely to pass their Mother
Tongue, and 24% less likely to pass their Math. The result is highly interesting, and
there may be various explanations. Firstly, students who attend tuition may be weak
in certain subjects, and thus are more likely to fail, as seen in our regression results.
Secondly, tuition may occur at the expense of revision time for other subjects. Cheo
and Quah (2005) found that the presence of private tutors in some subjects led to a
decline in academic performance in other subjects that were not tutored. This may
also explain the phenomenon of the negative coefficient.
6.3 Inferences From Survey Results
An individual’s examination performance in Primary school can be broadly thought of
based on three main factors: (1) the difficulty of the examination, (2) the individual’s
academic abilities at the point of assessment which is dependent on the factors in
our framework, (3) the performance of the individual during the assessment itself,
which are based on psychological and physiological factors.

28
While our data is cross-sectional in nature, we are sufficiently convinced that we are
able to eliminate the last factor from our argument. While it is entirely plausible that
all 87 of our students were feeling unwell or panicky during their examination, hence
affecting their academic performance, the probability of such an event occurring is
extremely low. Further, looking at the initial survey data from our client, such an
event would have to occur twice, in order for such a high and systemic failing rate to
occur for both surveys.
With reference to Table 14, we can conclude that our respondents’ current academic
abilities are unable to adequately overcome the difficulties of their examinations,
which explains the substantial failing rates across all 4 subjects.
School Factors
The steep increase in failing rates from Primary Three to Five in Figure 2 reflects
that students are increasingly less able to keep up or cope with the academic rigour
and pace as they advance from lower primary to upper primary. This implies that the
grade that the child is in affects his/her ability to do well academically. Academic
level was also identified as a significant factor influencing math and science results in
our statistical analysis.
There could be several explanations for the variance in academic performance by
academic level. Knowledge in school is imparted on an incremental basis, and a
failure to grasp previous concepts sufficiently thus inhibits students from learning
new concepts adequately. As a result, they fall further and further behind as they
move from Primary Three to Primary Five. The weaker foundation of these children
results in a slower learning pace, and when they are unable to catch up sufficiently,
they face a much higher probability of failing in higher academic levels.
Hence, one of the major drivers of the increase in failing rate could be the gap
between the learning pace of our respondents and the increasing difficulty of the
curriculum. On this note, the difficulty of the academic content is tied closely to
teaching pace. Difficult content taught at a slower pace provides learners with more
time to grasp the concepts. The converse is true as well, suggesting that the current
teaching pace is at a rate faster than the learning pace of our respondents. Without

29
passing judgment on the suitability of the current teaching pace, we perceive a gap
between the learning and teaching pace of students and schools.
The difference in pace is compounded by a system of automatic promotion. While
the policy is not spelled out officially, primary school children are usually promoted
automatically into a higher level after their year end results, regardless of their failing
rates. The aim is to ensure that the children progress with their classmates and are
not “left behind”. As a result of this policy, students are promoted to learn more
difficult materials, even if they show that they have not been able to cope with the
current materials adequately.
Some schools may provide remedial lessons after examinations to aid these
students in catching up before the new school year begins. However, such a policy is
contingent on the efforts of individual teachers, or individual schools who may
mandate such a policy. To the best of our knowledge, the Ministry of Education does
not mandate a need to have supplementary classes for students post-examinations
to help them in catching up. As a result of this automatic promotion policy and a
contingent supplementary lesson policy, students who have not been able to cope
well are less equipped to cope with higher levels of academic demand when they are
promoted into advanced levels.
The use of supplementary lessons for weaker students falls under the broad
umbrella of resources targeting weaker learners. Given the high failing rate, we
believe that current levels of resources targeted at mitigating this issue may be
insufficient. Resource here refers broadly to duration of instruction, attention
dedicated to students as well as teaching quality. One possible cause of this
resource deficiency could be large class sizes and high student to teacher ratios in
schools currently. As a result, the teacher is unable to dedicate sufficient time and
attention to help weaker students. However, without further research, we are unable
to draw a more detailed conclusion on the exact type of resource missing for these
children.
Figure 2 also shows a general decline in failing rate as students progress from
Primary Five to Six. While we are unable to confirm our conjecture, it is highly likely
that students undergo more exam-oriented training in preparation for their Primary
School Leaving Examination (PSLE) at the end of the year. The PSLE has been
viewed as an extremely important examination, with claims that it has strong

30
influence on life outcomes of individuals (The Straits Times, 2012). As such, schools
and parents dedicate large amount of time in preparing the students for the PSLE,
via revision exercises, and there is a general halt in teaching new curriculum. As a
result, students become better versed with previous content and are more able to
handle the demands of the examination. Students themselves may also feel the
urgency of the impending PSLE and become more motivated to study. The
combination of these factors may explain the decline in failing rate from Primary Five
to Primary Six.
Home & Individual Factors
We find that Basic Skills was a significant factor in explaining the failing rate of our
respondents. However, given that the average Basic Skills of our respondents were
high, this indicates that the effect was driven primarily by a minority of students who
had very low levels of basic skills. Interpreting the results together, this indicates that
students with low levels of basic skills were much more likely to fail compared to
other students in our response group. As such, there is a need to help improve the
basic skills of children who have low levels of them.
The education background of the head of household also had an influence on the
academic performance of our respondents’ English results. This may be due to the
parent’s ability to assist in the language capabilities of their children, or the ability to
better communicate with them in English, resulting in improved performance.
6.4 Limitations of Findings
In our analysis, we find that the level of household income was not a significant factor
in explaining the academic performance of our respondents. A similar finding was
observed in (Ng I. Y., 2012), where there was no relationship between family
earnings and levels of self-concepts in low-income families in Singapore. However,
as Raike and Thompson (2005) argues, this may be due to the fact that our sample
was made up entirely of low income families. We would expect a significant factor if
the sample included families with diverse economic backgrounds. Hence, SES
should still be a significant home factor in explaining the poor academic performance
of our target group.
Based on our literature review, motivation appears to be the strongest factor in
recent literature explaining the academic performance of children. However, we were

31
unable to find a positive and significant relationship in our analysis. This may be due
to the fact that the measurement error in our seven factors may be high, given the
presence of negative correlations of the factors with the results. We attribute this to
the inability of our respondents to sufficiently understand our questions, given their
age. Further, given that they were subjective measures, our respondents’ emotions
may have had an impact on their response during the survey. As such, despite the
insignificant finding, we do believe that motivation factors play a significant role in
explaining the academic performance of our target respondents.
6.5 Anecdotal Findings
In the course of our survey, we also identified some factors that affect the financial
status of our respondent families, which in turn affect their ability to contribute
towards their children’s education.
Financial Assistance Application
While 83% of our respondents were on the MOE Financial assistance scheme, only
28.4% of them were on any other financial assistance schemes. When quizzed on
why they did not try applying for other assistance schemes, the parents indicate that
the process of application was often onerous and complex; they had to submit
documents to each specific organization for application, with different requirements
for each assistance scheme. Some indicate that the effort invested did not warrant
the amount of financial assistance. One participant quipped:
“The (Straits Times Pocket Money) Fund only gives $70 a month, but must fill in so
many forms. And for two years only” (Survey Respondent)
Rental Period of Flats
While our survey covered five different locations, three of the locations were
extremely close to each other, and the children mostly attended the same primary
schools. However, our sample size of 87 children attended 23 different schools, with
some schools in locations that were at least one hour away by public transportation
When quizzed on why the children were attending schools in distant location, the
parents highlighted that their previous rental flats were in those locations, and hence
they had registered their children in schools near the location. When their rental
period was up, they were moved to the new location, resulting in the increase in
travelling time for their child.

32
The increase in travelling time occurs at the expense of other activities such as
studying and revision. Further, the travelling time may result in increased fatigue,
which may affect the productivity of the children as well.
Income Cap For Rental
One of our respondent indicated to us that his flat lease was up for renewal soon.
However, his wife had recently found a new job and the household monthly income
was now slightly above the income requirement9, at approximately $1800 a month.
When he submitted his application for renewal, he was rejected by the Housing
Development Board for breaching the income cap. He was informed that he had to
submit pay-slips that reflect a combined monthly income of less than $1500 in order
to be eligible for renewal. As a result, he was forced to work fewer hours, in order to
have a combined income pay slip that meets the requirements.
An income slightly above the requirement levels does not improve the lives of these
families drastically. However, with the policy enforcement, they are obliged to
purchase housing if they breach the income requirement marginally. A housing
purchase would add significant financial burdens to these families, given their low
income. Some families go around the issue by working odd jobs, such that their
monthly household income is supplemented. During the period of renewal, they cut
back on the number of jobs, such that they can meet the income requirements. Such
a strict enforcement of the income requirements thus forces low-income families to
be stuck with an income of below $1500.
Studying Environment
The rental flats in our survey sample were generally one-room flats with a living room
and kitchen. The average size of these flats is about 45 square meters (Housing
Development Board, 2014), and there is generally space constraint in these flats. As
a result, the children do not have a dedicated studying space, due to the space
limitation, and often have to utilize any existing space to study. Furthermore, as
Table 7 shows, the average number of people in the household in our sample was
5.26, which is relatively high compared to the physical size of the house. While we
were going around to conduct our surveys, we find that the children often had to
study on the floor, or were frequently disrupted by their family members who were
9 Citizens who wish to rent a flat from the Housing Development Board must have a monthly household income of less than $1500 (HDB, 2014).

33
watching television. As such, we conclude that the overall studying environment was
not conducive for these children.
6.6 Conclusions
Based on our survey data, we conclude that our respondents are unable to cope with
the increasing demands of the examinations at higher academic levels. This could be
due to their abilities at the point of assessment, which is inadequate to handle the
assessment criteria. We believe that the pace of teaching, curriculum difficulty,
automatic promotion and a lack of resource are the major school factors that
contribute to this high failing rate. In addition, a lack of basic skills for some children
can cause them to have a much higher failing rate in English and Math. The level of
education of the head of household also plays a significant factor in the English
results of our children. The presence of tuition programs also appears to exert a
negative effect on the Math and Mother tongue results of our respondents.
While we did not find a significant relationship for motivation and income on
academic performance, we believe that this is due to the limitations of our survey. As
such, we believe that these are also significant factors in influencing the academic
performance of our respondents.
34
7. RECOMMENDATIONS
Based on our findings and inferences, we devised a set of preliminary
recommendations that aims to improve the situation. Our recommendations tackle
the issue from two angles: (1) community-based actions that can improve the
current situation, and (2) policy changes that target structural issues in the primary
school education system. In the short term, our goals are to improve school
examination results for our target group of students. In the middle to long term, we
hope that these students can remain in the education system for a longer period of
time, which will lead them to better employment opportunities and enhance social
mobility eventually.
With these recommendations in mind, we conducted a stakeholder analysis of
parties who may be suitable to assist in implementing the recommendations.
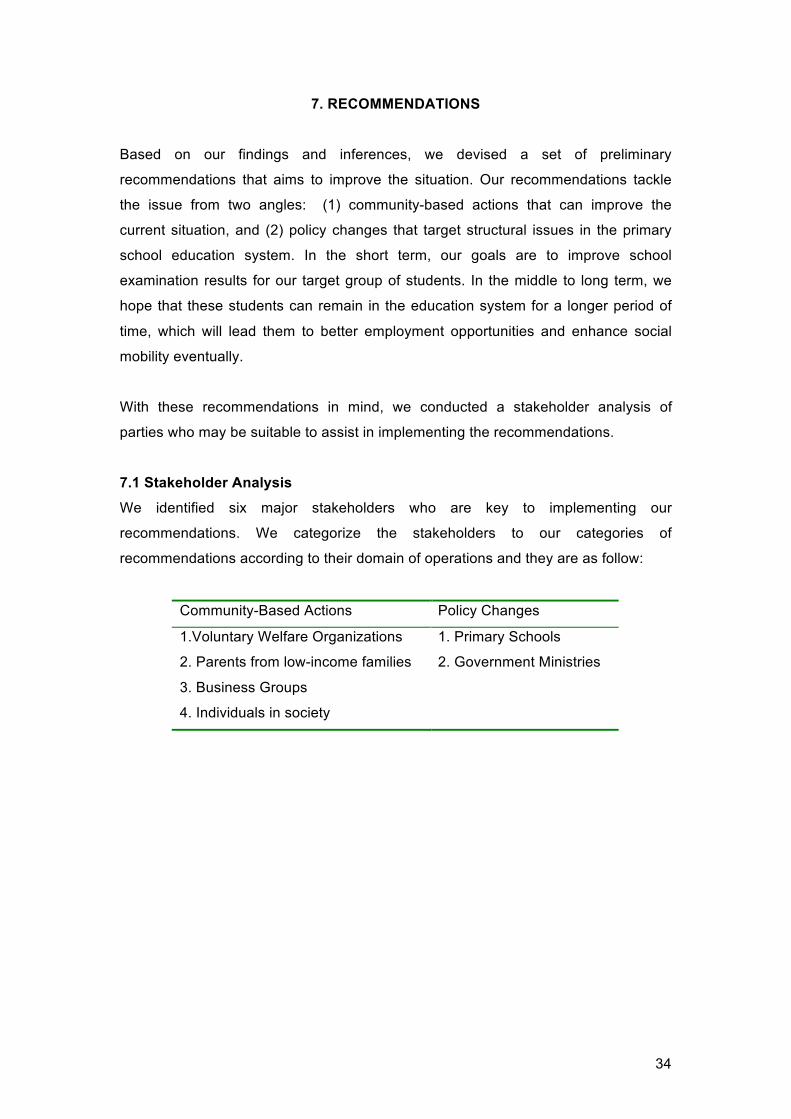
7.1 Stakeholder Analysis
We identified six major stakeholders who are key to implementing our
recommendations. We categorize the stakeholders to our categories of
recommendations according to their domain of operations and they are as follow:
Community-Based Actions Policy Changes
1.Voluntary Welfare Organizations
2. Parents from low-income families
3. Business Groups
4. Individuals in society
1. Primary Schools
2. Government Ministries

35
7.1.1 Stakeholders in Community-Based Actions
Figure 4: Analysis of Community Stakeholders
We further categorized VWOs into two sub-categories, namely identity-based VWOs
(such as racial, ethnic, or socio-economic status-based groups), and location-based
VWOs (such as neighborhood organizations and family service centers).
We rated each stakeholder according to three different criteria, on a scale of one to
three. The performance on each criterion for each stakeholder is relative to the other
stakeholders.
Resource Capabilities
In examining the resource potential of our stakeholders, we believe that Business
groups have the most financial and time resource, followed by VWOs, individuals
and parents of the children.
In the 2013 Commissioner of Charities Annual Report, corporate donations in 2012
amount to $701.5 million dollars, compared to donations from individuals at $329.7
million. The combined donations stand at $1103.2 million dollars, of which

36
$435.8million, or 39.5%, was dedicated to social and welfare sectors. The social and
welfare sectors also receive approximately $435.8 million in government grants, and
$816.9 million in income from programmes and services rendered (Commissioner of
Charities, 2014). While the combined receipts of organizations in the social and
welfare sector is larger than the size of corporate and individual donations, VWOs in
social and welfare sectors have many areas of responsibilities and the portion of
receipts dedicated to education10 may only be a fraction of the total sum. Hence, we
believe that business groups still have the highest financial potential, while VWOs
follow closely behind. Individuals, on average, have the second lowest potential,
while parents from the low-income families have the least financial potential.
The National Volunteer and Philanthropy Centre found that one in four volunteers
volunteered through their employers. Further, two out of three employees expressed
a desire to participate in volunteer activities organized by employers, if their
employers were to organize volunteering activities in the next twelve months
(National Volunteer and Philantrophy Centre, 2014). This indicates the large potential
for corporate volunteering and supports our analysis of business groups having the
most resource potential.
Program Sustainability
VWOs are set up with the explicit aim of supporting and developing the community,
and we believe that they are much more likely to maintain the programmes
proposed, especially if the programs prove to be effective in improving the situation.
Location-based communities may be slightly less sustainable than identity-based
communities, as individuals who shift to other locations may no longer have access
to these programs. Indisputably, parents are also likely to be heavily invested in their
child, and hence would be keen to ensure that interventions are carried out
continuously, in order to constantly improve their child’s welfare.
On the other hand, recommendations targeted at individuals and businesses are
much less sustainable, as their interest in supporting the programs is more on an ad-
hoc basis. From the 2012 Individual Giving Survey, 74% of volunteers prefer to
10 There are also education charities in Singapore, and the total donations to education charities amount to $356.5 million in 2012. They also receive $4.65 billion in government grants and $2.46 billion in income from programmes and services rendered. However, majority of education charities are school-based charities. As such, we do not include them as part of VWOs financial capabilities.

37
volunteer on an occasional basis, compared to 11% and 16% who volunteer on a
monthly and weekly basis (National Volunteer and Philantrophy Centre, 2013).
As such, we believe that recommendations for long-term programs will be more
suitable for VWOs and parents, while businesses and individuals may be more suited
for ad-hoc and short-term programs.
Collaboration Feasibility
We evaluate the willingness of our stakeholders in collaborating with our client on our
recommendations in this aspect, and concluded that VWOs and parents are highly
likely to be willing to collaborate. Our conclusion is based on analysis of our client’s
operations, which reflects that they are engaged in constant collaboration and
communication with parents and other VWOs in improving the community. As such,
we believe that the collaboration feasibility is the highest for these three stakeholders
For individuals, our client actively works with volunteers on various programs within
the community. While it may be easy to allocate individuals to assist in the
collaboration, it might be more difficult to identify individuals within civil society to
spearhead the recommendations and take on a leading role. As such, we envisage
that individuals will play more of an assistance role, rather than as a collaborator and
partner. Rather than focusing on individuals, it may be possible that interest groups
within civil society are actively engaging in some of our proposed recommendations.
Focusing on collaboration opportunities with such interest groups may be more
effective. However, the challenge for our client will be in identifying the presence of
such groups and contacting them.
For business groups, it might be difficult to collaborate with them beyond traditional
programs such as cash donations and employee volunteerism. In a survey of
corporate giving in Singapore, 83.6% of companies in Singapore prefer to provide
cash donations, and 65.6% prefer to provide employee volunteerism. Other forms of
giving, such as provision of company services free, were low at below 25% of
companies surveyed (National Volunteer & Philantrophy Centre, 2013). As such,
collaboration feasibility with business groups in other types of recommendations may
be limited.

38
7.1.2 Stakeholders in Policy Changes
The major stakeholders that we intend to target for our policy recommendations can
be grouped into two categories: primary schools and government ministries. We
evaluate these two stakeholders primarily on their willingness to implement our policy
recommendations.
Primary Schools
A significant difficulty in working with primary schools is the large amount of schools
present. This gives rise to a difference in policy receptiveness across different
schools. As such, it may be more feasible to examine only schools that have a high
proportion of students from low SES families.
Such schools will be likely to adopt policies that can help improve the high failing rate
of students from low SES background, given their large proportion in these schools.
However, one key concern might be the resource constraint that these schools face.
As a result, the schools may not as readily accept resource intensive programs or
recommendations.
Furthermore, these schools are unlikely to be ‘autonomous’, which is a status
typically granted only to the top-performing government schools (National Center on
Education and the Economy, 2014). Hence, they have a limited degree of autonomy
in determining their curriculum and teaching materials. These may lead to difficulties
in implementing curriculum or teaching-pace related recommendations in the
classroom.
Government Ministries
Government Ministries are more likely to accept policy recommendations that uphold
the ethos and guiding principles of the Singapore society, such as meritocracy,
fairness and equity. Hence, our policy recommendations should be mindful of not
eroding or undermining such principles. Nonetheless, some of the issues that we
raise here are issues that not only affect the low-income community but the society
as a whole. Hence, interests of different groups may often come into conflict with one
another and change, if any, is unlikely to be drastic, nor prompt. As such, we
envisage that policy recommendations for government ministries may take a longer
time period to take into effect.

39
7.2 Evaluation Criteria of Recommendations
We evaluated the feasibility of our recommendations for the six stakeholders based
on four criteria: (1) Intensity, (2) Frequency, (3) Capabilities and (4) Timeframe for
implementation.
Intensity refers to both resources required for implementation as well as the level of
immediate impact achieved. It encompasses elements of cost effectiveness, as well
as the duration of the intervention in achieving the effectiveness.
Frequency refers to the regularity of the recommendations and how often they should
be carried out.
Capabilities refer to the level of specialized skills required to implement the
recommendations. Some recommendations may be administrative in nature and
stakeholders may possess in-house capabilities to implement them, while other
recommendations may require collaboration with specialists who possess the
necessary capabilities.
Lastly, timeframe refers to the amount of time before the recommendations can be
implemented successfully. Some recommendations are on an ad-hoc basis and can
be completed quickly in the short term, while structural issues and resource intense
recommendations may require a longer duration to implement.
7.3 Focus Group Discussion
We organized a focus group session to share our preliminary ideas with a group of
ten participants. The purpose of the focus group session was to gather feedback on
our ideas so that we can better evaluate them using the above criteria, as well as
crowd source other possible effective recommendations. A summary of our
preliminary recommendations and focus group questions can be found in Annex E.
The focus group was split into two sessions – the first session was conducted with
representatives from five VWOs that had existing programs in supporting our target
group11, while the second session was conducted with three12 parents with school
11 We had invited two other VWOS: Children’s Society and Singapore Indian Development Association (SINDA) for Session One but they were unable to attend. Their comments on our recommendations were sought through electronic mail and incorporated as well. 12 Two other parents that were invited were unable to attend the session at the last minute.

40
age children from low-income households (Table 16 and 17). The VWOs were invited
based on their rich experience in working with the community and our target group,
and we believe that their experience would help us fine-tune our recommendations.
Similarly, having the perspective of parents was important in ensuring that our
recommendations would be well received by them.
Table 16: Participants in Focus Group Session One Focus Group Organization
No. Of Participants
Description of Organization
Yayasan Mendaki (Mendaki)
1 A self-help group founded in 1982 and dedicated to the empowerment of the disadvantaged in the Malay community (Yayasan Mendaki, 2014)
Chinese Development Assistance Council (CDAC)
1 A self-help group founded in 1992 and dedicated to developing the Chinese community (CDAC, 2014)
South Central Community Family Service Centre
1 Social service provider for families in need, which aims to promote and improve the social well-being of every individual in the family (Ministry of Social and Family Development, 2014)
Early Reader Program 2 An in home reading program for children from aged 3-10 from disadvantaged backgrounds (EARLY READER, 2014)
Beyond Social Service 2 Refer to Page 1
Table 17: Participants in Focus Group Session Two Participant A A mother of two children, with the
youngest currently studying in Primary School
Participant B A single mother of three children Participant C A single mother of five children
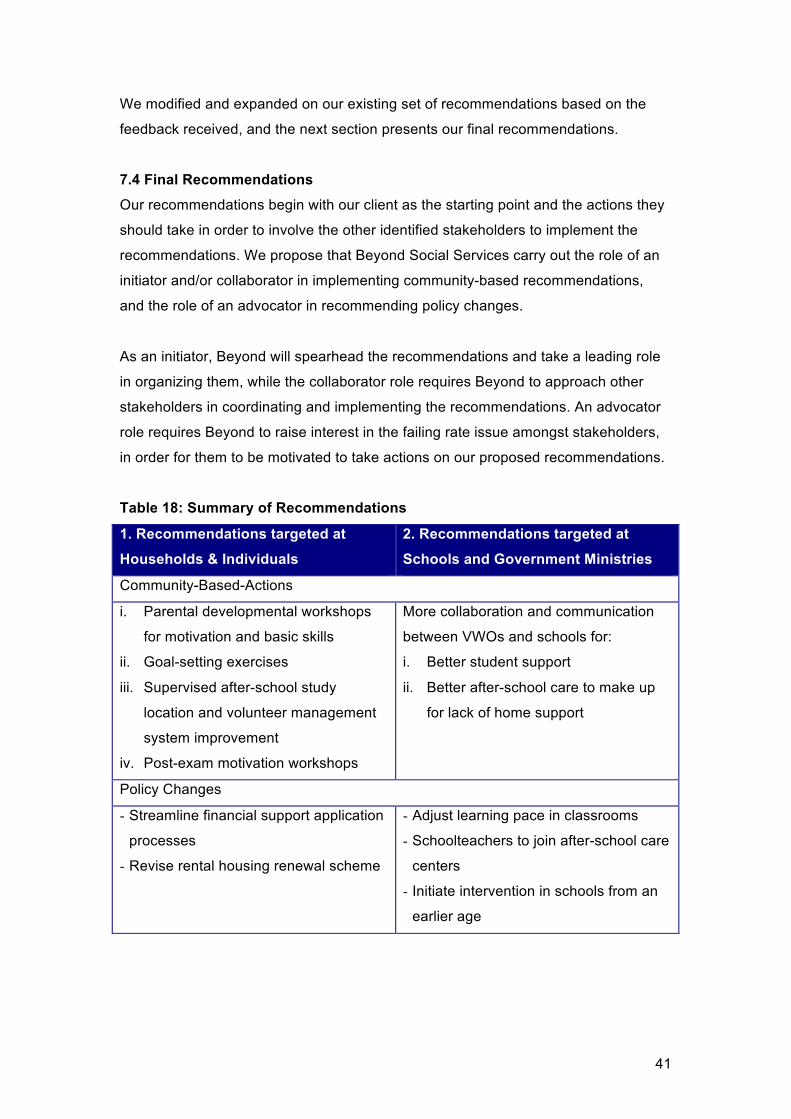
41
We modified and expanded on our existing set of recommendations based on the
feedback received, and the next section presents our final recommendations.
7.4 Final Recommendations
Our recommendations begin with our client as the starting point and the actions they
should take in order to involve the other identified stakeholders to implement the
recommendations. We propose that Beyond Social Services carry out the role of an
initiator and/or collaborator in implementing community-based recommendations,
and the role of an advocator in recommending policy changes.
As an initiator, Beyond will spearhead the recommendations and take a leading role
in organizing them, while the collaborator role requires Beyond to approach other
stakeholders in coordinating and implementing the recommendations. An advocator
role requires Beyond to raise interest in the failing rate issue amongst stakeholders,
in order for them to be motivated to take actions on our proposed recommendations.
Table 18: Summary of Recommendations
1. Recommendations targeted at
Households & Individuals
2. Recommendations targeted at
Schools and Government Ministries
Community-Based-Actions
i. Parental developmental workshops
for motivation and basic skills
ii. Goal-setting exercises
iii. Supervised after-school study
location and volunteer management
system improvement
iv. Post-exam motivation workshops
More collaboration and communication
between VWOs and schools for:
i. Better student support
ii. Better after-school care to make up
for lack of home support
Policy Changes
- Streamline financial support application
processes
- Revise rental housing renewal scheme
- Adjust learning pace in classrooms
- Schoolteachers to join after-school care
centers
- Initiate intervention in schools from an
earlier age

42
7.4.1 Household and Individual-targeted Recommendations
7.4.1.1 Community-Based Actions
i. Parental Development Workshops
First, VWOs can organize parental developmental workshops at regular intervals,
with the aim of educating parents on improving the motivation and basic skills of their
children in the short term. These workshops should be helmed by professionals who
have experience in working with families from low-income backgrounds, which
require collaboration with individuals or businesses possessing such expertise.
These workshops will not only allow parents to learn from experts but also to
exchange valuable tips and experiences with other parents. The parents who
participated in the focus group discussion said that they would definitely participate
actively in such workshops, and anticipated warm response from other parents as
well.
In terms of motivation, students’ mindsets about their academic ability influence their
level of academic performance. Research found that children who were praised for
their intelligence were more likely to have a ‘fixed mindset’, where they view
intelligence as a fixed quality that they either have or do not have, while children who
were praised for their effort were more likely to have a ‘growth mindset’, where they
view intelligence as a malleable quality that can be improved through investing
greater effort (Mueller & Dweck, 1998). Compared to students with a ‘fixed mindset’,
students with a ‘growth mindset’ were more likely to continue feeling motivated to
learn in the face of failures and setbacks, and retained their confidence as problems
got harder. In relation to this, experts can be brought in during workshops and events
to teach parents how to motivate their children based on effort instead of outcome
(e.g. through using different types of praises, goal setting, etc.), and the importance
of doing so.
In terms of basic skills, parents have a vital role to play in making sure children
develop proficient basic skills from a young age. Educators have found that doing
basic daily activities can help children apply the lessons they have learnt to their
everyday life, and that this learning ability helps them to perform better in school
(Paton, 2014). These activities could include helping to weigh and measure the
ingredients required for cooking, or folding the laundry, or counting loose change,
etc. Parents and children could attend such workshops together, where they will
have opportunities to experience doing daily activities hands-on and learn together.

43
In the longer term, these workshops can be extended to expectant and new mothers
to prepare and equip them for an active role in their children’s early childhood
development. This will help to ensure that children are put on the right track of
development as early as possible.
A challenge highlighted by the focus group participants was the time constraint that
parents face. As such, we propose that such workshops be held during community
events organized by VWOs, where children and parents commonly attend together.
This alleviates the need for both parents and children to make additional time out for
the workshops. Further, the information presented at such community events can be
brief and more easily absorbed by the participants. The short duration of these
workshops also reduces the resource demand from individuals and companies who
are providing them, which increases the possibility of obtaining such workshops as a
voluntary service.
In summary, these workshops are likely to be moderate in intensity and frequency,
require some input from professionals, and can be implemented in both the short run
and the long run.
ii. Goal Setting Exercises for children
Second, goal-setting exercises can help children from low SES families develop
greater academic tenacity and motivation. These exercises should focus on setting
learning-related goals more than performance-related goals, as learning goals were
found to be positively related to a ‘growth mindset’, encouraging children to seek out
new challenges and invest greater effort on difficult tasks (Dweck, Walton, & Cohen,
2014). For example, a performance-related goal would be ‘to score 90 points in a
math examination’, while a learning-related goal would be ‘to understand algebra so
that I can explain it to my classmate’. Performance goals tend to cultivate an active
avoidance of failure, while learning goals helped students to view failures as learning
points and constantly improve on themselves.
Furthermore, research also suggests that students tend to be more motivated and
successful when goals are cooperative rather than competitive or individualistic
(Dweck, Walton, & Cohen, 2014). In relation to this, intervention could be done
through communal goal-setting exercises, pairing or grouping children to set
common goals and engage in learning tasks together. Working towards common
44
goals in a team can instill a greater sense of responsibility in children and motivate
them to work harder as they do not want to let down their teammate(s).
It is particularly important for children from low SES households to have a long-term
view of what they would like to achieve in life. However, these long-term goals need
to be realistic and attainable, otherwise they may end up being discouraging instead.
For example, completing tertiary education is a goal that is both realistic and
attainable. Having appropriate long-term goals, or a larger sense of purpose, would
help these children to translate the academic tenacity that they have developed in
school into confidence that they have control over their circumstances, and to view
education as a tool of empowerment that can help them carve a better future for
themselves and their families.
The main implementation challenge highlighted here by our focus group participants
is the follow-through and review process after the initial goal-setting stage. One way
of overcoming this is to break a big, overarching goal down into smaller ones so that
goals appear easier to achieve. For example, in order to complete tertiary education,
low-income students may need to apply for scholarships or bursaries, which often
come with academic or extra-curricular achievement criterion. Children can begin by
setting small goals in these areas and use them as stepping-stones towards their
eventual goal. In addition, small goals for tasks at home can also help in building the
confidence of the children. We are all encouraged by small successes and this helps
children to retain their motivation in the longer term.
A timeframe of reference should be attached to the smaller goals (e.g. three months
interval) so that children can revisit their goals and mark their progress regularly.
Written commitments towards their goals by the children should be displayed
prominently in spots of high activity within community organizations e.g. near
entrances, or along the corridor to activity rooms. This will not only help to remind
children of their commitments but also make their goals known to other members of
the community so that they can help to monitor and motivate the children. Where
children were grouped together for communal goal-setting exercises, partners can
also help to track each other’s progress towards their common goal.
In summary, goal-setting exercises are likely to be moderate in intensity and
frequency, can be carried out with existing in-house capabilities, and can be
implemented in both the short run and the long run.

45
iii. After school study and volunteer management
Third, VWOs can help to create conducive locations where low-income children can
go to for supervised after school study, much like the after-school student care
centers (SSC) that some schools currently have. This can help students form a
support network and increase their sense of social belonging to the community. It is
also a good platform to conduct volunteer-run tuition and support programs.
However, there is a need to improve the current system of volunteer management in
many VWOs. There are a few aspects involved:
1. Volunteers should go through selection and training processes in order to
improve the quality of tuition programs, and ensure that time spent by
children at these tuition classes are useful and does not jeopardize overall
academic performance instead. These programs could also look into
developing a structured curriculum to follow rather than just providing
homework support.
2. Volunteers need to adopt the right approach and mindset when working with
children from low-income families too. In other words, they need to focus on
effort over outcome, and learning over performance. This change in mindset
may be particularly difficult for volunteers who do not come from similar
backgrounds and cultures as the children.
3. Current turnover rates of tutors in such programs tend to be high and this can
be disruptive to learning. Organizers may consider the use of only permanent
tutors who are able to promise middle to long-term commitment. Research
has found that in teacher-child relations, relationship-based rather than
transaction-based interactions tend to be more effective in encouraging
academic performance (Birch & Ladd, 1997). Tutors effectively play a similar
role as teachers outside of schools and strong relationships between them
and students also require time, effort, and constant interaction to build.
In summary, this recommendation is likely to be rather high in intensity and
frequency, require some input from professionals, and require a medium to long-term
commitment.
iv. Post-examination motivation workshops
Lastly, it may be useful to have post-examination motivational activities, which are
targeted at mitigating the sharp decline in the motivation of students when they
receive poor results after their examinations (Yeh, 2010). This helps to ensure that

46
when students face failure, they receive immediate guidance to keep them
motivated.
VWOs in our focus group highlighted it took a significant amount of time to gain
access to the examination results of the children, which can take up to six months.
However, gaining timely access to examination results is crucial to the
implementation of this recommendation. An alternative for VWOs is to reach out to
parents, instead of teachers and schools, to get a faster response. While such a
method may not reach out to all students who are affected, it ensures a timely
intervention for students who require such motivational support.
In summary, post-exam motivation workshops are likely to be moderate in intensity
and frequency, require the collaboration of external stakeholders, and are more of a
short-term measure.
7.4.1.2 Policy Changes
Currently, there is a plethora of support schemes available for low SES households
run by different organizations with varying qualifying criteria (see Appendix A). This
creates barriers to access – first, low SES households may not be fully aware of all
the programs and schemes that are available / that they are eligible for. Second, the
complexity of application processes (for example, many supporting documents may
be needed for approval) may hinder many families from applying.
Hence, there is a need to streamline the support scheme application process for low
SES households. This could be done through a centralized online portal that
aggregates schemes across categories from both public and private sectors (not
limited to education, but also transport, food, enrichment, etc.) Applicants should only
need to fill in their profile and upload relevant documents once, and the system will
automatically match their details to the eligibility criteria for various schemes. Further,
applications should be made by default and not on an opt-in basis in order to ensure
that these families are receiving the maximum support that they can get.
Implementation concerns lie with the level of technological literacy and access to
technological devices of low SES households. Some of these households may not
have regular access to a computer or the Internet, or have little knowledge of how to
navigate such online portals. Hence, after the initial phase of launch, it may be

47
necessary to deploy manpower to go door-to-door to provide assistance to those
families who have not yet registered on the portal for one reason or another.
Another concern of many low-income households in Singapore is that of housing.
Most of these families currently stay in rental public housing, which are renewed
once every two years.
The government may wish to revise its guidelines for the renewal process, especially
for households with primary-school attending children. A geospatial dimension could
be incorporated into the renewal process to ensure that children who are going to
primary school in that area receive priority to continue staying in that neighborhood.
This will help to minimize disruption to their daily routines and cut down on the time
and money spent on transportation to and from school. Further, the renewal criteria
for rental housing could be on a range of income, rather than a strict cut-off point.
Where families breach the income criteria, the renewal term can be adjusted based
on the level of income in excess of the criteria. For example, a family that breaches
the income criteria by 10% may see their renewal period extend to only 95% of the
two-year lease. This encourages truer reporting of employment and income status,
helps to assuage fears of not having a place to stay, and ensures that households
are fully financially ready before they move out of rental housing. Such a renewal
policy does not undermine the government’s home-ownership philosophy, but rather
promotes it, as low-income households are not incentivized to remain below the
$1500 cut off criteria.
In summary, the recommendations for policy changes are likely to be moderate in
intensity, require the government as the key implementer of change, and are long-
term in nature.
7.4.2 School and Government-Targeted Recommendations
7.4.2.1 Community-Based Actions
Home support is a key influencer of academic performance (Chohan & Khan, 2010).
However, not all children have the privilege of having supportive parents and a
nurturing home environment. This is especially true for low SES households, who
may often face greater adversity and challenges (e.g. financial woes). Consequently,
this jeopardizes their ability to focus on their children’s education and give them the
care and attention that they need in their development. Where home support is
48
lacking, it is difficult to reach out to parents and effect change through them. Hence,
the role of schools, where children spent the most time other than at home, becomes
ever more important.
As teachers have many students to look after, they may not be as aware or as
sensitive to each student’s background and needs. This is where VWOs can come in
to help inform the school of students with low levels of home support. Teachers and
counselors can then afford greater attention to these students in the school setting,
whether through a structured group program or on a one-to-one basis. Studies have
found that students from low-income groups who have a strong and supportive
relationship with an adult, most often a teacher, tend to have better academic
achievement and socio-emotional adjustment than their peers who did not have such
a figure (Murray & Malmgren, 2005). Furthermore, it was found that students from
low-income groups benefited even more from positive teacher-student relationships
than those from regular and high-income groups.
VWOs could also work more closely with schools to explore better after-school
arrangements. Some schools currently have their own after-school student care
centers (SSC), where students can go to do their homework or clarify concepts with
tutors. For example, in the Blangah Rise Primary School SSC, majority of the
attendees are students from low-income families. Better communication and
collaboration between VWOs and SSCs can help to build a nurturing environment in
SSCs, which can help to remedy the lack of home support.
It is important for VWOs in the community to communicate actively with schools in
order to better inform them of the child’s needs, and bridge the gap between school
and home settings as much as possible.
In summary, the recommendations are likely to be high in intensity and frequencies,
due to the need for frequent communication between stakeholders, requires
collaboration with multiple stakeholders, and are medium to long term in nature.
7.4.2.2 Policy Changes
As inferred from Chapter Six, there may be a gap between the learning pace of our
target students and the teaching pace in schools currently. Low SES students are
further disadvantaged as they have fewer resources (such as tuition) to catch up on
concepts outside of regular curricula time. Hence, it may be necessary for the

49
Ministry of Education to review the speed of teaching in classrooms, and look for
ways to better accommodate students who are having difficulty keeping up. As the
government asserted, tuition is not, and should not, be necessary to supplement the
mainstream education system and help students do well in exams.
Adjustments in the pedagogy, curriculum, and examination methods may be
necessary. For example, one possible way is to have more depth over breadth in
learning, giving students more time to delve deeper into one concept, understand it
and apply it before moving on. Another possibility is to reduce class sizes in schools
with higher proportion of students from low SES backgrounds, allowing room for
greater individual attention and customization. This will also help teachers to build
better and strong relationships with the students. These policy recommendations
require that more resources be dedicated to schools with higher proportion of low
SES students.
One of our focus group participants also suggested that it would be a good idea to
have schoolteachers join after-school care sessions as they have better knowledge
regarding student aptitudes and learning styles. Schools may wish to lighten the load
of these schoolteachers in other aspects in order to give them more time and energy
to tutor students during after-school sessions. This ties in with our earlier discussion
on the importance of building strong teacher-student relationships.
It is also important for schools to initiate intervention at an earlier age instead of
targeting efforts for academic improvement primarily towards upper primary students.
This will help mitigate the increase in steep increase in failing rate as students
progress. Further, intervention at upper primary levels tends to be examination-
focused in view of the upcoming Primary School Leaving Examination (PSLE) and
our previous discussions have already alluded that performance-focused intervention
measures are less effective than learning-focused measures. In this sense, late
intervention can foster a vicious cycle. More resources should be directed at lower
primary students to begin building their academic tenacity earlier with not only
examination outcomes in mind.
In summary, the recommendations in this section are highly intensive and frequent,
and require the government as a key agent in implementing the change, and are
long-term in nature.

50
8. CONCLUSION
Our PAE conducted an exploratory analysis of the factors relevant to the academic
performance of primary school children from low-income families in Singapore. We
found that the failing rate was high amongst this group of children, and that there was
a significant gap between the academic abilities of these children and the
assessment criteria in schools. In particular, the level of motivation, basic skills and
financial status of these children play the biggest role in explaining their poor
academic performance. Further, school-based factors, such as teaching pace and
curriculum difficulty may play a part as well. Based on these factors, we
recommended both community based actions and policy changes that will help to
mitigate the issue in the long and short term.
While we believe that home-based factors play a significant role in explaining the
academic performance of our target group, structural issues within the Singapore
education system impede the progression and performance to a large extent as well.
As such, future research in this area could examine school-based factors, in order to
confirm the specific factors that have the most signfiicant impact on the academic
performance of children from low-income groups. We implore the government and
society to focus more efforts on this issue, in order to ensure adequate social mobility
within the Singapore society.

51
9. BIBLIOGRAPHY
Abedi, J. (2003). Impact of Student Language Background on Content-Based Performance: Analyses of Extant Data. National Center for Research on Evaluation, Standards, and Student Testing. Los Angeles: California University. Abedi, J., & Lord, C. (2001). The Language Factor in Mathematics Tests. Applied Measurement in Education , 14 (3), 219-234. Bakar, M. A. (2004). Learning to read and write: A preliminary report on the cultural practices of literacy of Malay families. Singapore: Centre for Research in Pedagogy and Practice. Barr, M., & Skrbis, Z. (2008). Building the "New" Singaporean and New Elite. In Constructing Singapore Elitism, Ethnicity and the Nation-Building Project. Copenhagen: NIAS. Becker, B. E., & Luthar, S. S. (2010). Social–Emotional Factors Affecting Achievement Outcomes Among Disadvantaged Students: Closing the Achievement Gap. Educational Psychologist , 37 (4), 197-214. Birch, S. H., & Ladd, G. W. (1997). The Teacher-Child Relationship and Children's Early School Adjustment. Journal of School Psychology , 35 (1), 61-79. Blackwell, L. S., Trzesniewski, K. H., & Dweck, C. S. (2007). Implicit Theories of Intelligence Predict Achievement Across An Adolescent Transition: A longitudinal study and an intervention. Child Development (1), 246-263. Bray, M., & Lykins, C. (2012). Shadow Education Private Supplementary Tutoring and Its Implications for Policy Makers in Asia. Philippines: Asian Development Bank. CDAC. (2014). Mission. From CDAC: http://www.cdac.org.sg/about-us/mission Cheo, R., & Quah, E. (2005). Mothers, Maids and Tutors: An Empirical Evaluation of Their Effect on Children’s Academic Grades in Singapore. Education Economics , 13 (3), 269-285. Chinyoka, K., & Naidu, N. (2014). Influence of Home Based Factors on the Academic Performance of Girl Learners From Poverty Stricken Families: A Case of Zimbabwe. Mediterranean Journal of Social Sciences , 5 (6), 223-232. Chohan, B. I., & Khan, R. M. (2010). Impact of Parental Support on the Academic Performance and Self Concept of the Student. Journal of Research and Reflections in Education , 4 (1), 14-26. Chomitzhomitz, V. R., McGowanc, R. J., Mitchellitchell, S., Dawsonawson, G., & Hackeracker, K. (2009). Is There a Relationship Between Physical Fitness and Academic Achievement? Positive Results From Public School Children in the Northeastern United States. Journal of School Health , 79, 30-37. Civil Service College. (2004.). Principles of Governance . Retrieved 1 Nov, 2014 from National Education: http://www.ne.edu.sg/principles_of_governance.htm

52
Cohen, H.-Y. (Aug, 2014). Are You Born Intelligent or Does It Develop Socially? Retrieved Nov, 2014 from about intelligence: http://www.aboutintelligence.co.uk/are-born-intelligent-does-develop-socially.html Commissioner of Charities. (2014). Comissioner of Charities Annual Report: For The Year Ended December 2013. Singapore: Ministry of Culture, Community and Youth. Coughlin, S. S. (1990). Recall bias in epidemiologic studies. Journal of Clinical Epidemiology , 43 (1), 87-91. Duckworth, A., & Seligman, M. E. (2005). Self-Discipline Outdoes IQ in Predicting Academic Performance of Adolescents. Psychological Science , 16 (12), 939-944. Dweck, C. S., Walton, G. M., & Cohen, G. L. (2014). Academic Tenacity: Mindsets and Skills that Promote Long-term Learning. Seattle: Bill & Melinda Gates Foundation. EARLY READER. (2014). About- EARLY READER. From EARLY READER: http://www.earlyreader.org/about-us/ Gee, C. (Sep, 2012). The Educational "Arms Race": All For One, Loss For All. IPS Working Paper No. 20 . Goh, C., & Gopinathan, S. (2008). The Development of Education in Singapore since 1965. In Towards A Better Future Education and Training For Economic Development in Singapore Since 1965 (pp. 12-38). Washington, D.C.: World Bank. Gresham, F. M., & Elliott, S. N. (1990). Social Skills Rating System. Minesota: American Guidance Service. Heng, M. M. (2008). Reliability and Validity of the PedsQL 4.0 Generic Core Scales in Healthy School-going Children in Singapore II. Singapore: National University of Singapore. Hermans, H. J. (1983). Prestatie-Motivatie-Test voor kinderen (PMT-k 83) (Achievement Motivation test for children0. Lisse: Swets & Zeitlinger. Hill, N. E., Castellino, D. R., Lansford, J. E., Nowlin, P., Dodge, K. A., Bates, J. E., et al. (2004). Parent Academic Involvement as Related to School Behavior, Achievement, and Aspirations: Demographic Variations Across Adolescence. Child Development , 75 (5), 1491-1509. Ho, K. (2010). Social mobility in Singapore. In T. Cheong, Management of success: Singapore revisited (pp. 217-239). Singapore: Institute of Southeast Asian Studies. Housing Development Board. (2014). HDB InfoWeb: 2 Room Flat. Retrieved 2014 20-Nov from Housing Development Board Singapore: http://www.hdb.gov.sg/fi10/fi10321p.nsf/w/BuyingNewFlat2room?OpenDocument Housing Development Board. (2014). HDB InfoWeb: Eligibility Conditions For Renting A Flat. Retrieved 2014 20-Nov from Housing Development Board

53
Singapore:http://www.hdb.gov.sg/fi10/fi10323p.nsf/w/RentDirectHDBEligibility?OpenDocument#Income%20Ceiling Jensen, A. (1998). The G Factor: The Science of Mental Ability. Greenwood, Westport: Praeger. Last, J. M. (2000). A Dictionary of Epidemiology. Oxford University Press. Lee, H. L., (21 Aug 2013) “Prime Minister Lee Hsien Loong's National Day Rally 2013 (Speech in English),” Prime Minister's Office Singapore, http://www.pmo.gov.sg/content/pmosite/mediacentre/speechesninterviews/primeminister/2013/August/prime-minister- lee-hsien-loong-s-national-day-rally-2013--speech.html#.VFSoTudIchY (accessed Nov 1, 2014). Liu, W. C., & Wang, C. K. (2005). Academic Self-Concept: A Cross-Sectional Study of Grade and Gender Differences in a Singapore Secondary School. Asia Pacific Education Review , 6 (1), 20-27. Liu, W. C., Wang, C. K., & Parkins, E. J. (2005). A longitudinal study of students’ academic self-concept in a streamed setting: The Singapore context. British Journal of Educational Psychology (75), 567-586. Liu, X., Kaplan, H. B., & Risser, W. (1992). Decomposing the Reciprocal Relationships Between Academic Achievement and General Self-esteem. Youth and Society (24), 123-148. Low, D. (2013, Feb 1). Good Meritocracy, Bad Meritocracy. Retrieved Nov 2, 2014 from IPS Commons: http://www.ipscommons.sg/good-meritocracy-bad-meritocracy/ Low, D., & Vadaketh, S. T. (2014). Hard Choices: Challenging the Singapore Consensus. Singapore: NUS University Press. Luo, W., Hogan, D. J., Yeung, A. S., Sheng, Y. Z., & Aye, K. M. (2014). attributional beliefs of Singapore students: relations to self-construal, competence and achievement goals. Educational Psychology: An International Journal of Experimental Educational Psychology , 34 (2), 154-170. Marsh, H. W., Trautwein, U., Ludtke, O., Koller, O., & Baumert, J. (2005). Academic Self-Concept, Interest, Grades, and Standardized Test Scores: Reciprocal Effects Models of Causal Ordering. Child Development , 76 (2), 397-416. Mastercard. (10 Apr, 2013). Two Thirds of Asia/Pacific Parents Spending on Extra Tuition for Kids: MasterCard Survey. Retrieved 3 May, 2014 from Mastercard: http://newsroom.mastercard.com/press-releases/two-thirds-of-asiapacific-parents-spending-on-extra-tuition-for-kids-mastercard-survey/ Mckinsey & Company. (2010). How the World's Most Improved School Systems Keep Getting Better. McKinsey & Company. Ministry of Education, (2004) “Principles of Governance,” National Education Website, http://www.ne.edu.sg/principles_of_governance.htm (accessed May 3, 2014).

54
Ministry of Education (June 2012), Adjustments in school fees 2013, MOE Press Releases, http://www.moe.gov.sg/media/press/2012/06/adjustments-in-school-fees-2013.php (accessed Oct 14, 2014) Ministry of Education (Oct 2012), Performance by Ethnic Group in National Exmainations, MOE Press Releases, http://www.moe.gov.sg/media/press/2012/10/performance-by-ethnic-group-in.php (accessed Oct, 2014) Ministry of Education, Singapore. (Feb, 2013). Mininstry of Education, Singapore: Every School A Good School. Retrieved 20 Nov, 2014 from Ministry of Education, Singapore: http://www.moe.gov.sg/initiatives/every-school-good-school/ Ministry of Education (Sept 2013), Parliamentary reply on effects of tuition on mainstream education, MOE Website, http://www.moe.gov.sg/media/parliamentary-replies/2013/09/effects-of-tuition-on-mainstream-education.php (accessed Oct 14, 2014) Ministry of Education (2014), “Education in Singapore,” MOE Corporate Brochure 2014, http://www.moe.gov.sg/about/files/moe-corporate-brochure.pdf (accessed Oct 14, 2014) Ministry of National Development. (2013 09-Jul). Written Answer by Ministry of National Development on Ethnic Integration Policy for HDB rental flats. Retrieved 2014 Nov from Ministry of National Development, Singapore: http://app.mnd.gov.sg/Newsroom/NewsPage.aspx?ID=4633&category=Parliamentary%20Q%20&%20A&year=2013&RA1=&RA2=&RA3= Ministry of National Development. (2012 10-July). Written Answer by Ministry of National Development on Rental Flats and Ethnic Integration Policy. Retrieved 2014 Nov from Ministry of National Development, Singapore: http://app.mnd.gov.sg/Newsroom/NewsPage.aspx?ID=3698&category=Parliamentary%20Q%20&%20A&year=2012&RA1=&RA2=&RA3= Ministry of Social and Family Development. (2014 30-July). Family Service Centres- Ministry of Social and Family Development. Retrieved 2014 Nov from Ministry of Social and Family Development: http://app.msf.gov.sg/Policies/Strong-and-Stable-Families/Supporting-Families/Family-Service-Centres Mueller, C. M., & Dweck, C. S. (1998). Praise for Intelligence Can Undermine Children's Motivation and Performance. Journal of Personality and Social Psychology , 75 (1), 33-52. Murray, C., & Malmgren, K. (2005). Implementing a Teacher-Student Relationship Program in a High-Poverty Urban School: Effects on Social, Emotional, and Academic Adjustment and Lessons Learned. Journal of School Psychology , 43 (2), 137-152. National Center on Education and the Economy. (2014). Singapore: System and School Organization. Retrieved 24 Nov, 2014 from NCEE: http://www.ncee.org/programs-affiliates/center-on-international-education-benchmarking/top-performing-countries/singapore-overview/singapore-system-and-school-organization/

55
National Volunteer & Philantrophy Centre. (2013). Corporate Giving Survey 2012. Singapore: National Volunteer & Philantrophy Centre. National Volunteer and Philantrophy Centre. (201331-Jan). Individual Giving Survey 2012 Media Briefing. Retrieved 2014 20-Nov from National Volunteer and Philantrophy Centre: http://www.nvpc.org.sg/Portals/0/Documents/Research%20and%20Publications/IGS%202012/IGS%202012%20Media%20Briefing.pdf National Volunteer and Philantrophy Centre. (2014). Individual Giving Survey 2012- Supplement. Retrieved 2014 20-Nov from National Volunteer and Philantrophy Centre: http://www.nvpc.org.sg/Portals/0/Documents/Research%20and%20Publications/2014/IGS%202012%20Sup/IGS%202012%20Supplement.pdf Neisser, U., Boodoo, G., Bouchard, J., Boykin, W. A., Brody, N., Ceci, S., et al. (1996). Intelligence: Knowns and unknowns. American Psychologist , 51 (2), 77-101. Ng, I. Y. (2012). Parents' psychological self-concepts and children issues in low-income families in Singapore. Asia Pacific Journal of Social Work and Development , 22 (1-2), 50-62. Ng, I. Y., & Senin, N. (2012). Educational aspirations of Malay youths from low-income families in Singapore. Asia Pacific Journal of Social Work and Development , 22 (4), 253-265. Ng, I. Y., Shen, X., & Ho, K. W. (2009). Intergenerational earnings mobility in Singapore and the United States. Journal of Asian Economics , 20, 110-119. Ng, R., & Ho, K. (2006). Intergeneration educational mobility in Singapore: An empirical study. YouthScope (1), 58-73. OECD. (2011). Can disadvantaged students defy the odds against them? OECD Publishing. OECD. (2010). PISA 2009 Results: Overcoming Social Background- Equity in Learning Opportunities and Outcomes (Volume II). OECD. Paton, G. (20 Feb, 2014). Parents told: 'use chores to teach children basic skills'. Retrieved 21 Nov, 2014 from The Telegraph: http://www.telegraph.co.uk/education/educationnews/10649077/Parents-told-use-chores-to-teach-children-basic-skills.html Powell, B. M., Hughes-Scholes, H. C., & Sharman, J. S. (2012). Skill in Interviewing Reduces Confirmation Bias. Journal of Investigative Psychology and Offender Profiling , 9, 126-134. Ramey, S. L., & Ramey, C. T. (1992). Early educational intervention with disadvantaged children--To what effect? Applied & Preventive Psychology , 1, 131-140. Raikes, H.A., & Thompson, R.A. (2005). Efficacy and social support as predictors of parenting stress among families in poverty. Infant Mental Health Journal, 26,177 – 190.
56
Rea, L. M., & Parker, R. A. (2005). Designing and Conducting Survey Research: A Comprehensive Guide (Vol. 3). San Francisco: Jossey-Bass. Rosenberg, M., & Simmons, R. G. (1972). Rosenberg-Simmons Self-Esteem Scale. In R. C. Wylie, Measures of Self-Concept (p. 36). University of Nebraska. Ross, C. E., & Broh, B. A. (2000). The Roles of Self-Esteem and the Sense of Personal Control in the Academic Achievement Process. Sociology of Education , 73 (4), 270-284. Senin, N., & Ng, I. Y. (2012). Educational aspirations of Malay youths from low-income families in Singapore. Asia Pacific Journal of Social Work and Development , 22 (4), 253-265. Singh, P. (2012 28-Dec). HDB’s Rental Housing Policy (Part 1): The Malay EIP limit. Retrieved 2014 Nov from Singapore 2025: http://singapore2025.wordpress.com/2012/12/28/hdbs-rental-housing-policy-part-1-the-malay-eip-limit/ Sirin, S. R. (2005). Socioeconomic Status and Academic Achievement: A Meta-Analytic Review of Research. Review of Educational Research , 75 (3), 417-453. Tan, Kenneth Paul, (2008) “Meritocracy and Elitism in a Global City: Ideological Shifts in Singapore,” International Political Science Review 29, no. 1: 7-27. The Asian Parent. (2011). Singapore top primary schools rankings - top 21 ranked . Retrieved Nov, 2014 from The Asian Parent: http://sg.theasianparent.com/primary-schools-rankings-%E2%80%93-top-21/2/ The Straits Times. (05 Nov, 2012). Debate over PSLE revived. Retrieved 24 Sept, 2014 from Asiaone News: http://news.asiaone.com/News/Latest+News/Singapore/Story/A1Story20121105-381550.html The Straits Times. (21 Sep, 2013). Why Singapore is a 'tuition nation'. Retrieved 14 Oct, 2014 from The Straits Times: http://www.straitstimes.com/premium/forum-letters/story/why-singapore-tuition-nation-20130921 Today Online. (Sep, 2013). MPs call for closer look at at private tuition industry. Retrieved Nov, 2014 from Today Online: http://www.todayonline.com/singapore/mps-call-closer-look-private-tuition-industry-0 Varni, J., Seid, M., & Kurtin, P. (2001). PedsQL 4.0: Reliability and validity of the Pediatric Quality of Life Inventory version 4.0 generic core scales in healthy and patient populations. Medical Care , 39 (8), 800-812. Walker, L. S., & Greene, J. W. (1990). The Functional Disability Inventory: Measuring a Neglected Dimension of Child Health Status. Journal of Pediatric Psychology , 16 (1), 39-58. Wentzel, K. R., Weinberger, D. A., Ford, E. M., & Feldman, S. S. (1990). Academic Achievement in Preadolescence: The Roleof Motivational, Affective, and Self-Regulatory Processes. Journal of Applied Development Psychology , 11, 179-193.

57
Yayasan Mendaki. (2014). General- Yayasan Mendaki. Retrieved 2014 from Yayasan Mendaki: http://www.mendaki.org.sg/about-mendaki/general.aspx Yeh, S. S. (2010). Understanding and addressing the achievement gap through individualized instruction and formative assessment. Assessment in Education: Principles, Policy & Practice , 17 (2), 169-182.

58
10. APPENDIX
Annex A: Sample of Existing Educational Assistance Programs in Singapore
Annex B: List of schools with a high proportion of low SES students
Annex C: Survey Questionnaire
Annex D: Regression Analysis
Annex E: Preliminary Recommendations and Focus Group Discussions

59
Annex A: Sample of Existing Educational Assistance Programs in Singapore for Primary School Children from Low-Income Families Scheme Name/ Administered by
Description Eligibility Remarks
School Pocket Money Fund / NCS
Straits Times charity project with the aim of helping children from low- income families to pay for basic daily school-related expenses.
Quantum of assistance per month:
i) Primary Level: $60 ii) Secondary Level: $95 iii) Post Secondary Level : $120
Singapore citizen or PR
Full-time student studying in mainstream school, special education school, Mountbatten Vocational School, Northlight School, Assumption Pathway School or religious school (such as Madrasah)
Living in HDB 4-room flats or smaller
Per capita nett household income $450 or less per month
General Assistance Fund (Education) / North-east CDC “WeCare Fund @ Northeast”
Assistance is categorized under five main pillars: Food: Meals for primary and secondary school students who stay back in school for CCAs, grocery vouchers
Education: New School Bags, Assessment books and School Shoes Healthcare: Diapers, Milk feeds, Non-Standard Medication and Treatment, Dentures, Spectacles, Ambulance services for Seniors, Day Rehabilitation Services & Treatment, Ambulance Services to medical institutions
Household: Temporary jobs to pay off arrears
Singaporean and Singapore PR whose Gross Household Income per month is $2500 and below. Cases will be assessed based on needs and assisted on a case-by-case basis.

60
with Town Councils, Financial Budgeting Workshops, Study Tables and Chairs, Utensils, Mattresses
Transport: Vouchers for public transport and selected taxi vendor, Regular travelling expenses incurred to go treatment centres
CDAC-SFCCA Bursary / CDAC
The Bursary is meant for successful applicants to purchase school necessities, defray transport and meals cost for the new school term. Quantum of assistance: i) Primary Level: $280 ii) Secondary Level: $450 iii) Post Secondary Level : $580
Chinese Singapore Citizens or PRs
Full-time Primary, Secondary, JC/Pre-U & ITE students attending government / government-aided / autonomous / independent / ITE / JC / Centralised Institute
Not receiving School Pocket Money Fund/any other scholarship or bursary in the same academic year (excluding Edusave Scholarship and Merit Bursary); JC/CI MOE-FAS; and HOPE Scheme
Gross monthly household income not exceeding $1,500 or per capita income not exceeding $375
Has good conduct and regular attendance in school (at least 90%)
http://www.cdac.org.sg/cdac_corp/resource/application_form/Student%20Assistance%20&%20Support%20Scheme%202014.pdf
CDAC Tuition Programme / CDAC
Structured group tuition for Primary 1 to Secondary 5 students, coached by trained teachers/qualified individuals There is CDAC Tuition Fee Waiver for students from low-income families that genuinely cannot
Chinese Singapore Citizens or Singapore Permanent Residents. (tuition centres under Collaborative Tuition Programme accepts students of all races)
Gross monthly household income not exceeding
http://www.cdac.org.sg/cdac_corp/resource/application_form/Student%20Assistance%20&%20Support%20Scheme%

61
afford to pay the fee to attend CDAC Tuition Programme (Monthly household income not exceeding $1,500 or per capita income not exceeding $375).
Fee:
Pri Level: $8 per subject per month Sec Level: $12 per subject per month
$2,700 or per capita income not exceeding $700
Results criteria apply:
P1-3 (≤75%), P4-6 (≤69%), P5 & 6 Foundation Eng & Math (No restriction) Sec Exp English and Math : C5 or 60% and below Chinese : B3 or 69 % and below Sec Normal (A) and Normal (T) : No Restriction
202014.pdf
Eurasian Community Fund (ECF) Bursary Awards / Eurasian Association
1. ECF Education Awards: A one-time monetary reward to students to encourage them to continue working hard. Quantum cap of $100-$300.
2. Project Ray of Hope: Disbursement of Popular & Bata vouchers to purchase educational items to prepare for the next academic year. Quantum cap of $250-350.
3. Temasek Cares Education Bursary (TCEB): Covering school fees, books, uniforms, transport & meals for one academic year, to encourage Primary students to study hard and do well. Quantum cap of $1,200 per academic year.
Eurasian or with Eurasian parent or grandparent
Singapore Citizen or PR
Full-time student
1. GHI ≤ $2700 or PCI ≤ $700 2. GHI ≤ $2700 or PCI ≤ $700 3. GHI range: $2500 - $2700, or PCI range:
$625 - $750 *For students not under MOE FAS
http://www.eurasians.org.sg/education/
Mendaki Tuition Scheme / Mendaki
The MENDAKI Tuition Scheme (MTS) aims to provide quality tuition at affordable rates to help students attain better results in their school and national examinations. With highly qualified tutors, students are engaged in a positive and
Open to all Muslim students who are Singapore Citizens or PRs Obtained 75 marks and below in at least one tuition subject (English, Mathematics or Science)
http://mts.mendaki.org.sg

62
enriching environment during MTS lesson. MTS provides tuition in English, Mathematics and Science at over 50 centres for students from Primary 1 to Secondary 5. Classes are conducted on weekends. Packages: English – All levels Mathematics – All levels Primary 4-6 (Standard or Foundation): Mathematics and English / Mathematics and Science Fees: Primary 1-4: $135 Primary 5&6: $155 Secondary 1&2: $185 Secondary 3&4: $210
at year-end examination (SA2)
Criteria for fee waiver:
Household income less than $1,800 or average income per capita is below $450
Applicant must first obtain the subsidy or financial aid from existing financial assistance schemes available before an application can be made for ETF School Assistance Scheme (ETF-SAS). Students with overall results less than 75% MUST register for MTS in order to be eligible for ETF-SAS.
Parents are required to attend the Financial Literacy Workshop (Core Module) conducted by Yayasan MENDAKI and to produce the certificate of attendance when collecting vouchers.
Collaborative Tuition Programme (CTP) / Mendaki
Packages: English (Primary 1 – Secondary 5) Mathematics (Primary 1 – Secondary 5) Science (Primary 4 – Secondary 5) Fees: Primary 1-3: $8/subject/month Primary 4-Secondary 5: $12/subject/month
Open to all students who are Singapore citizens or PRs Year-end examination results of between 35 and 65 marks per tuition subject (English and Mathematics for all levels and Science for Primary 4 to Secondary 5) Gross Monthly household income of $3000 and below or the family’s per capita income (PCI) of $800 and below
http://mts.mendaki.org.sg/tuition.html

63
Education Trust Fund School Assistance Scheme (ETF-SAS) / Mendaki
To provide financial assistance for children in low-income Malay/Muslim families studying in primary, secondary or madrasah schools in cases where existing schemes are unable to provide. The Fund will also be used to provide additional funding to augment the amount provided by existing schemes, which may not be sufficient.
Students from the lower secondary will be receiving book vouchers valued $200 each.
To be eligible the child must be:
• Muslim Singapore Citizen or PR. At least one of the child’s parents must also be a Singapore Citizen or PR
• Studying full-time in primary 1 to Secondary 5, in local government or government-aided schools or madrasahs
• Net total family income of applicant must not be more than $1,800 or the family’s per capita income (PIC) must not be more than $450
• Applicant must first obtain the subsidy or financial aid from existing financial assistance schemes available before an application can be made for ETF School Assistance Scheme (ETF-SAS). Students with overall results less than 75% MUST register for MTSin order to be eligible for ETF-SAS.
• Parents are required to attend the Financial Literacy Workshop (Core Module) conducted by Yayasan MENDAKI and to produce the certificate of attendance when collecting vouchers.
Hope Centre (Singapore) Student Bursary Award / Hope Centre Singapore
Hope Centre has been giving out annual bursary awards to students in the community who are in financial need.
Award quantum values:
Singapore Citizens PRs
• Full-time students in a local institution (Primary / Secondary / JC / ITE / Polytechnic / University)
• From families with gross monthly household

64
Primary - $150 Secondary - $300 ITE - $500 JC - $350 Polytechnic - $1,200 University - $2,500
income of $1,500 or below
• With good conduct & satisfactory academic performance
• Students not receiving any other government/ company/charity funded scholarship or bursary award will be given priority
NTUC Back to School Vouchers
The U Care Back to School (BTS) Voucher Programme is to assist our low-income members to defray the cost of their children's school expenses for the new school year.
Each successful applicant will receive a booklet of U Care Back to School Vouchers worth $125 for each eligible school-going child (each eligible child will receive one booklet).
Eligible Groups of School-Going Children
• Kindergarten 1 or 2; • Government/Government Aided/Independent Schools (Primary or Secondary) under MOE; • Junior Colleges; Institute of Technical Education; Millennia Institute and Polytechnics; or • MOE-registered Special Education Schools Eligibility Criteria
• Member must have a minimum of 6 months continuous paid-up union membership at the point of application and is not in arrears. • Total Monthly Gross Household Income of $2,800 and below; OR Per Capita Income of $725 and below if gross household income exceeds $2,800. • Member’s child/children must be attending one of the schools stated above.
https://www.ntuc.org.sg/wps/portal/up2/home/areasofinterest/careandshare/ucareprogrammes/ucareprogrammesdetails?WCM_GLOBAL_CONTEXT=/content_library/ntuc/home/areas+of+interest/care+and+share/u+care+programmes/d2877e8040210e6c80a4f663702feb70
Extracted from National Council of Social Service, “Assistance Schemes for Individuals & Families In Social & Financial Need”. The full list of assistance schemes can be downloaded from www.ncss.org.sg/documents/assistanceschemes.pdf

65
Annex B: List of Schools Identified with High Proportion of Students from Low SES families 1. Blangah Rise Primary School 2. Gan Eng Seng Primary School 3. Zhangde Primary School 4. Queenstown Primary School 5. Mayflower Primary School 6. Balestier Hill Primary School The following shows the 25 schools that our respondents attended Primary School Name No. of Students Ahmad Ibrahim Primary 1 Anderson Primary 2 Balestier Hill Primary 6 Bendemeer Primary 2 Blangah Rise Primary 10 Broadrick Primary 1 Bukit View Primary 1 Corporation Primary 1 East View Primary 2 Eunos Primary 2 First Toa Payoh Primary 3 Gan Eng Seng Primary 21 Hong Wen Primary 2 Jin Shan Primary 1 Kranji Primary 1 Mayflower Primary 9 New Town Primary 1 Qifa Primary 1 Queenstown Primary 2 Radin Mas Primary 1 St Andrews Primary 1 St Margret Primary 2 Stanford Primary 8 Xishan Primary 1 Zhangde Primary 5
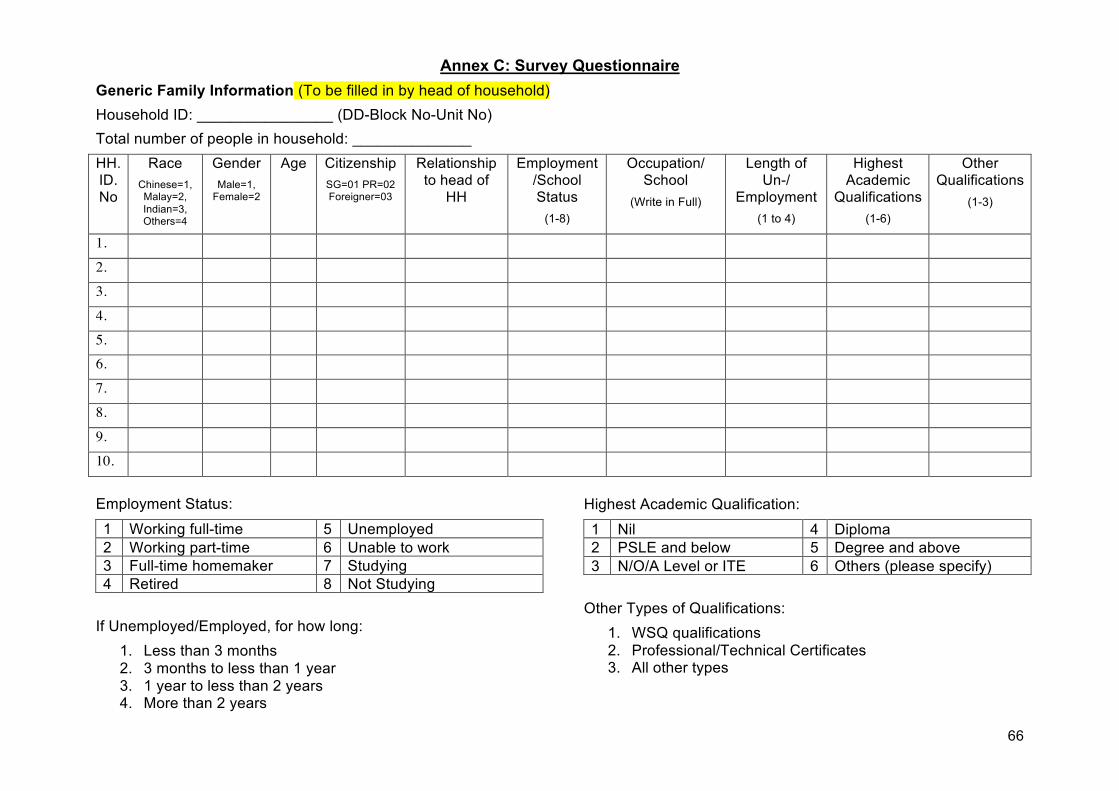
66
Annex C: Survey Questionnaire Generic Family Information (To be filled in by head of household) Household ID: ________________ (DD-Block No-Unit No) Total number of people in household: ______________ HH. ID. No
Race Chinese=1, Malay=2, Indian=3, Others=4
Gender Male=1,
Female=2
Age Citizenship SG=01 PR=02 Foreigner=03
Relationship to head of
HH
Employment /School Status
(1-8)
Occupation/ School
(Write in Full)
Length of Un-/
Employment (1 to 4)
Highest Academic
Qualifications (1-6)
Other Qualifications
(1-3)
1. 2. 3. 4. 5. 6. 7. 8. 9. 10.
Employment Status:
1 Working full-time 5 Unemployed 2 Working part-time 6 Unable to work 3 Full-time homemaker 7 Studying 4 Retired 8 Not Studying
If Unemployed/Employed, for how long:
1. Less than 3 months 2. 3 months to less than 1 year 3. 1 year to less than 2 years 4. More than 2 years
Highest Academic Qualification:
1 Nil 4 Diploma 2 PSLE and below 5 Degree and above 3 N/O/A Level or ITE 6 Others (please specify)
Other Types of Qualifications:
1. WSQ qualifications 2. Professional/Technical Certificates 3. All other types

67
1. Housing type: Purchased/Rental/Interim (Please circle the right option) o 1-room (or L shaped) o 2-room (1 bedroom and 1 living room) o 3-room (2 bedrooms and 1 living room)
2. Languages spoken at home: (Please tick the options that apply)
English Malay Mandarin Tamil or Indian Dialect Chinese Dialect Others (please specify)
3. Marital Status of Parents: With spouse Second marriage Divorced Others (please specify) Widow/widower
4. Total monthly basic household income:
<$400 $1001-1400 $401-800 $1401-1800 $801-1000 >$1800
5. Do you receive any financial assistance?
o Yes, total quantum per month: __________ o No
6. Do you receive any assistance in kind? Food Medical Transport Tuition Training/Training Credits Others
If others, what kind of assistance: ________________________________________________ If tuition, from which organization: ________________________________________________ Questions For Children Attending Primary School and Above Level Only HH ID. No. __ 2 3 4 5 6 7 7. Who takes care of this child after school?
1. Childcare services (public) 2. Childcare services (private) 3. Family members 4. Left alone
8. If currently enrolled in a school, at what level (Primary, Sec etc)
9. Is the Child Under the MOE School Financial Assistance Scheme (FAS)
Y/N Y/N Y/N Y/N Y/N Y/N

68
Framework Specific Questions To be filled in by Primary-School Attending child, with assistance by parents if necessary
Household ID. No. of Child:___
Section 1:
10. How many meals do you eat a day? (Tea-break and Supper counted as 0.5 each) _________________________________________________________
11. How many sets of uniform do you have? (Inclusive of PE-attires) _________________________________________________________
12. Do you feel that you live in a safe place? Please circle the option
Very Safe Not Quite Safe Quite Safe Not Safe At All
13. Do you feel that your school is a safe place? Please circle the option
Very Safe Not Quite Safe Quite Safe Not Safe At All
Section 2:
Does your child suffer from any disabilities/conditions/long term illnesses? 14. Physical disabilities: ______________________ 15. Learning disabilities: ______________________ 16. Health conditions: ______________________ Please tick the box in each row that best describe you In the past one month, have you had problems with: Never Almost
never Some-times
Often Almost always
17. It is hard for me to do sports activity or exercise.
18 I have low energy. 19. I feel stressed. 20. I feel happy.

69
21. I fall sick. 22. Do you feel stressed in school? Yes/No If yes, why: (Circle all that are applicable)
o Academic o Being bullied o Peer-pressure o Others (please specify):________
23. Do you feel stressed/nervous at home? Yes/No If yes, why:
o Poor relationships with parents/communication issues o Poor relationship between parents o Domestic abuse o Alcohol abuse by family members o Bad relationship with sibling(s) o Others (please specify): _______
Section 3:
Please tick the box in each row that best describes you. In the past one month, have you had problems with: Never Almost
never Some-times
Often Almost always
24. I hurt or ache. 25. I feel afraid or scared. 26. I have trouble sleeping.
27. Other kids want to be my friend.
28. Other kids make fun of me.
Section 4:
29. A kid told me: “There’s a lot wrong with me.” Do you ever feel like this? Yes/No
If yes, do you feel like this a lot or a little? ______
30. Another kid said: “I’m not much good at anything.” Do you ever feel like this? Yes/No
If yes, do you feel like this a lot or a little? ______
31. Everybody has some things about him which are good and some things about him which are bad. Are more of the things about you good, bad, or are they both about the same? ______

70
32. Another kid said, “I am no good at studying.” Do you ever feel like this? Yes/No
If yes, do you feel like this a lot or a little? ______
33. How happy are you with the kind of person you are? Are you very happy, pretty happy, a little happy, or not at all happy with the kind of person you are? ______
34. Another kid said, “I think i am no good at all.” Do you ever feel like this? Yes/No
If yes, do you feel like this a lot or a little? ______
Section 5: Please circle the option that you feel best describes you.
35. Going to school is something A. I like. B. I often dislike. C. I detest.
36. Paying attention at school is something A. I always do well. B. I often find very difficult.
37. Having a good school report is something for which I A. don’t care much. B. sometimes do my best. C. always try hard.
38. When I have been given an assignment to work out at home I A. sometimes make a mess of it. B. finish it as quickly as possible. C. do my best to get a good result
39. Studying hard is something I A. like. B. don’t like. C. don’t like at all.
40. When I have a difficult piece of work that doesn’t get solved I A. keep trying until I succeed. B. carry on for a fairly long time. C. I give it up.
41. For me, doing well in society is A. unimportant. B. important. C. very important.
Section 6: 42. (For Caretakers), Do you feel that you spend enough time with your children a. HH ID__: A. Not Enough at all B. Sometimes Enough C. Enough b. HH ID__: A. Not Enough at all B. Sometimes Enough C. Enough
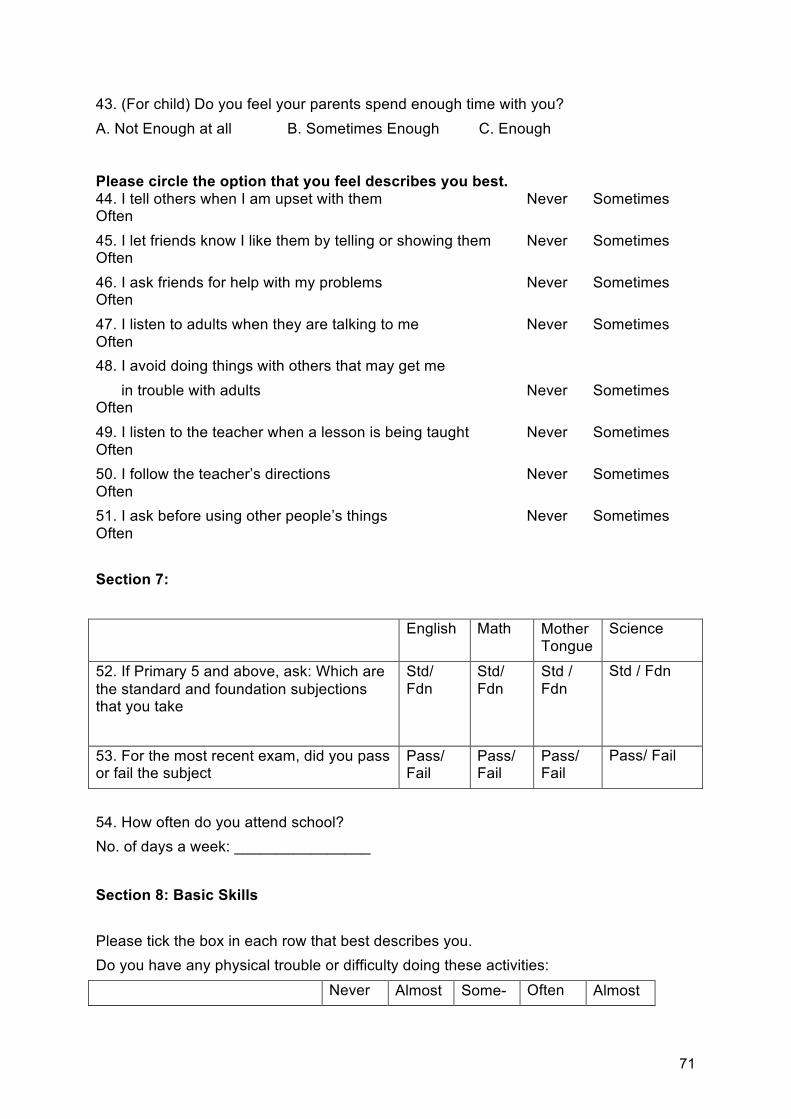
71
43. (For child) Do you feel your parents spend enough time with you? A. Not Enough at all B. Sometimes Enough C. Enough Please circle the option that you feel describes you best. 44. I tell others when I am upset with them Never Sometimes Often
45. I let friends know I like them by telling or showing them Never Sometimes Often 46. I ask friends for help with my problems Never Sometimes Often 47. I listen to adults when they are talking to me Never Sometimes Often 48. I avoid doing things with others that may get me in trouble with adults Never Sometimes Often
49. I listen to the teacher when a lesson is being taught Never Sometimes Often 50. I follow the teacher’s directions Never Sometimes Often 51. I ask before using other people’s things Never Sometimes Often
Section 7: English Math Mother
Tongue Science
52. If Primary 5 and above, ask: Which are the standard and foundation subjections that you take
Std/ Fdn
Std/ Fdn
Std / Fdn
Std / Fdn
53. For the most recent exam, did you pass or fail the subject
Pass/ Fail
Pass/ Fail
Pass/ Fail
Pass/ Fail
54. How often do you attend school? No. of days a week: ________________ Section 8: Basic Skills
Please tick the box in each row that best describes you. Do you have any physical trouble or difficulty doing these activities: Never Almost Some- Often Almost

72
never times always 55. Using the toilet by yourself
56. Walking up stairs, or from one place to another
57. Doing chores at home
58. Eating regular meals by yourself
59. Changing/wearing clothes by yourself

73
Annex D: Regression Analysis
Table 1: Correlation Matrix of Subjects and Seven Factors
English results
Math results
Mother Tongue results
Science results needs health security selfesteem motivation relationship basicskills
English results 1.000 Math results 0.367*** 1.000 0.000 Mother Tongue results 0.358*** 0.038 1.000 0.001 0.727 Science results 0.377*** 0.374*** 0.268** 1.000 0.001 0.001 0.025 needs 0.108 -0.025 -0.136 0.021 1.000 0.32 0.82 0.21 0.87 health -0.066 -0.014 0.028 -0.085 0.067 1.000 0.543 0.896 0.798 0.480 0.534 security 0.062 0.084 0.072 -0.099 0.199 0.304*** 1.000 0.567 0.438 0.512 0.411 0.063 0.004 selfesteem -0.130 -0.116 -0.037 0.054 0.024 0.355*** 0.302*** 1.000 0.231 0.286 0.733 0.654 0.827 0.001 0.004
motivation 0.106 0.106 0.096 -0.010 -
0.023 0.219** 0.248** 0.283*** 1.000 0.326 0.329 0.377 0.934 0.830 0.040 0.020 0.008 relationship 0.065 0.114 0.017 0.153 0.149 0.209** 0.325*** 0.234*** 0.373*** 1.000 0.548 0.295 0.875 0.202 0.166 0.051 0.002 0.028 0.000 basicskills 0.188* 0.104 0.005 -0.066 0.005 0.069 0.193* -0.036 0.034 0.106 1.000 0.082 0.336 0.961 0.586 0.961 0.523 0.071 0.738 0.755 0.324 *** p<0.01, ** p<0.05, * p<0.1
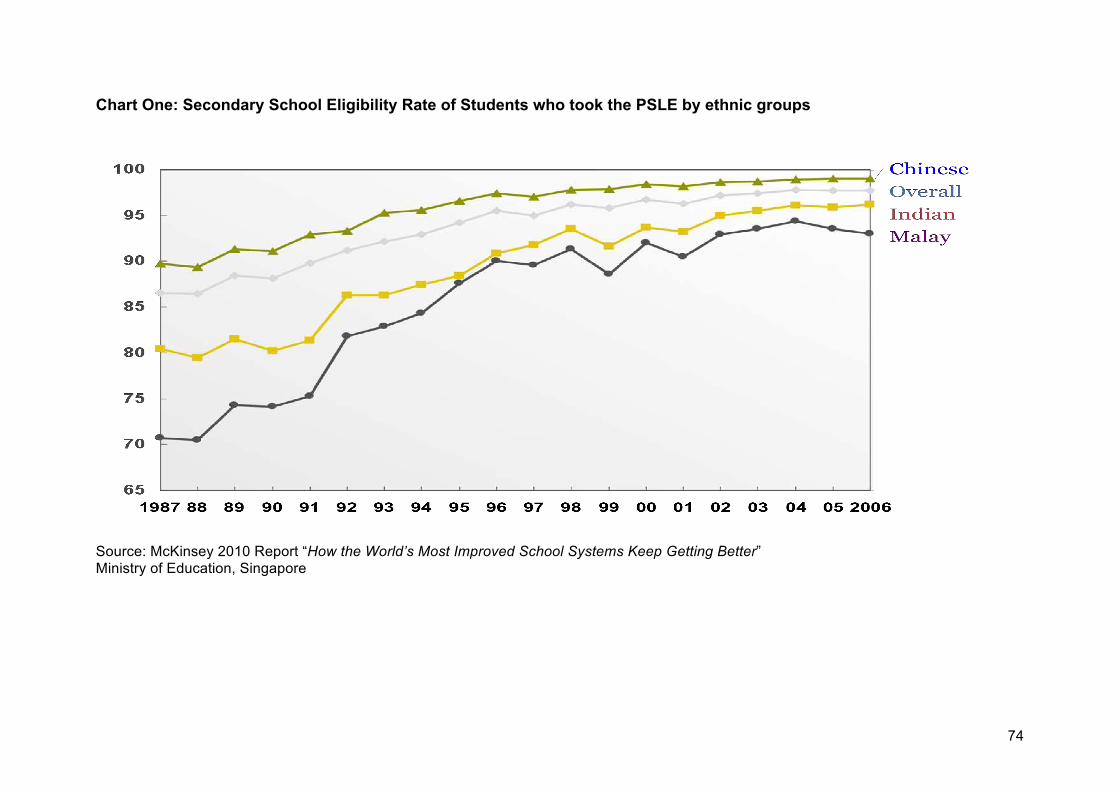
74
Chart One: Secondary School Eligibility Rate of Students who took the PSLE by ethnic groups
Source: McKinsey 2010 Report “How the World’s Most Improved School Systems Keep Getting Better” Ministry of Education, Singapore
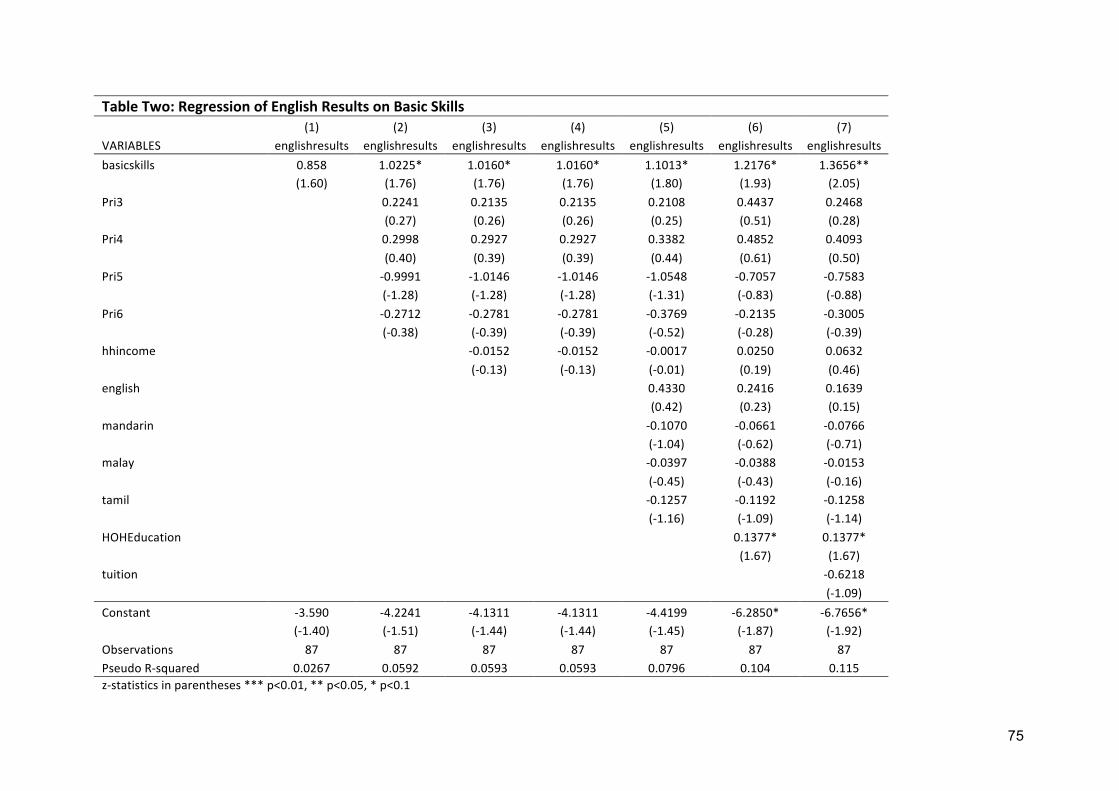
75
Table Two: Regression of English Results on Basic Skills (1) (2) (3) (4) (5) (6) (7) VARIABLES englishresults englishresults englishresults englishresults englishresults englishresults englishresults basicskills 0.858 1.0225* 1.0160* 1.0160* 1.1013* 1.2176* 1.3656** (1.60) (1.76) (1.76) (1.76) (1.80) (1.93) (2.05) Pri3 0.2241 0.2135 0.2135 0.2108 0.4437 0.2468 (0.27) (0.26) (0.26) (0.25) (0.51) (0.28) Pri4 0.2998 0.2927 0.2927 0.3382 0.4852 0.4093 (0.40) (0.39) (0.39) (0.44) (0.61) (0.50) Pri5 -‐0.9991 -‐1.0146 -‐1.0146 -‐1.0548 -‐0.7057 -‐0.7583 (-‐1.28) (-‐1.28) (-‐1.28) (-‐1.31) (-‐0.83) (-‐0.88) Pri6 -‐0.2712 -‐0.2781 -‐0.2781 -‐0.3769 -‐0.2135 -‐0.3005 (-‐0.38) (-‐0.39) (-‐0.39) (-‐0.52) (-‐0.28) (-‐0.39) hhincome -‐0.0152 -‐0.0152 -‐0.0017 0.0250 0.0632 (-‐0.13) (-‐0.13) (-‐0.01) (0.19) (0.46) english 0.4330 0.2416 0.1639 (0.42) (0.23) (0.15) mandarin -‐0.1070 -‐0.0661 -‐0.0766 (-‐1.04) (-‐0.62) (-‐0.71) malay -‐0.0397 -‐0.0388 -‐0.0153 (-‐0.45) (-‐0.43) (-‐0.16) tamil -‐0.1257 -‐0.1192 -‐0.1258 (-‐1.16) (-‐1.09) (-‐1.14) HOHEducation 0.1377* 0.1377* (1.67) (1.67) tuition -‐0.6218 (-‐1.09) Constant -‐3.590 -‐4.2241 -‐4.1311 -‐4.1311 -‐4.4199 -‐6.2850* -‐6.7656* (-‐1.40) (-‐1.51) (-‐1.44) (-‐1.44) (-‐1.45) (-‐1.87) (-‐1.92) Observations 87 87 87 87 87 87 87 Pseudo R-‐squared 0.0267 0.0592 0.0593 0.0593 0.0796 0.104 0.115 z-‐statistics in parentheses *** p<0.01, ** p<0.05, * p<0.1

76
Table Three: Regression of Math Results on Basic Skills (8) (9) (10) (11) (12) (13) (14) VARIABLES mathresults mathresults mathresults mathresults mathresults mathresults mathresults Basic Skills 0.5326 0.8291 0.8302 0.8302 0.7583 0.7870 0.9784* (0.95) (1.42) (1.42) (1.42) (1.32) (1.36) (1.67) Pri3 -‐0.1251 -‐0.1359 -‐0.1359 -‐0.1316 0.0085 -‐0.3782 (-‐0.16) (-‐0.17) (-‐0.17) (-‐0.16) (0.01) (-‐0.43) Pri4 -‐1.4485** -‐1.4579** -‐1.4579** -‐1.6216** -‐1.5862** -‐1.8345** (-‐1.97) (-‐1.97) (-‐1.97) (-‐2.09) (-‐2.02) (-‐2.24) Pri5 -‐2.4911*** -‐2.5114*** -‐2.5114*** -‐2.5804*** -‐2.3819** -‐2.6186** (-‐2.63) (-‐2.62) (-‐2.62) (-‐2.66) (-‐2.40) (-‐2.49) Pri6 -‐1.6422** -‐1.6524** -‐1.6524** -‐1.7408** -‐1.6447** -‐1.9289** (-‐2.28) (-‐2.28) (-‐2.28) (-‐2.33) (-‐2.18) (-‐2.40) hhincome -‐0.0176 -‐0.0176 -‐0.0004 0.0136 0.0534 (-‐0.14) (-‐0.14) (-‐0.00) (0.10) (0.39) english 0.3570 0.2763 0.1726 (0.33) (0.25) (0.15) mandarin -‐0.0944 -‐0.0718 -‐0.0963 (-‐0.73) (-‐0.53) (-‐0.69) malay -‐0.0984 -‐0.1003 -‐0.0783 (-‐0.94) (-‐0.94) (-‐0.69) tamil -‐0.0138 -‐0.0088 -‐0.0274 (-‐0.12) (-‐0.07) (-‐0.22) HOHEducation 0.0719 0.0615 (0.82) (0.68) tuition -‐1.0475* (-‐1.84) Constant -‐3.0379 -‐3.3160 -‐3.2496 -‐3.2496 -‐2.6029 -‐3.4503 -‐3.6681 (-‐1.12) (-‐1.19) (-‐1.15) (-‐1.15) (-‐0.96) (-‐1.18) (-‐1.26) Observations 87 87 87 87 87 87 87 Pseudo R-‐squared 0.00908 0.126 0.126 0.126 0.145 0.151 0.182 z-‐statistics in parentheses *** p<0.01, ** p<0.05, * p<0.1

77
Table 4: Regression of Mother Tongue Results on Basic Skills (15) (16) (17) (18) (19) (20) (21) VARIABLES mtresults mtresults mtresults mtresults mtresults mtresults mtresults Basic Skills 0.0263 -‐0.1274 -‐0.1274 -‐0.1274 -‐0.0559 -‐0.0112 0.3994 (0.05) (-‐0.23) (-‐0.23) (-‐0.23) (-‐0.10) (-‐0.02) (0.64) Pri3 -‐0.2756 -‐0.2770 -‐0.2770 -‐0.2934 -‐0.1285 -‐0.7118 (-‐0.33) (-‐0.33) (-‐0.33) (-‐0.35) (-‐0.15) (-‐0.73) Pri4 -‐0.2431 -‐0.2442 -‐0.2442 -‐0.2390 -‐0.1514 -‐0.4402 (-‐0.32) (-‐0.32) (-‐0.32) (-‐0.31) (-‐0.19) (-‐0.51) Pri5 0.1308 0.1280 0.1280 0.1582 0.4253 0.1818 (0.15) (0.14) (0.14) (0.17) (0.45) (0.18) Pri6 0.8814 0.8801 0.8801 0.8107 0.9697 0.7302 (1.03) (1.02) (1.02) (0.93) (1.08) (0.77) hhincome -‐0.0028 -‐0.0028 0.0021 0.0186 0.1423 (-‐0.02) (-‐0.02) (0.01) (0.13) (0.86) english 0.1688 -‐0.0145 -‐0.4383 (0.14) (-‐0.01) (-‐0.35) mandarin -‐0.0780 -‐0.0400 -‐0.0697 (-‐0.73) (-‐0.36) (-‐0.61) malay -‐0.0101 -‐0.0012 0.0643 (-‐0.11) (-‐0.01) (0.67) tamil -‐0.0814 -‐0.0665 -‐0.0916 (-‐0.73) (-‐0.59) (-‐0.80) HOHEducation 0.1037 0.1105 (1.13) (1.13) tuition -‐1.7626** (-‐2.40) Constant 1.0689 1.6893 1.7002 1.7002 1.4954 0.2744 -‐0.8035 (0.43) (0.63) (0.63) (0.63) (0.54) (0.09) (-‐0.27) Observations 86 86 86 86 86 86 86 Pseudo R-‐squared 2.66e-‐05 0.0293 0.0293 0.0293 0.0433 0.0568 0.130 z-‐statistics in parentheses *** p<0.01, ** p<0.05, * p<0.1

78
Table Five: Regression of Science Results on Basic Skills (22) (23) (24) (25) (26) (27) (28) VARIABLES sciresults sciresults sciresults sciresults sciresults sciresults sciresults Basic Skills -‐0.4091 -‐0.6929 -‐0.6170 -‐0.6170 -‐0.6373 -‐0.6146 -‐0.7757 (-‐0.55) (-‐0.87) (-‐0.76) (-‐0.76) (-‐0.75) (-‐0.72) (-‐0.90) Pri3 -‐ -‐ -‐ -‐ -‐ -‐ Pri4 -‐1.2396 -‐1.2461 -‐1.2461 -‐1.0622 -‐1.1027 -‐1.2120 (-‐1.54) (-‐1.55) (-‐1.55) (-‐1.29) (-‐1.33) (-‐1.45) Pri5 -‐1.7526** -‐1.7335** -‐1.7335** -‐1.5796* -‐1.5468* -‐1.7402* (-‐2.02) (-‐1.99) (-‐1.99) (-‐1.79) (-‐1.75) (-‐1.89) Pri6 0.0052 -‐0.0060 -‐0.0060 0.2351 0.2298 0.1601 (0.01) (-‐0.01) (-‐0.01) (0.28) (0.27) (0.18) hhincome 0.0750 0.0750 0.0402 0.0478 0.0116 (0.55) (0.55) (0.29) (0.34) (0.08) english 0.3434 0.2854 0.4465 (0.34) (0.28) (0.43) mandarin -‐0.0033 0.0110 0.0304 (-‐0.03) (0.10) (0.26) malay 0.0573 0.0604 0.0362 (0.66) (0.70) (0.39) tamil 0.0789 0.0841 0.0860 (0.70) (0.75) (0.75) HOHEducation 0.0443 0.0545 (0.47) (0.56) tuition 0.6256 (0.99) Constant 2.3926 4.4953 3.8760 3.8760 3.2341 2.7522 3.3377 (0.67) (1.16) (0.96) (0.96) (0.76) (0.63) (0.76) Observations 71 71 71 71 71 71 71 Pseudo R-‐squared 0.00330 0.0945 0.0977 0.0977 0.116 0.118 0.128 z-‐statistics in parentheses *** p<0.01, ** p<0.05, * p<0.1

79
Annex E: Preliminary Recommendations Our recommendations are targeted at the VWO we are currently working with, in mobilizing the community to provide resources to improve the situation. In the short term, we aim to improve school examination results for our target group of students. In the middle to long term, our aim is to retain these students within the education system and lower their dropout rate, in other to increase their employability and enhance social mobility. Based on our earlier findings, we have prepared recommendations for motivation-based factors and basic skills related factors respectively. We have also categorized recommendations under each area from short to long term. 1. Motivation-based factors
With regards to the first point for improving motivation in the short term, research has shown that compared to children who were praised for their intelligence, children who were praised for their effort were more likely to continue feeling motivated to learn and retain their confidence as problems got harder. Therefore, it is important for parents to motivate their children based on effort instead of outcome, as it cultivates a growth mindset and helps children perform better. With regards to the second point, goal setting exercises can help children from low SES families gain greater confidence that they have control over their circumstances, and translate this confidence into positive behavior change academically. The third recommendation is targeted at mitigating the sharp decline in the academic self-concept of students when they receive poor results after their examinations. This is a targeted approach to ensure that when students face failure, they receive immediate guidance to keep them motivated. Intensity here refers to both resources consumed and impacts achieved, frequency is how often these measures are carried out, and feasibility encompasses both in-house abilities and possibilities of collaboration with external stakeholders.

80
In the long-term, we need to improve the quality of volunteer tuition programs. Current turnover rates of tutors in such programs tend to be high and this can be disruptive to learning. Further, these programs could look into developing a structured curriculum to follow rather than just providing homework support. Another possibility is to conduct motivation and self-discipline workshops for students. This can be marketed as a CSR project for companies who are experts in this field. With regards to the last point, research has shown that cross-age peer mentoring programs may improve student retention rates. Mentors serve as positive role models for the younger students, guiding them towards academic and social success. The selection of mentors is of critical importance here and would be ideal if the mentor has lived through similar experiences of being from a low SES household.

81
2. Basic skills related factors
In terms of basic skills, parents have a vital role to play in making sure children develop proficient basic skills from a young age. Educators have found that doing basic daily activities can help children apply the lessons they have learnt to their everyday life and that this learning ability helps them to perform better in school. This could be helping to weigh and measure the ingredients required for cooking, or folding the laundry, etc. In the short term, one approach is to hold information sessions or distribute pamphlets on cultivating good home practices for children to low-income households. In the long term, we hope to extend such workshops to target expectant and new mothers so that the process of acquiring basic skills can start as early as possible. In addition, another idea is to partner with external trainers to conduct life skills camps for targeted upper primary students who are academically challenged, possibly because they may not have had the opportunity to fully develop their life skills previously.

82
Focus Group Questions
(Participants from VWOs) 1. How often/to what degree are you engaged with the parents of these children? Do you think you are able to mobilize them to take on a greater role in their children’s academic performance? 2. Do you have any goal setting exercises/motivation and self-discipline workshops for children currently? If so, how are they conducted and who are they conducted by? Are they effective?
• Do you have any in-house expertise to carry out these initiatives? • Who do you think will be able to help in these areas? • Do you prefer to conduct these programs independently or through
collaboration with other agencies? 3. If not, how receptive are you to implementing these exercises?
• What are some of your main concerns? • How much time would you be willing to spend to conduct these exercises
away from academic related classes? 4. Do you have any post-exams follow-up procedures currently? 5. Based on your experience, do you think students will be receptive to post-exam follow-up procedures? Do you have any ideas on how else we can motivate children besides holding motivational classes? 6. Understand that some of you have tuition programs staffed by volunteers. Who are these volunteers? What are the challenges working with these volunteers? What are some of the issues with the current tuition program? Are they effective? Do you think having a structured curriculum is better than providing homework support? 7. Have you ever thought of/had experience partnering businesses by promoting CSR projects to them? What do you think of the idea? What are some of your main concerns? What worked and what didn’t? 8. What is the age range of students that you work with? Are there possibilities for a cross-age peer mentoring program within your organization? 9. Another of our recommendation looks at organizing life skills camps for upper primary school students to build a sense of independence. Do you think a camp is beneficial in helping students build independence and problem solving skills? Do you have the expertise and manpower to organize such a camp? 9. Do you think it is plausible to target expectant and new mothers from low-income households in your communities? Do you think your organization has the capability to organize pre-school programs to equip young children with basic skills if their parents are unable to do so? 10. Given your current workload and resources, how many new initiatives do you think you can take on at a time? What would be a good timeframe to monitor progress?
83
(Parents) 1. Do you think that parents will be willing to attend workshops that teach you
• How to motivate your child based on effort instead of outcome? • How to cultivate good home practices from young? • Pre-school child development skills?
If so, how much time a week are you willing to spend on these workshops? If not, would you prefer to have access to the same information through pamphlets? 2. Are you comfortable with your child spending more time on such classes as compared to academic-focuses classes?


![INTERNATIONAL ORGANIZATION FOR · PDF file[SOURCE: ISO 22300] 3.6 . exercise annual plan . document in which the exercise policy plan has been translated to exercise aims, exercises,](https://img.pdfslide.net/doc/110x75/5a7c74d87f8b9a2e358cc3a7/international-organization-for-source-iso-22300-36-exercise-annual-plan.jpg)