Embed Size (px)
Citation preview
Clemson UniversityTigerPrints
All Dissertations Dissertations
12-2012
POLICY EVALUATION USING COST-BENEFIT ANALYSIS: EMPIRICALRAMIFICATIONS FOR TWO POLICY ISSUESElizabeth CrouchClemson University, [email protected]
Follow this and additional works at: https://tigerprints.clemson.edu/all_dissertations
Part of the Public Policy Commons
This Dissertation is brought to you for free and open access by the Dissertations at TigerPrints. It has been accepted for inclusion in All Dissertations byan authorized administrator of TigerPrints. For more information, please contact [email protected].
Recommended CitationCrouch, Elizabeth, "POLICY EVALUATION USING COST-BENEFIT ANALYSIS: EMPIRICAL RAMIFICATIONS FOR TWOPOLICY ISSUES" (2012). All Dissertations. 1060.https://tigerprints.clemson.edu/all_dissertations/1060
POLICY EVALUATION USING COST-BENEFIT ANALYSIS:
EMPIRICAL RAMIFICATIONS FOR TWO POLICY ISSUES
A Dissertation
Presented to
the Graduate School of
Clemson University
In Partial Fulfillment
of the Requirements for the Degree
Doctor of Philosophy
Policy Studies
by
Elizabeth Crouch
December 2012
Accepted by:
Dr. William Bridges, Committee Chair
Dr. Holley Ulbrich
Dr. David Lamie
Dr. Lori Dickes
Dr. Ken Robinson
ii
ABSTRACT
Using two distinct health policy issues my research examines the relevance and
ramifications of using cost-benefit analysis (CBA) to demonstrate real-world impacts of
the policies. My dissertation discusses how these two situations represent particular
challenges to cost-benefit analysis. The challenges have specific implications for how
scholars, agencies, and government entities should use CBA to evaluate policies.
Specifically, my research finds that by separating CBA into four different approaches, a
much more complete, and less assumption-laden, CBA can be accomplished.
iii
TABLE OF CONTENTS
Page
TITLE PAGE .................................................................................................................... i
ABSTRACT ..................................................................................................................... ii
CHAPTER
I. INTRODUCTION: THE FOUR TYPES OF COST-BENEFIT
ANALYSIS .................................................................................................... 1
II. A POLICY EVALUATION OF THE EXPANDED FOOD AND
NUTRITION EDUCATION PROGRAM ................................................... 31
III. AN EVALUATION OF THE POLICY IMPLICATIONS OF
IMMUNIZATION OF PRESCHOOL AGE CHILDREN .......................... 52
IV. CONCLUSIONS AND AREAS FOR FURTHER RESEARCH .............. 68
REFERENCES .............................................................................................................. 74
1
CHAPTER ONE
INTRODUCTION
THE FOUR TYPES OF COST-BENEFIT ANALYSIS
My research explores the potential policy repercussions of using cost-benefit
analysis (CBA) to evaluate two social issues: the Expanded Food and Nutrition Program
and child immunization. The primary objective of my research is to define several
different approaches to CBA. Hopefully these different approaches will provide policy
analysts “new and improved” insights into CBA, and these insights will result in better
policy evaluations and decisions.
Policy evaluation is a process that involves identifying the purposes of a program,
gathering information on the program’s costs and outputs, and evaluating the program
through various statistical techniques. Historically, policy evaluation has been based on
anecdotal evidence and thus, results have varied based on the bias of the evidence
(Anderson, 2006). In the last few years, however, systematic evaluation, which uses
social science methodology to measure the effectiveness of a program, has been
increasingly popular. Many different types of systematic evaluation have been done
(Rajgopal, 2002). The experimental design method, where program data are collected
before and program implementation, is a highly valid method. However, this method may
not be feasible because of the expense and time investment required. Thus, the quasi-
experiment method, where the treatment group is compared to a “control” group with
similar characteristics, is often used.
2
Rossi, Lipsey, and Freeman (2004) suggest four kinds of assessment that may be
appropriate at different stages of policy evaluation: the five-tiered approach, needs
assessment, cost-benefit analysis, and impact evaluation. My research utilizes CBA as
one of the four kinds of assessment suggested by Rossi, Lipsey, and Freeman.
The Role of Federalism in Policy
It often makes more senses to examine policy at the state level before
implementing and evaluating policy at the federal level. The implementation of policy at
the state level and the evaluation of the given policy can provide a plethora of
information to policymakers. States may be 1) an indicator for social problems or issues,
or 2) a laboratory for implementation of a policy in order to determine whether it will
work at the national level. Implementation at the state level can act as a laboratory where
policy evaluation components are built into new policies to increase the ease of
evaluation.
State level data may provide a better indicator of the magnitude of a problem in
various socio-demographic levels than federal level data, which may provide a weaker
signal. Inman and Rubinfeld describe economic federalism as “the most decentralized
structure of government capable of internalizing all economic externalities,” which grants
justifications to decentralization to the lowest levels of government. Economic federalism
further highlights the critical importance of economic efficiency. Inman and Rubinfield
argue that relatively small communities may be able to provide many public services
3
more efficiently and determine the needs and wants of the public better than any other
level of government. Oates (1994, p130) puts it even more clearly by arguing that
“tailoring outputs to local circumstances will, in general, produce higher levels of well-
being than a centralized decision to provide some uniform level of output across all
jurisdictions.”
With regards to policy implementation and evaluation, science-based research and
evaluation does not imply that there should be a national program that is the same from
state to state. State level research can help 1) identify states that are successful, and 2)
pair those states with other states that are similar in culture and participant demographics.
These pairings could refine provider and administrator education and performance,
leading to improved health outcomes.
Pressman and Wildavsky have noted that federalism can complicate
implementation. For many national policies, successful implementation requires
coordination and cooperation between national, state, and local agencies. There have
been a number of policy diffusion models that have examined the role of states as a
laboratory for policy innovation.
Ethical ramifications of policy analysis
As my or any other research draws conclusions about what the “correct” policy
decisions should be, it is important to emphasize that researchers have an ethical
obligation to the policy community and to consumers. Errors are always a reality, but
4
scholars should take every precaution to avoid pitfalls and maintain ethical integrity. One
of the major potential benefits of this research is that the policies examined here could be
used to help lift individuals out of the poverty cycle. The ethical obligation of
researchers is to err on the side of not making a type I error. A type I error would say that
a policy is ineffective when it has actually been very effective in improving the lives of
the nation’s citizens. It is perhaps better to err on the side of a type II error: stating that
the policy is effective when it is not.
Compensation from the Perspective of Three Ethical Schools
The biggest ethical issue associated with free markets in providing basic needs to
all citizens is equity. Democratic self-government, as in the United States, is designed to
try to be fair with hopes to also be efficient. When a project or program is implemented,
some individuals will be made worse off and some better off. When should
compensation be given to those made worse off by the implementation of social policy?
The three ethical schools all provide unique reasoning and answers.
Duty (Rule) Based Ethics:
Kantian ethics teaches us that we have a duty to do no harm, to only follow those
actions that we would be willing to have universalized as general principles. These
actions should be used to treat other people as ends in themselves, not as means to an
end. Thus, in public life, the rule of law (such as tort law, eminent domain law, social
5
security law, workman’s compensation law, and many other types) should be followed to
ensure that people are duly compensated for any harm they incur when a change occurs
(Sterba, 1998). Social contracts theorists would argue that compensation should be paid
to those whose welfare has been reduced under the rule of law. Rawlsian ethics asks us to
“hide behind the veil of ignorance” in making significant policy choices, ensuring that
society’s rules provide equality of opportunity and freedom. John Rawls argued that
“justice is the first virtue of social institutions” and thus it is more important than
generosity or compassion. Much earlier than Rawls, Plato wrote on the importance of
justice not just for individuals but also for government. John Rawls argues for strict
egalitarianism and equality of outcomes. He argues that we do not deserve rewards for
our behavior just because we were naturally given attributes that others may not have
(Rachels, 2003). Compensation should be paid to those whose welfare is reduced by the
program simply because that provides or restores equality of outcomes.
This duty-based ethics follows the rule of the difference principle. This principle
states that social and economic inequalities, such as those caused by program changes,
should be arranged so that they yield the greatest benefit to the least advantaged person.
Kantian ethics also calls for intergenerational equity. We have an obligation to make
sure that the next generation is not made worse off by our actions. Duty-based ethicists
argue that all generations should have the same rights to resources because of the
discounting of the future. CBA is not particularly intergenerational.
6
Virtue-Based Ethics:
Traditional virtue-based ethicists such as Aristotle claim that our goal should
always be to do the “right thing.” In other words, our motives for performing behaviors
matter. Virtue-based justice says that individuals who have been wronged should be
compensated. To these ethicists, the virtue of justice means trying to correct some
previous wrong. Edmund Burke believed that government officials must be motivated
outside of their office and must exhibit courage (Sterba, 1998).
The problem with virtue-based ethics is that virtues often conflict. If the measure
is loyalty and the policymaker’s constituents are harmed (through paying higher taxes)
when compensation is made to others, then the policymaker would be lauded for fighting
compensation in the interest of his or her constituents. But if, instead, the measure is
justice, praise would go to the policymaker who supported due compensation.
Outcomes-Based (Utilitarian) Ethics:
Utilitarian ideals are calculating, impersonal, and purely consequentialist. There
is no place in utilitarianism for “people’s idiosyncratic preferences, histories,
attachments, loyalties, or personal commitments” (Goodin, p. 8, 1995). A classical
utilitarian would argue that if an action results in the greatest good for the greatest
number, then it is the right action to follow. Utilitarians would claim that, “right actions
are the ones that produce the most good” (Rachels, 2007).
John Stuart Mill and Jeremy Bentham believed that the goodness of outcomes is
determined by the degree to which they secure the greatest benefit to all concerned. If
7
compensation to individuals made worse off by implementation of a project is going to
raise taxes for the majority of people, utilitarians would argue that the project should not
be undertaken based on the compensation principle. If the greatest benefit to all people is
to be able to rely on the government to make stable and predictable choices, but the
government makes unpredictable decisions that hurt people, then those who were made
worse off deserve compensation.
Goodin follows a utilitarian, outcomes-based approach to compensation and
redistribution. He argues that the practice of compensation is independent of any
judgment about the justice of the previous distribution pattern. He states that, “If we
think it is morally desirable to ensure that people are able to plan and organize their lives
in a sensible fashion, we must be systematic about both compensation and redistribution”
(Goodin, p. 227, 1995). Essentially, Goodin argues that people take into account the
current set of laws and systems when they make plans. He believes that people’s ability
to plan their lives is morally desirable. In certain situations, people should be able to
count on compensation if they are harmed. Compensation should be swift and certain so
that recipients can carry on their plans with minimum disruption from changes in policies
and programs. If the changes that occurred to reduce welfare were predictable and
expected, then Goodin believes people should not be compensated (Goodin, 1995).
8
Distributive Justice in Static and Dynamic Situations
Distributive justice with dynamic efficiency requires equality of outcomes.
Isbister (2001) asks: To what does moral equality entitle us? With regards to static
efficiency, he argues that we should provide equality in opportunities, but he realizes that
over time this equality in opportunities will lead to unequal outcomes, which will then
again lead to unequal opportunities. He says, “Even if a state of perfect social justice
could be achieved – that is, perfect equality of opportunity, it would be unstable; over
time it would descend into a state of unequal opportunity” (Isbister, p. 8, 2001). In the
little red hen example, if the other animals are too lazy to help, then they should get less
bread than the hen because they wouldn’t help her make it. But then the next generation
may be unable to help the hen make bread, as they are too weak and unhealthy due to the
decisions of their parents. Thus, Isbister illustrates that if we insist upon equality in one
dimension, we will inevitably get inequality in another dimension. When people are
given equal opportunities, they end up with inequalities in wealth because each has
different personal attributes that help or hinder success. Isbister argues that there is a need
for government intervention to provide goods and services when the private market fails
(Isbister, 2001).
Another problem of distributive justice is determining how much people are
willing to pay for something. The contingent valuation method used in traditional ex-ante
cost-benefit analysis poses hypothetical questions to people about how much they would
be willing to pay to prevent the loss of some particular object. This is troublesome as
9
contingent valuation has been used legally to measure the actual loss involved and an
indication of the culpability of the party (Sen 2000). Moreover, the formal theory of
traditional ex-ante cost-benefit analysis assumes that each individual has well-defined
preferences. This is not necessarily true. As well, traditional ex-ante cost-benefit analysis
weighs each individual’s preferences equally. It gives large weight to high-income
individuals who have a greater willingness to pay to accept or disregard policy changes.
The problem with this is the neglect of distributional issues, both in the form of attaching
the same weight one everyone’s dollars and in not attaching any weight to distributional
changes resulting from the program or project. In addition, it is difficult to get people to
reveal what they are really willing to pay, especially when the question is not followed by
an actual demand for that payment.
Benefits and costs of projects are often only given to individuals with standing in
society. The poor are often overlooked. The benefits described in traditional ex-ante cost
benefit analysis are often couched in general terms such as “growth,” with negative issues
such as environmental issues and congestion being overlooked. Often, analysts
overestimate benefits and underestimate costs. This is particularly true in the realm of
policy. Mistakes are made as analysts try to measure the benefits and costs of goods that
are not traded on the open market. It is often highly difficult to predict the ramifications
of a project. It is impossible to foresee the future and hard to predict how individuals will
respond to change. There may be random effects from a project, and thus broad
inference must be made.
10
Cost-benefit analysis
Cost-benefit analysis is based on the economic concept that optimal decisions
require the decision maker to determine the best use of limited resources among
competing uses (Levine, 1968). The main purpose of CBA is to assist in social decision-
making and to facilitate the best allocation of society’s resources. However, every
decision presents different issues and implications for how policy analysts use CBA.
Therefore there is not a “one-size-fits-all” CBA, but actually an array of CBA
approaches.
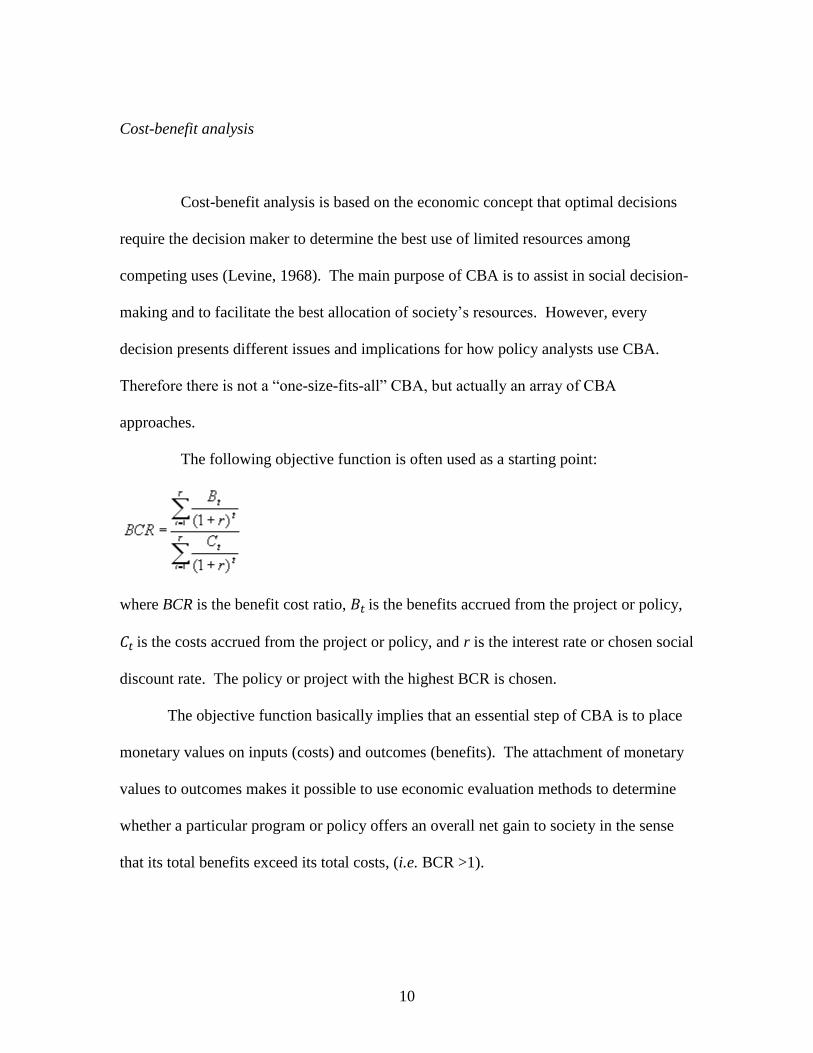
The following objective function is often used as a starting point:
where BCR is the benefit cost ratio, is the benefits accrued from the project or policy,
is the costs accrued from the project or policy, and r is the interest rate or chosen social
discount rate. The policy or project with the highest BCR is chosen.
The objective function basically implies that an essential step of CBA is to place
monetary values on inputs (costs) and outcomes (benefits). The attachment of monetary
values to outcomes makes it possible to use economic evaluation methods to determine
whether a particular program or policy offers an overall net gain to society in the sense
that its total benefits exceed its total costs, (i.e. BCR >1).
11
History of Cost-Benefit Analysis
CBA first became widely used in the United States during the Great
Depression. Under Franklin D. Roosevelt, massive public works programs were
undertaken in an attempt to spur economic growth. The National Planning Board, a board
set up to implement the New Deal, hired economists to study the economics of planning
public works. These economists recommended that the economic benefits provided by
public works projects be measured in monetary terms where possible (Hufschdmit,
1988). The question was how to value the social worth or the value of each of the
individual projects, and CBA offered a more satisfactory test of economic worth than had
previous methods.
Agencies routinely tried to calculate costs and benefits of their activities in
order to gain continued funding by Congress, especially since the federal court system
had begun mandating cost-benefit analysis in the 1960s. In 1936, the Flood Control Act
specified that projects should be undertaken if “the benefits to whomsoever they may
accrue are in excess of the estimated costs.” The work done by the United States federal
government in the ‘40s, ‘50s, and ‘60s extended the application of cost-benefit analysis
beyond water resources to many other public investment programs and to other countries.
The 1950s saw the first major economic critiques of CBA (Hufschdmit, 1988).
The problem is that no formal guidelines had been put forth for conducting analyses, nor
had there been precise definitions for benefits and costs. For example, is it better to
perform a CBA of a whole policy or to define all the specific projects involved, do CBA
12
for each project, and then “add up” the CBAs for each project to get the entire policy
CBA. Is the additive form even appropriate for CBA?
Since a 1981 presidential order, federal agencies have been required to use CBA
to evaluate past and future government regulations. Current governmental procedure to
evaluate regulations is based on private costs, which have no basis in modern applied
welfare economics (Hazilla and Kopp, 1990). As well, instead of using social costs
measured as compensating variations, as the theoretical literature proposes, federal
agencies use annualized engineering costs and consider operating and maintenance
expenses as equivalent to social cost. The assumptions underlying CBA must be
understood as well as the history of the use of CBA.
CBA Assumptions and Their Repercussions
CBA is a method of reaching policy decisions by comparing the economic costs
of doing something with its benefits; it is rooted in traditional neoclassical economics. It
sounds simple, but, in practice, it can easily become complicated and is much abused.
With careful selection of the assumptions used in CBA, it can be made to support or
oppose almost anything. This is particularly important when the decision being
contemplated involves some positive or negative externality that is not fully reflected in
the market price. Institutional economists criticize neo-classical economists for
neglecting institutions that affect political problems, enforcement problems, and
transaction costs that would arise when implementing a policy. These issues are almost
13
entirely overlooked when conducting traditional cost-benefit analysis. I will identify each
assumption made in cost-benefit analysis and demonstrate the flaws that are inherent
when neo-institutional economics is not considered.
Cost-benefit Analysis Assumption: Individuals are rational, self-interested
Socially Formed and Altered Preferences:
CBA has foundations in public choice theory, which begins with the critical
assumption that all individuals are driven by the goal of utility maximization (Buchanan,
1984). One of the first assumptions of cost-benefit analysis is that the individuals
involved are rational, self-interested individuals with stable and well-defined preferences.
This is not necessarily true. Contrary to a simplistic understanding of neoclassical
economic assumptions, self-interest does not necessarily mean selfish. Some economic
models in the field of behavioral economics assume that self-interested individuals
behave altruistically because they get some benefit, or utility, from doing so (Ariely,
2009). As well, behavioral economic literature recognizes that individuals often make
decisions that “satisfice” (satisfying utility preferences), rather than maximize their
utility.
Individuals have preferences and goals, but their preferences and goals are
influenced or constrained by others’ behavior; Schelling refers to this type of behavior as
contingent behavior (Schelling, 2006). Social norms are the behavioral expectations and
cues within a society or group. This sociological term has been defined as "the rules that
14
a group uses for appropriate and inappropriate values, beliefs, attitudes and behaviors.
Individuals conducting or evaluating cost-benefit analysis will take into account the
preferences of others and will be just as influenced by social norms as market norms such
as prices and wages. Furthermore, the preferences of individuals are subject to change
over time along with the preferences of the people with whom they associate (Ariely,
2009). While individuals may exhibit a preference for a certain policy or program to be
enacted at one point in time, that preference is just as likely to change over time as it is to
remain stagnant. This propensity to change challenges the foundation of cost-benefit
analysis. Preferences may change during the course of a project and may, in fact, be
influenced by the project itself. Thus, preferences are endogenous.
Cost-Benefit Analysis Assumption: Individuals Identify All Alternative Projects
Availability Heuristic:
Individuals do not have the cognitive abilities or the time to evaluate all options
when identifying alternative projects. The assumption that individuals identify all
alternative projects does not hold with neo-institutional economics. The availability
heuristic is a predisposition of people to base their judgments on the basis of information
that is readily available (Matzavinos, 2001). Often, analysts overestimate benefits and
underestimate costs. This is particularly true in the realm of policy. Analysts make
mistakes as they try to measure the benefits and costs of goods that are not traded on the
open market.
15
Bounded Rationality:
Bounded rationality is a theory of human decision-making that assumes that
people behave rationally, but only within the limits of the information available to them.
Humans make individual decisions that may appear to be irrational. The problem here is
that neither decision-makers nor analysts can handle comparisons among a large number
of alternatives, because resources and cognitive constraints exist. Thus, the bounded
rationality assumption of CBA is highly implausible. Williamson (1981, 553) argues
that, “Bounded rational agents experience limits in formulating and solving complex
problems and in processing information.” Without the ability to optimize utility in every
decision, individuals develop a set of second-best decision rules that result in their
making constrained decisions.
Credible Commitments:
Costs and benefits are evaluated by looking at the consequences of decisions; this
criterion allows the consequences to include happiness and fulfillment of desire as well as
whether certain actions have been performed. The problem with this approach is that
there is a lengthy tradition of taking a narrow view of what can count as consequences. In
addition, explicit valuation of all costs and benefits is difficult to conjecture; it involves
full explanation of the reasons for making a decision. Public decisions need to be explicit
as the demands of accountability apply to choices made by project and program planners
as well as those overseeing implementation (Sen, 2000), so the discrepancy between what
is needed and what is realistic can be vast.
16
Montzavinos discusses how economic growth occurs when governments establish
formal institutions that foster a credible commitment (p 245). One of the inherent issues
with policy implementation is that it is difficult to do. Administrations change and the
intended effects of the policy, as forecast by cost-benefit analysis, may not have time to
come to fruition. There are limits to the ability of governments to make credible
commitments (Stiglitz), which is sometimes a reason for policy failure.
Cost-benefit Analysis Assumption: Listing the physical impacts of the alternative
projects; predicting the impact of the project during the life of the project
Meta-Preferences: Formal and Informal Institutions (Social Norms) Matter:
An individual makes choices in a context of underlying meta-preferences, or
preferences about preferences – such as ethical values. As Mantzavinos (2001)
discusses, these meta-preferences influence choice sets. North (1990) states that the
consequent institutional framework limits the choice set of the actors. Mantzavinos
(2001, p.83) defines institutions as the “rules of the game” and organizations as
“corporate actors.” Individuals and groups of individuals establish solutions to common
social problems and realize social objectives through the institutional environment.
There is a decrease in costs when individuals have common rules to adhere to (Ostrom,
1990).
Given the cognitive constraints of individuals, Hayek (1960, p.66) argues that
rules (institutions) are the “device we have learned to use because our reason is
17
insufficient to master the full detail of complex reality.” Hayek also states that both the
formal and informal institutional environments complement each other to provide a
foundation of rules, norms, values, and conventions that society uses to manage and
achieve its goals and objectives.
According to Mantzavinos (2001), the informal institutional environment of a
society is composed of conventions, moral rules, and social norms. These institutions
emerge and persist for different reasons and in different ways, but in all societies the
informal institutional environment is equally important to, if not more important than,
formal institutions. However, rather than assessing their relative importance, it is more
instructive to uphold that formal and informal institutions complement and provide
structure for each other.
Path Dependency:
Path dependency means that where you have been in the past determines where
you are now and limits your options for where you can go in future. It refers to the way
in which apparently insignificant events and choices can have huge consequences for the
development of a market or an economy. Path dependency makes it difficult to consider
all unimplemented projects.
18
Cost-benefit Analysis Assumption: Choosing the social discount rate and complete
property rights.
Time inconsistent Preferences and Asymmetric Information:
Time-inconsistent preferences occur when individuals put too much weight on the
present when evaluating the costs and benefits of action (or inaction). The social
discount rate brings all past and future costs and benefits to the present. Choice of the
social discount rate for cost-benefit analysis is crucial. Subjectivity of the discount rate
leads to great inconsistency in the analysis of the efficacy of programs or agencies.
Because the analyst chooses the social discount rate, CBA is very susceptible to the bias
of the analyst.
Property Rights:
Property Rights are essential to a market economy. For a person to trade, he or
she must know that the person selling the good or service owns it and that ownership will
pass to the buyer. The stronger and clearer the property rights, the more likely it is that
trade will take place and that prices will be efficient. If there are no property rights
pertaining to something, there can be severe consequences such as overuse of a common
resource or negative externalities.
When conducting a CBA, researchers typically base decisions on the neoclassical
assumption that property rights are well defined and complete. Neo-institutional
economics recognizes that there will always be incomplete property rights (Barzel, 2002).
19
Actual property rights can be very different from perceived property rights. For example,
an individual may have the legal rights to property while not holding the ability to
capitalize on the property. In other words, the individual does not have the ability to
consume the property directly thus must consume it indirectly through exchange (Barzel,
2002).
Pros and Cons of Cost-Benefit Analysis
In my research, I used secondary data to conduct CBA. While secondary data is often
accessible and free to the general public, there are numerous challenges in using it. It
took long time periods for me to acquire secondary data. Federal data were obtained, but
not all that I needed were online or in readily readable formats. The secondary data
collected for my research were also two to five years old. It is difficult for policy-makers
to base decisions on research conducted with “old” data to solve current problems
(Young and Ryu, 2001).
There were advantages to using secondary data for my research. Data collected
for one purpose was used to answer questions about another research topic. As Young
and Ryu note, government-collected secondary data were reliably collected and validated.
As well, the fact that data were collected for a different purpose reduces the risk of it
being tainted by researcher bias.
20
Need for Other Types of Analysis besides Cost-Benefit Analysis
CBA is sometimes inadequate to meet the needs of policy analysis. There is often
a need for other types of policy evaluation in order to fully explain the policy
implications of an issue. The use of qualitative research methods to evaluate a policy can
provide unique and valuable insight that would otherwise be ignored with quantitative
research. Qualitative research helps us focus more on the individual rather than just the
collective. Qualitative research methods are often used “when the scientist is interested in
obtaining detailed and rich knowledge of a specific phenomenon” (Miller and Salkind, p.
143, 2002). Narrative research, ethnography, case studies, phenomenology, and
grounded theory research are all methodologies and techniques of qualitative research
that can be used to demonstrate the actual reality of the interviewee in a way that cannot
be stated in numbers or literal text (Miller and Salkind, 2002). Each of these five inquiry
approaches provides a systematic way to conduct qualitative research. Miller and
Salkind argue that qualitative research methods are not just another way to answer the
same research question that could be answered by quantitative research. Rather,
qualitative research methods offer a unique approach to answering new and different
types of questions.
From qualitative research information, researchers gain a stronger comprehension
of the audience for which a program is designed. Qualitative research may involve
collecting stories of experiences, understanding the experiences surrounding a
phenomenon, developing a theory grounded in data, describing or interpreting a culture
21
or single case, or developing an in-depth study of multiple cases (Miller and Salkind,
2002). The type of closed-ended questions used in quantitative analysis does not address
all potential costs and benefits that could become evident if qualitative research were
conducted.
There have been many insightful studies of policy formulation and evaluation that
have engaged in little to no statistical analysis. Quantitative analysis is not always as
precise as we might hope when it comes to statistical technique, data quality, or reliability
of results. Anderson argues that the idea that “policy analysis is worthwhile only when it
involves the analysis of quantitative data with statistical techniques… should be
resisted…there is no reason to assume that if something cannot be counted, it does not
count” (Anderson, 2011). The quality of the analysis, as well as the cautious and
thorough use of the data, is more important than whether or not quantitative analysis is
being used (Anderson, 2011).
Some policy initiatives have not lent themselves to scrupulous quantitative
analysis. Numerous attributes of social welfare, as well as economic regulatory policy,
are subject to such difficulties. The data gained through case studies, interviews, and
questionnaires often contain precious information which would not otherwise have been
provided to researchers (Anderson, 2011). At the same time, researchers using
interviews and case studies must be cognizant of the need to not ask questions that would
bias responses. Furthermore, the people being questioned may have their own agendas
and biases, so data gained from qualitative research must be checked against other
sources and used with care just as with quantitative research.
22
One of the first works published in the field of policy implementation was
qualitative research, a case study done by Pressman and Wildavsky: “Implementation:
How Great Expectations in Washington are Dashed in Oakland; Or, Why It's Amazing
that Federal Programs Work at All” (1973). Federal policy was initiated in Oakland,
California, to improve economic development. The authors examine the problems that
the EDA had in the Oakland case, analyze what happened to cause the program to mostly
fail, and provide insight into other policy implementation strategies. Their seminal work
is a great example of how qualitative research methods can be used to test and develop
new theories, provide contextual analysis of events, and deliver information to either
enforce current generalizations or demonstrate deviant examples of our theoretical
generalizations (Anderson, 2011).
Qualitative research provides an avenue to test theories and models and generates
richer and more fully developed descriptions of the target population (Brannen, 1992;
Thomas, 2006). Scholars often discuss the large divide between quantitative and
qualitative social science methodologies. In order to bridge this gap, numerous scholars
have advocated the use of quantitative and qualitative methods in tandem.
Methodological triangulation – where one method is used to complement the other – has
been touted since the 1970s (Denzin, 2004). The use of both qualitative and quantitative
methodology seems to give the most effective interpretation of the research. For
example, the majority of quantitative interviews typically contain at least one open-ended
question. Phone interviews could be conducted with qualitative research techniques such
as probing in order to gain more specific information than a typical quantitative interview
23
would garner (Grim, Harmon, and Gromis, 2006). Incorporating qualitative research
into policy analysis makes the results easier for a lay-person to comprehend. Some
stakeholders are more likely to respond to numbers while others are more likely to
respond when presented with qualitative interpretation (Grim, Harmon, and Gromis,
2006).
A Unique Approach to Cost-Benefit Analysis
Historically, no research has considered CBA as consisting of four cases. A
primary objective of my research is to define and consider four types of CBA: 1)
Traditional CBA Ex-Ante, 2) Traditional CBA Ex-Post, 3) Empirical Ex-Ante, 4)
Empirical Ex-Post. The varying assumptions and data requirements of CBA are to be
discussed in detail below in the following sections.
Traditional ex-ante cost-benefit analysis
Traditional ex-ante cost-benefit analysis occurs before policy-makers decide
whether or not to take on a proposed project. The first step is identifying the set of
alternative projects. The problem here is that neither decision-makers nor analysts can
handle comparisons among a large number of alternatives, because resources and
cognitive constraints exist. Thus, analysts must decide which benefits and costs should
be included, which means selection bias can be an issue. The next steps of traditional
24
cost-benefit analysis include listing the physical impacts of the alternative projects,
predicting the impact of the project during the life of the project, attaching dollar values
to the predicted impacts, aggregating the costs and benefits that arise over different years
by discounting the future benefits and costs to obtain their present value, and, finally,
choosing the social discount rate. The problems inherent in the assumptions of traditional
cost-benefit analysis, such as path dependency and availability heuristic, were discussed
earlier in this chapter.
Traditional ex-post cost-benefit analysis
Traditional ex-post cost-benefit analysis occurs after all the impacts of the
implemented project have been realized. The steps of ex-post cost-benefit analysis
involve the same steps as traditional ex-ante cost-benefit analysis except that this analysis
involves computing the net present value of each alternative. If the net present value is
greater than zero, the project exhibits positive returns.
As time (t) in the benefit-cost ratio formula increases, the variance of the estimate
of the present values of net benefits will decrease. It will never equal zero because
uncertainty, while reduced, is never gone. Error of traditional cost-benefit analysis can be
decreased by obtaining and estimating net benefits at different times. This will provide a
clue to the magnitude of the different types of traditional cost-benefit analysis forecasting
error. Furthermore, the market approach to traditional cost-benefit analysis provides
25
sensitivity to individual preferences, which is relevant for efficiency considerations (Sen,
2000).
Pros and Cons of Traditional CBAs
The pros and cons for traditional ex-ante and traditional ex-post CBA are
relatively similar. The only real difference is that fewer assumptions will be made about
impact in traditional ex-post, as more information is available to measure project impact.
Researchers might have survey results from the affected population to use to quantify
impact, rather than simply making assumptions based on how many people were affected.
The positive outcomes of both traditional analyses are numerous. Both types of
traditional CBA provide a starting point from which to begin the evaluation of a project.
Furthermore, both approaches force project advocates and opponents to provide
quantitative data to back up qualitative arguments. They are also useful because they
allow comparisons to be made between investments or projects. Since all investments are
evaluated using the same method, the comparison process is easier.
There are many disadvantages to traditional ex-ante and ex-post CBA. These two
approaches assume complete knowledge, requiring that each alternative project be
identified and known. The problem with this assumed completeness is that it is nearly
impossible to compare every alternative with every other, especially since so many
considerations are involved (see discussion of bounded rationality and availability
heuristic made previously in chapter). The presumption of full knowledge of the
26
consequences and alternatives is implausible. There are always going to be sources of
ambiguity, and these could have far-reaching effects (Sen, 2000).
Once costs and benefits have been defined, controversy arises over what type of
loss function to use for the computation of both. In statistics and decision theory, a loss
function maps an event onto a real number intuitively representing some “cost”
associated with the event. Additive accounting is the most common technique because it
is simple; it simply deducts costs from benefits. But multiplicative forms have also been
used (John Nash), and there has also been a strong case made for concave functions that
respond positively to benefits and negatively to costs (Kuhn-Tucker Theorem) (Baguley,
2004). The debate over what kind of algebraic form for the loss function to use for
calculating net benefits is a major challenge to using either type of traditional CBA.
An additional concern that ethicists have disputed is the fundamental utilitarian
assumptions of traditional ex-ante and ex-post CBAs which states that the sum of
individual utilities should be maximized because it is possible to trade off utility gains for
utility losses for others. In essence, ethicists are critical of the theory that many CBA
proponents advocate, that any policy that makes the economic pie larger should be
followed, without considering the distribution of those costs and benefits.
Furthermore, traditional ex-ante and ex-post CBAs are criticized for treating risks
to health and safety as commodities; they list all alternatives in terms of money, thus
treating all goods as replaceable with other goods (Graham, 1981). Traditional CBAs also
favor projects whose net present value is greater than zero, but use of the net present
value may not be the most efficient allocation of resources because the cost-benefit
27
analyst may not have taken all alternative projects into consideration (see discussion of
bounded rationality).
Bureaucrats and political processes have a big influence on traditional
approaches. This is not an ideal situation because political and bureaucratic actors,
especially policy entrepreneurs, tend to overestimate the benefits of their favored
alternative and underestimate the benefits of alternatives they do not favor for the sake of
convincing others to agree with them. As well, governments usually only include benefits
and costs to their residents, ignoring benefits and costs that occur in adjoining countries.
Traditional approaches are also very expensive. For example, in 1992, a traditional ex-
post cost-benefit analysis conducted to investigate the use of lead in gasoline cost the
EPA nearly $1 million.
Traditional ex-ante cost-benefit analysis has a unique problem with the Pareto
welfare criterion. The Pareto welfare criterion states that any given social policy cannot
be put into action unless at least someone will be made better off and no one worse off, or
unless those who are made worse off are compensated for their loss. Hubin (1994)
argues that because CBA is committed to the potential Pareto improvement criterion,
CBA does not give the appropriate consideration to distributive justice or
intergenerational equity.
A final issue in traditional CBAs is that there are numerous problems in
measuring gains – the value-added to stakeholders from the policy – and losses from the
negative impact. Individuals have different preferences, valuations of goods and services,
and opportunity costs; individuals also monetize impacts and choose discount rates
28
differently (see earlier discussion of meta-preferences). People typically want more
compensation for a loss (willingness to accept compensation for a proposed change-
WTA) than they would have paid for a gain (willingness to pay for a proposed change-
WTP) (Hubin, 1994). When compensating with money for a policy change, money may
not fully compensate the individual for losses that cannot be translated into monetary
terms (Goodin, 1995). Furthermore, happiness and utility are difficult yardsticks by
which to measure, and they vary from person to person.
Empirical (Regression) Approaches to Cost-Benefit Analysis
The empirical ex-ante and ex-post approaches involve isolating the population
that is going to be impacted by the policy and determining the true effect of the policy on
the population using statistical techniques, mainly through regression analysis. The
approach still asks whether the benefits of the policy at hand outweigh the costs. It also
asks, if a policy is to be put in place, how much implementation will be necessary? What
form of implementation should it take? How large scale should the policy be? These
approaches had not been implemented in many CBA studies.
One CBA that used the empirical ex-ante approach was “Regression modeling
and meta-analysis for decision making: a cost-benefit analysis of incentives in telephone
surveys” (Gelman, Stevens, and Chan 2003). It used regression techniques to measure
the relationship between the level of the incentive (the policy) on the x-axis and the
29
number of people taking a telephone survey on the y-axis. No other studies were
identified that used an empirical CBA approach.
Empirical ex-ante and ex-post cost-benefit analyses, or social return on
investment, are new ways of demonstrating the value of a policy. There are numerous
positives to the ex-ante empirical approach, and at first glance it appears to be a relatively
easy approach to take. The ex-ante empirical approach is also useful because it helps us
determine which among a series of responses a policy might impact, and it allows the
choice of which responses to target in order to garner the largest amount of impact.
The strength of the ex-post empirical approach is that it is able to quantify the
impact of the policy using statistical techniques. This leaves the analysis less room for
subjectivity than do traditional ex-ante and ex-post approaches. The biggest disadvantage
to the ex-post empirical approach is that it is extremely difficult to isolate the population
the policy has reached.
Cases Through Which to Test Cost-Benefit Analysis Approaches
My study uses two distinct cases, each of which has far reaching policy
implications. The chosen cases can be examined through either traditional or empirical
CBA. The first case, the Expanded Food and Nutrition Education Program, is a food
policy issue. Implemented in 1968, it has a long history and has only recently begun to
be evaluated. It also has wide breadth in that the federally funded program is
30
administered in nearly every state. It is supposed to lead to improvements in nutrition and
health, resulting in lower rates of cardiovascular disease, diabetes, obesity, etc.
Since its conception, there have been millions of participants in the EFNEP
program. There are large amounts of data produced by the Center for Disease Control on
the rates of different types of diseases and conditions over time. Data on the number of
participants and information on the socio-demographic characteristics of EFNEP
participants are also available. It appeared that this would be a relatively straightforward
situation in which to perform empirical ex-post CBA.
The second case involves public health. Child immunization is a public health
issue that has widespread ramifications on stability of a developed country. As children
are required in the United States to get immunizations before starting public education,
and the National Institute of Health does yearly surveys on childhood immunization and
therefore data were readily available on which children in the United States were getting
immunized. Billions of dollars in public and private funds are spent each year trying to
incentivize parental guardians to vaccinate their children. Numerous studies have been
done on the effects of policies to incentivize parents to vaccinate their children against
childhood diseases such as polio and the measles.
My study will attempt to evaluate each case using the four different types of
CBA. Ideally, the results will yield conclusions that can assist policy-makers in the
creation of legislation that will help the nation work through these complex social
problems.
31
CHAPTER TWO
A POLICY EVALUATION OF
THE EXPANDED FOOD AND NUTRITION EDUCATION PROGRAM
This chapter focuses on the effectiveness of one of the major nutrition policy
programs in the United States – the Expanded Food and Nutrition Education Program
(EFNEP). EFNEP is a federally funded program designed to help limited-resource
homemakers acquire the knowledge, skills, attitudes, and practices necessary for
establishing a sound diet for themselves and their families, with the long-term goal of
generally improved health and disease prevention. A major drawback to effective
evaluation of the policy is that the effectiveness is confounded with the implementation
of the policy.
Research on the role of implementation on policy effectiveness has a rich history.
In the 1970s, it became clear that implementation was a problem across all levels of
government. Implementation issues have historically been ignored in theories of
government action, but over time researchers have learned that agents do not always
perform as instructed, and scholars have found “that the consequences of even the best
planned, best supported, and most promising policy initiatives depend finally on what
happens as individuals throughout the policy system interpret and act on them”
(McLaughlin, 1987).
32
How the EFNEP program is implemented varies widely from state to state. The
role of implementation on policy effectiveness is very important in the context of EFNEP
for two reasons: first, it is very difficult to make policy implementation successful across
varying levels of government; and second, policy implementation and outcome success
depend on local and regional factors such as dedication, capability, and the intricacy of
institutions (McLaughlin, 1987). EFNEP is more successful in some states than others
due to local and regional factors. Extra funding to an institution can help a program’s
successful implementation, but dedication to the program is hard to legislate, so
determining which programs should receive funding is a complex challenge. While
EFNEP has received federal funding since 1968, an economic evaluation of the program
did not take place until 2002 (Rajgopal, 2002). The primary objective of my research is to
use different approaches to CBA to determine the actual benefit to individuals and
society of EFNEP. Before discussing the different types of CBA, I will clarify the
difference in CBA and CEA (cost-effectiveness analysis).
Quantitative Analysis of Health Policy Implementation and Evaluation: CBA v. CEA
There are two major types of quantitative analyses used to evaluate health policy:
cost-effectiveness analysis (CEA) and cost-benefit analysis (CBA). Cost-benefit analysis
is used less frequently in the health sector because many scholars are apprehensive about
assigning monetary value to the outcomes, quality of life (health) and life years, both of
which are highly subjective.
33
CEA compares different kinds of interventions in terms of the incremental cost-
effectiveness ratio (ICER). ICER is the net cost to achieve a given unit of health, such as
deaths prevented or life-years saved (Medeiros, Butkus, Chipman, Cox, Jones, and Little,
2005). CEA has become common in medical journals, but politicians in the United States
have shown little support for its use in funding decisions. As a result, economic
assessments of the performance of government programs are often of questionable
quality, not used by policy-makers, or not conducted at all. Additionally, lack of time
and funding for conducting these assessments and disincentives for sponsoring program
assessment can be barriers to nutrition program evaluation (Grosse, Teutsch, and Haddix,
2007). In order to understand best understand the use of CBA and CEA, a discussion of
the theory is needed.
Evaluation Theory
Researchers have traditionally assumed that the agents implementing and
receiving the nutrition policies of ENFEP are rational individuals who are trying to
maximize their own self-interests. In recent years, however, researchers have
demonstrated this assumption does not always hold. In order for EFNEP to be more
effective, policy implementers must realize the “bounded rationality” evident in their
audience. Many of EFNEP recipients are bound by societal constraints such as poverty
and limited education that may prove insurmountable when it comes to nutrition policies;
i.e., recipients may lack the skills to budget money, read food labels, and perform other
34
life skills that the EFNEP programming promotes. Since the 1980s, researchers
investigating EFNEP have found that many EFNEP recipients were indeed trying to
maximize their own self-interest but without the crucial realization that self-interest
included their health.
The fact that the effectiveness of EFNEP is confounded by the factors discussed
above makes it difficult to perform a proper assessment of EFNEP with CBA. This may
be one of the reasons that so little CBA of EFNEP had been done.
Traditional Ex-ante Cost-Benefit Analysis of EFNEP
For the traditional ex-ante CBA of EFNEP, direct benefits from the program will
be measured as costs avoided or delayed as a result of positive changes made by
participants. Indirect benefits will be measured as the monetary benefits accruing to
society on account of increased productivity of workers who have improved health,
longer life spans, and a reduction in lost work time. Some of the intangible or
immeasurable benefits from the program are employability, self-esteem, and quality of
life. The direct program costs are the actual expenditures for resources used in program
implementation, such as salaries, equipment, travel and materials. The indirect costs will
be measured as unintended expenditures such as value of participants’ time lost from
work and the cost of pain and discomfort that participants suffer (Rajgopal et al, 2002).
While economic evaluations of public health interventions had been taking place
for years in other health arenas, until 2002 there were no economic evaluations of
35
nutrition education policy. Researchers in Virginia decided to conduct a traditional ex-
ante CBA of Virginia EFNEP to clarify the health benefits potentially resulting from the
program. Before the Virginia study, the cost efficiency of the EFNEP program had not
been evaluated (Rajgopal et al, 2002).
A single measure of cost-effectiveness as net-present value was calculated in
addition to numerous other efficiency measures (Burney and Haughton, 2002). The
initial benefit/cost ratio of $10.64/$1.00 indicates that, for every dollar spent on the
Virginia EFNEP program, the potential exists that over 10 dollars may be saved in future
healthcare costs (Rajgopal et al, 2002, 34).
In 2002, Tennessee conducted a traditional ex-post CBA of the nutrition
education program EFNEP. This study was the first to use an experimental group as well
as a control group. Tennessee researchers found that subjects in both groups saved money
on average family food expenditures (Burney and Haughton, 2002). This study showed a
significant improvement in food resource management and nutrient intake for the
experimental group, which had received the EFNEP nutrition education, compared to the
control group.
No studies have been published that examine the retention of EFNEP lessons for
more than a five-year period. This limited time frame may fail to capture the long-term
costs and benefits that might alter the benefit/cost ratio. Additional CBAs of other
nutrition programs are needed to establish the monetary value of certain benefits such as
prevention of chronic disease.
36
Evaluation of the EFNEP program is especially important as this programming
addresses an underserved population that is more likely to have poor eating habits and be
at risk for a much higher incidence rate of chronic disease. In order to determine whether
EFNEP really can demonstrate benefits such as prevention of chronic disease, scholars
must continue to monitor participants. Long term evaluation will determine if the learned
nutrition behavior persists. A longitudinal study demonstrating the validity of the
EFNEP program among participants would also provide a stronger incentive to continue
the funding of this national program. There are differences in how the program is
administered in different states. The literature has yet to evaluate the federally funded
program as a nation, which is the gap that my research hopes to fill.
Traditional Ex-post Cost-Benefit Analysis
In order to conduct a traditional ex-post CBA for 2007-2009 federal data, my
research has followed the methodology set forth by the VA study (Rajgopal, 2002).
My first step was to identify behaviors taught in EFNEP that are assumed to
contribute to the delay or avoidance of diet-related chronic diseases and conditions that
are prevalent among low-income individuals. The direct tangible benefits of EFNEP are
characterized as dollars saved on healthcare costs by the assumed delay/avoidance of the
onset of chronic diseases and conditions.
EFNEP has been shown to have positive cost-benefit ratios based on potential
prevention of diet-related chronic diseases and conditions (Rajgopal et al, 2002). Many
37
of the practices learned in EFNEP change lifestyle choices that would otherwise have led
to hypertension, diabetes, or high blood pressure. Chronic diseases and health conditions
cost society an estimated $250 billion each year in medical charges and loss of
productivity. The degree to which these costs might be reduced by healthy eating
patterns cannot be calculated precisely. Nonetheless, numerous scholars such as
Dollahite and Hershey (2001) have estimated that a proper diet might forestall at least 20
percent of the annual deaths from heart disease, cancer, and diabetes. Other studies have
demonstrated that 50 percent of chronic disease mortality can be attributed to changeable
lifestyle factors, such as diet (United States Department of Health and Human Services,
1990).
The behaviors taught in EFNEP are designed to improve participants’ food
security, food resource management, and food nutrient value. EFNEP enrollees are
taught to make their own meals at home, avoid convenience store and fast foods, read
labels, etc. In order to measure whether these skills do in fact increase food security,
food management, and food nutrition value, the traditional ex-post CBA approach I will
take will be to test the mean change in pre- and post-scores on the EFNEP behavior
checklist. The food behavior checklist has questions related to food security, food
resource management, and food nutrition value (Radimer, 1990). A copy of this
checklist can be found at the end of this chapter.
38
Food Security in EFNEP
Adequate food security is defined as “access by all people to enough food for an
active, healthy life” (Campbell, 1991, 408), as well as the ability to acquire food in
socially acceptable ways (e.g., not through theft or begging). Food security means
having a diet with sufficient energy and nutritional quality to prevent malnutrition and
limited activity level. Previous approaches have demonstrated the effectiveness of
ENFEP implementation on food security, but only on the state level. This research will
utilize national data. The Dollahite (2001) study found that race/ethnic group, age, and
place of residence were significantly associated with change in food security score from
pre- to post-test. Graduates’ food security scores increased significantly over the scores
of terminated participants. This indicates that education can increase food security even
in the presence of economic limitations. My first formal research hypothesis is:
H1: If individuals participate in EFNEP, then graduates will experience greater
food security than non-EFNEP participant graduates.
Food Resource Management Component of EFNEP
One of the main purposes of the ENFEP program is to help people learn to utilize
their income in ways that maximize their food’s nutritional value. Previous studies, such
as a study by Hershey (2001), focused on evaluating the food resource management
success of EFNEP participants. Food resource management is the ability to compare
39
prices and plan ahead so as to avoid running out of food before the end of every month.
Food resource management is an important tool as many EFNEP participants are on food
stamps and often run out of food assistance funds by the end of the first week of the
month.
Researchers assume that before starting nutrition education programming through
EFNEP, most of these households were running out of food by the end of the month
because they had not learned the necessary skills. Hence, my next hypothesis is:
H2: If individuals participate in EFNEP, then participant graduates will experience
more food resource management success than non-EFNEP participant graduates.
Nutrient Uptake Component of EFNEP
Many participants in ENFEP do not understand how to monitor fat, salt, or sugar
intake. Many suffer from poor nutrition, either in the form of malnourishment or obesity.
Research shows that healthier nutrient intake leads to longer, more productive living.
Often, healthier nutrient intake is learned through engaging in better food shopping
practices, such as looking at nutrition labels or planning meals ahead of time. Before my
work, studies have shown that women who said they almost always used nutrition facts
on food labels had a much lower consumption of fat grams and higher consumption of
vitamins than those who did not or seldom used nutrition facts. Food shopping practices
can influence nutrient intake in low-income households and are key topics to nutrient
education (Murphy, 1998). As a result, it would be useful to determine whether receiving
40
an EFNEP education leads to healthier nutrient intake. Accordingly, my study
hypothesizes:
H3: If individuals participate in EFNEP, then participant graduates will engage in
healthier nutrient intake than non-EFNEP participant graduates.
Data Collection
My research utilizes national level EFNEP data collected from the federal EFNEP
headquarters in Washington, D.C. Currently, the ENFEP program operates in all fifty
states, as well as in American Samoa, Guam, Puerto Rico, and the Virgin Islands. The
goal of the program is for participants to be able to improve their diet, increase their
knowledge of essential human nutrition, increase ability to buy food that satisfies
nutritional needs, improve food production practice, and increase ability to manage food
budgets (United States Department of Agriculture, 2010).
My research focuses on adult, rather than younger, EFNEP participants. These
participants are low-income homemakers who are responsible for the planning and
preparation of their household’s food (State Extension Plan of Work, 1983). Participants
gain new skills in food production, safety, and sanitation. There are roughly 3,000
EFNEP participants per state each year (United States Department of Agriculture, 2010).
EFNEP is often delivered in a sequence of ten to twelve lessons over several
months. The program is delivered by county extension and consumer professionals who
train the peer educators and volunteers who teach the EFNEP lessons. Since the peer
41
educators are normally located in the same or nearby communities as the program
attendees, EFNEP referrals are often made from current or previous participants, as well
as local schools, churches, health centers, non-profits, and government assistance
programs. Program instruction varies by state but includes and is not limited to:
mailings, mass media efforts, and direct teaching in groups or one-on-one (United States
Department of Agriculture, 2010).
The time period for my study is 2007-2009. The response variable used to
measure EFNEP success was the food behavior score number of the participant. The
predictor variable was EFNEP intervention (pre and post). The behavior score was based
on the self-reported items from a federally mandated EFNEP Food Behavior Checklist.
The checklist uses ten questions designed to evaluate food resource management, food
safety, and nutrition practices. Each question is answered on a 1-5 scale: 1= Do not do,
2=Seldom, 3= Sometimes, 4= Most of the time, 5=Almost always. The food behavior
checklist is measured pre- and post-policy. The three hypotheses were addressed by
comparing the means of participants test scores pre- and post-EFNEP.
There are actually three different statistical approaches to comparing pre- and
post-test means while correcting for differences among participants and co-variation of
pre and post results within a participant. First, a dependent T-test could be computed.
Second, a two-way Analysis of Variance with factors of participant and time could be
computed. Finally, regression analysis could be used to regress the test scores onto
dummy-coded variables for participant and time. Of these three approaches, this study
uses the dependent t-test approach. The statistical significance level is set at α < 0.05.
42
Hypothesis 1 utilizes the responses from question 3 on the survey: “How often do
you run out of food before the end of the month?” Hypothesis 2 utilizes the responses
from question 1 on the survey: “How often do you plan meals ahead of time?”
Hypothesis 3 utilizes the responses from question 9 on the survey: “How often do you
look at food labels?” These were chosen by the preeminent Virginia EFNEP study
(through factor analysis and consultation with medical experts) as questions that best
answered the hypotheses given.
Data Analysis
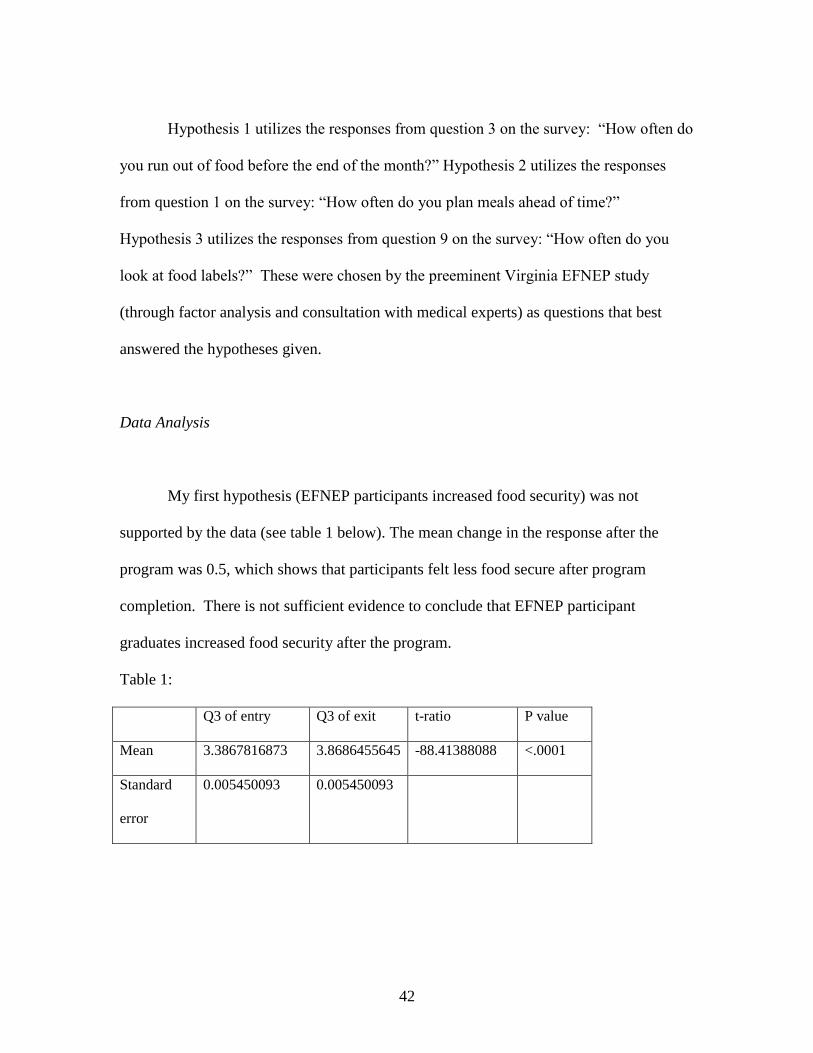
My first hypothesis (EFNEP participants increased food security) was not
supported by the data (see table 1 below). The mean change in the response after the
program was 0.5, which shows that participants felt less food secure after program
completion. There is not sufficient evidence to conclude that EFNEP participant
graduates increased food security after the program.
Table 1:
Q3 of entry Q3 of exit t-ratio P value
Mean 3.3867816873 3.8686455645 -88.41388088 <.0001
Standard
error
0.005450093 0.005450093
43
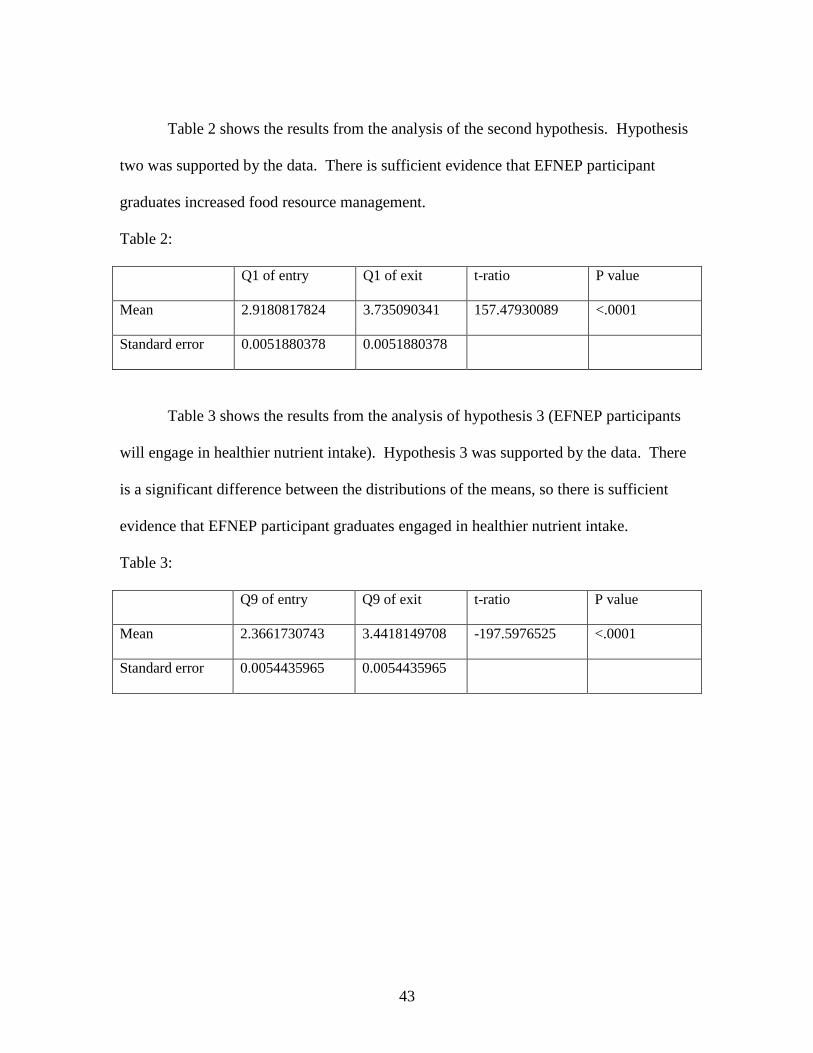
Table 2 shows the results from the analysis of the second hypothesis. Hypothesis
two was supported by the data. There is sufficient evidence that EFNEP participant
graduates increased food resource management.
Table 2:
Q1 of entry Q1 of exit t-ratio P value
Mean 2.9180817824 3.735090341 157.47930089 <.0001
Standard error 0.0051880378 0.0051880378
Table 3 shows the results from the analysis of hypothesis 3 (EFNEP participants
will engage in healthier nutrient intake). Hypothesis 3 was supported by the data. There
is a significant difference between the distributions of the means, so there is sufficient
evidence that EFNEP participant graduates engaged in healthier nutrient intake.
Table 3:
Q9 of entry Q9 of exit t-ratio P value
Mean 2.3661730743 3.4418149708 -197.5976525 <.0001
Standard error 0.0054435965 0.0054435965
44
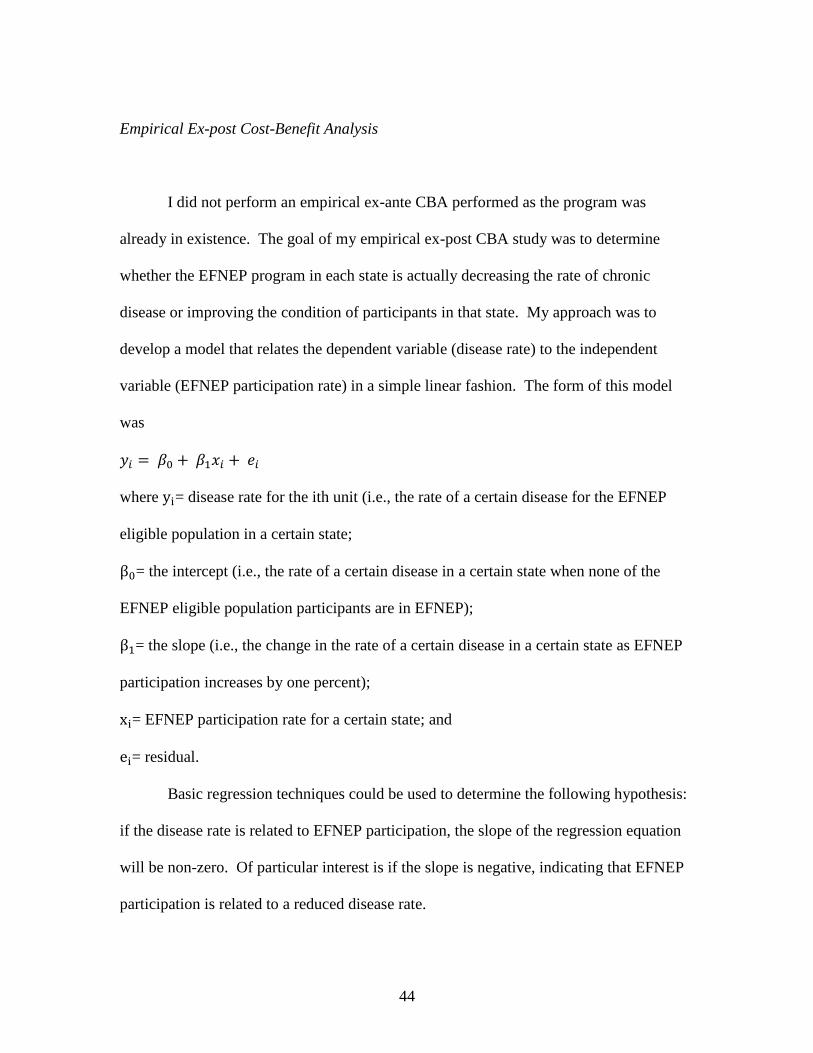
Empirical Ex-post Cost-Benefit Analysis
I did not perform an empirical ex-ante CBA performed as the program was
already in existence. The goal of my empirical ex-post CBA study was to determine
whether the EFNEP program in each state is actually decreasing the rate of chronic
disease or improving the condition of participants in that state. My approach was to
develop a model that relates the dependent variable (disease rate) to the independent
variable (EFNEP participation rate) in a simple linear fashion. The form of this model
was
where = disease rate for the ith unit (i.e., the rate of a certain disease for the EFNEP
eligible population in a certain state;
= the intercept (i.e., the rate of a certain disease in a certain state when none of the
EFNEP eligible population participants are in EFNEP);
= the slope (i.e., the change in the rate of a certain disease in a certain state as EFNEP
participation increases by one percent);
= EFNEP participation rate for a certain state; and
= residual.
Basic regression techniques could be used to determine the following hypothesis:
if the disease rate is related to EFNEP participation, the slope of the regression equation
will be non-zero. Of particular interest is if the slope is negative, indicating that EFNEP
participation is related to a reduced disease rate.
45
Previous traditional ex-ante and ex-post cost-benefit analysis studies of EFNEP
suggested that EFNEP instruction should result in the decrease or prevention of various
chronic diseases in the participants, but the only measurement used was the behavior test
score. Therefore, an important step in increasing the efficacy of empirical ex-post CBA is
to determine valid and reliable measures of participation (the percentage of eligible
people in the state who participated in EFNEP) and chronic disease rates in EFNEP
eligible populations (the percentage of people who have the chronic disease in question
who were eligible for and participated in EFNEP). Finding valid and reliable data on
these variables for this study proved extremely difficult. While the number of EFNEP
participants in each state is readily available, information on the total number of
individuals eligible for EFNEP is unavailable.
Definitions of poverty vary widely among states, the common thread being that
participants are living in poverty. Therefore the first step was to use the CDC’s
Behavioral Risk Factor Surveillance System to measure the number of individuals
eligible for EFNEP. The state of Iowa targets “low-resource individuals with children
under the age of 10” for participation (Iowa EFNEP Website). The state of Connecticut
targets “families with young children with incomes at or below 125% of the federal
poverty level or with other resource limitations such as poor housing, inadequate access
to food, limited reading skills, or physical disability” (Connecticut EFNEP Website).
Ultimately, this step did not work well because eligibility through poverty hinges on
several aspects beyond income alone.
46
A second step was to use the United States Census Bureau Current Population
Survey Annual Social and Economic Supplements from 2005 and 2006 and the American
Community Survey of 2005. The Census Bureau provides the percentage of individuals
living in poverty categorized by state. The Census Bureau uses a set of income
thresholds that vary by family size and composition to determine who is in poverty.
If a family's total income is less than the family's income threshold, then that
family and every individual in it is considered to be living in poverty. The official
poverty thresholds do not vary geographically, but they are updated for inflation using
Consumer Price Index (CPI-U). The official poverty definition uses income before taxes
and does not include capital gains or non-cash benefits (such as public housing,
Medicaid, and food stamps) (United States Census Bureau, 2005). The Census Bureau
data provides poverty as a percentage for each state in 2005. The number of people in the
state was then multiplied by the percentage in poverty to estimate the number of eligible
people in poverty in each state in a given year. From there, the number of participants in
EFNEP each year was divided by the number of people in poverty in the state to estimate
the independent variable (the percentage of people in poverty who participated in
EFNEP).
The next step to determining the potential EFNEP population was to use the
population of people in each state who are Medicaid recipients. Medicaid is health
insurance that helps many people who can't afford medical care pay for some or all of
their medical bills. Medicaid is available only to people with limited income, and thus it
is a good proxy for the EFNEP-eligible population in each state (United States
47
Department of Health and Human Services, 2011). It was easy to find data for the
percentage of people in each state who are on Medicaid. That percentage was then
multiplied by the total population in the state to get the number of Medicaid recipients.
My study uses the number of people in EFNEP in the state divided by the number of
people in Medicaid, which is thought to be a good estimate of EFNEP percentage.
Finding valid and reliable dependent variables (the rate of diagnosis of the chronic
disease) eligible for EFNEP also proved difficult. My first step for finding valid and
reliable dependent variables was to multiply the chronic disease diagnosis/incidence rate
by the number of people in poverty in the state to get the number of people EFNEP
eligible who would get a certain chronic disease. This step did not work because there
was too much variation. My second step was to assume that the incidence/diagnosis rate
for each chronic disease or condition was the same for the poverty/low-income
population of the state as the general population of the state.
My next step was to determine if the simple model could be improved by
including other independent variables to reduce errors and missing variable bias. The
independent variables considered to improve the model can be divided into three basic
categories. The first category is access to healthcare in the state, with variables of
percentage growth in healthcare spending, federally qualified health centers, healthcare
employment as a percentage, healthcare spending as percentage of Gross State Product,
healthcare spending per capita, registered nurses per 100,000 people, and the percentage
of health expenditures on hospitals.
48
The second category is wealth or lack of wealth in the state. The variables used to
measure wealth or lack of included the uninsured poor, the percentage of people who
could not see a doctor because of cost, dentists per 1,000 people, retail drugs filled per
capita, the number of people in the population who are underserved, the infant mortality
rate, fruit and vegetable consumption, preterm birth percentage, uninsured population,
and life expectancy.
The third category is the level of healthcare education that the people in the state
obtained. The variables used to measure healthcare education include poor mental health
as a percentage of the population, overweight children, adults who exercise, smokers, and
teen birth rate. All independent and dependent variables were collected from either the
Kaiser State Health Facts website or the Center for Disease Control.
The independent variables were also crossed with the EFNEP participation rate
(i.e. interaction) to allow for changes in the relationship of EFNEP and disease as the
additional independent variables changed. For example, if the importance of EFNEP
increases as the value of an independent variable decreases, then the two variables should
probably form an interaction term. The only disease rate that was significantly related to
the EFNEP percentage was obesity. EFNEP was only significant if the model included
additional terms and interactions.
Finally, the models should be compared over time and not just across states (i.e.,
longitudinal modeling). This approach made many regression assumptions including
normality, stable variance, and independent errors.
49
Conclusions
The traditional ex-ante and ex-post approaches are easy to argue for, as they show
the importance of EFNEP. The empirical ex-post approach has proven a much more
difficult approach to take to demonstrate the importance of EFNEP. Finding valid and
reliable independent and dependent variables was difficult, as was developing a model
incorporating other independent variables, interactions, and time.
My study demonstrates a positive cost-benefit ratio for the federal EFNEP
program. This indicates significant returns from dollars spent on the EFNEP program.
The sensitivity analyses show the range of the cost-benefit ratios to some of the
assumptions, and the estimates agree with the high figures found by the Virginia EFNEP
study ($10.64/$1.00). Finding a favorable benefit/cost ratio lends weight to efforts to
increase funding for such nutrition education programs in order to ultimately achieve
savings in healthcare costs.
Further policy research should also take into account issues of distribution of
benefits and costs. In a wealthy and developed country such as the United States, poor
nutrition is nearly always associated with financial constraint. Many nutrition scholars
argue that policy not only needs to be cost-effective, but also must reach underserved
populations. Many nutrition programs have not yet been evaluated on these criteria.
Research on the effectiveness of programs such as EFNEP is one way to ensure
that social assistance programs serve the needs of those who suffer food insecurity. Also,
the consequences of food insecurity such as malnutrition and mental well-being reduce
50
the individual’s ability to be a productive member of society individuals are able to make.
Obesity, for example, is a national issue right now, yet many Americans do not
understand that malnutrition in an industrialized, developed society includes a much more
complex set of issues and consequences than it does in a society such as Ethiopia, where
food is legitimately scarce. In the United States, an individual can be “obese and
undernourished in terms of micronutrients at the same time” (Graham 1985).
Finally, the opportunity cost of policy is the value of other programs and services
foregone by the use of the taxpayers’ monetary and physical resources. For example, a
potential health policy might not be funded because financial resources were given to
another program with more prominent interest groups. More CBA should be performed
in response to health policy analysis (Grosse, Teutsch, and Haddix, 2007). Making
assumptions explicit and developing the epidemiologic, statistical, and economic capacity
to prepare the analyses can lead to more informed decisions, with increasing capacity
leading to better policy decision-making by policy creators over time.
The results of my study are particularly relevant in today’s political climate due to
increased general awareness of healthcare costs. Further policy research should also take
issues of distribution of benefits and costs into account.

51
EFNEP Behavioral Checklist
52
CHAPTER THREE
AN EVALUATION OF THE POLICY IMPLICATIONS OF
IMMUNIZATION OF PRESCHOOL AGE CHILDREN
Immunizations have historically been an important component of healthcare for
children in the United States, but the cultural consensus that immunizations are good for
children has been eroding. Two important factors in this erosion are 1) many families are
no longer personally acquainted with mortality of the diseases the immunizations prevent,
and 2) certain organizations have publicized potential negative health consequences of
immunization for children. The consequence of this erosion is that immunization rates
among preschool-age children have been falling. It has been estimated that fewer than 50
percent of two-year-olds in the United States are fully immunized against deadly
childhood diseases such as measles, polio, mumps, rubella, tetanus, and whooping cough
(Khaleghian and Gupta, 2005). The 1989 measles epidemic occurred in areas of the
country where the percentage of fully vaccinated children was only 17 percent (Forbes,
2005).
Both outcome- and behavior-based policies have been utilized as a means to
increase the immunization of preschool-age children in the United States. For example, a
child must receive a list of immunizations prior to attending public pre-school or any
grade higher. However, because of loopholes and lack of compliance, this policy does
not result in all public school children being vaccinated (Forbes, 2005). The question
53
remains: what is the best policy for the government of the United States to use in
increasing the percentage of immunized children?
An overall objective of this chapter is to use CBA to evaluate how efficient
immunization policies are in increasing immunization percentages. However, to use
CBA, immunizations must be defined in economic and policy terms. The following
section discusses immunization in terms of 1) a public good, 2) a policy issue, 3)
principal-agent applications, and 4) pay for performance contracts.
Public Good Characteristics of Immunizations
A public good is both non-rival, i.e. consumption by one person does not restrict
consumption by another, and non-excludable, i.e. the benefits of the good accrue to the
entire population and cannot be restricted to a particular individual or group. Vaccination
coverage of children has an important public good dimension, because one child’s
immunization precipitates health benefits for others (Khaleghian and Gupta, 2005).
Immunizations are a merit good – having both public and private good
characteristics – and this has a large impact on how they should be financed and
delivered to society (Zhou et al, 2005). Merit goods are goods that everyone should have
regardless of ability to pay. Incentives for development of vaccines are needed for
research and development to occur because providers will not recoup the true marginal
costs. Families also have disincentives to bear the time and monetary cost of vaccination:
those choosing not to immunize reap the benefit of protection created by those who do,
54
but the greater the number of unvaccinated children, the greater the chances of disease
transmission (Zhou et al, 2005). Public financing and provision help to overcome these
problems and ensure an optimal level of service delivery.
Despite the recent public exposure to the “dangers” of immunizations by
celebrities such as Jenny McCarthy, experts in the field of health have very little
disagreement about the benefits of immunizations. Demand for vaccinations is very
weak in comparison to other public health initiatives, because media coverage has
increased the concern over the side effects of immunization and led to decreases in
vaccination coverage rates, especially in the United States and Sweden (Gauri and
Khaleghian, 2002).
Policy Theory
The quality and quantity of vaccine coverage to the public relies on the monetary
and political resources of different interest groups and political actors. The institutional
setting in which policymakers work affects the success of the coverage rates. In this
political economy framework, institutions and other “rules of the game” determine the
objectives of policymakers and thus determine the flow of resources. However, this
framework fails to explain the role of institutions in disseminating knowledge and
motivating political actors and policy entrepreneurs. The dissemination of knowledge
and the motivation of policymakers are vastly important as vaccination coverage is an
55
area where consumer demand is low and healthcare provide incentives are poor (Gauri
and Khaleghian, 2002).
Government policymakers need to understand: establishment and dissemination
of disease-burden data, vaccine effectiveness, assurance of adequate vaccine supply, and
the creation of funding to supply the vaccines to low-income and underdeveloped areas
(Gauri and Khaleghian, 2002).
The United States government has made numerous policy decisions to increase
immunization coverage. In 1955, soon after the polio vaccine was approved, Congress
passed a law to expedite state purchases of the vaccine. The Kennedy Administration
launched the Immunization Assistance Act of 1962, which provided federal support to
state and local immunization programs that vaccinated for polio, diphtheria, pertussis,
and tetanus (Hinman, 2005). The United States government began to purchase large
amounts of vaccines in the 1960s to lower the cost of vaccines to state and local agencies.
In 1972, the Public Health Service Act provided grants to state and local governments for
immunization development, and by the late 1980s childhood immunization rates had
reached 83% (Johnson et al, 2000).
The initiative to set national vaccine policy involves multiple agencies, including
the National Institute of Allergy and Infectious Diseases, Food and Drug Administration,
National Immunization Program, and the Advisory Committee for Immunization
Practices (Hinman, 2005). The passage of the Vaccines for Children (VFC) program in
1993 guarantees federally purchased vaccines to more than 10 million children
nationwide (Hinman, 2005).
56
The Costs and Benefits of Childhood Immunization through the Four Approaches
Traditional Ex-ante CBA:
Traditional ex-ante cost-benefit analysis occurs before a decision is made about
whether or not to invest in a proposed policy. It involves a number of steps, each of
which has its challenges. The first step involves identifying the set of alternative policies
that could be implemented instead of the proposed policy. It is very difficult to identify
all of the alternative immunization policies that could be put into place. The subsequent
steps, listing the physical impacts of the alternative projects, predicting the impact of the
project throughout its lifespan, attaching dollar values to the impacts predicted, and so
forth are problematic in the real world as costs and benefits are often timely and
expensive to determine. Finally, the potential Pareto societal welfare criterion is nearly
unreachable in government policy as many policies end up becoming redistributive in one
form or another.
The federal government has played a central role in the effort to increase
vaccination of children and decrease vaccine preventable childhood diseases. Spurred by
the polio epidemic, government officials conducting traditional ex-ante CBA argued that
short-term costs would turn into long-term savings. The studies emphasized the positive
effects of vaccine coverage and began to subsidize the dissemination of vaccinations for
diseases like polio (Johnson et al, 2000).
Numerous traditional ex-ante CBAs have been completed in the last sixty years
due to the deep public investment in the national immunization system. These analyses
57
have shown that public good properties characterize vaccines. Vaccines are going to be
under-produced and incentives for development of vaccines will be needed for research
and development to occur. Agencies such as the Center for Disease Control have
numerous policy researchers working to demonstrate positive cost-benefit ratios in order
to continue to assure funding.
Traditional Ex-Post CBA:
Traditional ex-post CBA occurs after the impacts of the implemented project have
been realized. The steps of ex-post CBA are the same steps as traditional ex-ante CBA,
with the same issues, except that this analysis also involves computing the net present
value of each alternative. If the net present value is greater than zero, the project exhibits
positive returns. The main challenge of performing ex-post traditional CBA with
immunization policy is valuation of health and safety. Health and safety are treated as
commodities. These approaches list all alternatives in terms of money, which treats all
goods as replaceable by other goods (Graham, 1981). Addressing this challenge is a
critical component of this research study.
One of the big challenges of ex-post, as well as ex-ante, traditional CBA is
bureaucratic and political influence. Politicians, bureaucrats, and policy entrepreneurs
often overestimate the benefits of their favored policy and underestimate the benefits of
policies they do not favor. Thus, those in favor of continuation of current immunization
policy would overestimate the positives of immunization policy that promotes those
58
ideals and underestimate those of the immunization policies that reinforce opposing
ideals.
Almost every society holds that the provision, requirement, and enforcement of
vaccinations are tasks for the government. Societies hold this notion because vaccines
are under-provided and subject to the free-rider effect. Vaccination provides a positive
externality. This means that benefits are accrued to all members of society when more
members of that society get vaccinated against disease. The costs of the major six
childhood vaccinations are relatively low, less than a $1 per fully immunized child.
Thus, nearly all ex-post traditional CBAs have demonstrated the value of government
subsidization and provision of vaccines. Ex-post traditional CBAs show that vaccination
availability has a positive effect.
Empirical ex-ante CBA
My approach of empirical ex-ante CBA was to determine the probability of a
preschool-age child being fully vaccinated based on various demographic and
socioeconomic variables. If it can be shown the probability is high, then this can be taken
as evidence that the immunization policy is effective. The National Immunization Survey
(NIS) is conducted by a subdivision of the Center for Disease Control (CDC) as part of
the Childhood Immunization Initiative (CII). In 1992 this initiative was established to
reduce the cost of vaccines, increase vaccine usage, improve delivery of vaccines to
children, and enhance awareness of vaccination and its benefits. The data used was only
59
for the year 2007, as the composition of the geographical areas that the CDC surveyed
changes from year to year.
The NIS uses a random digit dialing (RDD) telephone survey to identify
households containing children in the target age-range and interviews the adult who is
most knowledgeable about the child’s vaccinations. With consent of the child’s parent or
guardian, the NIS also contacts (by mail) the child’s healthcare provider(s) to request
information on vaccinations from the child’s medical records. Samples of telephone
numbers are drawn independently for each calendar quarter within selected geographical
areas, or strata.
In 2007, there were 64 geographic strata for which vaccine coverage levels can be
estimated, including 14 primarily urban city/county areas (including the District of
Columbia). The remaining 50 are either an entire state or a “rest of state” area. This
design makes it possible to produce annual estimates of vaccination coverage levels
within each of the 64 estimation areas with a specified degree of precision (a coefficient
of variation of approximately 7.5 percent). Further, by using the same data collection
methodology and survey instruments in all estimation areas, the NIS produces
comparable vaccination coverage levels among estimation areas and over time.
For the 2007 NIS, the household interviews began on January 4, 2007 and ended
on February 14, 2008. Provider data collection extended from February 2007 to April
2008. A total sample of approximately 4.5 million telephone numbers yielded household
interviews for 24,807 children, 17,017 of whom had provider data adequate to determine
whether the child was up-to-date with respect to the recommended immunization
60
schedule. The 2007 NIS public-use data file contains data for the 24,807 children with
completed household interviews, and more extensive data for the 17,017 children with
adequate provider data (including 128 zero-shot children).
The design and implementation of the NIS sample involve four procedures. First,
statistical models predict the number of sample telephone numbers needed in each
estimation area to meet the target precision requirements. Second, the sample for an
estimation area is divided into random sub-samples called replicates. By releasing
replicates as needed, it is possible to spread the interviews for each sampling area evenly
across the entire calendar quarter. Third, an automated procedure eliminates a portion of
the non-working and non-residential telephone numbers from the sample before the
interviewers dial them. Fourth, the sample telephone numbers are matched against a
national database of residential telephone numbers in order to obtain usable mailing
addresses for as many sample households as possible. To promote participation in the
NIS, an advance letter is sent to these addresses approximately two weeks prior to the
household interview. My data can be found and my study replicated through the NIS site.
The probability of immunization depends on a number of factors. The
methodology taken here is to develop a model that relates the probability of a preschool
age child being fully vaccinated (as verified by their vaccination provider) to several
demographic factors. Logistic regression is used to analyze the model and determine
which factors have a significant relationship to the probability of immunization. Higher
birth order of a child is a factor highly correlated with full immunization status. The
more children in the family, the less likely the later born children will receive their
61
childhood immunizations (Steele, 1996). Also, the benefits of immunizing another child
are reduced as more children are immunized. Children born into large families have a
low vaccination uptake (Levine, 2011). Thus, I included a variable in the logistic
regression model for first born child versus others, FRSTBRN.
I include healthcare coverage in my model, as many children in the United States
lack medical insurance (Zhou, 2005). The ‘free’ clinic option often involves opportunity
costs that low-income families are not worth taking, such as parental time off from work,
long waiting lines, and long travel time to a ‘free’ clinic. There are various types of
health insurance offered in the United States ranging from employer, Medicaid, SCHIP,
Indian health insurance, or military. Thus, various types of health insurance were
grouped into one variable called OVERINS which is equal to one if the child had some
form of insurance, zero otherwise.
Poverty status is also included in the model, as income and wealth are influential
due to that fact that the health service fee may pose too large of a burden on lower
income families (Levine, 2011). Those who are unwilling or unable to pay for vaccines
via their own means or healthcare coverage will not receive them. In a study of a 12-
county area of China, greater access to immunizations by means of lower fees and more
immunization days were found to be significantly related to a higher rate of immunizing.
A study done in India determined that many children were only partially
immunized because the parents were so engaged in livelihood activities (Zhou, 2005). A
recent Medicare study found that “more education, higher income, more knowledge
about and positive attitudes toward immunization, and health insurance” are all correlated
62
with higher rates of immunization (Levine, 2011). Income level is designated by variable
INCPOV1, which has three categorical values. A variable equal to one, corresponds to
those above poverty and having annual greater income than $75,000; equal to two, those
above poverty but below $75,000; and equal to three, those who are below poverty level.
I broke the data into four census regions with variable CEN_REG. The Northeast
region of the United States is region1; region 2 is the Midwest region; region 3 is the
South; and region 4 is the western portion of the United States. Immunization scholars
have found immunization uptake varies by region (Levine, 2011).
In China, the gender of the child is highly important. Boys are more likely to be
vaccinated than girls, probably because of the cultural idea of men continuing the family
line. Men also are needed in rural areas for farming in China, so this gender effect will
most likely be larger in rural areas (Zhou, 2005). A similar study conducted in Malawi
demonstrated that girls are less privileged in terms of accessing social services, which
include health and education (Steele, 1996).
Age of the mother is also important. Teenage mothers are less likely to get their
children vaccinated, probably due to lack of education. There are three groups of
mother’s ages called M_AGEGRP. “One” is assigned if the mother’s age at time of
survey is less than 19 years old, “two” if the mother is between the ages of twenty and
twenty-nine years, and “three” if mother’s age is greater than or equal to 30 years.
The higher education of the mother correlates to a higher probability that her
children will be vaccinated. In Malawi in 2000, 88 percent of mothers who had a
secondary school education had their children fully vaccinated compared to roughly 60
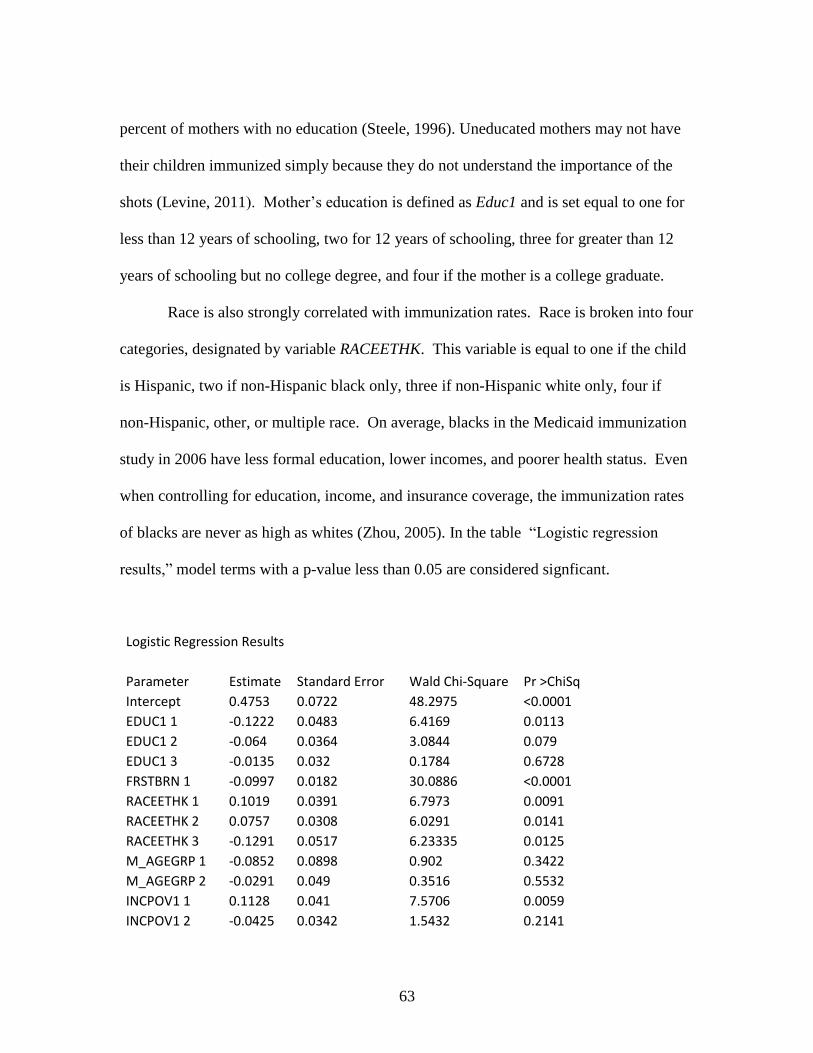
63
percent of mothers with no education (Steele, 1996). Uneducated mothers may not have
their children immunized simply because they do not understand the importance of the
shots (Levine, 2011). Mother’s education is defined as Educ1 and is set equal to one for
less than 12 years of schooling, two for 12 years of schooling, three for greater than 12
years of schooling but no college degree, and four if the mother is a college graduate.
Race is also strongly correlated with immunization rates. Race is broken into four
categories, designated by variable RACEETHK. This variable is equal to one if the child
is Hispanic, two if non-Hispanic black only, three if non-Hispanic white only, four if
non-Hispanic, other, or multiple race. On average, blacks in the Medicaid immunization
study in 2006 have less formal education, lower incomes, and poorer health status. Even
when controlling for education, income, and insurance coverage, the immunization rates
of blacks are never as high as whites (Zhou, 2005). In the table “Logistic regression
results,” model terms with a p-value less than 0.05 are considered signficant.
Logistic Regression Results
Parameter Estimate Standard Error Wald Chi-Square Pr >ChiSq
Intercept 0.4753 0.0722 48.2975 <0.0001
EDUC1 1 -0.1222 0.0483 6.4169 0.0113
EDUC1 2 -0.064 0.0364 3.0844 0.079
EDUC1 3 -0.0135 0.032 0.1784 0.6728
FRSTBRN 1 -0.0997 0.0182 30.0886 <0.0001
RACEETHK 1 0.1019 0.0391 6.7973 0.0091
RACEETHK 2 0.0757 0.0308 6.0291 0.0141
RACEETHK 3 -0.1291 0.0517 6.23335 0.0125
M_AGEGRP 1 -0.0852 0.0898 0.902 0.3422
M_AGEGRP 2 -0.0291 0.049 0.3516 0.5532
INCPOV1 1 0.1128 0.041 7.5706 0.0059
INCPOV1 2 -0.0425 0.0342 1.5432 0.2141
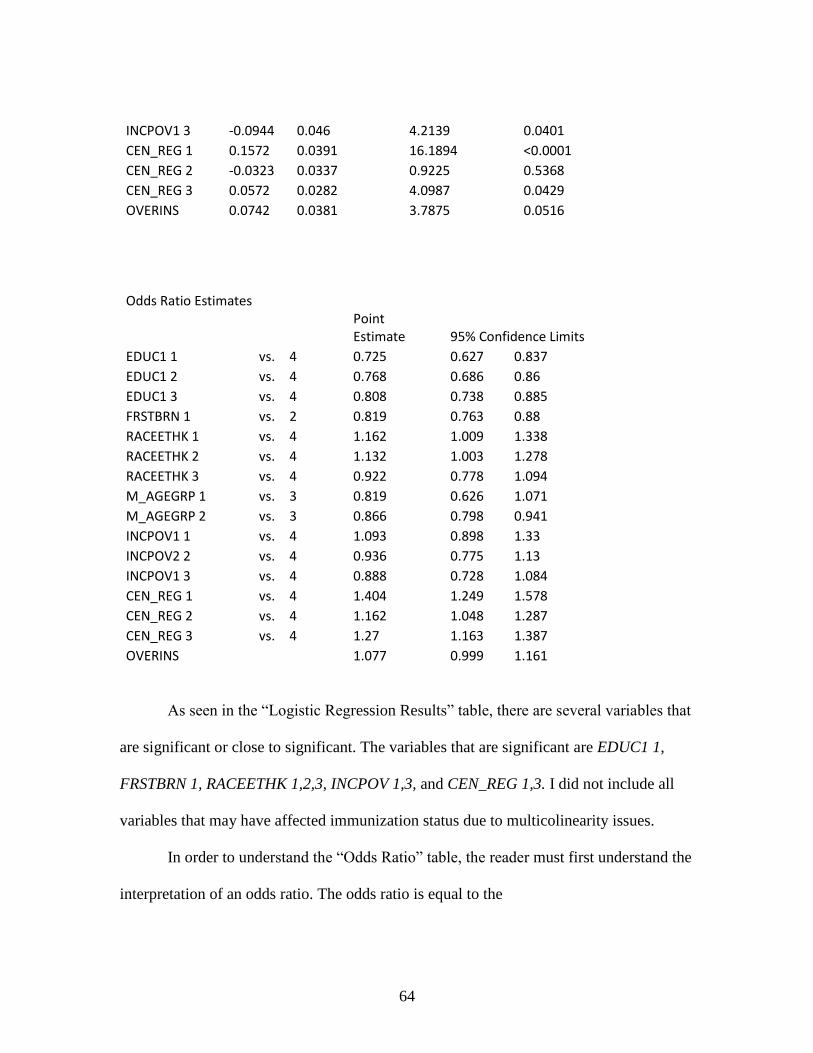
64
INCPOV1 3 -0.0944 0.046 4.2139 0.0401
CEN_REG 1 0.1572 0.0391 16.1894 <0.0001
CEN_REG 2 -0.0323 0.0337 0.9225 0.5368
CEN_REG 3 0.0572 0.0282 4.0987 0.0429
OVERINS 0.0742 0.0381 3.7875 0.0516
Odds Ratio Estimates
Point Estimate 95% Confidence Limits
EDUC1 1 vs. 4 0.725 0.627 0.837 EDUC1 2 vs. 4 0.768 0.686 0.86 EDUC1 3 vs. 4 0.808 0.738 0.885 FRSTBRN 1 vs. 2 0.819 0.763 0.88 RACEETHK 1 vs. 4 1.162 1.009 1.338 RACEETHK 2 vs. 4 1.132 1.003 1.278 RACEETHK 3 vs. 4 0.922 0.778 1.094 M_AGEGRP 1 vs. 3 0.819 0.626 1.071 M_AGEGRP 2 vs. 3 0.866 0.798 0.941 INCPOV1 1 vs. 4 1.093 0.898 1.33 INCPOV2 2 vs. 4 0.936 0.775 1.13 INCPOV1 3 vs. 4 0.888 0.728 1.084 CEN_REG 1 vs. 4 1.404 1.249 1.578 CEN_REG 2 vs. 4 1.162 1.048 1.287 CEN_REG 3 vs. 4 1.27 1.163 1.387 OVERINS
1.077 0.999 1.161
As seen in the “Logistic Regression Results” table, there are several variables that
are significant or close to significant. The variables that are significant are EDUC1 1,
FRSTBRN 1, RACEETHK 1,2,3, INCPOV 1,3, and CEN_REG 1,3. I did not include all
variables that may have affected immunization status due to multicolinearity issues.
In order to understand the “Odds Ratio” table, the reader must first understand the
interpretation of an odds ratio. The odds ratio is equal to the
65
. One of the significant variables in my analysis is
child birth order. The odds ratio of a preschool-age child being fully vaccinated
decreases by a factor of 0.82 when we move from a first-born child to a later-born child.
If the odds ratio is less than 1, the odds of a child being vaccinated decrease as we move
from first-born to a later-born child. If the odds ratio is greater than 1, the odds of a child
being vaccinated increase as we move from first-born to a later-born child. For another
example, the odds of a preschool-age child increase by a factor of 1.16 when we move
from Hispanic child to a non-Hispanic white child. Note that this is based on a simple
logistic regression. Additional analysis of the model to correct for multi-collinearity
and/or interaction among the dependent variables would be interesting.
Ex-post empirical CBA
Ex-post empirical CBA is used to determine if the relationship between the
immunization policy and the outcome of interest (disease reduction) is significant.
Researchers conducting ex-ante and ex-post traditional CBA, as well as ex-ante empirical
CBA, have frequently demonstrated that when immunization coverage increased, disease
costs also decreased (Kaddar et al, 2005). However, there have been almost no research
studies conducted with ex-post empirical CBA to determine the relationship between
immunization policies and diseases reduction. The most important additional challenge
to the empirical ex-post CBA approach is difficulty in finding data that actually reflect
policy implementation change and outcome variable change on the same unit of analysis
66
(for example, individual, state, year, etc.). Unfortunately, this approach has not yet been
used to examine the effects of immunization policy in the United States.
Results and Conclusion
The CBA approach that resulted in new insights into policy effects and
implementation issues is ex-ante empirical. This CBA is a logistic analysis of a simple
model. My model and analysis demonstrates that the empirical ex-ante CBA can provide
more insight into immunization policy than the traditional approaches to CBA. I was not
trying to do an overall CBA of immunization policy, that would take more data, more
years, and a much more complicated model.
Using logistic regression, the factors that are most significant in the model are
FRSTBRN and CEN_REG1. For a one unit increase in FRSTBRN, the odds of a
preschool-age child being fully vaccinated (vs. not being fully vaccinated) increase by a
factor of 0.819. This may be due to the fact that parents are more cautious with first born
children and may become more carefree with the births of subsequent children. The
more children in the family, the less likely the later-born children will receive their
childhood immunizations (Steele 1996). Also, the benefits of immunizing another child
are reduced as more children are immunized.
CEN_REG1 indicates that the preschool-age child resides in the Northeast region
of the United States. The odds of a child born in the Northeast being immunize versus a
child born in the West are between 1.249 and 1.578. The Northeast has a higher cost of
67
living than the rest of the country. Due to smaller space for housing, the parents might
want space away from their children. Thus, parents may choose higher quality children
over quantity. With more land out West and more room for children to roam, parents
may choose a higher number of children and spend less on each child in terms of
healthcare. A child born in the South is between 1.163 and 1.387 times as likely to be
immunized as a child born in the West.
The only level of education that is significant in influencing whether or not a child
had been immunized was EDUC1, which indicates that the mother has less than twelve
years of education. The difference between the mother having a high school education
versus college and beyond is not significant. This is surprising since income levels for
high school versus college graduates seem to be very different and income level was
found to be significant with immunization rates.
The main finding from my study is that immunization probability actually varies
widely among demographic groups. Some demographic groups have extremely low
probabilities of immunization. Targeting those groups could have a big benefit in
increasing immunization coverage.
68
CHAPTER FOUR
CONCLUSIONS AND AREAS FOR FURTHER RESEARCH
My dissertation has explored the usefulness of cost-benefit analysis in evaluating
policies addressed in two social issues: the Expanded Food and Nutrition Education
Program and child immunization. Examination of these social issues has provided
scholarly insight into the potential uses and misuses of the four types of cost-benefit
analysis outlined earlier. The application of the various types of cost-benefit analysis to
each policy issue produced unique conclusions, and each issue merits further exploration
for meaningful policy recommendations.
Lessons from EFNEP Policy Analysis
Numerous policy options in the community intervention literature suggest how to
bridge the gap between nutrition education programs such as EFNEP and outcomes. In
times of limited funding, it is essential that continuing long-term programs such as
EFNEP demonstrate economic efficiency through accountability measures. Currently, all
states must administer a national pre- and post-program test survey to program
participants. The test involves ten summative questions all of which fail to inquire about
participants’ skill, knowledge, behavior, and attitude about nutrition before and after
completing the program. This is a major oversight. The evaluation methods need to
reflect the various facets that demonstrate participant life-style change.
69
It is easy to argue for the policy effectiveness of EFNEP when conducting
traditional ex-ante and traditional ex-post approaches, as these are relatively
straightforward to conduct. As my research demonstrates, the empirical ex-ante and ex-
post approach are much more difficult approaches to demonstrating the importance of
EFNEP as there are no good data sets available for the relevant independent and
dependent variables.
No system has been developed or utilized by EFNEP administrators to nationally
evaluate or systematically address the survey results so as to provide meaningful
feedback to program practitioners. Government mandated, results-based accountability
methodology would provide EFNEP practitioners and administrators tools and
information to achieve outcomes. Furthermore, government funded, research-driven
community trials that follow participants for at least five years following program
participation would demonstrate whether EFNEP programming is having long-term
desirable effects.
Research on the effectiveness of programs such as EFNEP is one way to ensure
that social assistance programs are serving the needs of those who lack food security,
suffer nutrient-poor diets, and are at high risk for chronic disease. The consequences of
food insecurity such as malnutrition and poor mental health reduce individual’s ability to
be a productive member of society.
Researchers recommend the following policy evaluation tools: 1) increased
accountability measures, 2) longitudinal research studies, 3) state-state comparison
studies and conferences. All are crucial measures to increasing overall well-being in the
70
United States. The overall conclusion from my EFNEP policy analysis is that it is very
difficult to show that EFNEP leads to long-term disease reduction.
Lessons learned from Immunization Policy Analysis
As discussed in the immunization chapter, the benefits to vaccination coverage
are widespread and numerous. However, since only older generations can remember the
infectious diseases for which we now have vaccinations, younger generations often
distrust the need and value of vaccinations. It is becoming increasingly difficult to
maintain the level of immunization coverage needed for herd immunity (Vernon, 2003).
My research did not consider the traditional ex-ante and ex-post cost-benefit analysis
approaches because numerous scholars have already thoroughly exhausted these
approaches. Instead, my study follows the empirical ex-ante and ex-post methodology.
Using this methodology, this research was able to determine socio-demographic groups
that are least likely to get vaccinated, so that policymakers can target those groups.
Moving beyond all four types of cost-benefit analysis, most immunization
scholars believe that qualitative research would be the best way to fix low vaccination
rates. Roberts et al state, “The main barrier to successful combination of qualitative and
quantitative research in increasing vaccination coverage is that methods for incorporation
of qualitative research are underutilized” (1596, 2002). Qualitative research methods
such as focus groups and ethnography draw attention to lay beliefs and identify parental
concerns about exposing children to potential risk, as well as moral and religious
71
objections (Roberts et al, 2002). The few qualitative research studies that have been
conducted so far ran focus groups with immunizers and non-immunizers. Non-
immunizers were more likely to be concerned with long-term side effects of vaccines
(Vernon, 2003).
Policy researchers have determined that once health service factor improvements
are made (such as those mentioned in the Immunization chapter), the next best method
for vaccination improvement is financial incentives for mothers (Levine et al, 2011).
Furthermore, there needs to be concordance at a local and state level. Local and state
communities need to have public discussions to better disseminate vaccination coverage
information (Vernon, 2003).
General Conclusions
There are many findings in my research that will affect how policy analysts and
scholars conduct future research is conducted by policy analysts and scholars. The first
finding is that cost-benefit analysis can be separated into four approaches: ex-ante
traditional, ex-post traditional, ex-ante empirical, and ex-post empirical. Separating the
challenges into components associated with each approach can help identify specific and
tractable solutions to the challenges. Policy analysts should consider each type before
jumping into performing traditional ex-ante and ex-post or regression analysis.
The second result is that the four types of cost-benefit analysis are not equally
suitable to apply to every policy or problem with policy implications. In the chapter
72
regarding EFNEP, traditional ex-ante and empirical ex-post were not possible to conduct.
The policy had already occurred, so there was no need for traditional ex-ante analysis.
Empirical ex-post analysis was impossible due to severe data restrictions. In my research
regarding the problem of immunization, traditional ex-post and empirical ex-post CBA
were not possible as no new policy had been enacted.
The third finding of my research is that researchers and policy scholars need to
consider the advantages and disadvantages of each type of cost-benefit analysis before
starting new research. Never before has there been a clear delineation of the four ways to
approach cost-benefit analysis. Researchers should consider the many neo-classical
economic assumptions that come into play when conducting the two types of traditional
cost-benefit analysis. While the two types of empirical cost-benefit analysis do not have
as many assumptions, the lack of ability to gather primary data and to manipulate
secondary data often renders empirical analysis useless. Both regression approaches to
EFNEP and immunization policy analysis demonstrated that it is very difficult to conduct
empirical CBA of either type.
The fourth determination was that the “easiest” CBA’s to conduct are ex-ante
traditional and ex-ante empirical. It is easier to hypothesize what will happen than to
determine what has happened.
Given this conclusion, the fifth finding of this research is that the most useful type
of CBA is ex-post empirical, because EFNEP and immunization policy analysis found
new information that had not been demonstrated previously. However, realistically it is
often difficult to acquire data on the population the policy is supposed to affect. The
73
most important challenge to the empirical ex-post cost-benefit analysis approach is
difficulty in finding data that actually reflect policy implementation change and outcome
variable change on the same unit of analysis (individual, state, year, etc.). It is extremely
difficult to find a data set in which researchers are able to clearly designate a population
that responds to the policy at hand. Little academic work has taken this approach.
74
REFERENCES
Anderson, J. E. (1979). Public policy-making. Holt, Rinehart and Winston.
Arnold, C. G., & Sobal, J. (2000). “Food practices and nutrition knowledge after
graduation from the expanded food and nutrition education program (EFNEP)”.
Journal of Nutrition Education, 32(3), 130-138.
Baguley, T. (2004). “Understanding statistical power in the context of applied
research”. Applied Ergonomics, 35(2), 73-80.
Barnard, C. I. (1968). The functions of the executive . Harvard Univ Pr.
Batterham, A. M., & Hopkins, W. G. (2006). Making meaningful inferences about
magnitudes.
Buchanan, J. M. (1984). “Politics without romance: A sketch of positive public choice
theory and its normative implications”. The Theory of Public Choice II, , 11–22.
Burney, J., and Haughton, B. (2002). “EFNEP: A nutrition education program that
demonstrates cost-benefit”. Journal of the American Dietetic Association, 102(1),
39-45.
Campbell, C. C. (1991). “Food insecurity: A nutritional outcome or a predictor
variable?”. Journal of Nutrition, 121(3), 408.
Dimsdale, J. E., Pierce, C., Schoenfeld, D., Brown, A., Zusman, R., & Graham, R.
(1986). “Suppressed anger and blood pressure: The effects of race, sex, social
class, obesity, and age”. Psychosomatic Medicine, 48(6), 430.
75
Dollahite, D. C., Marks, L. D., and Goodman, M. A. (2004). “Families and religious
beliefs, practices, and communities”. Handbook of Contemporary Families:
Considering the Past, Contemplating the Future, , 411.
Dollahite, J., Olson, C., and Scott‐Pierce, M. (2003). “The impact of nutrition education
on food insecurity among Low‐Income participants in EFNEP”. Family and
Consumer Sciences Research Journal, 32(2), 127-139.
Downs, A. (1957). “An economic theory of political action in a democracy”. The Journal
of Political Economy, 65(2), 135-150.
Douglas, K. A., Collins, J. L., Warren, C., Kann, L., Gold, R., Clayton, S., . . . Kolbe, L.
J. (1997). “Results from the 1995 national college health risk behavior survey”.
Journal of American College Health, 46(2), 55-67.
Duclos, P., Okwo-Bele, J. M., Gacic-Dobo, M., & Cherian, T. (2009). “Global
immunization: Status, progress, challenges and future”. BMC International
Health and Human Rights. 9 (Suppl 1), S2.
Eichler, R. (2006). Can “pay-for-performance” increase utilization by the poor and
improve the quality of health services. Background Papers for the Working Group
on Performance Based Incentives.Centre for Global Development,
Feudtner, C., & Marcuse, E. K. (2001). “Ethics and immunization policy: Promoting
dialogue to sustain consensus”. Pediatrics. 107(5) 1158-1164.
Fillipp, S. W. (1983). The Effect of Nutrition Education on Nutrition Knowledge and
Food Patterns of Leaders Enrolled in the Expanded Nutrition Program. Texas
Tech Honors Thesis.
76
Fishbein, M., & Cappella, J. N. (2006). “The role of theory in developing effective health
communications”. Journal of Communication, 56, S1-S17.
Forbes, M., & Lynn, L. E. (2005). “How does public management affect government
performance? findings from international research”. Journal of Public
Administration Research and Theory, 15(4) 559.
Fox-Rushby, J. A., Kaddar, M., Levine, R., & Brenzel, L. (2004). “The economics of
vaccination in low-and middle-income countries”. Bulletin of the World Health
Organization. 82 (9) 640-640.
Freeman, B. (2008). “The role of elementary school physical activity in combating
childhood obesity”. Social Work Student Papers,17.
Gauri, V., & Khaleghian, P. (2002). “Immunization in developing countries: Its political
and organizational determinants”. World Development, 30 (12) 2109-2132.
Greer, B., & Poling, R. (2001). “Impact of participating in the expanded food and
nutrition education program on food insecurity”. Mississippi State: Mississippi
State University, Southern Rural Development Center.Retrieved May, 2, 2002.
Grosse, S. D., Teutsch, S. M., & Haddix, A. C. (2007). “Lessons from cost-effectiveness
research for united states public health policy”. Public Health, 28(1), 365.
Hasler, C. M. (1998). “Functional foods: Their role in disease prevention and health
promotion”. Food Technology-Champaign, 52, 63-147.
Hindess, B. (1988). Choice, rationality, and social theory. Routledge.
77
Hinman, A. R. (2005). “Financing vaccines in the 21st century: Recommendations from
the national vaccine advisory committee”. American Journal of Preventive
Medicine. 29 (1) 71-75.
Hochholzer, W., Trenk, D., Frundi, D., Blanke, P., Fischer, B., Andris, K., Bestehorn, H.
P., Buttner, H. J., & Neumann, F. J. (2005). “Time dependence of platelet
inhibition after a 600-mg loading dose of clopidogrel in a large, unselected cohort
of candidates for percutaneous coronary intervention”. Circulation, 111(20),
2560.
Inman, RP and Rubinfeld, DL (1997). “Rethinking Federalism”. Journal of Economic
Perspectives 11 (4): 43-64.
Johnson, K. A., Sardell, A., & Richards, B. (2000). “Federal immunization policy and
funding: A history of responding to crises”. American Journal of Preventive
Medicine. 19 (3) 99-112.
Jonsson, U. (2010). World nutrition. Journal of the World Public Health Nutrition
Association, 1(3).
Joy, A., Pradhan, V., & Goldman, G. (2006). “Cost-benefit analysis conducted for
nutrition education in California”. California Agriculture, 60(4), 185-191.
Kaddar, M., Lydon, P., & Levine, R. (2004). “Financial challenges of immunization: A
look at GAVI”. Bulletin of the World Health Organization, 82(9), 697-702.
78
Kant, A. K. (2000). “Consumption of energy-dense, nutrient-poor foods by adult
americans: Nutritional and health implications. the third national health and
nutrition examination survey, 1988–1994”. American Journal of Clinical
Nutrition, 72(4), 929-936.
Kaufman, P. R. (1999). “Rural poor have less access to supermarkets, large grocery
stores”. Rural Development Perspectives, 13, 19-26.
Kawachi, I., Kennedy, B. P., Lochner, K., & Prothrow-Stith, D. (1997). “Social capital,
income inequality, and mortality”. American Journal of Public Health, 87(9),
1491.
Keast, R., & Brown, K. (2002). “The government service delivery project: A case study
of the push and pull of central government coordination”. Public Management
Review, 4(4) 439-459.
Khaleghian, P., & Gupta, M. D. (2005). “Public management and the essential public
health functions”. World Development, 33(7) 1083-1099.
Levine, O. S., Bloom, D. E., Cherian, T. de Quadros, C., Sow, S., Wecker, J. Greenwood,
B. (2011). “The future of immunisation policy, implementation, and
financing”. The Lancet, 378(9789) 439-448.
Lomas, J. (1998). “Social capital and health: Implications for public health and
epidemiology”. Social Science & Medicine, 47(9), 1181-1188.
Lydon, P., Beyai, P. L., Chaudhri, I., Cakmak, N., Satoulou, A., & Dumolard, L. (2008).
“Government financing for health and specific national budget lines: The case of
vaccines and immunization”. Vaccine, 26(51) 6727-6734.
79
Mankiw, N. G., & Biederman, D. K. (2003). Principles of microeconomic tbeory.
Thomson Learning EMEA, Limited.
McDowell, G. R. (1985). “The political economy of extension program design:
Institutional maintenance issues in the organization and delivery of extension
programs”. American Journal of Agricultural Economics, 67(4) 717-725.
McGinnis, J. M., & Nestle, M. (1989). “The surgeon general's report on nutrition and
health: Policy implications and implementation strategies”. American Journal of
Clinical Nutrition, 49(1), 23.
McLaughlin, M. W. (1987). “Learning from experience: Lessons from policy
implementation”. Educational Evaluation and Policy Analysis, 9(2), 171.
Medeiros, L. C., Butkus, S. N., Chipman, H., Cox, R. H., Jones, L., & Little, D. (2005).
“A logic model framework for community nutrition education”. Journal of
Nutrition Education and Behavior, 37(4), 197-202.
Meltzer, D. (1997). “Accounting for future costs in medical cost-effectiveness analysis”.
Journal of Health Economics, 16(1), 33-64.
Mullen, K. J., Frank, R. G., & Rosenthal, M. B. (2010). “Can you get what you pay for?
Pay‐for‐performance and the quality of healthcare providers”. The Rand Journal
of Economics, 41(1) 64-91.
Murphy, E., Dingwall, R., Greatbatch, D., Parker, S., & Watson, P. (1998). Qualitative
research methods in health technology assessment: A review of the literature.
Health Technology Assessment (Winchester, England), 2(16)
80
Musgrave, RA (1997) Devolution, Grants, and Fiscal Competition. Journal of Economic
Perspectives 11 (4): 43-64.Meyer, J. W., & Rowan, B. (1977). “Institutionalized
organizations: Formal structure as myth and ceremony”. American Journal of
Sociology. 340-363.
Noar, S. M., & Zimmerman, R. S. (2005). Health behavior theory and cumulative
knowledge regarding health behaviors: Are we moving in the right direction?
Health Education Research, 20(3), 275.
Nutbeam, D. (2000). Health literacy as a public health goal: A challenge for
contemporary health education and communication strategies into the 21st
century. Health Promotion International, 15(3), 259.
O'Brien, R. M., Hudson, K., & Stockard, J. (2008). “A mixed model estimation of age,
period, and cohort effects”. Sociological Methods & Research, 36(3), 402.
Patrick, D. L., & Wickizer, T. M. (1995). Community and health. Society and Health, ,
46-92.
Petersen, L. A., Woodard, L. C. D., Urech, T., Daw, C., & Sookanan, S. (2006). “Does
pay-for-performance improve the quality of healthcare?”. Annals of Internal
Medicine. 145 (4) 265.
Pignone, M., Saha, S., Hoerger, T., Lohr, K. N., Teutsch, S., & Mandelblatt, J. (2005).
“Challenges in systematic reviews of economic analyses”. Annals of Internal
Medicine. 142(12 Part 2) 1073.
81
Prosser, L. A., Ray, G. T., O'Brien, M., Kleinman, K., Santoli, J., & Lieu, T. A. (2004).
“Preferences and willingness to pay for health states prevented by pneumococcal
conjugate vaccine”. Pediatrics. 113 (2) 283.
Putnam, J. W., Spiegel, A. N., & Bruininks, R. H. (1995). “Future directions in education
and inclusion of students with disabilities: A delphi investigation”. Exceptional
Children. 61(6)
Radimer, K. L., Olson, C. M., & Campbell, C. C. (1990). “Development of indicators to
assess hunger”. Journal of Nutrition. 120.
Rajgopal, R., Cox, R. H., Lambur, M., & Lewis, E. C. (2002). “Cost-benefit analysis
indicates the positive economic benefits of the expanded food and nutrition
education program related to chronic disease prevention”. Journal of Nutrition
Education and Behavior. 34(1) 26-37.
Resnik, D. B. (2000). “Statistics, ethics, and research: An agenda for education and
reform”. Accountability in Research. 8(1-2) 163-188.
Roberts, K. A., Dixon-Woods, M., Fitzpatrick, R., Abrams, K. R., & Jones, D. R. (2002).
“Factors affecting uptake of childhood immunisation: A bayesian synthesis of
qualitative and quantitative evidence. The Lancet 360 (9345), 1596-1599.
Rosenthal, R., & Rubin, D. B. “Statistical analysis: Summarizing evidence versus
establishing facts”. 1985. Print.
Rubin, P. H. (1990). Managing business transactions: Controlling the cost of
coordinating, communicating, and decision-making. New York: Free Press.
82
Sabatier, P. A. (1986). Top-down and bottom-up approaches to implementation research:
A critical analysis and suggested synthesis. Journal of Public Policy, 6(01), 21-
48.
Savedoff, W. D. (2010). “Basic economics of results-based financing in health”. Results-
Based Financing for Health.Washington, DC: World Bank.
Scholz, J. T., Twombly, J., & Headrick, B. (1991). “Street-level political controls over
federal bureaucracy”. The American Political Science Review, , 829-850.
Sen, A. (1981). “Ingredients of famine analysis: Availability and entitlements”. The
Quarterly Journal of Economics. 96 (3) 433-464.
Shankman, N. A. (1999). “Reframing the debate between agency and stakeholder
theories of the firm”. Journal of Business Ethics, 19(4), 319-334.
Simon, H. A. (1946). “The proverbs of administration”. Public Administration Review,
6(1) 53-67.
Smith, H. L. (2008). “Advances in Age–Period–Cohort analysis”. Sociological Methods
& Research, 36(3), 287.
Stokols, D. (1996). “Translating social ecological theory into guidelines for community
health promotion”. American Journal of Health Promotion. 10, 282-298.
Vernon, J. G. (2003). “Immunisation policy: From compliance to concordance?” The
British Journal of General Practice, 53(490) 399.
Wessman, C., Betterley, C., & Jensen, H. H. (2001). “Evaluation of the costs and benefits
of Iowa's expanded food and nutrition education program (EFNEP): Final report”.
Center for Agricultural and Rural Development (CARD) Publications.
83
West, W. F. (1997). Searching for a theory of bureaucratic structure. Journal of Public
Administration Research and Theory, 7(4) 591.
Williamson, O. E. (1981). “The economics of organization: The transaction cost
approach”. American Journal of Sociology. 87 (3) 548-577.
Williamson, O. E. (2002). The theory of the firm as governance structure: From choice to
contract. The Journal of Economic Perspectives, 16(3) 171-195.
Zhou, F., Santoli, J., Messonnier, M. L., Yusuf, H. R., Shefer, A., Chu, S. Y., Harpaz,
R.(2005). “Economic evaluation of the 7-vaccine routine childhood immunization
schedule in the United States”. 2001. Archives of Pediatrics and Adolescent
Medicine, 159(12) 1136.