Embed Size (px)
Citation preview
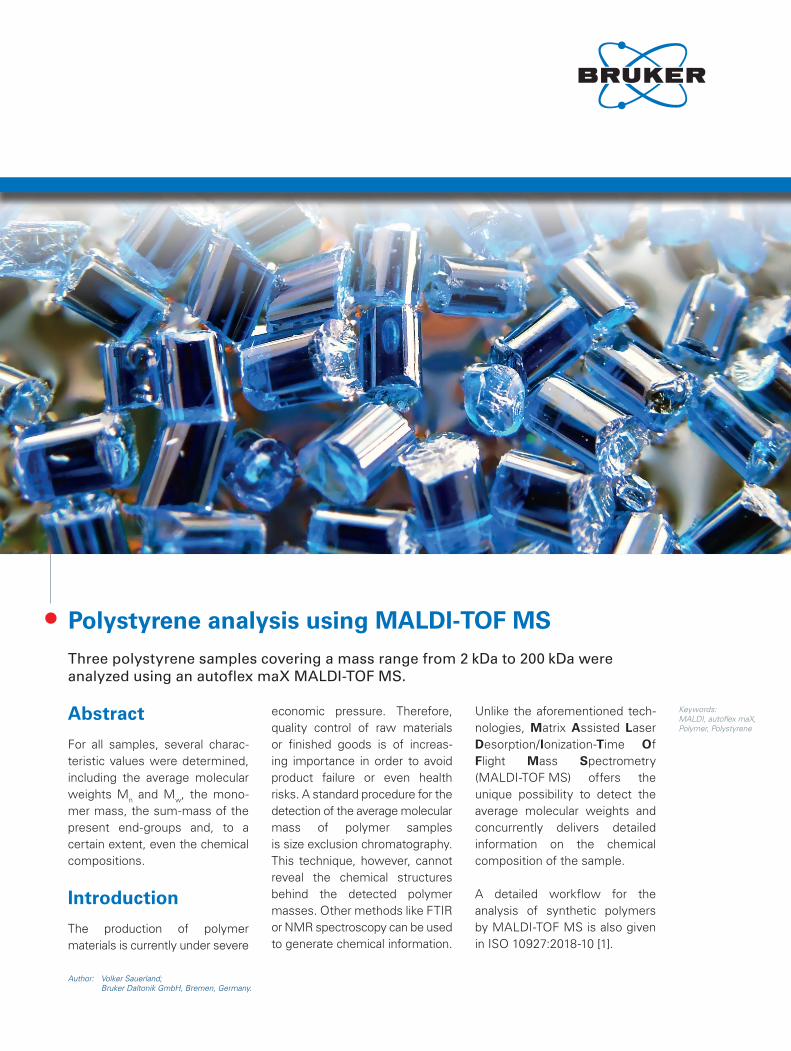
Polystyrene analysis using MALDI-TOF MSThree polystyrene samples covering a mass range from 2 kDa to 200 kDa were analyzed using an autoflex maX MALDI-TOF MS.
Abstract
For all samples, several charac-teristic values were determined, including the average molecular weights Mn and Mw, the mono-mer mass, the sum-mass of the present end-groups and, to a certain extent, even the chemical compositions.
Introduction
The production of polymer materials is currently under severe
economic pressure. Therefore, quality control of raw materials or finished goods is of increas-ing importance in order to avoid product failure or even health risks. A standard procedure for the detection of the average molecular mass of polymer samples is size exclusion chromatography. This technique, however, cannot reveal the chemical structures behind the detected polymer masses. Other methods like FTIR or NMR spectroscopy can be used to generate chemical information.
Unlike the aforementioned tech-nologies, Matrix Assisted Laser Desorption/Ionization-Time Of Flight Mass Spectrometry (MALDI-TOF MS) offers the unique possibility to detect the average molecular weights and concurrently delivers detailed information on the chemical composition of the sample.
A detailed workflow for the analysis of synthetic polymers by MALDI-TOF MS is also given in ISO 10927:2018-10 [1].
Author: Volker Sauerland; Bruker Daltonik GmbH, Bremen, Germany.
Keywords: MALDI, autoflex maX, Polymer, Polystyrene
Experimental
The polystyrene samples with Mp = 1920 Da (PS1) and Mp = 210 kDa (PS3) were purchased from Polymer Standards Services GmbH (Mainz, Germany). A polystyrene sample with molecular weight Mp = 19 kDa (PS2) was purchased from Polymer Laboratories LTD (Church Stretton, UK).
All samples were dissolved in THF at a concentration of 10 g/L. DCTB, prepared at 20 g/L in THF, was used as the matrix. Silver trifluoroacetate, was prepared as the doping salt at a concentration of 0.1 M in THF. The polymer, matrix, and salt solutions were mixed in a ratio 3:20:1 for PS1 and PS2 and 3:100:1 for PS3. A droplet of the mixture (0.5 μL) was hand-spotted onto three spots of a gound steel target plate.
An autoflex® maX (Bruker Daltonics) MS system, operating in reflector mode for sample PS1 and in linear
mode for samples PS2 and PS3, was used for data acquisition. All spectra were measured in the positive ion mode and calibration was performed on polystyrenes prepared on neigh-boring sample positions.
Data acquisition and calibration were carried out with COMPASS for flex 1.4 (Bruker Daltonics), followed by polymer signal analysis using PolyTools 1.0 SR 1 (Bruker Daltonics).
Results
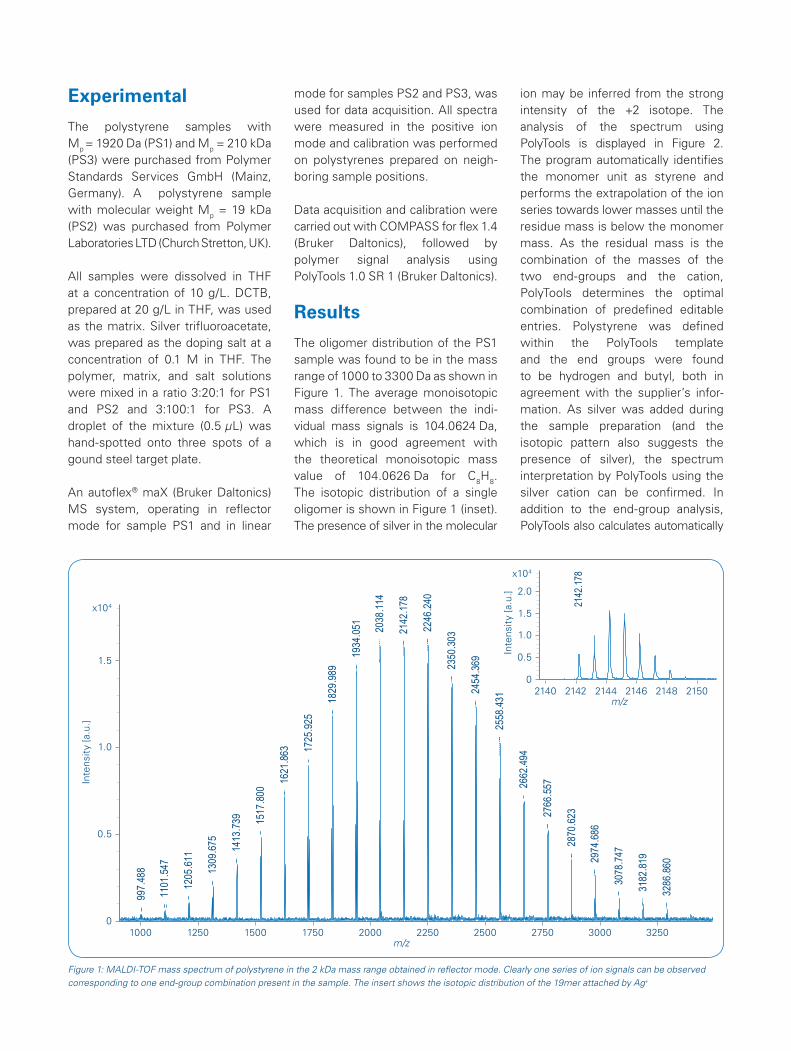
The oligomer distribution of the PS1 sample was found to be in the mass range of 1000 to 3300 Da as shown in Figure 1. The average monoisotopic mass difference between the indi-vidual mass signals is 104.0624 Da, which is in good agreement with the theoretical monoisotopic mass value of 104.0626 Da for C8H8. The isotopic distribution of a single oligomer is shown in Figure 1 (inset). The presence of silver in the molecular
ion may be inferred from the strong intensity of the +2 isotope. The analysis of the spectrum using PolyTools is displayed in Figure 2. The program automatically identifies the monomer unit as styrene and performs the extrapolation of the ion series towards lower masses until the residue mass is below the monomer mass. As the residual mass is the combination of the masses of the two end-groups and the cation, PolyTools determines the optimal combination of predefined editable entries. Polystyrene was defined within the PolyTools template and the end groups were found to be hydrogen and butyl, both in agreement with the supplier’s infor-mation. As silver was added during the sample preparation (and the isotopic pattern also suggests the presence of silver), the spectrum interpretation by PolyTools using the silver cation can be confirmed. In addition to the end-group analysis, PolyTools also calculates automatically
Inte
nsit
y [a
.u.]
m/z
0
0.5
1.0
x104
1.5
1750 27501500 2500 32501250 2250 30001000 2000
2142
.178
Inte
nsit
y [a
.u.]
m/z
0
0.5
1.0
x104
1.5
2.0
214621442142 21502140 2148
Figure 1: MALDI-TOF mass spectrum of polystyrene in the 2 kDa mass range obtained in reflector mode. Clearly one series of ion signals can be observed corresponding to one end-group combination present in the sample. The insert shows the isotopic distribution of the 19mer attached by Ag+
1309
.6
1101
997.
4
2246
.240
2142
.178
2038
.114
1934
.051
2350
.303
2454
.369
1829
.989
2558
.431
1725
.925
2662
.494
1621
.863
2766
.557
1517
.800
2870
.623
1413
.739
2974
.686
75
3078
.747
1205
.611
3182
.819
.547
3286
.860
88

the average molecular weights Mn (2137.67 Da) and Mw (2212.31 Da), the dispersity ĐM=1.035, the degree of polymerization (DP, 20.54), and the percentage of the total ion signal covered by the individual ion series.
The spectrum shown in Figure 3 was obtained from sample PS2 using linear mode of the autoflex maX. The average distance of 104.19 Da (average masses) between the signals in the spectrum is in good
agreement with the theoretical average mass value of 104.15 Da for C8H8. The interpretation by PolyTools (Figure 4) confirms the expected combination of end-groups. Due to the lower mass accuracy of linear mode collection, the spectrum interpretation shows a residual mass of 0.23 Da, which is typical for a polymer in this mass range.
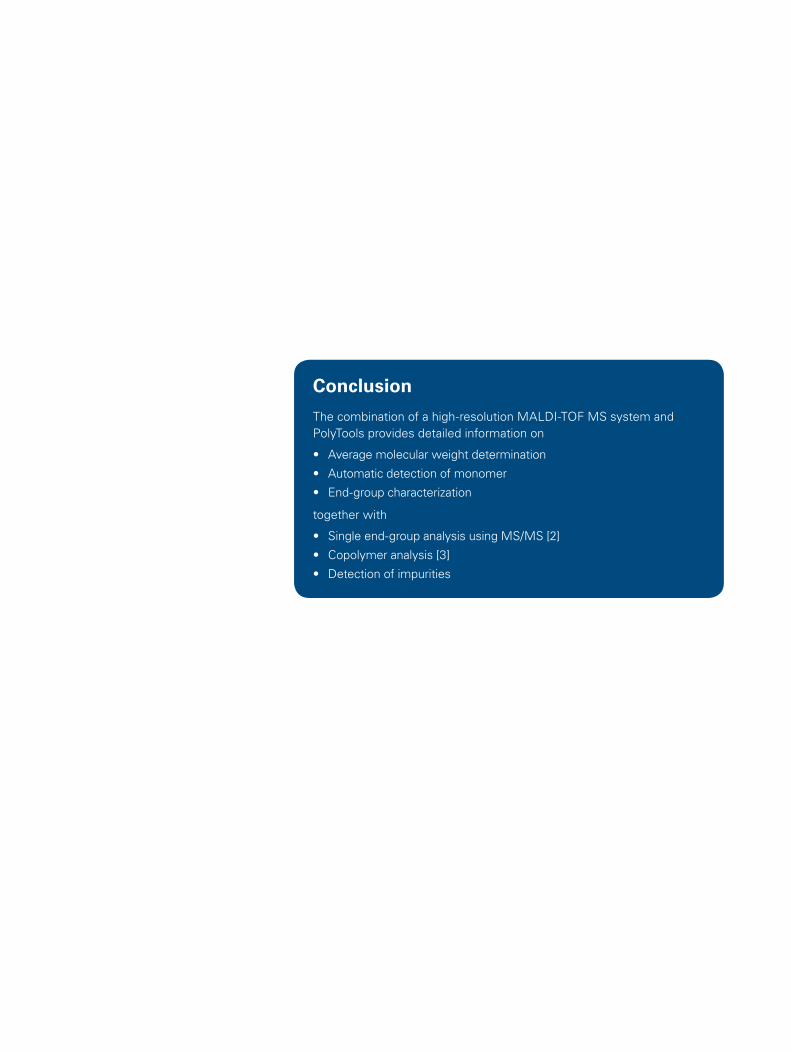
Even at much higher masses, e.g. between 100 - 300 kDa, still the average molecular weights can be calculated by PolyTools (Figure 5). As shown in Figure 6, at this high mass range the individual oligomers cannot be resolved. It is noteworthy that higher charged species appear in the spectrum such as one polystyrene molecule carrying two silver ions or a cluster of two polystyrene molecules sharing three silver ions (as the doubly charged dimer appears at the same mass as the singly charged monomer).
Figure 2: PolyTools interpretation of the spectrum of polystyrene in the 2 kDa mass range. Monomer detection, average mass calculations and end group analysis are done automatically
Figure 3: Spectrum of PS2 in the mass range 14 to 22 kDa acquired using the linear mode of the autoflex maX. In this mass range the isotopic resolution is lost, but the oligomers can be separated as shown in the insert
1755
9.1
1693
4.5
1724
6.8
1787
2.0
1662
1.7
1818
3.9
1620
5.2
1849
6.2
1870
4.6
1589
2.6
1568
4.2
1901
7.1
1537
1.9
1943
3.9
1505
8.7
1974
7.1
1464
1.8
2005
9.0
2037
0.6
Inte
nsit
y [a
.u.]
m/z
0
1000
2000
3000
14,000 15,000 16,000 17,000 18,000 19,000 20,000 21,000 22,000
Inte
nsit
y [a
.u.]
m/z
1000
2000
3000
4000
16,900 16,950 17,05017,000
0
1693
4.5
1703
8.7
Styrene
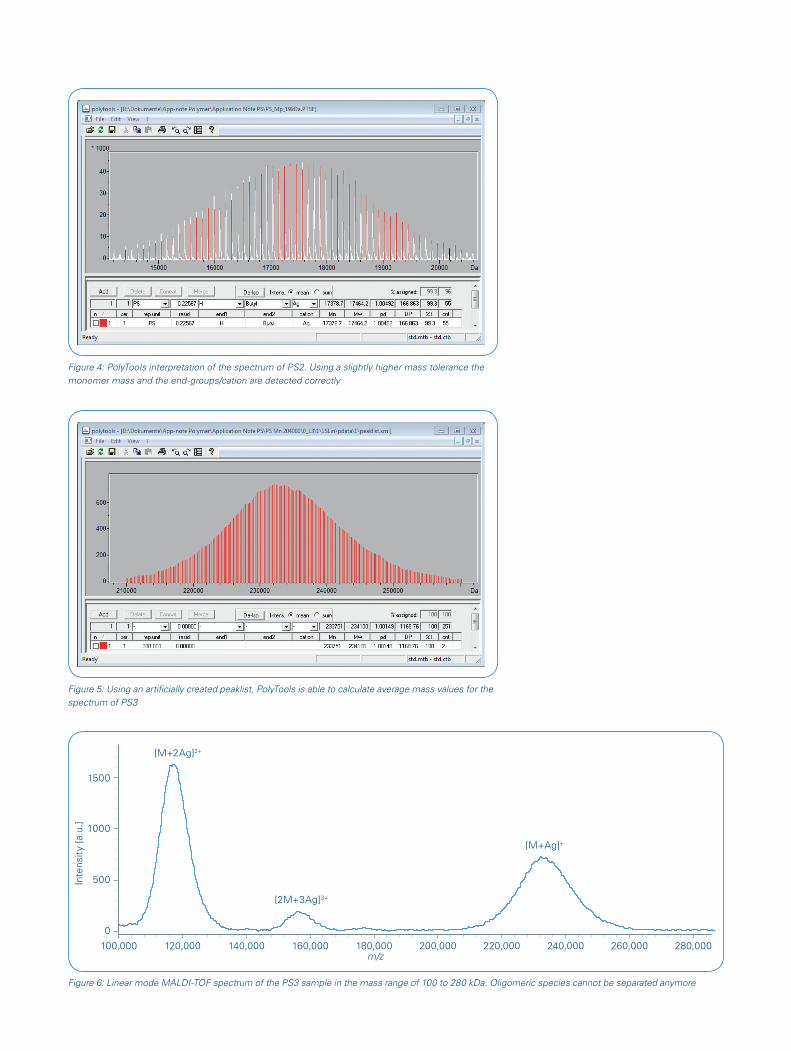
Figure 4: PolyTools interpretation of the spectrum of PS2. Using a slightly higher mass tolerance the monomer mass and the end-groups/cation are detected correctly
Figure 5: Using an artificially created peaklist, PolyTools is able to calculate average mass values for the spectrum of PS3
Figure 6: Linear mode MALDI-TOF spectrum of the PS3 sample in the mass range of 100 to 280 kDa. Oligomeric species cannot be separated anymore
[M+2Ag]2+
[2M+3Ag]3+
[M+Ag]+
Inte
nsit
y [a
.u.]
m/z
0
500
1000
1500
100,000 120,000 140,000 160,000 180,000 200,000 220,000 240,000 260,000 280,000
Conclusion
The combination of a high-resolution MALDI-TOF MS system and PolyTools provides detailed information on
• Average molecular weight determination
• Automatic detection of monomer
• End-group characterization
together with
• Single end-group analysis using MS/MS [2]
• Copolymer analysis [3]
• Detection of impurities

Bru
ker
Dal
toni
cs is
con
tinua
lly im
prov
ing
its p
rodu
cts
and
rese
rves
the
rig
ht
to c
hang
e sp
ecifi
catio
ns w
ithou
t no
tice.
© B
ruke
r D
alto
nics
04
-202
0, M
T-12
6, 1
8773
95
Bruker Daltonik GmbH
Bremen · GermanyPhone +49 (0)421-2205-0
Bruker Scientific LLC
Billerica, MA · USA Phone +1 (978) 663-3660
For Research Use Only. Not for Use in Clinical Diagnostic Procedures.
[email protected] – www.bruker.com
Learn More
You are looking for further Information? Check out the link or scan the QR code for more details.
www.bruker.com/autoflex
References
[1] Plastics - Determination of the molecular mass and molecular mass distribution of polymer species by matrix-assisted laser desorption/ionization time-of-flight mass spectrometry (MALDI-TOF-MS) (ISO 10927:2018); German version EN ISO 10927:2018
[2] Knop et al. (2010). Systematic MALDI-TOF CID Investigation on Different Substituted mPEG 2000, Macromol. Chem. Phys. 211, 677–684
[3] Weidner et al. (2007). A novel software tool for copolymer characterization by coupling of liquid chromatography with matrix-assisted laser desorption/ionization time-of-flight mass spectrometry, Rapid Commun. Mass Spectrom. 21, 2750–2758