Embed Size (px)
Citation preview
64 © British Birds 106 • February 2013 • 64 –100
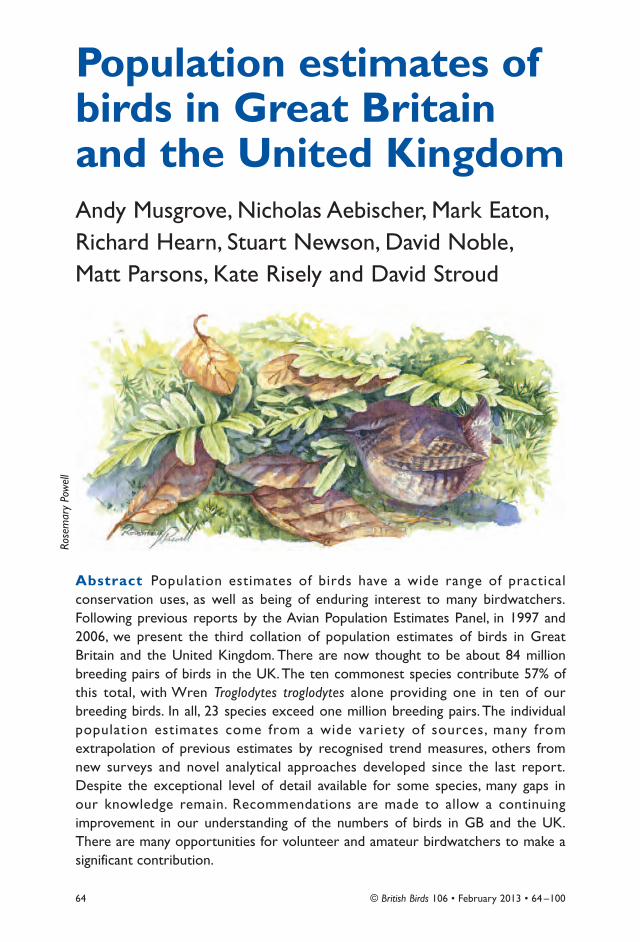
Population estimates ofbirds in Great Britainand the United KingdomAndy Musgrove, Nicholas Aebischer, Mark Eaton,Richard Hearn, Stuart Newson, David Noble, Matt Parsons, Kate Risely and David Stroud
Rosemary Powell
Abstract Population estimates of birds have a wide range of practicalconservation uses, as well as being of enduring interest to many birdwatchers.Following previous reports by the Avian Population Estimates Panel, in 1997 and2006, we present the third collation of population estimates of birds in GreatBritain and the United Kingdom. There are now thought to be about 84 millionbreeding pairs of birds in the UK. The ten commonest species contribute 57% ofthis total, with Wren Troglodytes troglodytes alone providing one in ten of ourbreeding birds. In all, 23 species exceed one million breeding pairs. The individualpopulation estimates come from a wide variety of sources, many fromextrapolation of previous estimates by recognised trend measures, others fromnew surveys and novel analytical approaches developed since the last report.Despite the exceptional level of detail available for some species, many gaps in our knowledge remain. Recommendations are made to allow a continuingimprovement in our understanding of the numbers of birds in GB and the UK.There are many opportunities for volunteer and amateur birdwatchers to make asignificant contribution.

How many birds are there in a popula-tion? Sometimes the most straight-forward of questions can be the most
difficult to answer. For most species, it isimpossible to count every individual and sobird numbers are estimated from samplecounts, using a variety of statistical tech-niques and assumptions about behaviour anddetectability. Yet bird numbers are inherentlydynamic, fluctuating within and betweenyears as a result of reproduction, mortality,immigration and emigration (Newton 1998).Consequently, the emphasis of much popula-tion-based research involves generating andunderstanding population trends, rather thantotal numbers. Nonetheless, the absolute sizeof an animal population is still important inconservation terms, in particular for therarest species, which may be under threat ofextinction (Mace 1994).
The UK statutory conservation agenciesand relevant non-governmental organisa-tions have previously collaborated throughthe Avian Population Estimates Panel (APEP)to collate the best estimates of the size ofbreeding and non-breeding bird populations.Both previous reports were published in BB,in 1997 (Stone et al. 1997, APEP 1) and 2006
(Baker et al. 2006, APEP 2). Their purposewas to present a consensus view on the mostappropriate estimates for a range of conser-vation applications. In 2002, the Joint NatureConservation Committee (JNCC) acknowl-edged the value to conservation agencies of asingle, quality-assured source of populationestimates for statutory conservation purposesand endorsed the APEP process (Stroud et al.2002).
The significance of the APEP’s work hasincreased with recent developments in Euro-pean bird conservation policy. Article 12 ofthe European Union’s (EU) Directive on theconservation of wild birds (2009/147/EC)requires Member States to submit a triennialreport on the implementation of the Direc-tive. Previous such reports (e.g. Defra 2007)focused on processes, with little or no assess-ment of the efficacy of Directive implemen-tation. However, a new reporting format hasnow been agreed, which moves Article 12reporting to a six-year cycle and focuses onassessment of species status (populationsizes, trends and distributions, and changesin these parameters over time). The first suchreporting cycle is being undertaken jointlywith BirdLife International, and thus will
65British Birds 106 • February 2013 • 64 –100
Population estimates of birds in Great Britain and the United Kingdom
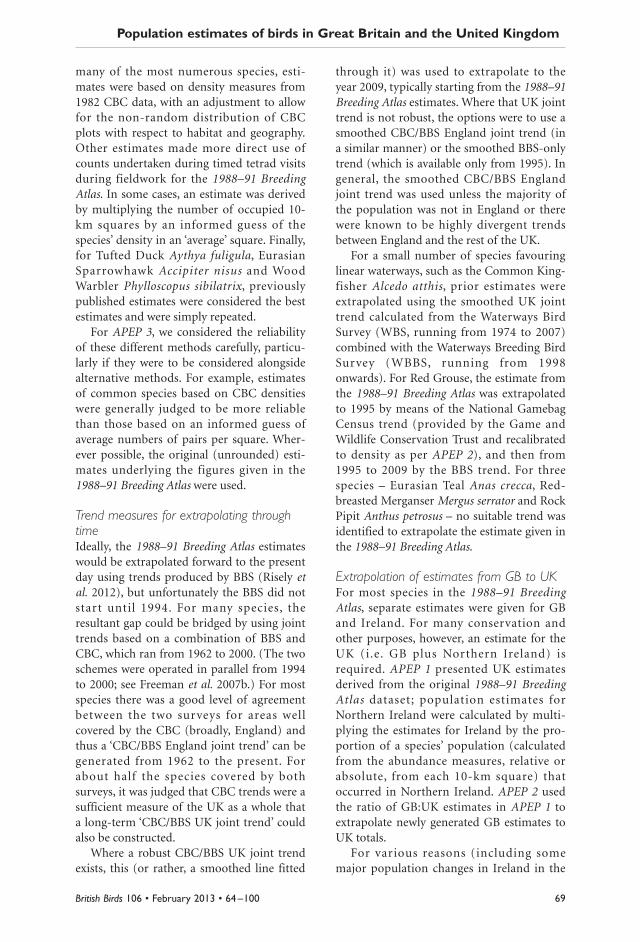
56. White-tailed Eagle Haliaeetus albicilla, Mull, Argyll, September 2012. This spectacular raptor,successfully reintroduced to Scotland in the late twentieth century, is well monitored by the RBBPand we have a very good estimate of its current population.
Graeme Willets

66
Musgrove et al.
British Birds 106 • February 2013 • 64 –100
contribute to a wider assessment of the statusof birds in Europe (and the third edition ofBirds in Europe; see BirdLife International2004). To encourage national joint assess-ments between Member State authorities andthe respective BirdLife partners, the Euro-pean Commission has promoted the APEP asa model of good working.
This, the third APEP report, presents themost recent population estimates for bothGreat Britain and the United Kingdom.These, together with other data and informa-tion, will support the UK’s Article 12 reportto the EU due for submission in December2013. However, we hope that the estimatesare also interesting and informative for amuch wider range of users.
ScopeSpecies, subspecies and biogeographicpopulationsAll species in Categories A and C of theBritish List were considered but other non-native species were excluded. Population esti-mates were principally sought at species levelbut for some species it was possible to giveseparate estimates of different subspecies.This was of particular interest for subspecieswith a distinct legal status and/or those con-
sidered endemic to parts of the UK. However,because of a lack of knowledge of distribu-tion, it was not possible to give estimates forthree currently recognised endemic sub-species: Meadow Pipit Anthus pratensis whist-leri, Linnet Carduelis cannabina autochthonaand Yellowhammer Emberiza citrinella caligi-nosa (and estimates for some other sub-species are similarly problematic). For somewaterbirds, it is common practice to treatclearly delineated biogeographic populationsseparately, and we follow Musgrove et al.(2011) in this regard.
Geographic areaAs far as possible, separate estimates havebeen produced for Great Britain (GB) and theUnited Kingdom (UK). All estimates excludethe Channel Islands. The Isle of Man (IoM) isnot part of GB or the UK, but its exclusionfrom most population estimates is generallynot straightforward and most estimates areactually for GB+IoM and UK+IoM. For mostspecies, this makes very little difference to theestimates, especially following rounding.However, for five species (Hen Harrier Circuscyaneus, Peregrine Falcon Falco peregrinus,Ringed Plover Charadrius hiaticula, HerringGull Larus argentatus and Red-billed Chough
57. Little Gull Hydrocoloeus minutus, Lancashire & N Merseyside, April 2012. One of the mostdifficult groups, in terms of estimating national population size, is that of non-breeding seabirds.
Steve Young/Birdwatch

Pyrrhocorax pyrrhocorax) the Isle of Man con-tributes a significant and calculable propor-tion of the GB/UK total; for these, separateIoM estimates are presented (together withstrict GB and UK estimates). Estimates mostlyexclude offshore areas out of sight of land,although this definition may be stretched byaerial survey data incorporated into CommonScoter Melanitta nigra and Red-throatedDiver Gavia stellata estimates.
SeasonsBreeding-season estimates are presented forall species with at least one case of provenbreeding from 2006 onwards. Appendix 3covers those other species where there was alower level of breeding evidence, plus anumber of historical breeding species thatexhibited no breeding evidence, over thesame period.
It was harder to define those species forwhich non-breeding estimates should be pre-sented. The precise definition of the non-breeding season varies according to speciesand estimation technique (as set out in thispaper and in those referenced) and thisshould be taken into account. In general,non-breeding estimates were omitted forlargely resident species, except for waterbirds
where statutory site protection and reportingis based around non-breeding estimates. Insome cases (such as Blackbird Turdus merulaand Common Chaffinch Fringilla coelebs),common residents are supplemented bylarge-scale autumn arrivals, but estimates ofnon-breeding numbers have not beenattempted for these species owing to a lack ofsuitable data sources. However, estimateshave been produced for species that are sub-stantially more numerous outside thebreeding season. These include scarce win-tering species (such as Great Grey ShrikeLanius excubitor) but not scarce passagemigrants (such as Barred Warbler Sylvianisoria). Rare migrants and vagrants (speciescovered by BBRC) were excluded unless therewere recent breeding records.
Estimating non-breeding numbers ofseabirds is particularly difficult, both in termsof monitoring species away from breedingcolonies and in terms of the passage of manyspecies through UK waters. In most cases,such estimates have been omitted. Estimatesof passage numbers of other species are alsoexcluded, with the exception of the globallythreatened Aquatic Warbler Acrocephaluspaludicola, which occurs here only at thispoint in its life-cycle.
67British Birds 106 • February 2013 • 64 –100
Population estimates of birds in Great Britain and the United Kingdom
58. Barn Owl Tyto alba, Northumberland, February 2010. In many parts of the UK, this is the mostfrequently encountered owl, hunting in daylight in a variety of open habitats; and yet, in terms ofestimating population size, it is surprisingly poorly known.
rspb-images.com
68
Musgrove et al.
British Birds 106 • February 2013 • 64 –100
TimescaleThe aim has been to collate the most recentlypublished estimates. However, many of theestimates presented here are based on novelanalyses that extrapolate from previouslypublished estimates. In these cases, breeding-season estimates have been extrapolatedmostly to 2009 (as described below).
MethodsFor every combination of species, geograph-ical area and season, details of the mostrecent published estimate were identified. Inaddition, for older estimates (2004 or earlier)the possibility of extrapolating those esti-mates forward in time was investigated, asdescribed below. In some cases, more thanone estimate was available for a givenspecies/region/season combination, when acollective decision was made on the mostappropriate one to use.
Many of the estimates in APEP 1 andAPEP 2 were derived from three national birdatlases – the 1968–72 Breeding Atlas (Shar-rock 1976), 1981–84 Winter Atlas (Lack 1986)and 1988–91 Breeding Atlas (Gibbons et al.1993). Data from Bird Atlas 2007–11 (Balmeret al. in prep.) were mostly not available for
APEP 3, although this will be a key source ofinformation for APEP 4. However, prelimi-nary data from the new atlas was helpful insome instances, particularly where discrepan-cies arose between multiple estimates derivedby different methods.
1. Common breeding species:extrapolation from the 1988–91Breeding Atlas For many common species, APEP 1 simplypresented estimates published in the 1988–91Breeding Atlas. In APEP 2, these estimateswere extrapolated forwards according to themost appropriate trend information avail-able, generally the Common Birds Census(CBC) or Breeding Bird Survey (BBS) trendsfrom the time. For APEP 3, estimates formany common species were generated by anequivalent procedure, but close attention waspaid to both the means of derivation of theoriginal estimate and which trend measure touse for extrapolation.
Original estimatesBreeding population estimates were pre-sented for all species in the 1988–91 BreedingAtlas but a variety of methods were used. For
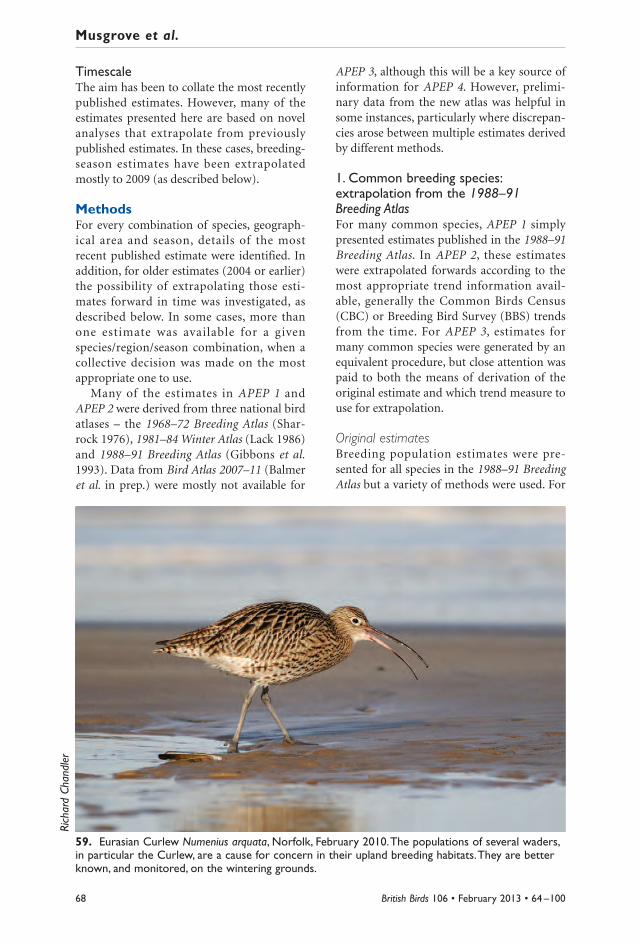
59. Eurasian Curlew Numenius arquata, Norfolk, February 2010. The populations of several waders,in particular the Curlew, are a cause for concern in their upland breeding habitats. They are betterknown, and monitored, on the wintering grounds.
Richard Chandler
many of the most numerous species, esti-mates were based on density measures from1982 CBC data, with an adjustment to allowfor the non-random distribution of CBCplots with respect to habitat and geography.Other estimates made more direct use ofcounts undertaken during timed tetrad visitsduring fieldwork for the 1988–91 BreedingAtlas. In some cases, an estimate was derivedby multiplying the number of occupied 10-km squares by an informed guess of thespecies’ density in an ‘average’ square. Finally,for Tufted Duck Aythya fuligula, EurasianSparrowhawk Accipiter nisus and WoodWarbler Phylloscopus sibilatrix, previouslypublished estimates were considered the bestestimates and were simply repeated.
For APEP 3, we considered the reliabilityof these different methods carefully, particu-larly if they were to be considered alongsidealternative methods. For example, estimatesof common species based on CBC densitieswere generally judged to be more reliablethan those based on an informed guess ofaverage numbers of pairs per square. Wher-ever possible, the original (unrounded) esti-mates underlying the figures given in the1988–91 Breeding Atlas were used.
Trend measures for extrapolating throughtimeIdeally, the 1988–91 Breeding Atlas estimateswould be extrapolated forward to the presentday using trends produced by BBS (Risely etal. 2012), but unfortunately the BBS did notstart until 1994. For many species, theresultant gap could be bridged by using jointtrends based on a combination of BBS andCBC, which ran from 1962 to 2000. (The twoschemes were operated in parallel from 1994to 2000; see Freeman et al. 2007b.) For mostspecies there was a good level of agreementbetween the two surveys for areas wellcovered by the CBC (broadly, England) andthus a ‘CBC/BBS England joint trend’ can begenerated from 1962 to the present. Forabout half the species covered by bothsurveys, it was judged that CBC trends were asufficient measure of the UK as a whole thata long-term ‘CBC/BBS UK joint trend’ couldalso be constructed.
Where a robust CBC/BBS UK joint trendexists, this (or rather, a smoothed line fitted
through it) was used to extrapolate to theyear 2009, typically starting from the 1988–91Breeding Atlas estimates. Where that UK jointtrend is not robust, the options were to use asmoothed CBC/BBS England joint trend (ina similar manner) or the smoothed BBS-onlytrend (which is available only from 1995). Ingeneral, the smoothed CBC/BBS Englandjoint trend was used unless the majority ofthe population was not in England or therewere known to be highly divergent trendsbetween England and the rest of the UK.
For a small number of species favouringlinear waterways, such as the Common King-fisher Alcedo atthis, prior estimates wereextrapolated using the smoothed UK jointtrend calculated from the Waterways BirdSurvey (WBS, running from 1974 to 2007)combined with the Waterways Breeding BirdSurvey (WBBS, running from 1998onwards). For Red Grouse, the estimate fromthe 1988–91 Breeding Atlas was extrapolatedto 1995 by means of the National GamebagCensus trend (provided by the Game andWildlife Conservation Trust and recalibratedto density as per APEP 2), and then from1995 to 2009 by the BBS trend. For threespecies – Eurasian Teal Anas crecca, Red-breasted Merganser Mergus serrator and RockPipit Anthus petrosus – no suitable trend wasidentified to extrapolate the estimate given inthe 1988–91 Breeding Atlas.
Extrapolation of estimates from GB to UKFor most species in the 1988–91 BreedingAtlas, separate estimates were given for GBand Ireland. For many conservation andother purposes, however, an estimate for theUK (i.e. GB plus Northern Ireland) isrequired. APEP 1 presented UK estimatesderived from the original 1988–91 BreedingAtlas dataset; population estimates forNorthern Ireland were calculated by multi-plying the estimates for Ireland by the pro-portion of a species’ population (calculatedfrom the abundance measures, relative orabsolute, from each 10-km square) thatoccurred in Northern Ireland. APEP 2 usedthe ratio of GB:UK estimates in APEP 1 toextrapolate newly generated GB estimates toUK totals.
For various reasons (including somemajor population changes in Ireland in the
69British Birds 106 • February 2013 • 64 –100
Population estimates of birds in Great Britain and the United Kingdom
70
Musgrove et al.
British Birds 106 • February 2013 • 64 –100
intervening years), it was felt that extrapola-tion of estimates from GB to UK was an areawhere it was reasonable to use raw data fromBird Atlas 2007–11. The extrapolation usedwas a combination of two factors. First, theratio of the numbers of 10-km squares withpossible, probable or confirmed breeding evi-dence in GB and UK was calculated. Second,a measure of average density in both GB andIreland was derived by comparing the resultsof Bird Atlas 2007–11 timed tetrad visits (firsthour only, and adjusted to account for dif-fering levels of coverage in different areas).
2. Distance samplingFor many common species, in addition to thetrend-based extrapolations described above,an alternative set of population estimates wasavailable following the method described inNewson et al. (2008). (The estimates for 2006published by Newson et al. were extrapolatedforwards to 2009 using the BBS smoothedtrend.) This method is based entirely on BBSdata and the fact that observations areassigned to multiple distance bands from thesurvey transect. Statistical analyses can inferthe proportion of birds missed by observers,and thus how many birds in total werepresent in the area surveyed. From this, an
estimate of the total number of birds inGB/UK can be generated and (as a firstapproximation) this can be halved to give thenumber of breeding pairs. This method alsoallows 95% confidence limits to be presented.
This approach is statistically sound but islikely to work better for some species than forothers, depending on the nature of thespecies. For example, for many species thedetection of males (by song) is much morelikely than detection of females, and thus themethod underestimates the true number ofpairs present. Ideally, the estimated numberof birds would be divided by a factor thatbetter represented the relative detectability ofeach sex (rather than simply dividing by two). In some cases, for exampleGrasshopper Warbler Locustella naevia,almost all the birds detected during BBSvisits are singing males, and thus the esti-mated number of birds would be approxi-mately equal to the estimated number ofpairs. For most other species, the divisionfactor will lie somewhere between one andtwo.
Distance sampling also makes theassumption that all birds on the transect linewould be detected, and that only distanceaffects the chance of detection. In reality,
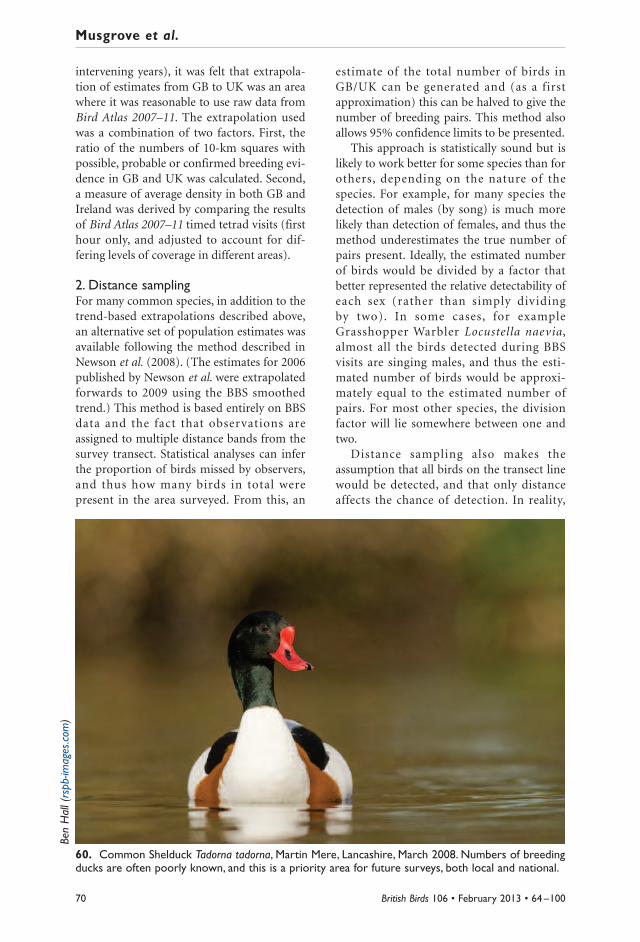
60. Common Shelduck Tadorna tadorna, Martin Mere, Lancashire, March 2008. Numbers of breedingducks are often poorly known, and this is a priority area for future surveys, both local and national.
Ben Hall (rspb-images.com)
detection is affected by other factors, particu-larly habitat. Furthermore, since this methodestimates numbers of birds, not breedingpairs, it will overestimate the number of pairsfor species where there is a substantial non-breeding component to the population. Forexample, most Common Buzzards Buteobuteo do not breed until their third year, andso the number of breeding pairs would belower than suggested by this method. Finally,although BBS squares are a stratified randomsample, and so produce a robust measure ofchange, the transects are by default likely tofollow linear features such as roads, paths,hedges and waterways. Thus, for example, anobserver is more likely to detect a MoorhenGallinula chloropus than a Red-legged Par-tridge Alectoris rufa.
The panel considered the estimates pro-duced by distance sampling alongside thoseproduced by other methods on a case-by-case basis. It was felt that the approach waslikely to produce more accurate estimates forsome species, but was less good for others. Inparticular, distance sampling was felt usefulfor upland and urban birds, but less useful incases where there was a large and uncertaindifference in detectability between the sexes,or where there was a substantial non-breeding component. If there was no clearevidence as to which of two estimates waslikely to be more accurate, the earlierapproach (i.e. extrapolating prior estimatesby CBC/BBS trends) was retained.
3. Rare breeding birdsFor the rarest breeding birds, including non-native species, data from the Rare BreedingBirds Panel (RBBP) were used (e.g. Holling etal. 2012). In most cases, to account for popu-lation changes and variation in reporting anddetection of these species, means were calcu-lated over the five-year period 2006–10. ForLady Amherst’s Chrysolophus amherstiae andGolden Pheasants C. pictus, RBBP data weresupplemented by information from relevantcounty bird reports. More recent data wereavailable for some species but these were gen-erally incomplete, so are not included here.Two exceptions to that involve EurasianBittern Botaurus stellaris (for which the datawere sufficiently complete that mean valuesbased on 2007–11 are given) and Great White
Egret Ardea alba (confirmed nesting for thefirst time in 2012).
For most species, a range is presented,where the minimum is the mean number ofconfirmed pairs and the maximum is themean number of possible, probable and con-firmed pairs. If these two figures are thesame, a single figure is given. Hybrid pairs arenot included. Where the mean maximumwould round down to zero, a range of 0–1pairs is shown. For seven species – CommonQuail Coturnix coturnix, Eurasian Bittern,Water Rail Rallus aquaticus, Corn Crake Crexcrex, Firecrest Regulus ignicapilla, Bearded TitPanurus biarmicus and Cetti’s Warbler Cettiacetti – where breeding is relatively difficult toprove, just the mean number of reported ter-ritories is given. A single figure of mean con-firmed pairs is also given for threewell-monitored species: Stone-curlewBurhinus oedicnemus, Avocet Recurvirostraavosetta and Roseate Tern Sterna dougallii.For Common Goldeneye Bucephala clangula,a mean of estimated egg-laying females ispresented. For Red Kite Milvus milvus there isknown to be significant under-reporting tothe RBBP as the species becomes more wide-spread and abundant, so the RBBP’s esti-mates (rather than the reported figures) areused here. Data for the Osprey Pandion hali-aetus are similarly incomplete, and the RBBPestimate of 200–250 pairs in 2010 is usedhere.
4. Breeding seabirdsIn APEP 2, estimates of breeding seabirdswere based on Seabird 2000, a national censuscarried out between 1998 and 2002 (Mitchellet al. 2004), except for Northern GannetMorus bassanus (all colonies were surveyed in2003–04; Wanless et al. 2005). ExtrapolatingSeabird 2000 estimates forward to the presentwas considered, but it was felt that there wasinsufficient knowledge of how representativethe trends generated by the Seabird Monitoring Programme are (http://jncc.defra.gov.uk/page-1550). For most seabirds,the APEP 2 figures are thus repeated here,although with an assessment of whetherthese should now be considered too high ortoo low. The exceptions are Roseate Tern andMediterranean Gull Larus melanocephalus,for which RBBP data are used.
71British Birds 106 • February 2013 • 64 –100
Population estimates of birds in Great Britain and the United Kingdom

5. Miscellaneous breeding estimatesFor a wide range of species, breeding esti-mates have been sourced from the literature,including novel surveys or analyses ofexisting data. In some cases, older publishedestimates have been extrapolated forward to2009 as described above for estimates fromthe 1988–91 Breeding Atlas. For other species,however, no suitable trend could be foundfor the purposes of extrapolation. For theGrey Heron Ardea cinerea, estimates of thebreeding population are derived annuallyfrom the Heronries Census and were pro-vided by the BTO. For five species of wildfowl– Greylag Goose Anser anser, Canada GooseBranta canadensis, Barnacle Goose B. leu-copsis, Egyptian Goose Alopochen aegyptiacaand Mandarin Duck Aix galericulata –breeding population estimates were simplyderived by dividing the winter estimate by astandard value of three (Meininger et al.1995). For some other species, novel analysesor compilations were undertaken for APEP 3;these are detailed in footnotes to Appendix 1and involve breeding estimates for CommonEider Somateria mollissima and Tawny Strixaluco, Long-eared Asio otus and Short-earedOwls A. flammeus.
6. Wintering waterbirdsEstimates of wintering waterbirds were takenfrom Musgrove et al. (2011). These estimateswere based on a variety of data sources,mainly the Wetland Bird Survey (WeBS),Goose & Swan Monitoring Programme(GSMP), Non-estuarine Coastal WaterbirdSurvey (NEWS), Winter Gull Roost Survey(WinGS) and a variety of other sources,including compilations of county birdreports. The majority of these estimatesrelate to the period 2004/05–2008/09. Theestimates published in Musgrove et al. (2011)were for GB only; the UK estimates presentedhere were produced by entirely equivalentmeans.
7. Estimates of scarce winter visitorsbased on BirdTrack/BirdGuides dataAPEP 1 presented winter estimates forRough-legged Buzzard Buteo lagopus, GreatGrey Shrike, Shore Lark Eremophila alpestris,Waxwing Bombycilla garrulus, Water PipitAnthus spinoletta and Lapland Bunting Cal-carius lapponicus. The first two were omittedin APEP 2, but the remainder were included,using estimates dating back to the 1981–84Winter Atlas. A number of other scarce, non-
72
Musgrove et al.
British Birds 106 • February 2013 • 64 –100
61. Rock Pipit Anthus petrosus, Cornwall, September 2011. In population terms this is an especiallypoorly known species, and one for which local, amateur studies could potentially provide significantnew information.
Richard Chandler
breeding species, for which no previous esti-mates have ever been published, also winterannually in small numbers. For APEP 3, anew approach for scarce wintering specieswas developed. All records were extractedfrom the BTO/RSPB/BWI/SOC/WOS Bird-Track database, which for species in questionalso included all records from the BirdGuidesdatabase. Since not all these records are vali-dated, an initial sense check was undertaken,particularly on higher counts, and a fewclearly erroneous records were removed.
These records were then summarised byestablishing the peak count per 10-km squareper month/year; these counts were thensummed to give GB/UK totals permonth/year. Peak monthly totals per winterwere derived, and the mean of these peakscalculated over the five winters 2006/07 to2010/11. Records were restricted to the mid-winter period of December to March forYellow-browed Warbler Phylloscopus inor-natus since the autumn-passage figures aremuch higher; a similar approach was consid-ered for both Great Grey Shrike and LaplandBunting, but not implemented because thediscrepancy between autumn and winter wasless (although still marked). Note that the‘winter’ estimate for White-billed DiverGavia adamsii is perhaps better considered aminimum measure of spring passage.
This approach makes a number of broadassumptions, chiefly that in any given monthbirds observed within a 10-km square relateto the same mobile individuals, whereasthose in adjacent squares are considered dif-ferent individuals. This is a necessary com-promise between avoiding double-countingof noteworthy species as they move locally,while wanting to maximise the ability toaccount for birds found in less regularlyvisited areas. The assumptions will be vari-ably successful for different species andfurther refinements are doubtless possible.
8. Estimates from the 1981–84 Winter AtlasAs mentioned above, winter estimates werenot generated for most landbirds, particu-larly residents. However, estimates of winternumbers of Fieldfare Turdus pilaris, RedwingT. iliacus, Brambling Fringilla montifringillaand Snow Bunting Plectrophenax nivalis were
retained from APEP 2. These were derivedfrom the 1981–84 Winter Atlas; the data areold and considered to be of low reliability butthere is nothing else available to describethese more numerous winter migrants. Anestimate of winter numbers of Black Red-starts Phoenicurus ochruros is also incorpo-rated from the 1981–84 Winter Atlas; this isthought to be an underestimate but theapproach based on BirdTrack data also pro-duced numbers that were clearly too low(based on draft results for Bird Atlas2007–11).
9. Aquatic Warbler This is the only species for which an estimateof passage numbers was generated, by col-lating records of all ringed birds and all pub-lished records from county bird reportsduring 2006–10. A small number of recordsfrom BirdTrack and BirdGuides were used tofill the gaps from any unpublished countyreports. This estimate is clearly just a bareminimum but it is of significance not only inrelation to the species’ globally threatenedstatus but also in relation to its Birds Direc-tive Annex 1 status requiring the classifica-tion of Special Protection Areas. The estimatehere should be considered alongside those of40 individuals in APEP 1 (1987–92) and 33 inAPEP 2 (1996–2000), derived from a similarmethodology.
ResultsAppendix 1 gives population estimates forGB/UK bird species, while those for selectedsubspecies or biogeographical populationsare shown in Appendix 2 (the speciesinvolved are denoted with an asterisk inAppendix 1). For consistency, estimates arerounded to two significant figures (to re -iterate: wherever possible, newly generatedestimates have been based on originalunrounded figures but in some cases theoriginal published sources do not giveunrounded figures). Note that for specieswhich are relatively scarce in NorthernIreland, the estimates for GB and UK mayappear identical simply as a result ofrounding.
All the non-breeding estimates relate toindividuals. Breeding-season estimates aremostly given as ‘pairs’ or ‘territories’,
73British Birds 106 • February 2013 • 64 –100
Population estimates of birds in Great Britain and the United Kingdom

74
Musgrove et al.
British Birds 106 • February 2013 • 64 –100
depending on survey methodology, and formost purposes the two terms can be usedinterchangeably. A number of species(including those with a more complexbreeding biology) are more sensibly esti-mated in other units, as shown in Appendix1. There are statutory requirements for Red-billed Chough population estimates to bepresented both as breeding pairs and asnumbers of individuals.
So that readers can trace the derivation ofeach estimate, the section number of theMethods section (1, 2, etc.) is stated witheach estimate; for those estimates thatinvolved forwards extrapolation, the trendmeasure used is also given (e.g. ‘1–BBS’means extrapolation from a 1988–91Breeding Atlas estimate via the BBS trend).
As with previous APEP reports, there is abroad reliability scoring attached to each esti-mate, ranging from 1 (good) to 3 (poor).These reliability scores take into account thederivation of original estimates and anymethods used for extrapolation. As a generalrule, estimates with reliability score 1 arebased on direct counts with a minimum ofextrapolation, those with reliability score 2have been arrived at through extrapolationfrom reliable figures (or with a small amountof uncertainty around the estimate), whilethose with reliability score 3 were based onassumptions and opinion in place of actualfieldwork. Those estimates in the last cate-gory are still considered the best estimatescurrently available, although in most casesthey highlight priorities for future work.
The reliability scores clearly rely heavilyon the means of derivation. For example,estimates of many common breeding passer-ines are based on extrapolation (using aCBC/BBS UK joint trend) of estimates pre-sented in the 1988–91 Breeding Atlas, whichthemselves were largely based on densitymeasures derived from 1982 CBC data. Suchestimates (indicated as ‘1–UK’ in the appen-dices) are based on a foundation of sounddata, but have involved a large degree ofextrapolation – and thus the majority of esti-mates for this method are given a reliabilityscore of 2.
In a number of cases, the estimates pre-sented are known to be either too high or toolow, but suitable data sources were not avail-
able to update them satisfactorily. In caseswhere an estimate is known to be too low it ismarked with a ‘+’, and where an estimate is toohigh it is marked with a ‘-’. It is important toseparate this measure of over- or under-esti-mation from reliability. For example, thebreeding estimate for Arctic Skua Stercorariusparasiticus is felt to be a good estimate of thepopulation size for the period 1998–2002,when it was produced, but it is also felt to over-represent the size of the current population.
Footnotes are provided for a number ofthe estimates that require further explana-tion, in particular where estimates werejudged to be less reliable. Finally, referencesshow the original source of an estimate,which should always be acknowledged byusers of population estimates.
Discussion and recommendationsAPEP findingsCovering just a few pages, Appendices 1 and2 represent millions of hours of effort fromthe UK’s ornithological community. The birdpopulations of the UK are often referred to asthe best-studied of this taxonomic groupanywhere in the world. The foundations forthat situation can be traced back to moni-toring schemes such as the Wetland BirdSurvey and the CBC in the 1960s, fieldworkfor the first national atlas, between 1968 and1972, and the creation of the RBBP in 1973.Developments since, such as rolling pro-grammes of single-species surveys, thelaunch of the BBS in 1994, further nationalatlases, and other initiatives such as Bird-Track, have served to improve our knowl-edge. Although led by professionals, each ofthese schemes depends on a massive contri-bution of time, effort and expertise from vol-unteer observers across the UK, which wewish to recognise here. The efforts of volun-teers underpin this report, and the appliedconservation uses for which these estimatesare fundamental.
The figures here suggest that the UK has abreeding bird population of over 84 millionpairs (with 79 million in GB). The ten com-monest species contribute 57% of that total,with Wren Troglodytes troglodytes alone pro-viding one in ten of our breeding birds and23 species surpassing the one-million-pairsmark. In contrast, the breeding populations
of the 100 rarest species provide about 0.1%of the total; many of the species that interestbirdwatchers greatly actually contribute atiny proportion of our avifauna.
There are an estimated 168 millionbreeding birds in the UK but, given lingeringwinter visitors, passing migrants and non-breeders, the number of birds in the UK eachspring must be considerably higher. Thosenumbers rise rapidly with the production ofnew offspring, then fall steeply as a result ofthe higher mortality of young birds. Inautumn, surviving offspring are bolstered bypassage migrants and winter visitors, not tomention the release of non-native gamebirds.If we estimate, conservatively, that breedingpopulations have doubled by early autumn,allow for wintering waterbirds (12.5 million),thrushes and landbirds, plus up to 35 milliongamebirds (mainly Common PheasantsPhasianus colchicus) released for shootingevery autumn, it is reasonable to think theremay be over 400 million individual birds atlarge in the UK countryside in autumn.
The data in Appendices 1 and 2 can bebroken down in so many insightful ways.More than 8% of our breeding birds arepigeons and doves, more than double thenumber of all seabirds combined, whereas
less than 0.3% are raptors or owls. About 3%of our breeding birds are non-native species,mostly Pheasants, Red-legged Partridges andCanada Geese. Comparing individual speciesestimates is often surprising. How manybirdwatchers, for example, would guess thatwe have similarly sized breeding populationsof Common Kestrel Falco tinnunculus andLeach’s Storm-petrel Oceanodroma leucorhoa,or of Scottish Crossbill Loxia scotica andLittle Grebe Tachybaptus ruficollis? We invitereaders to use the fascinating estimates pre-sented here to make their own investigations.
Estimate reliabilityOf course, the statements and comparisonsin the previous paragraph are only as robustas the estimates on which they are based; andhere we must face the fact that, despite theUK’s wealth of monitoring effort, for mostspecies we still feel that the estimates couldbe improved. Of 492 estimates in Appendix1, only 31% are classified as ‘good’ (reliabilityscore 1), and 18% as ‘poor’ (score 3.) Thereare some clear patterns in what determineshow robust our population estimates are. Asfig. 1 illustrates, we have greater confidencein the reliability of estimates for rarer species,whereas there are no ‘good’ estimates of
75British Birds 106 • February 2013 • 64 –100
Population estimates of birds in Great Britain and the United Kingdom
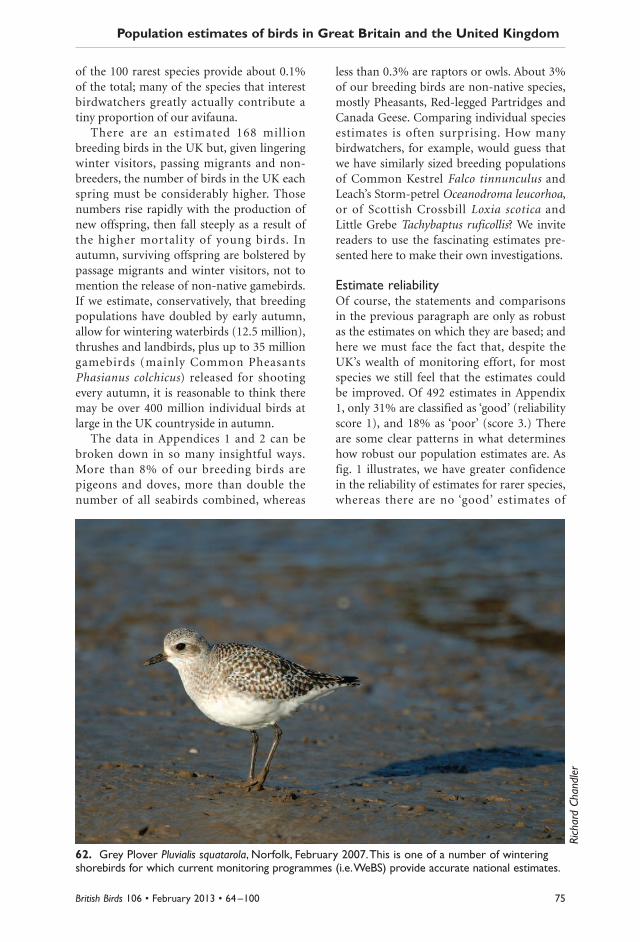
62. Grey Plover Pluvialis squatarola, Norfolk, February 2007. This is one of a number of winteringshorebirds for which current monitoring programmes (i.e. WeBS) provide accurate national estimates.
Richard Chandler

abundant species; note, however, that thegreatest proportion of ‘poor’ assessmentsapply to populations in intermediate sizeclasses. It is not clear whether this pattern isdue to the population sizes themselves, ordriven by the variation in the surveys andother estimation methods used for differentsizes of population. There are also clearbiases in the reliability of estimates accordingto their derivation (fig. 2). Unsurprisingly,those derived from complete censuses areconsidered the most robust, and so estimatesfor breeding seabirds from Seabird 2000 arewell regarded. Of course, while these arehigh-quality estimates, they are now alsorather dated, and a new census, planned forthe years around 2015, is extremely impor-tant to ensure that this good state of knowl-edge is maintained. The two next ‘best
performing’ methods of derivation also rely,in many cases, on efforts to count entire populations: for rare breeding birds by thecollation of all records by the RBBP(although for many species RBBP coverage isincomplete – see Holling et al. 2012), and forwintering waterbirds through WeBS andGSMP.
It is notable that none of the 147 estimatesfor widespread breeding species, calculatedeither by extrapolating forward estimates inthe 1988–91 Breeding Atlas or by distancesampling using BBS data, were considered tobe of ‘good’ quality. For the former, therewere often doubts about how robust theinitial atlas estimates were, some of thembased on extrapolation from local densityestimates which may not have been represen-tative of the national picture. In many cases
76
Musgrove et al.
British Birds 106 • February 2013 • 64 –100
abundant common moderately scarce rare very rare extremely common rare
Fig. 1. The variation of confidence in estimate reliability across bird abundance groups; breedingpopulation estimates only. Key: extremely rare = 0–10 breeding pairs, very rare = 11–100, rare = 101–1,000, scarce = 1,001–10,000,moderately common 10,001–100,000, common 100,001–1,000,000, abundant 1,000,000+.
100
90
80
70
60
50
40
30
20
10
0
% of estimates for abundance group
goodmoderatepoor
Fig. 2. The variation of confidence in estimate reliability by method of derivation; all estimates.
100
90
80
70
60
50
40
30
20
10
0% of estimates for derivation method
goodmoderatepoor
extrapolated distance- rare breeding other wintering scarce winter Aquaticfrom the sampled breeding seabirds breeding waterbirds winter estimates Warbler1988–91 BBS birds estimates visitors from the
Breeding Atlas Winter Atlas

these doubts were compounded by impreci-sion in the trends used to extrapolate forwardto the present day. The use of BBS data,through updates of the estimates publishedin Newson et al. (2008), enables a newapproach based on the BBS’s stratifiedrandom sampling, and should thus be free ofconcerns about bias in density estimates.However, this approach raises new issues,most notably how the estimate of individualsderived from BBS data relate to the numberof pairs published here. The assumption thatthe number of pairs is half the number ofindividuals estimated may be sufficientlyrobust for some species, such as WoodPigeon Columba palumbus, for which there islittle difference in the detectability of thesexes. But in many speciesmales are more detectablethan females. This informa-tion is essential for accurateconversion of density esti-mates to population esti-mates, but is currentlylacking for most species. Amodification to the BBSrequiring surveyors torecord the sex of birds,when known, or whetherbirds were singing, wouldenable this issue to betackled with more certainty.
In a number of cases,this new approach has pro-duced larger estimates forspecies than hitherto (i.e. inAPEP 2), sometimes forspecies we know to havedeclined in the interveningyears. These new estimatessuggest that we had under-estimated their populationsizes previously. Given suchchanges in methodologyand knowledge, for theseand many other estimates,we would strongly recom-mend against making com-parisons between estimatesfrom different APEP assess-ments to calculate trends.
Beyond these broadissues that affect many
species, often related to the monitoringschemes that estimates are derived from, thereare many species-specific issues that give riseto reliability scores of 3. There are severalcontenders for the least reliable estimate pre-sented here, such as breeding Water Rail andRock Pipit, and non-breeding Jack SnipeLymnocryptes minimus, Woodcock Scolopaxrusticolus, Common Snipe Gallinago galli-nago, Fieldfare, Redwing and Brambling. Forsuch species, what we present is essentially abest guess, informed by scant data; and it iscrucial to bear in mind the reliability scoreswhen using these estimates. And beyond that,there is a story in those estimates which we donot even attempt to present; for example, weknow that many common resident species are
77British Birds 106 • February 2013 • 64 –100
Population estimates of birds in Great Britain and the United Kingdom
63. Meadow Pipit Anthus pratensis, Tiree, Argyll, June 2007. The‘Scottish’ Meadow Pipit A. p. whistleri is an endemic subspecies, but one that is very poorly known in terms of its distribution.
Tom Marshall(rspb-images.com
)
supplemented by immigrants in the non-breeding season, in some cases substantiallyso, but at present we have no idea of thenumbers involved, nor a mechanism in placeto improve our understanding.
Recommendations: actions to improvepopulation estimatesWe are proud of the wealth of knowledgethat underpins this report, but there is muchto do to improve matters further. This is anideal opportunity to promote the value ofpopulation estimates and encourage effortsto improve reliability – in order to have fewer‘3’s and more ‘1’s in the next APEP report.
This section highlights some of the mostobvious shortfalls in current knowledge,including generic issues affecting largenumbers of species, others for particularspecies groups, and yet more for a number ofindividual species. While the APEP is con-cerned specifically with estimating popula-tion size, some of the missing informationrelates to this indirectly. For example, furtherinformation on population delineation, taxo-nomic status, or population densities (eitherin general or in poorly surveyed habitats) isoften required before robust population esti-
mates can be made. Furthermore, some ofthese recommendations relate not to countsof birds but to data gathered in other ways,such as by capture and marking.
The following list is not exhaustive, itsimply highlights priorities that could be pro-gressed over the coming few years. Some ofthese relate to large-scale surveys that requireadequate funding and some level of profes-sional input, others are small-scale studiesthat could be undertaken locally by volun-teers; progress on both fronts is important. Breeding ducks Perhaps surprisingly, we
currently have poor data on the breedingpopulations of a number of species:Common Shelduck Tadorna tadorna,Mandarin Duck, Gadwall Anas strepera,Eurasian Teal, Eider, Red-breasted Merganser and Goosander Mergus merganser among them. The variety ofhabitats and the different ranges of thesespecies mean that an entirely genericapproach is unlikely to work and bespokesurveys will be required.
Upland waders Although upland wadersare well suited to estimation by BBS dis-tance analyses, the poor coverage ofupland areas by BBS means that sample
78
Musgrove et al.
British Birds 106 • February 2013 • 64 –100
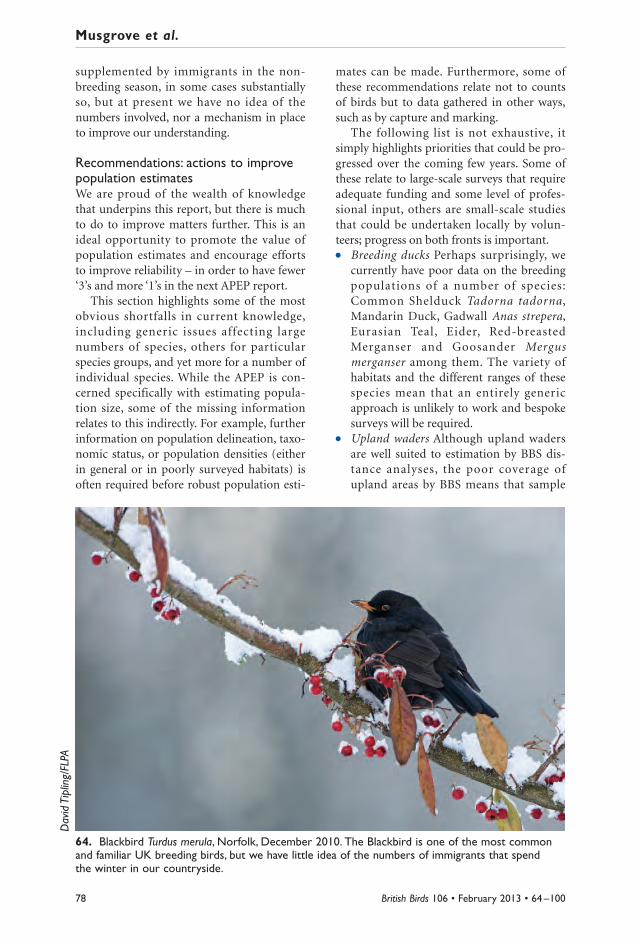
64. Blackbird Turdus merula, Norfolk, December 2010. The Blackbird is one of the most commonand familiar UK breeding birds, but we have little idea of the numbers of immigrants that spend the winter in our countryside.
David Tipling/FLPA
sizes are small, and targeted nationalsurveys have never been conducted forbreeding species such as the DunlinCalidris alpina, although local (designatedsite) surveys have been carried out.
Seabirds in the non-breeding season (‘atsea’) Numbers of both wintering andmigrant seabirds in our waters are poorlyknown, not surprisingly given the obviouslogistical challenges in survey work. Therehave been increasing efforts in recentyears, notably surrounding the globallythreatened Balearic Shearwater Puffinusmauretanicus, but how many skuas orLittle Gulls Hydrocoloeus minutus arethere?
Other marine waterbirds Similarly,numbers of most inshore marine water-birds, such as seaducks and divers, arepoorly known during the non-breedingseason. Site-based surveys in the pastdecade have improved our knowledgesubstantially but there are still major gapsin our understanding of population delin-eation and overall abundance. A co-ordi-nated programme of migration studiesand surveys is needed.
Dispersed wintering waterbirds Wetlandspecies such as Mallard Anas platyrhyn-chos and Moorhen occur in small or dis-
persed wetland habitats such as ditches,small ponds and linear wetlands. In somecases, these habitats support a high pro-portion of the total population and thusdata from WeBS do not provide a goodbasis for population estimation. Detailedstudies in some areas have provided thebasis for extrapolation at a national level(Musgrove et al. 2011), but more of theseare needed, particularly in some key areassuch as southwest England, Wales andScotland.
Wintering gulls Gulls are numerous andwidespread, and the UK holds interna-tionally important numbers of severalspecies, some of which appear to bedeclining. Wintering gulls generally forageaway from wetlands during the day andare not adequately covered by WeBS. Moretargeted surveys, based on counts at roosts(e.g. Banks et al. 2007), exist but are infrequent. Robust annual monitoring,particularly at key sites, augmented bymore comprehensive counts at roostsevery few years, is needed.
Breeding owls Surveys of nocturnal speciesare always challenging and the most reli-able data exist for the Little Owl Athenenoctua, the least nocturnal species. Long-eared and Short-eared Owls have recently
79British Birds 106 • February 2013 • 64 –100
Population estimates of birds in Great Britain and the United Kingdom
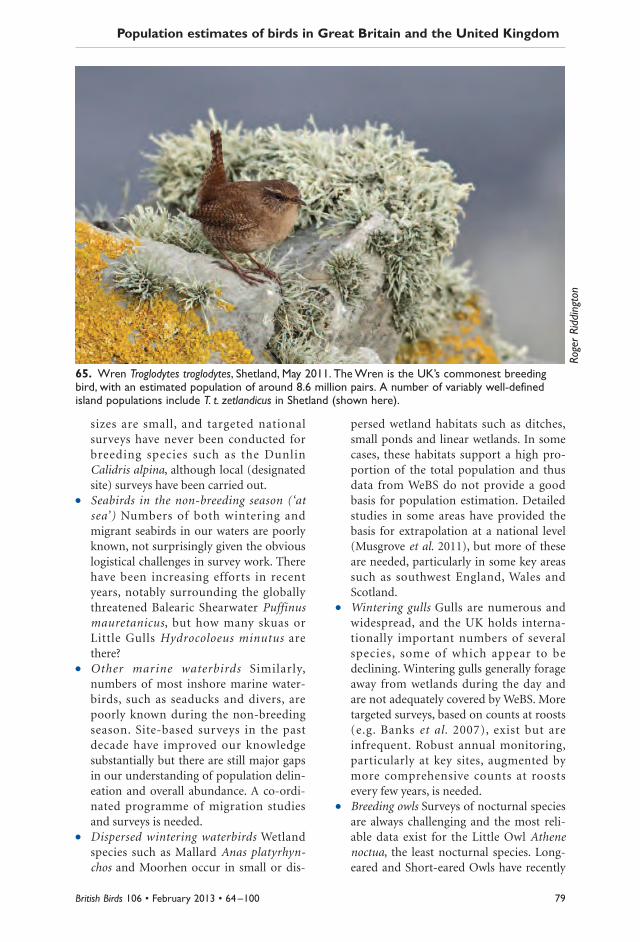
65. Wren Troglodytes troglodytes, Shetland, May 2011. The Wren is the UK’s commonest breedingbird, with an estimated population of around 8.6 million pairs. A number of variably well-definedisland populations include T. t. zetlandicus in Shetland (shown here).
Roger Riddington
been added to the RBBP list but it isunclear whether this will improve the ade-quacy of data collected, while the BarnOwl has not been surveyed since 1995–97,since when there is thought to have been asubstantial but unquantified populationincrease. The Tawny Owl estimate pre-sented here is also based on assumptionsthat would benefit from further testing.
BBS distance sampling As outlined above,new analyses of BBS distance data are asignificant development, particularly forthose species where existing density esti-mates were thought to be unreliable, suchas the urban and upland birds that werecovered poorly by the CBC. However,there remains much work to be done, par-ticularly on the detectability of birds andbiases due to the non-random selection ofBBS transect routes (albeit within ran-domly selected squares), to improve thisapproach.
Age of first breeding Knowing how thenumber of individuals in a given popula-tion relates to the number of breedingpairs is strongly dependent on this stat -istic. This is particularly important whenbreeding-season surveys measure thenumber of individuals, or when weattempt to estimate breeding populations
of resident birds from counts made inwinter.
Winter numbers of widespread species Asmentioned previously, we have extremelypoor knowledge of the population size ofwidely dispersed species in the winter,both ‘resident’ species, whose numbers areswelled by massive (but unquantified)immigration such as the Blackbird, andalso species more commonly regarded aswinter visitors such as Fieldfare, Redwingand Brambling.
Winter raptors and owls Despite goodmonitoring of many winter roosts of HenHarrier, coverage is far from complete,and our understanding of the winteringnumbers of Merlin Falco columbarius,Long-eared and Short-eared Owls is evenmore limited.
Individual species There are a number ofspecies, currently very poorly known,which can be tackled only by targeted,species-specific studies. Some of the mostobvious examples include PtarmiganLagopus muta, Water Rail (breeding andnon-breeding), Jack Snipe (non-breeding)and Common Snipe, Kingfisher, SandMartin Riparia riparia and Rock Pipit.Some of the work required to tackle these
shortfalls requires considerable funding,
80
Musgrove et al.
British Birds 106 • February 2013 • 64 –100
Tony Hamblin/FLPA
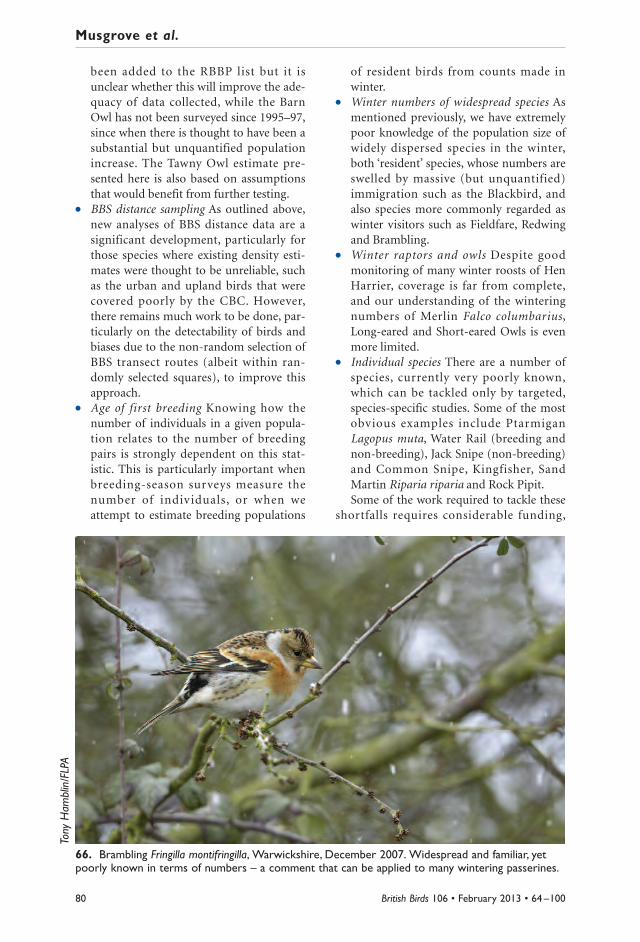
66. Brambling Fringilla montifringilla, Warwickshire, December 2007. Widespread and familiar, yetpoorly known in terms of numbers – a comment that can be applied to many wintering passerines.
particularly at a national level. However, inmany cases specific local studies would alsoprovide invaluable estimates, which could becombined with other information to extrap-olate to a national scale. Many of these couldbe undertaken by volunteers, and yieldresults of direct relevance to national popula-tion estimates – for example studies of theage of first breeding, or densities within spe-cific habitats or regions. Ringers also have animportant part to play, for example in esti-mating trends in abundance throughcapture-recapture studies of birds with lowdetectability during standard surveys, such asthe Water Rail and possibly snipes.
A simple example is that of passerinespecies such as Whinchat Saxicola rubetraand Rock Pipit, for which there have neverbeen national censuses, and for which thereare no well-founded baseline estimates.These species are not well monitored bynational schemes (such as BBS). The mostcomprehensive datasets available are thenational breeding atlases, but these do notallow accurate estimates of population size.Some local studies of breeding density wouldprovide data that could be extrapolatedacross the known range based on atlas data.This type of project is ideally carried out bykeen volunteer birdwatchers with good localknowledge, perhaps with support on studydesign and methods from professionalornithologists, and would make an invaluablecontribution to national ornithologicalknowledge and conservation.
In compiling this report we attempted,where possible, to look for population esti-mates of endemic subspecies. Although thiswas possible in some cases, a number ofapparently endemic subspecies remain forwhich it was not possible to derive suitableestimates. This is largely due to a lack ofunderstanding of the distribution, or in somecases even the validity, of these subspecies.Particular questions of relevance to the gen-eration of population estimates are asfollows: Coal Tit Periparus ater : where is the
dividing line in northeast Ireland betweenbritannicus and hibernicus?
Dipper Cinclus cinclus : what are theprecise distributions of hibernicus andgularis Dippers in western Scotland?
Meadow Pipit Anthus pratensis: what is thedistribution of whistleri in western Scot-land?
Linnet Carduelis cannabina: is the ‘Scot-tish’ Linnet autochthona really clearlydemarcated from nominate cannabinaalong the English border?
Yellowhammer Emberiza citrinella: whereis the dividing line between caliginosa Yellowhammers in the northwest andnominate Yellowhammers in the south-east?In each of these cases there is unlikely to
be a sharp demarcation between two forms.However, further work on the validity anddistribution of the UK’s apparently endemicforms would be a necessary prerequisite forthe generation of population estimates.
APEP: the futureAt present, we have striven to provide bothGB and UK estimates. With the increaseddevolution of responsibility for conservationdelivery to the UK’s four nations, we did con-sider country-specific estimates. This mightbe possible for a few species, particularlythose that have been the focus of single-species surveys or receive a high level ofreporting through the RBBP; but for mostspecies, reporting for individual countrieswould compound the problems faced whenproducing UK estimates, particularly outsideEngland where numbers of volunteers, andhence survey sample sizes, are lower.
We hope that our thoughts above mightstimulate an interest in improving populationestimates for birds in the UK, and weencourage observers to take on studies totackle some of the thorny issues. In line withthe new European reporting requirements, weintend to revise and publish compilations ofpopulation estimates every six years; ourintention is to produce APEP 4 in late 2018, inorder to inform the UK’s next report to theEuropean Union in 2019. In the interveningperiod, we intend to continue work exam-ining the problems with population estima-tion, and encouraging efforts to resolve them.In particular, we anticipate that APEP 4 willbe strongly influenced by more detailedanalyses of Bird Atlas 2007–11 in the comingyears. However, we reiterate that productionof population estimates does not have to be
81British Birds 106 • February 2013 • 64 –100
Population estimates of birds in Great Britain and the United Kingdom

the sole preserve of professional ornitholo-gists and we invite all observers with aninterest in this area of work, on any species, toidentify potential projects and to seek adviceand support from APEP if necessary.
Acknowledgments
The majority of the estimates in this paper are basedon work carried out by thousands of volunteers overmany years, either as surveyors, local scheme organisersor county bird recorders; their contribution cannot be underestimated. In addition, we acknowledge thesupport for the principal monitoring schemes given bythe British Trust for Ornithology, Council for NatureConservation & the Countryside, Countryside Councilfor Wales, Joint Nature Conservation Committee,Natural England, Royal Society for the Protection ofBirds, Scottish Natural Heritage, Scottish Ornithologists’Club, Welsh Ornithological Society and the Wildfowl &Wetlands Trust, and acknowledge the support and helpfrom our colleagues at BirdWatch Ireland, and theprovision of records from BirdGuides. We alsoacknowledge funding provided by the Department forEnvironment, Food and Rural Affairs, which supportedthis work as an element of a review of the current UKnetwork of Special Protection Areas. Finally, particularhelp and advice was provided by Dawn Balmer, FionaBarclay, Leo Batten, Andy Brown, Niall Burton, NigelBuxton, Paul Castle, Jacquie Clark, Rob Clements, GregConway, Tony Cross, Olivia Crowe, Anita Donaghy, Allan Drewitt, Tony Fox, Steve Freeman, Rob Fuller, Will George, Simon Gillings, Daniel Hayhow, IainHenderson, Mark Holling, Baz Hughes, Liz Humphreys,Annabel Knipe, Dave Leech, Alex Lord, John Marchant,Dario Massimino, Roddy Mavor, Ian Newton, SueO’Brien, James Pearce-Higgins, Hannah Peck, Tim Poole,Rob Robinson, Ron Summers, Rachel Taylor, RegThorpe, Mike Toms, Chris Wernham, Sian Whiteheadand Simon Wotton.
References
Armitage, M. J. S., Rehfisch, M. M., & Wernham, C. V.1997. The 1997 Breeding Sawbill Survey. BTOResearch Report No. 193, Thetford. [1]
Aspinall, S., & Aspinall, R. 2011. The Fair Isle Wren:population and territory occupancy, 1950–2010.Brit. Birds 104: 312–324. [2]
Baker, H., Stroud, D. A., Aebischer, N. J., Cranswick, P. A.,Gregory, R. D., McSorley, C. A., Noble, D. G., &Rehfisch, M. M. 2006. Population estimates of birdsin Great Britain and the United Kingdom. Brit. Birds99: 25–44. [3]
Balmer, D. E., Gillings, S., Caffrey, B., Swann, R. L.,Downie, I. S., & Fuller, R. J. In prep. Bird Atlas2007–11: the breeding and wintering birds of Britainand Ireland. BTO Books, Thetford. [4]
Banks, A. N., Burton, N. H. K., Calladine, J. R., & Austin,G. E. 2007. Winter Gulls in the UK: populationestimates from the 2003/04–2005/06 Winter GullRoost Survey. BTO Research Report No. 456,Thetford. [5]
—, Crick, H. Q. P., Coombes, R. H., Benn, S., Ratcliffe, D. A., & Humphreys, E. M. 2010. The breeding statusof the Peregrine Falcon Falco peregrinus in theUnited Kingdom & Isle of Man in 2002.
Bird Study 57: 421–436. [6]Batten, L. A. 2001. European Honey-buzzard Survey
2000 and 2001: preliminary results and request forfurther surveys. Brit. Birds 94: 143–144. [7]
Bellamy, P. E., & Eaton, M. A. 2010. 2009 CSM birdmonitoring of Caithness and Sutherland PeatlandsSPA. RSPB report to SNH. [8]
Bibby, C. J. 1989. A survey of breeding Wood WarblersPhylloscopus sibilatrix, in Britain 1984–85. Bird Study36: 56–72. [9]
BirdLife International. 2004. Birds in Europe: populationestimates, trends and conservation status. BirdLifeConservation Series No. 12, Cambridge. [10]
Brown, A., & Grice, P. 2005. Birds in England. Poyser,London. [11]
Clements, R. 2001. The Hobby in Britain: a newpopulation estimate. Brit. Birds 94: 402–408. [12]
— 2002. The Common Buzzard in Britain: a newpopulation estimate. Brit. Birds 95: 377–383. [13]
— 2012. A UK population estimate for the Hawfinch.Brit. Birds 106: 43–44. [14]
Conway, G. J., Burton, N. H. K, Handschuh, M., & Austin,G. E. In prep. Changes in breeding populations ofRinged Plover Charadrius hiaticula and Little RingedPlover C. dubius in the United Kingdom. [15]
—, Wotton, S., Henderson, I., Langston, R., Drewitt, A.,& Currie, F. 2007. Status and distribution ofEuropean Nightjars Caprimulgus europaeus in theUK in 2004. Bird Study 54: 98–111. [16]
—, —, —, Eaton, M., Drewitt, A., & Spencer, J. 2009.The status of breeding Woodlarks Lullula arborea inBritain in 2006. Bird Study 56: 310–325. [17]
Davies, A. K. 1988. The distribution and status ofMandarin Duck Aix galericulata in Britain. Bird Study35: 203–208. [18]
Department for Environment, Food and Rural Affairs(Defra). 2007. Directive on the Conservation of WildBirds: 79/409/EEC. Eighth Report by the UK underArticle 12: Implementation of National Provisions2002–04. [19]
Dillon, I. A., Smith, T. D., Williams, S. J., Haysom, S., &Eaton, M. A. 2009. Status of Red-throated Divers inBritain in 2006. Bird Study 56: 147–157. [20]
Donald, P. F., & Evans, A. D. 1995. Habitat selection andpopulation size of Corn Buntings Miliaria calandrabreeding in Britain in 1993. Bird Study 42: 190–204.[21]
Dougall, T. W., Holland, P. K., & Yalden, D. W. 2004. Arevised estimate of the breeding population ofCommon Sandpipers Actitis hypoleucos in GreatBritain and Ireland. Wader Study Group Bulletin 105:42–49. [22]
Eaton, M. A., Dillon, I. A., Stirling-Aird, P. K., & Whitfield,D. P. 2007a. Status of Golden Eagle Aquila chrysaetosin Britain in 2003. Bird Study 54: 212–220. [23]
—, Austin, G. E., Banks, A. N., Conway, G., Douse, A.,Grice, P. V., Hearn, R., Hilton, G., Hoccom, D.,Musgrove, A. J., Noble, D. G., Ratcliffe, N., Rehfisch,M. M., Worden, J., & Wotton, S. 2007b. The State ofthe UK’s Birds 2006. RSPB, BTO, WWT, CCW, EHS,NE and SNH, Sandy. [24]
Ewing, S. R., Eaton, M. A., Poole, T. F., Davies, M., &Haysom, S. 2012. The size of the Scottish populationof Capercaillie Tetrao urogallus: results of the fourthnational survey. Bird Study 59: 126–138. [25]
––, Rebecca, G. W., Heavisides, A., Court, I., Lindley, P.,Ruddock, M., Cohen, S., & Eaton, M. A. 2011.
82
Musgrove et al.
British Birds 106 • February 2013 • 64 –100
Breeding status of the Merlin Falco columbarius inthe UK in 2008. Bird Study 58: 379–389. [26]
Finney, S. K., & Jardine, D. C. 2003. The distribution andstatus of the Red-billed Chough in Scotland in2002. Scottish Birds 24: 11–17. [27]
Forrester, R. W., Andrews, I. J., McInerny, C. J., Murray, R. D., McGowan, R. Y., Zonfrillo, B., Betts, M. W.,Jardine, D. C., & Grundy, D. S. 2007. The Birds ofScotland. SOC, Aberlady. [28]
Freeman, S. N., Balmer, D. E., & Crick, H. Q. P. 2007a.Tawny Owl Survey 2005. BTO News 268: 6–7. [29]
—, Noble, D. G., Newson, S. E., & Baillie, S. R. 2007b.Modelling bird population changes using data fromdifferent surveys: the Common Birds Census andthe Breeding Bird Survey. Bird Study 54: 61–72.doi:10.1080/00063650709461457 [30]
Furness, R. W., Mable, B., Savory, F., Griffiths, K., Baillie, S. R., & Heubeck, M. 2010. Subspecies status ofCommon Eiders Somateria mollissima in Shetlandbased on morphology and DNA. Bird Study 57:330–335. [31]
Gibbons, D. W., Reid, J. B., & Chapman, R. A. 1993. TheNew Atlas of Breeding Birds in Britain and Ireland:1988–1991. Poyser, London. [32]
Gilbert, G. 2002. The status and habitat of SpottedCrakes Porzana porzana in Britain in 1999. BirdStudy 49: 79–86. [33]
Gillings, S., & Fuller, R. J. 2009. How many EurasianGolden Plovers Pluvialis apricaria and NorthernLapwings Vanellus vanellus winter in Great Britain?Results from a large-scale survey in 2006/07. WaderStudy Group Bulletin 166: 21–28. [34]
Green, G. 2004. The Birds of Dorset. Christopher Helm,London. [35]
Gregory, R. D., Carter, S. P., & Baillie, S. R. 1997.Abundance, distribution and habitat use of breedingGoosanders Mergus merganser and Red-breastedMergansers Mergus serrator on British rivers. BirdStudy 44: 1–12. [36]
Griffin, L. 2010. Svalbard Barnacle Goose distributionaround the Solway Firth 2009–2010: flock countsfrom the Solway goose management scheme area.Final Report to SNH. WWT, Slimbridge. [37]
Hancock, M. H., Gibbons, D. W., & Thompson, P. S.1997. The status of breeding Greenshank Tringanebularia in the United Kingdom in 1995. Bird Study44: 290–302. [38]
Henderson, I. 2012 Ruddy Duck Eradication Bulletin 8.FERA report, Sand Hutton. [39]
Holling, M., & the Rare Breeding Birds Panel. 2010.Rare breeding birds in the United Kingdom in 2007.Brit. Birds 103: 2–52. [40]
— & — 2011. Non-native breeding birds in theUnited Kingdom in 2006, 2007 and 2008. Brit. Birds104: 114–138. [41]
— & — 2012. Rare breeding birds in the UnitedKingdom in 2010. Brit. Birds 105: 352–416. [42]
Hoodless, A. N., Lang, D., Aebischer, N. J., Fuller, R. J., &Ewald, J. A. 2009. Densities and population estimatesof breeding Eurasian Woodcock Scolopax rusticolain Britain in 2003. Bird Study 56: 15–25. [43]
Johnstone, I. G., Dyda, J., & Lindley, P. 2008. Thepopulation status of breeding Golden Plovers andDunlin in Wales in 2007. Welsh Birds 5: 300–310.[44]
Lack, P. 1986. The Atlas of Wintering Birds in Britain andIreland. Poyser, London. [45]
Langston, R. H. W., Smith, T., Brown, A. F., & Gregory, R. D. 2006. The status of breeding Twite Carduelisflavirostris in the UK. Bird Study 53: 55–63. [46]
Mace, G. 1994. An investigation into methods forcategorising the conservation status of species. In:Edwards, P. J., May, R. M., & Webb, N. R. (eds.), Large-scale Ecology and Conservation Biology, pp. 293–312.Blackwell, Oxford. [47]
Marchant, J. H., & Gregory, R. D. 1999. Numbers ofnesting Rooks Corvus frugilegus in the UnitedKingdom in 1996. Bird Study 46: 258–273. [48]
McGowan, R. Y., Clugston, D. L., & Forrester, R. W. 2003.Scotland’s endemic subspecies. Scottish Birds 24:18–35. [49]
McLoughlin, D., & Cotton, D. 2008. The status of TwiteCarduelis flavirostris in Ireland 2008. Irish Birds 8:323–330. [50]
Meininger, P. L., Schekkerman, H., & van Roomen, M. W. J. 1995. Population estimates and 1% criteriafor waterbird species occurring in the Netherlands:suggestions for standardization. Limosa 68 (2):41–48. [51]
Miles, W. 2011. The appearance and status of the StKilda Wren. Brit. Birds 104: 325–328. [52]
Mitchell, C. 2010. Status and Distribution of Icelandic-breeding Geese: results of the 2009 internationalcensus. WWT, Slimbridge. [53]
—, Walsh, A., Hall, C., & Crowe, O. 2008. GreenlandBarnacle Geese Branta leucopsis in Britain andIreland: results of the international census, spring2008. WWT, Slimbridge. [54]
Mitchell, I., Newton, S. F., Ratcliffe, N., & Dunn, T. E.2004. Seabird Populations of Britain and Ireland.Poyser, London. [55]
Moore, A. 2004. Choughs in the Isle of Man in 2002,the year of the international census. Peregrine 8:338–343. [56]
Musgrove, A. J., Austin, G. E., Hearn, R. D., Holt, C. A.,Stroud, D. A., & Wotton, S. R. 2011. Overwinterpopulation estimates of British waterbirds. Brit. Birds104: 364–397. [57]
Newson, S. E., Evans, K. L., Noble, D. G., Greenwood, J. J. D., & Gaston, K. J. 2008. Use of distance samplingto improve estimates of national population sizesfor common and widespread breeding birds in theUK. J. Appl. Ecol. 45: 1330–1338. [58]
Newton, I. 1986. The Sparrowhawk. Poyser, Calton. [59]— 1998. Population Limitation in Birds. Academic Press,
London. [60]O’Brien, M. 2004. Estimating the number of farmland
waders breeding in the United Kingdom.International Wader Studies 14: 135–139. [61]
O’Brien, S. H., Wilson, L. J., Webb, A., & Cranswick, P. A.2008. Revised estimate of wintering Red-throatedDivers Gavia stellata in Great Britain. Bird Study 55:152–160. [62]
Ogilvie, M. A. 2003. European Honey-buzzards in theUK – correction to breeding totals. Brit. Birds 96:145. [63]
Owen, M., Atkinson-Willes, G. L., & Salmon, D. G. 1986.Wildfowl in Great Britain. 2nd edn. CambridgeUniversity Press, Cambridge. [64]
Risely, K., Massimino, D., Johnston, A., Newson, S. E.,Eaton, M. A., Musgrove, A. J., Noble, D. G., Procter,D., & Baillie, S. R. 2012. The Breeding Bird Survey2011. BTO Research Report 624, Thetford. [65]
Robertson, P. A., Woodburn, M. I. A., Tapper, S. C., &
83British Birds 106 • February 2013 • 64 –100
Population estimates of birds in Great Britain and the United Kingdom
84
Musgrove et al.
British Birds 106 • February 2013 • 64 –100
Stoate, C. 1989. Estimating game densities in Britainfrom land-use maps. Institute of Terrestrial Ecology,Grange-over-Sands. [66]
Sharrock, J. T. R. 1976. The Atlas of Breeding Birds inBritain and Ireland. Poyser, Calton. [67]
Sim, I. M. W., Eaton, M. A., Setchfield, R. P., Warren, P. K.,& Lindley, P. 2008. Abundance of male Black GrouseTetrao tetrix in Britain in 2005, and change since1995–96. Bird Study 55: 304–313. [68]
Stanbury, A., & the UK Crane Working Group. 2011.The changing status of the Common Crane in theUK. Brit. Birds 104: 432–447. [69]
—, Davies, M., Grice, P., Gregory, R., & Wotton, S. 2010.The status of the Cirl Bunting in the UK in 2009.Brit. Birds 103: 702–711. [70]
Stone, B. H., Sears, J., Cranswick, P. A., Gregory, R. D.,Gibbons, D. W., Rehfisch, M. M., Aebischer, N. J., &Reid, J. B. 1997. Population estimates of birds inBritain and in the United Kingdom. Brit. Birds 90:1–22. [71]
Stroud, D. A., Francis, I., & Stroud, R. 2012. SpottedCrakes breeding in Britain and Ireland: a history andevaluation of current status. Brit. Birds 105: 197–220.[72]
—, Douse, A., Whitehead, S., Brown, A., & Enlander, I.2002. National bird population estimates: approvalprocedures for statutory purposes. JNCCCommittee Paper. [73]
Summers, R. W., & Buckland, S. T. 2010. A First Survey ofthe Global Population Size and Distribution of theScottish Crossbill Loxia scotica. Bird ConservationInternational, published online by CambridgeUniversity Press doi:10.1017/S0959270909990323[74]
Taylor, M., & Marchant, J. H. 2011. The Norfolk Bird Atlas:summer and winter distributions 1999–2007. BTOBooks, Thetford. [75]
Thorpe, R. T., & Johnstone, I. G. 2003. The status of theChough Pyrrhocorax pyrrhocorax in Wales in 2002.Welsh Birds 3: 354–362. [76]
Thorup, O. 2006. Breeding Waders in Europe 2000.International Wader Studies 14. International WaderStudy Group, Thetford. [77]
Toms, M. P., Crick, H. Q. P., & Shawyer, C. R. 2001. Thestatus of breeding Barn Owls Tyto alba in the United
Kingdom 1995–97. Bird Study 48: 23–37. [78]Wanless, S., Murray, S., & Harris, M. P. 2005. The status
of Northern Gannet in Britain & Ireland in 2003/04.Brit. Birds 98: 280–294. [79]
Ward, R. M., Cranswick, P. A., Kershaw, M., Austin, G. E.,Brown, A. W., Brown, L. M., Coleman, J. T., Chisholm,H., & Spray, C. 2007. National Mute Swan Census2002. WWT, Slimbridge. [80]
Whitfield, P. 2002. Status of breeding DotterelCharadrius morinellus in Britain in 1999. Bird Study49: 237–249. [81]
Wilson, A. M., Henderson, A. C. B., & Fuller, R. J. 2002.Status of the Nightingale Luscinia megarhynchos inBritain at the end of the 20th century withparticular reference to climate change. Bird Study49: 193–204. [82]
Worden, J., Cranswick, P. A., Crowe, O., McElwaine, G.,& Rees, E. C. 2006. Numbers and distribution ofBewick’s Swan Cygnus columbianus bewickiiwintering in Britain and Ireland: results of theInternational Censuses, January 1995, 2000 and2005. Wildfowl 56: 3–22. [83]
—, Crowe, O., Einarsson, O., Gardarsson, A.,McElwaine, G., & Rees, E. C. 2009. Population sizeand breeding success of the Icelandic WhooperSwan Cygnus cygnus: results of the January 2005International Census. Wildfowl 59: 17–40. [84]
Wotton, S. R., Langston, R. H. W., & Gregory, R. D.2002. The breeding status of the Ring Ouzel Turdustorquatus in the UK in 1999. Bird Study 49: 26–34.[85]
—, Grantham, M., Moran, N., & Gilbert, G. 2011.Eurasian Bittern distribution and abundance in theUK during the 2009/10 winter. Brit. Birds 104:636–641. [86]
—, Conway, G., Eaton, M., Henderson, I., & Grice, P.2009. The status of the Dartford Warbler in the UKand the Channel Islands in 2006. Brit. Birds 102:230–246. [87]
Additional sources of information for Appendices 1–3:[88] BirdTrack database; [89] County bird reports;[90] RSPB data; [91] BTO Heronries Census; [92] www.projectparakeet.com, H. Peck pers. comm.;[93] BirdGuides; [94] BTO ringing data.
Andrew J. Musgrove, Stuart E. Newson, David G. Noble and Kate Risely, BTO, The Nunnery,Thetford, Norfolk IP24 2PU; e-mail [email protected]
Nicholas J. Aebischer, GWCT, Burgate Manor, Fordingbridge, Hampshire SP6 1EFMark A. Eaton, RSPB, The Lodge, Sandy, Bedfordshire SG19 2DLRichard D. Hearn, WWT, Slimbridge, Gloucestershire GL2 7BTMatt Parsons, JNCC, Inverdee House, Baxter Street, Aberdeen AB11 9QADavid A. Stroud, JNCC, Monkstone House, City Road, Peterborough PE1 1JY
Andy Musgrove is Head of Monitoring at the BTO and is responsible for the delivery of many of the BTO’slarge-scale monitoring schemes. Nicholas Aebischer is Deputy Director of Research at Game & WildlifeConservation Trust, where his responsibilities include applied ecological research into wildlife management.Mark Eaton is a Principal Conservation Scientist at RSPB with a particular responsibility for monitoring. RichardHearn has worked on a wide range of waterbird monitoring projects at the Wildfowl & Wetlands Trust for thepast 16 years. Stuart Newson is a Senior Research Ecologist at the BTO, with particular interests in populationestimates, Cormorants and bats. David Noble is the Principal Ecologist for Monitoring at the BTO, includingleading on the development of biodiversity indicators. Matt Parsons is a Senior Seabird Ecologist at JNCC,where he has worked on seabird issues since 2002. Kate Risely has been the National Organiser for theBreeding Bird Survey at the BTO since 2008. David Stroud is Senior Ornithologist with JNCC and a long-termGreenland White-fronted Goose obsessive.

85British Birds 106 • February 2013 • 64 –100
Population estimates of birds in Great Britain and the United Kingdom
Appendix 1. Population estimates of birds in Great Britain and the United Kingdom.Key: Species: * denotes a species with one or more distinct subspecies or populations, listed in Appendix 2. Region: GB = Great Britain; IoM = Isle of Man; UK = United Kingdom; * denotes a strict GB/UK estimateexcluding IoM. Season: B = Breeding; P = Passage; W = Wintering. Unit: AOS = Apparently Occupied Sites; F = females; I = individuals; M = males; N = nests; P = pairs; T = territories. Der (Derivation): Numberscorrespond to the appropriate section of the Methods; see text. Rel (Reliability): 1 (good) to 3 (poor); see text for full explanation. +/-: + = population known to be larger than estimate listed, but no better estimateavailable; - = population known to be smaller than estimate listed. Note: Numbers refer to the footnotes of the table. Ref: Numbers correspond to those given in the References section.
Species Region Season Estimate Unit Date Der Rel +/- Note Ref
Mute Swan GB B 6,000 P 2009 5–BBS 2 80Cygnus olor (5,400–6,600)
UK B 6,400 P 2009 5–BBS 2 80(5,800–7,000)
GB W 74,000 I 2004/05–08/09 6 2 57UK W 79,000 I 2004/05–08/09 6 2 57
Bewick’s Swan GB/UK W 7,000 I 2005 6 1 83Cygnus columbianus
Whooper Swan GB B 8–12 P 2006–10 3 1 42Cygnus cygnus UK B 9–14 P 2006–10 3 1 42
GB W 11,000 I 2005 6 1 84UK W 15,000 I 2005 6 1 84
Bean Goose Anser fabalis * GB/UK W 730 I 2004/05–09/10 6 1 57
Pink-footed Goose GB/UK B 0–1 P 2006–10 3 1 42Anser brachyrhynchus GB/UK W 360,000 I 2009/10 6 1 - 1 53
White-fronted Goose GB/UK W 16,000 I 2004/05–09/10 6 1 57Anser albifrons *
Greylag Goose GB/UK B 46,000 P 2004–08 5 3 57Anser anser * GB W 220,000 I 2004/05–09/10 6 2 53, 57
UK W 230,000 I 2004/05–09/10 6 2 53, 57
Snow Goose GB/UK B 3–5 P 2004–08 3 3 + 2 41Anser caerulescens GB/UK W 180 I 2004/05–08/09 6 2 57
Canada Goose GB/UK B 62,000 P 2004–08 5 3 57Branta canadensis GB/UK W 190,000 I 2004/05–08/09 6 2 57
Barnacle Goose GB B 900 P 2004–08 5 3 - 3 57Branta leucopsis * UK B 1,000 P 2004–08 5 3 - 3 57
GB/UK W 94,000 I 2004/05–09/10 6 1 37, 54, 57
Brent Goose GB W 95,000 I 2004/05–08/09 6 1 57Branta bernicla * UK W 120,000 I 2004/05–08/09 6 1 57
Egyptian Goose GB/UK B 1,100 P 2004–08 5 3 57Alopochen aegyptiaca GB/UK W 3,400 I 2004/05–08/09 6 2 57
Common Shelduck GB/UK B 15,000 P 2009 1–Eng 2 + 4 32Tadorna tadorna GB W 61,000 I 2004/05–08/09 6 1 57
UK W 66,000 I 2004/05–08/09 6 1 57
Mandarin Duck GB/UK B 2,300 P 1988 5 3 + 5 18Aix galericulata GB/UK W 7,000 I 1988 6 3 + 6 18
Eurasian Wigeon GB/UK B 300–500 P 1968–72 5 2 67Anas penelope GB W 440,000 I 2004/05–08/09 6 1 57
UK W 450,000 I 2004/05–08/09 6 1 57
American Wigeon GB/UK W 8 I 2006/07–10/11 7 2 88Anas americana
Gadwall GB B 670–1,710 P 2006–09 3 2 + 7 42Anas strepera UK B 690–1,730 P 2006–09 3 2 + 7 42
GB/UK W 25,000 I 2004/05–08/09 6 1 57
Eurasian Teal GB B 1,500–2,600 P 1988–91 1 3 32Anas crecca UK B 1,600–2,800 P 1988–91 1 3 32
GB W 210,000 I 2004/05–08/09 6 2 57UK W 220,000 I 2004/05–08/09 6 2 57
Green-winged Teal GB W 23 I 2006/07–10/11 7 2 88Anas carolinensis UK W 25 I 2006/07–10/11 7 2 88

86
Musgrove et al.
British Birds 106 • February 2013 • 64 –100
Musgrove et al.
Species Region Season Estimate Unit Date Der Rel +/- Note Ref
Mallard GB B 59,000–142,000 P 2009 5–UK 3 + 8 3Anas platyrhynchos UK B 61,000–146,000 P 2009 5–UK 3 + 8 3
GB W 680,000 I 2004/05–08/09 6 3 57UK W 710,000 I 2004/05–08/09 6 3 57
Pintail GB/UK B 9–33 P 2006–10 3 1 42Anas acuta GB/UK W 29,000 I 2004/05–08/09 6 1 57
Garganey GB B 13–91 P 2006–10 3 2 42Anas querquedula UK B 14–93 P 2006–10 3 2 42
Shoveler GB B 310–1,010 P 2006–10 3 2 42Anas clypeata UK B 310–1,020 P 2006–10 3 2 42
GB/UK W 18,000 I 2004/05–08/09 6 1 57
Red-crested Pochard GB/UK B 10–21 P 2004–08 3 3 + 9 41Netta rufina GB/UK W 320 I 2004/05–08/09 6 1 57
Common Pochard GB B 330–610 P 2006–10 3 2 42Aythya ferina UK B 350–630 P 2006–10 3 2 42
GB W 38,000 I 2004/05–08/09 6 1 57UK W 48,000 I 2004/05–08/09 6 1 57
Ring-necked Duck GB W 14 I 2006/07–10/11 7 2 88Aythya collaris UK W 18 I 2006/07–10/11 7 2 88
Ferruginous Duck GB W 9 I 2006/07–10/11 7 2 88Aythya nyroca UK W 10 I 2006/07–10/11 7 2 88
Tufted Duck GB B 16,000–18,000 P 2009 1–Eng 3 64Aythya fuligula UK B 16,000–19,000 P 2009 1–Eng 3 64
GB W 110,000 I 2004/05–08/09 6 1 57UK W 120,000 I 2004/05–08/09 6 1 57
Greater Scaup GB W 5,200 I 2004/05–08/09 6 2 57Aythya marila UK W 12,000 I 2004/05–08/09 6 2 57
Common Eider GB B 26,000 P 2004–09 5 2 10 32, 57Somateria mollissima * UK B 27,000 P 2004–09 5 2 10 32, 57
GB W 60,000 I 2004/05–09/10 6 2 57UK W 63,000 I 2004/05–09/10 6 2 57
Long-tailed Duck GB/UK W 11,000 I 2004/05–08/09 6 2 - 11 57Clangula hyemalis
Common Scoter GB/UK B 52 P 2007 5 1 40Melanitta nigra GB/UK W 100,000 I 2004/05–08/09 6 2 57
Surf Scoter GB/UK W 13 I 2006/07–10/11 7 2 88Melanitta perspicillata
Velvet Scoter GB/UK W 2,500 I 2004/05–08/09 6 2 - 12 57Melanitta fusca
Common Goldeneye GB/UK B 200 F 2006–10 3 2 42Bucephala clangula GB W 20,000 I 2004/05–08/09 6 2 57
UK W 27,000 I 2004/05–08/09 6 2 57
Smew Mergellus albellus GB/UK W 180 I 2004/05–08/09 6 1 57
Red-breasted Merganser GB B 2,200 P 1988–91 1 3 + 13 1, 32Mergus serrator UK B 2,400 P 1988–91 1 3 + 13 1, 32
GB W 8,400 I 2004/05–08/09 6 2 57UK W 9,000 I 2004/05–08/09 6 2 57
Goosander GB/UK B 3,500 P 2009 5–WBS/ 2 + 14 1, 36Mergus merganser (3,100–3,800) WBBS
GB/UK W 12,000 I 2004/05–08/09 6 2 57
Ruddy Duck GB/UK W 60 I 2012 5 1 39Oxyura jamaicensis
Common Quail GB/UK B 540 M 2006–10 3 2 42Coturnix coturnix
Red-legged Partridge GB/UK B 82,000 T 2009 1–UK 2 32Alectoris rufa
Red Grouse GB/UK B 230,000 P 2009 1–NGC/ 3 32Lagopus lagopus BBS
87British Birds 106 • February 2013 • 64 –100
Population estimates of birds in Great Britain and the United KingdomPopulation estimates of birds in Great Britain and the United Kingdom
Species Region Season Estimate Unit Date Der Rel +/- Note Ref
Ptarmigan GB/UK B 2,000–15,000 P 2007 5 2 28Lagopus muta
Black Grouse GB/UK B 5,100 M 2005 5 1 68Tetrao tetrix
Capercaillie GB/UK W 1,300 I 2009/10 5 2 25Tetrao urogallus (800–1,900)
Grey Partridge GB/UK B 43,000 T 2009 1–UK 2 32Perdix perdix
Common Pheasant GB B 2,200,000 F 2009 1–Eng 2 66Phasianus colchicus UK B 2,300,000 F 2009 1–Eng 2 66
Lady Amherst's Pheasant GB/UK B 5 M 2006–10 3 1 15 41, 89Chrysolophus amherstiae
Golden Pheasant GB/UK B 50–100 P 2009 3 3 16 4, 35, 41, Chrysolophus pictus 75, 89
Red-throated Diver GB/UK B 1,300 P 2006 5 1 20Gavia stellata (1,000–1,600)
GB/UK W 17,000 I 2001–06 6 2 62
Black-throated Diver GB/UK B 220 (190–250) P 2006 5 1 24Gavia arctica GB/UK W 560 I 2004/05–08/09 6 3 57
Great Northern Diver GB W 2,500 I 2004/05–08/09 6 3 + 17 57Gavia immer UK W 2,600 I 2004/05–08/09 6 3 + 17 57
White-billed Diver GB/UK W 13 I 2006/07–10/11 7 3 18 88Gavia adamsii
Fulmar GB/UK B 500,000 P 1998–2002 4 1 55Fulmarus glacialis
Manx Shearwater GB B 300,000 P 1998–2002 4 2 55Puffinus puffinus (280,000–310,000)
UK B 300,000 P 1998–2002 4 2 55(280,000–320,000)
European Storm-petrel GB/UK B 26,000 AOS 1998–2002 4 2 55Hydrobates pelagicus (21,000–33,000)
Leach's Storm-petrel GB/UK B 48,000 AOS 1998–2002 4 2 55Oceanodroma leucorhoa (36,000–65,000)
Northern Gannet GB/UK B 220,000 N 2003–04 4 1 79Morus bassanus
Great Cormorant GB B 8,400 P 1998–2002 4 1 19 55Phalacrocorax carbo UK B 9,000 P 1998–2002 4 1 19 55
GB W 35,000 I 2004/05–08/09 6 2 19 57UK W 41,000 I 2004/05–08/09 6 2 19 57
Shag GB/UK B 27,000 P 1998–2002 4 1 55Phalacrocorax aristotelis GB/UK W 110,000 I 1998–2002 6 2 57
Eurasian Bittern GB/UK B 80 M 2007–11 3 1 + 20 42, 90Botaurus stellaris GB/UK W 600 I 2009/10 5 2 86
Little Bittern GB/UK B 0–1 P 2006–10 3 1 42Ixobrychus minutus
Cattle Egret Bubulcus ibis GB/UK B 0–1 P 2006–10 3 1 42
Little Egret GB/UK B 660–740 P 2006–10 3 2 + 21 42Egretta garzetta GB/UK W 4,500 I 2004/05–08/09 6 2 + 22 57
Great White Egret GB/UK B 0–1 P 2008–12 3 1 23 42Ardea alba GB W 34 I 2006/07–10/11 7 2 88
UK W 35 I 2006/07–10/11 7 2 88
Grey Heron GB B 12,000 P 2007–11 5 1 91Ardea cinerea UK B 13,000 P 2007–11 5 1 91
GB W 61,000 I 2004/05–08/09 6 2 57UK W 63,000 I 2004/05–08/09 6 2 57
Purple Heron GB/UK B 0–1 P 2006–10 3 1 42Ardea purpurea
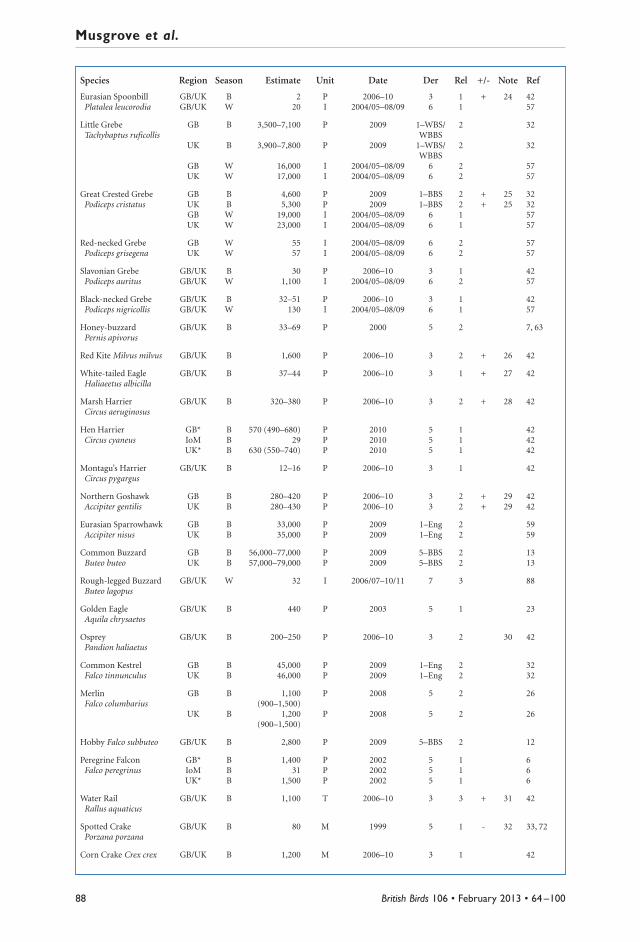
88
Musgrove et al.
British Birds 106 • February 2013 • 64 –100
Species Region Season Estimate Unit Date Der Rel +/- Note Ref
Eurasian Spoonbill GB/UK B 2 P 2006–10 3 1 + 24 42Platalea leucorodia GB/UK W 20 I 2004/05–08/09 6 1 57
Little Grebe GB B 3,500–7,100 P 2009 1–WBS/ 2 32Tachybaptus ruficollis WBBS
UK B 3,900–7,800 P 2009 1–WBS/ 2 32 WBBS
GB W 16,000 I 2004/05–08/09 6 2 57UK W 17,000 I 2004/05–08/09 6 2 57
Great Crested Grebe GB B 4,600 P 2009 1–BBS 2 + 25 32 Podiceps cristatus UK B 5,300 P 2009 1–BBS 2 + 25 32
GB W 19,000 I 2004/05–08/09 6 1 57UK W 23,000 I 2004/05–08/09 6 1 57
Red-necked Grebe GB W 55 I 2004/05–08/09 6 2 57Podiceps grisegena UK W 57 I 2004/05–08/09 6 2 57
Slavonian Grebe GB/UK B 30 P 2006–10 3 1 42 Podiceps auritus GB/UK W 1,100 I 2004/05–08/09 6 2 57
Black-necked Grebe GB/UK B 32–51 P 2006–10 3 1 42 Podiceps nigricollis GB/UK W 130 I 2004/05–08/09 6 1 57
Honey-buzzard GB/UK B 33–69 P 2000 5 2 7, 63Pernis apivorus
Red Kite Milvus milvus GB/UK B 1,600 P 2006–10 3 2 + 26 42
White-tailed Eagle GB/UK B 37–44 P 2006–10 3 1 + 27 42Haliaeetus albicilla
Marsh Harrier GB/UK B 320–380 P 2006–10 3 2 + 28 42Circus aeruginosus
Hen Harrier GB* B 570 (490–680) P 2010 5 1 42Circus cyaneus IoM B 29 P 2010 5 1 42
UK* B 630 (550–740) P 2010 5 1 42
Montagu’s Harrier GB/UK B 12–16 P 2006–10 3 1 42Circus pygargus
Northern Goshawk GB B 280–420 P 2006–10 3 2 + 29 42Accipiter gentilis UK B 280–430 P 2006–10 3 2 + 29 42
Eurasian Sparrowhawk GB B 33,000 P 2009 1–Eng 2 59Accipiter nisus UK B 35,000 P 2009 1–Eng 2 59
Common Buzzard GB B 56,000–77,000 P 2009 5–BBS 2 13Buteo buteo UK B 57,000–79,000 P 2009 5–BBS 2 13
Rough-legged Buzzard GB/UK W 32 I 2006/07–10/11 7 3 88Buteo lagopus
Golden Eagle GB/UK B 440 P 2003 5 1 23Aquila chrysaetos
Osprey GB/UK B 200–250 P 2006–10 3 2 30 42 Pandion haliaetus
Common Kestrel GB B 45,000 P 2009 1–Eng 2 32 Falco tinnunculus UK B 46,000 P 2009 1–Eng 2 32
Merlin GB B 1,100 P 2008 5 2 26Falco columbarius (900–1,500)
UK B 1,200 P 2008 5 2 26(900–1,500)
Hobby Falco subbuteo GB/UK B 2,800 P 2009 5–BBS 2 12
Peregrine Falcon GB* B 1,400 P 2002 5 1 6Falco peregrinus IoM B 31 P 2002 5 1 6
UK* B 1,500 P 2002 5 1 6
Water Rail GB/UK B 1,100 T 2006–10 3 3 + 31 42 Rallus aquaticus
Spotted Crake GB/UK B 80 M 1999 5 1 - 32 33, 72Porzana porzana
Corn Crake Crex crex GB/UK B 1,200 M 2006–10 3 1 42
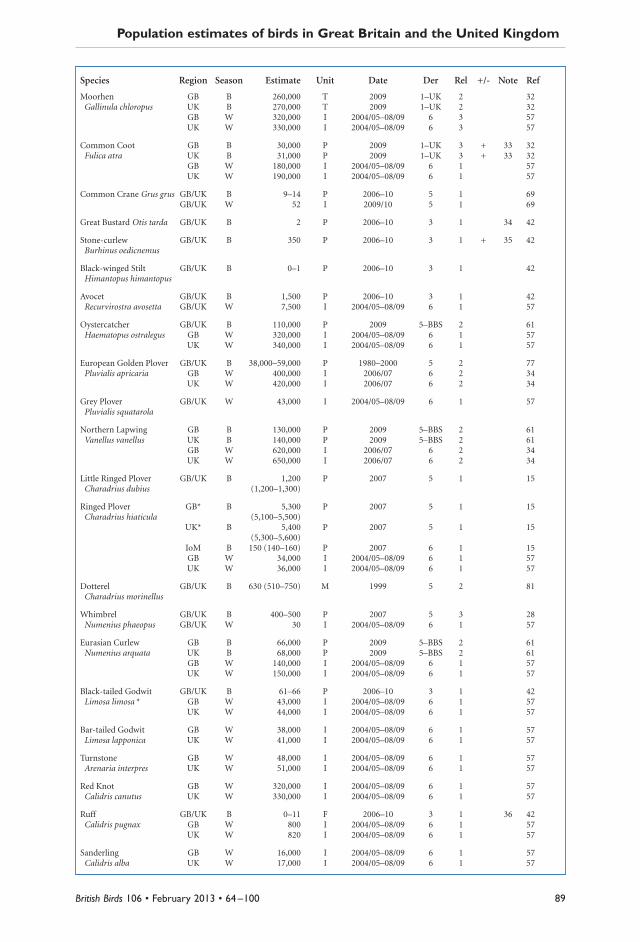
89British Birds 106 • February 2013 • 64 –100
Population estimates of birds in Great Britain and the United Kingdom
Species Region Season Estimate Unit Date Der Rel +/- Note Ref
Moorhen GB B 260,000 T 2009 1–UK 2 32 Gallinula chloropus UK B 270,000 T 2009 1–UK 2 32
GB W 320,000 I 2004/05–08/09 6 3 57UK W 330,000 I 2004/05–08/09 6 3 57
Common Coot GB B 30,000 P 2009 1–UK 3 + 33 32 Fulica atra UK B 31,000 P 2009 1–UK 3 + 33 32
GB W 180,000 I 2004/05–08/09 6 1 57UK W 190,000 I 2004/05–08/09 6 1 57
Common Crane Grus grus GB/UK B 9–14 P 2006–10 5 1 69GB/UK W 52 I 2009/10 5 1 69
Great Bustard Otis tarda GB/UK B 2 P 2006–10 3 1 34 42
Stone-curlew GB/UK B 350 P 2006–10 3 1 + 35 42Burhinus oedicnemus
Black-winged Stilt GB/UK B 0–1 P 2006–10 3 1 42Himantopus himantopus
Avocet GB/UK B 1,500 P 2006–10 3 1 42Recurvirostra avosetta GB/UK W 7,500 I 2004/05–08/09 6 1 57
Oystercatcher GB/UK B 110,000 P 2009 5–BBS 2 61Haematopus ostralegus GB W 320,000 I 2004/05–08/09 6 1 57
UK W 340,000 I 2004/05–08/09 6 1 57
European Golden Plover GB/UK B 38,000–59,000 P 1980–2000 5 2 77Pluvialis apricaria GB W 400,000 I 2006/07 6 2 34
UK W 420,000 I 2006/07 6 2 34
Grey Plover GB/UK W 43,000 I 2004/05–08/09 6 1 57Pluvialis squatarola
Northern Lapwing GB B 130,000 P 2009 5–BBS 2 61Vanellus vanellus UK B 140,000 P 2009 5–BBS 2 61
GB W 620,000 I 2006/07 6 2 34UK W 650,000 I 2006/07 6 2 34
Little Ringed Plover GB/UK B 1,200 P 2007 5 1 15Charadrius dubius (1,200–1,300)
Ringed Plover GB* B 5,300 P 2007 5 1 15Charadrius hiaticula (5,100–5,500)
UK* B 5,400 P 2007 5 1 15(5,300–5,600)
IoM B 150 (140–160) P 2007 6 1 15GB W 34,000 I 2004/05–08/09 6 1 57UK W 36,000 I 2004/05–08/09 6 1 57
Dotterel GB/UK B 630 (510–750) M 1999 5 2 81Charadrius morinellus
Whimbrel GB/UK B 400–500 P 2007 5 3 28Numenius phaeopus GB/UK W 30 I 2004/05–08/09 6 1 57
Eurasian Curlew GB B 66,000 P 2009 5–BBS 2 61Numenius arquata UK B 68,000 P 2009 5–BBS 2 61
GB W 140,000 I 2004/05–08/09 6 1 57UK W 150,000 I 2004/05–08/09 6 1 57
Black-tailed Godwit GB/UK B 61–66 P 2006–10 3 1 42 Limosa limosa * GB W 43,000 I 2004/05–08/09 6 1 57
UK W 44,000 I 2004/05–08/09 6 1 57
Bar-tailed Godwit GB W 38,000 I 2004/05–08/09 6 1 57Limosa lapponica UK W 41,000 I 2004/05–08/09 6 1 57
Turnstone GB W 48,000 I 2004/05–08/09 6 1 57Arenaria interpres UK W 51,000 I 2004/05–08/09 6 1 57
Red Knot GB W 320,000 I 2004/05–08/09 6 1 57Calidris canutus UK W 330,000 I 2004/05–08/09 6 1 57
Ruff GB/UK B 0–11 F 2006–10 3 1 36 42 Calidris pugnax GB W 800 I 2004/05–08/09 6 1 57
UK W 820 I 2004/05–08/09 6 1 57
Sanderling GB W 16,000 I 2004/05–08/09 6 1 57Calidris alba UK W 17,000 I 2004/05–08/09 6 1 57

90
Musgrove et al.
British Birds 106 • February 2013 • 64 –100
Species Region Season Estimate Unit Date Der Rel +/- Note Ref
Dunlin GB/UK B 8,600–10,600 P 2005–07 5 2 37 11, 28, 44Calidris alpina GB W 350,000 I 2004/05–08/09 6 1 57
UK W 360,000 I 2004/05–08/09 6 1 57
Purple Sandpiper GB/UK B 1 P 2006–10 3 1 42 Calidris maritima GB/UK W 13,000 I 2004/05–08/09 6 2 57
Little Stint Calidris minuta GB/UK W 14 I 2004/05–08/09 6 1 57
Red-necked Phalarope GB/UK B 20–24 M 2006–10 3 1 42 Phalaropus lobatus
Common Sandpiper GB/UK B 15,000 P 2009 5–WBS/WBBS 2 22Actitis hypoleucos GB/UK W 73 I 2004/05–08/09 6 1 57
Green Sandpiper GB/UK B 1–3 P 2006–10 3 1 42 Tringa ochropus GB/UK W 910 I 2004/05–08/09 6 3 57
Spotted Redshank GB/UK W 98 I 2004/05–08/09 6 1 57Tringa erythropus
Greenshank GB/UK B 1,100 P 1995 5 2 + 38 38Tringa nebularia (700–1,500)
GB W 610 I 2004/05–08/09 6 1 57UK W 770 I 2004/05–08/09 6 1 57
Wood Sandpiper GB/UK B 11–27 P 2007 5 1 40Tringa glareola
Common Redshank GB B 24,000 P 2009 5–BBS 2 61Tringa totanus UK B 25,000 P 2009 5–BBS 2 61
GB W 120,000 I 2004/05–08/09 6 1 57UK W 130,000 I 2004/05–08/09 6 1 57
Jack Snipe GB W 100,000 I 2004/05 6 3 57Lymnocryptes minimus UK W 110,000 I 2004/05 6 3 57
Woodcock GB B 78,000 M 2003 5 2 43Scolopax rusticola (62,000–96,000)
UK B 81,000 M 2003 5 2 43(64,000–100,000)
GB/UK W 1,400,000 I 2003/04 6 3 57
Common Snipe GB B 76,000 P 2009 5–BBS 3 61Gallinago gallinago UK B 80,000 P 2009 5–BBS 3 61
GB W 1,000,000 I 2004/05 6 3 57UK W 1,100,000 I 2004/05 6 3 57
Arctic Skua GB/UK B 2,100 P 1998–2002 4 1 - 39 55Stercorarius parasiticus
Great Skua GB/UK B 9,600 P 1998–2002 4 1 55Stercorarius skua
Puffin Fratercula arctica GB/UK B 580,000 P 1998–2002 4 1 55
Black Guillemot GB/UK B 19,000 P 1998–2003 4 1 40 55Cepphus grylle
Razorbill GB B 110,000 P 1998–2002 4 1 41 55Alca torda UK B 130,000 P 1998–2002 4 1 41 55
Common Guillemot GB B 880,000 P 1998–2002 4 1 41 55Uria aalge UK B 950,000 P 1998–2002 4 1 41 55
Little Tern GB/UK B 1,900 P 2000 4 1 55Sternula albifrons
Sandwich Tern GB B 11,000 P 2000 4 1 55Sterna sandvicensis UK B 12,000 P 2000 4 1 55
Common Tern GB B 10,000 P 2000 4 1 55Sterna hirundo UK B 12,000 P 2000 4 1 55
Arctic Tern GB/UK B 53,000 P 2000 4 1 55Sterna paradisaea
Roseate Tern GB B 86 P 2006–10 3 1 42 Sterna dougallii UK B 89 P 2006–10 3 1 42
Kittiwake GB B 370,000 P 1998–2002 4 1 - 39 55Rissa tridactyla UK B 380,000 P 1998–2002 4 1 - 39 55

91British Birds 106 • February 2013 • 64 –100
Population estimates of birds in Great Britain and the United Kingdom
Species Region Season Estimate Unit Date Der Rel +/- Note Ref
Black-headed Gull GB B 130,000 P 1998–2002 4 1 + 42 55Chroicocephalus ridibundus UK B 140,000 P 1998–2002 4 1 + 42 55
GB* W 2,200,000 I 2003/04–05/06 6 2 5 (2,100,000–2,200,000)
UK* W 2,200,000 I 2003/04–05/06 6 2 5 (2,100,000–2,300,000)
Little Gull GB/UK B 0–1 P 2006–10 3 1 42 Hydrocoloeus minutus
Mediterranean Gull GB/UK B 600–630 P 2006–10 3 1 42 Larus melanocephalus GB/UK W 1,800 I 2004/05–08/09 6 2 57
Ring-billed Gull GB W 17 I 2006/07–10/11 7 2 88Larus delawarensis UK W 22 I 2006/07–10/11 7 2 88
Common Gull GB B 48,000 P 1998–2002 4 1 55Larus canus UK B 49,000 P 1998–2002 4 1 55
GB* W 700,000 I 2003/04–05/06 6 2 5 (670,000–720,000)
UK* W 710,000 I 2003/04–05/06 6 2 5 (680,000–730,000)
Caspian Gull GB/UK W 90 I 2004/05–08/09 6 2 57Larus cachinnans
Lesser Black-backed Gull GB/UK B 110,000 P 1998–2002 4 1 - 39 55Larus fuscus GB* W 120,000 I 2003/04–05/06 6 2 5
(120,000–130,000)UK* W 130,000 I 2003/04–05/06 6 2 5
(120,000–130,000)
Glaucous Gull GB W 150 I 2004/05–08/09 6 2 57Larus hyperboreus UK W 170 I 2004/05–08/09 6 2 57
Iceland Gull GB W 210 I 2004/05–08/09 6 2 57Larus glaucoides UK W 240 I 2004/05–08/09 6 2 57
Yellow-legged Gull GB/UK B 1 P 2006–10 3 1 42 Larus michahellis GB/UK W 1,100 I 2004/05–08/09 6 2 57
Herring Gull GB* B 130,000 P 1998–2002 4 1 - 39 55Larus argentatus IoM B 7,100 P 1998–2002 4 1 - 39 55
UK* B 140,000 P 1998–2002 4 1 - 39 55GB* W 730,000 I 2003/04–05/06 6 2 5
(700,000–760,000)UK* W 740,000 I 2003/04–05/06 6 2 5
(710,000–780,000)
Great Black-backed Gull GB/UK B 17,000 P 1998–2002 4 1 - 39 55Larus marinus GB* W 76,000 I 2003/04–05/06 6 2 5
(71,000–81,000)UK* W 77,000 I 2003/04–05/06 6 2 5
(72,000–82,000)
Rock Dove/Feral Pigeon GB B 540,000 P 2009 2 2 43 58Columba livia (440,000–640,000)
UK B 550,000 P 2009 2 2 43 58(450,000–650,000)
Stock Dove GB/UK B 260,000 T 2009 1–Eng 2 32Columba oenas
Wood Pigeon GB B 5,300,000 P 2009 2 2 58Columba palumbus (5,000,000–5,600,000)
UK B 5,400,000 P 2009 2 2 58(5,100,000–5,700,000)
Collared Dove GB B 980,000 P 2009 2 2 58Streptopelia decaocto (880,000–1,070,000)
UK B 990,000 P 2009 2 2 58(900,000–1,090,000)
Turtle Dove GB/UK B 14,000 T 2009 1–UK 2 32Streptopelia turtur
Rose-ringed Parakeet GB/UK B 8,600 P 2012 5 1 44 92Psittacula krameri
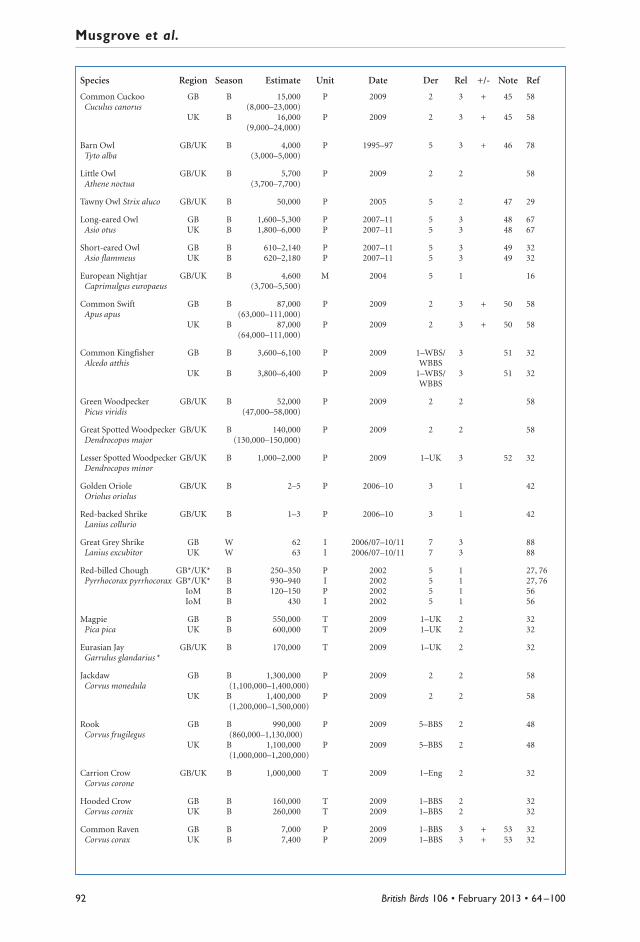
92
Musgrove et al.
British Birds 106 • February 2013 • 64 –100
Species Region Season Estimate Unit Date Der Rel +/- Note Ref
Common Cuckoo GB B 15,000 P 2009 2 3 + 45 58Cuculus canorus (8,000–23,000)
UK B 16,000 P 2009 2 3 + 45 58(9,000–24,000)
Barn Owl GB/UK B 4,000 P 1995–97 5 3 + 46 78Tyto alba (3,000–5,000)
Little Owl GB/UK B 5,700 P 2009 2 2 58Athene noctua (3,700–7,700)
Tawny Owl Strix aluco GB/UK B 50,000 P 2005 5 2 47 29
Long-eared Owl GB B 1,600–5,300 P 2007–11 5 3 48 67Asio otus UK B 1,800–6,000 P 2007–11 5 3 48 67
Short-eared Owl GB B 610–2,140 P 2007–11 5 3 49 32Asio flammeus UK B 620–2,180 P 2007–11 5 3 49 32
European Nightjar GB/UK B 4,600 M 2004 5 1 16Caprimulgus europaeus (3,700–5,500)
Common Swift GB B 87,000 P 2009 2 3 + 50 58Apus apus (63,000–111,000)
UK B 87,000 P 2009 2 3 + 50 58(64,000–111,000)
Common Kingfisher GB B 3,600–6,100 P 2009 1–WBS/ 3 51 32Alcedo atthis WBBS
UK B 3,800–6,400 P 2009 1–WBS/ 3 51 32WBBS
Green Woodpecker GB/UK B 52,000 P 2009 2 2 58Picus viridis (47,000–58,000)
Great Spotted Woodpecker GB/UK B 140,000 P 2009 2 2 58Dendrocopos major (130,000–150,000)
Lesser Spotted Woodpecker GB/UK B 1,000–2,000 P 2009 1–UK 3 52 32Dendrocopos minor
Golden Oriole GB/UK B 2–5 P 2006–10 3 1 42 Oriolus oriolus
Red-backed Shrike GB/UK B 1–3 P 2006–10 3 1 42 Lanius collurio
Great Grey Shrike GB W 62 I 2006/07–10/11 7 3 88Lanius excubitor UK W 63 I 2006/07–10/11 7 3 88
Red-billed Chough GB*/UK* B 250–350 P 2002 5 1 27, 76Pyrrhocorax pyrrhocorax GB*/UK* B 930–940 I 2002 5 1 27, 76
IoM B 120–150 P 2002 5 1 56IoM B 430 I 2002 5 1 56
Magpie GB B 550,000 T 2009 1–UK 2 32Pica pica UK B 600,000 T 2009 1–UK 2 32
Eurasian Jay GB/UK B 170,000 T 2009 1–UK 2 32Garrulus glandarius *
Jackdaw GB B 1,300,000 P 2009 2 2 58Corvus monedula (1,100,000–1,400,000)
UK B 1,400,000 P 2009 2 2 58(1,200,000–1,500,000)
Rook GB B 990,000 P 2009 5–BBS 2 48Corvus frugilegus (860,000–1,130,000)
UK B 1,100,000 P 2009 5–BBS 2 48(1,000,000–1,200,000)
Carrion Crow GB/UK B 1,000,000 T 2009 1–Eng 2 32Corvus corone
Hooded Crow GB B 160,000 T 2009 1–BBS 2 32Corvus cornix UK B 260,000 T 2009 1–BBS 2 32
Common Raven GB B 7,000 P 2009 1–BBS 3 + 53 32Corvus corax UK B 7,400 P 2009 1–BBS 3 + 53 32
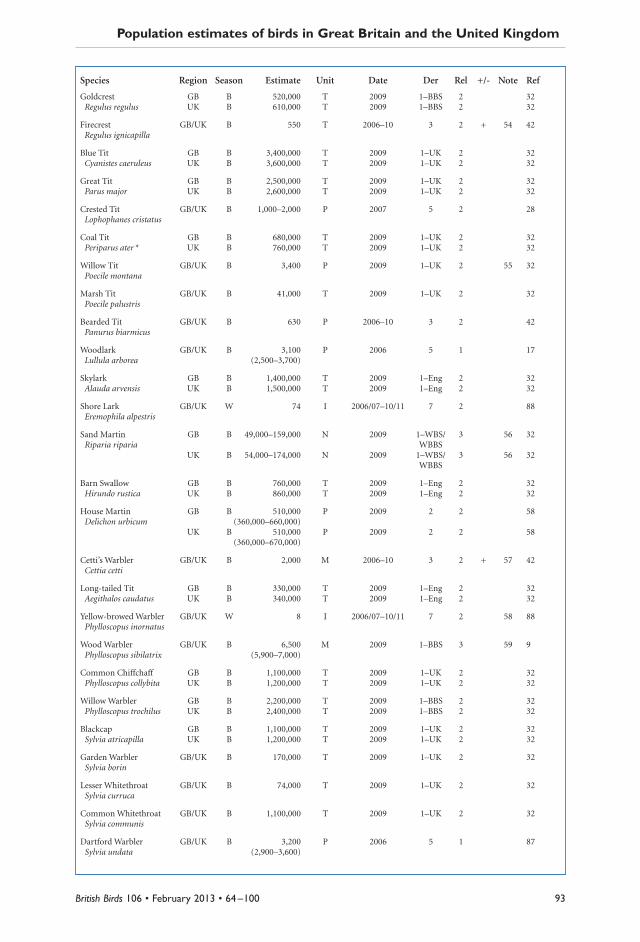
93British Birds 106 • February 2013 • 64 –100
Population estimates of birds in Great Britain and the United Kingdom
Species Region Season Estimate Unit Date Der Rel +/- Note Ref
Goldcrest GB B 520,000 T 2009 1–BBS 2 32Regulus regulus UK B 610,000 T 2009 1–BBS 2 32
Firecrest GB/UK B 550 T 2006–10 3 2 + 54 42 Regulus ignicapilla
Blue Tit GB B 3,400,000 T 2009 1–UK 2 32Cyanistes caeruleus UK B 3,600,000 T 2009 1–UK 2 32
Great Tit GB B 2,500,000 T 2009 1–UK 2 32Parus major UK B 2,600,000 T 2009 1–UK 2 32
Crested Tit GB/UK B 1,000–2,000 P 2007 5 2 28Lophophanes cristatus
Coal Tit GB B 680,000 T 2009 1–UK 2 32Periparus ater * UK B 760,000 T 2009 1–UK 2 32
Willow Tit GB/UK B 3,400 P 2009 1–UK 2 55 32Poecile montana
Marsh Tit GB/UK B 41,000 T 2009 1–UK 2 32Poecile palustris
Bearded Tit GB/UK B 630 P 2006–10 3 2 42 Panurus biarmicus
Woodlark GB/UK B 3,100 P 2006 5 1 17Lullula arborea (2,500–3,700)
Skylark GB B 1,400,000 T 2009 1–Eng 2 32Alauda arvensis UK B 1,500,000 T 2009 1–Eng 2 32
Shore Lark GB/UK W 74 I 2006/07–10/11 7 2 88Eremophila alpestris
Sand Martin GB B 49,000–159,000 N 2009 1–WBS/ 3 56 32Riparia riparia WBBS
UK B 54,000–174,000 N 2009 1–WBS/ 3 56 32WBBS
Barn Swallow GB B 760,000 T 2009 1–Eng 2 32Hirundo rustica UK B 860,000 T 2009 1–Eng 2 32
House Martin GB B 510,000 P 2009 2 2 58Delichon urbicum (360,000–660,000)
UK B 510,000 P 2009 2 2 58(360,000–670,000)
Cetti’s Warbler GB/UK B 2,000 M 2006–10 3 2 + 57 42 Cettia cetti
Long-tailed Tit GB B 330,000 T 2009 1–Eng 2 32Aegithalos caudatus UK B 340,000 T 2009 1–Eng 2 32
Yellow-browed Warbler GB/UK W 8 I 2006/07–10/11 7 2 58 88Phylloscopus inornatus
Wood Warbler GB/UK B 6,500 M 2009 1–BBS 3 59 9Phylloscopus sibilatrix (5,900–7,000)
Common Chiffchaff GB B 1,100,000 T 2009 1–UK 2 32Phylloscopus collybita UK B 1,200,000 T 2009 1–UK 2 32
Willow Warbler GB B 2,200,000 T 2009 1–BBS 2 32Phylloscopus trochilus UK B 2,400,000 T 2009 1–BBS 2 32
Blackcap GB B 1,100,000 T 2009 1–UK 2 32Sylvia atricapilla UK B 1,200,000 T 2009 1–UK 2 32
Garden Warbler GB/UK B 170,000 T 2009 1–UK 2 32Sylvia borin
Lesser Whitethroat GB/UK B 74,000 T 2009 1–UK 2 32Sylvia curruca
Common Whitethroat GB/UK B 1,100,000 T 2009 1–UK 2 32Sylvia communis
Dartford Warbler GB/UK B 3,200 P 2006 5 1 87Sylvia undata (2,900–3,600)
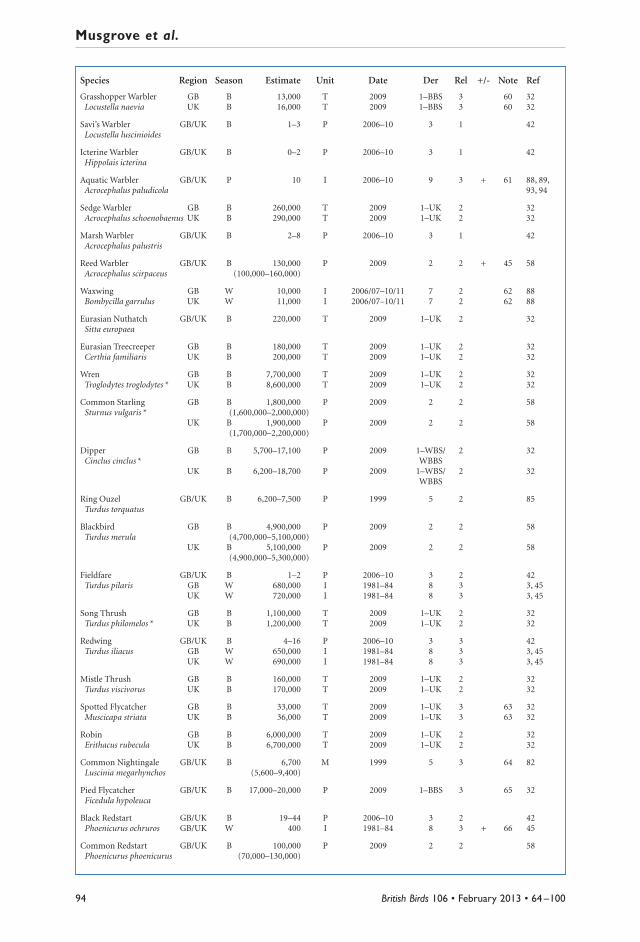
94
Musgrove et al.
British Birds 106 • February 2013 • 64 –100
Species Region Season Estimate Unit Date Der Rel +/- Note Ref
Grasshopper Warbler GB B 13,000 T 2009 1–BBS 3 60 32Locustella naevia UK B 16,000 T 2009 1–BBS 3 60 32
Savi’s Warbler GB/UK B 1–3 P 2006–10 3 1 42 Locustella luscinioides
Icterine Warbler GB/UK B 0–2 P 2006–10 3 1 42 Hippolais icterina
Aquatic Warbler GB/UK P 10 I 2006–10 9 3 + 61 88, 89, Acrocephalus paludicola 93, 94
Sedge Warbler GB B 260,000 T 2009 1–UK 2 32Acrocephalus schoenobaenus UK B 290,000 T 2009 1–UK 2 32
Marsh Warbler GB/UK B 2–8 P 2006–10 3 1 42 Acrocephalus palustris
Reed Warbler GB/UK B 130,000 P 2009 2 2 + 45 58Acrocephalus scirpaceus (100,000–160,000)
Waxwing GB W 10,000 I 2006/07–10/11 7 2 62 88Bombycilla garrulus UK W 11,000 I 2006/07–10/11 7 2 62 88
Eurasian Nuthatch GB/UK B 220,000 T 2009 1–UK 2 32Sitta europaea
Eurasian Treecreeper GB B 180,000 T 2009 1–UK 2 32Certhia familiaris UK B 200,000 T 2009 1–UK 2 32
Wren GB B 7,700,000 T 2009 1–UK 2 32Troglodytes troglodytes * UK B 8,600,000 T 2009 1–UK 2 32
Common Starling GB B 1,800,000 P 2009 2 2 58Sturnus vulgaris * (1,600,000–2,000,000)
UK B 1,900,000 P 2009 2 2 58(1,700,000–2,200,000)
Dipper GB B 5,700–17,100 P 2009 1–WBS/ 2 32Cinclus cinclus * WBBS
UK B 6,200–18,700 P 2009 1–WBS/ 2 32WBBS
Ring Ouzel GB/UK B 6,200–7,500 P 1999 5 2 85Turdus torquatus
Blackbird GB B 4,900,000 P 2009 2 2 58Turdus merula (4,700,000–5,100,000)
UK B 5,100,000 P 2009 2 2 58(4,900,000–5,300,000)
Fieldfare GB/UK B 1–2 P 2006–10 3 2 42 Turdus pilaris GB W 680,000 I 1981–84 8 3 3, 45
UK W 720,000 I 1981–84 8 3 3, 45
Song Thrush GB B 1,100,000 T 2009 1–UK 2 32Turdus philomelos * UK B 1,200,000 T 2009 1–UK 2 32
Redwing GB/UK B 4–16 P 2006–10 3 3 42 Turdus iliacus GB W 650,000 I 1981–84 8 3 3, 45
UK W 690,000 I 1981–84 8 3 3, 45
Mistle Thrush GB B 160,000 T 2009 1–UK 2 32Turdus viscivorus UK B 170,000 T 2009 1–UK 2 32
Spotted Flycatcher GB B 33,000 T 2009 1–UK 3 63 32Muscicapa striata UK B 36,000 T 2009 1–UK 3 63 32
Robin GB B 6,000,000 T 2009 1–UK 2 32Erithacus rubecula UK B 6,700,000 T 2009 1–UK 2 32
Common Nightingale GB/UK B 6,700 M 1999 5 3 64 82Luscinia megarhynchos (5,600–9,400)
Pied Flycatcher GB/UK B 17,000–20,000 P 2009 1–BBS 3 65 32Ficedula hypoleuca
Black Redstart GB/UK B 19–44 P 2006–10 3 2 42 Phoenicurus ochruros GB/UK W 400 I 1981–84 8 3 + 66 45
Common Redstart GB/UK B 100,000 P 2009 2 2 58Phoenicurus phoenicurus (70,000–130,000)
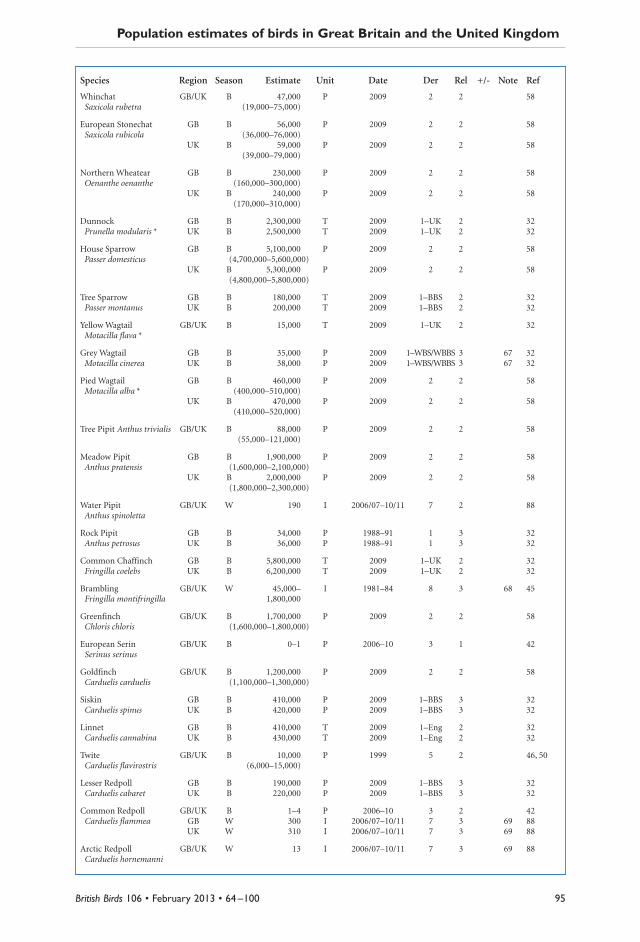
95British Birds 106 • February 2013 • 64 –100
Population estimates of birds in Great Britain and the United Kingdom
Species Region Season Estimate Unit Date Der Rel +/- Note Ref
Whinchat GB/UK B 47,000 P 2009 2 2 58Saxicola rubetra (19,000–75,000)
European Stonechat GB B 56,000 P 2009 2 2 58Saxicola rubicola (36,000–76,000)
UK B 59,000 P 2009 2 2 58(39,000–79,000)
Northern Wheatear GB B 230,000 P 2009 2 2 58Oenanthe oenanthe (160,000–300,000)
UK B 240,000 P 2009 2 2 58(170,000–310,000)
Dunnock GB B 2,300,000 T 2009 1–UK 2 32Prunella modularis * UK B 2,500,000 T 2009 1–UK 2 32
House Sparrow GB B 5,100,000 P 2009 2 2 58Passer domesticus (4,700,000–5,600,000)
UK B 5,300,000 P 2009 2 2 58(4,800,000–5,800,000)
Tree Sparrow GB B 180,000 T 2009 1–BBS 2 32Passer montanus UK B 200,000 T 2009 1–BBS 2 32
Yellow Wagtail GB/UK B 15,000 T 2009 1–UK 2 32Motacilla flava *
Grey Wagtail GB B 35,000 P 2009 1–WBS/WBBS 3 67 32Motacilla cinerea UK B 38,000 P 2009 1–WBS/WBBS 3 67 32
Pied Wagtail GB B 460,000 P 2009 2 2 58Motacilla alba * (400,000–510,000)
UK B 470,000 P 2009 2 2 58(410,000–520,000)
Tree Pipit Anthus trivialis GB/UK B 88,000 P 2009 2 2 58(55,000–121,000)
Meadow Pipit GB B 1,900,000 P 2009 2 2 58Anthus pratensis (1,600,000–2,100,000)
UK B 2,000,000 P 2009 2 2 58(1,800,000–2,300,000)
Water Pipit GB/UK W 190 I 2006/07–10/11 7 2 88Anthus spinoletta
Rock Pipit GB B 34,000 P 1988–91 1 3 32Anthus petrosus UK B 36,000 P 1988–91 1 3 32
Common Chaffinch GB B 5,800,000 T 2009 1–UK 2 32Fringilla coelebs UK B 6,200,000 T 2009 1–UK 2 32
Brambling GB/UK W 45,000– I 1981–84 8 3 68 45Fringilla montifringilla 1,800,000
Greenfinch GB/UK B 1,700,000 P 2009 2 2 58Chloris chloris (1,600,000–1,800,000)
European Serin GB/UK B 0–1 P 2006–10 3 1 42 Serinus serinus
Goldfinch GB/UK B 1,200,000 P 2009 2 2 58Carduelis carduelis (1,100,000–1,300,000)
Siskin GB B 410,000 P 2009 1–BBS 3 32Carduelis spinus UK B 420,000 P 2009 1–BBS 3 32
Linnet GB B 410,000 T 2009 1–Eng 2 32Carduelis cannabina UK B 430,000 T 2009 1–Eng 2 32
Twite GB/UK B 10,000 P 1999 5 2 46, 50Carduelis flavirostris (6,000–15,000)
Lesser Redpoll GB B 190,000 P 2009 1–BBS 3 32Carduelis cabaret UK B 220,000 P 2009 1–BBS 3 32
Common Redpoll GB/UK B 1–4 P 2006–10 3 2 42 Carduelis flammea GB W 300 I 2006/07–10/11 7 3 69 88
UK W 310 I 2006/07–10/11 7 3 69 88
Arctic Redpoll GB/UK W 13 I 2006/07–10/11 7 3 69 88Carduelis hornemanni
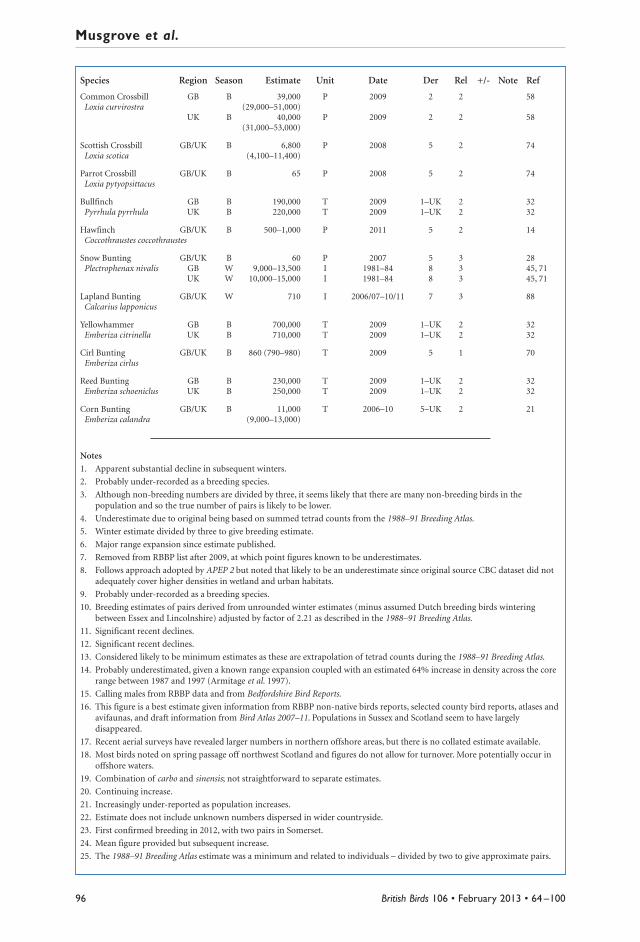
96
Musgrove et al.
British Birds 106 • February 2013 • 64 –100
Species Region Season Estimate Unit Date Der Rel +/- Note Ref
Common Crossbill GB B 39,000 P 2009 2 2 58Loxia curvirostra (29,000–51,000)
UK B 40,000 P 2009 2 2 58(31,000–53,000)
Scottish Crossbill GB/UK B 6,800 P 2008 5 2 74Loxia scotica (4,100–11,400)
Parrot Crossbill GB/UK B 65 P 2008 5 2 74Loxia pytyopsittacus
Bullfinch GB B 190,000 T 2009 1–UK 2 32Pyrrhula pyrrhula UK B 220,000 T 2009 1–UK 2 32
Hawfinch GB/UK B 500–1,000 P 2011 5 2 14Coccothraustes coccothraustes
Snow Bunting GB/UK B 60 P 2007 5 3 28Plectrophenax nivalis GB W 9,000–13,500 I 1981–84 8 3 45, 71
UK W 10,000–15,000 I 1981–84 8 3 45, 71
Lapland Bunting GB/UK W 710 I 2006/07–10/11 7 3 88Calcarius lapponicus
Yellowhammer GB B 700,000 T 2009 1–UK 2 32Emberiza citrinella UK B 710,000 T 2009 1–UK 2 32
Cirl Bunting GB/UK B 860 (790–980) T 2009 5 1 70Emberiza cirlus
Reed Bunting GB B 230,000 T 2009 1–UK 2 32Emberiza schoeniclus UK B 250,000 T 2009 1–UK 2 32
Corn Bunting GB/UK B 11,000 T 2006–10 5–UK 2 21Emberiza calandra (9,000–13,000)
Notes
1. Apparent substantial decline in subsequent winters.
2. Probably under-recorded as a breeding species.
3. Although non-breeding numbers are divided by three, it seems likely that there are many non-breeding birds in thepopulation and so the true number of pairs is likely to be lower.
4. Underestimate due to original being based on summed tetrad counts from the 1988–91 Breeding Atlas.
5. Winter estimate divided by three to give breeding estimate.
6. Major range expansion since estimate published.
7. Removed from RBBP list after 2009, at which point figures known to be underestimates.
8. Follows approach adopted by APEP 2 but noted that likely to be an underestimate since original source CBC dataset did notadequately cover higher densities in wetland and urban habitats.
9. Probably under-recorded as a breeding species.
10. Breeding estimates of pairs derived from unrounded winter estimates (minus assumed Dutch breeding birds winteringbetween Essex and Lincolnshire) adjusted by factor of 2.21 as described in the 1988–91 Breeding Atlas.
11. Significant recent declines.
12. Significant recent declines.
13. Considered likely to be minimum estimates as these are extrapolation of tetrad counts during the 1988–91 Breeding Atlas.
14. Probably underestimated, given a known range expansion coupled with an estimated 64% increase in density across the corerange between 1987 and 1997 (Armitage et al. 1997).
15. Calling males from RBBP data and from Bedfordshire Bird Reports.
16. This figure is a best estimate given information from RBBP non-native birds reports, selected county bird reports, atlases andavifaunas, and draft information from Bird Atlas 2007–11. Populations in Sussex and Scotland seem to have largelydisappeared.
17. Recent aerial surveys have revealed larger numbers in northern offshore areas, but there is no collated estimate available.
18. Most birds noted on spring passage off northwest Scotland and figures do not allow for turnover. More potentially occur inoffshore waters.
19. Combination of carbo and sinensis; not straightforward to separate estimates.
20. Continuing increase.
21. Increasingly under-reported as population increases.
22. Estimate does not include unknown numbers dispersed in wider countryside.
23. First confirmed breeding in 2012, with two pairs in Somerset.
24. Mean figure provided but subsequent increase.
25. The 1988–91 Breeding Atlas estimate was a minimum and related to individuals – divided by two to give approximate pairs.
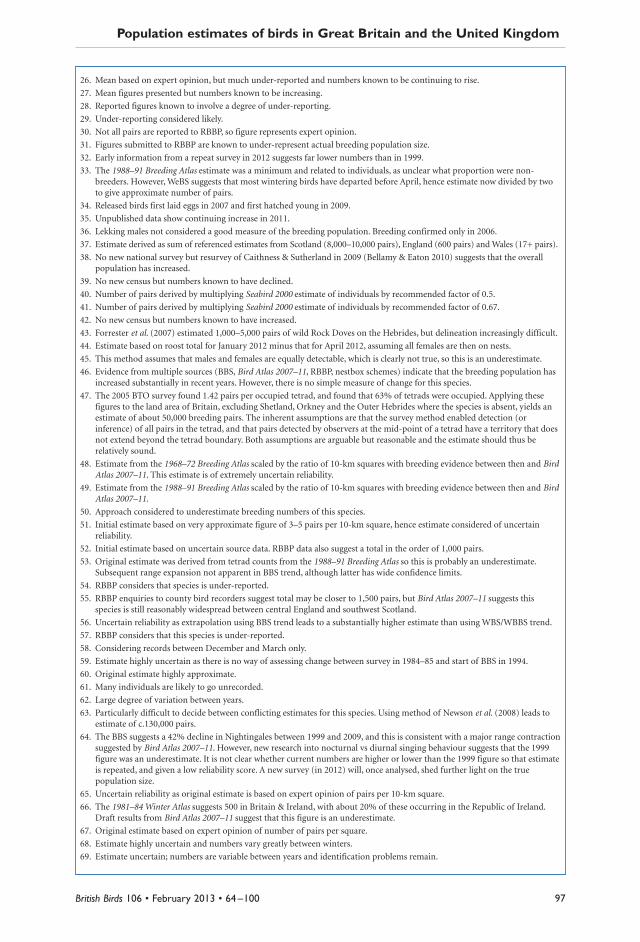
97British Birds 106 • February 2013 • 64 –100
Population estimates of birds in Great Britain and the United Kingdom
26. Mean based on expert opinion, but much under-reported and numbers known to be continuing to rise.
27. Mean figures presented but numbers known to be increasing.
28. Reported figures known to involve a degree of under-reporting.
29. Under-reporting considered likely.
30. Not all pairs are reported to RBBP, so figure represents expert opinion.
31. Figures submitted to RBBP are known to under-represent actual breeding population size.
32. Early information from a repeat survey in 2012 suggests far lower numbers than in 1999.
33. The 1988–91 Breeding Atlas estimate was a minimum and related to individuals, as unclear what proportion were non-breeders. However, WeBS suggests that most wintering birds have departed before April, hence estimate now divided by twoto give approximate number of pairs.
34. Released birds first laid eggs in 2007 and first hatched young in 2009.
35. Unpublished data show continuing increase in 2011.
36. Lekking males not considered a good measure of the breeding population. Breeding confirmed only in 2006.
37. Estimate derived as sum of referenced estimates from Scotland (8,000–10,000 pairs), England (600 pairs) and Wales (17+ pairs).
38. No new national survey but resurvey of Caithness & Sutherland in 2009 (Bellamy & Eaton 2010) suggests that the overallpopulation has increased.
39. No new census but numbers known to have declined.
40. Number of pairs derived by multiplying Seabird 2000 estimate of individuals by recommended factor of 0.5.
41. Number of pairs derived by multiplying Seabird 2000 estimate of individuals by recommended factor of 0.67.
42. No new census but numbers known to have increased.
43. Forrester et al. (2007) estimated 1,000–5,000 pairs of wild Rock Doves on the Hebrides, but delineation increasingly difficult.
44. Estimate based on roost total for January 2012 minus that for April 2012, assuming all females are then on nests.
45. This method assumes that males and females are equally detectable, which is clearly not true, so this is an underestimate.
46. Evidence from multiple sources (BBS, Bird Atlas 2007–11, RBBP, nestbox schemes) indicate that the breeding population hasincreased substantially in recent years. However, there is no simple measure of change for this species.
47. The 2005 BTO survey found 1.42 pairs per occupied tetrad, and found that 63% of tetrads were occupied. Applying thesefigures to the land area of Britain, excluding Shetland, Orkney and the Outer Hebrides where the species is absent, yields anestimate of about 50,000 breeding pairs. The inherent assumptions are that the survey method enabled detection (orinference) of all pairs in the tetrad, and that pairs detected by observers at the mid-point of a tetrad have a territory that doesnot extend beyond the tetrad boundary. Both assumptions are arguable but reasonable and the estimate should thus berelatively sound.
48. Estimate from the 1968–72 Breeding Atlas scaled by the ratio of 10-km squares with breeding evidence between then and BirdAtlas 2007–11. This estimate is of extremely uncertain reliability.
49. Estimate from the 1988–91 Breeding Atlas scaled by the ratio of 10-km squares with breeding evidence between then and BirdAtlas 2007–11.
50. Approach considered to underestimate breeding numbers of this species.
51. Initial estimate based on very approximate figure of 3–5 pairs per 10-km square, hence estimate considered of uncertainreliability.
52. Initial estimate based on uncertain source data. RBBP data also suggest a total in the order of 1,000 pairs.
53. Original estimate was derived from tetrad counts from the 1988–91 Breeding Atlas so this is probably an underestimate.Subsequent range expansion not apparent in BBS trend, although latter has wide confidence limits.
54. RBBP considers that species is under-reported.
55. RBBP enquiries to county bird recorders suggest total may be closer to 1,500 pairs, but Bird Atlas 2007–11 suggests thisspecies is still reasonably widespread between central England and southwest Scotland.
56. Uncertain reliability as extrapolation using BBS trend leads to a substantially higher estimate than using WBS/WBBS trend.
57. RBBP considers that this species is under-reported.
58. Considering records between December and March only.
59. Estimate highly uncertain as there is no way of assessing change between survey in 1984–85 and start of BBS in 1994.
60. Original estimate highly approximate.
61. Many individuals are likely to go unrecorded.
62. Large degree of variation between years.
63. Particularly difficult to decide between conflicting estimates for this species. Using method of Newson et al. (2008) leads toestimate of c.130,000 pairs.
64. The BBS suggests a 42% decline in Nightingales between 1999 and 2009, and this is consistent with a major range contractionsuggested by Bird Atlas 2007–11. However, new research into nocturnal vs diurnal singing behaviour suggests that the 1999figure was an underestimate. It is not clear whether current numbers are higher or lower than the 1999 figure so that estimateis repeated, and given a low reliability score. A new survey (in 2012) will, once analysed, shed further light on the truepopulation size.
65. Uncertain reliability as original estimate is based on expert opinion of pairs per 10-km square.
66. The 1981–84 Winter Atlas suggests 500 in Britain & Ireland, with about 20% of these occurring in the Republic of Ireland.Draft results from Bird Atlas 2007–11 suggest that this figure is an underestimate.
67. Original estimate based on expert opinion of number of pairs per square.
68. Estimate highly uncertain and numbers vary greatly between winters.
69. Estimate uncertain; numbers are variable between years and identification problems remain.

98
Musgrove et al.
British Birds 106 • February 2013 • 64 –100
Appendix 2. Population estimates of selected subspecies or biogeographical populations of birdsin Great Britain and the United Kingdom.Key: See Appendix 1.
Subspecies/population Region Season Estimate Unit Date Der Rel +/- Note Ref
Taiga Bean Goose GB/UK W 410 I 2005/06–2009/10 6 1 57Anser fabalis fabalis
Tundra Bean Goose GB/UK W 320 I 2004/05–2008/09 6 1 57Anser fabalis rossicus
European White- GB/UK W 2,400 I 2004/05–2008/09 6 1 57fronted GooseAnser albifrons albifrons
Greenland White- GB/UK W 13,000 I 2005/06–2009/10 6 1 57fronted GooseAnser albifrons flavirostris
Greylag Goose GB/UK B 46,000 P 2004–08 5 3 57Anser anser GB/UK W 140,000 I 2004/05–08/09 6 2 57(Britain, Ireland)
Greylag Goose GB W 85,000 I 2005/06–09/10 6 2 53Anser anser (Iceland) UK W 88,000 I 2005/06–09/10 6 2 53
Barnacle Goose GB/UK W 58,000 I 2007/08 6 1 54Branta leucopsis (E Greenland)
Barnacle Goose GB/UK W 33,000 I 2009/10 6 1 37, 57Branta leucopsis (Svalbard)
Barnacle Goose GB B 900 P 2004–08 5 3 - 1 57Branta leucopsis UK B 1,000 P 2004–08 5 3 - 1 57(naturalised) GB W 2,700 I 2004/05–08/09 6 2 57
UK W 3,000 I 2004/05–08/09 6 2 57
Dark-bellied Brent Goose GB/UK W 91,000 I 2004/05–08/09 6 1 57Branta bernicla bernicla
Light-bellied Brent Goose GB W 710 I 2004/05–08/09 6 1 57Branta bernicla hrota UK W 27,000 I 2004/05–08/09 6 1 57(Canada)
Light-bellied Brent Goose GB/UK W 3,400 I 2004/05–08/09 6 1 57Branta bernicla hrota(Svalbard/N Greenland)
Common Eider GB B 23,000 P 2004–08 5 2 2 32, 57Somateria mollissima UK B 25,000 P 2004–08 5 2 2 32, 57(excl. Shetland) GB W 55,000 I 2004/05–08/09 6 2 2 57
UK W 58,000 I 2004/05–08/09 6 2 2 57
Common Eider GB/UK B 2,500 P 2005–09 5 2 - 2 32, 57Somateria mollissima GB/UK W 5,500 I 2005/06–09/10 6 1 - 2 57(Shetland)
Eurasian Black-tailed Godwit GB/UK B 54–57 P 2006–10 3 1 42Limosa limosa limosa
Icelandic Black-tailed GB/UK B 7–9 P 2006–10 3 1 42Godwit GB W 43,000 I 2004/05–08/09 6 1 57Limosa limosa islandica UK W 44,000 I 2004/05–08/09 6 1 57
Eurasian Jay UK (NI) B 4,300 T 2009 1–UK 2 32Garrulus glandarius hibernicus
Coal Tit GB B 680,000 T 2009 1–UK 2 32Periparus ater britannicus UK B 680,000 T 2009 1–UK 2 + 3 32
Coal Tit UK (NI) B 85,000 T 2009 1–UK 2 - 3 32Periparus ater hibernicus
Wren GB B 7,700,000 T 2009 1–UK 2 32Troglodytes troglodytes UK B 8,600,000 T 2009 1–UK 2 32indigenus
‘Fair Isle’ Wren GB/UK B 29 T 2007–11 5 1 2Troglodytes troglodytes fridariensis
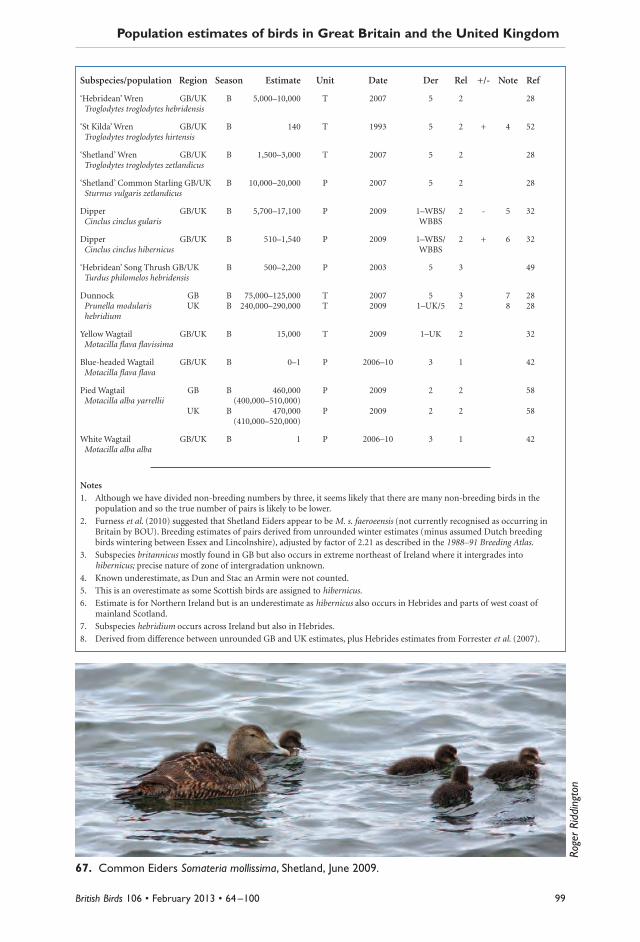
99British Birds 106 • February 2013 • 64 –100
Population estimates of birds in Great Britain and the United Kingdom
Subspecies/population Region Season Estimate Unit Date Der Rel +/- Note Ref
‘Hebridean’ Wren GB/UK B 5,000–10,000 T 2007 5 2 28Troglodytes troglodytes hebridensis
‘St Kilda’ Wren GB/UK B 140 T 1993 5 2 + 4 52Troglodytes troglodytes hirtensis
‘Shetland’ Wren GB/UK B 1,500–3,000 T 2007 5 2 28Troglodytes troglodytes zetlandicus
‘Shetland’ Common Starling GB/UK B 10,000–20,000 P 2007 5 2 28Sturnus vulgaris zetlandicus
Dipper GB/UK B 5,700–17,100 P 2009 1–WBS/ 2 - 5 32Cinclus cinclus gularis WBBS
Dipper GB/UK B 510–1,540 P 2009 1–WBS/ 2 + 6 32Cinclus cinclus hibernicus WBBS
‘Hebridean’ Song Thrush GB/UK B 500–2,200 P 2003 5 3 49Turdus philomelos hebridensis
Dunnock GB B 75,000–125,000 T 2007 5 3 7 28Prunella modularis UK B 240,000–290,000 T 2009 1–UK/5 2 8 28hebridium
Yellow Wagtail GB/UK B 15,000 T 2009 1–UK 2 32Motacilla flava flavissima
Blue-headed Wagtail GB/UK B 0–1 P 2006–10 3 1 42Motacilla flava flava
Pied Wagtail GB B 460,000 P 2009 2 2 58Motacilla alba yarrellii (400,000–510,000)
UK B 470,000 P 2009 2 2 58(410,000–520,000)
White Wagtail GB/UK B 1 P 2006–10 3 1 42Motacilla alba alba
Notes
1. Although we have divided non-breeding numbers by three, it seems likely that there are many non-breeding birds in thepopulation and so the true number of pairs is likely to be lower.
2. Furness et al. (2010) suggested that Shetland Eiders appear to be M. s. faeroeensis (not currently recognised as occurring inBritain by BOU). Breeding estimates of pairs derived from unrounded winter estimates (minus assumed Dutch breedingbirds wintering between Essex and Lincolnshire), adjusted by factor of 2.21 as described in the 1988–91 Breeding Atlas.
3. Subspecies britannicus mostly found in GB but also occurs in extreme northeast of Ireland where it intergrades intohibernicus; precise nature of zone of intergradation unknown.
4. Known underestimate, as Dun and Stac an Armin were not counted.
5. This is an overestimate as some Scottish birds are assigned to hibernicus.
6. Estimate is for Northern Ireland but is an underestimate as hibernicus also occurs in Hebrides and parts of west coast ofmainland Scotland.
7. Subspecies hebridium occurs across Ireland but also in Hebrides.
8. Derived from difference between unrounded GB and UK estimates, plus Hebrides estimates from Forrester et al. (2007).
67. Common Eiders Somateria mollissima, Shetland, June 2009.
Roger Riddington
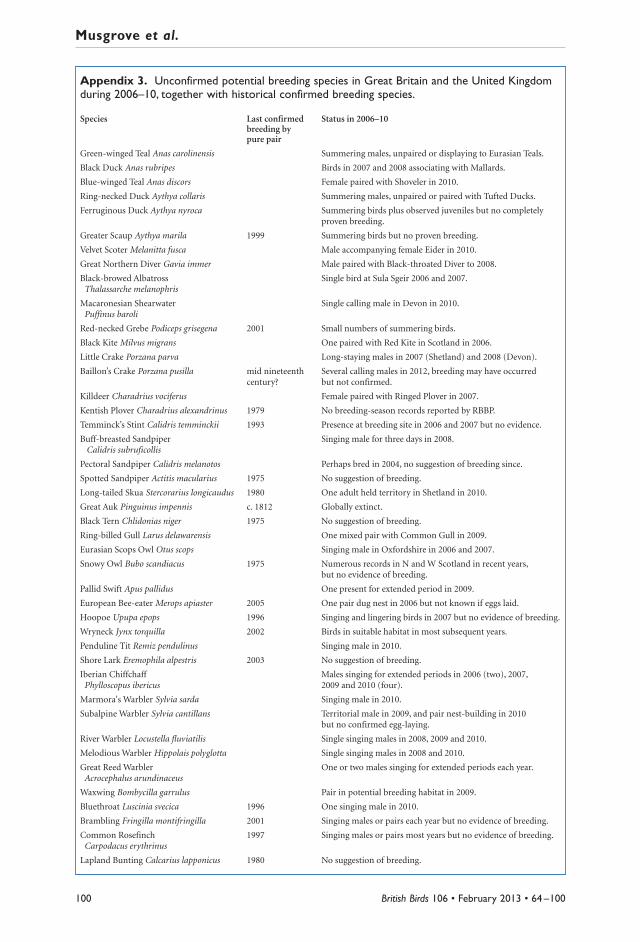
100
Musgrove et al.
British Birds 106 • February 2013 • 64 –100
Appendix 3. Unconfirmed potential breeding species in Great Britain and the United Kingdomduring 2006–10, together with historical confirmed breeding species.
Species Last confirmed Status in 2006–10breeding by pure pair
Green-winged Teal Anas carolinensis Summering males, unpaired or displaying to Eurasian Teals.
Black Duck Anas rubripes Birds in 2007 and 2008 associating with Mallards.
Blue-winged Teal Anas discors Female paired with Shoveler in 2010.
Ring-necked Duck Aythya collaris Summering males, unpaired or paired with Tufted Ducks.
Ferruginous Duck Aythya nyroca Summering birds plus observed juveniles but no completely proven breeding.
Greater Scaup Aythya marila 1999 Summering birds but no proven breeding.
Velvet Scoter Melanitta fusca Male accompanying female Eider in 2010.
Great Northern Diver Gavia immer Male paired with Black-throated Diver to 2008.
Black-browed Albatross Single bird at Sula Sgeir 2006 and 2007.Thalassarche melanophris
Macaronesian Shearwater Single calling male in Devon in 2010.Puffinus baroli
Red-necked Grebe Podiceps grisegena 2001 Small numbers of summering birds.
Black Kite Milvus migrans One paired with Red Kite in Scotland in 2006.
Little Crake Porzana parva Long-staying males in 2007 (Shetland) and 2008 (Devon).
Baillon’s Crake Porzana pusilla mid nineteenth Several calling males in 2012, breeding may have occurredcentury? but not confirmed.
Killdeer Charadrius vociferus Female paired with Ringed Plover in 2007.
Kentish Plover Charadrius alexandrinus 1979 No breeding-season records reported by RBBP.
Temminck’s Stint Calidris temminckii 1993 Presence at breeding site in 2006 and 2007 but no evidence.
Buff-breasted Sandpiper Singing male for three days in 2008.Calidris subruficollis
Pectoral Sandpiper Calidris melanotos Perhaps bred in 2004, no suggestion of breeding since.
Spotted Sandpiper Actitis macularius 1975 No suggestion of breeding.
Long-tailed Skua Stercorarius longicaudus 1980 One adult held territory in Shetland in 2010.
Great Auk Pinguinus impennis c. 1812 Globally extinct.
Black Tern Chlidonias niger 1975 No suggestion of breeding.
Ring-billed Gull Larus delawarensis One mixed pair with Common Gull in 2009.
Eurasian Scops Owl Otus scops Singing male in Oxfordshire in 2006 and 2007.
Snowy Owl Bubo scandiacus 1975 Numerous records in N and W Scotland in recent years, but no evidence of breeding.
Pallid Swift Apus pallidus One present for extended period in 2009.
European Bee-eater Merops apiaster 2005 One pair dug nest in 2006 but not known if eggs laid.
Hoopoe Upupa epops 1996 Singing and lingering birds in 2007 but no evidence of breeding.
Wryneck Jynx torquilla 2002 Birds in suitable habitat in most subsequent years.
Penduline Tit Remiz pendulinus Singing male in 2010.
Shore Lark Eremophila alpestris 2003 No suggestion of breeding.
Iberian Chiffchaff Males singing for extended periods in 2006 (two), 2007, Phylloscopus ibericus 2009 and 2010 (four).
Marmora's Warbler Sylvia sarda Singing male in 2010.
Subalpine Warbler Sylvia cantillans Territorial male in 2009, and pair nest-building in 2010 but no confirmed egg-laying.
River Warbler Locustella fluviatilis Single singing males in 2008, 2009 and 2010.
Melodious Warbler Hippolais polyglotta Single singing males in 2008 and 2010.
Great Reed Warbler One or two males singing for extended periods each year.Acrocephalus arundinaceus
Waxwing Bombycilla garrulus Pair in potential breeding habitat in 2009.
Bluethroat Luscinia svecica 1996 One singing male in 2010.
Brambling Fringilla montifringilla 2001 Singing males or pairs each year but no evidence of breeding.
Common Rosefinch 1997 Singing males or pairs most years but no evidence of breeding.Carpodacus erythrinus
Lapland Bunting Calcarius lapponicus 1980 No suggestion of breeding.