Embed Size (px)
Citation preview
1
Population Genetics: Practical ApplicationsPopulation Genetics: Practical Applications
Lynn B. JordeLynn B. JordeDepartment of Human GeneticsDepartment of Human Genetics
University of Utah School of MedicineUniversity of Utah School of Medicine
OverviewOverview
Patterns of human genetic variationPatterns of human genetic variation•• Among populationsAmong populations•• Among individualsAmong individuals
““RaceRace”” and its biomedical implicationsand its biomedical implications
Linkage disequilibrium, the Linkage disequilibrium, the HapMapHapMap, and , and the search for complex disease genesthe search for complex disease genes
2
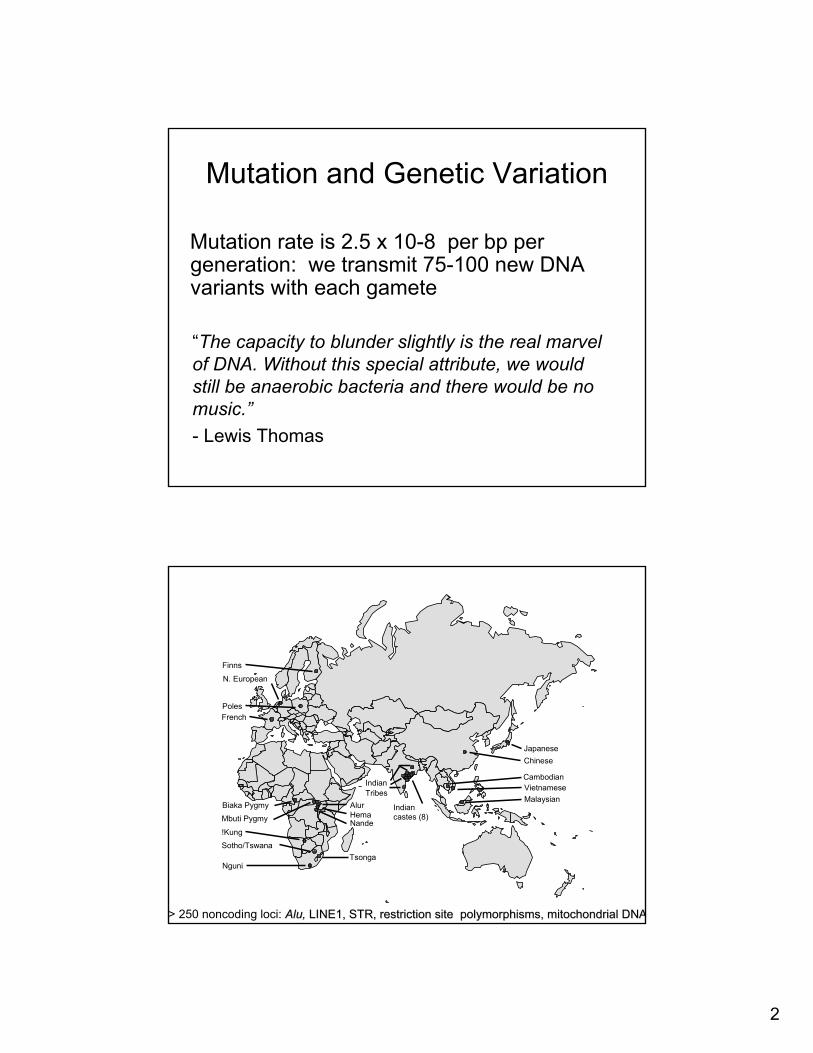
MMutation rate is 2.5 x 10utation rate is 2.5 x 10--8 per 8 per bpbp per per generation: wgeneration: we transmit 75e transmit 75--100 new DNA 100 new DNA variants with each gametevariants with each gamete
“The capacity to blunder slightly is the real marvel of DNA. Without this special attribute, we would still be anaerobic bacteria and there would be no music.”- Lewis Thomas
Mutation and Genetic VariationMutation and Genetic Variation
Nguni
Sotho/TswanaTsonga
AlurHemaNande
Biaka Pygmy
Mbuti Pygmy
French
N. European
Poles
Finns
JapaneseChinese
CambodianVietnameseMalaysian
IndianTribes
!Kung
Indiancastes (8)
> 250 noncoding loci: AluAlu, , LINE1, STR, restriction site polymorphisms, mitochondrial DNALINE1, STR, restriction site polymorphisms, mitochondrial DNA
3
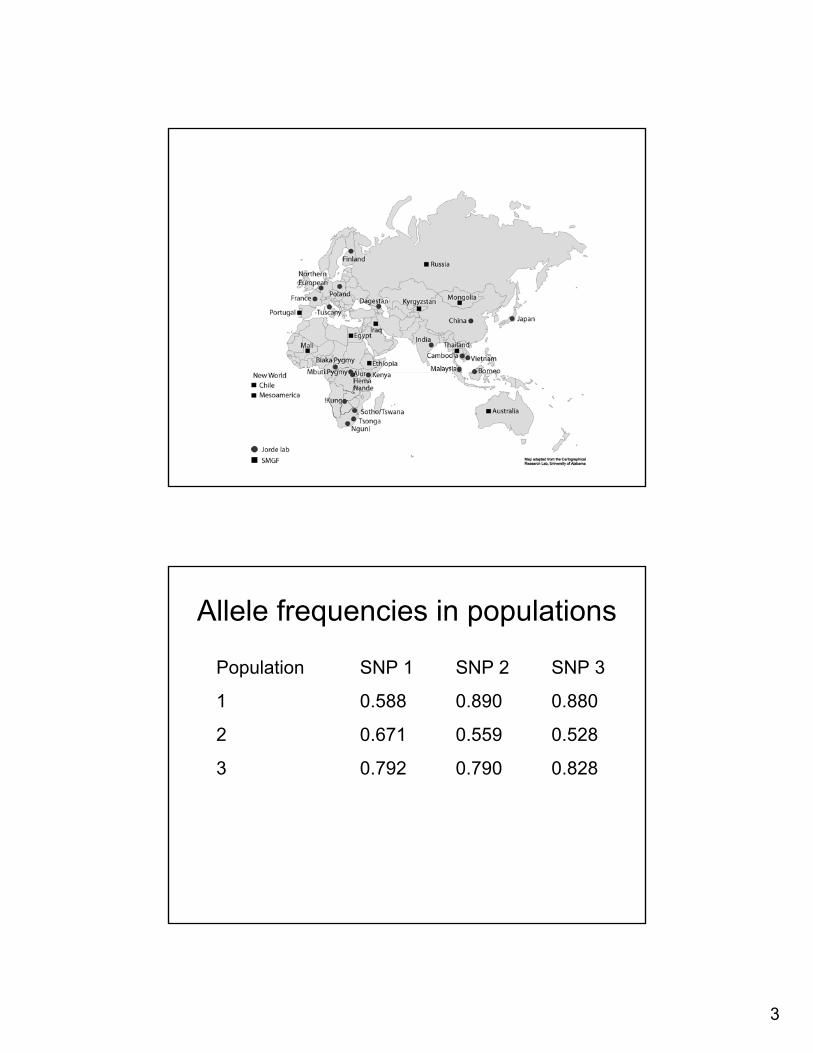
Allele frequencies in populationsAllele frequencies in populations
PopulationPopulation SNP 1SNP 1 SNP 2SNP 2 SNP 3SNP 3
11 0.5880.588 0.8900.890 0.8800.880
22 0.6710.671 0.5590.559 0.5280.528
33 0.7920.792 0.7900.790 0.8280.828
4
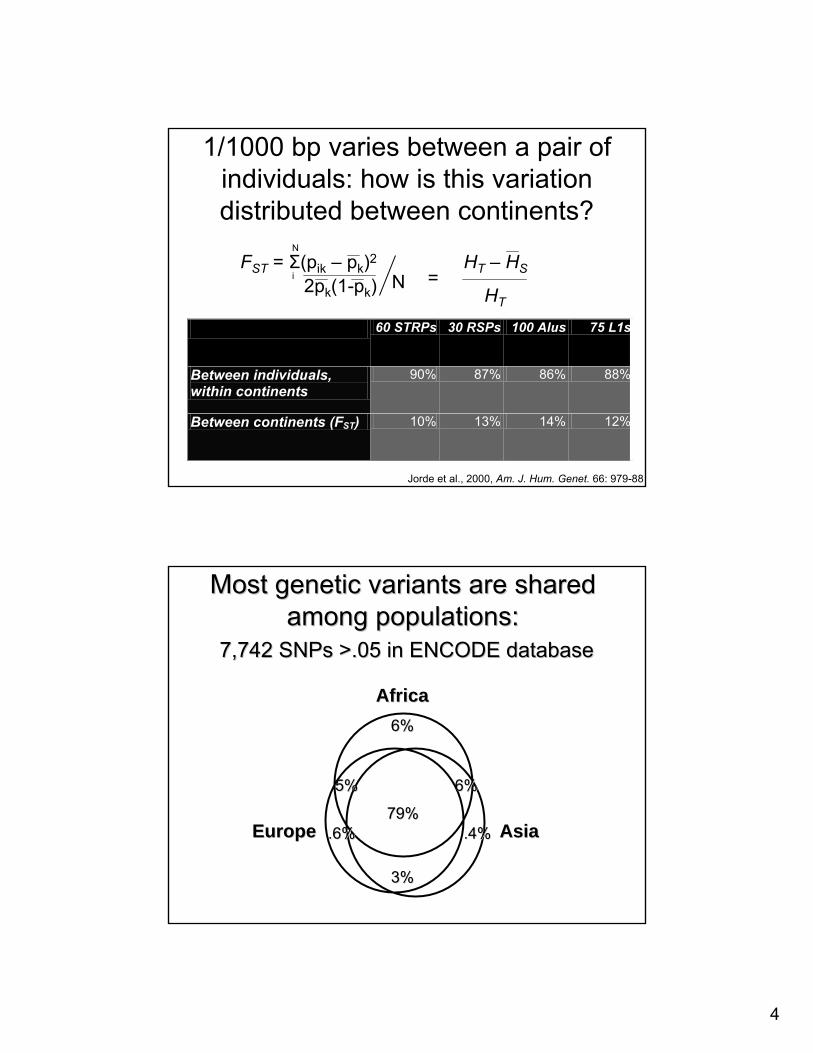
1/1000 bp varies between a pair of 1/1000 bp varies between a pair of individuals: how is this variation individuals: how is this variation distributed between continents?distributed between continents?
60 STRPs 30 RSPs 100 Alus 75 L1s
Between individuals, within continents
90% 87% 86% 88%
Between continents (FST) 10% 13% 14% 12%
FFSTST = = ΣΣ((ppikik –– ppkk))22ii
2p2pkk(1(1--ppkk)) NN
NN
HHTT –– HHSS
HHTT
==
Jorde et al., 2000, Jorde et al., 2000, Am. J. Hum. Genet. Am. J. Hum. Genet. 66: 97966: 979--8888
Most genetic variants are shared Most genetic variants are shared among populations:among populations:
7,742 SNPs >.05 in ENCODE database7,742 SNPs >.05 in ENCODE database
AsiaAsia
AfricaAfrica
79%79%
6%6%
.4%.4%.6%.6%
6%6%5%5%
3%3%
EuropeEurope
5
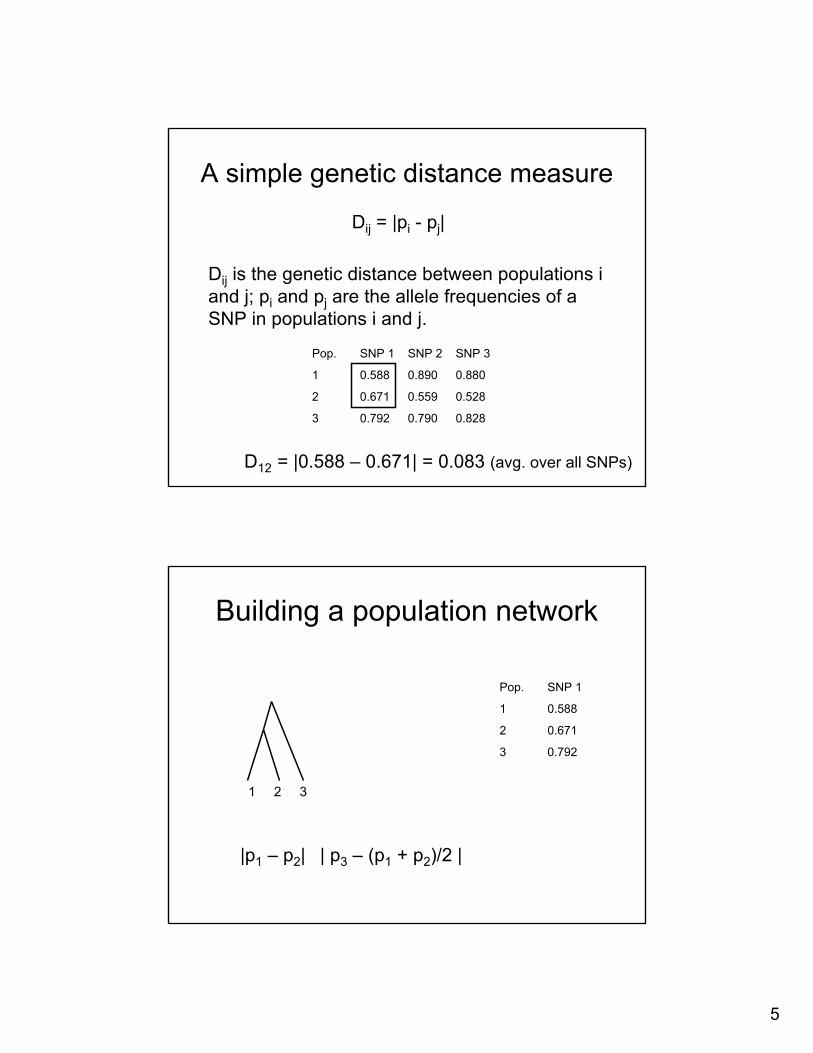
A simple genetic distance measureA simple genetic distance measure
DDijij = |p= |pii -- ppjj||
DDijij is the genetic distance between populations i is the genetic distance between populations i and j; pand j; pii and and ppjj are the allele frequencies of a are the allele frequencies of a SNP in populations i and j.SNP in populations i and j.
Pop.Pop. SNP 1SNP 1 SNP 2SNP 2 SNP 3SNP 3
11 0.5880.588 0.8900.890 0.8800.880
22 0.6710.671 0.5590.559 0.5280.528
33 0.7920.792 0.7900.790 0.8280.828
= |0.588 = |0.588 –– 0.671| = 0.083 0.671| = 0.083 (avg. over all (avg. over all SNPsSNPs))DD1212
Building a population networkBuilding a population network
||pp11 –– pp22||
1 2 31 2 3
|| pp33 –– (p(p11 + p+ p22))/2 |/2 |
Pop.Pop. SNP 1SNP 1
11 0.5880.588
22 0.6710.671
33 0.7920.792
6
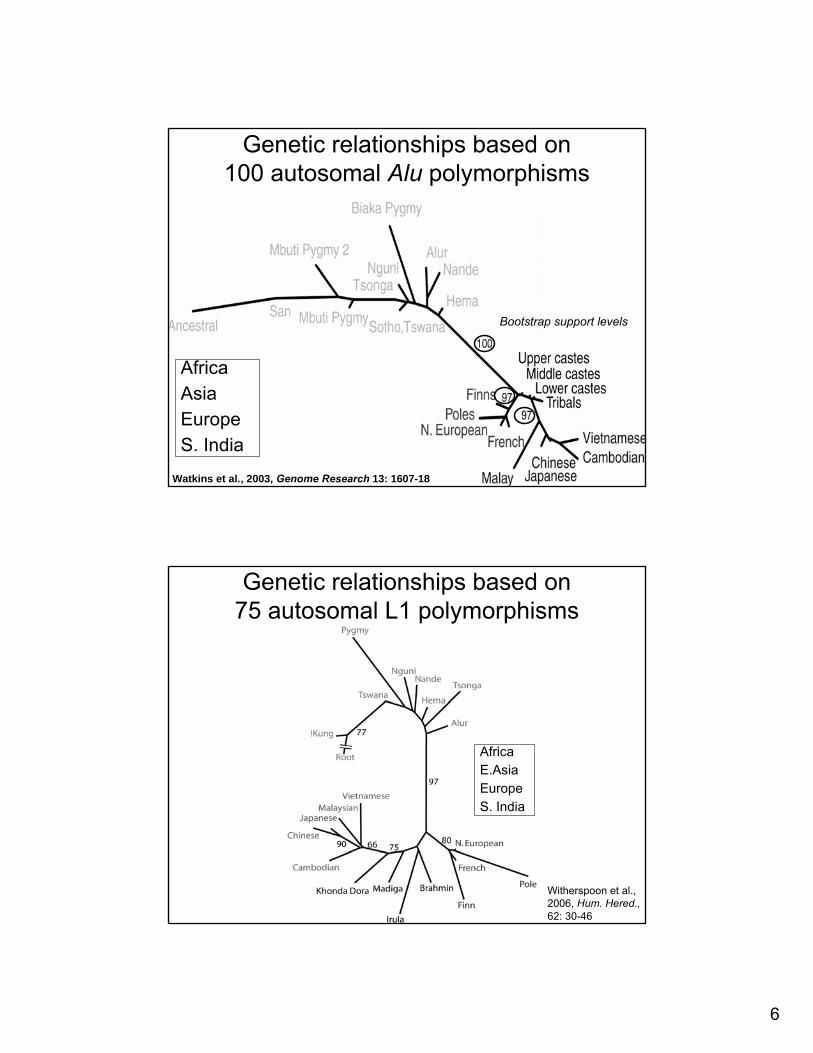
Genetic relationships based on Genetic relationships based on 100 autosomal 100 autosomal AluAlu polymorphisms polymorphisms
Watkins et al., 2003, Genome Research 13: 1607-18
AfricaAsiaEuropeS. India
Bootstrap support levelsBootstrap support levels
Genetic relationships based on Genetic relationships based on 75 autosomal L1 polymorphisms75 autosomal L1 polymorphisms
AfricaE.AsiaEuropeS. India
Witherspoon et al., Witherspoon et al., 2006, 2006, Hum. Hered., Hum. Hered., 62: 3062: 30--4646
7
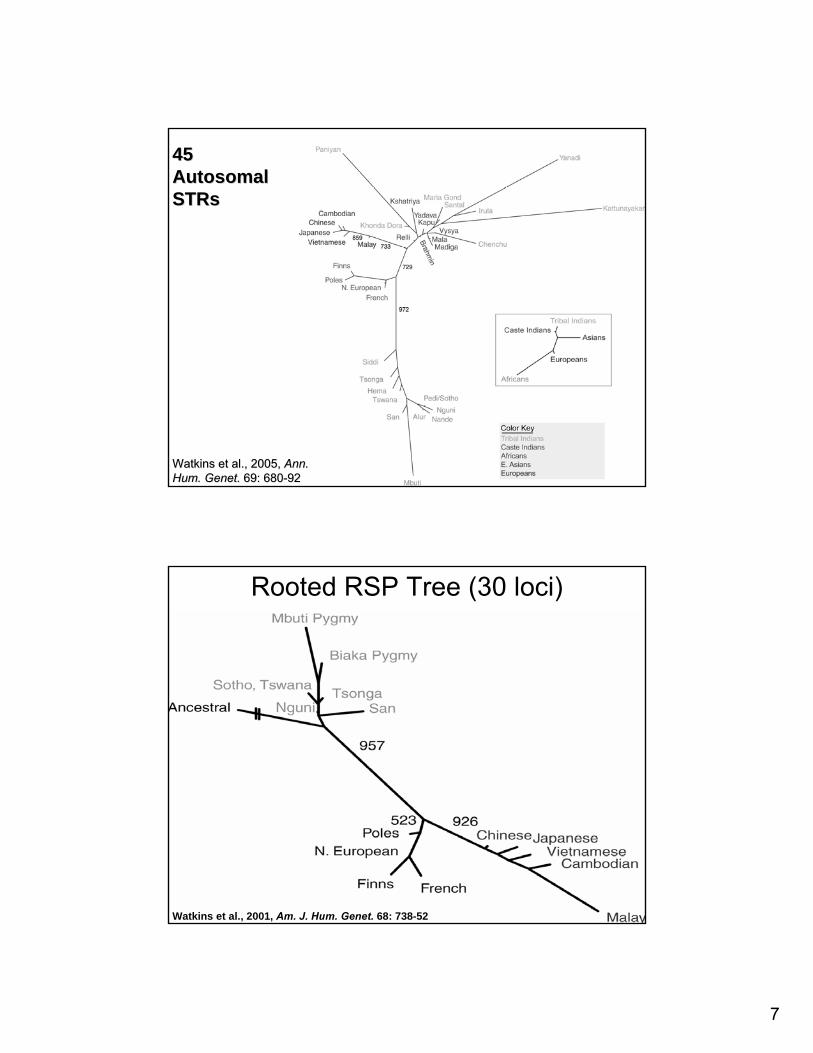
Watkins et al., 2005, Watkins et al., 2005, Ann. Ann. Hum. Genet. Hum. Genet. 69: 68069: 680--9292
45 45 Autosomal Autosomal STRsSTRs
Rooted RSP Tree (30 loci)Rooted RSP Tree (30 loci)
Watkins et al., 2001, Am. J. Hum. Genet. 68: 738-52
8
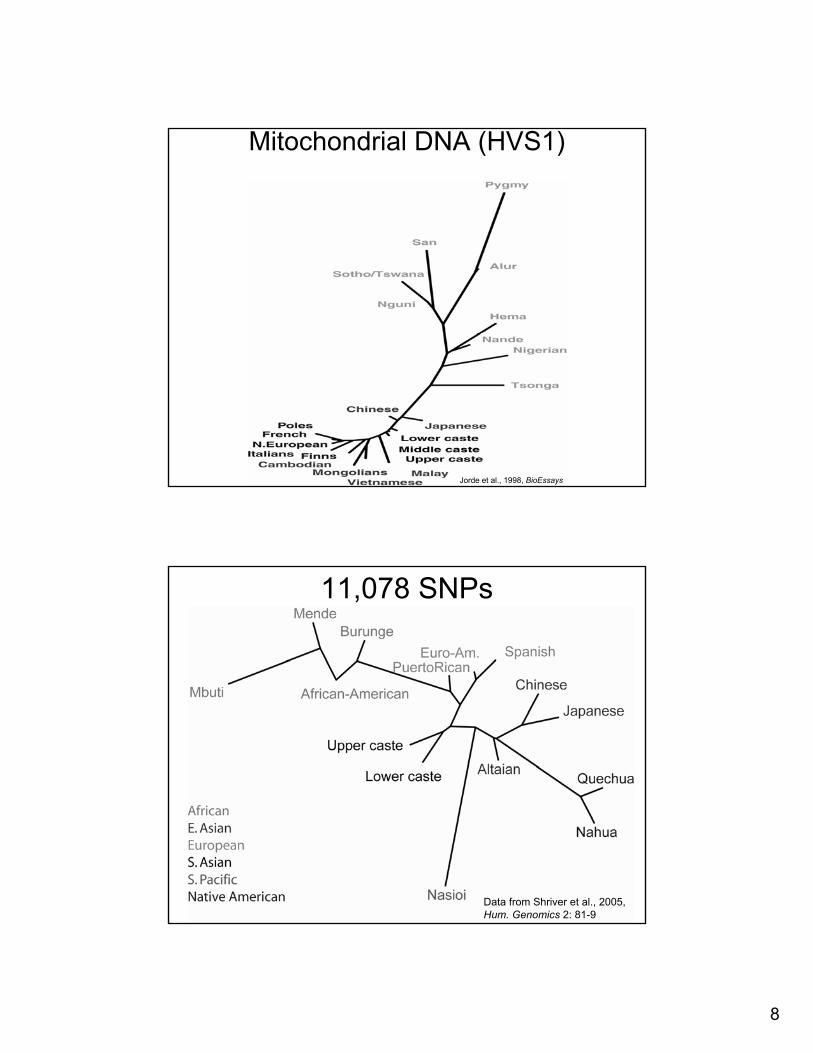
Mitochondrial DNA (HVS1)Mitochondrial DNA (HVS1)
Jorde et al., 1998, Jorde et al., 1998, BioEssaysBioEssays
11,078 SNPs11,078 SNPs
Data from Shriver et al., 2005, Data from Shriver et al., 2005, Hum. Genomics Hum. Genomics 2: 812: 81--99
9
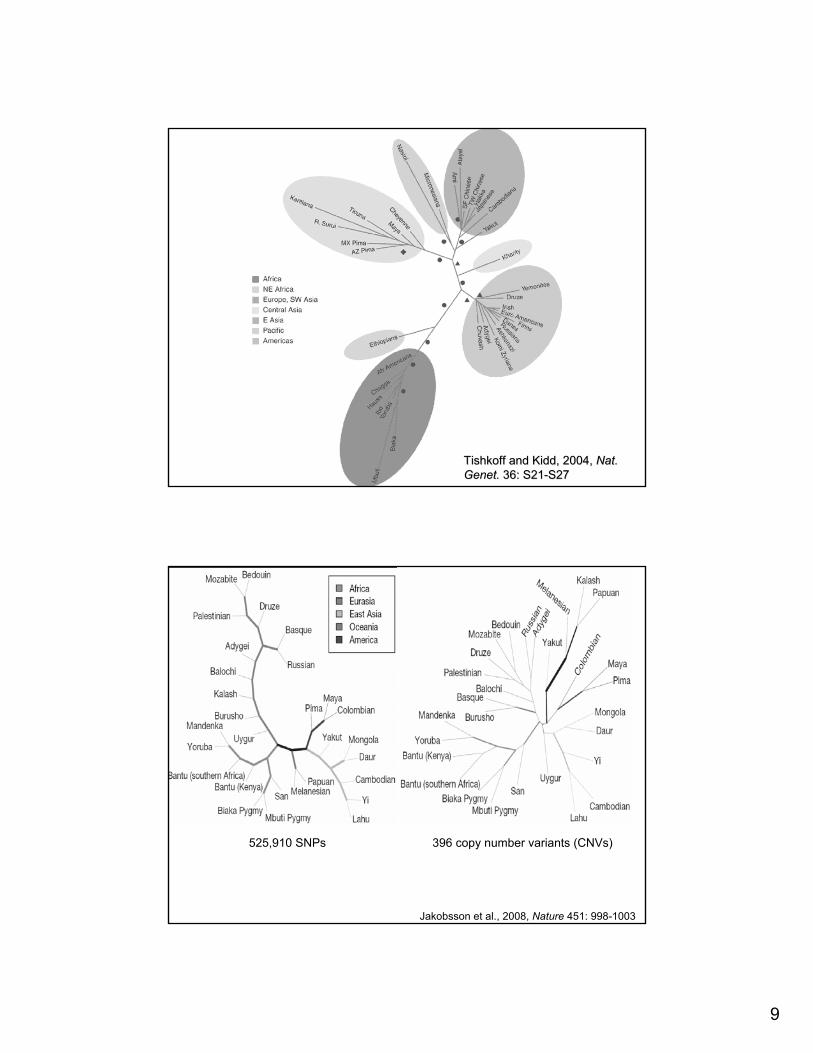
Tishkoff and Kidd, 2004, Tishkoff and Kidd, 2004, Nat. Nat. Genet. Genet. 36: S2136: S21--S27S27
525,910 SNPs 396 copy number variants (CNVs)
Jakobsson et al., 2008, Nature 451: 998-1003
10
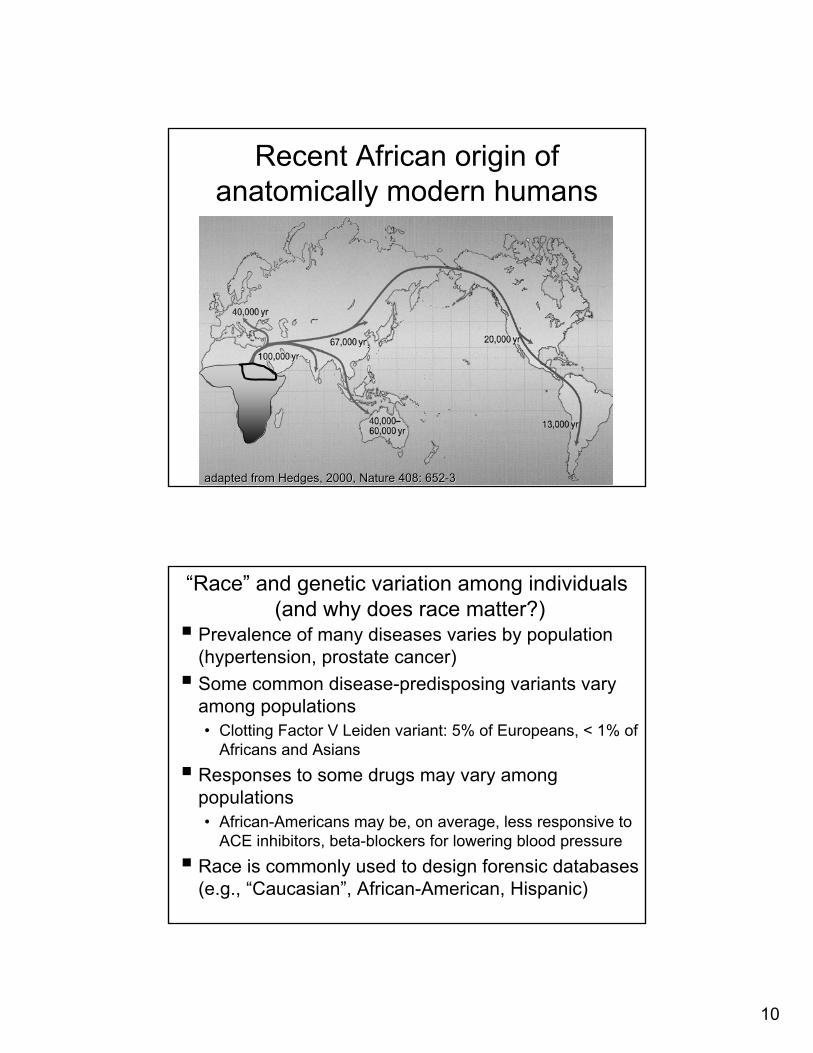
Recent African origin of Recent African origin of anatomically modern humansanatomically modern humans
adapted from Hedges, 2000, Nature 408: 652adapted from Hedges, 2000, Nature 408: 652--33
““RaceRace”” and genetic variation among individualsand genetic variation among individuals(and why does race matter?)(and why does race matter?)
Prevalence of many diseases varies by population Prevalence of many diseases varies by population (hypertension, prostate cancer) (hypertension, prostate cancer) Some common diseaseSome common disease--predisposing variants vary predisposing variants vary among populationsamong populations•• Clotting Factor V Leiden variant: 5% of Europeans, < 1% of Clotting Factor V Leiden variant: 5% of Europeans, < 1% of
Africans and AsiansAfricans and Asians
Responses to some drugs may vary among Responses to some drugs may vary among populationspopulations•• AfricanAfrican--Americans may be, on average, less responsive to Americans may be, on average, less responsive to
ACE inhibitors, betaACE inhibitors, beta--blockers for lowering blood pressureblockers for lowering blood pressure
Race is commonly used to design forensic databases Race is commonly used to design forensic databases (e.g., (e.g., ““CaucasianCaucasian””, African, African--American, Hispanic)American, Hispanic)
11
Recent comments on raceRecent comments on race
“’“’RaceRace’’ is biologically meaninglessis biologically meaningless””---- Schwartz, 2001, Schwartz, 2001, N. Engl. J. Med.N. Engl. J. Med.
““I am a racially profiling doctorI am a racially profiling doctor””---- Satel, May 5, 2002, Satel, May 5, 2002, New York TimesNew York Times
““These [genetic] data also show that any two These [genetic] data also show that any two individuals within a particular population individuals within a particular population are as different genetically as any two are as different genetically as any two people selected from any two populations people selected from any two populations in the world.in the world.””---- American Anthropological Association, 1997American Anthropological Association, 1997
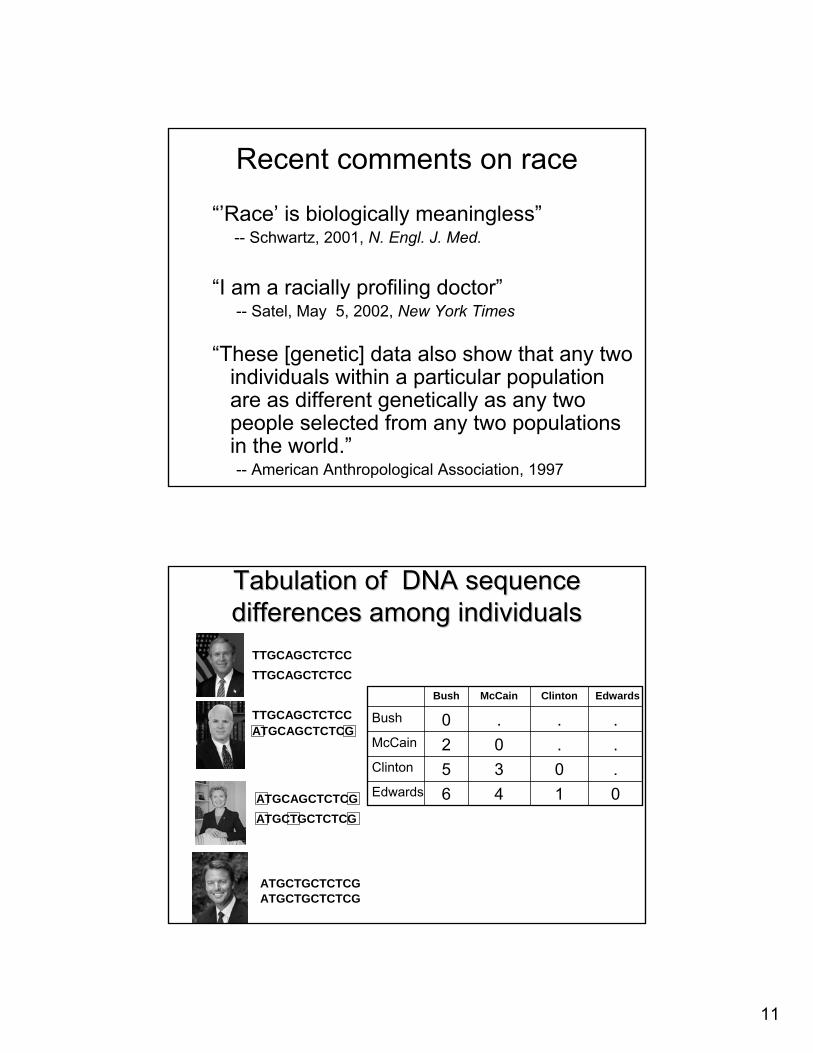
Tabulation of DNA sequence Tabulation of DNA sequence differences among individualsdifferences among individuals
ATGCTGCTCTCG
ATGCTGCTCTCGATGCAGCTCTCG
TTGCAGCTCTCC
TTGCAGCTCTCC
ATGCTGCTCTCG
ATGCAGCTCTCG
TTGCAGCTCTCC
0146Edwards.035Clinton..02McCain...0Bush
EdwardsClintonMcCainBush
12
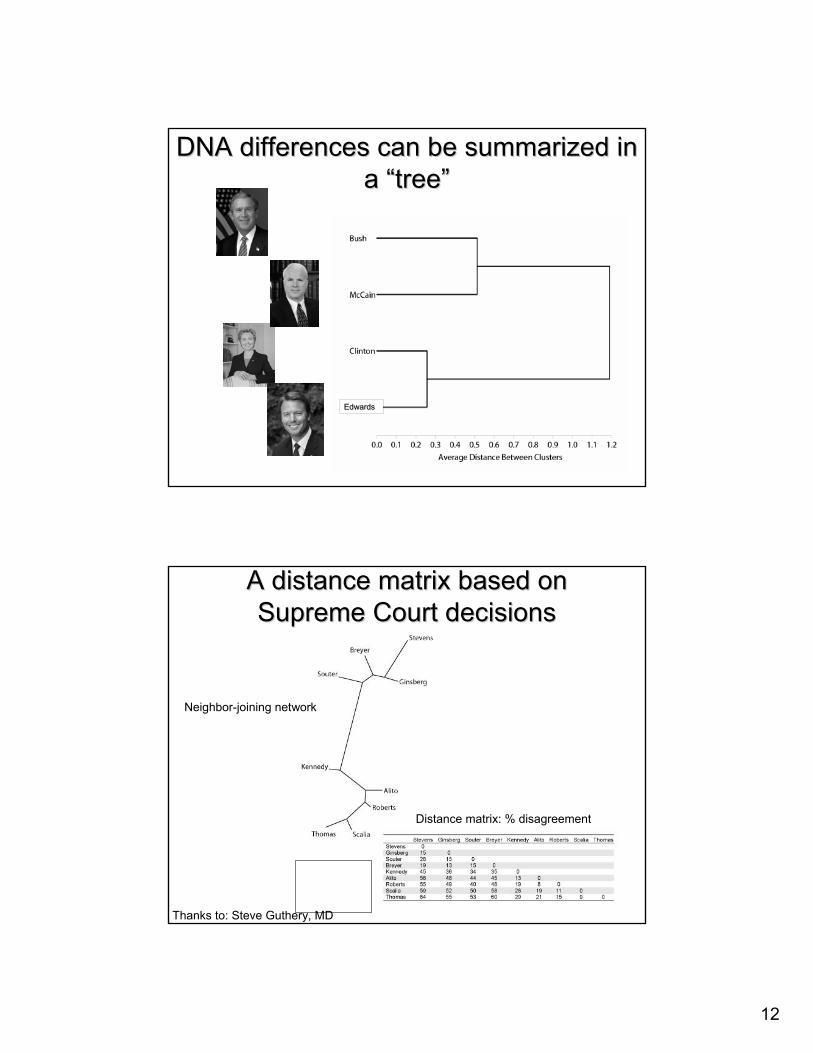
DNA differences can be summarized in DNA differences can be summarized in a a ““treetree””
EdwardsEdwards
A distance matrix based on A distance matrix based on Supreme Court decisionsSupreme Court decisions
Distance matrix: % disagreement
Neighbor-joining network
Thanks to: Steve Guthery, MD
13
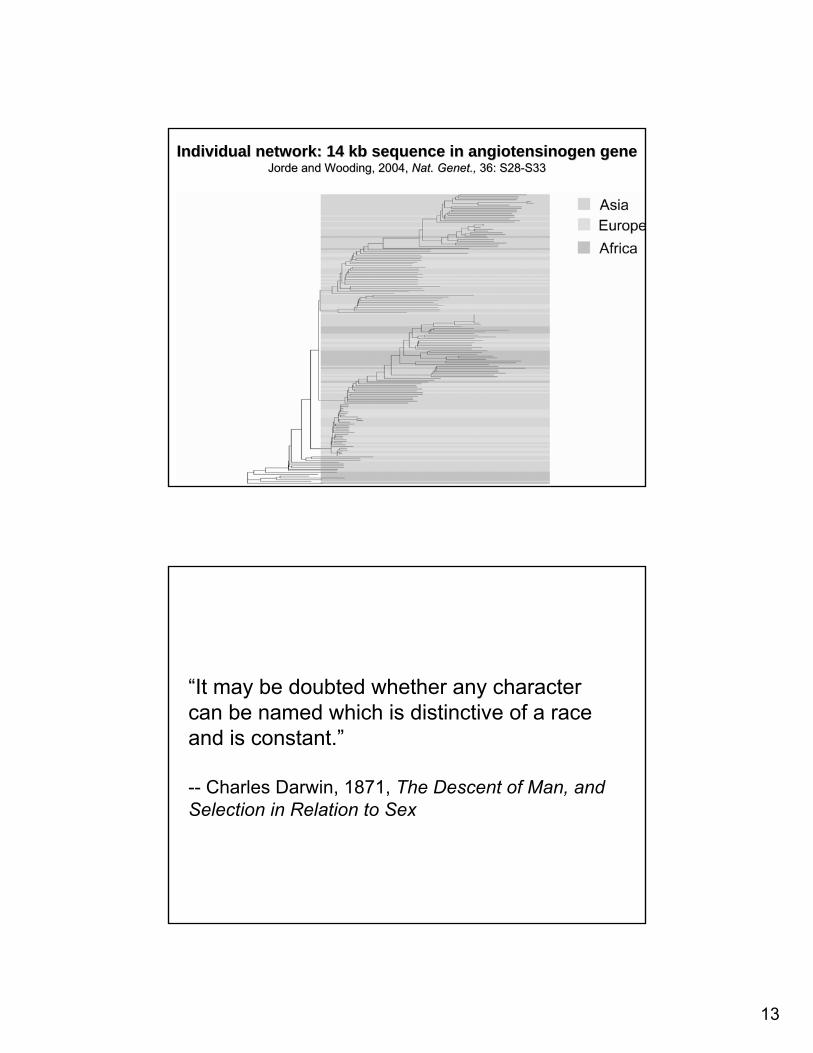
Individual network: 14 kb sequence in Individual network: 14 kb sequence in angiotensinogenangiotensinogen gene gene Jorde and Wooding, 2004, Jorde and Wooding, 2004, Nat. Genet., Nat. Genet., 36: S2836: S28--S33S33
“It may be doubted whether any character can be named which is distinctive of a race and is constant.”
-- Charles Darwin, 1871, The Descent of Man, and Selection in Relation to Sex
14
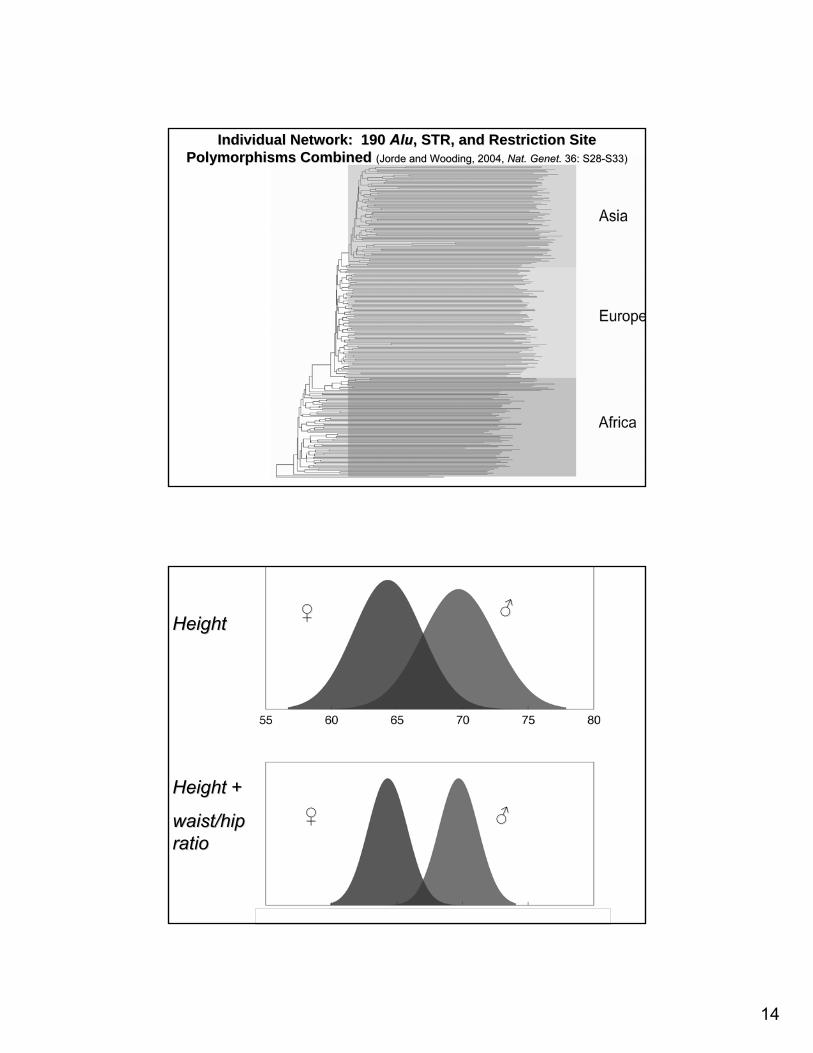
Individual Network: 190 Individual Network: 190 AluAlu, STR, and Restriction Site , STR, and Restriction Site Polymorphisms Combined Polymorphisms Combined (Jorde and Wooding, 2004, (Jorde and Wooding, 2004, Nat. Genet. Nat. Genet. 36: S2836: S28--S33)S33)
♂♂
♂♂
♀♀
♀♀
HeightHeight
Height +Height +
waist/hip waist/hip ratioratio
15
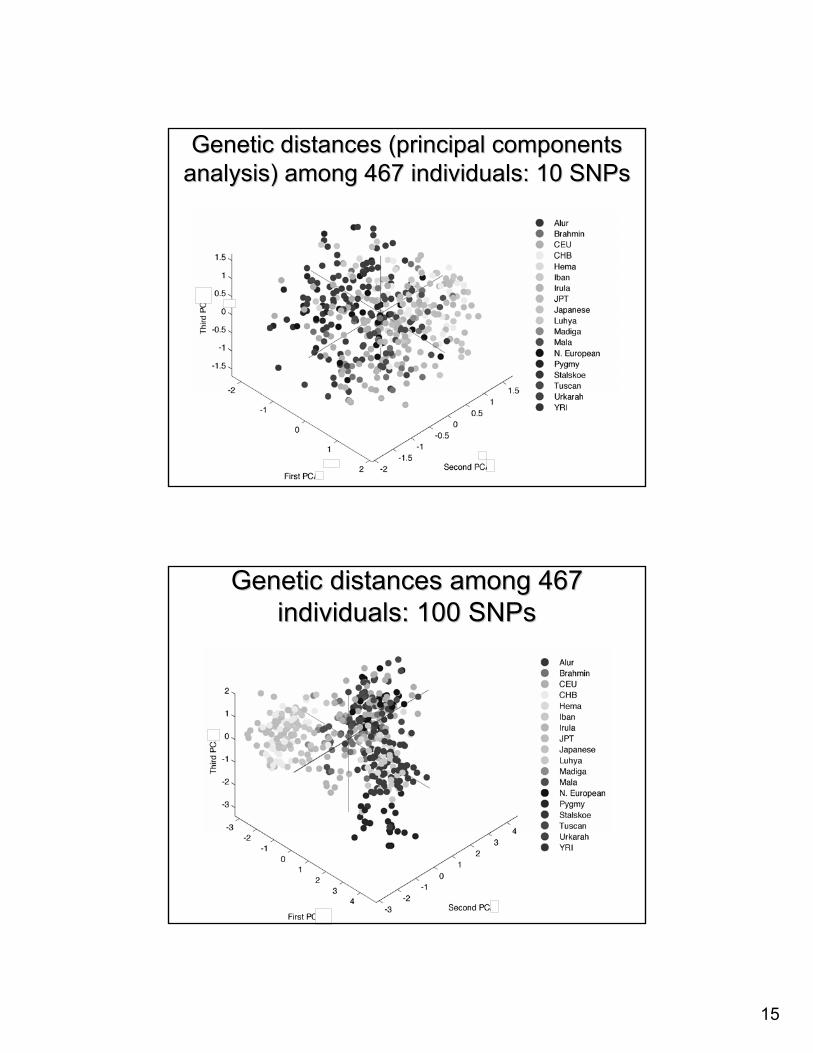
Genetic distances (principal components Genetic distances (principal components analysis) among 467 individuals: 10 analysis) among 467 individuals: 10 SNPsSNPs
Genetic distances among 467 Genetic distances among 467 individuals: 100 individuals: 100 SNPsSNPs
16
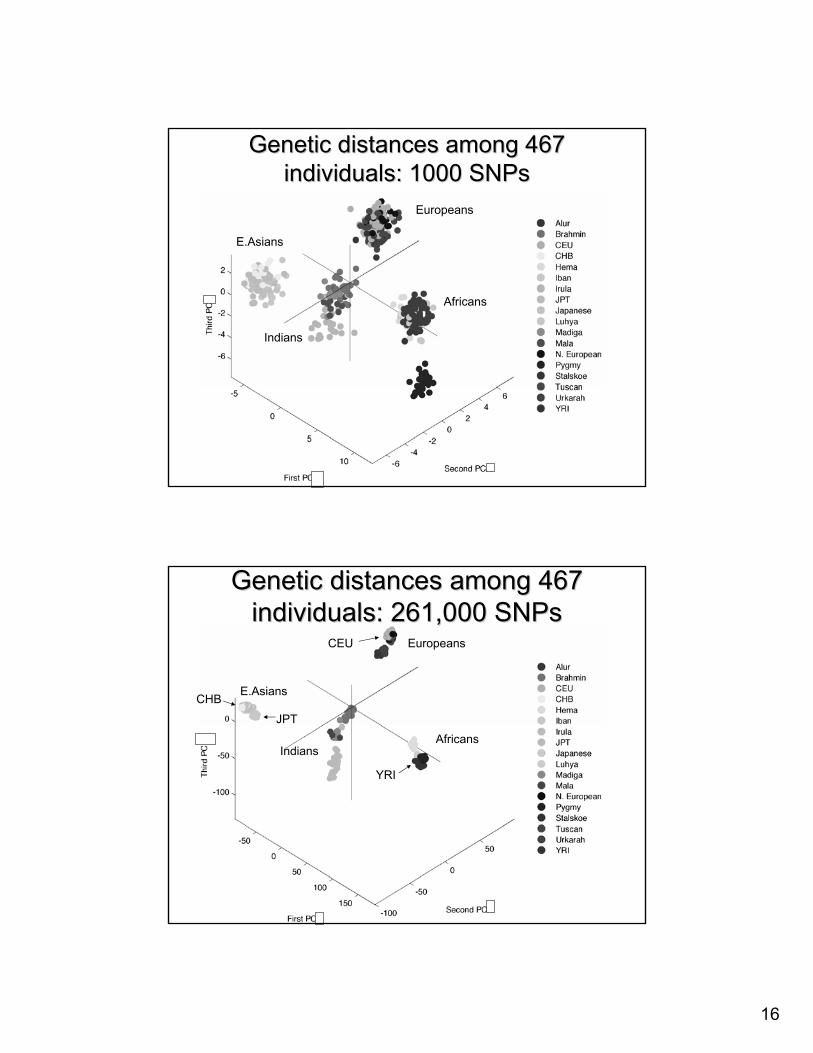
Genetic distances among 467 Genetic distances among 467 individuals: 1000 individuals: 1000 SNPsSNPs
Africans
Europeans
E.Asians
Indians
Genetic distances among 467 Genetic distances among 467 individuals: 261,000 individuals: 261,000 SNPsSNPs
Africans
Europeans
E.Asians
Indians
CEU
CHB
JPT
YRI
17
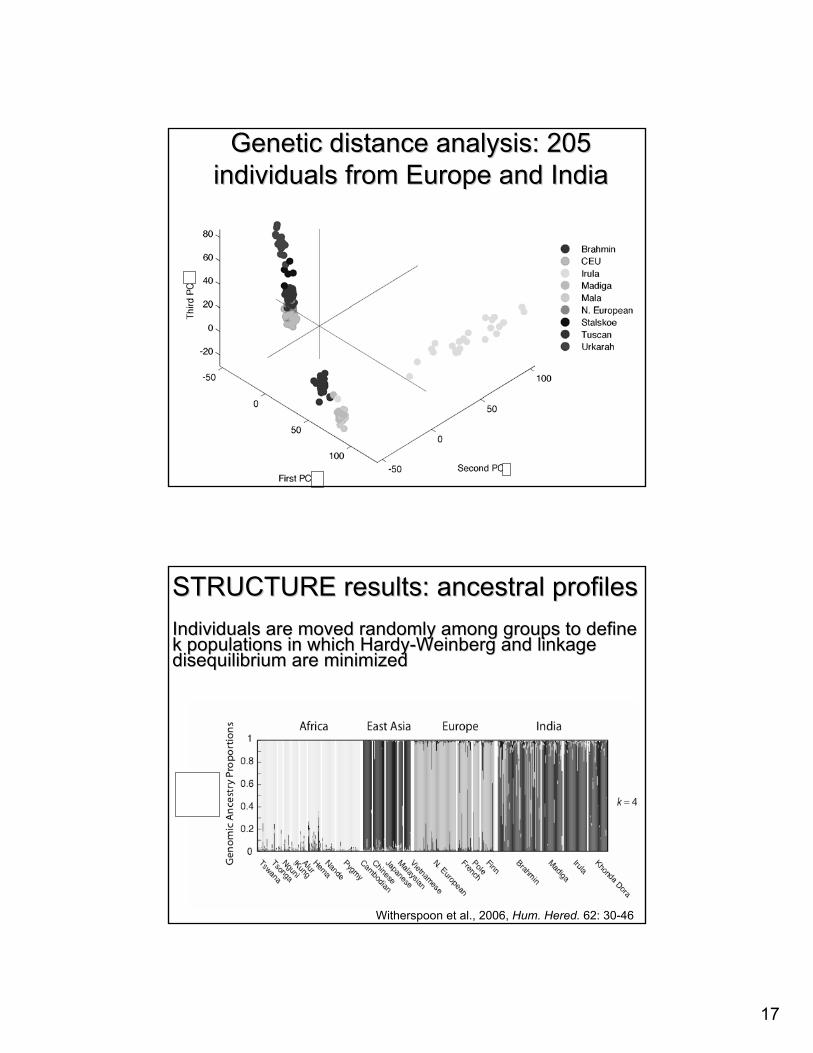
Genetic distance analysis: 205 Genetic distance analysis: 205 individuals from Europe and Indiaindividuals from Europe and India
STRUCTURE results: STRUCTURE results: ancestralancestral profilesprofilesIndividuals are moved randomly among groups to define Individuals are moved randomly among groups to define k populations in which Hardyk populations in which Hardy--Weinberg and linkage Weinberg and linkage disequilibrium are minimizeddisequilibrium are minimized
Witherspoon et al., 2006, Hum. Hered. 62: 30-46
18
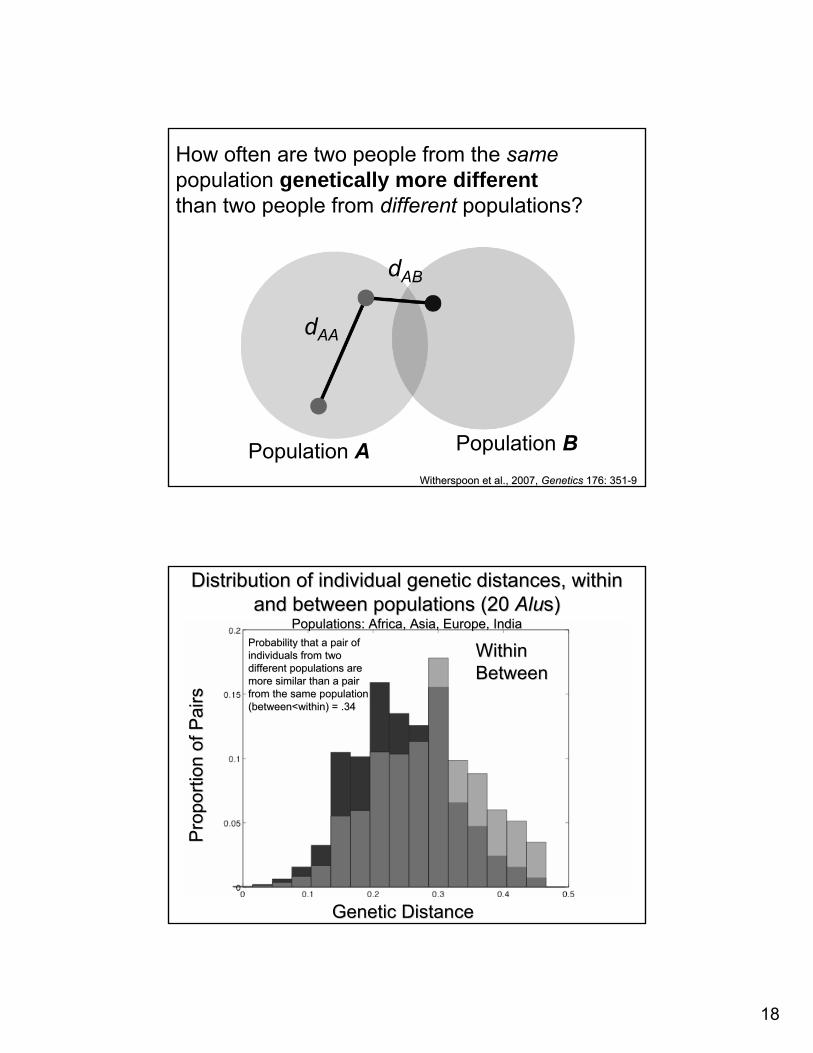
Population A Population B
dAA
dAB
How often are two people from the samepopulation genetically more differentthan two people from different populations?
Witherspoon et al., 2007, Witherspoon et al., 2007, Genetics Genetics 176: 351176: 351--99
Distribution of individual genetic distances, within Distribution of individual genetic distances, within and between populations (20 and between populations (20 AluAlus)s)
Populations: Africa, Asia, Europe, IndiaPopulations: Africa, Asia, Europe, India
Genetic DistanceGenetic Distance
Pro
porti
on o
f Pai
rsP
ropo
rtion
of P
airs
WithinWithinBetweenBetween
Probability that a pair of Probability that a pair of individuals from two individuals from two different populations are different populations are more similar than a pair more similar than a pair from the same population from the same population (between<within) = .34(between<within) = .34
19
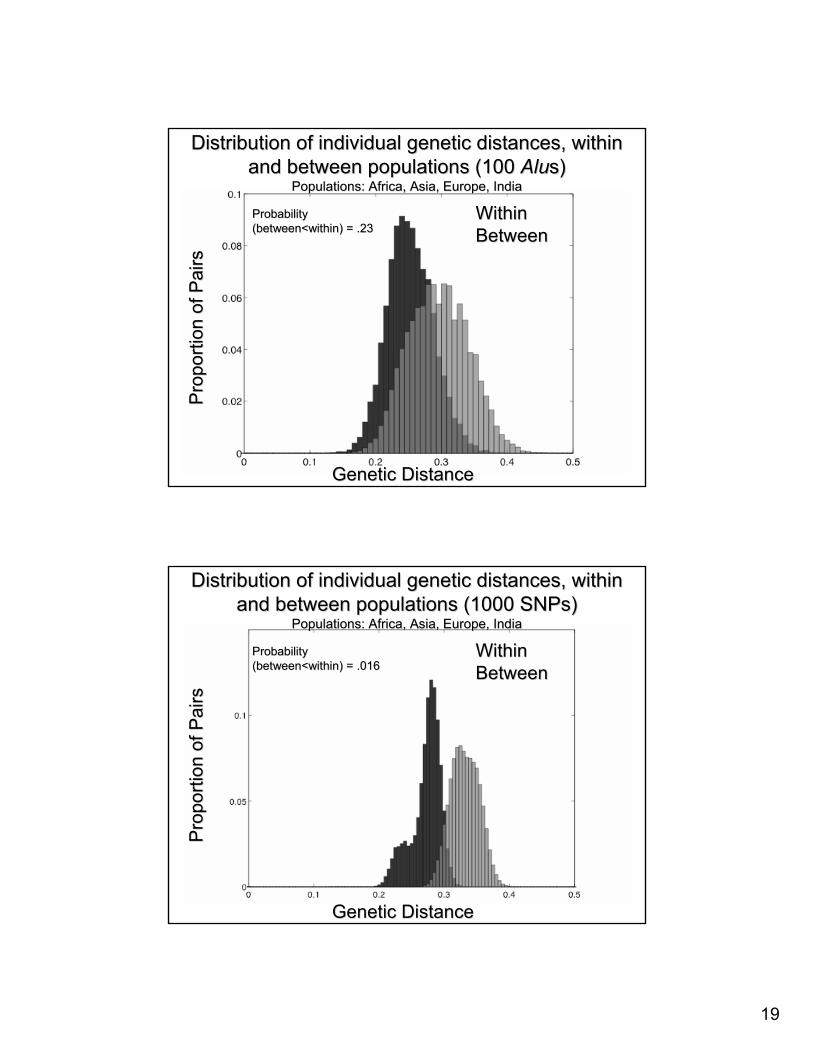
Distribution of individual genetic distances, within Distribution of individual genetic distances, within and between populations (100 and between populations (100 AluAlus)s)
Populations: Africa, Asia, Europe, IndiaPopulations: Africa, Asia, Europe, India
Genetic DistanceGenetic Distance
Pro
porti
on o
f Pai
rsP
ropo
rtion
of P
airs
WithinWithinBetweenBetween
Probability Probability (between<within) = .23(between<within) = .23
Distribution of individual genetic distances, within Distribution of individual genetic distances, within and between populations (1000 SNPs)and between populations (1000 SNPs)
Populations: Africa, Asia, Europe, IndiaPopulations: Africa, Asia, Europe, India
Genetic DistanceGenetic Distance
Pro
porti
on o
f Pai
rsP
ropo
rtion
of P
airs
WithinWithinBetweenBetween
Probability Probability (between<within) = .016(between<within) = .016
20
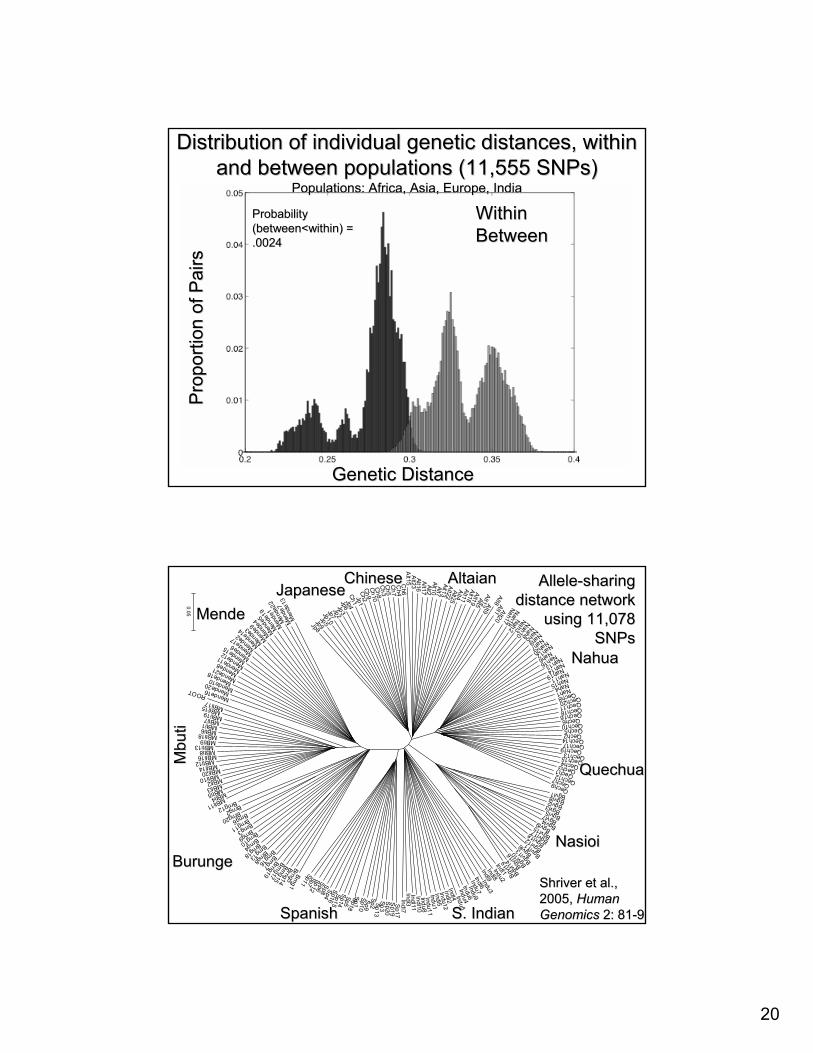
Distribution of individual genetic distances, within Distribution of individual genetic distances, within and between populations (11,555 SNPs)and between populations (11,555 SNPs)
Populations: Africa, Asia, Europe, IndiaPopulations: Africa, Asia, Europe, India
Genetic DistanceGenetic Distance
Pro
porti
on o
f Pai
rsP
ropo
rtion
of P
airs
WithinWithinBetweenBetween
Probability Probability (between<within) = (between<within) = .0024.0024
Jp8Jp9
Jp5Jp10
Jp7Jp2
Jp3Jp6Jp4
Ch1Jp1
Ch2Ch9C
h10C
h8C
h3C
h5C
h7C
h4C
h 6A
lt 15A
lt23Alt16A
lt17Alt2
Alt10Alt7
Alt13
Alt22Alt25Alt4Alt11Alt18Alt19
Alt5
Alt12 Alt9
Alt8 Alt1 Alt20
Nah17
Nah18 Nah2
Nah3
Nah10
Nah8
Nah5
Nah9 Nah7Nah20
Nah12 Nah6 Nah16Nah13 Nah14 Nah19 Nah11 Nah15 Nah4 Nah1 Qech8 Qech20 Qech11 Qech18 Qech16 Qech6 Qech10
Qech5Qech2
Qech14Qech17Qech19
Qech13Qech15
Qech4Qech3Qech1
Qech12Qech7
Qech9
Bgvl1Bgvl8Bgvl2Bgvl3Bgvl5
Bgvl7
Bgvl4Bgvl9
Bgvl15
Bgvl17
Bgvl18
Bgvl12
Bgvl11Bgv
l6
Bgvl13
Bgvl10
Bgvl16
Bgvl1
4Bg
vl19 Indl1 Indu2
Indl8
Indl9 Indu3
Indl6 Indu7
Indu9
Indu6 Indu4
Indu5
Indl4 Indl2 Indu12 Indl5 Indu1 Indu11 Indu8 Indl10
Indl11 I nd l3
Indl7 S
p17 S
p19 S
p20 Sp3 Sp13
Sp2 S
p9 Sp10 S
p1 Sp18
Sp5 Sp14 Sp15
Sp16 Sp4
Sp8 Sp6
Sp12 Sp7
Sp11 Brng1
Brng5 Brng14
Brng15 Brng17 Brng19
Brng7 Brng16
Brng8
Brng13
Brng18
Brng4
Brng10
Brng9
Brng3
Brng11
Brng6 Brng20
Brng2 Brng12
MBti11
MBti4 MBti5 MBti3 MBti2
MBti10 MBti20 MBti14 MBti12
MBti16 MBti8 MBti13
MBti9 MBti18 MBti6 MBti1 MBti7 MBti19 MBti15 MBti17
ROOT Mende16 Mende20
Mende10 Mende18 Mende21 Mende8
Mende11 Mende12
Mende15
Mende6
Mend
e17
Men
de2
Men
de14
Mend
e3
Men
de9
Men
de4
Men
de5
Men
de19
Men
de1
Men
de22
Men
de7
Men
de130.05
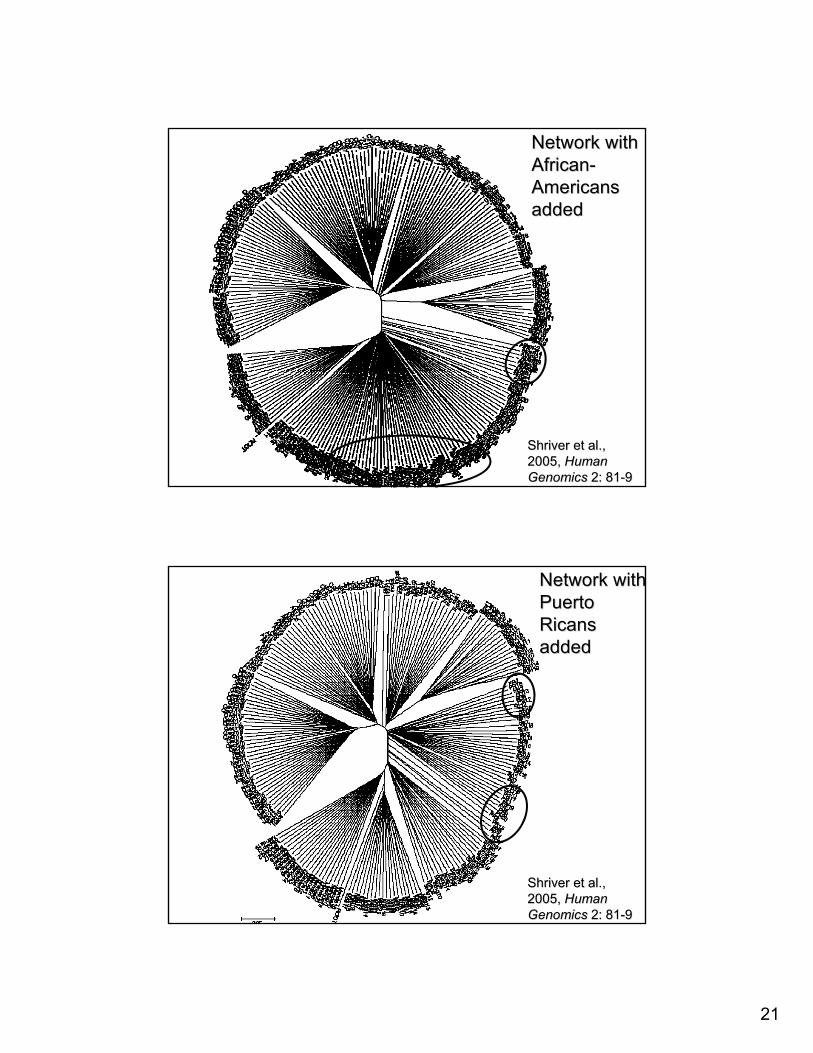
AlleleAllele--sharing sharing distance network distance network
using 11,078 using 11,078 SNPsSNPs
Shriver et al., Shriver et al., 2005, 2005, Human Human Genomics Genomics 2: 812: 81--99
MendeMende
Mbu
tiM
buti
BurungeBurunge
SpanishSpanish S. IndianS. Indian
NasioiNasioi
QuechuaQuechua
NahuaNahua
AltaianAltaianChineseChineseJapaneseJapanese
21
Network with Network with AfricanAfrican--Americans Americans addedadded
Shriver et al., Shriver et al., 2005, 2005, Human Human Genomics Genomics 2: 812: 81--99
Network withNetwork with Puerto Puerto Ricans Ricans addedadded
Shriver et al., Shriver et al., 2005, 2005, Human Human Genomics Genomics 2: 812: 81--99
22
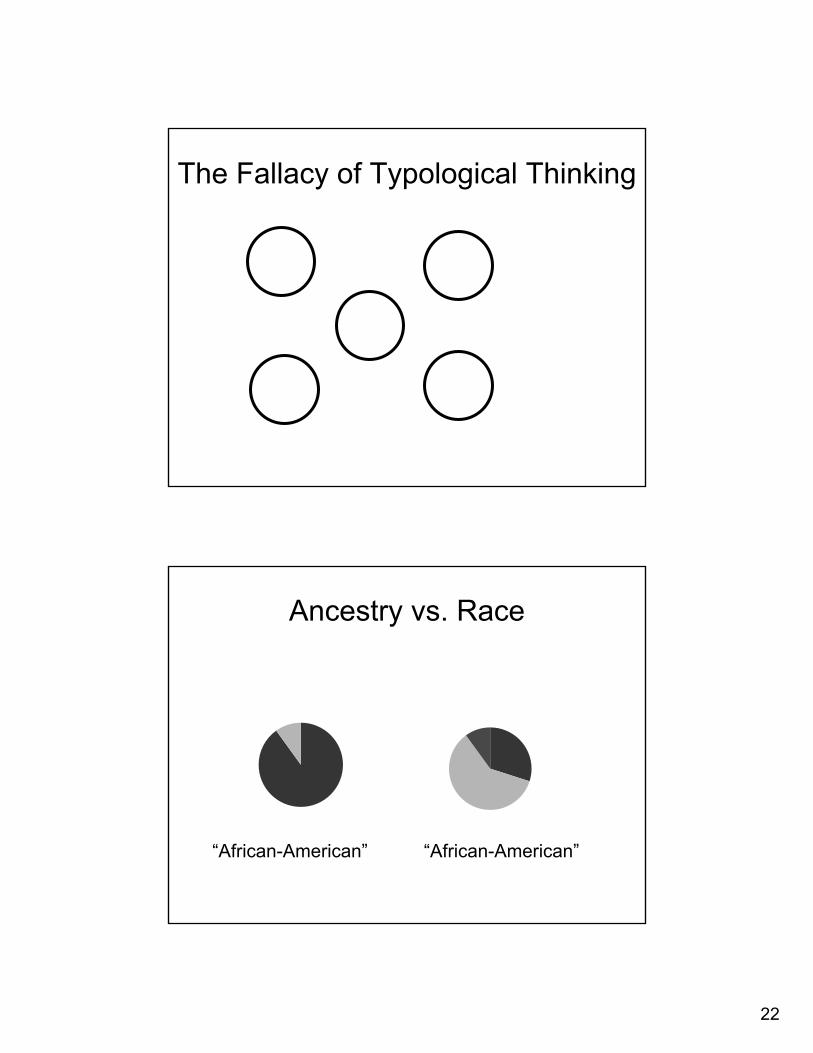
The Fallacy of Typological ThinkingThe Fallacy of Typological Thinking
Ancestry vs. RaceAncestry vs. Race
African
European
African
European
Native American
“African-American” “African-American”
23
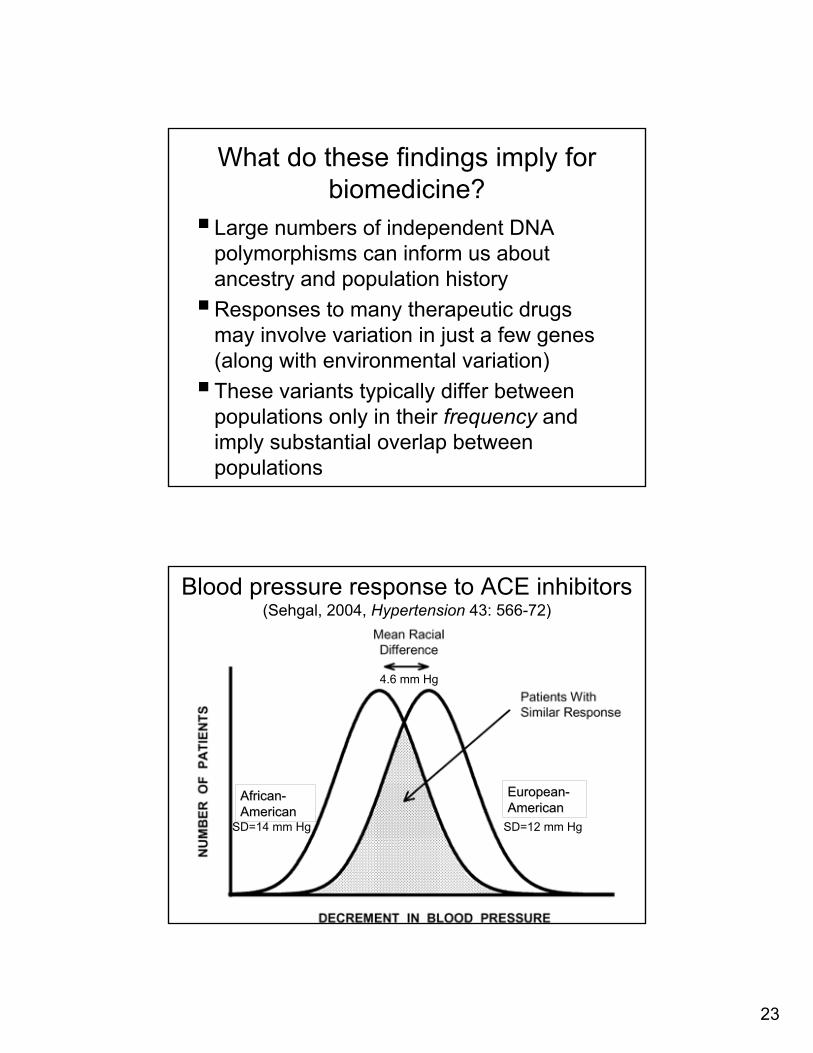
What do these findings imply for What do these findings imply for biomedicine?biomedicine?
Large numbers of independent DNA Large numbers of independent DNA polymorphisms can inform us about polymorphisms can inform us about ancestry and population historyancestry and population historyResponses to many therapeutic drugs Responses to many therapeutic drugs may involve variation in just a few genes may involve variation in just a few genes (along with environmental variation)(along with environmental variation)These variants typically differ between These variants typically differ between populations only in their populations only in their frequency frequency and and imply substantial overlap between imply substantial overlap between populationspopulations
Blood pressure response to ACE inhibitorsBlood pressure response to ACE inhibitors((SehgalSehgal, 2004, , 2004, Hypertension Hypertension 43: 56643: 566--72)72)
4.6 mm Hg4.6 mm Hg
SD=14 mm HgSD=14 mm Hg SD=12 mm HgSD=12 mm Hg
AfricanAfrican--AmericanAmerican
EuropeanEuropean--AmericanAmerican
24
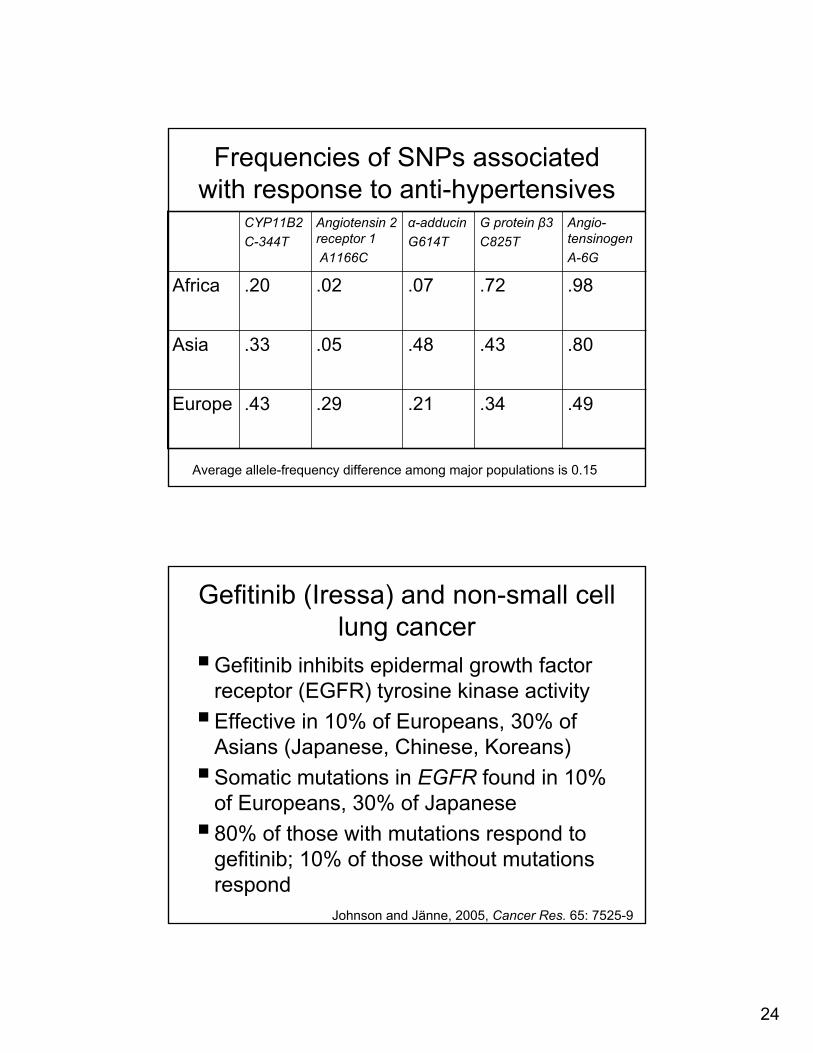
Frequencies of Frequencies of SNPsSNPs associated associated with response to antiwith response to anti--hypertensiveshypertensives
Average allele-frequency difference among major populations is 0.15
EuropeEurope
AsiaAsia
AfricaAfrica
.43.43
.33.33
.20.20
CYP11B2CYP11B2CC--344344TT
.29.29
.05.05
.02.02
AngiotensinAngiotensin 2 2 receptor 1receptor 1A1166A1166CC
.21.21
.48.48
.07.07
αα--adducinadducinG614G614TT
.34.34
.43.43
.72.72
G protein G protein ββ33C825C825TT
.49.49
.80.80
.98.98
AngioAngio--tensinogentensinogenAA--6G6G
GefitinibGefitinib ((IressaIressa) and non) and non--small cell small cell lung cancerlung cancer
GefitinibGefitinib inhibits epidermal growth factor inhibits epidermal growth factor receptor (EGFR) tyrosine receptor (EGFR) tyrosine kinasekinase activityactivityEffective in 10% of Europeans, 30% of Effective in 10% of Europeans, 30% of Asians (Japanese, Chinese, Koreans)Asians (Japanese, Chinese, Koreans)Somatic mutations in Somatic mutations in EGFREGFR found in 10% found in 10% of Europeans, 30% of Japaneseof Europeans, 30% of Japanese80% of those with mutations respond to 80% of those with mutations respond to gefitinibgefitinib; 10% of those without mutations ; 10% of those without mutations respondrespond
Johnson and Johnson and JJäännenne, 2005, , 2005, Cancer Res.Cancer Res. 65: 752565: 7525--99
25
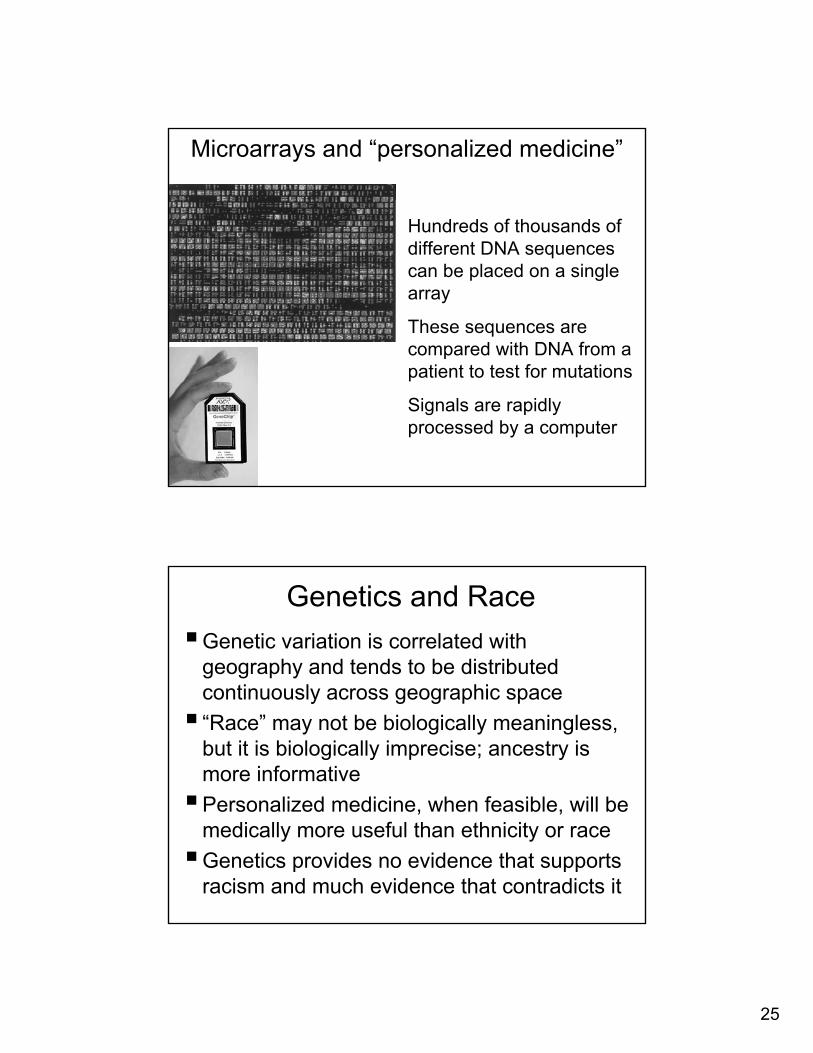
MicroarraysMicroarrays and and ““personalized medicinepersonalized medicine””
Hundreds of thousands of different DNA sequences can be placed on a single array
These sequences are compared with DNA from a patient to test for mutations
Signals are rapidly processed by a computer
Genetics and RaceGenetics and RaceGenetic variation is correlated with Genetic variation is correlated with geography and tends to be distributed geography and tends to be distributed continuously across geographic spacecontinuously across geographic space““RaceRace”” may not be biologically meaningless, may not be biologically meaningless, but it is biologically imprecise; ancestry is but it is biologically imprecise; ancestry is more informativemore informativePersonalized medicine, when feasible, will be Personalized medicine, when feasible, will be medically more useful than ethnicity or racemedically more useful than ethnicity or raceGenetics provides no evidence that supports Genetics provides no evidence that supports racism and much evidence that contradicts itracism and much evidence that contradicts it
26
SNPsSNPs, , haplotypeshaplotypes, linkage , linkage disequilibrium, and gene mappingdisequilibrium, and gene mapping
A SNP with minor allele frequency (MAF) > 1% A SNP with minor allele frequency (MAF) > 1% is found, on average, at 1/300 is found, on average, at 1/300 bpbp (roughly 10 (roughly 10 million total)million total)
A A ““commoncommon”” SNP (MAF > 5%) is found at about SNP (MAF > 5%) is found at about 1/600 1/600 bpbp (roughly 5 million total)(roughly 5 million total)
SNPsSNPs have low mutation rates and can be typed have low mutation rates and can be typed by automated methodsby automated methods
WholeWhole--genome association: the genome association: the cost problemcost problem
A wholeA whole--genome association study seeks genome association study seeks any SNP allele that is found with elevated any SNP allele that is found with elevated frequency in disease casesfrequency in disease casesAt $.001 per SNP, genotyping 5 million At $.001 per SNP, genotyping 5 million SNPsSNPs costs $5,000 per personcosts $5,000 per personA study involving 1,000 cases and 1,000 A study involving 1,000 cases and 1,000 controls would cost $10,000,000controls would cost $10,000,000Will SNP association reveal disease Will SNP association reveal disease genes, and do we need to test all of these genes, and do we need to test all of these SNPsSNPs??
27
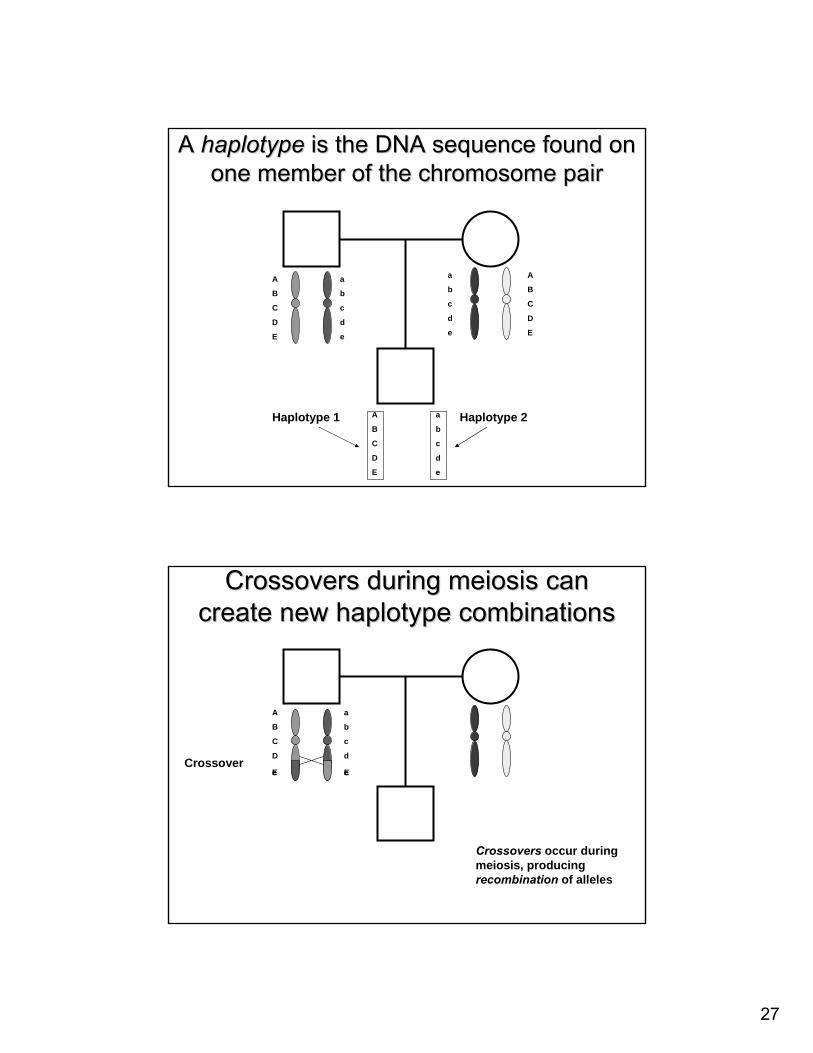
A A haplotypehaplotype is the DNA sequence found on is the DNA sequence found on one member of the chromosome pairone member of the chromosome pair
A
B
C
D
E
a
b
c
d
e
A
B
C
D
E
a
b
c
d
e
A
B
C
D
E
a
b
c
d
e
Haplotype 1 Haplotype 2
Crossovers during meiosis can Crossovers during meiosis can create new haplotype combinationscreate new haplotype combinations
A
B
C
D
a
b
c
d
E ee ECrossover
Crossovers occur during meiosis, producing recombination of alleles
28
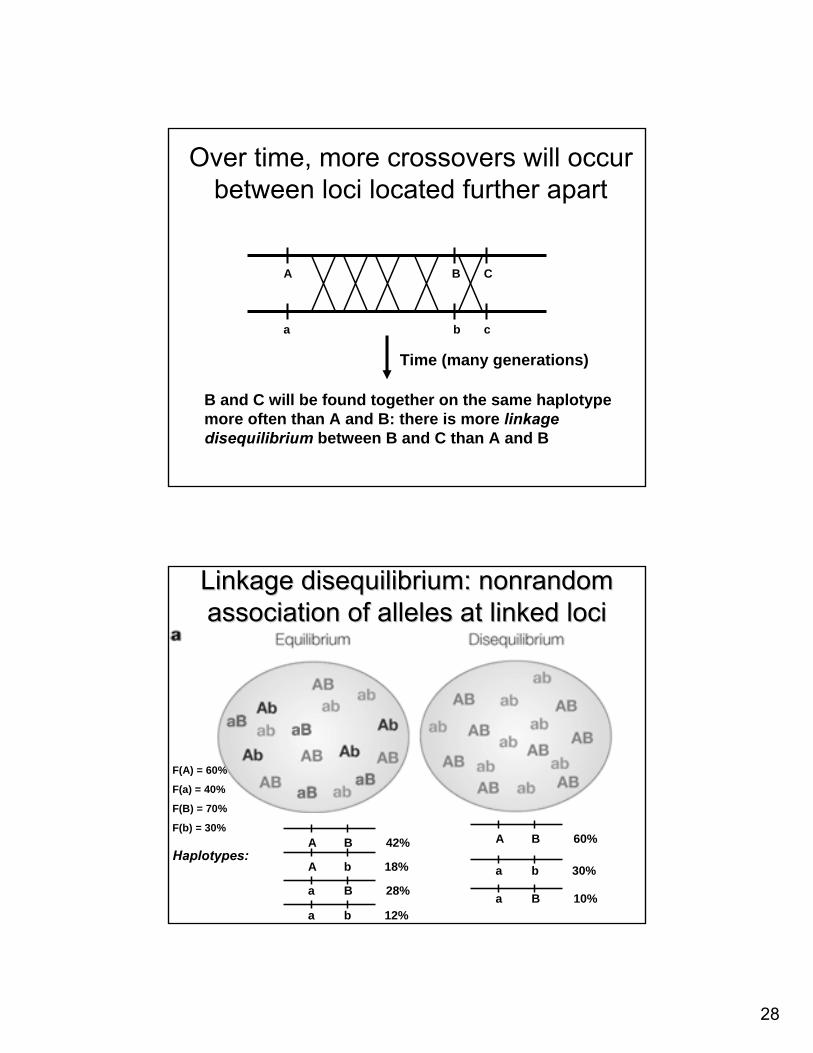
Over time, more crossovers will occur Over time, more crossovers will occur between loci located further apartbetween loci located further apart
A B CA B C
a b ca b c
B and C will be found together on the same haplotype B and C will be found together on the same haplotype more often than A and B: there is more more often than A and B: there is more linkage linkage disequilibriumdisequilibrium between B and C than A and Bbetween B and C than A and B
Time (many generations)Time (many generations)
Linkage disequilibrium: nonrandom Linkage disequilibrium: nonrandom association of alleles at linked lociassociation of alleles at linked loci
A b 18%
b 12%
B 28%a
a
A B 42%Haplotypes:
F(A) = 60%
F(a) = 40%
F(B) = 70%
F(b) = 30%A B 60%
b 30%a
B 10%a
29
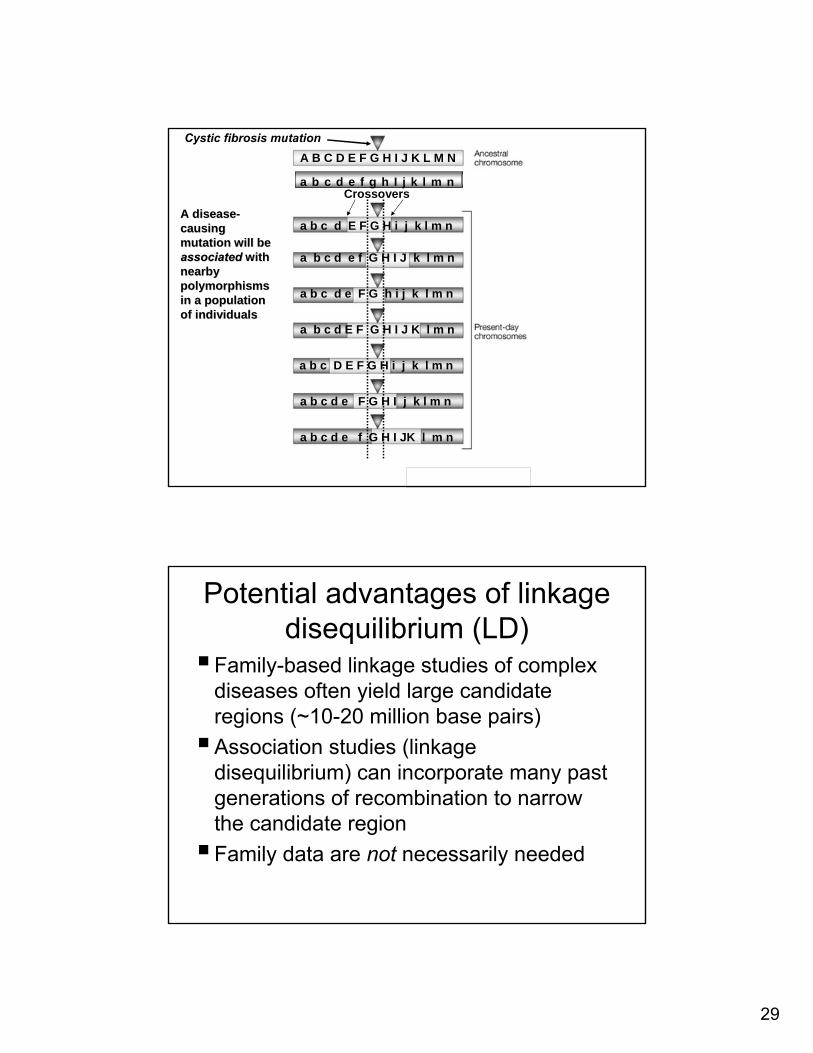
A B C D E F G H I J K L M N
a b c d E F G H i j k l m n
a b c d e f G H I J k l m n
a b c d e F G h i j k l m n
a b c d E F G H I J K l m n
a b c D E F G H i j k l m n
a b c d e F G H I j k l m n
a b c d e f G H I JK l m n
a b c d e f g h I j k l m nCrossovers
Cystic fibrosis mutation
A diseaseA disease--causing causing mutation will be mutation will be associatedassociated with with nearby nearby polymorphisms polymorphisms in a population in a population of individualsof individuals
Potential advantages of linkage Potential advantages of linkage disequilibrium (LD)disequilibrium (LD)
FamilyFamily--based linkage studies of complex based linkage studies of complex diseases often yield large candidate diseases often yield large candidate regions (~10regions (~10--20 million base pairs)20 million base pairs)Association studies (linkage Association studies (linkage disequilibrium) can incorporate many past disequilibrium) can incorporate many past generations of recombination to narrow generations of recombination to narrow the candidate regionthe candidate regionFamily data are Family data are not not necessarily needednecessarily needed
30
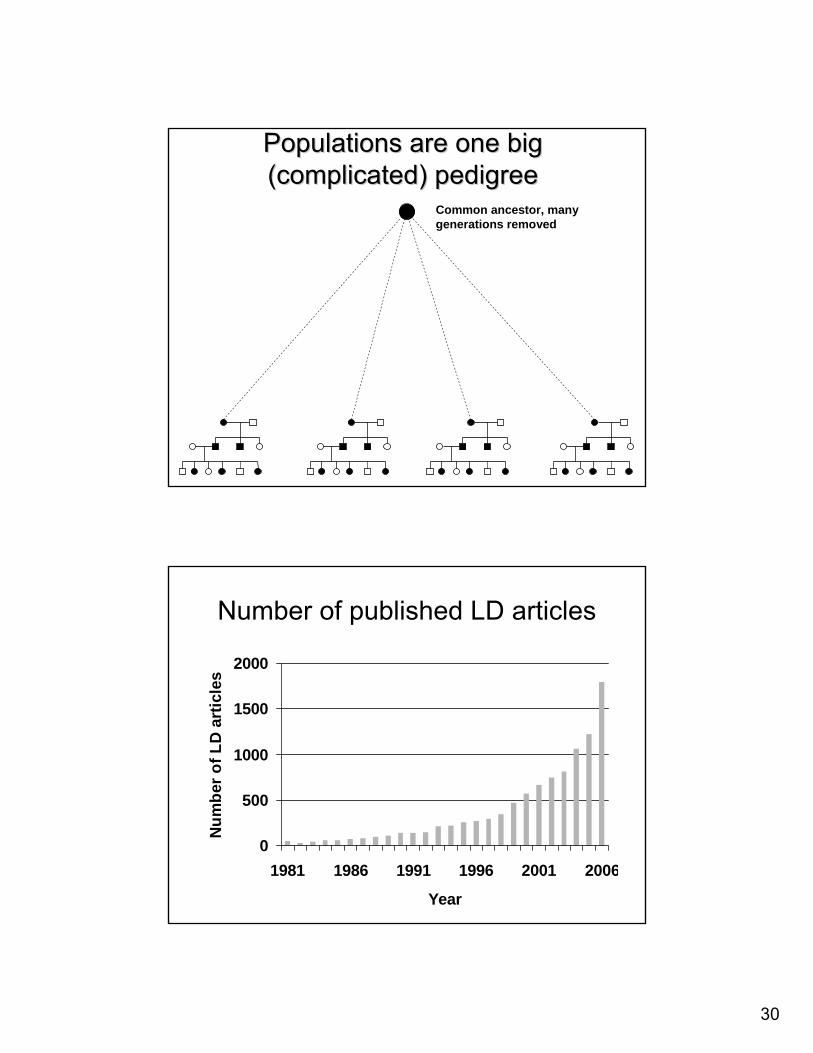
Populations are one big Populations are one big (complicated) pedigree(complicated) pedigree
Common ancestor, many generations removed
Number of published LD articles Number of published LD articles
0
500
1000
1500
2000
1981 1986 1991 1996 2001 2006
Year
Num
ber o
f LD
art
icle
s
31
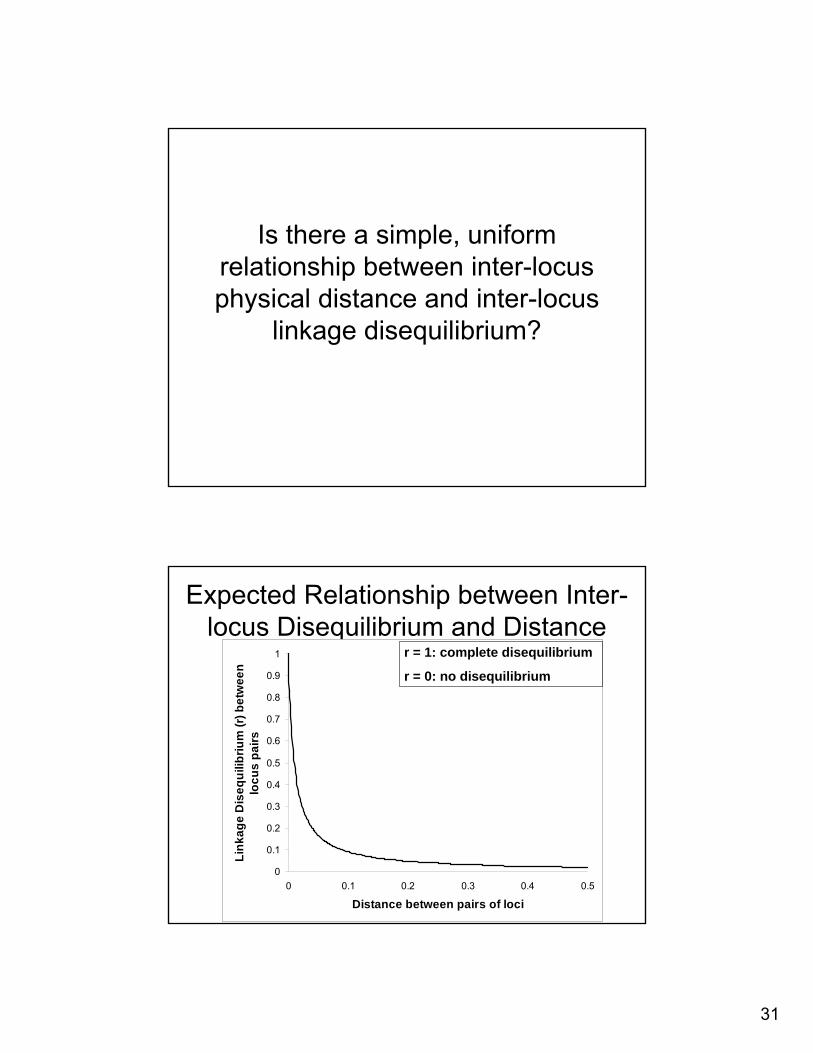
Is there a simple, uniform Is there a simple, uniform relationship between interrelationship between inter--locus locus physical distance and interphysical distance and inter--locus locus
linkage disequilibrium?linkage disequilibrium?
Expected Relationship between InterExpected Relationship between Inter--locus Disequilibrium and Distancelocus Disequilibrium and Distance
0
0.1
0.2
0.3
0.4
0.5
0.6
0.7
0.8
0.9
1
0 0.1 0.2 0.3 0.4 0.5
Distance between pairs of loci
Lin
kage
Dis
equi
libriu
m (r
) bet
wee
n lo
cus
pairs
r = 1: complete disequilibrium
r = 0: no disequilibrium
32
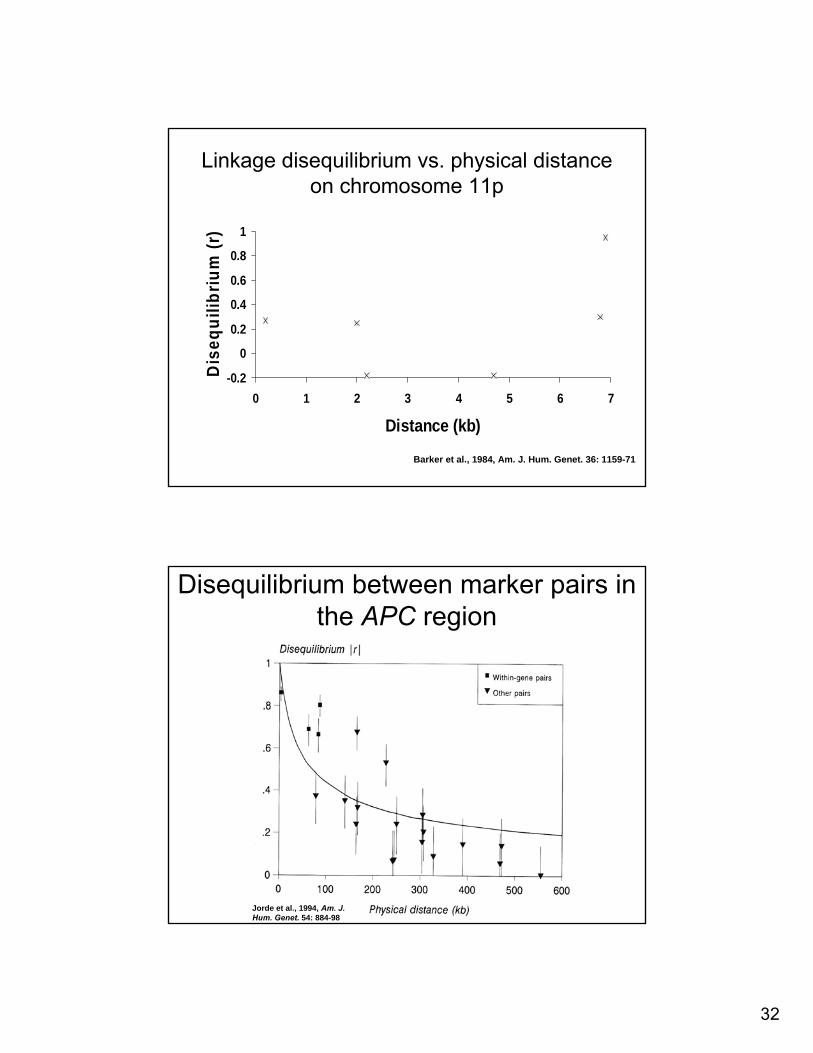
Linkage disequilibrium vs. physical distance Linkage disequilibrium vs. physical distance on chromosome 11pon chromosome 11p
-0.2
0
0.2
0.4
0.6
0.8
1
0 1 2 3 4 5 6 7
Distance (kb)
Dis
equi
libriu
m (r
)
Barker et al., 1984, Am. J. Hum. Genet. 36: 1159-71
Disequilibrium between marker pairs in Disequilibrium between marker pairs in the the APCAPC regionregion
Jorde et al., 1994, Am. J. Hum. Genet. 54: 884-98
33
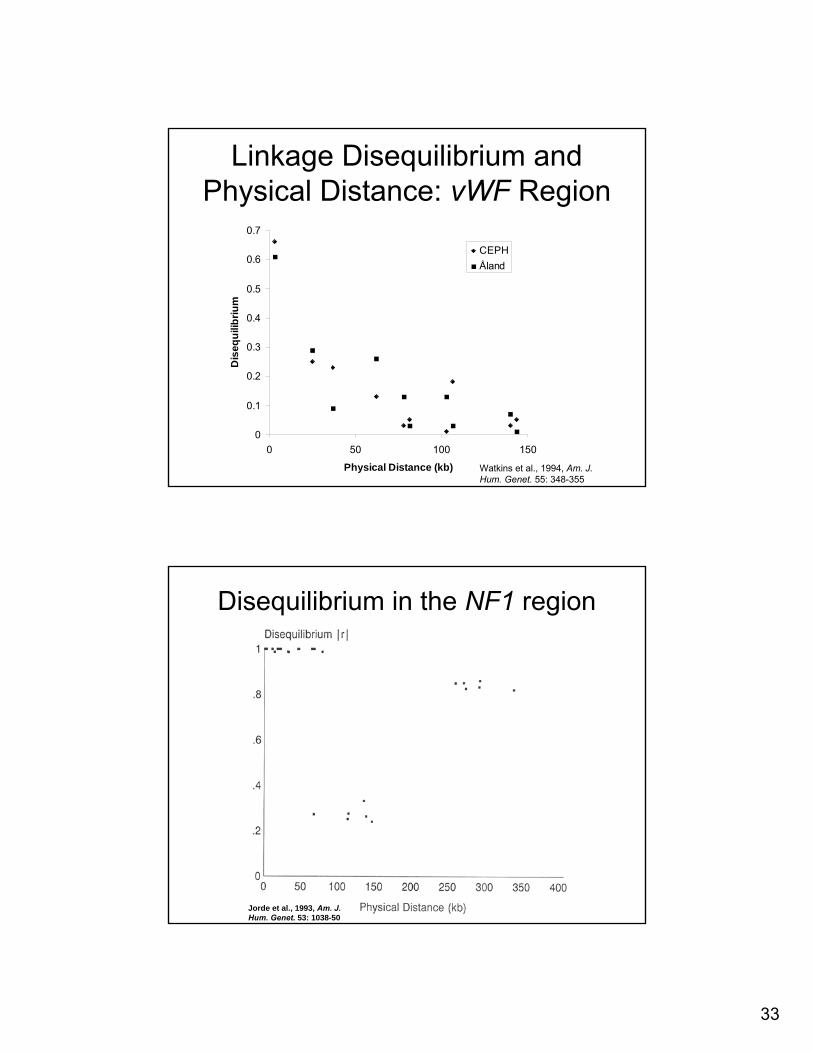
Linkage Disequilibrium and Linkage Disequilibrium and Physical Distance: Physical Distance: vWFvWF Region Region
0
0.1
0.2
0.3
0.4
0.5
0.6
0.7
0 50 100 150
Physical Distance (kb)
Dis
equi
libriu
mCEPHÅland
Watkins et al., 1994, Watkins et al., 1994, Am. J. Am. J. Hum. Genet. Hum. Genet. 55: 34855: 348--355355
Disequilibrium in the Disequilibrium in the NF1NF1 regionregion
Jorde et al., 1993, Am. J. Hum. Genet. 53: 1038-50
34
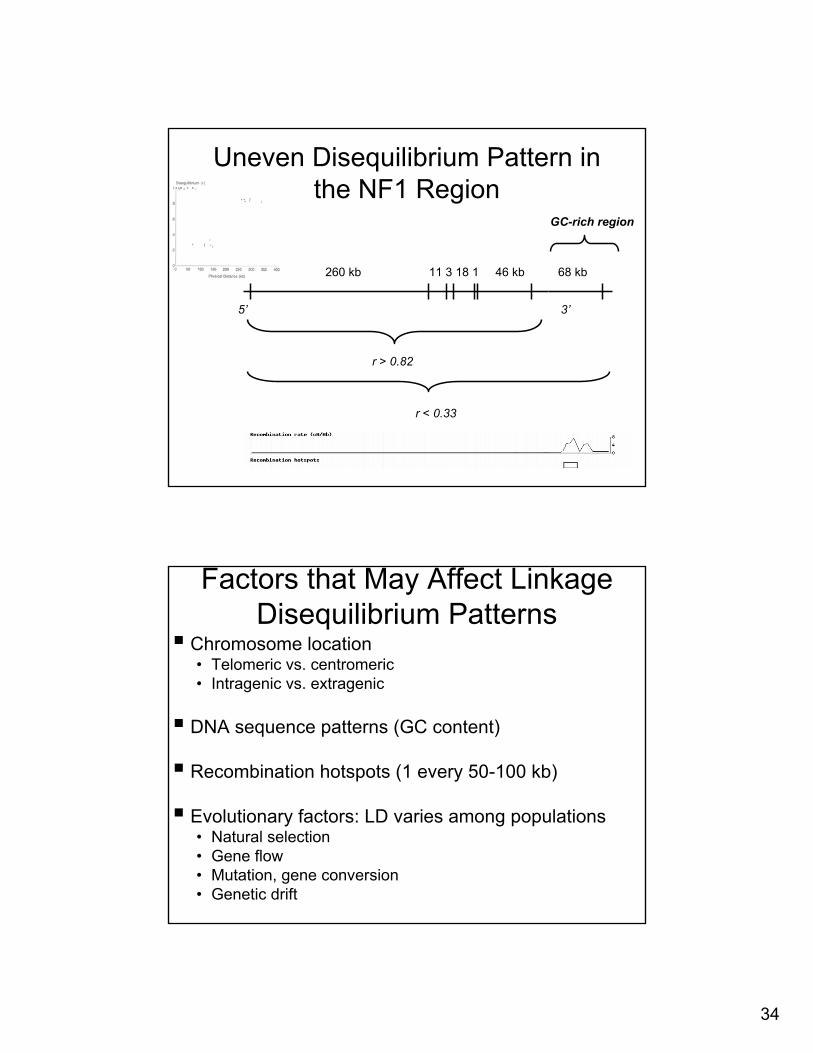
Uneven Disequilibrium Pattern in Uneven Disequilibrium Pattern in the NF1 Regionthe NF1 Region
260 kb260 kb 11 3 18 1 46 kb 68 kb 11 3 18 1 46 kb 68 kb
55’’ 33’’
r > 0.82 r > 0.82
r < 0.33r < 0.33
GCGC--rich regionrich region
Factors that May Affect LinkageFactors that May Affect LinkageDisequilibrium PatternsDisequilibrium Patterns
Chromosome locationChromosome location•• TelomericTelomeric vs. vs. centromericcentromeric•• IntragenicIntragenic vs. vs. extragenicextragenic
DNA sequence patterns (GC content)DNA sequence patterns (GC content)
Recombination hotspots (1 every 50Recombination hotspots (1 every 50--100 kb)100 kb)
Evolutionary factors: LD varies among populationsEvolutionary factors: LD varies among populations•• Natural selectionNatural selection•• Gene flowGene flow•• Mutation, gene conversionMutation, gene conversion•• Genetic driftGenetic drift
35
Patterns of genetic variation: Patterns of genetic variation: implications for disequilibriumimplications for disequilibrium
Continental variation patterns affect Continental variation patterns affect stratification and admixture LD mapping designstratification and admixture LD mapping designGreater Greater ““ageage”” of African populations: LD of African populations: LD persists over shorter physical distancespersists over shorter physical distancesGreater divergence of African populations: LD Greater divergence of African populations: LD patterns more likely to differ from other patterns more likely to differ from other populations: Africanpopulations: African--American populations American populations especially useful for admixture LD mappingespecially useful for admixture LD mappingCommon alleles and haplotypes are likely to be Common alleles and haplotypes are likely to be shared across populations: association shared across populations: association patterns may be sharedpatterns may be shared
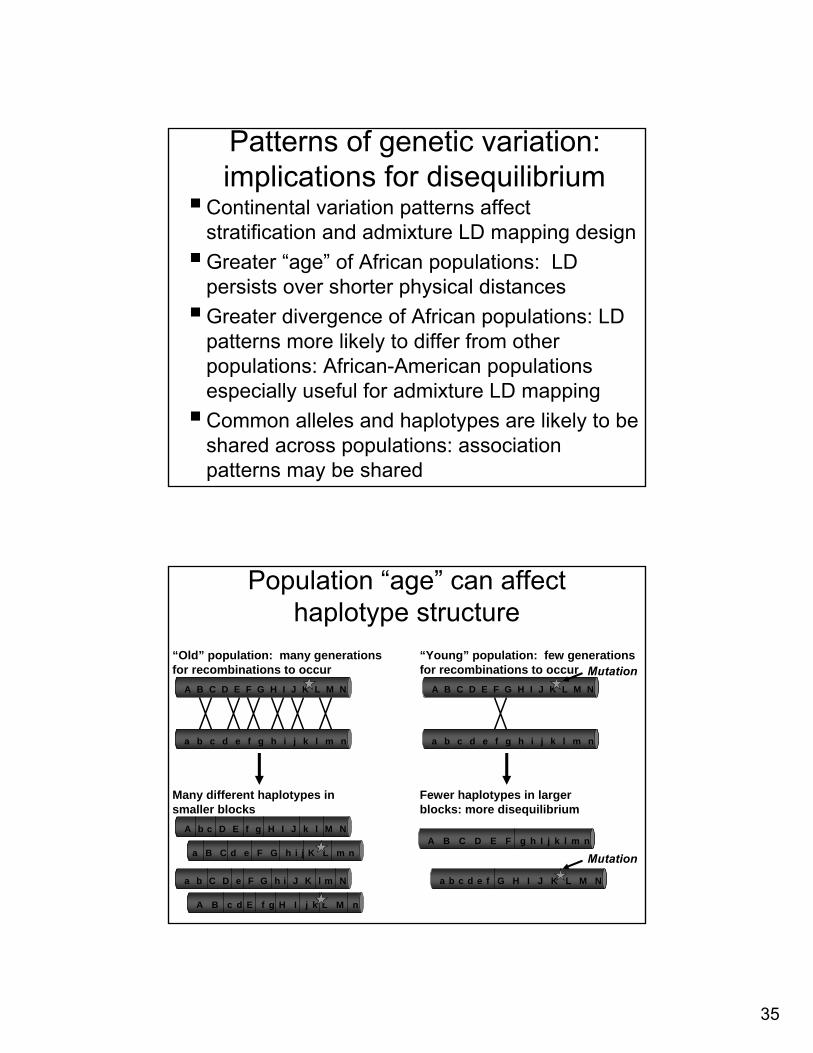
Population Population ““ageage”” can affect can affect haplotype structurehaplotype structure
A B C D E F G H I J K L M N
a b c d e f g h i j k l m n
“Old” population: many generations for recombinations to occur
Many different haplotypes in smaller blocks
A b c D E f g H I J k l M N
a B C d e F G h i j K L m n
A B c d E f g H I j k L M n
a b C D e F G h i J K l m N
A B C D E F G H I J K L M N
a b c d e f g h i j k l m n
“Young” population: few generations for recombinations to occur
Fewer haplotypes in larger blocks: more disequilibrium
A B C D E F g h I j k l m n
a b c d e f G H I J K L M N
Mutation
Mutation
36
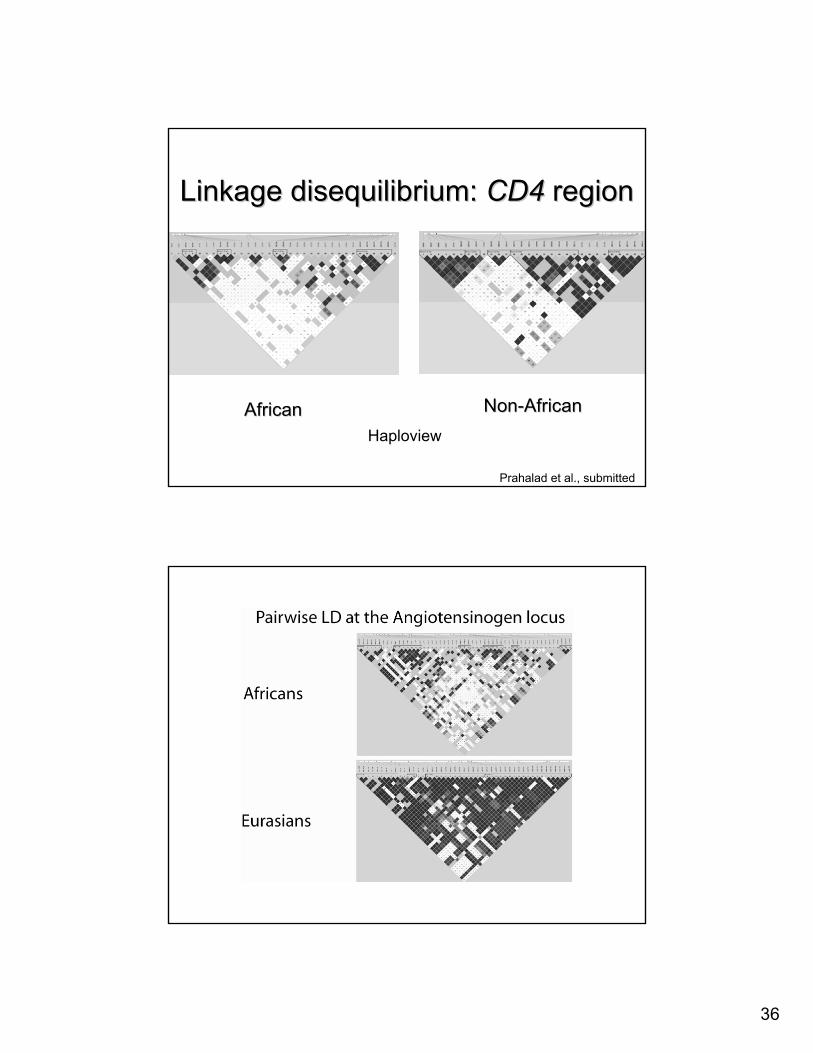
Linkage disequilibrium: Linkage disequilibrium: CD4CD4 regionregion
AfricanAfrican NonNon--AfricanAfrican
Prahalad et al., submitted
Haploview
37
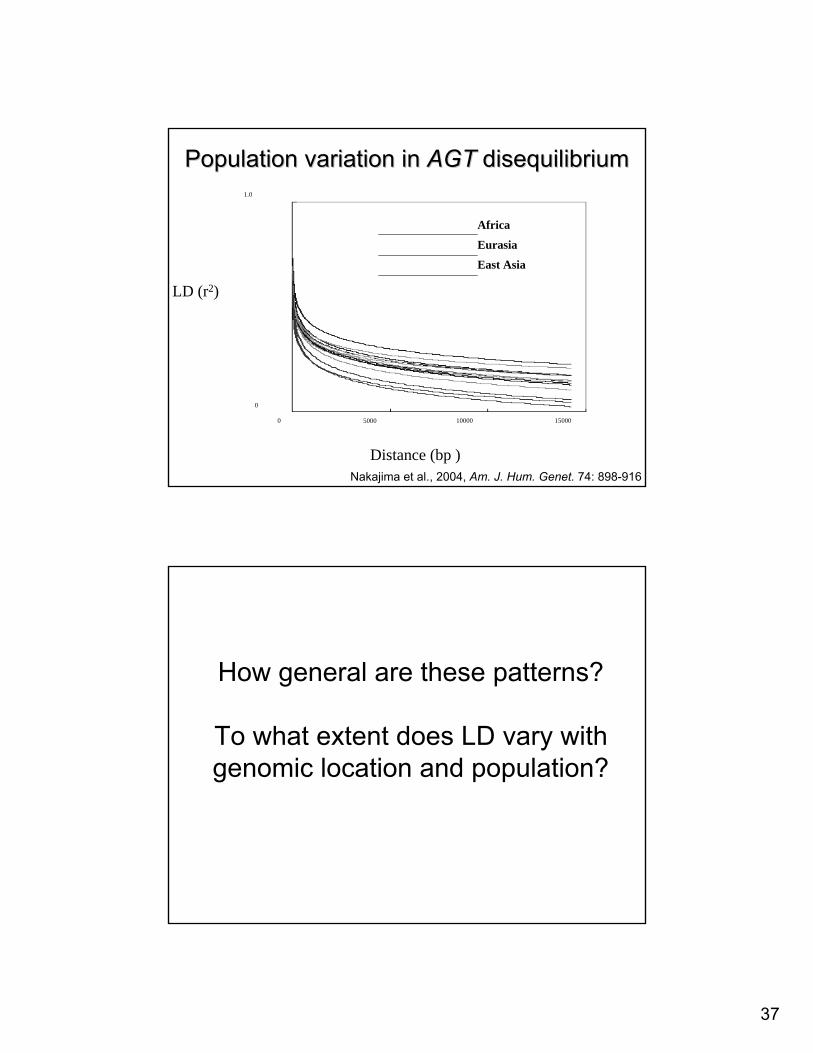
Population variation in Population variation in AGTAGT disequilibriumdisequilibrium
5000 10000 150000
1.0
0
Distance (bp )
LD (r2)
Africa
Eurasia
East Asia
Nakajima et al., 2004, Am. J. Hum. Genet. 74: 898-916
How general are these patterns?How general are these patterns?
To what extent does LD vary with To what extent does LD vary with genomic location and population?genomic location and population?
38
A Map of the World, 1544A Map of the World, 1544
In search of a better map: The In search of a better map: The International International HaplotypeHaplotype Map ProjectMap Project
600,000 600,000 SNPsSNPs (1 per 5 kb) genotyped in (1 per 5 kb) genotyped in 270 individuals270 individuals•• 90 CEPH Utah individuals (30 trios)90 CEPH Utah individuals (30 trios)•• 90 90 YorubanYoruban from Nigeria (30 trios)from Nigeria (30 trios)•• 90 East Asians (45 Chinese, 45 Japanese)90 East Asians (45 Chinese, 45 Japanese)
Evaluate patterns of linkage disequilibrium Evaluate patterns of linkage disequilibrium and and haplotypehaplotype structurestructure•• Variation in different genomic regionsVariation in different genomic regions•• Variation in different populationsVariation in different populations
39
Some of the issues surrounding Some of the issues surrounding HapMapHapMap
Choice of populationsChoice of populations•• How best to How best to samplesample human diversityhuman diversity•• Families vs. unrelated individualsFamilies vs. unrelated individuals•• Sample sizeSample sizeSNP ascertainment and densitySNP ascertainment and densityELSIELSI•• Informed consent (individual consent and Informed consent (individual consent and
community consultation)community consultation)•• Avoidance of stigmatizationAvoidance of stigmatization
A Map of the World, 1688A Map of the World, 1688
40
Genetic applications of Genetic applications of HapMapHapMap
Understanding human genomeUnderstanding human genome--wide wide haplotypehaplotypediversitydiversity
Detection of recombination hotspotsDetection of recombination hotspots
Detection of genes that have experienced strong Detection of genes that have experienced strong natural selectionnatural selection
Detection of diseaseDetection of disease--causing mutationscausing mutations
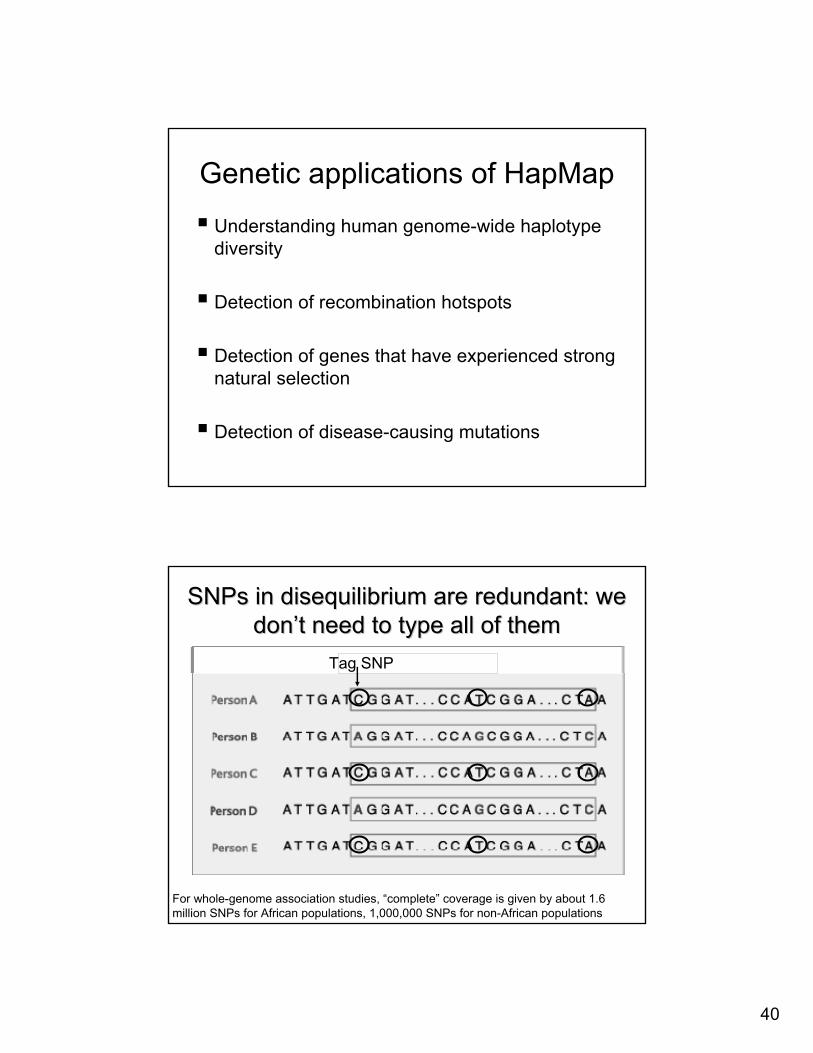
SNPsSNPs in disequilibrium are redundant: we in disequilibrium are redundant: we dondon’’t need to type all of themt need to type all of them
Tag SNP
For whole-genome association studies, “complete” coverage is given by about 1.6 million SNPs for African populations, 1,000,000 SNPs for non-African populations
41
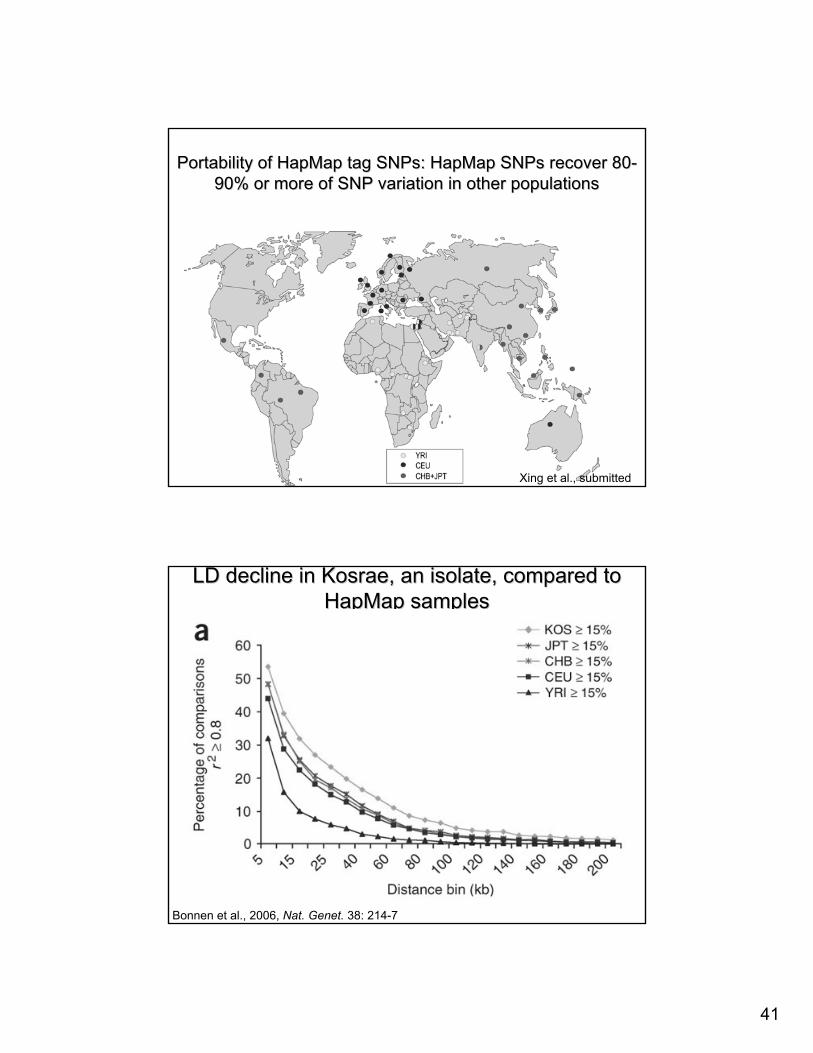
Portability of Portability of HapMapHapMap tag tag SNPsSNPs: : HapMapHapMap SNPsSNPs recover 80recover 80--90% or more of SNP variation in other populations90% or more of SNP variation in other populations
Xing et al., submitted
LD decline in LD decline in KosraeKosrae, an isolate, compared to , an isolate, compared to HapMapHapMap samplessamples
Bonnen et al., 2006, Nat. Genet. 38: 214-7
42
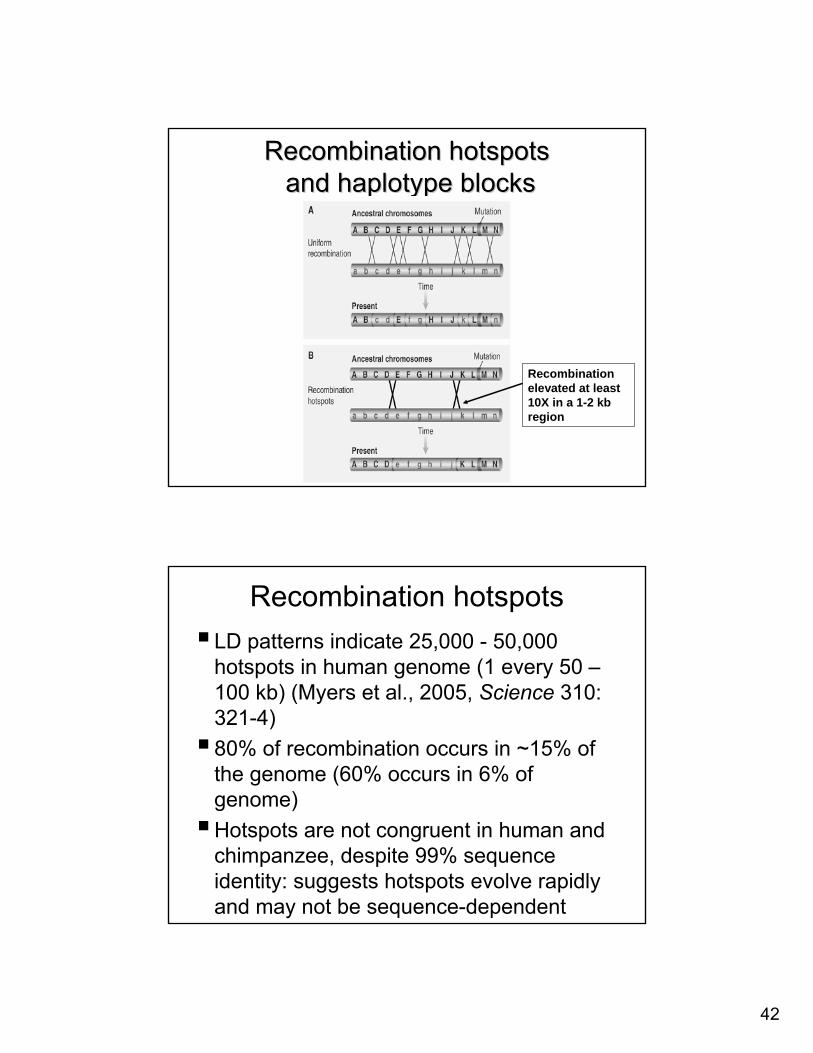
Recombination hotspotsRecombination hotspotsand and haplotypehaplotype blocksblocks
Recombination elevated at least 10X in a 1-2 kb region
Recombination hotspotsRecombination hotspotsLD patterns indicate 25,000 LD patterns indicate 25,000 -- 50,000 50,000 hotspots in human genome (1 every 50 hotspots in human genome (1 every 50 ––100 kb) (Myers et al., 2005, 100 kb) (Myers et al., 2005, Science Science 310: 310: 321321--4)4)80% of recombination occurs in ~15% of 80% of recombination occurs in ~15% of the genome (60% occurs in 6% of the genome (60% occurs in 6% of genome)genome)Hotspots are not congruent in human and Hotspots are not congruent in human and chimpanzee, despite 99% sequence chimpanzee, despite 99% sequence identity: suggests hotspots evolve rapidly identity: suggests hotspots evolve rapidly and may not be sequenceand may not be sequence--dependentdependent
43
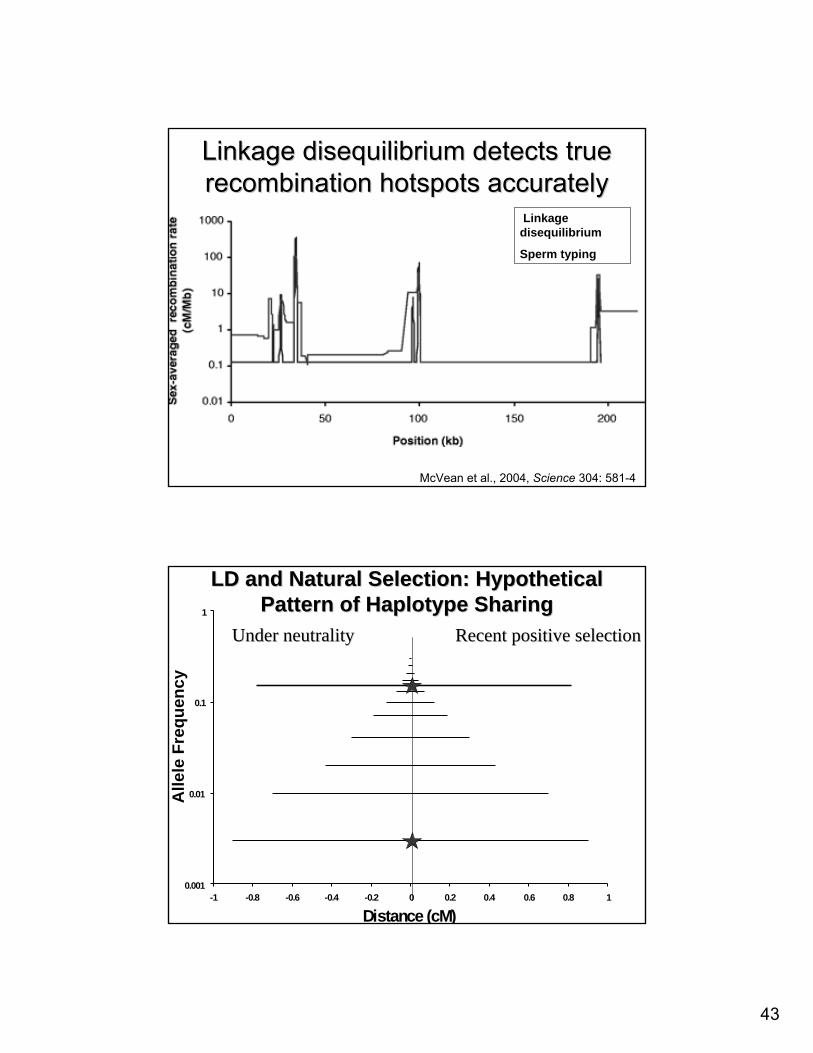
Linkage disequilibrium detects true Linkage disequilibrium detects true recombination hotspots accuratelyrecombination hotspots accurately
McVean et al., 2004, Science 304: 581-4
Linkage disequilibrium
Sperm typing
0.001
0.01
0.1
1
-1 -0.8 -0.6 -0.4 -0.2 0 0.2 0.4 0.6 0.8 1
Distance (cM)
Alle
le F
requ
ency
LD and Natural Selection: Hypothetical LD and Natural Selection: Hypothetical Pattern of Haplotype SharingPattern of Haplotype Sharing
Under neutralityUnder neutrality Recent positive selectionRecent positive selection
44
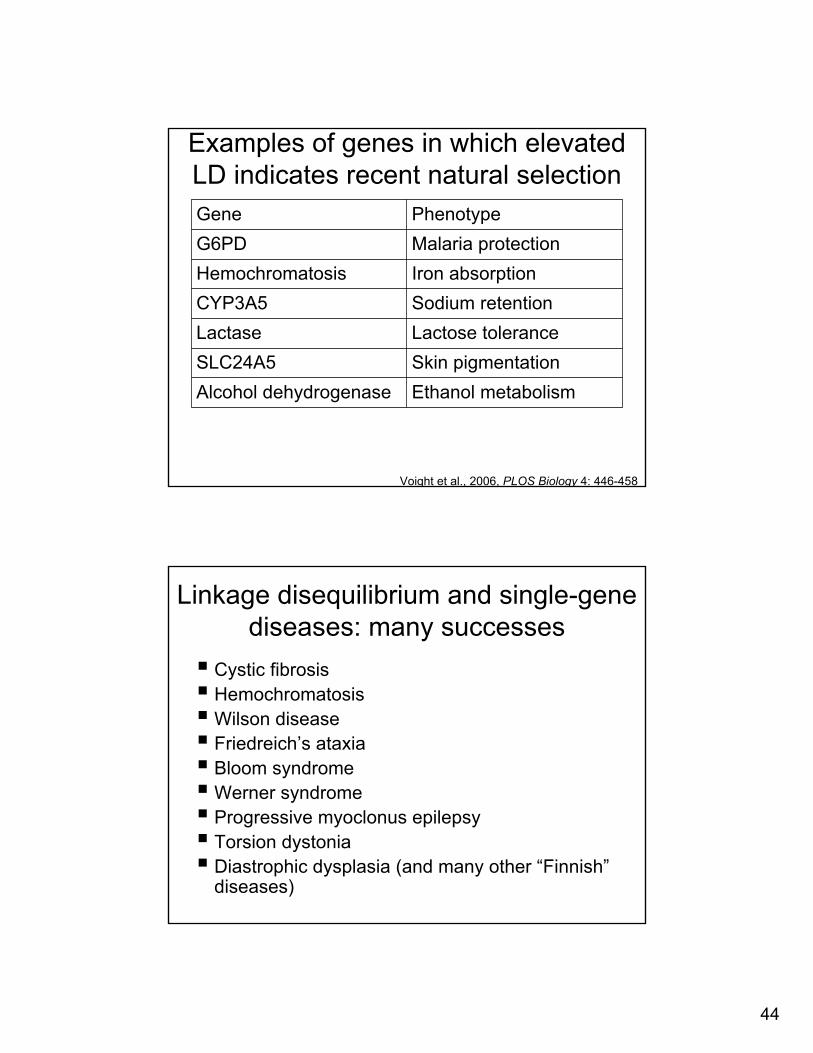
Examples of genes in which elevated Examples of genes in which elevated LD indicates recent natural selectionLD indicates recent natural selection
Ethanol metabolismEthanol metabolismAlcohol Alcohol dehydrogenasedehydrogenaseSkin pigmentationSkin pigmentationSLC24A5SLC24A5Lactose toleranceLactose toleranceLactaseLactaseSodium retentionSodium retentionCYP3A5CYP3A5Iron absorptionIron absorptionHemochromatosisHemochromatosisMalaria protectionMalaria protectionG6PDG6PDPhenotypePhenotypeGeneGene
Voight et al., 2006, PLOS Biology 4: 446-458
Linkage disequilibrium and singleLinkage disequilibrium and single--gene gene diseases: many successesdiseases: many successes
Cystic fibrosisCystic fibrosisHemochromatosisHemochromatosisWilson diseaseWilson diseaseFriedreichFriedreich’’s ataxias ataxiaBloom syndromeBloom syndromeWerner syndromeWerner syndromeProgressive myoclonus epilepsyProgressive myoclonus epilepsyTorsion dystoniaTorsion dystoniaDiastrophic dysplasia (and many other Diastrophic dysplasia (and many other ““FinnishFinnish””diseases)diseases)
45
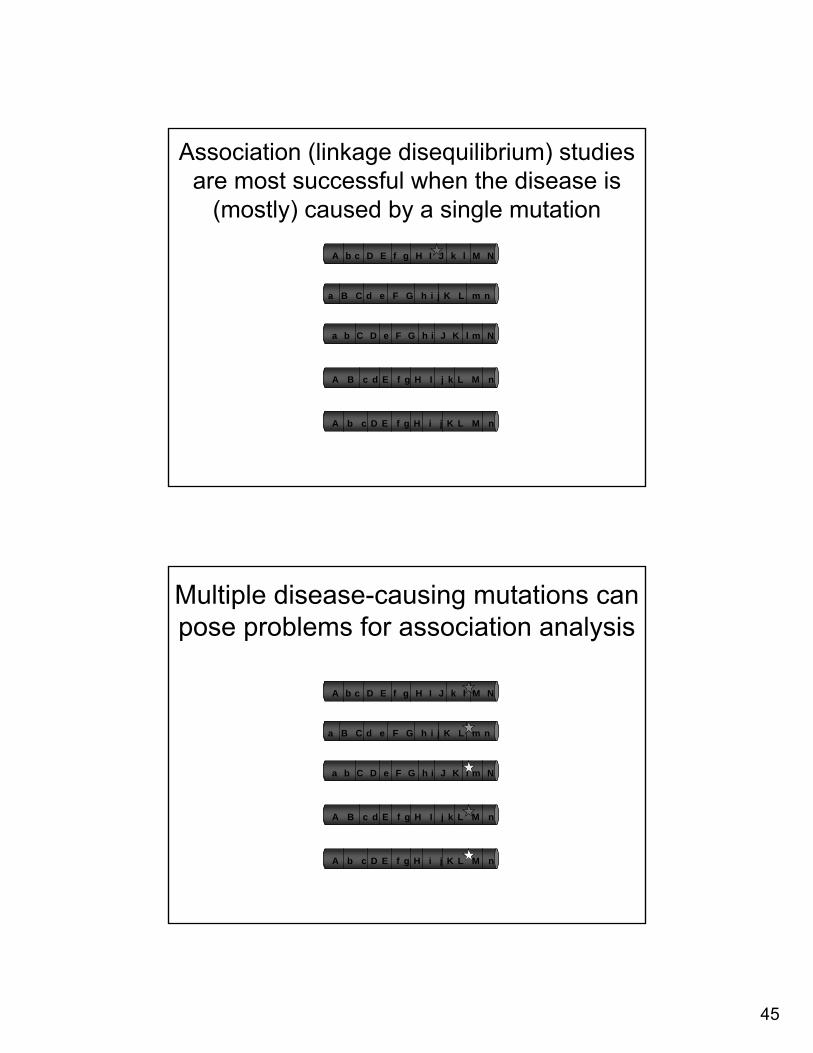
Association (linkage disequilibrium) studies Association (linkage disequilibrium) studies are most successful when the disease is are most successful when the disease is
(mostly) caused by a single mutation(mostly) caused by a single mutation
A b c D E f g H I J k l M N
a B C d e F G h i j K L m n
A B c d E f g H I j k L M n
a b C D e F G h i J K l m N
A b c D E f g H i j K L M n
Multiple diseaseMultiple disease--causing mutations can causing mutations can pose problems for association analysispose problems for association analysis
A b c D E f g H I J k l M N
a B C d e F G h i j K L m n
A B c d E f g H I j k L M n
a b C D e F G h i J K l m N
A b c D E f g H i j K L M n
46
How can we reduce heterogeneity?How can we reduce heterogeneity?
Define the trait consistently and Define the trait consistently and accuratelyaccuratelyIdentify subtypesIdentify subtypes•• Early onsetEarly onset•• Severe expressionSevere expression•• Atypical expressionAtypical expressionUse strict, narrow population Use strict, narrow population definitionsdefinitions
Linkage disequilibrium and complex Linkage disequilibrium and complex diseases: some recent successesdiseases: some recent successes
NOD2 NOD2 ((CARD15CARD15), ), IL23RIL23R and Crohnand Crohn’’s diseases disease
ADAM33, GPRA, ADAM33, GPRA, and asthmaand asthma
NeuregulinNeuregulin and schizophrenia and schizophrenia
Complement factor H and ageComplement factor H and age--related macular related macular degenerationdegeneration•• HapMapHapMap data used to define a 41 kb block to focus data used to define a 41 kb block to focus
mutation searchmutation search
47
Population genetics and genome analysisPopulation genetics and genome analysis
Genetic variation contains useful information Genetic variation contains useful information about population historyabout population history
Genetic variation provides a more informed view Genetic variation provides a more informed view of of ““racerace”” and its relevance to medicineand its relevance to medicine
Population genetic analysis has been critical in Population genetic analysis has been critical in understanding linkage disequilibriumunderstanding linkage disequilibrium
Population genetics is Population genetics is funfun!!