Embed Size (px)
Citation preview
POPULATION RESEARCH SEMINAR SERIES Sponsored by the Statistics and Survey Methods Core of the U54 Partnership
Power calculations: When and why are they necessary?
Wendy B. London, PhDAssociate Professor of Pediatrics
Harvard Medical SchoolFebruary 3, 2014

TopicsTopics
• Designing a valid study: how to Designing a valid study: how to collaboratecollaborate with the statistician to with the statistician to calculate powercalculate power
• Motivating Motivating exampleexample: improvement : improvement in level of in level of health literacyhealth literacy
• How to deal with How to deal with pitfallspitfalls: lower than : lower than expected enrollment; small than expected enrollment; small than anticipated effect sizeanticipated effect size
·
Collaborating with a Collaborating with a statisticianstatistician
• Exchange of knowledge: Exchange of knowledge: teach the teach the statisticianstatistician your area of research; your area of research; statistician will teach you statistician will teach you statistical methodsstatistical methods
• http://www.youtube.com/watch?v=PbODigCZqL8
Focus on the primary Focus on the primary objectiveobjective
• Statistician will ask questions:Statistician will ask questions:• What is your What is your primary objectiveprimary objective? (wording is ? (wording is
important)important)• The question you want to answerThe question you want to answer
• What is your What is your primary endpointprimary endpoint??• The thing you measure in order to answer the questionThe thing you measure in order to answer the question
• Statistician will encourage you to be Statistician will encourage you to be focusedfocused
The study’s power is driven by the The study’s power is driven by the primary objective.primary objective.
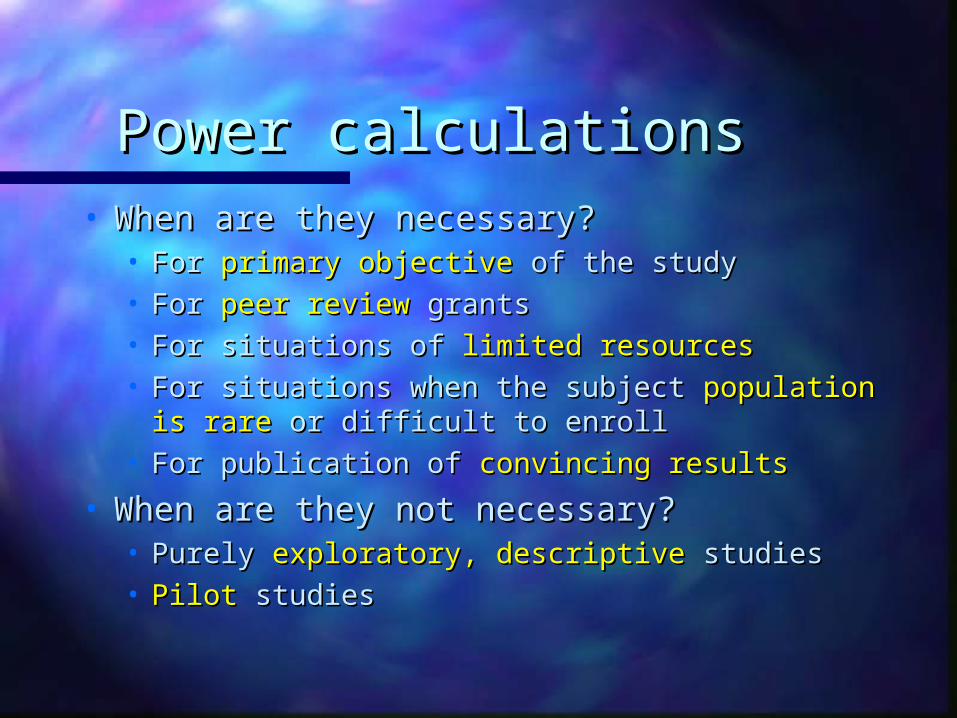
Power calculationsPower calculations• When are they necessary?When are they necessary?
• For For primary objective primary objective of the studyof the study• For For peer review peer review grantsgrants• For situations of For situations of limited resourceslimited resources• For situations when the subject For situations when the subject population is population is
rare rare or difficult to enrollor difficult to enroll• For publication of For publication of convincing resultsconvincing results
• When are they not necessary?When are they not necessary?• Purely Purely exploratory, descriptive exploratory, descriptive studiesstudies• PilotPilot studies studies
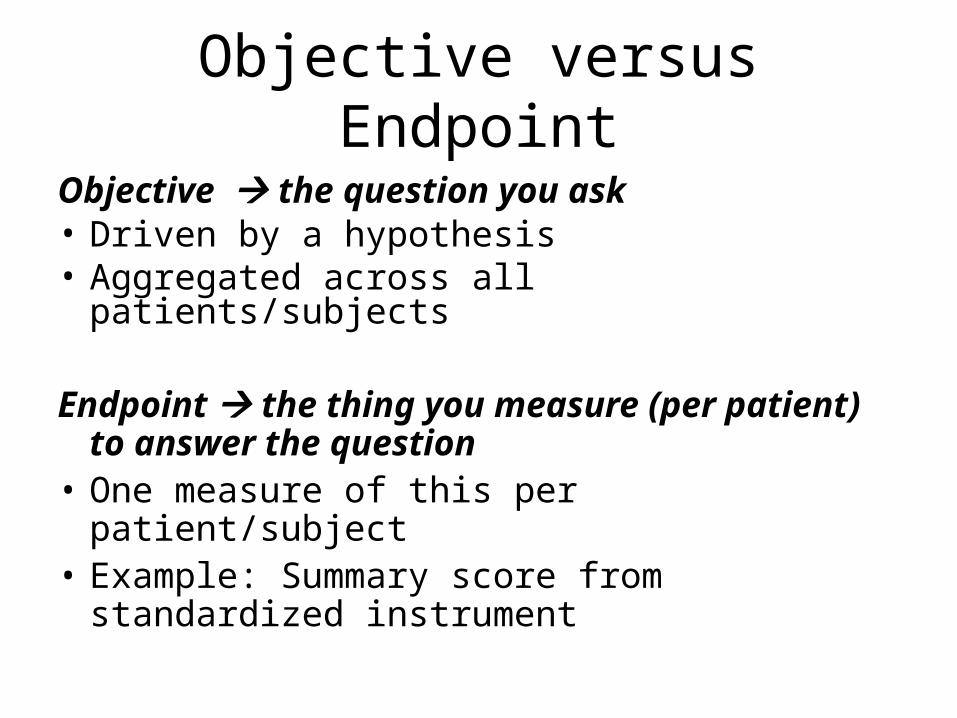
Objective versus Endpoint
Objective the question you ask• Driven by a hypothesis• Aggregated across all patients/subjects
Endpoint the thing you measure (per patient) to answer the question
• One measure of this per patient/subject• Example: Summary score from standardized
instrument
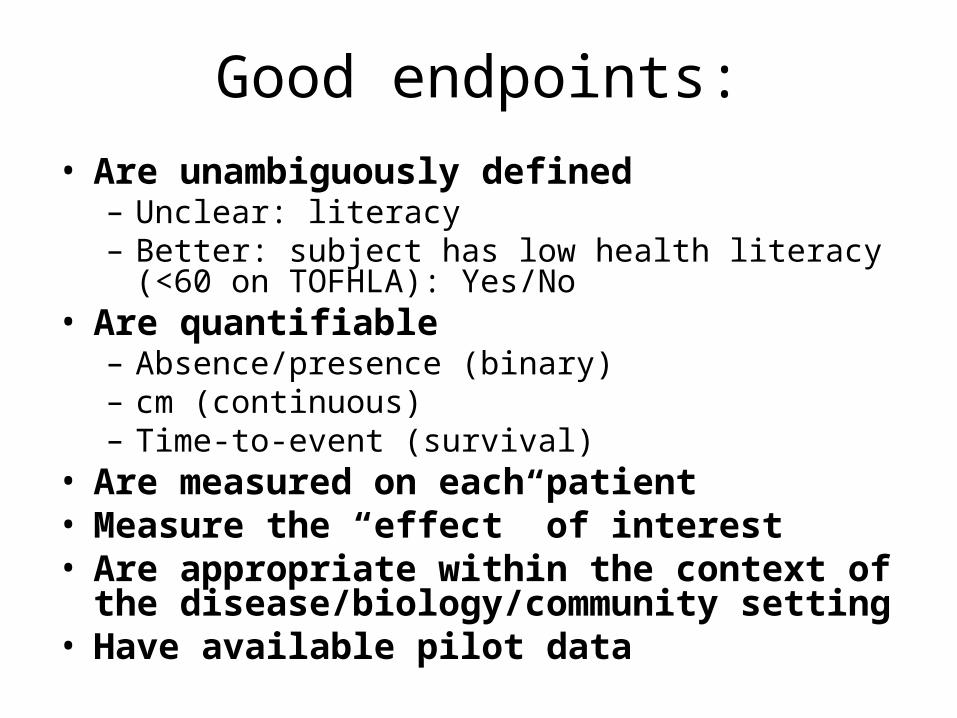
Good endpoints:
• Are unambiguously defined– Unclear: literacy– Better: subject has low health literacy (<60 on
TOFHLA): Yes/No• Are quantifiable
– Absence/presence (binary)– cm (continuous)– Time-to-event (survival)
• Are measured on each patient• Measure the “effect” of interest • Are appropriate within the context of the
disease/biology/community setting• Have available pilot data
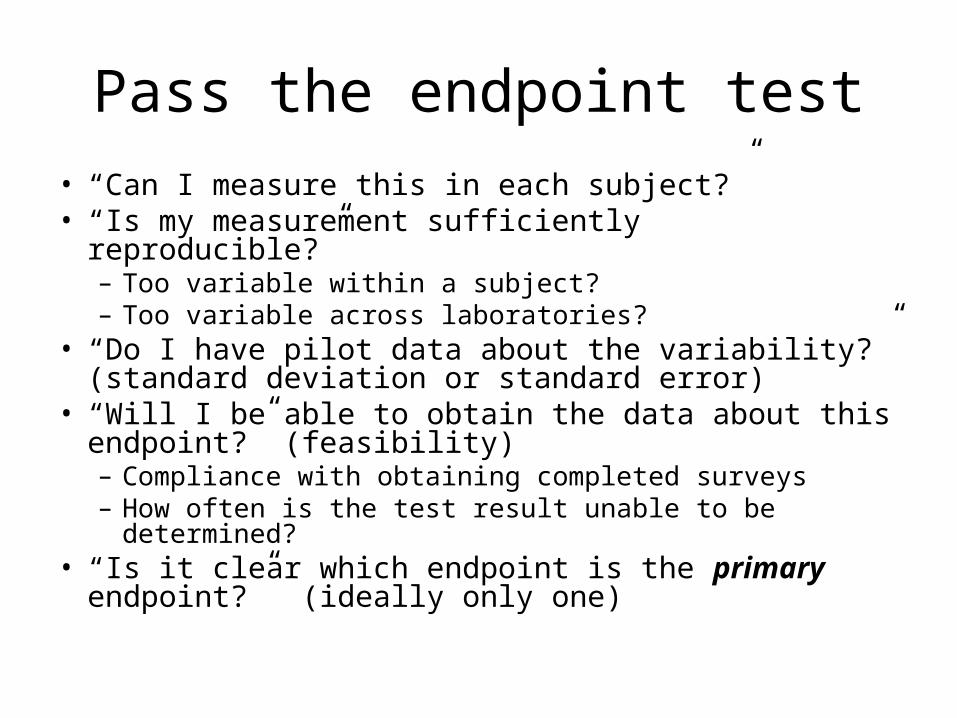
Pass the endpoint test
• “Can I measure this in each subject?”• “Is my measurement sufficiently reproducible?”
– Too variable within a subject?– Too variable across laboratories?
• “Do I have pilot data about the variability?” (standard deviation or standard error)
• “Will I be able to obtain the data about this endpoint?” (feasibility)– Compliance with obtaining completed surveys– How often is the test result unable to be determined?
• “Is it clear which endpoint is the primary endpoint?” (ideally only one)
Summary about endpoints
• Objective: question
• Endpoint: what you measure to answer the question
• Explicitly define one primary endpoint in the study
Example: Study to Example: Study to improve health literacy improve health literacy
(hypothetical)(hypothetical)
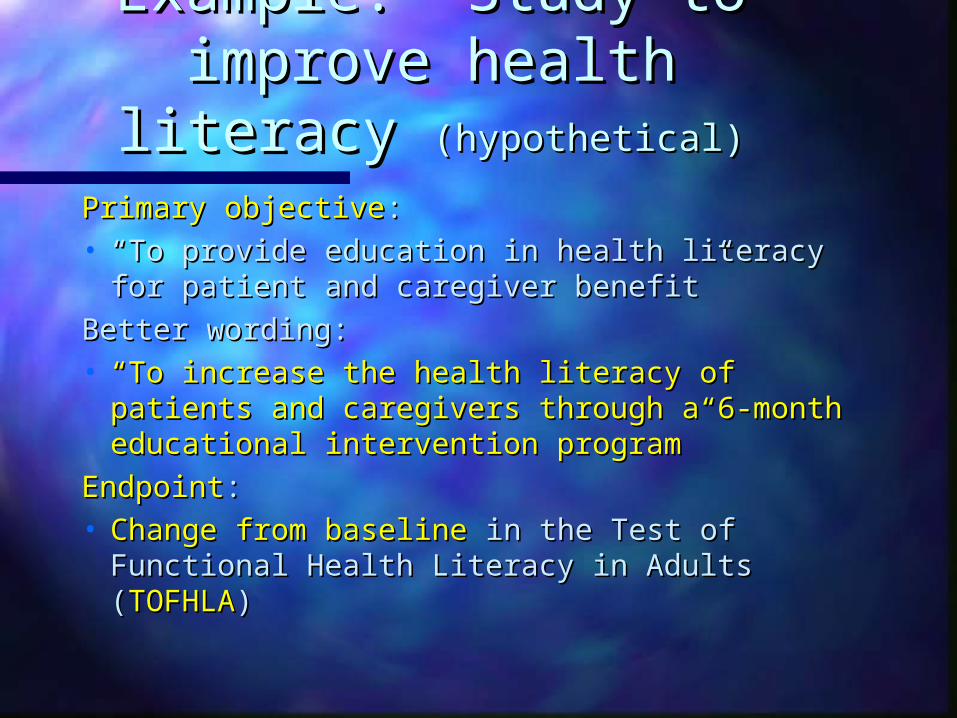
Primary objectivePrimary objective::• ““To provide education in health literacy for To provide education in health literacy for
patient and caregiver benefit”patient and caregiver benefit”
Better wording:Better wording:• ““To increase the health literacy of patients and To increase the health literacy of patients and
caregivers through a 6-month educational caregivers through a 6-month educational intervention program”intervention program”
EndpointEndpoint::• Change from baseline Change from baseline in the Test of Functional in the Test of Functional
Health Literacy in Adults (Health Literacy in Adults (TOFHLATOFHLA))
Come prepared to answer Come prepared to answer the Statistician’s the Statistician’s
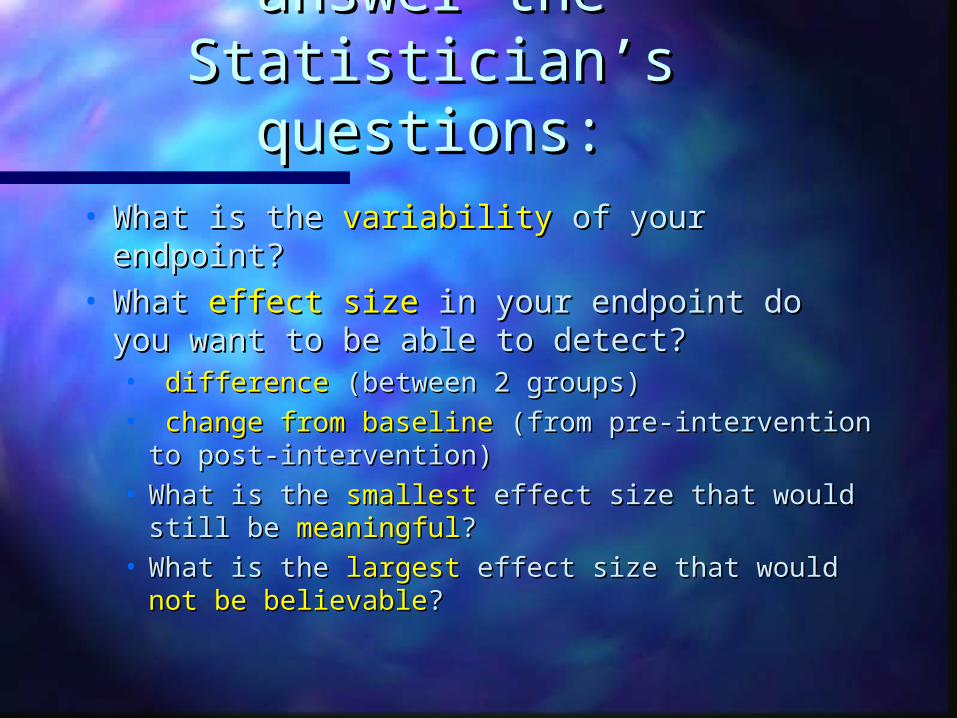
questions:questions:• What is the What is the variabilityvariability of your endpoint? of your endpoint?• What What effect size effect size in your endpoint do you in your endpoint do you
want to be able to detect?want to be able to detect?• differencedifference (between 2 groups) (between 2 groups)• change from baseline change from baseline (from pre-intervention (from pre-intervention
to post-intervention)to post-intervention)• What is the What is the smallestsmallest effect size that would effect size that would
still be still be meaningfulmeaningful??• What is the What is the largestlargest effect size that would effect size that would not not
be believablebe believable??
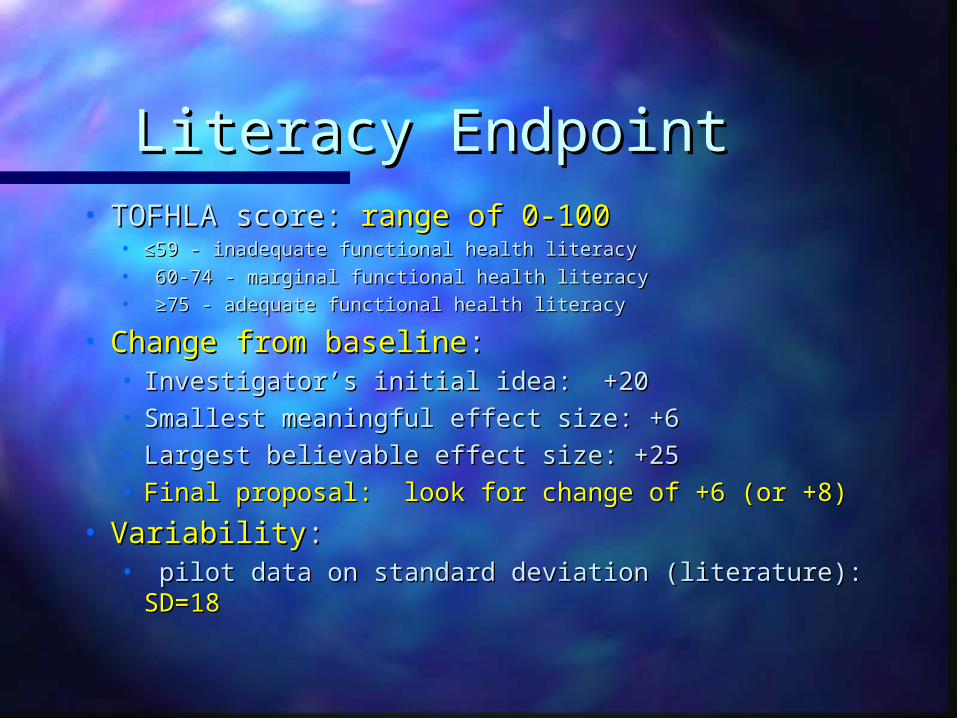
Literacy EndpointLiteracy Endpoint• TOFHLA score: TOFHLA score: range of 0-100range of 0-100
• ≤≤59 - inadequate functional health literacy59 - inadequate functional health literacy• 60-74 - marginal functional health literacy60-74 - marginal functional health literacy• ≥ ≥75 - adequate functional health literacy75 - adequate functional health literacy
• Change from baselineChange from baseline: : • Investigator’s initial idea: +20Investigator’s initial idea: +20• Smallest meaningful effect size: +6Smallest meaningful effect size: +6• Largest believable effect size: +25Largest believable effect size: +25• Final proposal: look for change of +6 (or +8)Final proposal: look for change of +6 (or +8)
• VariabilityVariability::• pilot data on standard deviation (literature): pilot data on standard deviation (literature): SD=18SD=18
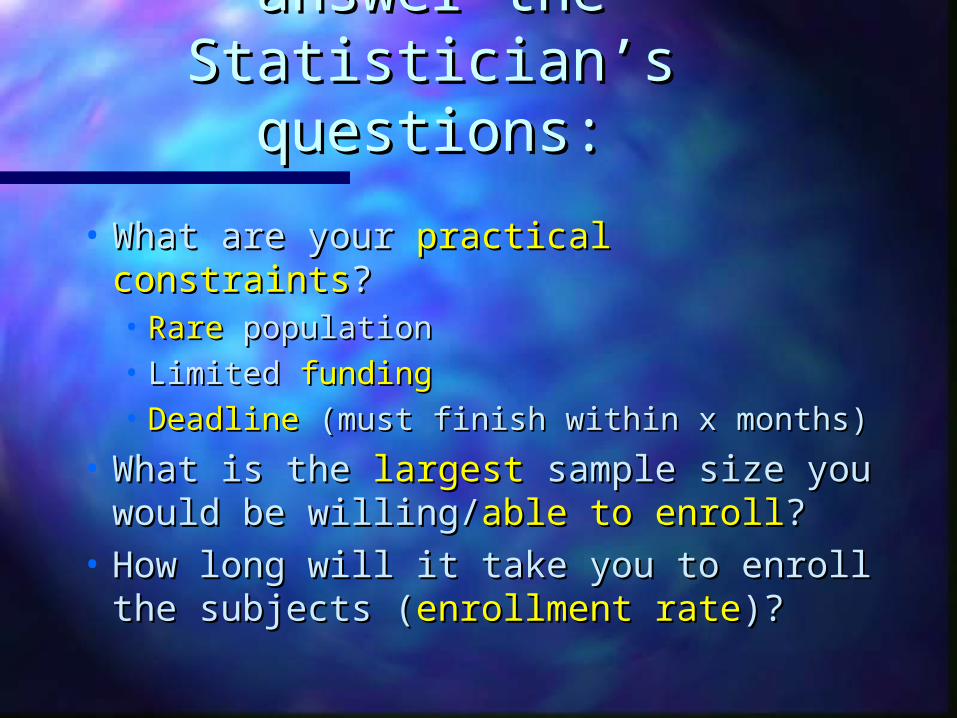
Come prepared to answer Come prepared to answer the Statistician’s the Statistician’s
questions:questions:
• What are your What are your practical constraintspractical constraints??• RareRare population population• Limited Limited fundingfunding• DeadlineDeadline (must finish within x months) (must finish within x months)
• What is the What is the largestlargest sample size you sample size you would be willing/would be willing/able to enrollable to enroll??
• How long will it take you to enroll How long will it take you to enroll the subjects (the subjects (enrollment rateenrollment rate)?)?
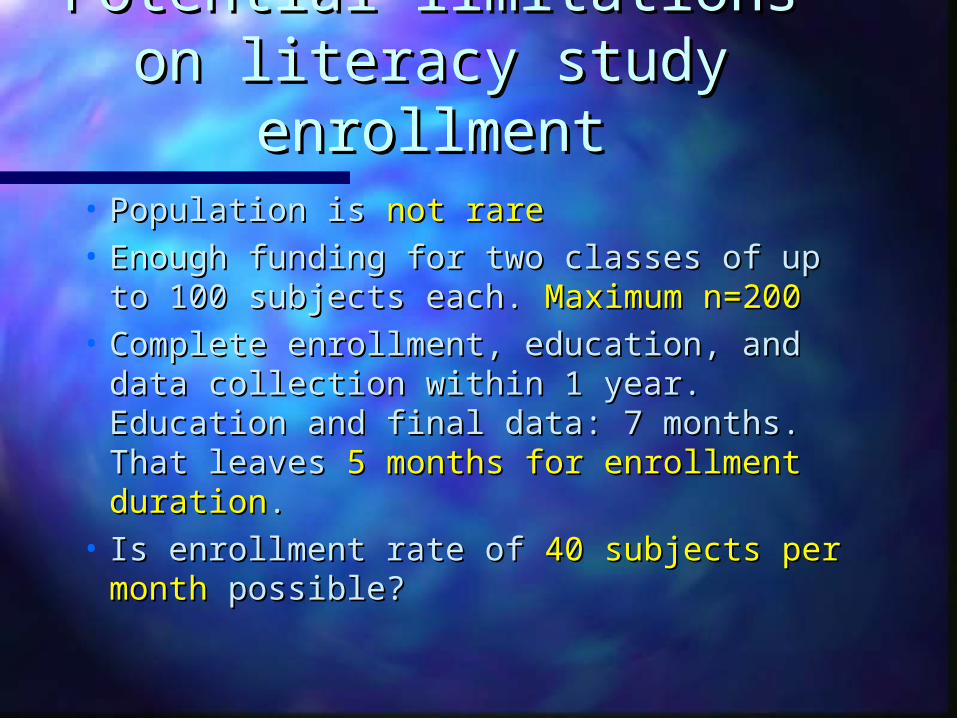
Potential limitations on Potential limitations on literacy study enrollmentliteracy study enrollment• Population is Population is not rarenot rare• Enough funding for two classes of up to Enough funding for two classes of up to
100 subjects each. 100 subjects each. Maximum n=200Maximum n=200• Complete enrollment, education, and Complete enrollment, education, and
data collection within 1 year. Education data collection within 1 year. Education and final data: 7 months. That leaves and final data: 7 months. That leaves 5 5 months for enrollment durationmonths for enrollment duration..
• Is enrollment rate of Is enrollment rate of 40 subjects per 40 subjects per monthmonth possible? possible?
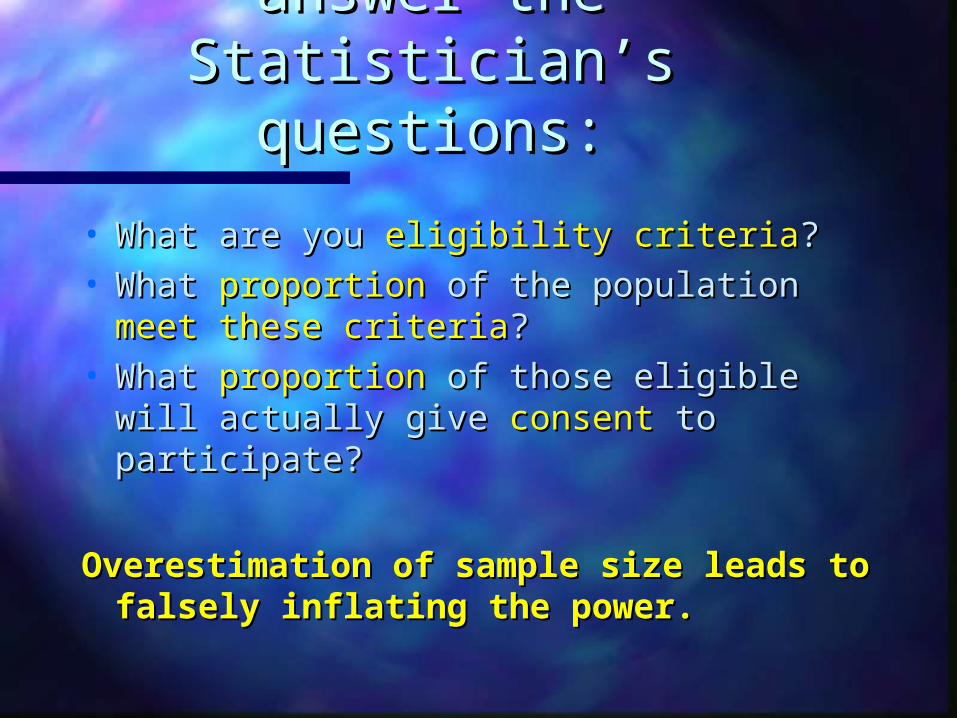
Come prepared to answer Come prepared to answer the Statistician’s the Statistician’s
questions:questions:
• What are you What are you eligibility criteriaeligibility criteria??• What What proportionproportion of the population of the population meet meet
these criteriathese criteria??• What What proportionproportion of those eligible will of those eligible will
actually give actually give consentconsent to participate? to participate?
Overestimation of sample size leads Overestimation of sample size leads to falsely inflating the power.to falsely inflating the power.
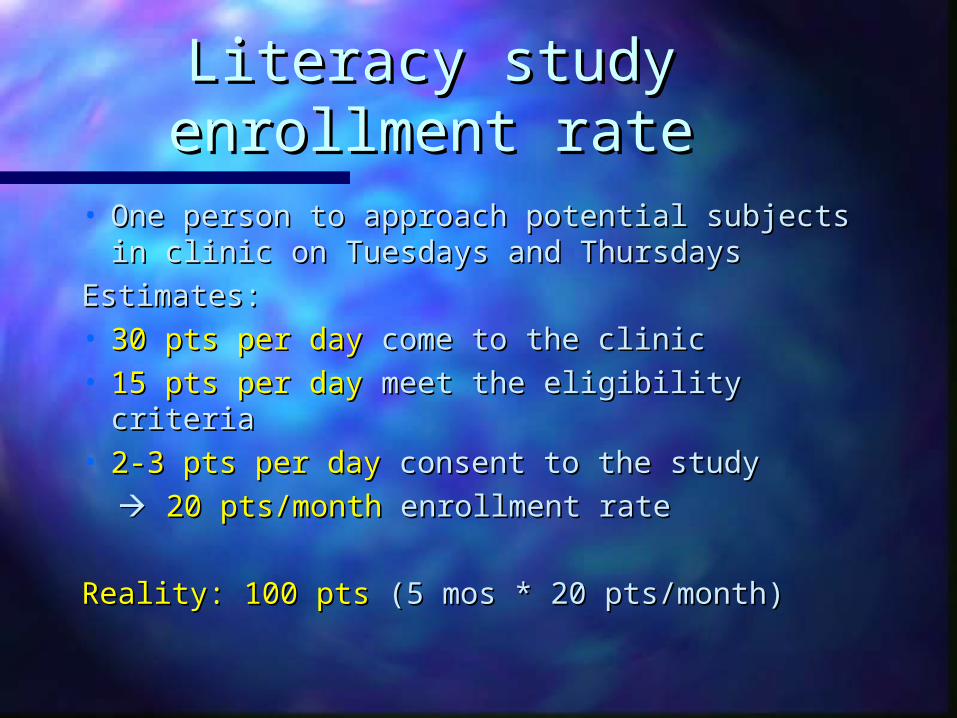
Literacy study enrollment Literacy study enrollment raterate
• One person to approach potential subjects in One person to approach potential subjects in clinic on Tuesdays and Thursdaysclinic on Tuesdays and Thursdays
Estimates:Estimates:• 30 pts per day 30 pts per day come to the cliniccome to the clinic• 15 pts per day 15 pts per day meet the eligibility criteriameet the eligibility criteria• 2-3 pts per day 2-3 pts per day consent to the studyconsent to the study
20 pts/month 20 pts/month enrollment rateenrollment rate
Reality: 100 pts Reality: 100 pts (5 mos * 20 pts/month)(5 mos * 20 pts/month)

Hypothesis testingHypothesis testingRestateRestate the primary objective the primary objective as a statistical as a statistical
hypothesishypothesisLet Let d = (final TOFHLA score) – (baseline TOFHLA score)d = (final TOFHLA score) – (baseline TOFHLA score)
Null hypothesis Null hypothesis Ho: d = 0Ho: d = 0Alternative hypothesisAlternative hypothesisHa: d > 0Ha: d > 0• Power = the probability of rejecting the null if Power = the probability of rejecting the null if
it is falseit is false• Alpha = the probability of rejecting the null if Alpha = the probability of rejecting the null if
it is trueit is true““underpowered”underpowered” - study is too small to detect a - study is too small to detect a
meaningful differencemeaningful difference
PowerPower
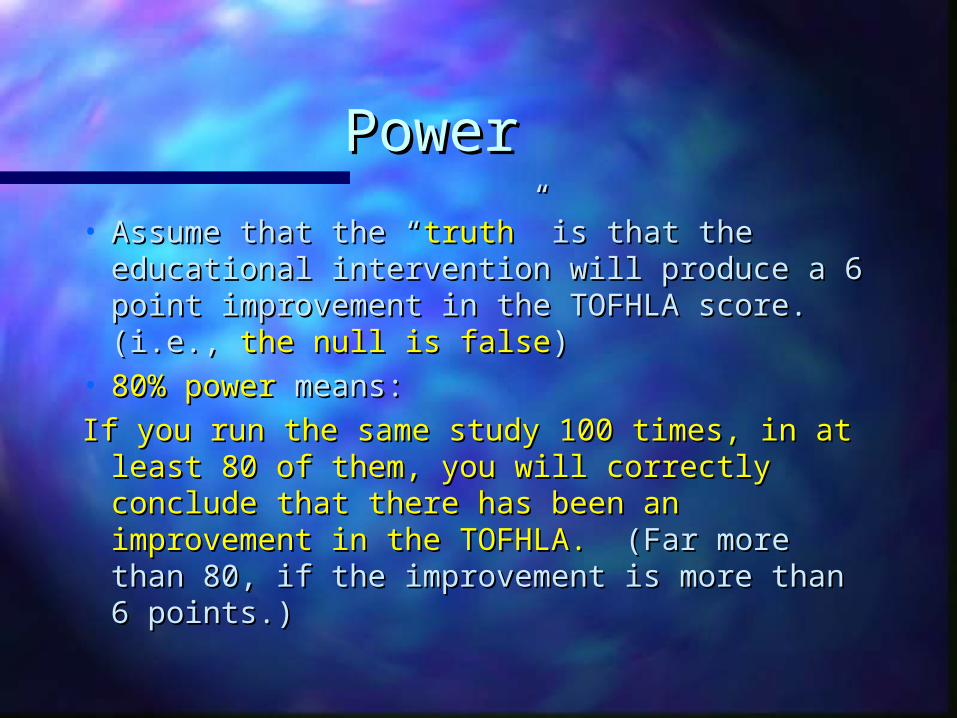
• Assume that the “Assume that the “truthtruth” is that the ” is that the educational intervention will produce a 6 educational intervention will produce a 6 point improvement in the TOFHLA score. point improvement in the TOFHLA score. (i.e., (i.e., the null is falsethe null is false))
• 80% power 80% power means:means:
If you run the same study 100 times, in at If you run the same study 100 times, in at least 80 of them, you will correctly conclude least 80 of them, you will correctly conclude that there has been an improvement in the that there has been an improvement in the TOFHLA. TOFHLA. (Far more than 80, if the (Far more than 80, if the improvement is more than 6 points.)improvement is more than 6 points.)
Recall the p-valueRecall the p-value
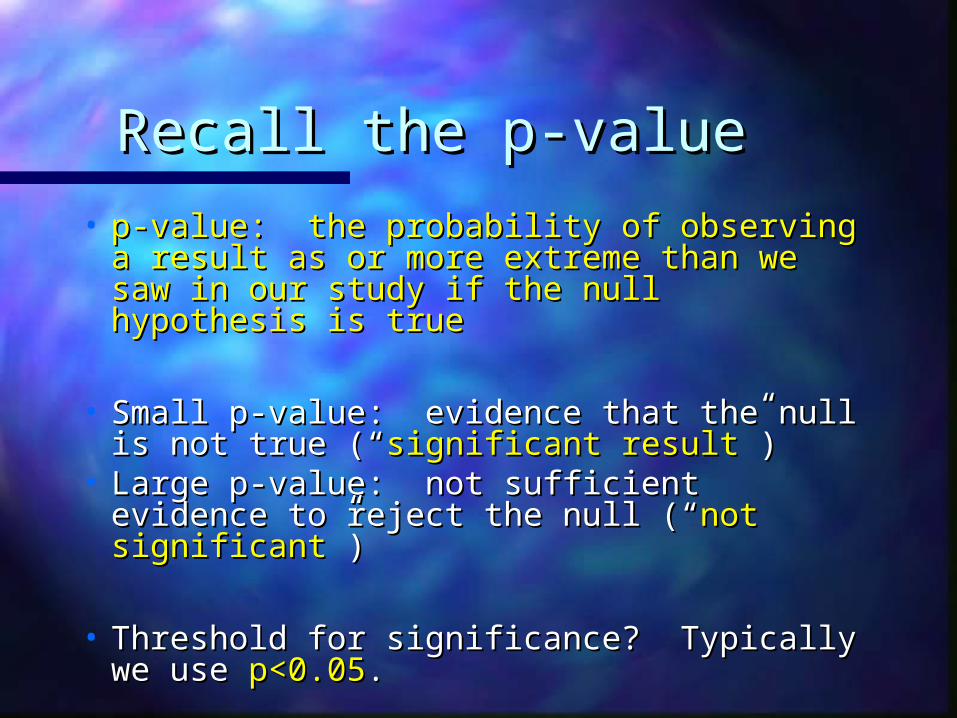
• p-value: the probability of observing a p-value: the probability of observing a result as or more extreme than we saw result as or more extreme than we saw in our study if the null hypothesis is truein our study if the null hypothesis is true
• Small p-value: evidence that the null is Small p-value: evidence that the null is not true (“not true (“significant resultsignificant result”)”)
• Large p-value: not sufficient evidence Large p-value: not sufficient evidence to reject the null (“to reject the null (“not significantnot significant”)”)
• Threshold for significance? Typically we Threshold for significance? Typically we use use p<0.05p<0.05..
P-value depends on the sample P-value depends on the sample sizesize
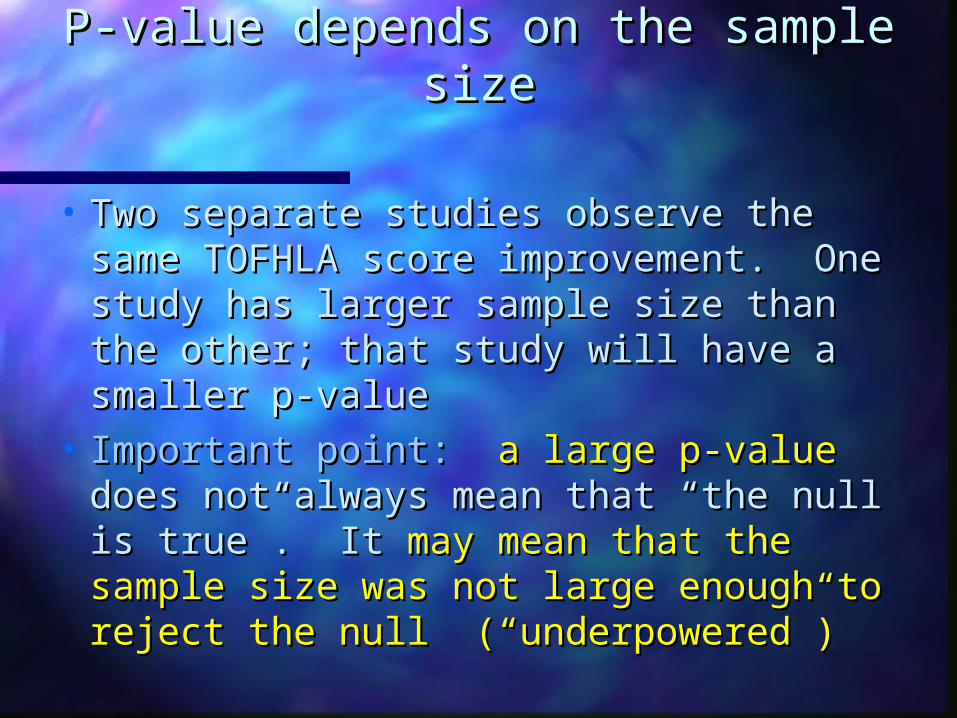
• Two separate studies observe the Two separate studies observe the same TOFHLA score improvement. same TOFHLA score improvement. One study has larger sample size than One study has larger sample size than the other; that study will have a the other; that study will have a smaller p-valuesmaller p-value
• Important point:Important point: a large p-value a large p-value does does not always mean that “the null is not always mean that “the null is true”. It true”. It may mean that the sample may mean that the sample size was not large enough to reject size was not large enough to reject the null (“underpowered”)the null (“underpowered”)
Literacy studyLiteracy studypower calculationspower calculations
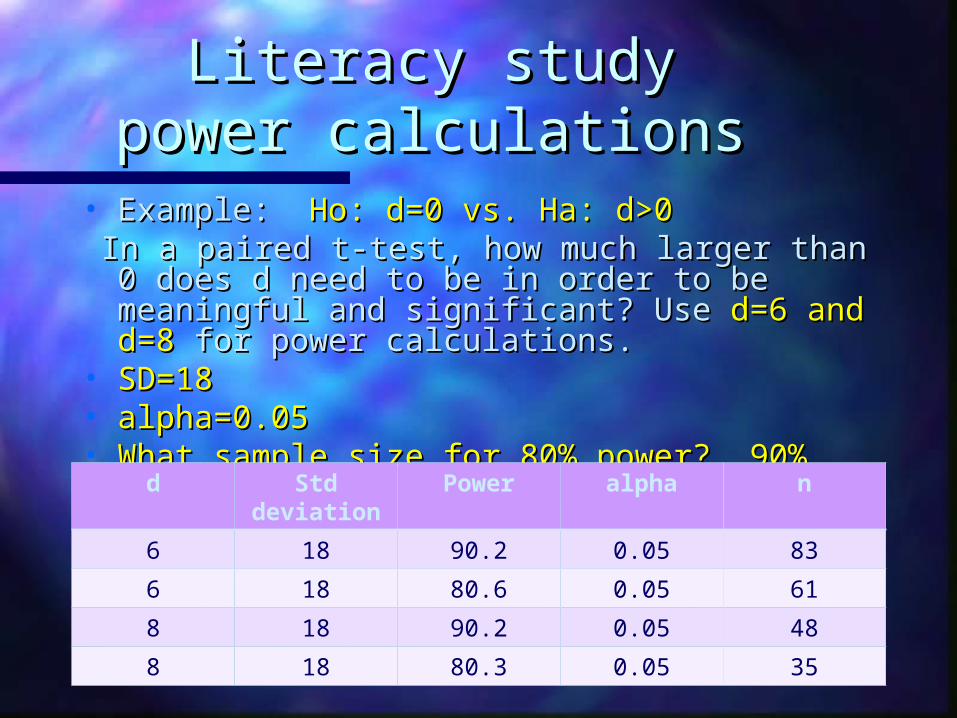
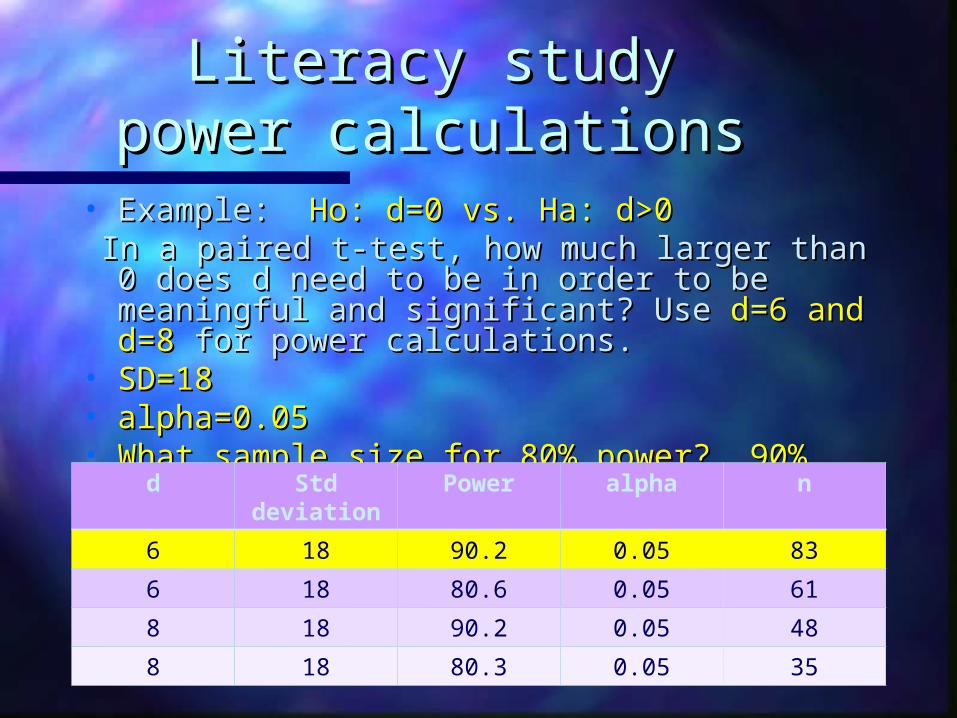
• Example: Example: Ho: d=0 vs. Ha: d>0Ho: d=0 vs. Ha: d>0 In a paired t-test, how much larger than 0 does In a paired t-test, how much larger than 0 does
d need to be in order to be meaningful and d need to be in order to be meaningful and significant? Use significant? Use d=6 and d=8d=6 and d=8 for power for power calculations.calculations.
• SD=18SD=18• alpha=0.05alpha=0.05• What sample size for 80% power? 90% What sample size for 80% power? 90%
power?power?d Std deviation
Power alpha n
6 18 90.2 0.05 83
6 18 80.6 0.05 61
8 18 90.2 0.05 48
8 18 80.3 0.05 35
Literacy studyLiteracy studypower calculationspower calculations
• Example: Example: Ho: d=0 vs. Ha: d>0Ho: d=0 vs. Ha: d>0 In a paired t-test, how much larger than 0 does In a paired t-test, how much larger than 0 does
d need to be in order to be meaningful and d need to be in order to be meaningful and significant? Use significant? Use d=6 and d=8d=6 and d=8 for power for power calculations.calculations.
• SD=18SD=18• alpha=0.05alpha=0.05• What sample size for 80% power? 90% What sample size for 80% power? 90%
power?power?d Std deviation
Power alpha n
6 18 90.2 0.05 83
6 18 80.6 0.05 61
8 18 90.2 0.05 48
8 18 80.3 0.05 35
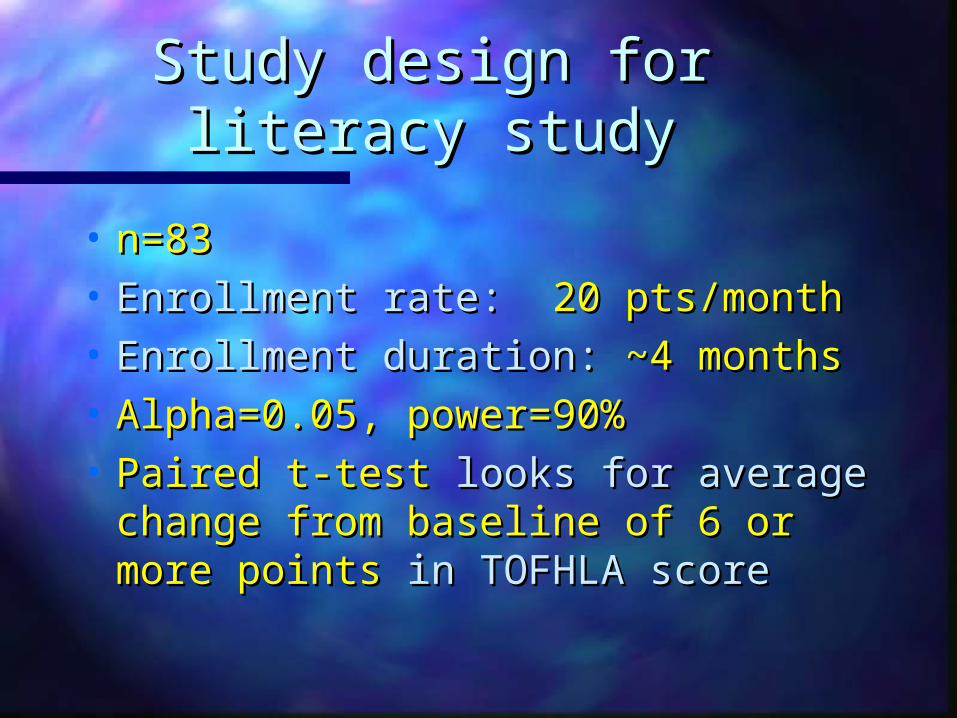
Study design for literacy Study design for literacy studystudy
• n=83n=83• Enrollment rate: Enrollment rate: 20 pts/month20 pts/month• Enrollment duration: Enrollment duration: ~4 months~4 months• Alpha=0.05, power=90%Alpha=0.05, power=90%• Paired t-test Paired t-test looks for average looks for average
change from baseline of 6 or more change from baseline of 6 or more points points in TOFHLA scorein TOFHLA score
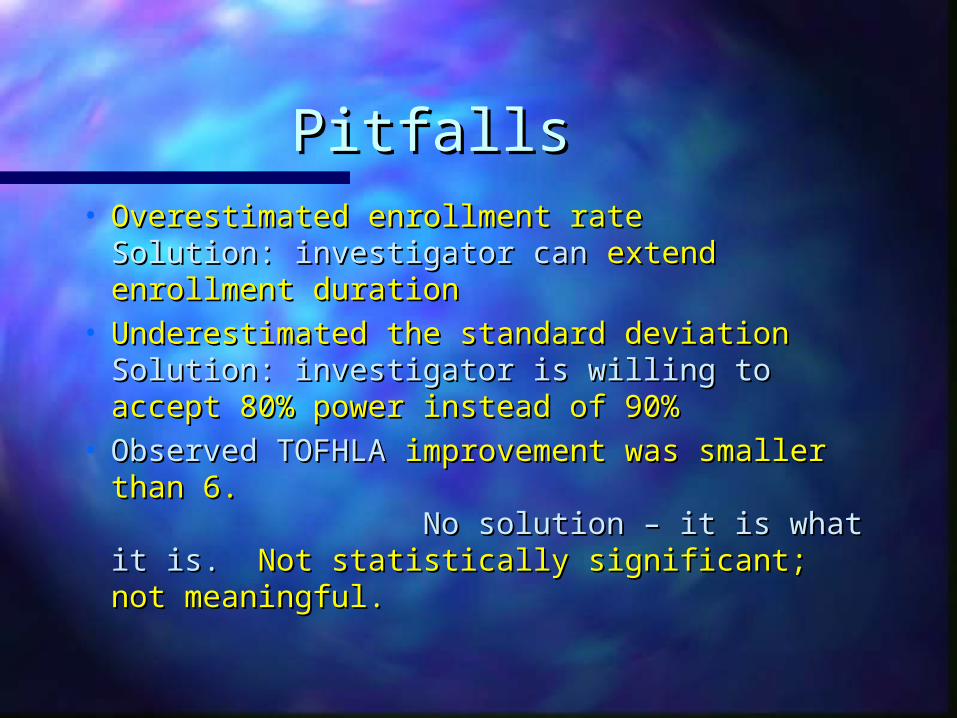
PitfallsPitfalls• OverestimatedOverestimated enrollment rate enrollment rate
Solution: investigator can Solution: investigator can extend extend enrollment durationenrollment duration
• Underestimated the standard deviation Underestimated the standard deviation Solution: investigator is willing to Solution: investigator is willing to accept accept 80% power instead of 90%80% power instead of 90%
• Observed TOFHLA Observed TOFHLA improvement was improvement was smaller than 6. smaller than 6. No solution – it is what it is. No solution – it is what it is. Not Not statistically significant; not meaningful.statistically significant; not meaningful.
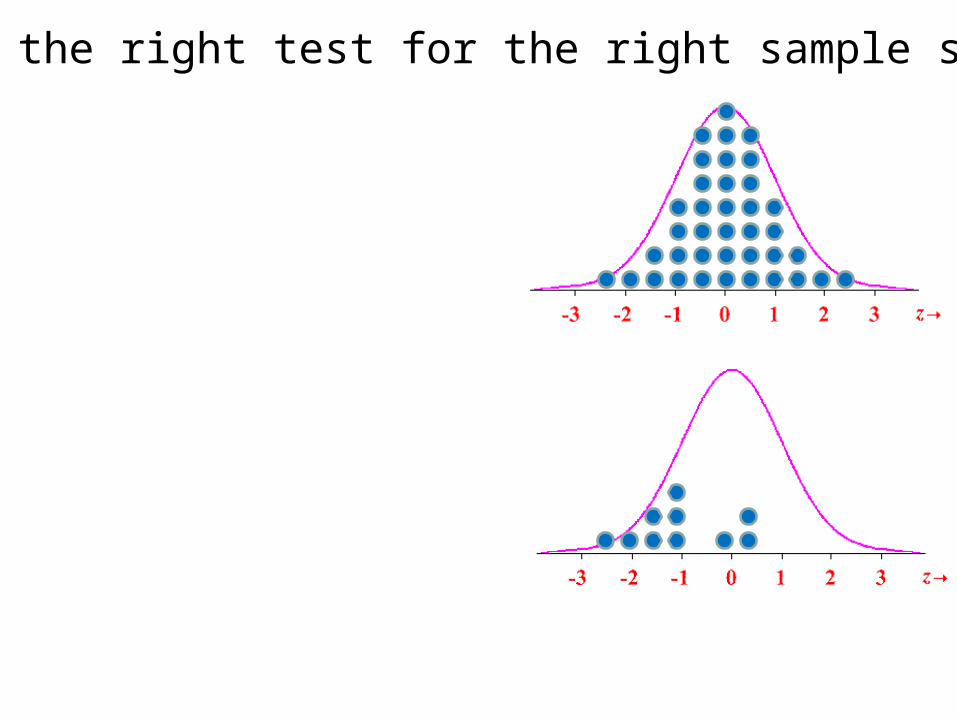
Pick the right test for the right sample size
Pick the right test for the right sample size
Pick the right test for the right sample size
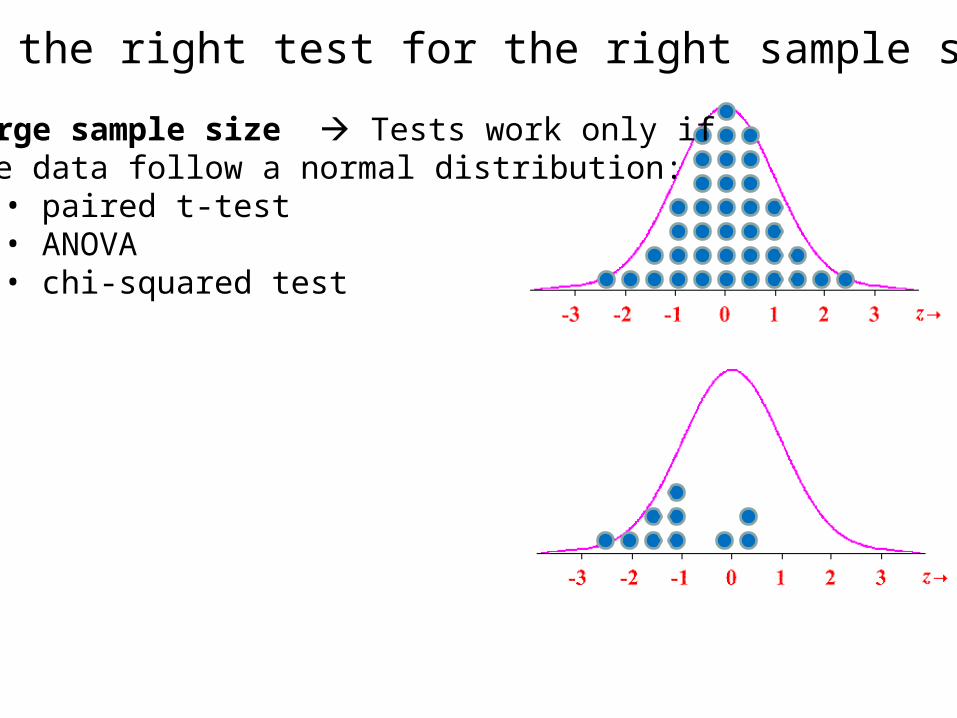
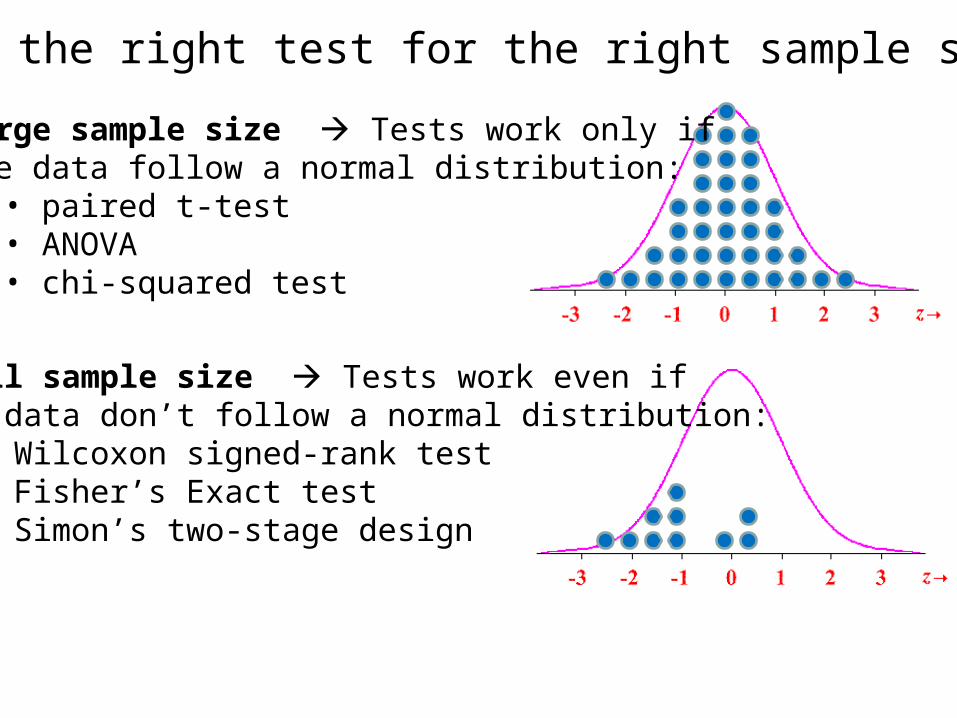
Large sample size Tests work only if the data follow a normal distribution:
• paired t-test• ANOVA• chi-squared test
Pick the right test for the right sample size
Large sample size Tests work only if the data follow a normal distribution:
• paired t-test• ANOVA• chi-squared test
Small sample size Tests work even if the data don’t follow a normal distribution:
• Wilcoxon signed-rank test• Fisher’s Exact test• Simon’s two-stage design
Post-hoc power Post-hoc power calculationscalculations
No consensus No consensus on this in the literatureon this in the literature• Yes, it’s OK to retrospectively calculate power Yes, it’s OK to retrospectively calculate power
• if assumptions made during study design turn out if assumptions made during study design turn out to be untrueto be untrue
• if study enrollment stops before planned accrual if study enrollment stops before planned accrual goalgoal
• No, there is no benefit to recalculating powerNo, there is no benefit to recalculating power• Power is inherently prospectivePower is inherently prospective• Once the study is completed, power calculations Once the study is completed, power calculations
do not inform us in any way as to the conclusions do not inform us in any way as to the conclusions of the present study (re-expression of p-value)of the present study (re-expression of p-value)
PrecisonPrecison
Precision is another approach to Precision is another approach to sample size justificationsample size justification..
• Precision is the way we Precision is the way we quantify quantify how accurate the observed how accurate the observed endpoint isendpoint is::• Width of a confidence intervalWidth of a confidence interval• Larger sample size Larger sample size narrower narrower
confidence intervalconfidence interval
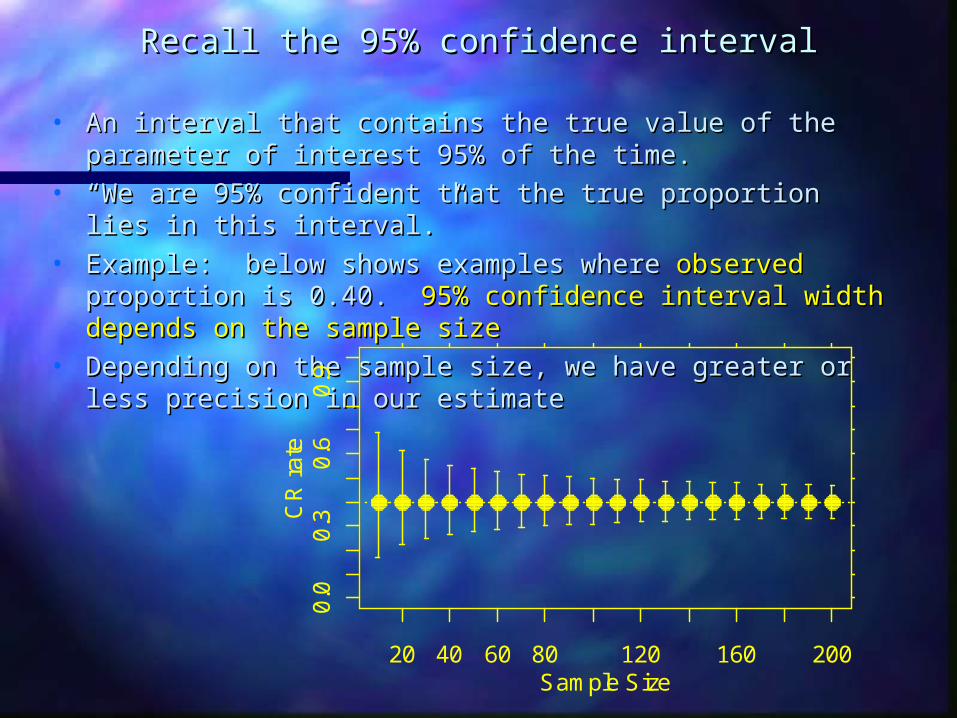
Recall the 95% confidence intervalRecall the 95% confidence interval
• An interval that contains the true value of the parameter of An interval that contains the true value of the parameter of interest 95% of the time.interest 95% of the time.
• ““We are 95% confident that the true proportion lies in this We are 95% confident that the true proportion lies in this interval.” interval.”
• Example: below shows examples where Example: below shows examples where observedobserved proportion is 0.40. proportion is 0.40. 95% confidence interval width depends 95% confidence interval width depends on the sample sizeon the sample size
• Depending on the sample size, we have greater or less Depending on the sample size, we have greater or less precision in our estimateprecision in our estimate
20 40 60 80 120 160 200
0.0
0.3
0.6
0.9
Sample Size
CR
ra
te
Power CalculationsPower Calculations
• Why are they necessary? Why are they necessary? • For the For the integrity of the studyintegrity of the study: :
publication of publication of convincing resultsconvincing results• As a part of As a part of thoughtful study designthoughtful study design: :
Power is the central elementPower is the central element• Because your Because your grant won’t get past grant won’t get past
the peer-review statistician the peer-review statistician without without themthem
POPULATION RESEARCH SEMINAR SERIES Sponsored by the Statistics and Survey Methods Core of the U54 Partnership
Questions? Comments?Type them in or ask over your
webcam/microphone
Or send an email to