Embed Size (px)
Citation preview
Port % " ^h of Seattle %
^O
EAST WATERWAY OPERABLE UNIT
SUPPLEMENTAL REMEDIAL INVESTIGATION/
FEASIBILITY STUDY
FINAL SEDIMENT TRANSPORT EVALUATION APPROACH
MEMORANDUM
For submittal to
The U.S. Environmental Protection Agency Region 10 Seattle, WA
December 2008
Prepared by
Xf- ANCHOR Baireiie ^ / k = ^ E N V I R O N M E N T A L , L . L . C
Seattle Research Center 1423 3rd Avenue • Suite 300 1100 Dexter Avenue N. • Suite 400 Seattle, Washington • 98101 Seattle, WA« 98109
KPFF Consulting Engineers Coast and Harbor Engineering
USEPA SF
1307331

Executive Summary
EXECUTIVE SUMMARY
The Sediment Transport Evaluation Approach Memorandum (STEAM) outlines various
modeling approaches and selects a preferred approach to evaluate and characterize sediment
transport physical processes within the East Waterway (EW). The focus of the STEAM is to
present an approach to evaluate hydrodynamics and sediment transport physical processes in
relation to solids transport and to identify the data needs necessary to evaluate sediment
transport processes in the EW.
The STEAM identifies the preferred Sediment Transport Evaluation (STE) approach to address
sediment transport physical processes within the EW. There are two main components to
evaluating sediment transport within the EW: 1) sediment transport due to natural processes,
including lateral solids loads (solids entering the EW from combined sewer overflows [CSOs]
and storm drains), and 2) sediment transport due to vessel-induced hydrodynamic effects.
Several modeling approaches were considered for evaluating sediment transport from natural
processes. These approaches included using mass balance calculations, using a screening-level
model, and using a physics-based modeling approach that included three variations of model
grid resolution (coarse, moderate, and fine). The physics-based modeling approach was based
on the existing Lower Duwamish Waterway (LDW) Environmental Fluid Dynamics Code
(EFDC) model (QEA 2007). Following discussions between the East Waterway Group (EWG)
and U.S. Environmental Protection Agency (EPA), a preferred approach was selected. The
preferred approach combines using physics-based modeling with moderate grid resolution to
evaluate hydrodynamics and erosion potential, using measured sediment transport characteristics
to inform sediment transport rates, and localized modeling to assess recontamination potential.
Existing hydrodynamic and sediment transport information that was compiled in the Existing
Information Summary Report (EISR; Anchor and Windward 2008a) was evaluated to assess its
applicability for use in the preferred approach for natural processes. Data needs included
bathymetry, salinity and temperature profiles, velocity profiles, and net sedimentation data. An
important component of the natural processes preferred approach will be to incorporate lateral
solids loads from EW CSOs and storm drains. Additional data will be collected to support
hydrodynamic and sediment data gaps for CSOs and storm drains. These data will be
identified in the Initial Source Screening and Data Gaps Memorandum, to be completed as part
of the Source Control Evaluation process.
Final Sediment Transport Evaluation Approach Memorandum h ^ December 2008 East Waterway Operable Unit i ^ ' 060003-01

Executive Summary
The second main component of the STE is evaluating vessel-induced hydrodynamic effects.
The modeling approach included addressing propeller wash (propwash), pressure fields from
passing vessels, and vessel-generated wake impacts. Pressure fields and vessel wakes are not
expected to be a significant factor in EW sediment transport processes; however, propwash is
expected to have a significant effect, and will be important to consider during the Feasibility
Study (FS) review of various remedial alternatives, including monitored natural recovery
(MNR) and cap stability evaluations.
The information presented in the STEAM is closely linked to and relies in part on the Physical
Processes Conceptual Site Model (CSM) presented in the CSM and Data Gaps Analysis Report
(Anchor, Windward and Batteile 2008). In that report, the Physical Processes CSM description
synthesizes what is currently known about important hydrodynamic and physical processes
within the EW, focusing specifically on the processes that govern sediment transport within the
waterway. The Physical Processes CSM will serve to inform subsequent steps in the
Supplemental Remedial Investigation and Feasibility Study (SRI/FS), including investigation of
the nature and extent of contamination, recontamination potential, and feasibility of remedial
alternatives.
The STE results will be summarized in the Sediment Transport Evaluation Report and the
results will be used to help refine the Physical Processes CSM. As part of the FS Report, the
sediment transport processes will be integrated with Source Control Evaluation work in order
to assess sediment recontamination potential. Following EPA review and approval of the
STEAM, the evaluation steps listed below are anticipated:
• Establish STE workgroup and develop detailed STE modeling methodology with
workgroup input
• Develop field sampling program (i.e.. Quality Assurance Project Plans [QAPPs]) to fill LJ the data needs
• Conduct field-sampling investigations after review and approval of the STE QAPPs by EPA
• Develop and run the STE models based on the approved STE modeling methodology plan
• Prepare Sediment Transport Evaluation Report
• Refine Physical Processes CSM in the SRI Report
• Integrate STE results with Source Control Evaluation results to assess recontamination
potential in the FS Report
Final Sediment Transport Evalimtion Approach Memorandum <. y^ December 2008 East Waterway Operable Unit ii ' 060003-01
c

I
Table of Contents
EXECUTIVE SUMMARY
1 INTRODUCTION 1 1.1 Overview 1 1.2 Purpose of the Sediment Transport Evaluation 1 1.3 Sediment Transport Evaluation Process 4 1.4 Physical Setting of the East Waterway 5
2 DISCUSSION OF EXISTING INFORMATION 8 2.1 Green River Flow and Elliott Bay Tidal Data 8 2.2 Velocity Data 9
2.2.1 King County Water Quality Analysis Study 9 2.2.2 Harbor Island RI Study 11
2.3 Sedimentation Rate Data 12 2.4 Sediment Transport Data 15 2.5 Bathymetric Data 15 2.6 Hydrodynamic and Sediment Transport Modeling 16 2.7 Estimation of Lateral Solids Loadings within the East Waterway 16 2.8 Propwash, Hydrodynamic Pressure Fields, and Vessel Wakes 17 2.9 Suitability of Data for Use in East Waterway Sediment Transport Evaluation 17 2.10 Current Understanding of Sediment Transport in the East Waterway 18
2.10.1 Natural Sediment Transport Processes 19 2.10.2 Vessel-induced Hydrodynamic Effects 20
3 . SEDIMENT TRANSPORT EVALUATION MODELING APPROACH SELECTION AND DATA NEEDS DETERMINATION 23
3.1 Relevant Sediment Transport Processes in the East Waterway 24 3.1.1 Hydrodynamics 24 3.1.2 Sediment Transport and Sedimentation 25 3.1.3 Bed Sediment 25 3.1.4 Time and Spatial Scales of Sediment Transport Processes 26
3.2 Sediment Transport Modeling Approaches For Natural Processes 26 3.2.1 Single-Box Mass Balance Calculation Approach 29 3.2.2 Two-Layer Screening-Level Modeling Approach 29 3.2.3 Physics-Based Modeling Approach - Existing/Coarse Grid Resolution in the EW. 30 3.2.4 Physics-Based Modeling Approach - Moderate Grid Resolution in the EW 32 3.2.5 Physics-Based Modeling Approach - Fine Grid Resolution in the EW 33
3.3 Data Requirements of the Natural Processes Modeling Approaches 33 3.4 Preferred Approach 36 3.5 Data Gaps Evaluation for Preferred Approach 40
3.5.1 Review of Existing Information for Natural Processes Preferred Approach 40 3.5.2 Data Needs Identification 42
3.6 Sediment Transport from Vessel-induced Hydrodynamic Effects Modeling Approach45
Final Sediment Transport Evalimtion Approach Memorandum * ^ December 2008 East Watenvay Operable Unit iii ' 060003-01

cTable of Contents
3.6.1 Propwash Modeling 45 c 3.6.2 Pressure Field Modeling 48 3.6.3 Vessel Wake Modeling 49 3.6.4 Monte Carlo Simulations 50
4 NEXT STEPS AND FUTURE DELIVERABLES 52 c 5 REFERENCES 53
List of Tables
Table 2-1 ADP Velocity Profile Measurement Station and Period 10 Table 2-2 Net Sedimentation Rates at the East Waterway Stations from the
Harbor Island RI (HISWG 1996) 13 Table 2-3 Gross Sedimentation Rates at the East Waterway Stations from the
Harbor Island RI (HISWG 1996) 14 Table 3-1 Advantages and Limitations of the Modeling Approaches for c
Natural Processes 28 Table 3-2 Summary of Data Required for the Various Sediment Transport |
Evaluation Modeling Approaches 35 Table 3-3 Available Data for Natural Processes Preferred Approach 41 p Table 3-4 Summary of Data Needs for Natural Processes Preferred Approach 43 ! Table 3-5 Vessel and Propulsion Data Requirements for Main Propulsion
and Thrusters 47
c List of Figures
Figure 1-1 Vicinity Map and East Waterway SRI/FS Boundary c Figure 1-2 Major East Waterway Features Figure 1-3A Existing Bathymetry Figure 1-3B Existing Bathymetry c Figure 2-1 River Flow at USGS Auburn and Tukwila Gauge Stations Figure 2-2 Velocity and NOAA Tide Measurement Stations cFigure 2-3 Tide Elevation During ADP Measurement Periods Figure 2-4 Sediment Sampling Locations in the East Waterway from the Harbor Island RI j Figure 2-5 Cesium-137 and PCB Profiles from the East Waterway used for Dating and LJ
Estimation of Sedimentation Rates Figure 2-6 Mudline Elevation Profile along the Centerline of the East Waterway j Figure 3-1 Probability of Stability of Capping Material based on Monte Carlo Simulations
c
Final Sediment Transport Evalimtion Approach Memorandum h 5^ December 2008 East Waterway Operable Unit iv ^ " 060003-01 c

Acronyms and Abbreviations
1~D one-dimensional
2-D two-dimensional
3-D three-dimensional
ADP Acoustic Doppler Profiler
Anchor Anchor Environmental, L.L.C.
ASAOC Administrative Settlement Agreement and Order on Consent
CERCLA Comprehensive Environmental Response, Compensation and Liability Act
City City of Seattle
County King County
Cs-137 Cesium-137
CSM Conceptual Site Model
CSO combined sewer overflow
CSTR Continually Stirred Tank Reactor
DWEB Duwamish Waterway-Elliott Bay
EFDC Environmental Fluid Dynamics Code
EISR Existing Information Summary Report
EPA U.S. Environmental Protection Agency
ERA Ecological Risk Assessment
EW East Waterway
EWG East Waterway Group (Port of Seattle, City of Seattle, and King County)
FS Feasibility Study
HHRA Human Health Risk Assessment
HISWG Harbor Island Sediment Work Group
LDW Lower Duwamish Waterway
LDWG Lower Duwamish Waterway Group
MHW mean high water
MHHW mean higher high water
MLW mean low water
MLLW mean lower low water
MNR monitored natural recovery
MTL mean tide level
NAVD North American Vertical Datum
NOAA National Oceanic and Atmospheric Administration
Final Sediment Transport Evaluation Approach Memorandum December 2008 ^ East Waterway Operable Unit v 060003-01

c [
Acronyms and Abbreviations
OU
Pb-210
PCB
Port
QAPP
RI
RM
ROD
SCEAM
SOW
SRI/FS
STA
STE
STEAM
TOC
TSS
U&A
USCG
USGS
WASP
WQA
WW
Operable Unit
Lead-210 [polychlorinated biphenyl
Port of Seattle
Quality Assurance Project Plan c remedial investigation
River Mile c Record of Decision
Source Control Evaluation Approach Memorandum c Statement of Work
Supplemental Remedial Investigation/Feasibility Study c Sediment Transport Analysis approach
Sediment Transport Evaluation c Sediment Transport Evaluation Approach Memorandum
total organic carbon c total suspended solids
Usual and Accustomed c U.S. Coast Guard
U.S. Geological Survey
Water Quality Analysis Simulation Program
King County Water Quality Assessment (King County 1999)
West Waterway [
c c c c c c
Final Sediment Transport Evaluation Approach Memorandum December 2008 '<£ [East Waterway Operable Unit vi 060003-01

1
Introduction
INTRODUCTION
1.1 Overview
The U.S. Environmental Protection Agency (EPA) has ordered the Port of Seattle (Port) to
conduct a Supplemental Remedial Investigation/Feasibility Study (SRI/FS) for the East
Waterway (EW) Operable Unit (OU) of the Harbor Island Superfund Site per the process
defined by the Comprehensive Environmental Response, Compensation, and Liability Act
(CERCLA), or Superfund. The SRI/FS will ultimately lead to an EPA Record of Decision
(ROD) outlining cleanup actions to address threats to human health and the environment in
the EW.
The Sediment Transport Evaluation Approach Memorandum (STEAM) is a required
deliverable set forth in the SRI/FS Workplan (Workplan; Anchor and Windward 2007),
prepared in response to the Administrative Settlement Agreement and Order on Consent
(ASAOC) and Statement of Work (SOW) (EPA 2006).
The objective of the STEAM is to outline a plan to evaluate and characterize sediment
transport dynamics within the EW. The STEAM includes a description of objectives, an
analysis of existing information, a proposed strategy and modeling approach for the
Sediment Transport Evaluation (STE), and a discussion of the STEAM'S relationship to the
overall SRI/FS process for the EW.
1.2 Purpose of the Sediment Transport Evaluation
The primary purpose of the STEAM is to describe how the sediment transport dynamics
within the EW will be characterized for the SRI/FS, and how this work will be coordinated
with other SRI/FS activities described in the Workplan (Anchor and Windward 2007).
The Workplan (Anchor and Windward 2007) provides the guidelines and objectives for
conducting the STE. Because the EW receives flows from the Lower Duwamish Waterway
(LDW), and the southern boundary of the EW OU is identical to the northern boundary of
the LDW Superfund Site at the EW, the STE will be largely based on the approach used to
evaluate sediment transport in the LDW for the analysis conducted as part of the LDW
RI/FS evaluation (Windward and QEA 2008; QEA 2007). The hydrodynamic model used for
the LDW sediment transport analysis includes the EW as part of its model grid.
Final Sediment Transport Evaluation Approach Memorandum i. ^ December 2008 East Waterway Operable Unit 1 ^ ' 060003-01

Introduction
As stated in the Workplan, the objectives of the STE are as follows:
1. Identify and evaluate the primary sources of sediment to EW
2. Identify temporal and spatial patterns of sediment erosion and deposition (if
applicable)
3. Identify the physical processes driving sediment transport
4. Identify likely routes or pathways for sediment movement
5. Assess how sediment transport pathways may affect the feasibility of remedial
alternatives, including monitored natural recovery (MNR), enhanced natural
recovery, dredging, and isolation capping
6. Assess potential for physical processes to contribute to recontamination
The STE will be conducted using information described in the Existing Information
Summary Report (EISR; Anchor and Windward 2008a) and new information obtained
through the STE preferred approach discussed in this document. The STE will be
summarized in a Sediment Transport Evaluation Report, as described in the Workplan
(Anchor and Windward 2007),.and will be used to refine the Physical Processes Conceptual
Site Model (CSM) presented in the CSM and Data Gaps Analysis Report (Anchor,
Windward and Batteile 2008). The Physical Processes CSM will be refined in the SRI Report,
and the SRI will also merge the STE and Source Control Evaluation. The FS will assess
recontamination potential. The STEAM and the Sediment Transport Evaluation Report will
focus only on the physical processes associated with transport of sediment. Source control
issues will be evaluated in a separate evaluation as described in the Source Control
Evaluation Approach Memorandum (SCEAM) (Anchor and Windward 2008b).
L J
As described in the SCEAM, information on lateral solids inputs from combined sewer
overflows (CSOs) and storm drains will be developed as part of the Source Control
Evaluation. The STE will incorporate lateral solids inputs in development of the
hydrodynamic and sediment transport model. The SRI Report will integrate the results of \_j
the STE and Source Control Evaluation work, along with the results of the risk assessments
and other SRI activities. The FS Report will evaluate the risk of recontamination by ,_j
integrating the findings of the Source Control Evaluation and other SRI activities.
Final Sediment Transport Evaluation Approach Memorandum i, ^ December 2008 East Waterway Operable Unit 2 ^ * 060003-01
C

Introduction
The focus of the STEAM is to present an approach to evaluate hydrodynamics and sediment
transport dynamics in relation to solids transport and to identify data needs necessary to
evaluate sediment transport processes in the EW. The STEAM discusses the selection of the
modeling approach to be used in the STE. The information presented in the STEAM is
closely linked to and relies in part on the Physical Processes CSM presented in the CSM and
Data Gaps Analysis Report (Anchor, Windward and Batteile 2008). In that report, the
Physical Processes CSM description synthesizes what is currently known about important
hydrodynamic and physical processes within the EW, focusing specifically on the processes
that govern sediment transport within the waterway. Data and information presented in
the EISR (Anchor and Windward 2008a) was used to develop the Physical Processes CSM
and will be used to develop the Ecological Risk Assessment (ERA) and Human Health Risk
Assessment (HHRA) CSMs. The Physical Processes CSM will also inform subsequent steps
in the SRI/FS and design process, including investigation of the nature and extent of
contamination, recontamination potential, and feasibility of remedial alternatives.
As discussed in the Workplan (Anchor and Windward 2007), the STEAM identifies data
needs necessary to evaluate sediment transport processes, primarily through a modeling
approach, and to also help refine the Physical Processes CSM. As part of the data gaps
evaluation identification in the STEAM, specific data needed to carry out the preferred STE
modeling approach are identified. The preferred approach is designed to improve the
understanding of the sediment transport dynamics necessary to support the refinement of
the Physical Processes CSM, determine the potential mechanisms that redistribute
sediments, map areas that may be prone to accumulation or loss of sediment, and identify
potential pathways of sediment movement away from potential contaminant sources.
This STEAM is being completed as a stand-alone submittal to expedite completing the data
gaps analysis and initiate Quality Assurance Project Plans (QAPPs) to collect needed data.
Detailed study designs to fill these data gaps will be presented in separate QAPPs, as
outlined in the Workplan (Anchor and Windward 2007).
Additional data needs will also be identified in the Initial Source Screening and Data Gaps
Memorandum as part of the Source Control Evaluation process. The SCEAM (Anchor and
Windward 2008b) describes an approach for evaluating potential contaminant sources to the
Final Sediment Transport Evaluation Approach Menwrandum i. "^ December 2008 East Waterway Operable Unit 3 ^ - ' 060003-01

Introduction
EW, including the objectives and approach of source control integration into the SRI/FS.
Potential sources of contamination to EW sediment are identified in Section 5 of the EISR
(Anchor and Windward 2008a) and may include CSO discharges, stormwater discharges,
overwater uses and spills, industrial wastewater discharges, nearshore cleanup sites, and
atmospheric deposition.
1.3 Sediment Transport Evaluation Process
The East Waterway Group (EWG) anticipates that the STE will be an iterative process
between EWG and EPA. This Memorandum presents a preferred evaluation approach, and
EWG recognizes that the evaluation approach may need to be refined as EWG works with
EPA to approve model selection and methodology, key modeling parameters, evaluation
assumptions, and subsequent evaluation steps. It is important to note that the preferred
approach does have risks associated with meeting the original Workplan schedule (Anchor
and Windward 2007), primarily due to potential for changes to the analysis based on
Agency input. However, EWG considers the preferred approach to be the approach that
most closely meets the selection criteria (Section 3.4). Following EPA review and approval
of the STEAM, the evaluation steps listed below are anticipated:
• Establish STE workgroup. This workgroup will consist of EWG members and EPA
representatives, and will provide technical input to the modeling approach and
other sediment transport evaluation approaches during the STE. The workgroup
will also coordinate with the ongoing work for LDW sediment transport evaluation.
Workgroup recommendations (e.g., recommendations for key modeling parameters
and assumptions) will be documented and provided to EPA.
. Develop field sampling program to fill the data needs. The STEAM identifies key
data needs to complete the STE. QAPPs will be prepared to address STE data needs
and will include details of how the sediment transport data needs will be filled.
• Conduct field-sampling investigations after review and approval of the STE
QAPPs by EPA.
• Develop and run the STE models based on the approved STE modeling
methodology plan. Conduct additional sediment transport evaluations as needed to
support refining the Physical Processes CSM.
c
c c p
i-J
rn
Ll
Final Sediment Transport Evaluation Approach Memorandum * '^ December 2008 East Watenvay Operable Unit 4 ^ ~ ' 060003-01

Introduction
. Prepare Sediment Transport Evaluation Report This report will provide the results
of the sediment transport modeling efforts and any additional evaluations of
sediment transport processes.
• Refine Physical Processes CSM in the SRI Report. The Physical Processes CSM
will be refined in the SRI Report based on additional sediment transport and
hydrodynamic data collected during field sampling. The results of the STE
modeling efforts will also be used to refine the Physical Processes CSM.
• Integrate STE results with Source Control Evaluation results to assess
recontamination potential. This integration includes sources of contamination from
upstream sources, as well as from lateral solids loads. The evaluation of
recontamination potential will be included in the FS Report.
The results of all SRI tasks, including sediment transport and source control evaluation, will
be combined and synthesized in the SRI Report. The FS Report wiU incorporate results of
the STE that contribute to evaluating the feasibility of remedial alternatives, including MNR,
enhanced natural recovery, dredging, and isolation capping.
1.4 Physical Setting of the East Waterway
This section presents an overview of the physical site characteristics pertinent to the
development of the STE. Additional detailed information on the environmental setting of
the EW is presented in Section 2 of the EISR (Anchor and Windward 2008a), including
habitat and biological conditions (EISR Section 2.3) and human use characteristics (EISR
Section 2.4). Section 1 of the EISR also presents a detailed site history of the EW and
surrounding areas.
The EW is located approximately 1 mile southwest of downtown Seattle, in King County,
Washington. It is part of the greater Duwamish River estuary, which includes the
freshwater/salt water interface extending as far as 10 miles upstream. The Duwamish River
drains approximately 362,000 acres, flowing northward to its terminus in Puget Sound at
Elliott Bay. Near the mouth of the Duwamish River at River Mile (RM) 0, the northward
flowing river splits into the EW and the West Waterway (WW), surrounding Harbor Island.
The EW and WW extend from the southern end of Harbor Island to the island's north end at
Elliott Bay (Figure 1-1). The EW runs along the eastern shore of Harbor Island. The EW OU
Final Sediment Transport Evaluation Approach Memorandum >, y^ December 2008 East Waterway Operable Unit " 5 * 060003-01

Introduction
is immediately downstream from the LDW Superfund Site. Proposed northern and
southem study area boundaries for the EW OU are shown on Figure 1-1. The extent of the
LDW model is from the mouth of Elliott Bay (approximately the line between Alki Point
and Magnolia Bluff) to the Tukwila Gauge on the Green River. It is expected that the
hydrodynamic model for the EW will also need to encompass this same domain so that
hydrodynamic conditions in the interior of the model can be properly represented. The east
and west boundaries of the EW OU are defined by mean higher high water (MHHW), as
shown in Figure 1-2.
The former Duwamish River channel and surrounding floodplains were filled and graded
to form the present day topography. Dredging in 1903 to 1905 created the EW and WW,
and dredged material from the river was used to create Harbor Island (Weston 1993).
The EW is approximately 7,100 feet long and 750 feet wide (for most of its length). It is
channelized and has a south-to-north orientation. The southern 1,700-foot section of the EW L J
varies in width from 250 feet north of the Spokane Street corridor and beneath the bridges to
approximately 150 feet south of the bridges (see Figure 1-2). The mudline elevation of the
EW varies from approximately -40 to -60 feet mean lower low water (MLLW) in the 750
foot-wide portion of the waterway (Figures 1-3A and 1-3B). Mudline elevations increase to
between -13 and -6 feet MLLW in the vicinity of Spokane Street and the West Seattle Bridge. L J
However, besides water depth soundings in the EW south of the Spokane Street corridor
conducted for Nautical Chart #18450 (NOAA 2004), no detailed bathymetry exists in the
vicinity of the Spokane Street corridor and south of the Spokane Street corridor (DEA 2003).
The shallow water depths associated with this "sill" along the Spokane Street corridor form c a physical constriction that causes the Duwamish River to primarily flow through the WW. p
The presence of the bridges along the Spokane Street corridor also prohibits any type of boat Li
passage, except at low tide by smaU, shallow-draft boats (e.g., kayaks and skiffs). ^
J The highly developed shoreline within the EW is primarily composed of piers, riprap,
constructed seawalls, and bulkheads for industrial and conrmercial use (Anchor and _j
Windward 2008a). In addition, three CSOs and 39 storm drains are present along the EW
that contribute freshwater and solids to the waterway (Figure 1-2). ,
Final Sediment Transport Evaluation Approach Memorandum * y^ December 2008 East Waterway Operable Unit 6 ^ 060003-01 [^
_l

Introduction
The EW, north of the Spokane Street corridor, experiences regular vessel traffic of various
sizes and types. Container ships call at Terminals 18 (T-18), 25 (T-25), and 30 (T-30). Cruise
ships currently call at T-30, however, cruise ships are planned to be moved to Pier 91 in 2009
(previously identified as 2008 in the EISR). U.S. Coast Guard (USCG) vessels are based at
Pier 36. The EW also has significant tug and barge traffic. The EW is part of the Tribal
Usual and Accustomed (U&A) fishing areas for the Muckleshoot and Suquamish Tribes and
is extensively utilized for gill net fishing for salmon. There is recreational use of the EW at
the public park adjacent to Slip 36. The public fishing pier at the head of the EW at the
Spokane Street Bridge was identified as a popular harvest area within Elliott Bay in a King
County 1999 creel survey (King County 1999). South of the Spokane Street corridor, the
Harbor Island Marina is located on the southem tip of Harbor Island and is used by
recreational and commercial boats from the LDW. Also present south of the Spokane Street
corridor, a 750-fobt dock along Harbor Island is used for commercial moorage.
Final Sediment Transport Evalimtion Approach Memorandum h ^ December 2008 East Waterway Operable Unit 7 ^ ~ ' 060003-01
Discussion of Existing Information
2 DISCUSSION OF EXISTING INFORMATION
The EISR (Anchor and Windward 2008a) identified the available data that pertains to the EW.
For the sediment transport aspects of the EISR, these data included measurements of river flow,
tidal elevations, current velocity, sedimentation rates, bathymetry, and studies of sediment
transport in the LDW and Elliott Bay. These data are discussed in greater detail in the following
subsections, followed by an evaluation of the suitability of the data for use in the STE. This
section also includes a brief discussion of the current understanding of the sediment transport
dynamics in the EW, which is summarized in greater detail in the Physical Processes CSM
(Anchor, Windward and Batteile 2008).
2.1 Green River Flow and Elliott Bay Tidal Data
The EW receives freshwater flows from the Green/Duwamish River watershed. The Green
River flow is recorded at the U.S. Geological Survey (USGS) gauge (Station 1213000) at
Auburn at RM 32. The Green River basin has 399 square miles (640 acres) of drainage area.
The river flow has been regulated by the Howard Hanson Dam that was constructed at RM
64.5 in 1961 (USACE 2005). After dam regulation, the daily peak flow rate was reduced
below 12,000 cubic feet per second (cfs).
The river flow time-series corresponding to the available velocity measurement period (see
Section 2.2) is plotted in Figure 2-1. The general characteristic of flow showed high peak
flow during the wet season (winter through spring) and low flow during the dry season
(summer). The minimum river flow for 1996 was 248 cfs, whereas the winter of 1997 had a
daily peak flow of 11,600 cfs. The peak flow (measured to date) from Howard Hanson Dam
is 12,000 cfs (see Figure 2-1). For the erosion potential analyses in the LDW, the peak flow
was assumed to occur for a 1-week period. At the Tukwila gauge (USGS Station 12113350)
on the Green River, (downstream of the Auburn gauge), the annual flow is only slightly
higher than at the Auburn gauge. The seasonal flow variation is expected to affect the
hydrodynamic characteristics of the entire river system to its mouth, including the LDW
and the EW.
Both the EW and the LDW are tidally influenced. This influence extends as far as 10 miles
upstream. Tidal data are available from the nearby National Oceanic and Atmospheric
Administration (NOAA) Seattle station (9447130), located approximately 0.65 miles north of
Final Sediment Transport Evaluation Approach Memorandum > ^ December 2008 East Waterway Operable Unit 8 ^ ' 060003-01

Discussion of Existing Information
the northern end of the EW (shown in Figure 2-2). Tidal statistics referenced to feet MLLW
for this station are summarized below.
. MHHW: 11.34
.
.
.
.
.
Mean high water (MHW): 10.48
Mean tide level (MTL): 6.66
Mean low water (MLW): 2.83
North American Vertical Datiim 88 (NAVD88): 2.51
MLLW: 0.00
r i
p
-^
p
The time-series plots of tide elevation at Seattle in 2007 are presented in Figure 2-3,
including periods from 1995 and 1997, which correspond to velocity measurement periods.
As is characteristic of Puget Sound, tides are semi-diurnal. Mean tidal range, measured
from MHW to MLW, and .diurnal range, measured from MHHW to MLLW are 7.66 feet
(2.33 meters) and 11.36 feet (3.46 meters), respectively. The maximum and minimum water
levels recorded are +14.52 feet (4.43 meters) and -5.00 feet (-1.52 meters) MLLW,
respectively. f— '
2.2 Velocity Data
Two sets of velocity data from the EW are available, as identified in the EISR (Anchor and
Windward 2008a). These included Acoustic Doppler Profilers (ADP) data (King County
1999) and S4 current meter data collected for the Harbor Island RI (HISWG 1996). These
data are discussed in the following sections.
i
~
2.2.1 King County Water Quality Analysis Study
ADP measurements were made at several stations along the Duwamish River and Elliott
Bay during 1996 to 1997, as a component of the Water Quality Analysis (WQA) study for
the Duwamish Waterway-EllioH: Bay (DWEB) (King County 1999). The data collection
activities consisted of two separate, continuous measurements during 1996 and 1997.
However, some data were missing due to instrument failure and other reasons. During
the WQA study, velocities were measured at several locations but included only one EW
station (EWW), located south of the Spokane Street Bridge (Figures 2-2 and 2-4). Besides
the EWW station, the SBW station (located upstream in the LDW) and ARC station
(located in the WW) are included because the conditions there contribute to the
T
p
*—'
p
Li
P
Final Sediment Transport Evaluation Approach MemorandumEast Waterway Operable Unit 9
i. ^ ^ *
December 2008 060003-01
_ j
P
Discussion of Existing Information
understanding of the Duwamish River system and boundary conditions for the
altemative modeling approaches. The measurement periods at the stations in the
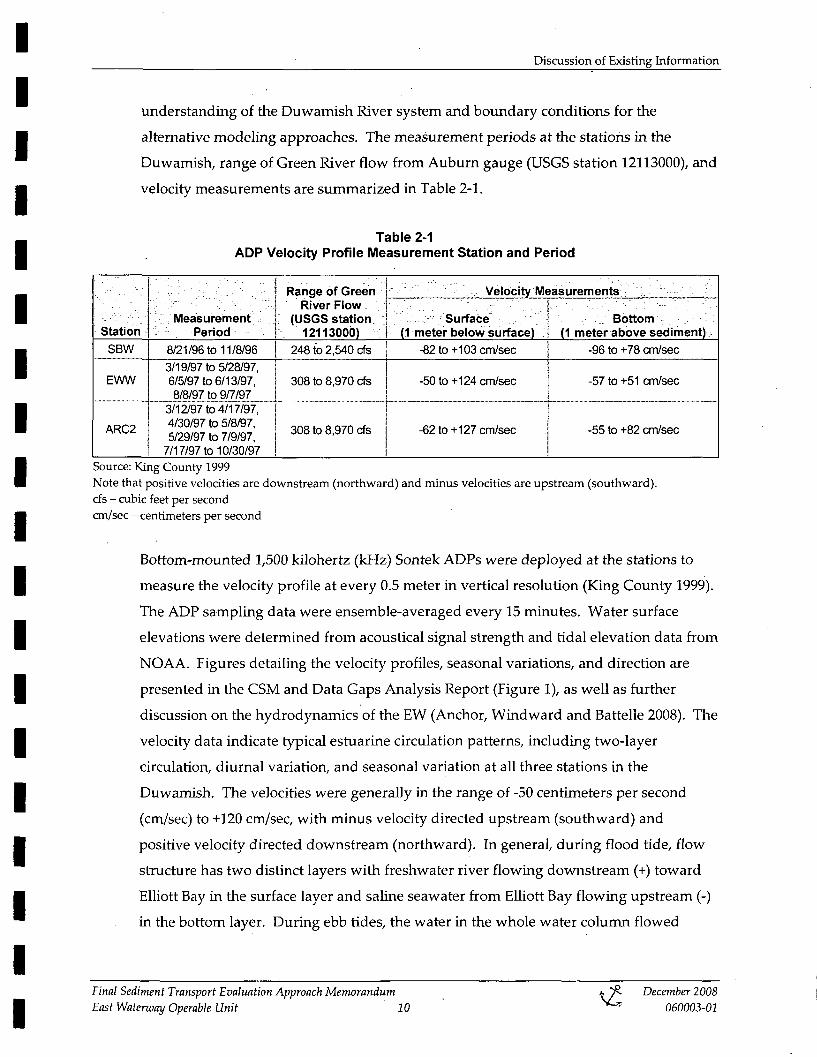
Duwamish, range of Green River flow from Aubum gauge (USGS station 12113000), and
velocity measurements are summarized in Table 2-1.
Table 2-1 ADP Velocity Profile Measurement Station and Period
Range of Green Velocity Measurements L River Flow
Measurement . (USGS station. Surface \ Bottom Station Period 12113000) (1 meter below surface) (1 meter above sediment)
SBW 8/21/96 to 11/8/96 248 to 2,540 cfs -82 to+103 cm/sec -96 to +78 cm/sec 3/19/97 to 5/28/97,
EWW 6/5/97 to 6/13/97, 308 to 8,970 cfs -50 to+124 cm/sec -57 to +51 cm/sec 8/8/97 to 9/7/97
3/12/97 to 4/17/97, 4/30/97 to 5/8/97, ARC2 308 to 8,970 cfs -62 to+127 cm/sec -55 to +82 cm/sec 5/29/97 to 7/9/97,
7/17/97 to 10/30/97 Source: King County 1999 Note that positive velocities are downstream (northward) and minus velocities are upstream (southward). cfs - cubic feet per second cm/sec - centimeters per second
Bottom-mounted 1,500 kilohertz (kHz) Sontek ADPs were deployed at the stations to
measure the velocity profile at every 0.5 meter in vertical resolution (King County 1999).
The ADP sampling data were ensemble-averaged every 15 minutes. Water surface
elevations were determined from acoustical signal strength and tidal elevation data from
NOAA. Figures detailing the velocity profiles, seasonal variations, and direction are
presented in the CSM and Data Gaps Analysis Report (Figure 1), as well as further
discussion on the hydrodynamics of the EW (Anchor, Windward and Batteile 2008). The
velocity data indicate typical estuarine circulation patterns, including two-layer
circulation, diurnal variation, and seasonal variation at all three stations in the
Duwamish. The velocities were generally in the range of -50 centimeters per second
(cm/sec) to +120 cm/sec, with minus velocity directed upstream (southward) and
positive velocity directed downstream (northward). In general, during flood tide, flow
structure has two distinct layers with freshwater river flowing downstream (+) toward
Elliott Bay in the surface layer and saline seawater from Elliott Bay flowing upstream (-)
in the bottom layer. During ebb tides, the water in the whole water column flowed
Final Sediment Transport Evaluation Approach Memorandum December 2008 ^ East Watenvay Operable Unit 10 060003-01

Discussion of Existing Information
seaward toward Elliott Bay at the shallowest station (EWW station), but tended to retain
two-layer flow at the other stations (King County 1999).
Seasonal variations were also observed. During the wet season (high river flow), the
channel flow velocities, particularly in the surface layer, are significantly increased
proportional to river discharge. These are seaward flows maintained in the surface layer
over the tidal cycle. During the dry season (low river flow), seaward channel velocities
are significantly decreased due to the reduced river flow, and may only flow seaward
during ebb tides.
P
2.2.2 Harbor Island Rl Study
The Harbor Island RI Report described velocity data from stations HI-03 and HI-04
(Figure 2-4) that were collected from the main body of the EW (north of the Spokane
Street corridor) during 1996 (HISWG 1996). A summary of these data were presented in
Harbor Island Sediment Work Group (HISWG; 1996), but locating the raw data from
which the summaries were generated has so far been unsuccessful. These data are
summarized below, but additional analysis of these data may not be possible unless the
raw data are located.
The HISWG summarized that at the two stations within the EW (Figure 2-4), velocities
were measured approximately 1 meter above the sediment bed during the period March
27 through May 17,1995L The velocities averaged 2 to 2.5 cm/sec, with more than 99
percent of the velocities measuring less than 10 cm/sec and less than 0.01 percent of the
velocities measuring greater than 25 cm/sec (HISWG 1996). The velocities measuring
greater than 25 cm/sec were attributed to propwash (HISWG 1996) due to the relatively
short (burst) duration of the velocities measured in that range and the presence of ships
in the vicinity during the bursts. The net direction of flow at the measurement locations
was to the south, in alignment with the EW channel and indicating a net inflow near the
bottom. The highest measured velocities (maximums of 85 and 129 cm/sec at the two
stations) were attributed to ship passage.
H
p
LJ
p
L
„
[_|
,_j
1 During this period, the average daily fiow for the Green River was 1,010 cfs, the peak tidal
elevation was 11.76 feet MLLW, and the minimum tidal elevation was -3.07 feet MLLW.
Final Sediment Transport Evaluation Approach Memorandum >, y^ December 2008 East Watenvay Operable Unit 11 ^ * 060003-01

Discussion of Existing Information
2.3 Sedimentation Rate Data
Samples for sedimentation rate analyses were collected from the EW stations HI-03 and
HI-04 shown in Figure 2-4. Sedimentation rate data for the EW includes net sedimentation
measured from high-resolution sediment cores and gross sedimentation measured from
sediment traps in the water column (HISWG 1996). Both sedimentation rates are expressed
in terms of the thickness of sediment accumulated per unit time and in terms of the mass
accumulation (sediment mass per unit area per unit time). This section discusses the net
and gross sedimentation rate measurements. Net sedimentation rate is the accumulation
rate of sediment in the bed following deposition of sediment from the water column and
erosion of sediment from the bed. Gross sedimentation rate is the rate of deposition from
the water column due to the settling of sedunent particles.
Net sedimentation rates in the EW were estimated from the radioisotope and chemical
profile data. Cesium-137 (Cs-137), lead-210 (Pb-210), mercury, and polychlorinated
biphenyls (PCBs) were measured in all the high-resolution sediment cores. Cs-137 and PCB
profiles from the study are presented in Figure 2-5. According to HISWG (1996), mercury
data were influenced by numerous sources and were not used in the estimation of
sedimentation rates. The Pb-210 data were found to be uninterpretable and were not
analyzed further (HISWG 1996). Dating using the Cs-137 core data was based on both the
first appearance of Cs-127 in 1950 and the peak level in 1965. Because the source of Cs-137
was from atmospheric nuclear weapons testing, it is not continuously generated and
provided a suitable marker for estimating sedimentation rates. The PCBs in the sediment
cores were thought to originate from a single spill at Slip 1 in September 1974 (HISWG
1996). This large spill was also thought to provide a suitable marker for estimating
sedimentation rates. Note that the Lower Duwamish Waterway Group (LDWG) assigned
the year 1960 (the year of peak use) as the peak in PCB deposition for the determination of
net sedimentation rates at core collection locations away from Slip 1. However, for cores
near Slip 1, the year of the spill (1974) was assigned by LDWG as the peak date for PCB
deposition (Appendix F in Windward and QEA 2008).
The net sedimentation rates expressed in terms of depth and mass are given in Table 2-2 for
each of the markers and dates. The rates were estimated from the sediment depth where the
Final Sediment Transport Evaluation Approach Memorandum i. ^ December 2008 East Waterway Operable Unit 12 ^ ' 060003-01

[Discussion of Existing Information
[marker occurred in the sediment and the year at which the marker was placed. The year
during which each marker was placed is also indicated in Figure 2-5. [ Table 2-2
Net Sedimentation Rates at the East Waterway Stations from the Harbor Island Rl (HISWG 1996) c
Marker Station HI-03 Station HI-04 [Sedimentation Rate (cm/yr)
PCB 2.46 1.26 Cs-137
2.44 1.65 c(peak, 1965) Cs-137
n/a 1.56 (first appearance, 1950) Average ± SD c
2.45 ±0.012 1.49 ± 0.20
Mass Sedimentation Rate (g/cm^/yr)
PCB 1.52 0.91 c Cs-137
1.42 1.14 (peak, 1965) Cs-137
n/a 0.99 c(first appearance, 1950) Average ± SD
1.47 ±0.067 1.01 ±0.118 ccm/yr - centimeters per year Cs-137 - Cesium-137 g/cmVyr - grams per square centimeter per year n/a - no data are available c PCB - polychlorinated biphenyl SD - standard deviation c
The estimated net sedimentation rates for each station were computed as the average of the
measured net sedimentation rates for each marker. For station HI-03, in the middle of the c EW, the sedimentation rate was 2.45 centimeters per year (cm/yr), while at station HI-04,
just north of the Spokane Street corridor, the sedimentation rate was 1.49 cm/yr. These data c indicate a lower rate of net sedimentation at the south end of the EW (north of the sill) than
at the middle of the EW. c The gross sedimentation rates were measured using sediment traps that were deployed c 1 meter above the bottom at the same locations where the high-resolution sediment cores
were collected. The sediment traps were deployed over 31 to 96 days in 1995 during two crounds of sampling (Table 2-3), which is much shorter than the period over which net
[ Final Sediment Transport Evaluation Approach Memorandum December 2008
^ East Waterway Operable Unit 13 060003-01 c

Discussion of Existing Information
sedimentation occurred. The physical data (wet and dry weight) measured in the sediment
traps, other than percent solids and size fractions, were not reported in HISWG (1996).
Table 2-3 Gross Sedimentation Rates at the East Waterway Stations from the Harbor Island Rl (HISWG 1996)
: ; Length of ; : Gross: \ Gross Mass : Deployment Deployment Percent Sedimentation ' Sedimentation
Station Dates (days)^ i Solids Rate (cm/yr) : Rate (g/cm^/yr)
Round 1
Hl-ST-03 March 27 to May
16,1995 50 51.2 3.2 2.3
HI-ST-04 April 13 to May 17, 1995
31 49.4 7.8 5.3
Round 2
Hl-ST-03 n/a n/a n/a n/a n/a
HI-ST-04 May 17 to August 21,1995
96 49.4 6.6 4.5
cm/yr - centimeters per year g/cmVyr - grams per square centimeter per year n/a - deployed but no useable samples collected
During the Round 1 sampling, the gross sedimentation rate at station HI-ST-04 was
7.8 cm/yr, while the gross sedimentation rate at station Hl-ST-03 was 3.2 cm/yr (Table 2-3).
The gross mass sedimentation rate at HI-ST-04 was 5.3 grams per square centimeter per year
(g/cmVyr), and the rate at Hl-ST-03 was 2.3 g/cmVyr. The Round 2 rates at HI-ST-04 were
slightly lower than in Round 1. The Round 1 data indicate a higher rate of gross
sedimentation at the south end of the EW (north of the Spokane Street corridor) than at the
middle of the EW.
Also computed in the Harbor Island RI (HISWG 1996) were the mass resuspension rates,
which were computed as the difference between the gross and net sedimentation rates.
From the Round 1 gross sedimentation rate data, the calculated mass resuspension rates
were as follows:
. HI-03: 0.83g/cmVyr
. HI-04: 4.29g/cmVyr
These data indicate a higher rate of resuspension at the south end of the EW, north of the
sill, than at the middle of the EW. It is unknov^m what effect propwash and/or other vessel
induced hydrodynamic effects may have had on resuspension.
Final Sediment Transport Evaluation Approach Memorandum December 2008 ^ East Waterway Operable Unit 14 060003-01
Discussion of Existing Information
2.4 Sediment Transport Data
A study of net sediment transport was conducted by McLaren and Ren (1994) in the Elliott
Bay-Duwamish Waterway estuary system. The study collected samples from the top 10 to
15 cm of sediment from a gridded network of stations across Elliott Bay, the EW, the WW,
and the LDW. Statistical analyses of sediment size distribution in lines of cores samples
were conducted as an indicator of sediment transported from one grid point to another
(Note that sediment composition data are available from previous studies in the EW). This
study was presented in the EISR (Anchor and Windward 2008a) as part of the available
information concerning sediment dynamics and transport.
McLaren and Ren (1994) hypothesized that a circulation pattern generated during storm
periods produced currents capable of transporting sediment from Elliott Bay into the EW,
which was not consistent with some of the net circulation studies to date. Note that the
study estimates direction of sediment movement, but cannot determine the mass of
sediment movement. U
2.5 Bathymetric Data
Bathymetric data is important for understanding and predicting sediment transport
dynamics. Existing bathymetry in the EW is presented in Figures 1-3A and 1-3B. The
geometry of the system strongly influences the hydrodynamics by guiding the currents that
transport suspended sediments and influencing the current speed and sedimentation rates.
Relatively recent bathymetric surveys have been conducted in 2003 and 2005 in the EW
north of the Spokane Street corridor. There are limited bathymetric survey data under the
bridges or between the bridges and the junction with the LDW.
L J
LJ
P
The mudline profile along the centerline of the EW north of the Spokane Street corridor is
shown in Figure 2-6. However, no recent data are available south of the Spokane Street
corridor in the EW. The general elevation south of the Spokane Street corridor is shown on
N O A A char t #18450 as be ing approximate ly -20 feet MLLW ( N O A A 2004).
^
p
L-i
p
-J
Based on the elevation information and aerial photographs, the EW's configuration goes
from an approximately 150-foot-wide shallow section (sill) south of the Spokane Street
corridor, widens to an approximate 400-foot-wide narrow section (junction) under the
\_j
Final Sediment Transport Evaluation Approach MemorandumEast Waterway Operable Unit 15
* ^ ^ *
December 2008 060003-01 [^

Discussion of Existing Information
bridges, and to a much wider and deeper section north of the bridges (forming the main
body of the EW approximately 750 feet in width).
2.6 Hydrodynamic and Sediment Transport Modeling
The hydrodynamic and.sediment transport modeling studies for the LDW are currently in
draft form and in progress. The studies recently published in July 2007 for that modeling
program (Appendix G in Windward and QEA 2008; QEA 2007) report the sediment load
exiting from the LDW and entering the combined WW and EW for the 2-year, 10-year, and
100-year retum period flow events (Windward and QEA 2008) and over a 30-year analysis
period (QEA 2007). The reported sediment load exiting the LDW was not split between the
EW and WW, although the LDW hydrodynamic model extended into these waterways and
Elliott Bay with a coarser grid.
The EWG has requested the model from the LDWG and anticipates that the model will be
available for use in more detailed analyses of sediment dynamics and transport in the EW.
A brief overview of sedimentation results from the model is described below.
For the LDW over the 30-year simulation period, the estimated influx of sediment from the
Green River (RM 4.8) was 6,220,000 metric tons. The model-estimated transport
downstream from the LDW was 3,213,700 metric tons, which gives an overall trapping
efficiency of 49 percent for the LDW. Lateral solids loads accounted for 36,200 metric tons of
the sediment influx to the LDW, with 17,100 metric tons of the lateral solids load
transported downstream from the LDW. Of the sediment transported downstream from the
LDW over the 30-year period, 99 percent of the mass was derived from the Green River. For
the analysis of the high-flow event (100-year return period), 97 percent of the sediment from
the Green River was computed to be transported downstream of the LDW past RM 0.0; the
remainder was from bed and lateral sources. For the purposes of the STE, the time-series of
flows and sediment loads from the LDW model entering the EW are needed.
2.7 Estimation of Lateral Solids Loadings within the East Waterway
The SCEAM (Anchor and Windward 2008b) describes how potential sources of sediment
recontamination are to be evaluated. As described in that memorandum, current and
anticipated future solids loadings from storm drain and CSO discharges will be estimated.
Final Sediment Transport Evaluation Approach Memorandum i , ' ^ December 2008 East Waterway Operable Unit 16 • " 060003-01
Discussion of Existing Information
which are potentially relevant to the evaluation of sediment transport within the EW. This
information will be summarized in an Initial Source Screening and Data Gaps
Memorandum (per the SCEAM) that will be available for use in STE work. Information to
be developed that is potentially relevant to the STE includes the following:
• Estimated solids loadings from storm drains based on storm drainage basin sizes,
land use, particle size distribution and total suspended solids (TSS) data from
regional studies, and local rainfall data
• Locations of storm drain and CSO discharges,, based on surveys, drawings, or
inspections of outfall locations
• Representative discharges from storm drains and CSOs within the EW, based on
recent discharge patterns c . Information on typical solids loadings from storm drain and CSO discharges from
previous sampling of conveyance systems typical of those discharging to the EW
• Locations and characteristics of other potential discharges of solids and/or pollutants
to the EW L J
2.8 Propwash, Hydrodynamic Pressure Fields, and Vessel Wakes
There are no specific studies for the EW concerning sediment resuspension due to
propwash, hydrodynamic pressure fields ("drawdown" or Bernoulli effects), or vessel
wakes. Analysis and modeling specific to the physical layout and sediment characteristics
of the EW, vessel types, and vessel operations will be required.
2.9 Suitability of Data for Use in East Waterway Sediment Transport Evaluation
The data presented in Section 2 consist of hydrodynamic, sediment transport, bathymetry,
and model-generated data. The first three data types consist of measurements from
different studies in the LDW, EW, and Elliott Bay. Model data were from the LDW study
reports (Windward and QEA 2008; QEA 2007).
The velocity data that are directly pertinent to the EW include measurements from the WQA
study (King County 1999). These velocity data are suitable for use in the STE. The WQA
velocity data provide information about the nature of flow interactions with the LDW. They
could also be used for model validation.
Final Sediment Transport Evaluation Approach Memorandum * ^ December 2008 East Watenvay Operable Unit 17 ^ ' 060003-01

Discussion of Existing Information
Dredging records have been collected and summarized in the EISR (Anchor and Windward
2008a). Since most dredging activities in the EW have been undertaken to deepen navigable
depths, rather than to perform maintenance dredging, it is difficult to quantify
sedimentation from these records. The effect of dredging on sediment mass balance is not
being incorporated into the STE and dredging activities are also not being included in any
modeling analyses.
The sediment transport data consist of the sedimentation rate data and the study of
sediment transport. The data used to calculate sedimentation rates are suitable for use in
the STE. They give the historical sedimentation patterns in the EW. It is possible that the
sites from which the high-resolution core samples were collected may have been dredged,
but the data can still be used for estimating sediment deposition rates, conducting historical
sedimentation analyses, and for model validation.
The sediment transport study by McLaren and Ren (1994) is problematic in that while it
suggests direction of movement of the sediment bed, it cannot be used to determine
amounts of that movement or sources of the material that comprised the bed. Therefore, it
provides only one line of evidence for a net measurement.
2.10 Current Understanding of Sediment Transport in the East Waterway
The current understanding of sediment transport in the EW is described tn the CSM and
Data Gaps Analysis Report (Anchor, Windward and BatteUe 2008). The existing
information was reviewed and used as the basis for conceptualizing the processes that
influence sediment transport in the EW. The following section summarizes the sediment
transport processes due to natural and anthropogenic processes described in the CSM and
Data Gaps Analysis Report. In the Physical Processes CSM, three reaches of the EW were
identified: the Junction Reach (south of the Spokane Street corridor to the southern
boundary of the EW), the Sill Reach (the shallow area in the Spokane Street corridor), and
the Main Body Reach (north of the Spokane Street corridor). Sediment transport and
hydrodynamic processes are different in each of these reaches.
Final Sediment Transport Evaluation Approach Memorandum h ^ December 2008 East Waterway Operable Unit 18 ^ ' 060003-01

Discussion of Existing Information
2.10.1 Natural Sediment Transport Processes
2.10.1.1 Hydrodynamics
Hydrodynamics in the EW are influenced by tidally-induced fluctuations of the
water surface in Elliott Bay and inflows from the LDW. The influence of the tide on
inflows to the EW from Elliott Bay depends on the flows in the Green River. Specific
hydrodynamic data for three reaches in the EW (Junction, Sill, and Main Body) are
not currently available; however, a general discussion of anticipated flow is
provided.
Stratified flow conditions develop throughout the EW with freshwater flows from
the LDW flowing northward over the higher salinity bottom waters of the EW from
Elliott Bay.
During periods of high flow in the Green River and during tidal ebb, the velocity
profile throughout the water column is directed to the north into the Main Body
Reach from the Junction and Sill Reaches. Also during periods of high river flow,
but with flood tides, the surface of the water column velocity is directed to the north,
but there is also flow in the bottom layer directed to the south, which is presumably
composed of marine waters. This bottom-layer flow would depend on the Green
River flow and height and strength of the flood tide. From evaluation of velocity
data in the Junction Reach of the EW and assumptions based on hydrodynamic
principles, it is concluded that velocities within the water column will be highest in
the Junction and Sill Reaches, and lowest in the Main Body Reach due to the increase
in cross-sectional area.
During periods of low flow in the Green River, the velocity profile in the water
column is dominated by tidal variations. During ebb tide the velocity profile is
directed to the north, and during flood tide the velocity profile is directed to the
south.
2.10.1.2 Sediment Transport
Suspended solids concentrations during low river Row periods will likely be
relatively small in comparison to high river flow periods. It is during the high flow
Final Sediment Transport Evaluation Approach Memorandum rr, y^ December 2008 East Waterway Operable Unit 19 ^ ~ ' 060003-01
c c
LJ
LJ

Discussion of Existing Information
periods that the greatest sedunent loads likely will be transported into the EW,
because of the large water flows and the likely higher concentrations of suspended
sediment. The highest deposition is expected in the Main Body Reach, where the
fluid velocities decrease in comparison with the Junction and Sill Reaches.
Deposition in the Main Body Reach is likely highest at the south end, near the Sill
Reach, and decreases as sediment is transported northward toward Elliott Bay.
2.10.1.3 Sediment Deposition and Resuspension
Sedimentation is influenced by the deposition of sediment from the water column
(gross sedimentation) and by resuspension of the sediment bed due to current
induced shear stress applied to the sediment bed. The difference between the gross
sedimentation and resuspension is the net sedimentation. The fluid shear stress
from natural currents will vary depending upon the direction and velocity of flow
and on the depth of water due to estuarine dynamics. Historically, the depth of the
southern end of the Main Body Reach was shallow, so that resuspension from
natural currents was likely larger than in deeper regions of the Main Body Reach.
Consequently, provided sediment type and cross-sectional area are uniform, net
sedimentation at the south end is likely lower under those conditions than in the
deeper sections further north.
2.10.2 Vessel-induced Hydrodynamic Effects
Most vessel traffic in the EW consists of container ships that are assisted by tugboats
moving into and out of the EW. Each container ship requires at least one tugboat to
maneuver the ship during berthing. Cruise ships have called on T-30 for the past several
years. However, the Port of Seattle plans to move cruise ship operations from T-30 to
Terminal 91 (T-91) in Ellioti: Bay in 2009 (previously identified as 2008 in the EISR) and
restore T-30 to a container facility. Cruise ships typically maneuver under their own
power. Vessels from NOAA (which are much smaller) will temporarily dock at T-30
from November through March of 2008, prior to its conversion to a container facility.
In addition to the above ship traffic, tugboats, barges, and small craft also use the EW.
USCG moors numerous vessels in Slip 36, including USCG icebreakers, cutters (greater
than 65 feet in length), and gunboats. Other miscellaneous vessel moorage is present in
Final Sediment Transport Evaluation Approach Memorandum * y^ December 2008 East Waterway Opa-able Unit 20 ^ ' 060003-01

cDiscussion of Existing Information
Slip 27. South of the Spokane Street corridor, recreational and commercial boats move in c and out of the Harbor Island Marina (T-102) from the LDW. Along the T-102 shoreline
within the EW, the Port leases out moorages at a 750-foot-long dock for commercial use. c Detailed information on vessel arrivals and departures is included in Section 2.4.2 in the
EISR (Anchor and Windward 2008a). [ Propwash from deep-draft vessels, tugboats, and pleasure craft can generate strong c currents, resulting in shear stresses on adjacent bottom and sideslopes of the EW.
Propwash velocities can often exceed velocities from tidal currents or river flow c velocities.
A preliminary review of vessels operating in the EW suggests that propwash may be the
primary cause of sediment resuspension ftom the bottom and sideslopes along the EW.
The random nature of vessel-induced sediment resuspension is a complicating factor in
the analysis of sediment transport physical processes. The location, time of passage, and J
maneuvering of a specific vessel can occur with any tidal height and flow condition.
In addition to propwash, ship-induced pressure field effects (also known as drawdown [ or Bernoulli effects) and vessel wake are other vessel-produced hydrodynamic
phenomena typically considered when evaluating the potential for resuspension of [ bottom and bank sediment. c Pressure fields are long period waves from moving deep-draft vessels in restricted
waterways, such as the EW, that cause high water velocities in the nearshore shallow c areas and potential resuspension of fine sediment.
c Formation of any significant pressure field effects in the EW likely would occur only if a
large deep-draft vessel exceeded a certain speed criteria and/or traveled along a sailing I ,
line offset from the channel centerline. These conditions are not typical and are not
expected to occur within the EW. It is anticipated that pressure field effects are not a I
significant factor for sediment resuspension in the EW due to the slow velocities of
deep-draft vessels while docking and undocking within the EW. An analysis of j
operational conditions of deep-draft vessels tn the EW will be conducted to confirm this
expectation. If the analysis confirms that operational conditions of deep-draft vessels H Final Sediment Transport Evaluation Approach Memorandum * y^ December 2008 East Waterway Operable Unit 21 ^ * 060003-01 f"

Discussion of Existing Information
minimize or exclude pressure field effects, these effects will be removed from the
analysis of sediment resuspension and sediment transport.
Vessel wakes are generated by shallow-draft vessels transiting the EW. Docking and
undocking deep-draft vessels do not reach speeds that produce discernible wakes,
which will be verified in the modeling. When vessel wakes transform on shallow
bottom and slopes, they can generate flow or orbital velocities that may resuspend
available sediment.
Previous experience with vessel wakes in Puget Sound and other regions suggests that
hydrodynamic effects on sediment resuspension may extend only to an effective depth
of approximately 10 to 15 feet below the water surface. If the sediment of concern is
located at a water depth deeper than 15 feet, it is unlikely that vessel wakes will cause
significant resuspension effects on the sediment A description of the EW shoreline is
included in the EISR (Anchor and Windward 2008a). It is important to note that nearly
all of the EW shorelines are protected with riprap armor from the top of slopes down to
the toe of slopes, which is typically located deeper than 15 feet below the water surface.
Vessel speed is a critical factor for the development of significant hydrodynamic forces
and vessel wake effects on sediment resuspension. Vessels maneuvering within the EW
typically operate at slow speeds due to the relatively narrow widths and presence of
structures and other vessels.
Final Sediment Transport Evaluation Approach Memorandum i. ^ December 2008 East Watenvay Operable Unit • 22 ^ ' 060003-01

Sediment Transport Evaluation Modeling Approach Selection and Data Needs Determination
3 SEDIMENT TRANSPORT EVALUATION MODELING APPROACH SELECTION
AND DATA NEEDS DETERMINATION
As discussed in Section 1, the Sediment Transport Evaluation Report will summarize the STE
and will be used to refine the Physical Processes CSM presented in the CSM and Data Gaps
Analysis Report (Anchor, Windward and BatteUe 2008). The STE will be conducted using
existing information obtained from the EISR (Anchor and Windward 2008a) and new
information obtained to support the STE preferred approach discussed in this STEAM.
Potential modeling approaches to inform the STE are examined tn this section and are evaluated
on the ability to meet the objectives outlined tn Section 1. How well the modeling approaches
are able to incorporate the relevant physical processes, scales, and the level of effort involved
(e.g., model setup and n m time) are used to select which approach will adequately address the
objectives of the STE. The preferred approach must also be able to examine the potential for
recontamination during future SRI/FS activities. In addition, another important factor that
should influence the selection of a preferred approach is whether a modeling approach can
effectively achieve the STE objectives while meeting the Workplan (Anchor and Windward
2007) schedule.
Section 3.1 provides an overview of relevant physical processes that influence sediment
transport in the EW. Potential modeling approaches to inform the STE have been discussed
with EWG and EPA. These approaches are examined in Sections 3.2 and 3.3. Section 3.2
identifies several modeling approaches to assess sediment transport from natural processes, and
Section 3.3 reviews their data requirements. Following preparation of the Draft STEAM, several
meetings were held between EWG and EPA to develop a consensus STE approach. An
overview of the consensus modeling approach has been developed that includes hydrodynamic
modeling, localized transport modeling, and empirical data analyses. This preferred approach
is discussed in Section 3.4. Section 3.5 identifies data needs for the preferred approach.
Section 3.6 presents the modeling approach for evaluating vessel-induced hydrodynamic
effects. The STEAM provides much more detail in the selection of the modeling approach for
evaluating sediment transport ftom natural processes than is provided for vessel-induced
hydrodynamic effects since there are limited modeling alternatives available to assess these
effects.
Final Sediment Transport Evaluation Approach Memorandum * ^ December 2008 East Watenoay Operable Unit 23 ' 060003-01

cSediment Transport Evaluation Modeling Approach Selection and Data Needs Determination
3.1 Relevant Sediment Transport Processes in the East Waterway c Sections 3.1.1 through 3.1.4 describe the relevant sediment transpbrt processes in the EW.
These physical processes form the basis to develop potential STE approaches and are c incorporated into the Physical Processes CSM for the EW (Anchor, Windward and Batteile
2008). The discussion is separated between the processes of sediment transport through the [ water column and the interactions between the sediment bed and the water column.
c 3.1.1 Hydrodynamics
The hydrodynamics of the EW have a major effect on the transport of sediment. The c tidal conditions and marine waters (with high salinity) tn Elliott Bay and the freshwater
flow in the Green River (with low salinity) govem the velocity field and the density c stratification of the EW. Freshwater inflows ftom the LDW into the EW will produce
stratified flow conditions. Freshwater lateral solids loads from CSOs and storm drains c have intermittent and random discharges to the EW. The discharge of freshwater into
high salinity marine waters will produce buoyancy effects that influence mixing and c entrainment of the discharge into the receiving water. The elevation of the discharge
pipe with respect to the range of tidal elevations determines if the discharge behaves as j
a surface or subsurface discharge. Discharges from lateral solids loads are not expected
to affect the overall circulation pattems produced by the tidal exchange and inflows
ftom the LDW.
[The interaction of the fluid flow with solid boundaries and fluid layers produces
turbulence in the EW that promotes mixing and dispersion processes. These processes, ctn turn, influence the loading of sediment into the EW from the LDW and lateral solids
loads and the pathways of transport within the EW. c Additionally, localized vessel-induced hydrodynamic effects (e.g., propwash, pressure
field effects, and ship wakes) influence sediment transport in the localized region where [ the vessel-induced effects occur. Vessel-induced effects can have significant localized
impacts on sediment stability and transport, and cumulatively may result in mixing of [ surface sediments over larger spatial scales.
[
[ Final Sediment Transport Evaluation Approach Memorandum * y^ December 2008 East Watenvay Operable Unit 24 ^ " 060003-01 [
Sediment Transport Evaluation Modeling Approach Selection and Data Needs Determination
3.1.2 Sediment Transport and Sedimentation
As sediment is brought into and transported through the EW by advective fluid flow,
suspended sediment particles will tend to settle through the water column. No salt
wedge is expected to develop in the EW and, therefore, it is not expected to have a
significant influence on settling dynamics. This settling process can be counteracted by
turbulent processes that lift sediment particles back up into the water column. The
turbulence-induced motion promotes mixing of sediment particles through the water
column. The time needed for settling depends on the particle size (settling velocity), the
depth of water through which the particle settles, and the residence time of the system.
If the residence time of the sediment particle is long enough, the particle will eventually
settle to the sediment bed. Large particles, such as gravel and sand, will settle faster
than smaller particles (silts and clays). In the process of settling, smaller sediment
particles may form floes along with other sediment particles by differential settling.
Differential settling allows particles to aggregate and form floes, resulting in increased
settling rates. Floe formation is also increased when sediments suspended tn freshwater
come into contact with saline waters. This reduces the electrostatic repulsion of the
smaller particles and allows them to aggregate and flocculate. Turbulence and velocity
shear in the water column just above the bed can break apart floes (de-flocculation) that
are settling to the bed, resulting in a reduced rate of sediment deposition.
3.1.3 Bed Sediment
After sediment is deposited to the sediment bed, sedirnent particles will either undergo
sedimentation (burial) or resuspension. A fluff layer forms on the sediment surface
composed of the recently deposited sediment particles. If sediment particles continue to
be deposited on the bed surface, particles will be buried deeper tn the sediment column.
As sediment particles are buried, the interstitial porewater will be squeezed out due to
the increasing weight of sediment. This results tn sediment consolidation and increasing
shear strength with depth. The vertical variation in shear strength tn the sediment bed
can also be affected by episodic deposition of less cohesive sediment, bioturbation
(sediment mixing from benthic infauna), and anthropogenic disturbances.
Final Sediment Transport Evaluation Approach Memorandum * y^ December 2008 East Watenvay Operable Unit 25 ^ - ' 060003-01

Sediment Transport Evaluation Modeling Approach Selection and Data Needs Determination
Periodically, the fluid velocity above the sediment bed may be so large as to produce
large shear stresses on the bed that cause entrainment of sediment particles into the
water column (resuspension). The re-entrained sediment can be removed from the
surface of the sediment bed, or if there is a shear strength weakness within the bed, mass
erosion of the sediment bed can occur.
3.1.4 Time and Spatial Scales of Sediment Transport Processes
Sediment transport dynamics occur over a spectrum of time scales. River floods
carrying large sediment loads occur over a period of hours to days. Tidal influences on
sediment transport occur over a period of hours. Sedimentation occurs over a period of
years, with shorter-term processes influencing the rate on the order of hours to days.
There is also a range of spatial scales over which sediment transport dynamics occur.
Factors that affect spatial scales include the diameter of a discharge pipe, the width of a
sediment plume or sediment footprint, the distance it takes for an advected sediment
particle to settle, the scale and distribution of propwash effects, and the size of the whole
waterbody being analyzed.
3.2 Sediment Transport Modeling Approaches For Natural Processes
There are several modeling approaches that have been discussed between EWG and EPA to
inform the STE for natural processes. They range from simple mass balance calculations to
physics-based models with fine-resolution grids used with multi-year simulations. The
following subsections describe and document the range of approaches considered and
discuss the advantages and limitations of each approach presented. For the physics-based
model approaches, it should be recognized that a spectrum of possible approaches could be
presented with variations of grid resolution, period of analysis, and model domain size.
The evaluation of modeling approaches for natural processes presented tn the STEAM is
based on the ability of the approach to meet STE objectives. The STE objectives identified tn
the Workplan (Anchor and Windward 2007) are as follows:
1. Identify and evaluate the primary sources of sediment to EW
2. Identify temporal and spatial patterns of sediment erosion and deposition (if
applicable)
Final Sediment Transport Evaluation Approach Memorandum i, ^ Decanber 2008 East Waterway Operable Unit 26 ' ^ " 060003-01
L J
U
L J
c

Sedtment Transport Evaluation Modeling Approach Selection and Data Needs Determination
3. Identify the physical processes driving sediment ttansport
4. Identify likely routes or pathways for sediment movement
5. Assess how sediment transport pathways may affect the feasibility of remedial
alternatives, including MNR, enhanced natural recovery, dredging, and isolation
capping
6. Assess potential for physical processes to contribute to recontamination
The evaluation of each modeling approach also considers the anticipated likelihood of
whether the modeling approach can meet the Workplan schedule (Anchor and Windward
2007). Table 3-1 provides details of each modeling approach, as well as the advantages and
limitations of each approach.
Five modeling approaches for natural processes are presented in Table 3-1 and summarized
in this section, as follows:
1. Single-box mass balance calculation approach
2. Two-layer screening-level modeling approach
3. Physics-based modeling approach - existing/coarse grid resolution in the EW
4. Physics-based modeling approach - moderate grid resolution tn the EW
5. Physics-based modeling approach - fine grid resolution in the EW
Final Sediment Transport Evaluation Approach Memorandum rr. )R. December 2008 East Waterway Operable Unit 27 ^ ^ ' 060003-01
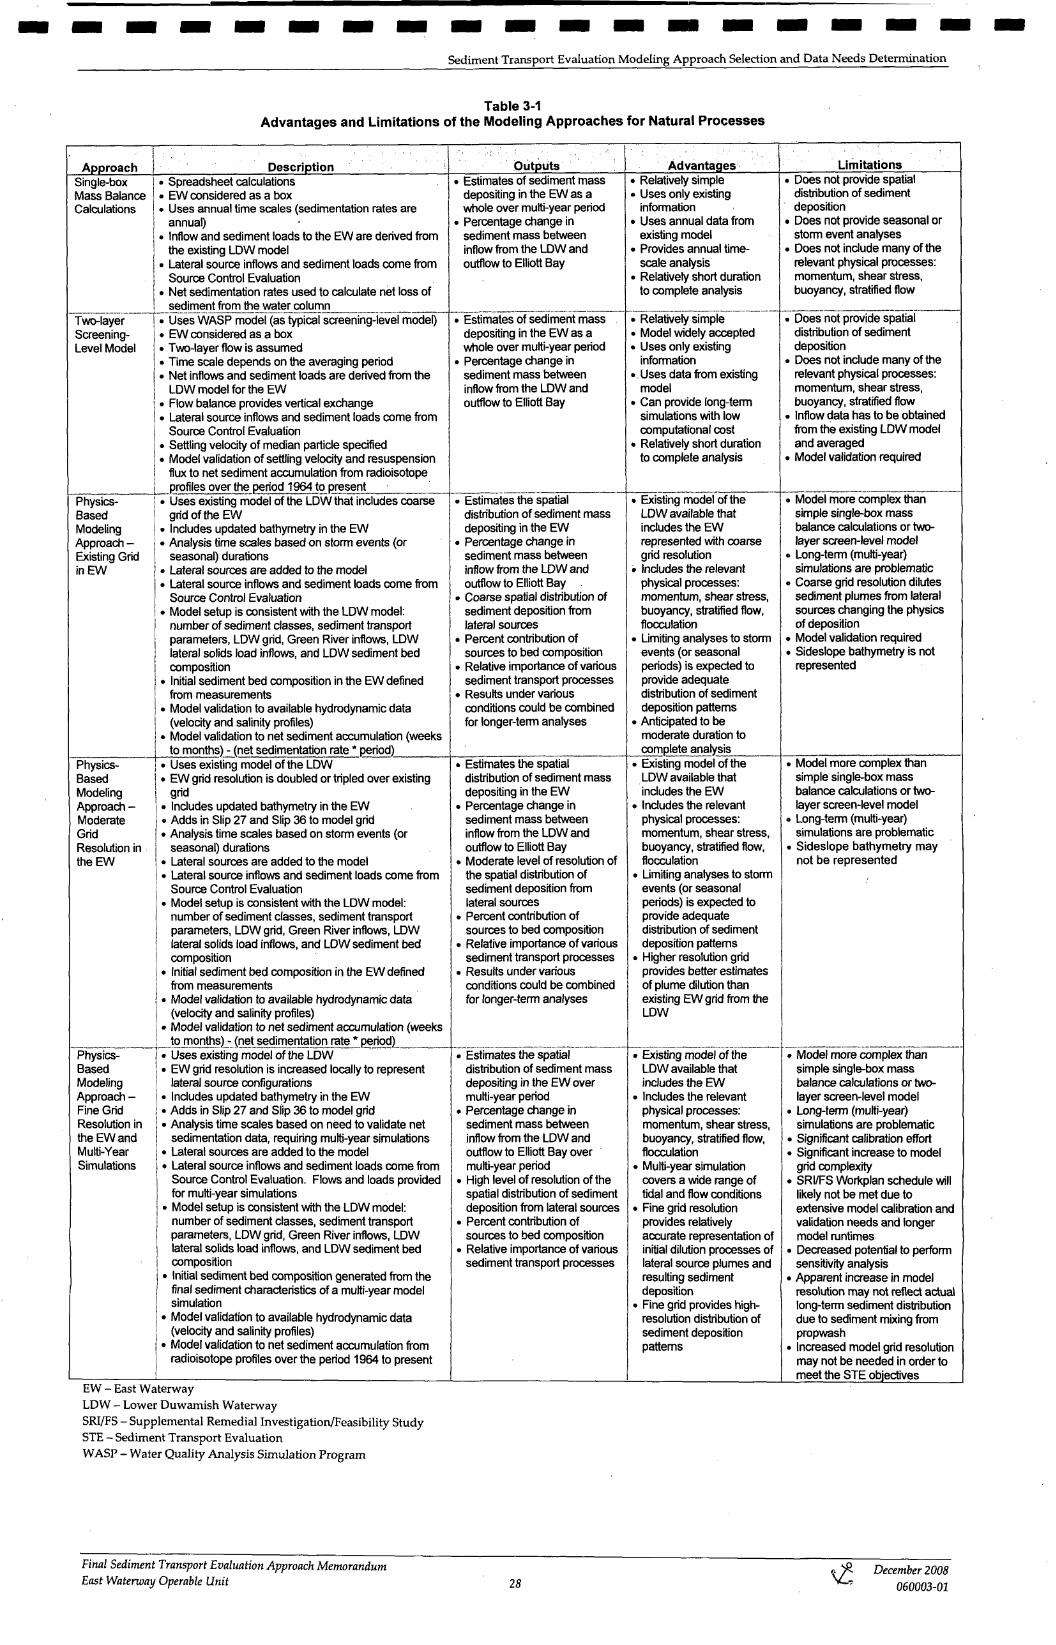
Sediment Transport Evaluation Modeling Approach Selection and Data Needs Determination
Table 3-1 Advantages and Limitations of the Modeling Approaches for Natural Processes
Approach Description Single-box . Spreadsheet calculations Mass Balance • EW considered as a box Calculations . Uses annual time scales (sedimentation rates are
annual) • Inflow and sediment loads to the EW are derived firom
the existing LDW model • Lateral source inflows and sediment loads come from
Source Control Evaluation • Net sedimentation rates used to calculate net loss of
sediment from the water column Two-layer . Uses WASP model (as typical screening-level model) Screening- • EW considered as a box Level Model • Two-layer flow is assumed
• Time scale depends on the averaging period • Net inflows and sediment loads are derivedfirom the
LDW model for theEW • Flow balance provides vertical exchange • Lateral source inflows and sediment loads come from
Source Control Evaluation . Settling velocity of median particle specified • Model validation of settling velodty and resuspension
flux to net sediment accumulation from radioisotope profiles over the period 1964 to present
Physics- . Uses existing model ofthe LDW that includes coarse Based grid of theEW Modeling • Includes updated bathymetry in the EW Approach - • Analysis time scales based on storm events (or Existing Grid seasonal) durations inEW • Lateral sources are added to the model
• Lateral source inflows and sediment loads come from Source Control Evaluation
• Model setup is consistent with the LDW model: number of sediment classes, sediment transport parameters, LDW grid. Green River inflows, LDW lateral solids load inflows, and LDW sediment bed composition
. Initial sediment bed composition in the EW defined from measurements
• Model validation to available hydrodynamic data (velocity and salinity profiles)
• Model validation to net sediment accumulation (weeks to months) - (net sedimentation rate * period)
Physics- . Uses existing model ofthe LDW Based • EW grid resolution is doubled or tripled over existing Modeling grid Approach - • Includes updated bathymetry in the EW Moderate • Adds in Slip 27 and Slip 36 to model grid Grid • Analysis time scales based on storm events (or Resolution in seasonal) durations theEW • Lateral sources are added to the model
• Lateral source inflows and sediment loads come fi'om Source Control Evaluation
. Model setup is consistent with the LDW model: number of sediment classes, sediment transport parameters, LDW grid. Green River inflows, LDW lateral solids load inflows, and LDW sediment bed composition
• Initial sediment bed composition in the EW defined from measurements
. Model validation to available hydrodynamic data (velocity and salinity profiles)
• Model validation to net sediment accumulation (weeks to months) - (net sedimentation rate * period)
Physics- • Uses existing model ofthe LDW Based • EW grid resolution is increased locally to represent Modeling lateral source configurations Approach - • Includes updated bathymetry in the EW Fine Grid • Adds in Slip 27 and Slip 36 to model grid Resolution in • Analysis time scales based on need to validate net theEW and sedimentation data, requiring multi-year simulations Multi-Year • Lateral sources are added to the model Simulations • Lateral source inflows and sediment loads come fi'om
Source Control Evaluation. Flows and loads provided for multi-year simulations
• Model setup is consistent with the LDW model: number of sediment classes, sediment transport parameters, LDW grid, Green River inflows, LDW lateral solids load inflows, and LDW sediment bed composition
• Initial sediment bed composition generated from the final sediment characteristics of a multi-year model simulation
• Model validation to available hydrodynamic data (velocity and salinity profiles)
• Model validation fo net sediment accumulation fi'om radioisotope profiles over the period 1964 to present
EW - East Waterway LDW - Lower Duwamish Waterway SRI/FS - Supplemental Remedial InvestigatiorVFeasibility Study STE - Sediment Transport Evaluation WASP - Water Quality Analysis Simulation Program
Outputs • Estimates of sediment mass
depositing in the EW as a whole over multi-year period
• Percentage change in sediment mass between inflowfix)m the LDW and outflow to Elliott Bay
• Estimates of sediment mass depositing in the EW as a whole over multi-year period
• Percentage change in sediment mass between inflow from the LDW and outflow to Elliott Bay
. Estimates the spatial distribution of sediment mass depositing in the EW
. Percentage change in sediment mass between inflow from the LDW and outflow to Elliott Bay
• Coarse spatial distribution of sediment deposition firom lateral sources
• Percent contribution of sources to bed composition
• Relative importance of various sediment transport processes
• Results under various conditions could be combined for longer-term analyses
• Estimates the spatial distribution of sediment mass depositing in the EW
• Percentage change in sediment mass between inflowfirom the LDW and outflow to Elliott Bay
• Moderate level of resolution of the spatial distribution of sediment deposition fixjm lateral sources
. Percent contribution of sources to bed composition
• Relative importance of various sediment ti^nsport processes
. Results under various conditions could be combined for longer-term analyses
• Estimates the spatial distribution of sediment mass depositing in the EWover multi-year period
• Percentage change in sediment mass between inflowfi-om the LDW and outflow to Elliott Bay over multi-year period
• High level of resolution ofthe spatial distiibution of sediment deposition fi'om lateral sources
• Percent contribution of sources to bed composition
• Relative importance of various sediment transport processes
Advantages • Relatively simple • Uses only existing
infonnation • Uses annual data from
existing model • Provides annual time
scale analysis • Relatively short duration
to complete analysis
• Relatively simple • Model widely accepted • Uses only existing
information . Uses datafi-om existing
model • Can provide long-term
simulations with low computational cost
• Relatively short duration to complete analysis
• Existing model ofthe LDW available that includes tiie EW represented vwth coarse grid resolution
• Includes the relevant physical processes: momentum, shear stress, buoyancy, stratified flow, flocculation
• Limiting analyses to storm events (or seasonal periods) is expected to provide adequate disbribution of sediment deposition pattems
• Anticipated to be moderate duration to complete analysis
. Existing model ofthe LDW available that includes the EW
• Includes the relevant physical processes: momentum, shear stress, buoyancy, stiratified flow, flocculation
• Limiting analyses to storm events (or seasonal periods) is expected to provide adequate disb'ibution of sediment deposition pattems
• Higher resolution grid provides better estimates of plume dilution than existing EWgrid from the LDW
• Existing model of the LDW available that includes the EW
• Includes the relevant physical processes: momentum, shear stress, buoyancy, sti-atified flow, flocculation
• Multi-year simulation covers a wide range of tidal and flow conditions
• Fine grid resolution provides relatively accurate representation of initial dilution processes of lateral source plumes and resulting sediment deposition
• Fine grid provides highresolution distiibution of sediment deposition pattems
Limitations . Does not provide spatial
distiibution of sediment deposition
• Does not provide seasonal or stomi event analyses
• Does not include many ofthe relevant physical processes: momentum, shear stress, buoyancy, stratified flow
. Does not provide spatial distribution of sediment deposition
» Does not include many ofthe relevant physical processes: momentum, shear stress, buoyancy, stratified flow
. Inflow data has to be obtained fixim the existing LDW model and averaged
• Model validation required
• Model more complex tiian simple single-box mass balance calculations or twolayer SCTeen-level model
o Long-tenn (multi-year) simulations are problematic
» Coarse grid resolution dilutes sediment plumes from lateral sources changing the physics of deposition
• Model validation required • Sideslope bathymetry is not
represented
. Model more complex than simple single-box mass balance calculations or twolayer screen4evel model
• Long-term (multi-year) simulations are problematic
• Sideslope bathymetry may not be represented
• Model more complex than simple single-box mass balance calculations or twolayer screen-level model
. Long-tenn (multi-year) simulations are problematic
. Significant calibration effort • Significant increase to model
grid complexity . SRI/FS Woricplan schedule will
likely not be met due to extensive model calibration and validation needs and longer model runtimes
. Decreased potential to perfbmi sensitivity analysis
• Apparent increase in model resolution may not reflect actual long-temn sediment distribution due to sediment mixing from propwash
. Increased model grid resolution may not be needed in order to meet the STE objectives
Firml Sediment Transport Evaluation Approach Memorandum December 2008 East Waterway Operable Unit \ & 28 060003-01

Sediment Transport Evaluation Modeling Approach Selection and Data Needs Determination
3.2.1 Single-Box Mass Balance Calculation Approach
This simplest modeling approach considers the EW as a whole, and examines sediment
transport on annual periods. The approach models the EW as a single box, or
Continually Stirred Tank Reactor (CSTR), and calculates a sedimentation rate from a
settling speed, the suspended sediment concenttation within the box, and the average
geometry. The model would use the output from the existing LDW model (QEA 2007)
to provide annual inputs of flow and sediment load to the EW. Flow and solids loads
from lateral sources would be refined as described in the Initial Source Screening and
Data Gaps Memorandum (per the SCEAM process). A flow balance would compute the
net flow at the Elliott Bay boundary. This net flow is anticipated to be outward,
meaning sediment concentrations at this boundary would not be a required input. The
suspended solids concentration would be calculated from the net sediment fluxes, and
the net sedimentation rate would be computed as the product of this concentration, the
settling speed, and the effective area. The net sedimentation rate would be compared
with the measured net sedimentation rates. Discrepancies would be reconciled based on
the current understanding of the physical processes in the EW and the level of
confidence of the boundary values.
While this approach is relatively simple, it does not provide spatial distributions of
sediment bed conttibutions from sediment sources. It also does not include the
important physical processes of hydrodynamics and sediment transport. It can provide
an estimate of sediment deposition with time, at least on an annual time scale or longer.
3.2.2 Two-Layer Screening-Level Modeling Approach
The two-layer screening-level modeling approach assumes the use of the Water Quality
Analysis Simulation Program (WASP) model (Wool et al. 2001) with a simplified two
layer flow model. The EW is represented as two vertical boxes with no horizontal
segmentation.
This modeling approach assumes a simplified two-layer flow model with the surface
layer representing freshwater flows from the LDW and the bottom layer representing
saline inflows from Elliott Bay. The existing LDW model output (Windward and QEA
2008) would be averaged to provide the net inflows and outflows of the surface and
Final Sediment Transport Evaluation Approach Menwrandum * y^ December 2008 East Watenvay Operable Unit 29 ^ ' 060003-01

Sediment Transport Evaluation Modeling Approach Selection and Data Needs Determination
bottom layers ftom the LDW and Elliott Bay. These inflow data are used to derive a
flow balance within the EW to estimate vertical exchange between the bottom and
surface layers. The averaging period would be of a reasonable length to quicken
computation and remove tidal exchanges, such as a monthly or seasonal interval.
Suspended sediment concenttations would come from the existing LDW model (QEA
2007) at the LDW boundary and from existing Elliott Bay monitoring data for the Elliott
Bay boundary. Model validation would involve adjusting boundary concenttations,
settling rates, and resuspension fluxes to match the predicted sedimentation rate to
observed net sedimentation rates.
As with the single-box mass balance approach, this modeling approach does not provide
spatial distributions of sediment bed contributions from lateral solids loads, but it can
provide a slightly higher temporal resolution, at least on the time scale of net inflow
calculations. It only includes a subset of the physical processes important for
hydrodynamic and sediment transport analyses. In the case of the EW, using the
existing (coarse-grid) physics-based model would be faster and more cost-effective than
developing a two-layer screening-level model.
3.2.3 Physics-Based Modeling Approach - Existing/Coarse Grid Resolution in
theEW
The existing model used for the LDW analyses includes the EW in the model domain
(QEA 2007). The use of the existing model provides an advantage in time savings in that
the model is already set up. The existing model for the LDW includes Environmental
Fluid Dynamics Code (EFDC) for the hydrodynamic processes and SEDZLJ for the
sediment transport processes. It is a physics-based model, in that it includes the
important physical processes and state-of-the-art algorithms to describe the
hydrodynamic and sediment transport processes. The model domain extends from the
Duwamish River at the south to a boundary between Puget Sound and Elliott Bay that is
located between Alki and West Points. The scale of the existing grid is generally
consistent with the scale of longitudinal bathymetric features tn the EW tn that the
resolution of the model grid captures longitudinal changes in bathymetry. The grid
resolution is relatively coarse and transverse bathymetric features, such as steep
Final Sediment Transport Evaluation Approach Memorandum i. ^ December 2008 East Waterway Operable Unit 30 ^ ' 060003-01
n
c c c c c
,
LJ
p

Sediment Transport Evaluation Modeling Approach Selection and Data Needs Determination
shorelines, are not accurately represented by this grid. Another limitation of the existing
grid is that it does not depict Slip 27 and Slip 36.
This physics-based modeling approach for natural processes includes a coarse grid
resolution in the EW, but the model would be updated with the latest bathymetry data
for the EW. The initial sediment bed composition is not currently configured for the
EW, but will be derived from existing sediment composition data. Boundary conditions
would be provided by USGS gauge data, sediment rating curves (TSS) at the Green
River boundary, and tidal elevations and average sediment concentrations (TSS) at the
Elliott Bay-Puget Sound boundary. The model resolution is coarse in the EW, with two
cells across the width and 13 cells along the length. This includes one row (two cells
wide) tn the Junction Reach and two rows (two cells wide) in the Sill Reach. The model
has a very fine temporal resolution, on the scale of minutes. Model calibration would
come extensively from the LDW modeling work (QEA 2007).
Lateral solids loads would be input as point sources into the existing model grid.
Lateral solids loads in the EW include three CSOs and an estimated 39 storm drains.
Flows and sediment concenttations in CSOs and storm drain discharges to the EW will
be developed as part of the Source Control Evaluation process. The key output of the
modeling analysis of lateral discharges will be the fraction of sediment from CSOs and
storm drains deposited tn the EW. Due to the coarse grid, the existing model would
provide only a general distribution of lateral solids loads but would be sufficient to
provide a general picture of how lateral solids loads impact EW sediment ttansport
processes. However, the deposition resolution can be no greater than the grid
resolution, as all model calculations are defined by the grid resolution.
The existtng/coarse-grid approach is an improvement over the single-box mass balance
calciilations and two-layer screening-level modeling as it provides results of the spatial
distribution of sediment deposition. The time scales of analysis will be adequate to
accurately characterize the variations of flow and sediment load over storm events and
seasonal hydrologic cycles. The approach includes all of the physical processes
important for hydrodynamic and sedtment ttansport analyses (presented in Section 3.1).
Since this approach utilizes an existing model, relatively minor configuration changes
Final Sediment Transport Evaluation Approach Memorandum * y^ December 2008 East Waterway Operable Unit 31 ' 060003-01

Sediment Transport Evaluation Modeling Approach Selection and Data Needs Determination
are required to simulate the EW, thus reducing the effort required as compared to the
two-layer screening-level approach. Though current bathymetry would be applied to
the existing grid, because of the coarse resolution of the grid cells tn the Junction and Sill
Reaches, the shallow depths and narrowing associated with the Sill Reach may not
adequately capture the two-layer hydrodynamic flows in the Sill Reach.
n
3.2.4 Physics-Based Modeling Approach - Moderate Grid Resolution in the EW
The second variant of the physics-based model approach is similar to the previous
coarse-grid approach. Its difference is that the grid resolution tn the EW would be
doubled or ttipled compared to the existing grid to provide a moderate grid resolution.
The moderate grid would also depict Slip 27 and Slip 36. Increasing the grid resolution
would be done to provide more accurate representation of dilution processes for solids
from lateral sources. This approach also provides higher spatial resolution of sediment
deposition patterns from lateral sources and the LDW than would result from using the
existing/coarse grid. More accurate results from the moderate grid model would c provide more confidence in evaluating the feasibility of MNR as a remedial alternative
and for evaluating recontamination potential. With the potential for slightly greater
resolution, lateral solids loads would be modeled similar to the approach using the
existing/coarse grid resolution. This approach also increases the potential to capture the
complexities of the impact of the Sill and Junction Reach restrictions on the two-layer
hydrodynamic flow.
As is the case for the coarse grid, using a physics-based modeling approach at moderate
grid resolution is an improvement over the single-box mass balance calculations and
two-layer screening-level modeling because it provides results of the spatial distribution
of sediment deposition. Since this approach utilizes an existing model, relatively minor LJ
configuration changes are required to simulate the EW, thus reducing the effort p
required. However, additional effort (above that needed for the existing/coarse grid) to «-'
refine the grid and to validate and potentially re-calibrate the LDW model is required r-i
for this approach. This approach provides adequate time scale resolution over the Ll
duration of analyses. It also includes the physical processes important for ^^
hydrodynamic and sediment transport analyses (presented in Section 3.1). Ll
U Final Sediment Transport Evaluation Approach Memorandum * y^ December 2008 East Watenvay Operable Unit 32 ^ * 060003-01 P

Sediment Transport Evaluation Modeling Approach Selection and Data Needs Determination
3.2.5 Physics-Based Modeling Approach - Fine Grid Resolution in the EW
The third variant of the physics-based model approach has some significant differences
from the previous two approaches. It calls for significant improvements to the existing
model grid resolution in the EW. Fine grid resolution would be better able to resolve the
localized nature of plumes of solids from lateral solids loads (i.e., storm drains and
CSOs), which would require that the smallest grid dimension would be about the size of
a typical discharge pipe in the vicinity of the lateral sources. Other areas within the EW
could utilize a larger grid resolution. The effects of lateral solids loads could then be
represented as accurately as possible in the vicinity of the discharge. A fine grid model
also improves the resolution of possible contaminant footprint from lateral solids loads
tn the sediment bed, which may help to better evaluate recontamination potential. As is
the case for the coarse and moderate grid resolution approaches, the model setup for the
fine grid would be consistent with the LDW model.
Using a physics-based modeling approach at fine grid resolution is an improvement
over the other natural process modeling approaches discussed as it provides greater
precision of results of the spatial distribution of sediment deposition. This approach
provides adequate time scale resolution. It also includes the physical processes
important for hydrodynamic and sediment transport analyses (presented tn Section 3.1).
However, there are significant difficulties tn this modeling approach. Significant
additional calibration of the model is expected. Another critical factor is that refining
the existing LDW model to address lateral solids loads to a,detailed degree would
significantly increase the overall complexity of the model grid and likely would result in
the need to conduct extensive model validation and calibration. Increasing the model
resolution to a fine grid would also significantly increase model run times to a degree
that long-term simulations may not be feasible.
3.3 Data Requirements ofthe Natural Processes Modeling Approaches
The data required to conduct each modeling approach are listed in Table 3-2. The data
required for the single-box mass balance calculations and two-layer screening-level model
have several differences ftom the data requirements of the physics-based models. The mass
balance calculations use data at annual time scales, primarily due to the annual rates
determined for net sedimentation. Net sedimentation rate data are used for comparison
Final Sediment Transport Evaluation Approach Memorandum * y^ December 2008 East Waterway Operable Unit 33 ^ ' 060003-01
Sediment Transport EvaluaHon Modeling Approach Selection and Data Needs Determination
purposes to mass balance calculation results. The two-layer screening-level model uses net
inflows computed over averaging periods corresponding to tidal cycles (i.e., daily, ^
biweekly, or monthly). These longer time scales are used for inputs of flows and sediment
loads to the EW. The data for the single-box mass balance and two-layer screening-level P
modeling approaches would be obtained from the LDW existing model output (Windward '-
and QEA 2008). p
The physics-based models use time intervals on the order of the frequency of the data: 15 p
minutes for tide and hourly for river flows. These data are taken from measurements at L
gauge stations in the case of flows and tides. A rating curve is used to estimate sediment
concentrations from the flow measurements. Additional data requirements for physics- L
based models are listed below: n
• Measurements of velocity and salinity profiles in each of the reaches.
• Flows and sediment concentrations from lateral sources.
• Settling velocity data for several size classes are needed for both the two-layer
screening-level and physics-based models. For consistency, the settling velocity data
would be the same data for four primary sediment size classes as used for the LDW
analyses (QEA 2007). It is likely that the variability of measured settling velocity will
be greater than the estimation from physical principles. A very large sample set
would be needed to reduce the variation. This has been accomplished already tn
many studies of sediment settling rates of various sizes and particle types. f
Therefore, literature values will be used.
• Sediment physical characteristics from existing data can be used for all of the p
physics-based model approaches. Critical sheer strees and erosion rates would be '--'
used as calibration parameters with the coarse-grid resolution approach, whereas tn p
the medium- and fine-grid approach, they are measured from intact sediment cores L
using Sedflume (McNeil et al. 1996) methods and specified as inputs. P
• Net sedimentation rate data are used for model validation in physics-based L
modeling approaches.
Final Sediment Transport Evaluation Approach Memorandum >. y^ December 2008 East Waterway Operable Unit 34 ^ ' 060003-01
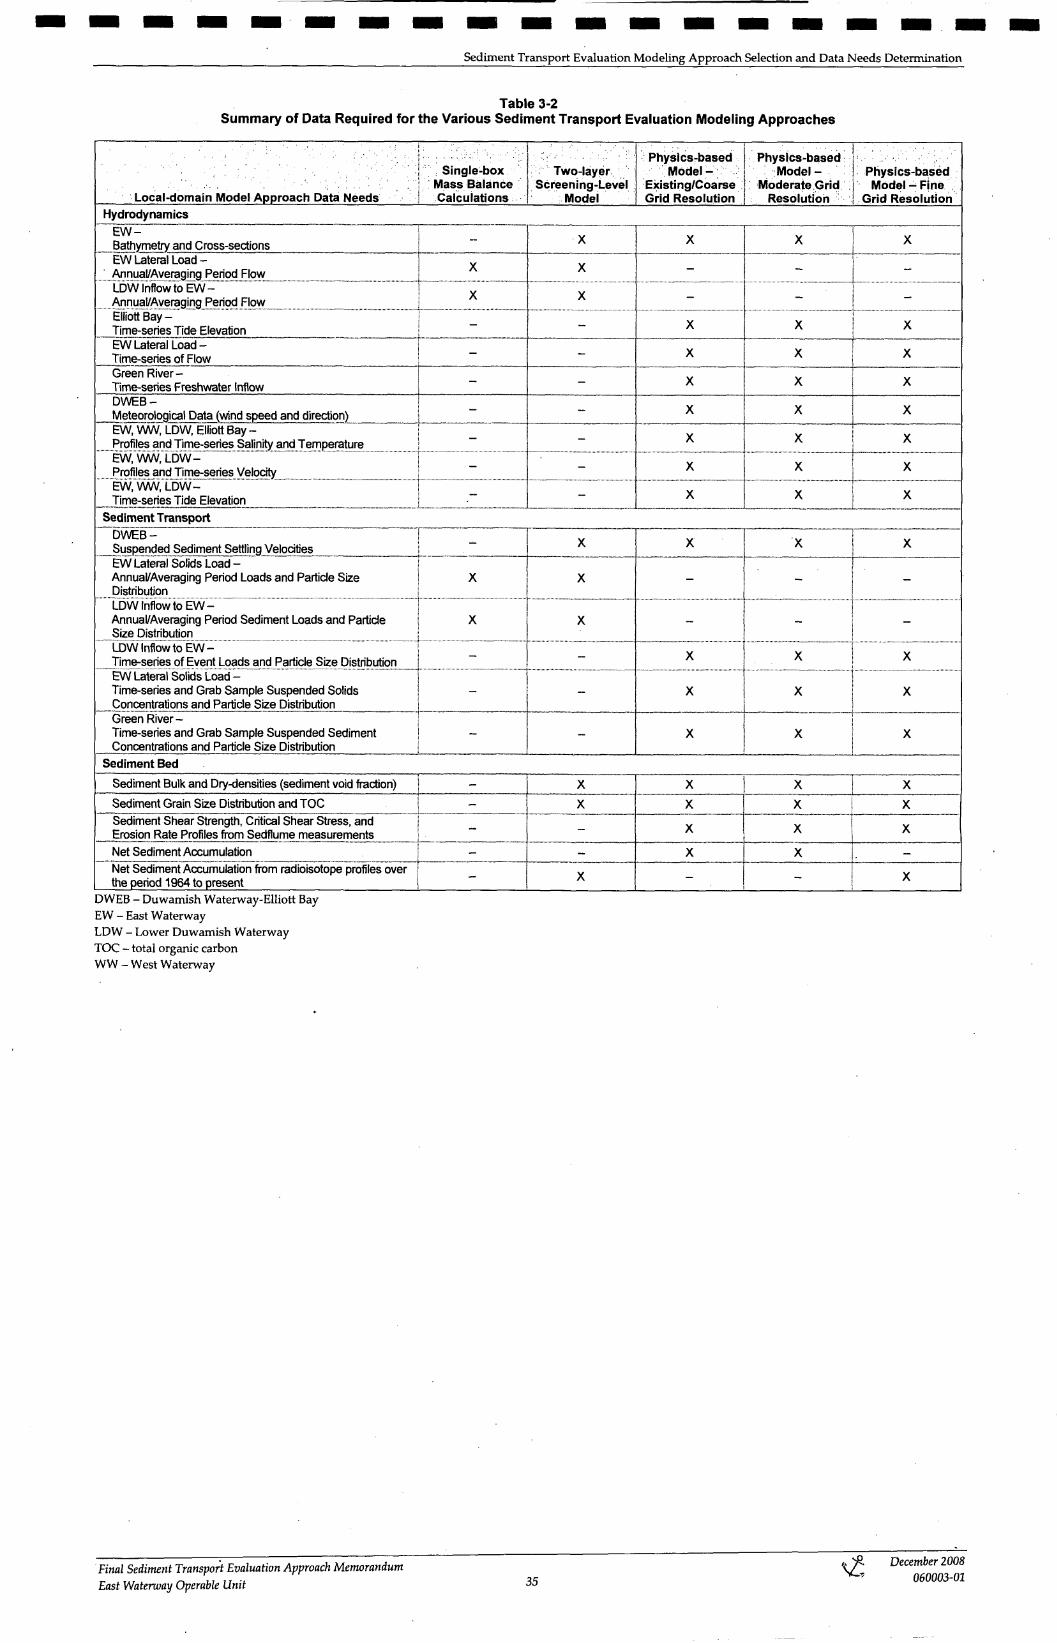
Sediment Transport Evaluation Modeling Approach Selection and Data Needs Determination
Table 3-2 Summary of Data Required for the Various Sediment Transport Evaluation Modeling Approaches
Physics-based Physics-based •. Single-box Two-layer Mode l - Mode l - Physics-based
Mass Balance Screening-Level Existing/Coarse : Moderate Grid : Model-'Fine Local-domain Model Approach Data Needs Calculations Model Grid Resolution Resolution Grid Resolution
Hydrodynamics E W -Bathymeti7 and Cross-sections - X X X X
EW Lateral Load Annual/Averaging Period Flow X X - - -
LDW Inflow to E W -Annual/Averaging Period Flow X X - - -
Elliott Bay-Time-series Tide Elevation - - X X X
EW Lateral Load-Time-series of Flow - - X X X
Green RiverTime-series Freshwater Inflow - - X X X
DWEB-Meteorological Data (wind speed and direction) - - X X X
EW, WW, LDW, Elliott Bay -Profiles and Time-series Salinity and Temperature - - X X X
EW, WW, LDW-Profiles and Time-series Velocity - - X X X
EW, WW, LDW-Time-series Tide Elevation - - X X X
Sediment Transport DWEB-Suspended Sediment Settling Velocities - X X X X
EW Lateral Solids Load-Annual/Averaging Period Loads and Particle Size X X - - -Distribution LDW Inflow to E W -Annual/Averaging Period Sediment Loads and Particle X X - - -Size Distribution LDW Inflow to E W -Time-series of Event Loads and Particle Size Distiibution - - X X X
EW Lateral Solids Load Time-series and Grab Sample Suspended Solids - - X X X Concentrations and Particle Size Distribution Green RiverTime-series and Grab Sample Suspended Sediment - - X X ConcentiBtions and Particle Size Distribution
Sediment Bed
Sediment Bulk and Dry-densities (sediment void fraction) - X X X X
Sediment Grain Size Distribution and TOC - X X X X Sediment Shear Strength, Critical Shear Stress, and Erosion Rate Profiles from Sedflume measurements - - X X X
Net Sediment Accumulation - - X X -Net Sediment Accumulationfromradioisotope profiles over the period 1964 to present - X - - X
DWEB Duwamish Waterway-Elliott Bay EW East Waterway LDW - Lower Duwamish Waterway TOC - total organic carbon WW - West Waterway
December 2008 Final Sediment Transport Evaluation Approach Memorandum ^ 35 East Watenvay Operable Unit
060003-01

Sediment Transport Evaluation Modeling Approach Selection and Data Needs Determination
3.4 Preferred Approach
In order to select the preferred approach, each approach is evaluated based on the following
criteria:
• Does the approach address the STE objectives and address the analytical needs for
the SRI/FS?
• Does the approach present the most practical, technically defensible, and cost
effective approach?
• Can the Workplan schedule be met with the anticipated field data collection, level of
modeling design effort, and analysis times needed to conduct the approach?
The STE objectives identified tn the Workplan (Anchor and Windward 2007) are as follows:
1. Identify and evaluate the primary sources of sediment to fhe EW
2. Identify temporal and spatial patterns of sediment erosion and deposition (if
applicable)
3. Identify the physical processes driving sediment transport
4. Identify likely routes or pathways for sediment movement
5. Assess how sediment transport pathways may affect the feasibility of remedial
alternatives including MNR, enhanced natural recovery, dredging, and isolation
capping
6. Assess potential for physical processes to contribute to recontamination
Objectives 1 and 2 require an approach that can provide spatial distribution and handle
sediment transport dynamics. Objective 2 also requires an approach that can accommodate
the range of spatial and temporal scales found in a system like the EW. Objective 3 requires
an approach based on physical principles that affect sediment transport dynamics.
Objective 4 links to the Source Control Evaluation (as do Objectives 5 and 6) and the need to
temporally and spatially evaluate the distribution of sediments (and contaminants) from
sources within the EW as well as from outside the EW. The approach must include the
capability to evaluate recontamination potential as given tn Objective 6.
As stated in the introduction to Section 3, various approaches (presented in Sections 3.2 of
3.3 of this document) were discussed with EWG (Port of Seattle, City of Seattle, and King
County) and EPA following submittal of the Draft STEAM on March 7, 2008. The
Final Sediment Transport Evaluation Approach Memorandum i. ^ December 2008 East Watenvay Operable Unit 36 ^ ' 060003-01

Sediment Transport Evaluation Modeling Approach Selection and Data Needs Determination
discussions occurred during meetings between EWG and EPA on May 15, 2008, and July 22,
2008, and focused on the level of complexity of the analyses, the needs for the SRI/FS, and
the impact of the approach on the schedule. Through these discussions, a consensus was
reached that the initial preferred approach outlined in the Draft STEAM (March 2008) could
not meet all of the objectives of the Workplan (Anchor and Windward 2007) and a new
tiered approach was developed. This approach combines use of the EFDC model developed
for the LDW at moderate grid resolution to evaluate hydrodjoiamics and erosion potential
in the EW, use of measured sediment transport characteristics to inform sediment transport
rates, and localized pluine and/or particle tracking modeling to assess recontamination
potential from lateral sources^.
P
p
'^
p
L
j - ,
L
The proposed sediment ttansport evaluation approach for the EW includes updating and
utilizing the existing LDW hydrodynamic model. The hydrodynamic model updates will be
focused on the EW and will include bathymetry, geometry, and calibration in the EW. In
particular, there is a need to update the bathymetry in the vicinity of the shallow water Sill
Reach and the Junction Reach of the EW with the LDW, and include the slips. The updated
model will be used to evaluate the hydrodynamics and erosion potential (by determining
shear stresses) within the EW to help validate the EW CSM. Also, the split of LDW flow and
suspended sediment between the EW and WW will be estimated using the updated
hydrodynamic model.
n L J
c c p
"-
The updated hydrodynamic model will be run in a consistent method with the Sediment
Transport Analyses (STA) of the LDW model, in that high-flow events (such as 2- and 100-year
events in the Green River and LDW) wUl be examined for the EW. The hydrodynamic model
data will be used to analyze the erosion potential in the EW for these events. Based on existing
information for the EW, we anticipated that the erosion potential in the EW will be low, such
that simplified methods for sediment ttansport analysis can be used^.
L
L J
L l
LJ
2 The approach initially assumes that hydrodynamic modeling analyses of erosion potential will
not indicate that significant resuspension will occur under the most extreme tidal exchange or
flooding conditions in the Green River and Duwamish Waterway.
3 If the erosion potential is significant, then more detailed methods of sediment transport
analysis may be needed. This will be evaluated following the hydrodynamic analyses.
U
U
Final Sediment Transport Evaluation Approach MemorandumEast Waterway Operable Unit 37
>. yR ^ ~ '
December 2008 060003-01
LJ

Sediment Transport Evaluation Modeling Approach Selection and Data Needs Determination
The updated hydrodynamic model will also be used to confirm the natural physical
processes CSM directly for hydrodynamics and indirectly for sediment ttansport. The
direct confirmation of hydrodynamics will be based on velocity, salinity, and depth output
from the model. The indirect confirmation for sediment ttansport will be based on erosion
potential of the EW sediment bed and other indirect indicators of sediment transport
processes.
Evaluation of sediment transport from the LDW will primarily rely on empirical
calculations. The LDW sediment transport model will be utilized only to provide boundary
conditions to the EW (i.e., TSS concentrations in the LDW upstream of the Junction Reach)
for the empirical calculations, and will not be employed directly to predict sediment
transport within the EW*. Sediment transport ftom lateral sources will be evaluated using
localized stand-alone models (e.g., CORMIX or PTM) and empirical calculations. Final
determination of the sediment transport evaluation approach is subject to EPA approval. It
is currently assumed that the LDW will be used to provide boundary conditions. This
approach will be evaluated pending recalibration of the model.
Following refinement and validation of the CSM for the EW, an empirical sediment
transport evaluation will be conducted to assess MNR potential and sediment
recontamination potential. This evaluation will incorporate sediment loadings from the
LDW model, results from the updated hydrodynamic model, and geochronological cores to
estimate net sedimentation from undisturbed areas in the main body of the EW. This
information will be used to estimate residence time and trapping efficiency of the EW and
the contribution to the EW from lateral loading sources. A preliminary outline of the STA
approach steps is summarized below:
1. Collect bathymetty for the EW within the existing LDW hydrodynamic model in the
vicinity of the sill
2. Calibrate the updated LDW hydrodynamic model with site-specific velocity and
salinity profile data (to be collected in the fall of 2008). Specific attention will be paid
to calibration of bottom velocities.
3. Collect and analyze geochronological cores (fall of 2008)
* The existing sediment ttansport model of the LDW uses a hard bottom in the EW. Detailed
calibration would be needed if sediment transport modeling analyses are to be conducted.
Final Sediment Transport Evaluation Approach Memorandum >. December 2008 East Waterway Operable Unit 38 ^ ' 060003-01

Sediment Transport Evaluation Modeling Approach Selection and Data Needs Determination
4. Run the updated hydrodynamic model consistently with the STA approach used in
the LDW
5. Use results ftom the EW hydrodynamic model to: c a. Determine erosion potential (i.e., shear stresses) within the EW
b. Determine need for Sedflume cores [ c. Validate, and refine as necessary, the CSM for the EW
d. Estimate inflows (including the flow split) from LDW and the residence time of c EW
e. Compare results of the EW hydrodynamic model with the existing LDW model c to ensure that they do not differ fundamentally from each other.
6. Utilize data provided from erosion potential and from geochronological cores to c determine potential depositional areas and net deposition rates within the EW
(where propwash is not a significant factor). Erosion areas will also be identified
using these data. The recalibrated hydrodynamic model will be used to
confirm/refine the CSM. Based on that initial analysis, the methodology for :
determining loads from the LDW will be determined.
7. Apply results from the existing LDW sediment transport model to provide estimates
of sediment loading input to the EW from the LDW
8. Use a "box model" approach to evaluate: ^
a. Mass balance of sediment load from LDW and lateral loads to the EW; sediment
loading from LDW to the EW comes from P
LDW sediment load upstream of the Junction Reach ^
Newly estimated flow split to the Junction Reach from the updated r
hydrodynamic model L J
b. Trapping efficiency of the EW
9. Use a Lagrangian particle tracking model (such as PTM) or a localized plume model c (such as CORMIX) to estimate the conttibution to and distribution of lateral
sediment loads to the EW c The final selected approach will include coordination with EPA throughout the process. c Key milestones requiring EPA input include recalibration of the hydrodynamic model,
determination of need for Sedflume cores, and selection of particle tracking or localized c plume models.
Final Sediment Transport Evaluation Approach Memorandum ,. yft December 2008 East Waterway Operable Unit 39 ^ ' 060003-01 c
Sediment Transport Evaluation Modeling Approach Selection and Data Needs Determination
Data needs for this evaluation include bathymetry, short-term synoptic velocity, salinity,
and water level measurements, and geochronological cores within the EW.
3.5 Data Gaps Evaluation for Preferred Approach
The preferred approach for evaluating sediment transport natural processes must be
supported by information describing the physical processes in the EW. The existing
information has been identified in the EISR (Anchor and Windward 2008a) and briefly
discussed in Section 2 of this Memorandum.
As identified in the Physical Processes CSM (Anchor, Windward and Batteile 2008), there
are three reaches of the EW: the Junction Reach, the Sill Reach, and the Main Body Reach.
Each of these is subject to different hydrodjmamic conditions under the varying tidal and
flow regimes of Elliott Bay and the Green River, respectively. Additional information on the
hydrodynamic and sediment ttansport processes in each reach will help to refine the
Physical Processes CSM for the EW. The following subsections review the adequacy of the
existing information for the preferred approach and identify data needs that should be filled
with additional field investigations in the EW. In general, the data is needed to support the
calibration of the hydrodynamic model of the EW and the estimation of erosion potential of
the sediment bed. In addition, lateral flows and sediment loads are needed to evaluate
recontamination potential from those sources.
3.5.1 Review of Existing Information for Natural Processes Preferred Approach
The data presented in the EISR (Anchor and Windward 2008a) and reviewed in
Section 2 of this Memorandum are summarized in Table 3-3. The data are useful for
hydrodynamic and sediment transport analysis and will be incorporated into the
preferred approach, as appropriate.
The hydrodynamic data include a velocity profile at one location in the Junction Reach
and a point velocity time series at two locations within the Main Body Reach. The point
velocity data have been identified in the EISR (Anchor and Windward 2008a), and
surrmiaries of these data have been reviewed. However, the raw data have not been
located and may not be available for further analysis. The existing hydrodynamic data
also include tidal data from the Seattle waterfront and flow data from the Green River.
The existing sediment transport data include gross and net sedimentation rates
Final Sediment Transport Evaluation Approach Menwrandum i. yR December 2008 East Waterway Operable Unit 40 ^ ' 060003-01

c [
Sediment Transport Evaluation Modeling Approach Selection and Data Needs Determination
estimated from sediment traps and radioisotope measurements from high-resolution
sediment cores in the Main Body Reach of the EW. c Table 3-3
Available Data for Natural Processes Preferred Approach c 1 \ Useablefor
'-: J;.;^'--;-^ - . ' r .JDatav :,-.;• 1 • .^.^/STE-,;'-:;:.' c.: >:-;•: J D a t a ; ; - Source Location Description Period 1 Available? ] Development? Hydrodynamics
King cCounty WQA Junction High-frequency March
Velocity Profiles Analysis Reach of tiie ADP through Yes Yes (King EW measurements August 1997
County c 1999)
Near North High-frequency Harbor and South
S4 velocity March Island Rl Ends of the Not yet Yes, but not cPoint Velocity measurements through May (HISWG Main Body located * reviewed * 1 meter off ttie 1995 1996) Reach ofthe bottom EW cHigh-frequency NO/^ Seattle water surface Tidal Elevations (Station ID Continuous Yes Yes Waterfront elevation
9447130) measurements 15-minute to c
USGS Green River daily interval River Flows (Station Continuous Yes Yes at Aubum flow c1213000) measurements
Sediment Transport
Round 1: Near Nortii Used for gross March HartDor and Soutti sedimentation through May cIsland Rl Ends of the Sediment Trap rate estimation 1995 Yes Yes (HISWG Main Body 1 meter off the Round 2: May 1996) Reach of ttie
bottom through EW August 1995 c
Near North Radioisotope Harbor and Soutii
Used for net Analyses from High- Island Rl Ends ofthe Accumulation sedimentation Yes Yes cresolution Sediment (HISWG Main Body from 1950 rate estimation Cores 1996) Reach of ttie EW
* - Raw data have not been located. Summary data have been reviewed. cADP - Acoustic Doppler Profilers with Sontek current meters EW - East Waterway NOAA - National Oceanic and Atmospheric Administration RI - Remedial Investigation c STE - Sediment Transport Evaluation USGS - U.S. Geological Survey WQA - Water Quality Assessment c
r u
Final Sediment Transport Evaluation Approach Memorandum December 2008 East Waterway Operable Unit 41 • ^ , 060003-01 C

Sediment Transport Evaluation Modeling Approach Selection and Data Needs Determination
It is expected that the hydrodynamics and sediment ttansport characteristics will differ
between the three distinct EW reaches (i.e., the Junction Reach, the Sill Reach, and the
Main Body Reach). The existing information does not include full coverage of each of
the reaches. Also, for the hydrodynamic characterization, it is important to note that no
salinity profiles are available within the EW. While the existing information from the
EISR (Anchor and Windward 2008a) was used to develop the Physical Processes CSM in
the CSM and Data Gaps Analysis Report (Anchor, Windward and BatteUe 2008),
additional data are needed to support the implementation of the preferred approach.
3.5.2 Data Needs Identification
3.5.2.1 Hydrodynamic Characterization
Table 3-4 presents the data needs for the hydrodynamic characterization and model
calibration of the EW for the preferred approach for natural processes. Data needs
include detailed bathymetty, velocity, and salinity profiles from each reach. Because
bathymetty data ftom the Sill and Junction Reaches are limited, detailed bathymettic
data in those reaches is a required component to accurately estimate flows into and
through the EW.
A velocity profile in the Junction Reach was measured in 1997, but it is not
accompanied by salinity profile data to confirm the estuarine conditions.
Hydrodynamic data in the other reaches are not available. Additional velocity
profiles should be measured synoptically in each reach to evaluate how
hydrodynamic characteristics change from reach to reach under the same tidal and
Green River flow forcing.
Final Sediment Transport Evaluation Approach Memorandum i. y^ December 2008 East Watenvay Operable Unit 42 ^ - ' 060003-01

Sediment Transport Evaluation Modeling Approach Selection and Data Needs Determination
Table Z-4 Summary of Data Needs for Natural Processes Preferred Approach
Additional Sampling Required and General
Data Type Purpose Data Need Explanation Description Hydrodynamics EW Bathymetry Bathymetry influences the flow split from Uie Bathymetry data are available for ttie Main Yes, at ttie Sill and
LDW between the EW and WW. Body Reach (Anchor and Windward 20Q8a) but Junction Reaches ofthe not for tiie Sill and Junction Reaches. The data EW and at Slip 36. are critical to correctly computing the flow from the LDW.
EW Lateral Load- Discharge flows from the CSOs and stonn No flow data or very limited flow data from Flows are to be estimated Time-series of drains are needed fbr estimating contribution CSOs and stonn drains. as part ofthe Initial Source Flow from lateral solids loads. Saeening and Data Gaps
Memorandum. Salinity Profiles The data will be used fbr model validation in Salinity profile data for ttie EW are not Yes, at two stations in the
the EW. The estuarine conditions are available. Main Body Reach, one expected to produce stratified flow under station in ttie Sill Reach, varying tides and river flows. and one station in ttie
Junction Reach. Sampling will attempt to fit existing schedule.
Velocity Profiles The data will be used for model validation in Velocity profile data ft)r ttie Main Body and Yes, at two stations in the the EW. The estuarine conditions are Junction Reaches ofthe EW are not available. Main Body Reach and one expected to produce sfratified flow under Data from ttie WQA (King County 1999) are station each in the Sill varying tides and river flows. The net southeriy available, but they are ftir 1996-1997 with only Reach, Junction Reach, velodty in the bottom layers needs to be one station in the Junction Reach. Bottom and WW. Will be deployed verified and tiie net velocity in middle and velocity data in ttie Main Body Reach from ttie for 1 month: upper layers needs to be detennined. HariDor Island Rl (HISWG 1996) have not yet
been located. Sediment Transport EW Lateral Solids Solids loads from the CSOs and storm drains No flow data or very limited flow data from Solids loads are to be Load- are needed for estimating contiibution from CSOs and storm drains. estimated as part ofthe Solids lateral solids loads. Initial Source Screening Concentieition and Data Gaps Time-series Memorandum. Net Sedimentation Used lo estimate tiie accumulation of sediment Gross sediment rates have been estimated at Additional profiles from the Rate (e.g., in the bed. Note that sediment cores must be two stations in the Main Body Reach ofthe EW EW, including ttie Sill, radioisotope collected in areas that have not been disturbed at ttie same locations where net sedimentation Junction, and Main Body profiles) by dredging. rates have been estimated. Results indicate Reaches, depending on
that gross sediment rates are higher in the the ability to colled soutiiem end ofthe Main Body Reach. This undistijrtsed sediment may need to be confimied. Also, additional cores. stations are needed forthe Sill and Junction Reaches.
Sedflume Erosion Used to specify the characteristics ofthe No characterization of sediment shear strength The need and extent of Rates and Shear sediment bed pertaining to sediment or erosion rates has been done within the EW. Sedflume data will be Strengtii Profiles resuspension. The Sedflume method These will be needed for estimation ofthe detemiined Uirough
measures erosion rates and shear strengths erosion potential. discussions with EPA. throughout the sediment profile and ttiese are used as inputs to a sediment transport model. In combination with the net sedimentation rate data and fluid sfresses generated by tiie hydrodynamic model, the resuspension rate can be estimated. The sum ofthe net sedimentation rate and resuspension rate is the gross sedimentation rate.
CSO - combined sewer overflow EPA - U.S. Environmental Protection Agency EW East Waterway LDW - Lower Duwamish Waterway RI Remedial Investigation WQA - Water Quality Assessment V rn - West Waterway
December 2008 Final Sediment Transport Evaluation Approach Menwrandum ^ East Waterway Operable Unit 43 060003-01

Sediment Transport Evaluation Modeling Approach Selection and Data Needs Determination
3.5.2.2 Sediment Transport Characterization
Table 3-4 also presents the data needs for sediment transport evaluation. For the
preferred approach, net sedimentation rate and estimates of bottom shear stress and
sediment shear strength are needed in each reach. The analysis of erosion potential
needs an estimate of the sediment shear strength for comparison to estimated bed
shear sttess ftom hydrodynamic action. This is typically accomplished by the use of
Sedflume measurements of sediment cores. The Sedflume data include
measurements of erosion rate and shear sttength in the sediment profile. Sedflume
data has been collected for the LDW and may be utilized for the EW depending
upon results of the hydrodynamic analysis, evaluation of the geochronological cores,
and additional sediment characteristics for the EW. Sedflume data may be collected
specifically for the EW following discussions with EPA. The net sedimentation rate
data are used in combination with the sediment loading data and the defined
erosion/deposition potential areas to estimate the sediment trapping efficiency of the
EW.
High-resolution sediment cores have also been collected in the Main Body Reach of
the EW in 1997 for estimation of net sedimentation rates using radioisotope analyses.
Collection and radioisotope analyses of additional sediment cores within all three
reaches of the EW (Junction, Sill, and Main Body) are included in the preferred STE
approach. The core locations will focus on areas that have not been dredged recently
(from approximately 1964 through the present). Existing and available dredging
records and existing sediment core data will be utilized to assist with determination
of proposed core locations. However, because of the high degree of dredging in the
Main Body Reach, it may be difficult to find undisturbed locations within the reach.
As shown in Table 3-4, analysis of flows and solids concentrations in lateral solids
loads (e.g., storm drains and CSOs) are being proposed as part of the Initial Source
Screening and Data Gaps Memorandum (per the SCEAM process). When those data
are available, they will be incorporated into the STE.
Final Sediment Transport Evaluation Approach Memorandum /j y^ December 2008 East Watenvay Operable Unit 44 ^ * 060003-01

[Sediment Transport Evaluation Modeling Approach Selection and Data Needs Determination
[3.6 Sediment Transport from Vessel-induced Hydrodynamic Effects Modeling
Approach
Vessel-induced hydrodynamic effects (i.e., propwash, pressure fields, and vessel wakes) are c the second main component of the STE for the EW. Understanding these effects through
physics-based modeling and analysis is important to meet several of the objectives of the c STE, as listed below:
• Identify temporal and spatial patterns of sediment erosion and deposition (if c applicable)
• Identify the physical processes driving sediment transport c • Assess how sediment ttansport pathways may affect the feasibility of remedial
alternatives c • Assess potential for physical processes to contribute to recontamination
c The propwash, pressure field, and vessel wake modeling and analysis will be used to inform the STE and also to support initial screening of remedial alternatives for the EW as I ;
part of the FS. Evaluating vessel-induced hydrodynamic effects requires using specialized
methods since there are limited previously tested and accepted methods to conduct these
types of sediment transport evaluations. Each main hydrodynamic effect is discussed in c more detail below, with a description of the proposed modeling approach for each to inform
the STE. c 3.6.1 Propwash Modeling c Evaluating potential propwash effects on sediment stability and resuspension from
berthing and navigation of a vessel is a complex exercise because vessel operations can c occur at any location within the EW and at any tidal elevation and river flow condition.
Therefore, a two-step tiered process (i.e., deterministic and probabilistic analysis) would c be used to determine vessel-induced sediment resuspension and bottom scour.
c The deterministic analysis is the first tier and will define the specific limiting factors,
such as vessel type, maneuvering operations, and water depth that could induce c sediment resuspension and scour. The need for probabilistic analysis is dependent on
the evaluation of FS remedial alternatives and an assessment of the results of the c deterministic analysis. If the EWG and EPA determine there is a need to conduct
c Final Sediment Transport Evaluation Approach Memorandum >. y^ December 2008 East Watenvay Operable Unit 45 ^ * 060003-01
Sediment Transport Evaluation Modeling Approach Selection and Data Needs Determination
probabilistic analysis, it will be based on Monte Carlo simulations that incorporate
statistical parameters for such items as vessel location-based berthing schedules at each
terminal in the EW, duration of vessel operations, tide elevations, and other key
parameters. The results of the modeling and analysis will provide spatial displays of the
EW showing probability of sediment resuspension, scour locations, and scour depth.
The standard approach to modeling potential propwash impacts consists of using
1-dimensional (1-D) or 2-dimensional (2-D) steady-state physics-based models
developed by Albertson et al. (1948) and further modified by Blaauw and van de Kaa
(1978), Verhey (1983), Fuerher et al. (1987), Maynord (2000), Shepsis et al. (2000), and
others. These models are based on semi-empirical formation of the velocity field
generated by jets discharging as it expands into a volume of water. However, the fluid
structure simulated with 1- or 2-D models does not describe the complexity and spatial
variability of propwash flow and interaction of the flow field with the sediment bed. In
order to better simulate the propwash complexity, EWG proposes to use both 2-D and 3
dimensional (3-D) models to assess potential propwash impacts.
Hydrodynamic modeling for propwash is proposed to be conducted using the
numerical models JETWASH and VH-PU. JETWASH is a 2-D steady-state numerical
model that simulates propeller-generated velocity at 0.8 feet above the bottom surface
elevation. The model is applicable to both flat and sloped bottom topography. The
methodology used in the JETWASH model has been accepted by EPA Region 5,
including the methods used to determine granular sediment mobility based on
propeller-induced currents, regardless of duration of the current (Shaw and Anchor
2007).
The model selected wiU be based on the specific types of vessels, operational scenarios,
and ambient environmental conditions. It is pointed out that the proposed propwash
models have features not found with the model in Maynord (2000). For example,
JETWASH and VH-PU can model propwash velocities over sloped bottoms, whereas the
model in Maynord (2000) is limited to flat bottoms. Unlike the Maynord model,
JETWASH and VH-PU can also model cycloidal propellers and propwash from non-
Final Sediment Transport Evaluation Approach Memorandum * December 2008 East Waterway Operable Unit 46 ^ ' 060003-01
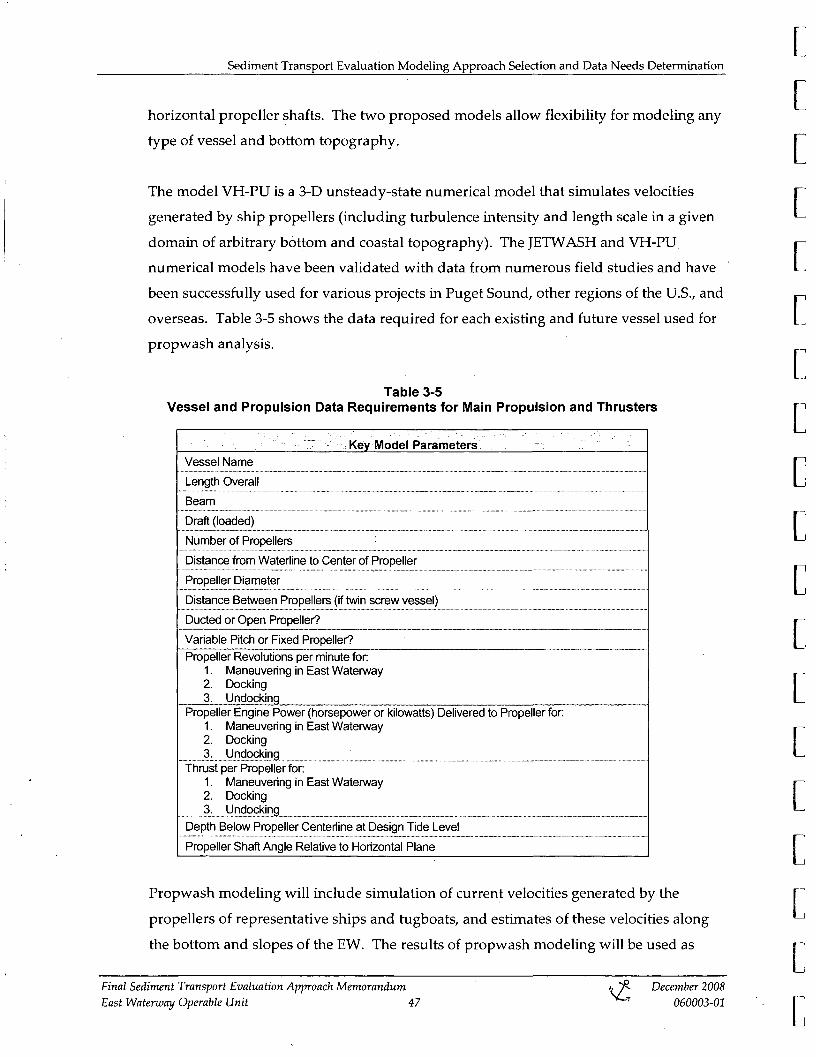
[Sediment Transport Evaluation Modeling Approach Selection and Data Needs Determination
Chorizontal propeller shafts. The two proposed models allow flexibility for modeling any
type of vessel and bottom topography. c The model VH-PU is a 3-D unsteady-state numerical model that simulates velocities
generated by ship propellers (including turbulence intensity and length scale in a given [ domain of arbittary bottom and coastal topography). The JETWASH and VH-PU
numerical models have been validated with data ftom numerous field studies and have c been successfully used for various projects in Puget Sound, other regions of the U.S., and
overseas. Table 3-5 shows the data required for each existing and future vessel used for c propwash analysis.
c Table 3-5
Vessel and Propulsion Data Requirements for Main Propulsion and Thrusters c Key Model Parameters
Vessel Name
Length Overall c Beam
Draft (loaded) cNumber of Propellers
Distance from Wateriine to Center of Propeller
Propeller Diameter c Distance Between Propellers (if twin saew vessel)
Ducted or Open Propeller?
Variable Pitch or Fixed Propeller? c Propeller Revolutions per minute for
1. Maneuvering in East Waterway 2. Docking c3. Undocking
Propeller Engine Power (horsepower or kilowatts) Delivered to Propeller for: 1. Maneuvering in East Waterway 2. Docking c3. Undocking
Thrust per Propeller for: 1. Maneuvering in East Watenway 2. Docking c3. Undocking
Depth Below Propeller Centerline at Design Tide Level
Propeller Shaft Angle Relative to Horizontal Plane c Propwash modeling will include simulation of current velocities generated by the cpropellers of representative ships and tugboats, and estimates of these velocities along
the bottom and slopes of the EW. The results of propwash modeling will be used as c Final Sediment Transport Evaluation Approach Memorandum December 2008 •<2 [East Waterway Operable Unit 47 060003-01
Sediment Transport Evaluation Modeling Approach Selection and Data Needs Determination
input parameters for sediment stability modeling to determine potential sediment depth
of scour, resuspension, and ttansport. The sediment stability model is based on a
standard approach using equations of fluid dynamics that considers two criteria for
initiation of sediment movement: flow velocity threshold and flow duration. The
sediment stability model has been developed specifically for the analysis of stability of
capping material for contaminated sediment and has been accepted by EPA Region 5,
the U.S. Army Corps of Engineers (USACE), and local and state agencies (Shaw and
Anchor 2007).
Input parameters for the modeling would consist of two dataset types: deterministic and
random. The deterministic dataset includes, but is not limited to, waterway bathymetry,
dimensions, and technical characteristics of propulsion systems for all vessels
(hereinafter referred to as "impact vessels") considered in propwash, bottom sediment,
and tide elevation. (Please note that for propwash modeling, tide elevation is
considered a deterministic input factor. In other types of modeling, tide elevation
would be considered as a random input parameter). The random dataset would only be
used if the deterministic analysis indicated the need to conduct further probabilistic
analysis (per discussion with EWG and EPA) and includes, but is not limit to,
occurrence of a specific impact vessel, vessel position in the EW, vessel speed, and
operating characteristics of the propulsion system relative to the rated characteristics
(for example, applied shaft power relative to the rated power). Random input
parameters would be statistically estimated and assigned with certain statistical
distributions to be used further in the probabilistic Monte Carlo simulations.
Data needs for propwash modeling will include the input parameters identified in
Table 3-5. All of the data needs from Table 3-5 are typically obtainable from vessel
manufacturers, interviews with pilots, and marine facility operations managers. For the
needs of the SRI/FS, site- and vessel-specific calibration field data are not anticipated to
be necessary in order for this modeling approach to meet the STE objectives.
3.6.2 Pressure Field Modeling
Because of the typically slow operating speeds of vessels within the EW, the EWG
anticipates that pressure field impacts to sediment transport processes will be negligible.
Final Sediment Transport Evaluation Approach Menwrandum * ^ December 2008 East Watenvay Operable Unit 48 ^ * 060003-01
[Sediment Transport Evaluation Modeling Approach Selection and Data Needs Determination
[To verify this expectation, pressure field analysis will be conducted in two tiers. The
first tier involves analyzing deep-draft vessel operational conditions in the EW. The first ctier of analysis will assess the potential for vessels using the EW to generate significant
pressure field effects in the EW. It is possible (and likely) that vessel speeds are
insufficient to create pressure fields that induce hydrodynamic effects sufficient to c resuspend and ttansport sediment. However, if the first tier review results in
determining that there is indeed potential for significant impacts, the second tier of the c study (detailed hydrodynamic modeling and analysis of pressure field effects) will be
initiated. c If necessary, second-tier modeling involves conducting hydrodynamic modeling of c pressure field effects using the 3-D model VH-LU. The VH-LU model simulates water
surface elevations and velocities in the modeling domain during passage of a vessel [ through a channel. Results of pressure field modeling, wave parameters, and bore
velocities may then be used as input parameters for sediment stability analysis.
Input parameters for the modeling include, but are not limited to, waterway
bathymetry, tonnage of vessels, vessel speed, vessel relative position, bottom sediment
characteristics, and tidal elevation. Data needs for pressure field analysis are typically
obtainable from vessel manufacturers, interviews with pilots, waterway speed c restrictions, and marine facility operations managers. For the needs of the SRI/FS, site
and vessel-specific calibration field data are not anticipated to be necessary in order for c this modeling approach to meet the STE objectives.
c 3.6.3 Vessel Wake Modeling
Because of the typically slow operating speeds of vessels within the EW, the EWG c anticipates that vessel wake impacts to sediment resuspension and ttansport processes
will be negligible. To verify this expectation, a vessel wake sediment resuspension c analysis will be conducted using the 2-D model SHIPWAVE. This modeling approach
can provide a simple analysis to assess the potential for resuspension of sediment from c vessel-generated wakes within the EW. The SHIPWAVE model simulates propagation
of near-field wakes generated by the vessel hull to the nearshore areas, and computes c velocities and shear stresses on the bottom and slopes. The SHIPWAVE model has been
[Final Sediment Transport Evaluation Approach Memorandum i. yft December 2008 East Waterway Operable Unit 49 ^ ~ ' 060003-01
[

Sediment Transport Evaluation Modeling Approach Selection and Data Needs Determination
successfully used for a number of projects in Puget Sound, San Francisco Bay, and other
regions of the U.S. The results of the SHIPWAVE modeling will be reviewed to assess a
vessel's potential to generate sufficient velocities (from waves) to resuspend sediment
within the EW.
Major input parameters for the SHIPWAVE modeling include waterway bathymetty
and near-field wake train parameters. Near-field wake train parameters represent water
motion at the location of vessel wake formation in close proximity to the moving hull.
Near-field wake ttain parameters may be obtained from existing databases (previous
measurements or Computational Fluid Dynamics computations) or may be computed
analytically using appropriate empirical/analytical procedures. For analytical
computations, the following parameters may be required: tonnage of vessel, vessel
speed, vessel relative position, bottom sediment characteristics, and tidal elevation.
Data needs for vessel wake modeling are typically obtainable from vessel
manufacturers, interviews with pilots, waterway speed restrictions, and marine facility
operations managers. For the needs of the EW SRI/FS, site- and vessel-specific
calibration field data are not anticipated to be necessary in order for this modeling
approach to meet the STE objectives.
3.6.4 Monte Carlo Simulations
If evaluation of FS remedial alternatives and the magnitude and extent of propwash
effects indicates a need to conduct additional probabilistic analysis (i.e., tier 2), then the
Monte Carlo approach will be utilized. Input parameters and results from the propwash
analysis will be used for Monte Carlo simulation to evaluate potential for scour
throughout the EW. The EW would be divided into sectors based on waterway use and
physical characteristics. These sectors may or may not be the same as the three reaches
identified in this Memorandum (i.e., the Junction, Sill, and Main Body Reaches).
Simulation would then be conducted for each sector of the waterway. The output of the
Monte Carlo modeling would include probability of occurrences of resuspension (and/or
scour) of bottom sediment at each of the EW sectors due to propwash. The probability
of occurrence of scour depth will be determined. Also, the Monte Carlo simulation
would help to assess the potential risk of using various remedial alternatives, including
stability of potential capping at the channel bottom or sideslopes. An example of a
Final Sediment Transport Evaluation Approach Memorandum h y^ December 2008 East Waterway Operable Unit 50 ' 060003-01
[Sediment Transport Evaluation Modeling Approach Selection and Data Needs Determination
c Monte Carlo simulation is shown in Figure 3-1. The figure shows the probability of
stability of different sizes of capping material relative to propwash scour, based on csimulations of 10,000 cases of input parameters.
[ c c c c c c D c c c c c c [
Final Sediment Transport Evaluation Approach Memorandum i. y^ December 2008 East Waterway Operable Unit 51 ^ ~ ' 060003-01 [

Next Steps and Future Deliverables
4 NEXT STEPS AND FUTURE DELIVERABLES
This STEAM focuses on outlining various STE approaches and selecting a preferred approach to
evaluate sediment ttansport physical processes within the EW, including sediment ttansport
due to natural processes and vessel-induced hydrodynamic effects. The EWG has discussed the
STE with EPA (and its technical experts from USACE) and EWG, and a consensus approach is
presented in Section 3.4.
The EWG recognizes that the preferred approach presented in this Memorandum may need to
be refined as we work with EPA to approve model selection and methodology, key modeling
parameters, evaluation assumptions, and subsequent evaluation steps. It is important to note
that the preferred approach does have risks associated with meeting the original Workplan
schedule (Anchor and Windward 2007), primarily due to the potential need to re-calibrate the
hydrodynamic model. However, EWG considers the preferred approach to be the approach
that most closely meets the selection criteria (Section 3.4).
The STE results will be summarized in the Sediment Transport Evaluation Report, and the
results will be used to help refine the Physical Processes CSM. Eventually, as part of the SRI
Report, the sediment transport processes will be integrated with Source Control Evaluation
work. The FS will assess sediment recontamination potential. Following EPA review and
approval of the STEAM, the steps listed below are anticipated, as previously discussed in
Section 1.3:
• Establish STE workgroup and develop detailed STE modeling methodology with
workgroup input
. Develop field sampling program (i.e., QAPPs) to fill the data needs
• Conduct field sampling investigations after review and approval of the STE QAPPs by
EPA
. Develop and run the STE models based on the approved STE modeling methodology
• Prepare Sediment Transport Evaluation Report
• Refine Physical Processes CSM in the SRI Report
• Integrate STE results with Source Control Evaluation results to assess recontamination
potential in the FS Report
Final Sediment Transport Evaluation Approach Memorandum * y^ December 2008 East Watenvay Operable Unit 52 ^ " 060003-01

References
5 REFERENCES
Albertson, M.L., Y.B. Dai, R.A. Jensen, and Hunter Rouse. 1948. Diffusion of Submerged Jets.
Proceedings of the American Society of Civil Engineers, Paper No. 2409. P. 639-697.
Anchor and Windward. 2007. East Waterway Operable Unit, Supplemental Remedial
Investigation/Feasibility Study, Final Workplan. Prepared for Port of Seattle.
Anchor and Windward. 2008a. East Waterway Operable Unit, Supplemental Remedial
Investigation/Feasibility Study, Final Existing Information Summary Report. Prepared
for Port of Seattle.
Anchor and Windward. 2008b. East Waterway Operable Unit, Supplemental Remedial
Investigation/Feasibility Study, Final Source Control Evaluation Approach
Memorandum. Prepared for Port of Seattle.
Anchor, Windward and Batteile. 2008. East Waterway Operable Unit, Supplemental Remedial
Investigation/Feasibility Study, Draft Final Conceptual Site Model and Data Gaps
Analysis Report Prepared for Port of Seattle.
Blaauw, H.G. and E.J. van de Kaa. 1978. Erosion of Bottom and Sloping Banks Caused by the
Screw-Race of Maneuvering Ships. International Harbour Congress. Antwerp, Belgium.
DEA. 2003. Bathymetric survey East Duwamish Waterway. Prepared for Windward
Enviroiunental, L.L.C. by David Evans and Associates, Inc. January 8, 2003.
EPA. 2006. Administrative settlement agreement and order on consent for the supplemental
remedial investigation and feasibility study of the East Waterway Operable Unit of the
Harbor Island Superfund site. U.S. Environmental Protection Agency, Region 10,
Seattle, WA.
Evans Hamilton. 1996. Denny CSO Oceanographic Data Interpretation. Prepared for King
County Metro, Seattle, Washington.
Final Sediment Transport Evaluation Approach Memorandum i, y^ December 2008 East Watenuay Operable Unit 53 ^ ' 060003-01
References
Fuehrer, M., Pohl, H. and K. Roemisch. 1987. Propeller Jet Erosion and Stability Criteria for c Bottom Protections of Various Constructions. Bulletin of the P.I.A.N.C. No. 58. P. 45-56. c
HISWG. 1996. Harbor Island Sediment Operable Unit - Supplemental Remedial Investigation
- Draft Volumes 1 and 2. Submitted to U.S. Environmental Protection Agency, Seattle, c WA. Prepared by EVS Consultants, Seattle, WA. Harbor Island Sediment Work Group.
March.
King County. 1999. King County combined sewer overflow water quality assessment for the
Duwamish River and Elliott Bay. Vol. 1: Overview and interpretation, plus appendices. m
King County Department of Natural Resources, Seattle, WA.
Maynord, Steven. 2000. Physical Forces near Commercial Tows. Interim Report for the Upper
Mississippi Rive - Illinois Waterway System Navigation Study. U.S. Army Corps of
Engineers ENV Report 19.
McLaren P. and P. Ren. 1994. Sediment transport in Elliott Bay and the Duwamish River, n
Seattle: Implications to estuarine management. Prepared for Washington Department of
Ecology. GeoSea Consulting (Canada) Ltd., Salt Spring Island, BC. May.
McNeil, J., C. Taylor, W. Lick. 1996. Measurements of Erosion of Undisturbed Bottom
Sediments with Depth. Journal of Hydraulic Engineering 122(6): 316-324. L J
NOAA. 2004. National Oceanic and Atmospheric Administration Nautical Chart #18450 - c Seattle Harbor, Elliott Bay, and Duwamish Waterway. 18* Edition. February 1. c
QEA. 2007. Lower Duwamish Waterway Sediment Transport Modeling Report - Draft.
Prepared for U.S. Environmental Protection Agency, Region 10, and Washington State c Department of Ecology - Northwest Regional Office. Quantitative Environmental
Analysis LLC. July.
c c
Final Sediment Transport Evaluation Approach Memorandum * y^ December 2008 East Waterway Operable Unit 54 ^ * 060003-01 c
References
Shaw and Anchor. 2007. Lower Fox River 30 Percent Design Report. Prepared for Fort James
Operating Company, Inc. and NCR Corporation by Shaw Environmental &
Infrastructure, Inc. and Anchor Environmental, L.L.C. November 30, 2007.
Shepsis, V. and D. Simpson. 2000. Propwash Modeling for CAD Design, Contaminated
Sediment Conference, Massachusetts Institute of Technology (MIT), Boston, 2000.
USACE. 2005. Howard Hanson Dam Reservoir Operations and Sediment Management Plan
for Water Year 2006, Appendix C: Water Quality Sampling and Analysis Plan. Prepared
by U.S. Army Corps of Engineers, Seattle District, Water Management Section, Seattle,
Washington. December.
Verhey, H.J. 1983. The Stability of Bottom and Banks Subjected to the Velocities in the
Propeller Jet Behind Ships. In Proceedings of the 8th International Harbour Congress.
Antwerp, Belgium. June 13-17.
Weston. 1993. Harbor Island remedial investigation report Prepared for U.S. Environmental
Protection Agency, Region 10. Roy F. Weston, Inc., Seattle, WA.
Windward and QEA. 2008. Sediment Transport Modeling Report - Final. Prepared for U.S.
Environmental Protection Agency, Region 10, and Washington State Department of
Ecology - Northwest Regional Office. Windward Environmental LLC and Quantitative
Environmental Analysis LLC.
Wool, T.A., R.B. Ambrose, J.L. Martin, and E.A. Comer. 2001. Water Quality Analysis Program
(WASP) V. 6.0. Draft: User's Manual. U.S. Environmental Protection Agency - Region 4,
Atianta, GA.
Final Sediment Transport Evaluation Approach Memorandum i. y^ December 2008 East Watenvay Operable Unit 55 ^ - ' 060003-01

FIGURES

Figure 1-1 Vicinity Map and Proposed East Watenway SRI/FS Boundary
Sediment Transport Evaluation Approach Memorandum East Watenway Operable Unit

IT T 7 — i r - - ,
T^jy^|[\|Ai .?n
CjtM^T GUARS /
PIEk 36 - PIER 37
t f •.^;,,v:-«^«^ * ' 7 * " ' i i
TERMIf|f^Ld6. .*
p . .*-..._n
A^ILM
LEGEND
, . . . INNER HARBOR LINE/PROPERTY LINE
PROPOSED EAST WATERWAY OPERABLE UNIT BOUNDARY
MHHW LINE
•
®
CSO LOCATION
APPROXIMATE STORM DRAIN LOCATION
Note: Previously established station locations for the East Watenvay are shown along the westem shoreline for reference. 600
Scale in Feet
Figure 1-2 Major East Watenway Features
Sediment Transport Evaluation Approach Memorandum East Watenway Operable Unit

PROPOSED EAST WATERWAY OPERABLE UNIT BOUNDARY
MHHW LINE
400
Scale in Feet
Notes: 1. Existing bathymetry from David Evans Associates dated 2003 and Blue Water Engineering dated 2004. 2. Bathymetry contours shown at 2-foot intervals (MLLW). 3. Bathymetry soundings are available for the area south of the Spokane Street corridor, as shown on NOAA Nautical Chart #18450 (Edition 2/1/08).
Figure 1-3A Existing Bathymetry
Sediment Transport Evaluation Approach Memorandum East Waterway Operable Unit

3 P/f/? / 7
E L L I O T T B A Y
E I
LEGEND
PROPOSED EAST WATERWAY OPERABLE UNIT BOUNDARY
MHHW LINE
to
o a.
o
E MARGINAL WAY S
ALASKAN WAY VIADUCT
400
Scale in Feet
Notes: 1. Existing bathymetry from David Evans Associates dated 2003 and Blue Water Engineering dated 2004. 2. Bathymetry contours shown at 2-foot intervals (MLLW).
Figure 1-3B Existing Bathymetry
Sediment Transport Evaluation Approach Memorandum East Waterway Operable Unit

Daily River Flow at Auburn
15000 •
10000 1 ll
5000
0 ^k imAkiki \ M M X 1/1/1960 1/1/1970
u. ykAWM-k uik likllLLLJiUj JJb 1/1/1980 1/1/1990 1/1/2000
Daily River Flow at Tukwila 20000
.. ! . \ L . ^ 15000
10000
5000 iikMiiilUioyLlliLulUll—~t—' T — 1/1/1960 1/1/1970 1/1/1980 1/1/1990 1/1/2000
5000
Annual Flow J • • USGS station 12113000 at Aubum
^ m USGS station 12113350 at Tuliwiia 4000
-^ 3000 i
5 2000 o "• 1000 llllllllllllllll IIII ll II lllll. illllUllllllll li
I960 1965 1970 1975 1980 1985
Figure 2-1 River Flow at USGS Auburn and Tukwila Gauge Stations Sediment Transport Evaluation Approach Memorandum
East Waterway Operable Unit

Figure 2-2 Velocity and NOAA Tide Measurement Stations
Sediment Transport Evaluation Approach Memorandum East Waterway Operable Unit

Tide Elevation at Seattle
1/1/1996 2/1/1996 3/1/1996 4/1/1996 5/1/1996 6/1/1996 7/1/1996 8/1/1996 9/1/1996 10/1/1996 11/1/1996 12/1/1996
Date
Tide Elevation at Seattle
1 1
1/1/1997 2/1/1997 3/1/1997 4/1/1997 5/1/1997 6/1/1997 7/1/1997 8/1/1997 9/1/1997 10/1/1997 11/1/1997 12/1/1997
Date
Tide Elevation at Seatt le
1/1/2007 2/1/2007 3/1/2007 4/1/2007 5/1/2007 6/1/2007 7/1/2007 8/1/2007 9/1/2007 10/1/2007 11/1/2007 12/1/2007
Date
Figure 2-3 Tide Elevation During ADP Measurement Periods
Sediment Transport Evaluation Approach Memorandum East Waterway Operable Unit

Notes
1. Previously established station locations for the East Waterway are shown along the westem shoreline for reference.
2. Current meters and sediment trap deployed
King County WQA velocity sampling location during Spring 1995. Figure 2-4
Near-Bottom Velocity and Sediment Trap Sampling Locations Sediment trap and near-bottom velocity sampling locations 3. King county WQA velocity sampling I Sediment Transport Evaluation Approach Memorandum
conducted in 1996. j East Waterway Operable Unit

Corrected Cs-137 Corrected PCB
• ^
20 - 20 7^ f •
E E 1974
o 40 - o 40 1965-Teak • - ,
Q. Q. / (D
Q Q »60 60 c C « « 0) • P> "? •
E E 0) 80 - 80 W CO
•
100 - 100 • •
120 I I I I I I I I r I I 120 ' l 1 1 1 1 1 1 1 1 1 I t T 1 I l l l I l l l
0.0 0.5 1.0 1.5 2.0 0 50 100 150 200 250
Corrected Cs-137 (DPM/g) Corrected PCB (mg/kg oc)
- • - HI-NR-03 - • - HI-NR-03 - • - HI-NR-04 -^— HI-NR-04
1
Note: The data are from HISWG (1996). Note that the dating of the Cesium-137 (Cs-137) profiles differs based on whether the first appearance of Cs-137 is used (1950) or the peak levels of Cs-137 are used (1965). The estimated sedimentation rates in HISWG (1996) were based on the averages of the estimates.
Figure 2-5 Cesium-137 and PCB Profiles from the East Waterway used for Dating and Estimation of Sedimentation Rates
Sediment Transport Evaluation Approach Memorandum East Waterway Operable Unit
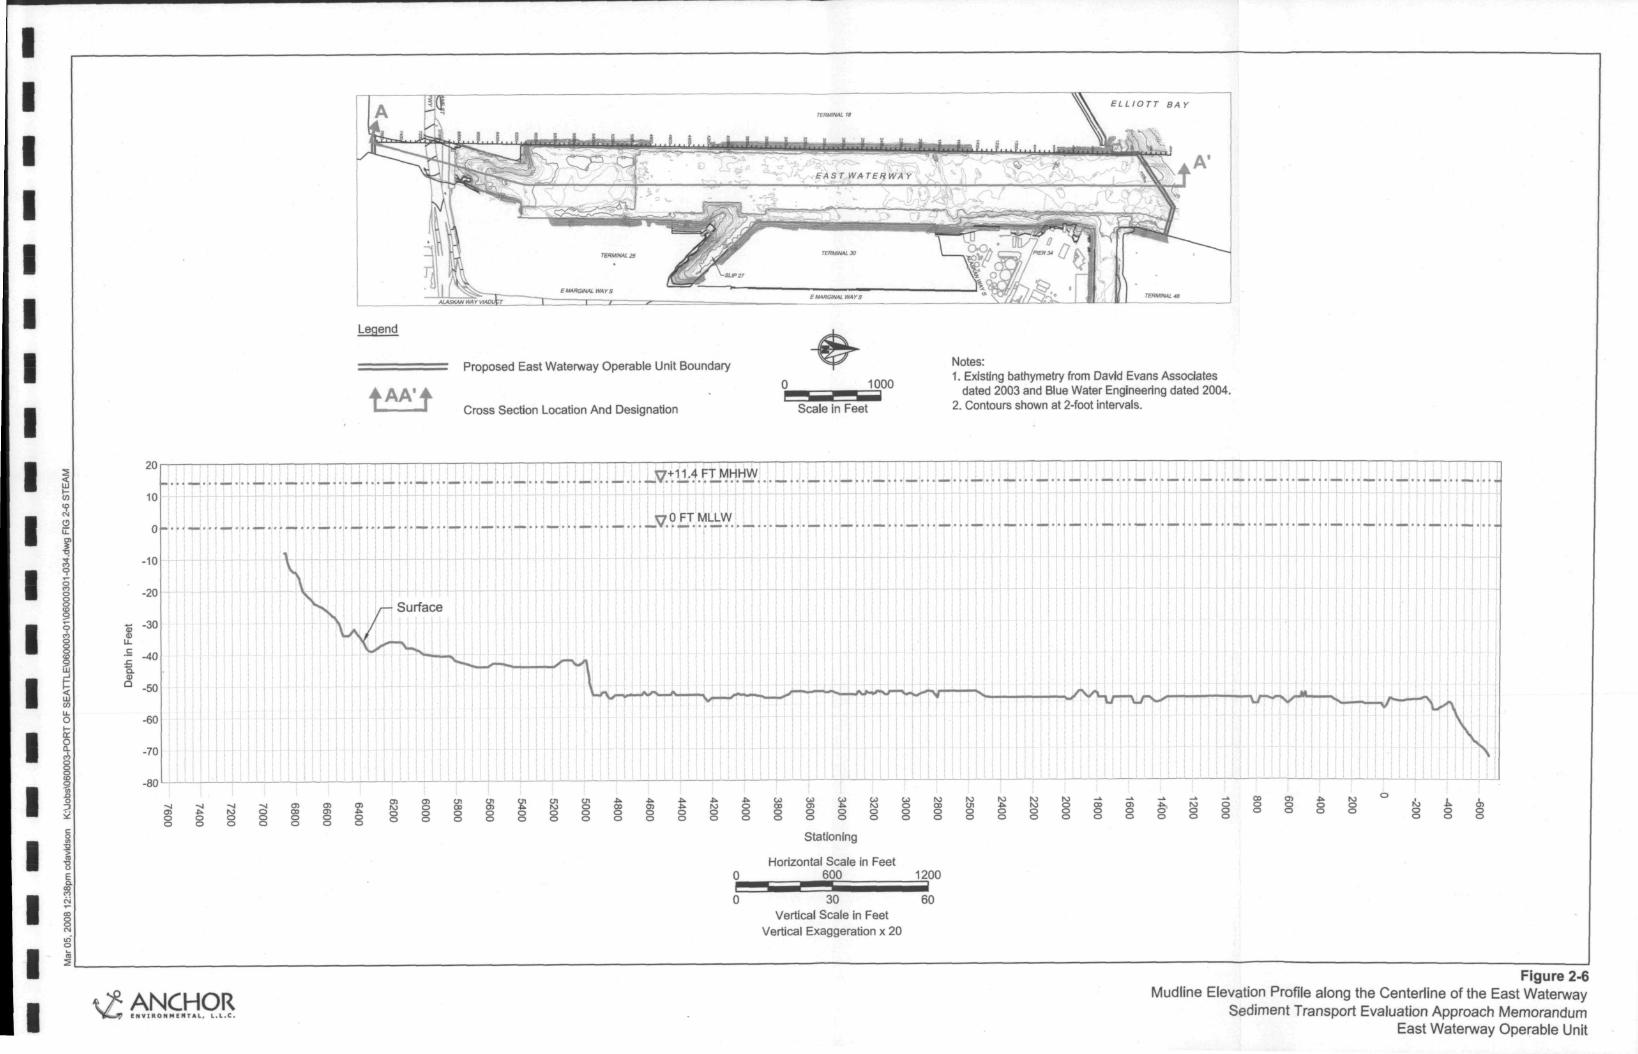
11 1 ll J
E L L I O T T BAY
Legend
tAAVf Proposed East Watenway Operable Unit Boundary
Cross Section Location And Designation
0 1000
Scale in Feet
Notes: 1. Existing battiymetry from David Evans Associates
dated 2003 and Blue Water Engineering dated 2004. 2. Contours shown at 2-foot intervals.
2< UJ I -co
201
10 .,...^. iiJ. |iJ.Lj.j.lu:. uj..Ui.;.-fN-U-h-Uli-l+i H+l-ii-H'i-il^-l-*^-^-'^''-^^^": ft^i-^H-H-H-i+H-i+Hi-^4i-tt-Htl-n^l t t i i rnrmiTnltrtirrrfiTTiriThiTrtlTi r1^-rifl-i tti-i \t i M1 ! 1 1 11 i 1 1! ! 1111! 1111 1 1! 1 1 ! 1 1H1 ^
0 : i i 11 i
-•• < - W ! i i 1 i 11 111 M 1 1 i 1 11 11 i I 1 ll i i; OOFT'MLLW: Mi M
t"Hr mrrnr ' rr i rfti*n'H'TH'TrtlT"H+i*M^ i tt l r rr" . •— - TH' Th' M'J u.[i 11 1! '1 \\U L JJ l U [n UJ IlJ Lu LL LL J LLL 11 1 1'n"niTr n i' 11"'r m r.Tm T m l til* nl i M 1 n Tn I'M n i T n i T ' I T
J l 1 1 1 L MT tiT m i
JJ1
1
-10 - ' M l N-1-1 M M " — r i !rrTi"ni 1 i 1"M M 1" 1M j 1 1 11 ! MM M M M M M 1 M ^ ^ ^ ^ ^ ^ ^ ^ ^ M M
-20
' ' 1 1 j 1 1 j 1 11 1 1 1 1 i [Hil i 11 j Ij-j Surface 1 1 11 1 1 1 11 11111 1 1 11 ! j 11 1 1 m M 1 l l l i 1 111 l i l i j j [ I l u l JJ J IL iJ U U U .
• -4U 11M1 MTtiiM''*Wi'H' ^ ' MM riri MTI 11 t i ii riTi u i ITii i i m riTi ITI MTI rf I I I I ITI i M I T I I n Tf Tf i <
° -50 M 1 1 i 1 i 111II1111 i 1111 1 y rL-l 11 \'\ I T I i l l >r yA • i> I l* ' ["i '"f " rf'^ '^f' i* \- ^ T H M i M Ll'^'Vi 11 i ' ji-«L L M 1 M ' LLH* wi ' M ' 1 M ' i 11' 1 H LU CO u. O -60 I a.O ac o o o
-70
-fin
H LU i' m ' ' ' ' • ' ' ' ' ' ' ' ' ' ' L ' ' M i . j 11 M! 111! 1 M 1 ! I M M 1 I I I I I I ! I I 1 ! I M M II
o -vi0 5O O
->] * -
O O
O O
-vl M
-~JOOO
CJ) CD
O o
O) CJ) o o o o
O) N3 O o
CB o o o
O l 00 o o
CJI O)
o s o
O l N) o o
tn o o o
A
95 o o
- O) o o
• ^
o
^ o o
_Q O
Od 00 o o
CO O i
o
iJ o o
CO M o o
CO o o o
N) 00 o o
ro O l o o
NJ
*. O o
ho IV3 O O
M O O o
_ k
00 o
_ k
o
_ k
*. o
_ k
o
_ A
o
00 O) o o
.tk o o
ho o o o
o o
o at o o
Stationing
Horizontal Scale in Feet 0 600 1200
0 30 60 Vertical Scale in Feet
Vertical Exaggeration x 20
Figure 2-6 Mudline Elevation Profile along the Centerline of the East Waterway t / ANCHOR Sediment Transport Evaluation Approach Memorandum
W * m ^ C N V I K O N M E N T A L , L . L . C .
East Waterway Operable Unit
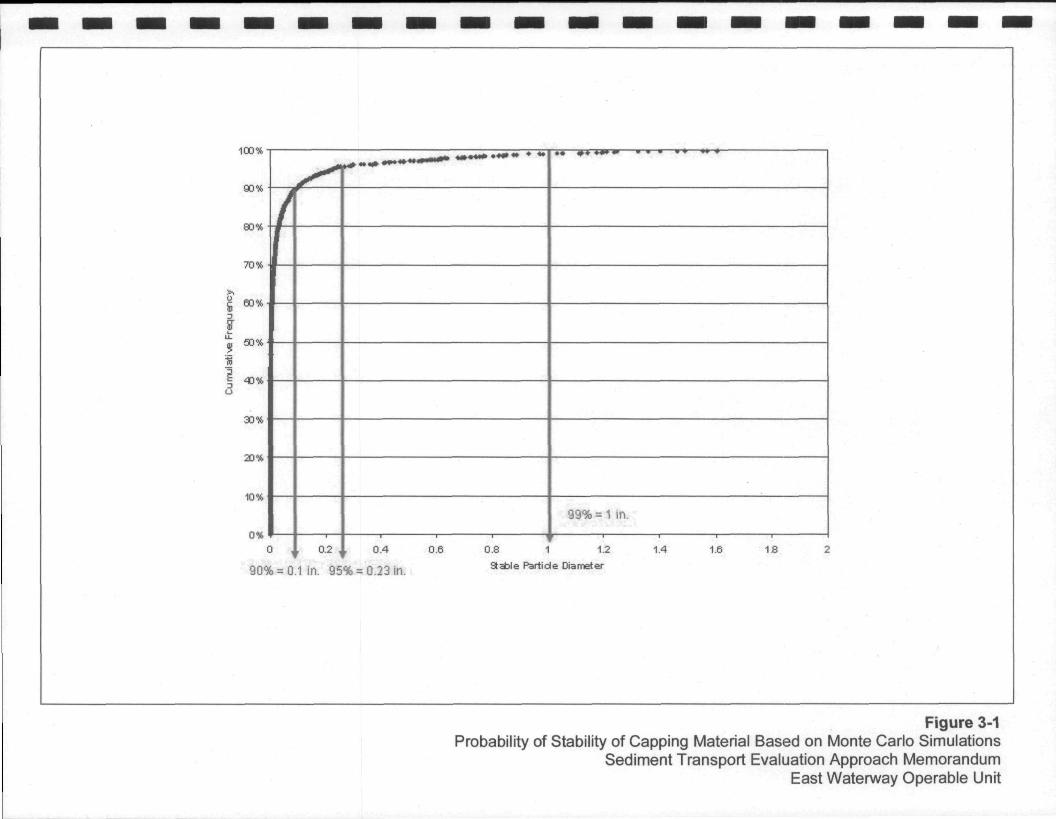
•
•• #« *«*»
90% •
80% /
/
^ m<«.J 5 60%
" 30%
o
30%
20%
10%
99% = l i n .
C ^ 0.2 1 0.4 0.6 0.8 1 1.2 1.4 1.6 IS 2
90<X ) = 0 . 1 i n . 95% =0.23 in. aable Partide Diameter
1 .1
Figure 3-1 Probability of Stability of Capping Material Based on Monte Carlo Simulations
Sediment Transport Evaluation Approach Memorandum East Watenway Operable Unit