Embed Size (px)
Citation preview

PORTFOLIO ADDITIONAL ESTIMATES STATEMENTS 2013-14
ENVIRONMENT PORTFOLIO
EXPLANATIONS OF ADDITIONAL ESTIMATES 2013-14
© Commonwealth of Australia 2014
ISBN 987176004 4299
This publication is available for your use under a Creative Commons BY Attribution
3.0 Australia licence, with the exception of the Commonwealth Coat of Arms, the
Environment Portfolio logo, photographs, images, signatures and where otherwise
stated. The full licence terms are available from http://creativecommons.org/licenses/by/3.0/au/legalcode.
Use of Environment Portfolio material under a Creative Commons BY Attribution 3.0
Australia licence requires you to attribute the work (but not in any way that suggests
that the Environment Portfolio endorses you or your use of the work).
Environment Portfolio material used 'as supplied'
Provided you have not modified or transformed Environment Portfolio material in any
way including, for example, by changing the Environment Portfolio text; calculating
percentage changes; graphing or charting data; or deriving new statistics from
published Environment Portfolio statistics – then Environment Portfolio prefers the
following attribution:
Source: The Australian Government Environment Portfolio.
Derivative material
If you have modified or transformed Environment Portfolio material, or derived new
material from those of the Environment Portfolio in any way, then Environment
Portfolio prefers the following attribution:
Based on The Australian Government Environment Portfolio data.
Use of the Coat of Arms
The terms under which the Coat of Arms can be used are set out on the It’s an Honour
website (see www.itsanhonour.gov.au)
Other Uses
Inquiries regarding this licence and any other use of this document are welcome at:
First Assistant Secretary, Policy and Communications Division in the
Department of the Environment on (02) 6274 1401.
iii
GREG HUNT
PARLIAMENT HOUSE
CANBERRA 2600
President of the Senate
Australian Senate
Parliament House
CANBERRA ACT 2600
Speaker
House of Representatives
Parliament House
CANBERRA ACT 2600
Dear Mr President
Dear Madam Speaker
I hereby submit Portfolio Additional Estimates Statements in support of the
2013-14 Additional Estimates for the Environment Portfolio.
These statements have been developed, and are submitted to the Parliament, as a
statement on the funding requirements being sought for the Portfolio.
I present these statements by virtue of my ministerial responsibility for accountability
to the Parliament and, through it, the public.
Yours sincerely
iv
Abbreviations and conventions
The following notations may be used:
NEC/nec not elsewhere classified
- nil
.. not zero, but rounded to zero
na not applicable (unless otherwise specified)
nfp not for publication
$m $ million
Figures in tables and in the text may be rounded. Figures in text are generally rounded
to one decimal place, whereas figures in tables are generally rounded to the nearest
thousand. Discrepancies in tables between totals and sums of components are due to
rounding.
ENQUIRIES
Should you have any enquiries regarding this publication please contact Lily
Viertmann, Chief Financial Officer in the Department of the Environment
on (02) 6274 1812.
A copy of this document can be located on the Australian Government Budget website
at: http://www.budget.gov.au.
USER GUIDE TO THE
PORTFOLIO ADDITIONAL ESTIMATE STATEMENTS


vii
USER GUIDE
The purpose of the Portfolio Additional Estimates Statements (PAES), like that of the
Portfolio Budget Statements (PB Statements), is to inform Senators and Members of
Parliament of the proposed allocation of resources to Government outcomes by
agencies within the portfolio. The focus of the PAES differs from the PB Statements in
one important aspect. While the PAES include an Agency Resource Statement to
inform Parliament of the revised estimate of the total resources available to an agency,
the focus of the PAES is on explaining the changes in resourcing by outcome(s) since
the Budget. As such, the PAES provides information on new measures and their
impact on the financial and/or non-financial planned performance of programs
supporting those outcomes.
The PAES facilitate understanding of the proposed appropriations in Appropriation
Bills (Nos. 3 and 4) 2013-14. In this sense the PAES is declared by the Additional
Estimates Appropriation Bills to be a ‘relevant document’ to the interpretation of the
Bills according to section 15AB of the Acts Interpretation Act 1901.
Whereas the Mid-Year Economic and Fiscal Outlook (MYEFO) 2013-14 is a mid-year
budget report which provides updated information to allow the assessment of the
Government’s fiscal performance against its fiscal strategy, the PAES update the most
recent budget appropriations for agencies within the portfolio.
User Guide
viii
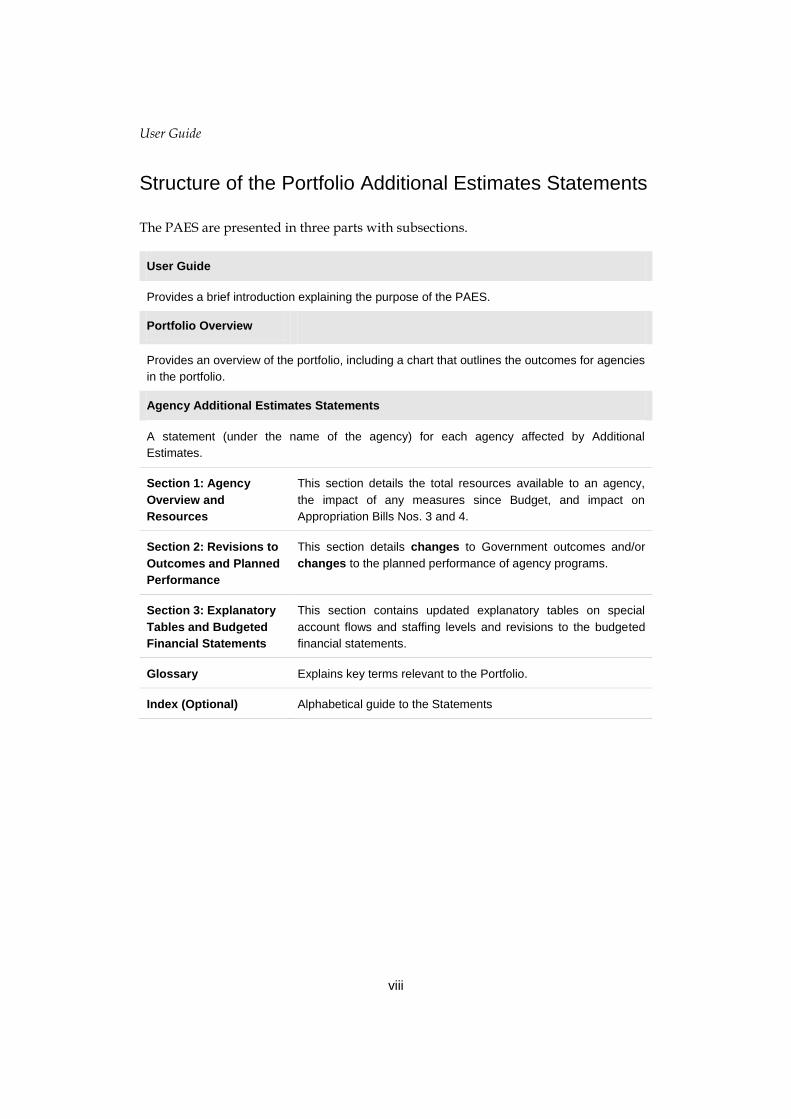
Structure of the Portfolio Additional Estimates Statements
The PAES are presented in three parts with subsections.
User Guide
Provides a brief introduction explaining the purpose of the PAES.
Portfolio Overview
Provides an overview of the portfolio, including a chart that outlines the outcomes for agencies
in the portfolio.
Agency Additional Estimates Statements
A statement (under the name of the agency) for each agency affected by Additional
Estimates.
Section 1: Agency
Overview and
Resources
This section details the total resources available to an agency,
the impact of any measures since Budget, and impact on
Appropriation Bills Nos. 3 and 4.
Section 2: Revisions to
Outcomes and Planned
Performance
This section details changes to Government outcomes and/or
changes to the planned performance of agency programs.
Section 3: Explanatory
Tables and Budgeted
Financial Statements
This section contains updated explanatory tables on special
account flows and staffing levels and revisions to the budgeted
financial statements.
Glossary Explains key terms relevant to the Portfolio.
Index (Optional) Alphabetical guide to the Statements

ix
CONTENTS
Portfolio Overview......................................................................................................... 1
Department of the Environment ................................................................................ 13
Clean Energy Regulator ............................................................................................. 93


PORTFOLIO OVERVIEW

Portfolio Overview
3
PORTFOLIO OVERVIEW
PORTFOLIO STRUCTURE
Since the 2013-14 Budget, the outcome structure of the Portfolio has changed through
the Administrative Arrangements Order announced by the Prime Minister and
approved by the Governor-General on 18 September 2013. These changes include:
the change of the portfolio name from the Sustainability, Environment, Water,
Population and Communities Portfolio to the Environment Portfolio;
the change of the department name from the Department of Sustainability,
Environment, Water, Population and Communities to the Department of the
Environment;
the transfer of responsibility for Indigenous Environmental Policy to the
Department of the Prime Minister and Cabinet; and
the transfer, from the former Portfolio of Industry, Innovation, Climate Change,
Science, Research and Tertiary Education, of responsibility for:
o development and co-ordination of domestic climate change policy;
o renewable energy target policy, regulation and co-ordination;
o greenhouse emissions and energy consumption reporting;
o climate change adaptation strategy and co-ordination;
o co-ordination of climate change science activities;
o renewable energy;
o greenhouse gas abatement programmes; and
o community and household climate action.
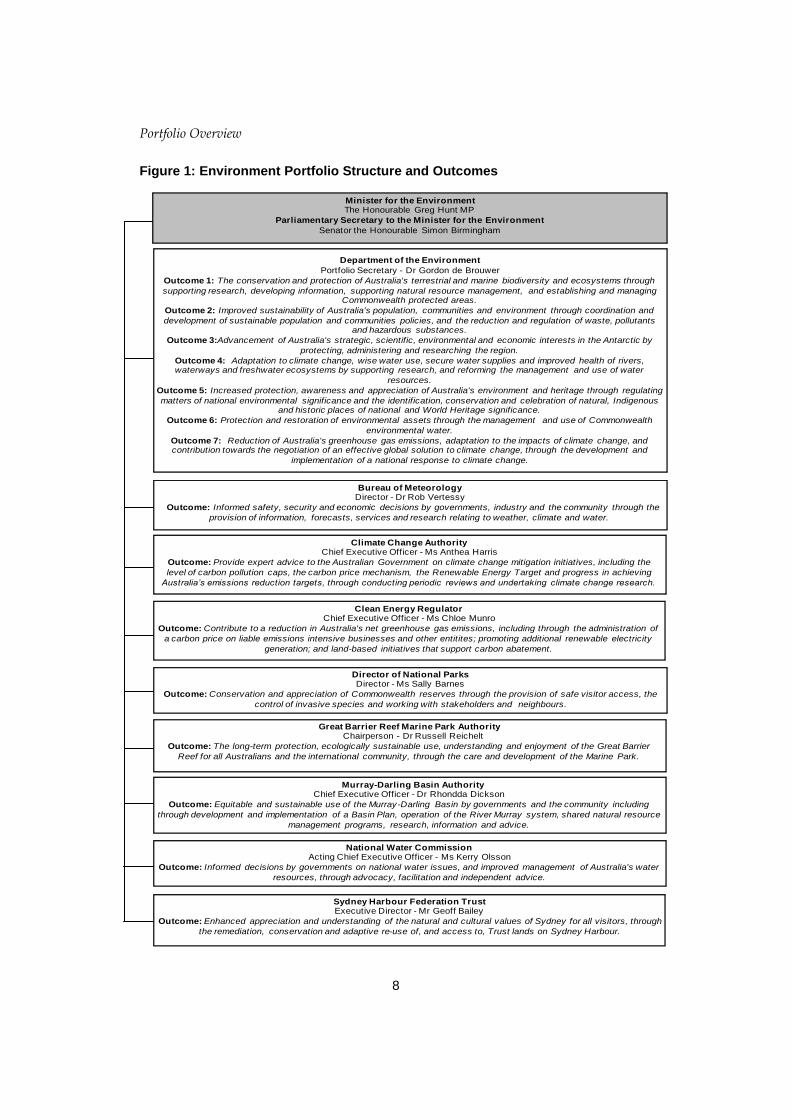
A revised Portfolio structure reflecting these changes is presented at Figure 1
Portfolio Overview
4
MINISTER AND PORTFOLIO RESPONSIBILITIES
The Portfolio is led by the Minister for the Environment and comprises the
Department, six prescribed agencies1 and two Commonwealth Authorities2.
The Department provides leadership on environment, domestic climate change, water,
and heritage matters with a national focus, or matters that are the direct responsibility
of the Australian Government. In addition to these roles, the Department is also
responsible for advancing Australia’s interests in the Antarctic.
Bureau of Meteorology
The Bureau of Meteorology is an executive3 and prescribed agency and is responsible
for the outcome:
Informed safety, security and economic decisions by governments, industry and
the community through the provision of information, forecasts, services and
research relating to weather, climate and water.
The Bureau is Australia’s national meteorological authority. It makes observations of
the atmosphere, space, oceans, water and the land, provides forecasts of weather,
climate and water availability, issues extreme weather warnings, studies climate
variability and change, assesses the nation’s water resources, and supports
international cooperation in these areas. The Bureau’s work supports all Australians
including the Australian Defence Force and key sectors such as emergency
management, aviation, transport, water management, agriculture and environmental
management. The Bureau operates under the Meteorology Act 1955 and the Water Act
2007.
1 ‘prescribed agency’ as defined under the Financial Management and Accountability Act 1997. 2 ‘Commonwealth Authority’ as defined under the Commonwealth Authorities and Companies Act
1997. 3 ‘executive agency’ as defined under the Public Service Act 1999.
Portfolio Overview
5
Climate Change Authority
The Climate Change Authority is a statutory4 and prescribed agency that is responsible
for the outcome:
Provide expert advice to the Australian Government on climate change
mitigation initiatives, including the level of carbon pollution caps, the carbon
price mechanism, the Renewable Energy Target and progress in achieving
Australia’s emissions reduction targets, through conducting periodic reviews
and undertaking climate change research.
The Government introduced a Bill to abolish the Authority into the Parliament in
November 2013, which is currently being considered by the Senate. The Bill provides
that the Authority will be abolished on a date to be proclaimed or 6 months after Royal
Assent, whichever is earlier.
Clean Energy Regulator
The Clean Energy Regulator is a statutory and prescribed agency that is responsible for
the outcome:
Contribute to a reduction in Australia's net greenhouse gas emissions, including
through the administration of a carbon price on liable emissions intensive
businesses and other entities (until such time as the carbon price is repealed);
promoting additional renewable electricity generation; and land-based initiatives
that support carbon abatement.
The Regulator undertakes a broad range of functions to facilitate participation in and
ensure the integrity of Australia’s carbon pricing mechanism and previously
established mechanisms for monitoring and strengthening Australia’s response to
climate change. Its vision is to support Australia’s transition to a low carbon economy
through an informed and efficient market for carbon and investment in renewable
energy.
The Government introduced bills to repeal the carbon pricing mechanism and related
measures imposing equivalent carbon prices in November 2013, which are currently
being considered by the Senate. The Bills provide that carbon price liabilities will no
longer arise after 30 June 2014.
4 ‘statutory agency’ as defined under the Public Service Act 1999.
Portfolio Overview
6
Director of National Parks
The Director of National Parks is a Commonwealth and statutory5 authority and is
responsible for the outcome:
Conservation and appreciation of Commonwealth reserves through the
provision of safe visitor access, the control of invasive species and working with
stakeholders and neighbours.
The Director manages the Commonwealth’s terrestrial and marine reserves and
conservation zones, including Kakadu and Uluru–Kata Tjuta National Parks, and
provides national leadership in protected area management. The Director operates
under the Environment Protection and Biodiversity Conservation Act 1999.
Great Barrier Reef Marine Park Authority
The Great Barrier Reef Marine Park Authority is a prescribed and statutory agency and
is responsible for the outcome:
The long-term protection, ecologically sustainable use, understanding and
enjoyment of the Great Barrier Reef for all Australians and the international
community, through the care and development of the Marine Park.
The Authority protects and conserves the World Heritage values of the Great Barrier
Reef and operates under the Great Barrier Reef Marine Park Act 1975.
Murray-Darling Basin Authority
The Murray-Darling Basin Authority is a prescribed and statutory agency, established
by the Water Act 2007, and is responsible for the outcome:
Equitable and sustainable use of the Murray-Darling Basin by governments and
the community including through development and implementation of a
Murray-Darling Basin Plan, operation of the River Murray system, shared
natural resource management programs, research, information and advice.
The Authority is responsible for planning integrated management of the water
resources of the Murray-Darling Basin. The Authority has developed, and will
implement and enforce, the Basin Plan, which includes a sustainable cap on surface
and groundwater diversions across the Basin, an Environmental Watering Plan, a
Water Quality and Salinity Management Plan and water trading and transfer rules.
5 ‘statutory authority’ as defined under the Commonwealth Authorities and Companies Act 1997.
Portfolio Overview
7
National Water Commission
The National Water Commission is a prescribed and statutory agency within the
portfolio and is responsible for the outcome:
Informed decisions by governments on national water issues, and improved
management of Australia’s water resources, through advocacy, facilitation and
independent advice.
The Commission operates under the National Water Commission Act 2004, and works to
improve water management across Australia by providing assessments and advice,
and undertaking activities that promote the National Water Initiative.
Sydney Harbour Federation Trust
The Sydney Harbour Federation Trust is a Commonwealth and statutory authority
and is responsible for the outcome:
Enhanced appreciation and understanding of the natural and cultural values of
Sydney for all visitors, through the remediation, conservation and adaptive re-
use of, and access to, Trust lands on Sydney Harbour.
The Trust is responsible for conserving and planning the future uses of former military
bases and other Commonwealth land around Sydney Harbour. The Trust operates
under the Sydney Harbour Federation Trust Act 2001.
Portfolio Overview
8
Minister for the EnvironmentThe Honourable Greg Hunt MP
Parliamentary Secretary to the Minister for the Environment
Senator the Honourable Simon Birmingham
Great Barrier Reef Marine Park AuthorityChairperson - Dr Russell Reichelt
Outcome: The long-term protection, ecologically sustainable use, understanding and enjoyment of the Great Barrier
Reef for all Australians and the international community, through the care and development of the Marine Park.
Sydney Harbour Federation TrustExecutive Director - Mr Geoff Bailey
Outcome: Enhanced appreciation and understanding of the natural and cultural values of Sydney for all visitors, through
the remediation, conservation and adaptive re-use of, and access to, Trust lands on Sydney Harbour.
National Water CommissionActing Chief Executive Officer - Ms Kerry Olsson
Outcome: Informed decisions by governments on national water issues, and improved management of Australia's water
resources, through advocacy, facilitation and independent advice.
Director of National ParksDirector - Ms Sally Barnes
Outcome: Conservation and appreciation of Commonwealth reserves through the provision of safe visitor access, the
control of invasive species and working with stakeholders and neighbours.
Murray-Darling Basin AuthorityChief Executive Officer - Dr Rhondda Dickson
Outcome: Equitable and sustainable use of the Murray-Darling Basin by governments and the community including
through development and implementation of a Basin Plan, operation of the River Murray system, shared natural resource
management programs, research, information and advice.
Department of the Environment
Portfolio Secretary - Dr Gordon de Brouwer
Outcome 1: The conservation and protection of Australia's terrestrial and marine biodiversity and ecosystems through
supporting research, developing information, supporting natural resource management, and establishing and managing Commonwealth protected areas.
Outcome 2: Improved sustainability of Australia's population, communities and environment through coordination and
development of sustainable population and communities policies, and the reduction and regulation of waste, pollutants and hazardous substances.
Outcome 3:Advancement of Australia's strategic, scientific, environmental and economic interests in the Antarctic by
protecting, administering and researching the region.
Outcome 4: Adaptation to climate change, wise water use, secure water supplies and improved health of rivers, waterways and freshwater ecosystems by supporting research, and reforming the management and use of water
resources.
Outcome 5: Increased protection, awareness and appreciation of Australia's environment and heritage through regulating
matters of national environmental significance and the identification, conservation and celebration of natural, Indigenous and historic places of national and World Heritage significance.
Outcome 6: Protection and restoration of environmental assets through the management and use of Commonwealth
environmental water.
Outcome 7: Reduction of Australia's greenhouse gas emissions, adaptation to the impacts of climate change, and contribution towards the negotiation of an effective global solution to climate change, through the development and
implementation of a national response to climate change.
Bureau of MeteorologyDirector - Dr Rob Vertessy
Outcome: Informed safety, security and economic decisions by governments, industry and the community through the
provision of information, forecasts, services and research relating to weather, climate and water.
Climate Change AuthorityChief Executive Officer - Ms Anthea Harris
Outcome: Provide expert advice to the Australian Government on climate change mitigation initiatives, including the
level of carbon pollution caps, the carbon price mechanism, the Renewable Energy Target and progress in achieving
Australia’s emissions reduction targets, through conducting periodic reviews and undertaking climate change research.
Clean Energy RegulatorChief Executive Officer - Ms Chloe Munro
Outcome: Contribute to a reduction in Australia's net greenhouse gas emissions, including through the administration of
a carbon price on liable emissions intensive businesses and other entitites; promoting additional renewable electricity
generation; and land-based initiatives that support carbon abatement.
Figure 1: Environment Portfolio Structure and Outcomes

Portfolio Overview
9
Portfolio Resources
Table 1 shows for those agencies reporting in the PAES the additional resources
provided to the portfolio in the 2013-14 budget year, by agency.
Table 1: Portfolio Resources 2013-14 Receipts Total
Bill No. 3 Bill No. 4 Special
$m $m $m $m $m
Administered appropriations 0.350 0.088 - - 0.438
Departmental appropriations 4.966 38.141 - - 43.107
Clean Energy Regulator
Departmental appropriations 3.118 5.264 - - 8.382
Total: 51.927
Resources available within portfolio: 51.927
Appropriation
Department of the
Environment


AGENCY ADDITIONAL ESTIMATES
STATEMENTS
Department of the Environment ................................................................................ 13
Clean Energy Regulator ............................................................................................. 93

13
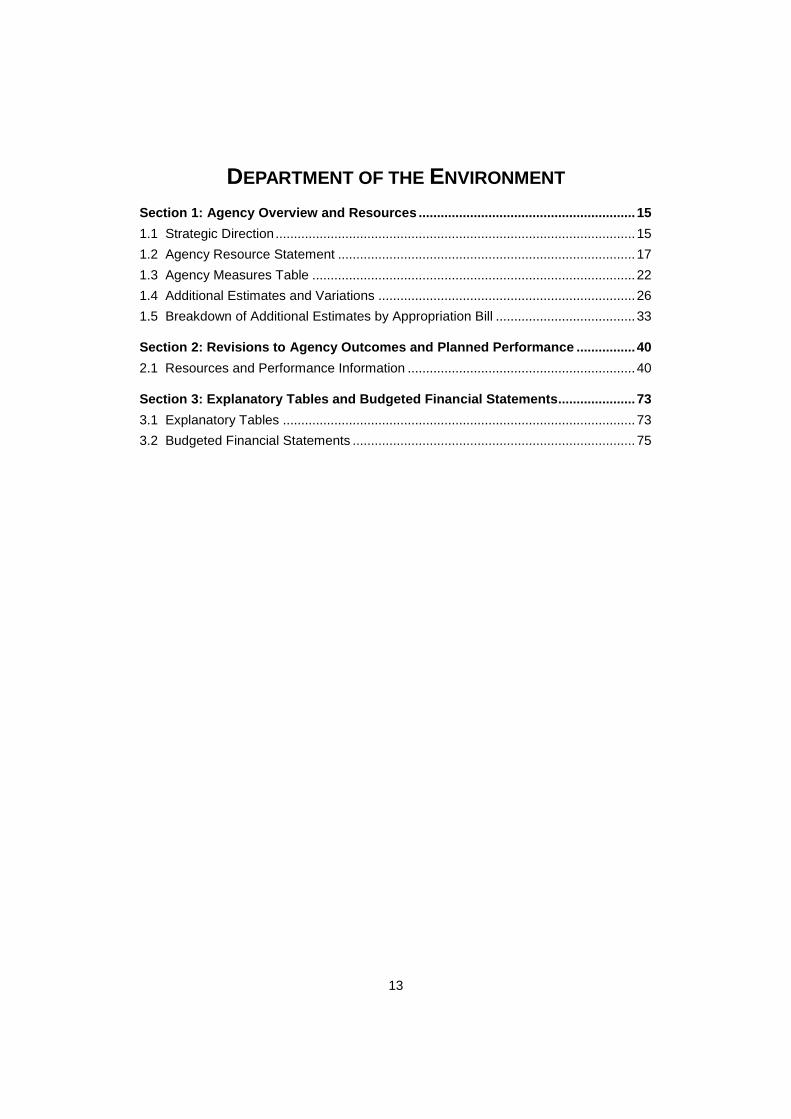
DEPARTMENT OF THE ENVIRONMENT
Section 1: Agency Overview and Resources ........................................................... 15
1.1 Strategic Direction .................................................................................................. 15
1.2 Agency Resource Statement ................................................................................. 17
1.3 Agency Measures Table ........................................................................................ 22
1.4 Additional Estimates and Variations ...................................................................... 26
1.5 Breakdown of Additional Estimates by Appropriation Bill ...................................... 33
Section 2: Revisions to Agency Outcomes and Planned Performance ................ 40
2.1 Resources and Performance Information .............................................................. 40
Section 3: Explanatory Tables and Budgeted Financial Statements ..................... 73
3.1 Explanatory Tables ................................................................................................ 73
3.2 Budgeted Financial Statements ............................................................................. 75


Agency Additional Estimates Statements — Department of the Environment
15
DEPARTMENT OF THE ENVIRONMENT
Section 1: Agency Overview and Resources
1.1 STRATEGIC DIRECTION
Since the 2013-14 Budget, the change of government at the federal election in
September 2013 has resulted in changes to the strategic priorities for the Department of
the Environment. The key priority for the Department is implementing the new
Government’s reform agenda, including its election commitments, along with meeting
existing obligations under environmental and other legislation and international
arrangements.
The four pillars of the Government’s Plan for a Cleaner Environment – Clean Air,
Clean Land, Clean Water and Heritage Protection – are a guiding framework for water
reform, environmental regulation, supporting Australia’s interests in Antarctica,
natural resource management, biodiversity conservation and action on climate change.
Work is well advanced on fulfilling the Government’s commitment to repeal the
carbon tax to lower costs for Australian businesses and ease cost of living pressures for
households. The package of carbon tax repeal bills was introduced as the first item of
legislative business for the 44th Parliament in November 2013. The bills have been
passed by the House of Representatives and are currently before the Senate.
A Green Paper was released in December 2013 on the Emissions Reduction Fund,
which will form the centrepiece of the Government’s Direct Action Plan. The Fund will
work together with other features of the Direct Action Plan and the Renewable Energy
Target to help meet the Government’s target of reducing greenhouse gas emissions by
five per cent below 2000 levels by 2020.
The Department is progressing implementation of the Government’s commitment to
establish a one stop shop for environmental approvals. This will accredit state and
territory planning systems under the Environment Protection and Biodiversity
Conservation Act 1999 (EPBC Act) to create a single environmental assessment and
approval process. The one stop shop policy aims to simplify the approvals process for
businesses, while maintaining high environmental standards. All states and territories
have signed Memoranda of Understanding committing to implement a one stop shop,
and the Government has signed assessment bilateral agreements with Queensland and
New South Wales.
In support of the Government’s broader deregulation agenda, the Department is also
progressing an audit of environmental regulation and identifying opportunities to
reduce red tape and costs to business and the community.
Agency Additional Estimates Statements — Department of the Environment
16
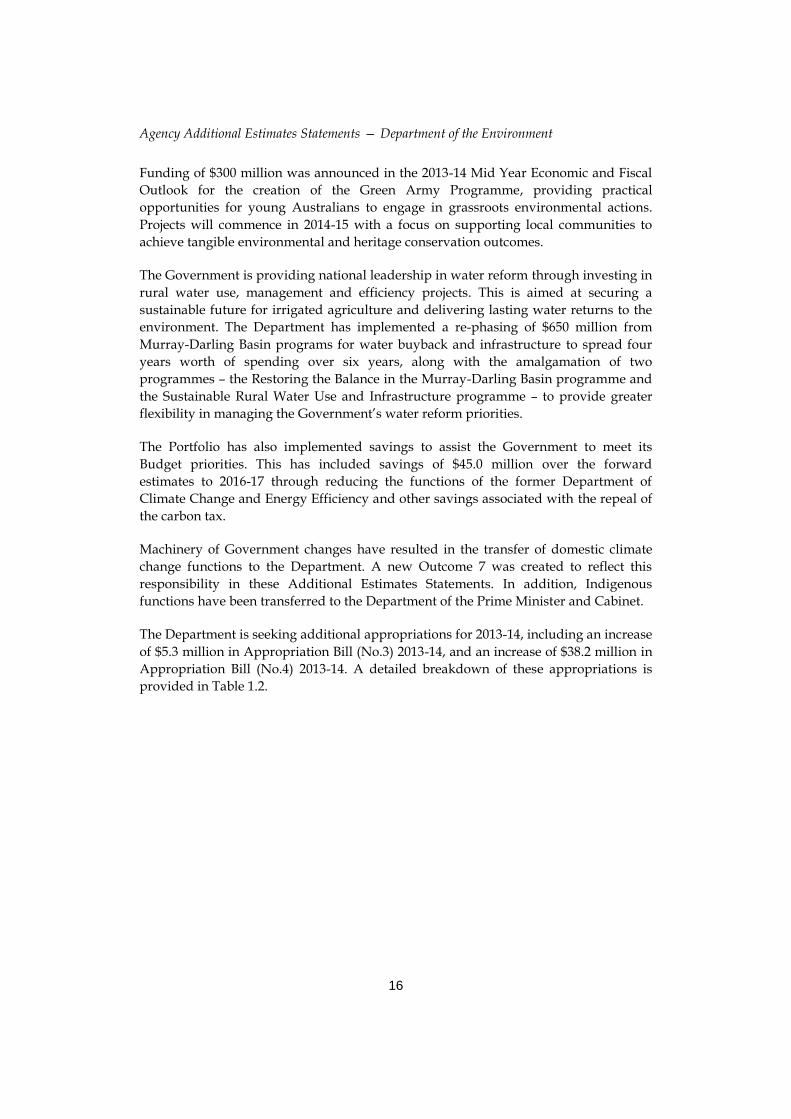
Funding of $300 million was announced in the 2013-14 Mid Year Economic and Fiscal
Outlook for the creation of the Green Army Programme, providing practical
opportunities for young Australians to engage in grassroots environmental actions.
Projects will commence in 2014-15 with a focus on supporting local communities to
achieve tangible environmental and heritage conservation outcomes.
The Government is providing national leadership in water reform through investing in
rural water use, management and efficiency projects. This is aimed at securing a
sustainable future for irrigated agriculture and delivering lasting water returns to the
environment. The Department has implemented a re-phasing of $650 million from
Murray-Darling Basin programs for water buyback and infrastructure to spread four
years worth of spending over six years, along with the amalgamation of two
programmes – the Restoring the Balance in the Murray-Darling Basin programme and
the Sustainable Rural Water Use and Infrastructure programme – to provide greater
flexibility in managing the Government’s water reform priorities.
The Portfolio has also implemented savings to assist the Government to meet its
Budget priorities. This has included savings of $45.0 million over the forward
estimates to 2016-17 through reducing the functions of the former Department of
Climate Change and Energy Efficiency and other savings associated with the repeal of
the carbon tax.
Machinery of Government changes have resulted in the transfer of domestic climate
change functions to the Department. A new Outcome 7 was created to reflect this
responsibility in these Additional Estimates Statements. In addition, Indigenous
functions have been transferred to the Department of the Prime Minister and Cabinet.
The Department is seeking additional appropriations for 2013-14, including an increase
of $5.3 million in Appropriation Bill (No.3) 2013-14, and an increase of $38.2 million in
Appropriation Bill (No.4) 2013-14. A detailed breakdown of these appropriations is
provided in Table 1.2.

Agency Additional Estimates Statements — Department of the Environment
17
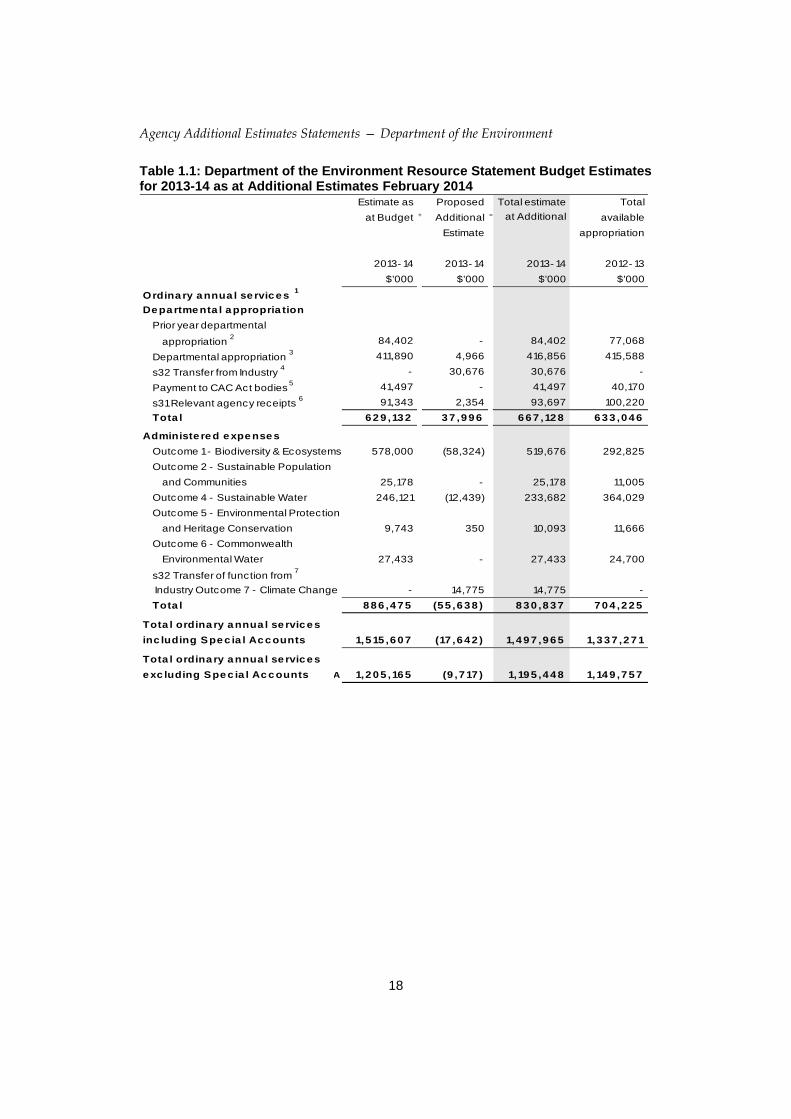
1.2 AGENCY RESOURCE STATEMENT
The Agency Resource Statement details the resourcing for the Department at
Additional Estimates. Table 1.1 outlines the total resourcing available from all sources
for the 2013-14 Budget year, including variations through Appropriation Bill Nos. 3
and 4, Special Appropriations and Special Accounts.
Agency Additional Estimates Statements — Department of the Environment
18
Table 1.1: Department of the Environment Resource Statement Budget Estimates for 2013-14 as at Additional Estimates February 2014
Estimate as Proposed Total estimate Total
at Budget + Additional = at Additional
Estimates
available
Estimate appropriation
2013- 14 2013- 14 2013- 14 2012- 13
$'000 $'000 $'000 $'000
Ordina ry a nnua l se rvic e s 1
De pa rtme nta l a ppropria tion
Prior year departmental
appropriation 2
84,402 - 84,402 77,068
Departmental appropriation 3
411,890 4,966 416,856 415,588
s32 Transfer from Industry 4
- 30,676 30,676 -
Payment to CAC Act bodies 5
41,497 - 41,497 40,170
s31 Relevant agency receipts 6
91,343 2,354 93,697 100,220
Tota l 6 2 9 ,13 2 3 7 ,9 9 6 6 6 7 ,12 8 6 3 3 ,0 4 6
Administe re d e xpe nse s
Outcome 1 - Biodiversity & Ecosystems 578,000 (58,324) 519,676 292,825
Outcome 2 - Sustainable Population
and Communities 25,178 - 25,178 11,005
Outcome 4 - Sustainable Water 246,121 (12,439) 233,682 364,029
Outcome 5 - Environmental Protection
and Heritage Conservation 9,743 350 10,093 11,666
Outcome 6 - Commonwealth
Environmental Water 27,433 - 27,433 24,700
s32 Transfer of function from 7
Industry Outcome 7 - Climate Change - 14,775 14,775 -
Tota l 8 8 6 ,4 7 5 (5 5 ,6 3 8 ) 8 3 0 ,8 3 7 7 0 4 ,2 2 5
Tota l ordina ry a nnua l se rvic e s
inc luding Spe c ia l Ac c ounts 1,5 15 ,6 0 7 (17 ,6 4 2 ) 1,4 9 7 ,9 6 5 1,3 3 7 ,2 7 1
Tota l ordina ry a nnua l se rvic e s
e xc luding Spe c ia l Ac c ounts A 1,2 0 5 ,16 5 (9 ,7 17 ) 1,19 5 ,4 4 8 1,14 9 ,7 5 7
Agency Additional Estimates Statements — Department of the Environment
19
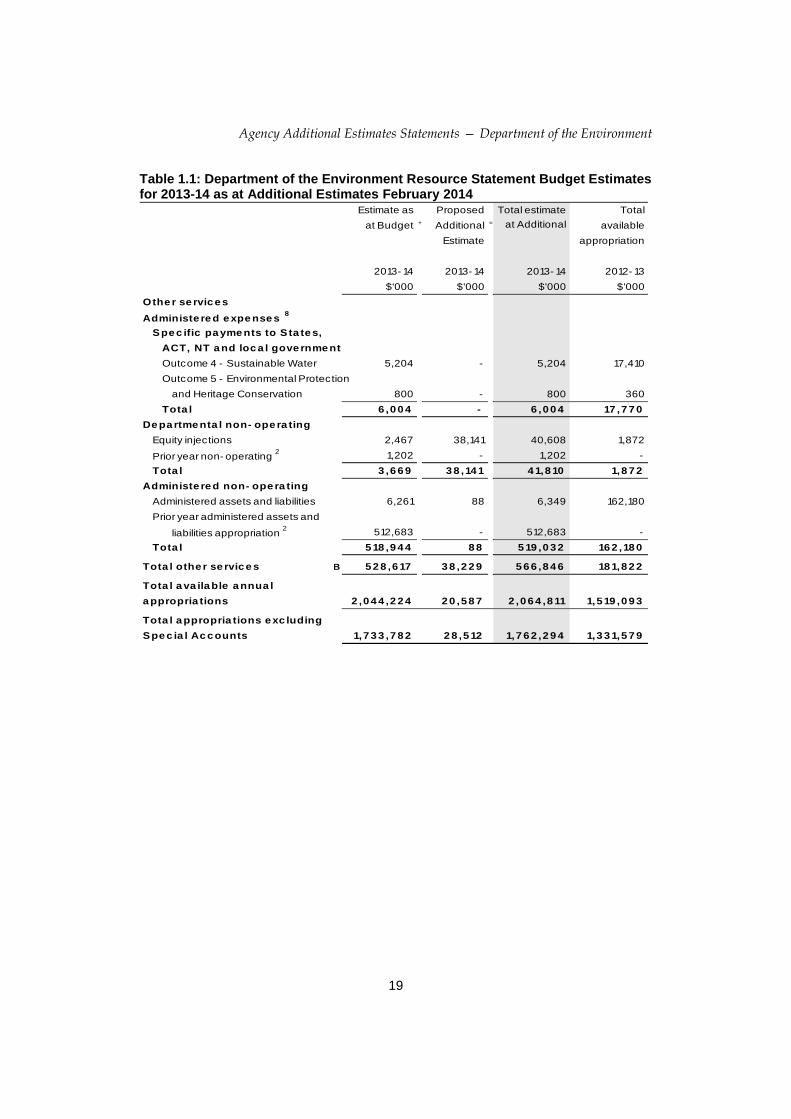
Table 1.1: Department of the Environment Resource Statement Budget Estimates for 2013-14 as at Additional Estimates February 2014
Estimate as Proposed Total estimate Total
at Budget + Additional = at Additional
Estimates
available
Estimate appropriation
2013- 14 2013- 14 2013- 14 2012- 13
$'000 $'000 $'000 $'000
Othe r se rvic e s
Administe re d e xpe nse s 8
Spe c ific pa yme nts to S ta te s,
ACT, NT a nd loc a l gove rnme nt
Outcome 4 - Sustainable Water 5,204 - 5,204 17,410
Outcome 5 - Environmental Protection
and Heritage Conservation 800 - 800 360
Tota l 6 ,0 0 4 - 6 ,0 0 4 17 ,7 7 0
De pa rtme nta l non- ope ra ting
Equity injections 2,467 38,141 40,608 1,872
Prior year non- operating 2
1,202 - 1,202 -
Tota l 3 ,6 6 9 3 8 ,14 1 4 1,8 10 1,8 7 2
Administe re d non- ope ra ting
Administered assets and liabilities 6,261 88 6,349 162,180
Prior year administered assets and
liabilities appropriation 2
512,683 - 512,683 -
Tota l 5 18 ,9 4 4 8 8 5 19 ,0 3 2 16 2 ,18 0
Tota l othe r se rvic e s B 5 2 8 ,6 17 3 8 ,2 2 9 5 6 6 ,8 4 6 18 1,8 2 2
Tota l a va ila ble a nnua l
a ppropria tions 2 ,0 4 4 ,2 2 4 2 0 ,5 8 7 2 ,0 6 4 ,8 11 1,5 19 ,0 9 3
Tota l a ppropria tions e xc luding
Spe c ia l Ac c ounts 1,7 3 3 ,7 8 2 2 8 ,5 12 1,7 6 2 ,2 9 4 1,3 3 1,5 7 9

Agency Additional Estimates Statements — Department of the Environment
20
Table 1.1: Department of the Environment Resource Statement Budget Estimates for 2013-14 as at Additional Estimates February 2014
Special Accounts Estimate Proposed Total Total
of prior year + at Budget = estimate available
amounts appropriation
available in
2013- 14 2013- 14 2013- 14 2012- 13
$'000 $'000 $'000 $'000
Spe c ia l Ac c ounts
Opening balance 9
452,976 - 452,976 449,478
Appropriation receipts 310,442 (7,925) 302,517 187,514
Non- appropriation receipts to
Special Accounts 46,600 (190) 46,410 10,447
Tota l Spe c ia l Ac c ount C 8 10 ,0 18 (8 ,115 ) 8 0 1,9 0 3 6 4 7 ,4 3 9
Tota l re sourc ing
A+B+C 2 ,5 4 3 ,8 0 0 2 0 ,3 9 7 2 ,5 6 4 ,19 7 1,9 7 9 ,0 18
Less appropriations drawn from
annual or special appropriations above
and credited to special accounts (310,442) 7,925 (302,517) (187,514)
and/or CAC Act bodies through
annual appropriations (41,497) - (41,497) (40,170)
Tota l ne t re sourc ing for
Environme nt 2 ,19 1,8 6 1 2 8 ,3 2 2 2 ,2 2 0 ,18 3 1,7 5 1,3 3 4
1 Appropriation Act (No.1) 2013- 14 and Appropriation Bill (No. 3) 2013- 14.
2 Estimate at Budget has been adjusted to reflect the actual balance carried from previous year for
annual appropriations. 3 Includes $26.550 million for the Departmental Capital Budget (DCB) in 2013- 14 (refer to table 3.2.5
for further details). For accounting purposes the DCB amount has been designated as
'contributions by owners'. 4 Ministerial responsibility for domestic Climate Change has been transferred from the Department
of Industry consistent with the AAO changes announced on 18 September 2013. $30.676 million was
transferred on the 31st of January 2014 via a section 32 determination. 5 As per the Environment Protection and Biodiversity Conservation Act 1999 section 514S, Environment
is directly appropriated the Director of National Parks's (DNP) appropriations, which is then allocated
to DNP by the Secretary.6 FMA Act s31 receipts, also known as FMA Regulation 15 receipts, are an estimate.
7 Ministerial responsibility for domestic Climate Change has been transferred from the Department
of Industry consistent with the AAO changes announced on 18 September 2013. $14.775 million was
transferred on the 31st of January 2014 via a section 32 determination.8Appropriation Act (No.2) 2013- 14 and Appropriation Bill (No. 4 ) 2013- 14.
9 Estimated opening balance for special accounts (less 'Special Public Money' held in accounts such
as Services for Other Entities and Trust Moneys account as they do not constitute funds available
to the department for operations). For further information on special accounts see table 3.1.1.
Reader note: All figures are GST exclusive.
Agency Additional Estimates Statements — Department of the Environment
21
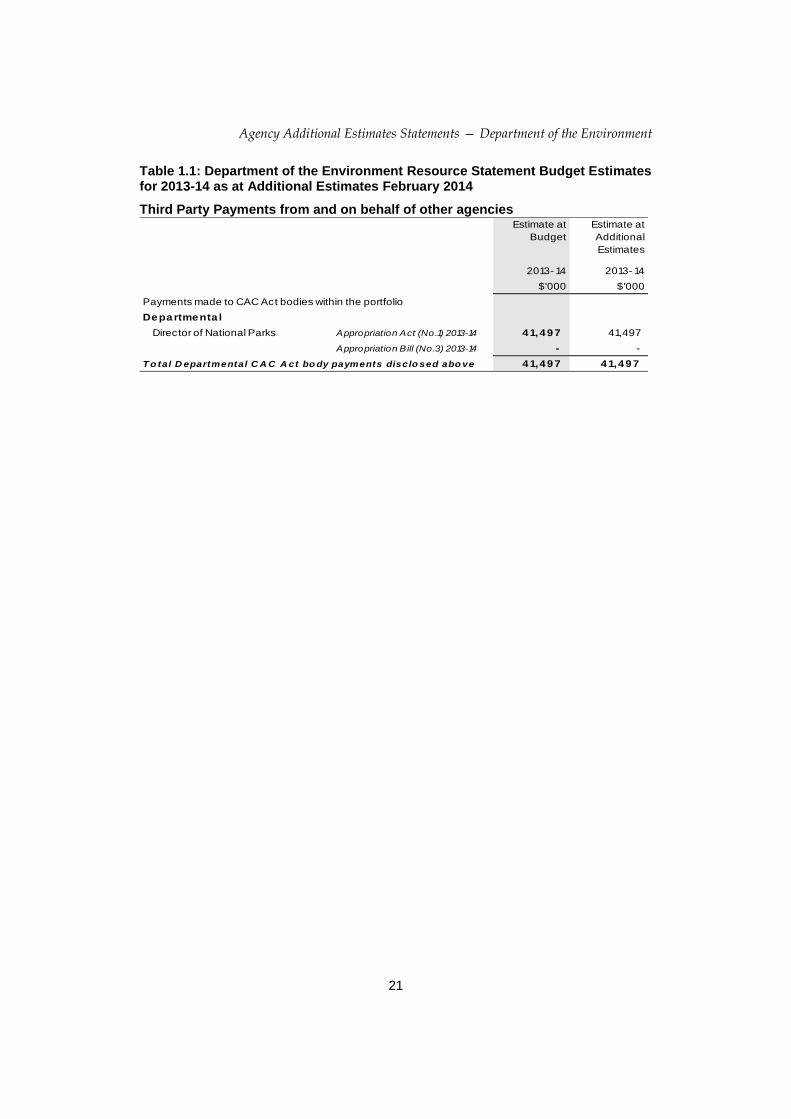
Table 1.1: Department of the Environment Resource Statement Budget Estimates for 2013-14 as at Additional Estimates February 2014
Third Party Payments from and on behalf of other agencies Estimate at
Budget
Estimate at
Additional
Estimates
2013- 14 2013- 14
$'000 $'000
Payments made to CAC Act bodies within the portfolio
Departmenta l
Director of National Parks Appropriation Act (No.1) 2013-14 41,497 41,497
Appropriation Bill (No.3) 2013-14 - -
T o tal D epartmental C A C A ct bo dy payments disclo sed abo ve 41,497 41,497

Agency Additional Estimates Statements — Department of the Environment
22
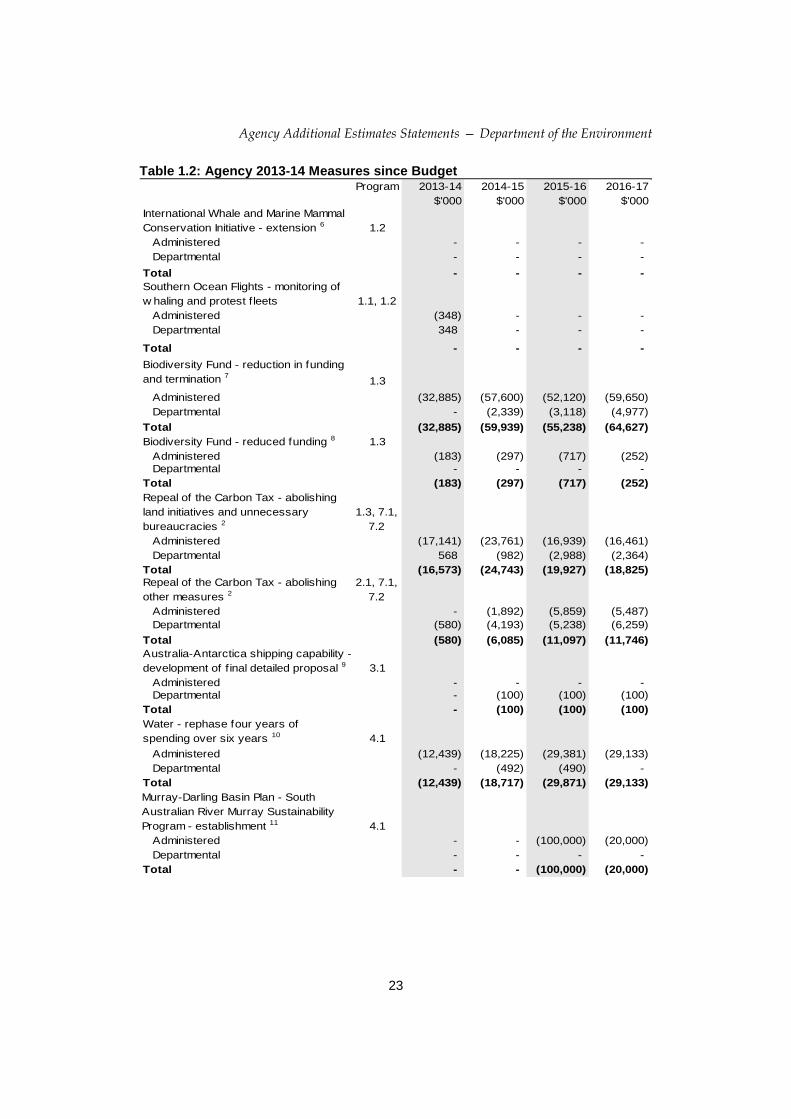
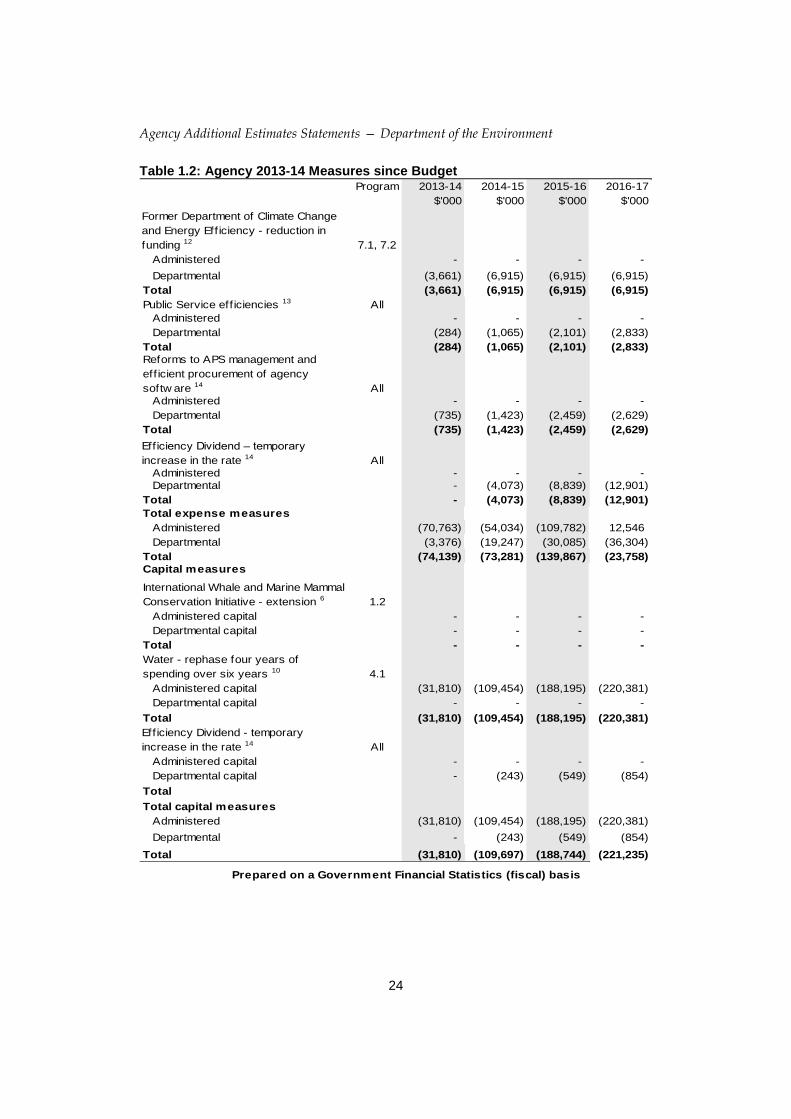
1.3 AGENCY MEASURES TABLE
Table 1.2 summarises measures taken since the 2013-14 Budget. The table is split into
revenue, expense and capital measures, with the affected program identified.
Table 1.2: Agency 2013-14 Measures since Budget Program 2013-14 2014-15 2015-16 2016-17
$'000 $'000 $'000 $'000
Revenue measures
Carbon pricing mechanism — replacing
f ixed price w ith an emissions trading
scheme from 1 July 2014 1 2.1
Administered revenues - (150,000) - -
Departmental revenues - - - -
Total - (150,000) - -
Repeal of the Carbon Tax - forgone
revenue from repeal of the Carbon Tax 2.1
Administered revenues (10,000) (50,000) (50,000) (90,000)
Departmental revenues - - - -
Total (10,000) (50,000) (50,000) (90,000)
Repeal of the Carbon Tax - abolishing
other measures 2 2.1
Administered revenues - 7,200 3,000 4,000
Departmental revenues - - - -
Total - 7,200 3,000 4,000
Total revenue measures
Administered (10,000) (192,800) (47,000) (86,000)
Departmental - - - -
Total (10,000) (192,800) (47,000) (86,000)
Expense measures
Caring for our Country - redirection of
funding 3 1.1
Administered (1,100) (604) (1,117) (1,092)
Departmental - - - -
Total (1,100) (604) (1,117) (1,092)
Caring for our Country - redirection of
funding 4 1.1
Administered (6,667) - - -
Departmental - - - -
Total (6,667) - - -
Green Army - establishment 1.1
Administered - 48,345 96,351 144,621
Departmental 968 2,335 2,163 2,674
Total 968 50,680 98,514 147,295
Tasmanian Economic Diversif ication
Projects 5 1.1, 5.1
Administered - - - -
Departmental - - - -
Total - - - -
Agency Additional Estimates Statements — Department of the Environment
23
Table 1.2: Agency 2013-14 Measures since Budget Program 2013-14 2014-15 2015-16 2016-17
$'000 $'000 $'000 $'000
International Whale and Marine Mammal
Conservation Initiative - extension 6 1.2
Administered - - - -
Departmental - - - -
Total - - - -
Southern Ocean Flights - monitoring of
w haling and protest f leets 1.1, 1.2
Administered (348) - - -
Departmental 348 - - -
Total - - - -
Biodiversity Fund - reduction in funding
and termination 7 1.3
Administered (32,885) (57,600) (52,120) (59,650)
Departmental - (2,339) (3,118) (4,977)
Total (32,885) (59,939) (55,238) (64,627)
Biodiversity Fund - reduced funding 8 1.3
Administered (183) (297) (717) (252)
Departmental - - - -
Total (183) (297) (717) (252)
Repeal of the Carbon Tax - abolishing
land initiatives and unnecessary
bureaucracies 2
1.3, 7.1,
7.2
Administered (17,141) (23,761) (16,939) (16,461)
Departmental 568 (982) (2,988) (2,364)
Total (16,573) (24,743) (19,927) (18,825)
Repeal of the Carbon Tax - abolishing
other measures 2
2.1, 7.1,
7.2
Administered - (1,892) (5,859) (5,487)
Departmental (580) (4,193) (5,238) (6,259)
Total (580) (6,085) (11,097) (11,746)
Australia-Antarctica shipping capability -
development of f inal detailed proposal 9 3.1
Administered - - - -
Departmental - (100) (100) (100)
Total - (100) (100) (100)
Water - rephase four years of
spending over six years 10 4.1
Administered (12,439) (18,225) (29,381) (29,133)
Departmental - (492) (490) -
Total (12,439) (18,717) (29,871) (29,133)
Murray-Darling Basin Plan - South
Australian River Murray Sustainability
Program - establishment 11 4.1
Administered - - (100,000) (20,000)
Departmental - - - -
Total - - (100,000) (20,000)
Agency Additional Estimates Statements — Department of the Environment
24
Table 1.2: Agency 2013-14 Measures since Budget Program 2013-14 2014-15 2015-16 2016-17
$'000 $'000 $'000 $'000
Former Department of Climate Change
and Energy Eff iciency - reduction in
funding 12 7.1, 7.2
Administered - - - -
Departmental (3,661) (6,915) (6,915) (6,915)
Total (3,661) (6,915) (6,915) (6,915)
Public Service eff iciencies 13 All
Administered - - - -
Departmental (284) (1,065) (2,101) (2,833)
Total (284) (1,065) (2,101) (2,833)
Reforms to APS management and
eff icient procurement of agency
softw are 14 All
Administered - - - -
Departmental (735) (1,423) (2,459) (2,629)
Total (735) (1,423) (2,459) (2,629)
Efficiency Dividend – temporary
increase in the rate 14 All
Administered - - - -
Departmental - (4,073) (8,839) (12,901)
Total - (4,073) (8,839) (12,901)
Total expense measures
Administered (70,763) (54,034) (109,782) 12,546
Departmental (3,376) (19,247) (30,085) (36,304)
Total (74,139) (73,281) (139,867) (23,758)
Capital measures
International Whale and Marine Mammal
Conservation Initiative - extension 6 1.2
Administered capital - - - -
Departmental capital - - - -
Total - - - -
Water - rephase four years of
spending over six years 10 4.1
Administered capital (31,810) (109,454) (188,195) (220,381)
Departmental capital - - - -
Total (31,810) (109,454) (188,195) (220,381)
Efficiency Dividend - temporary
increase in the rate 14 All
Administered capital - - - -
Departmental capital - (243) (549) (854)
Total
Total capital measures
Administered (31,810) (109,454) (188,195) (220,381)
Departmental - (243) (549) (854)
Total (31,810) (109,697) (188,744) (221,235)
Prepared on a Government Financial Statistics (fiscal) basis
Agency Additional Estimates Statements — Department of the Environment
25
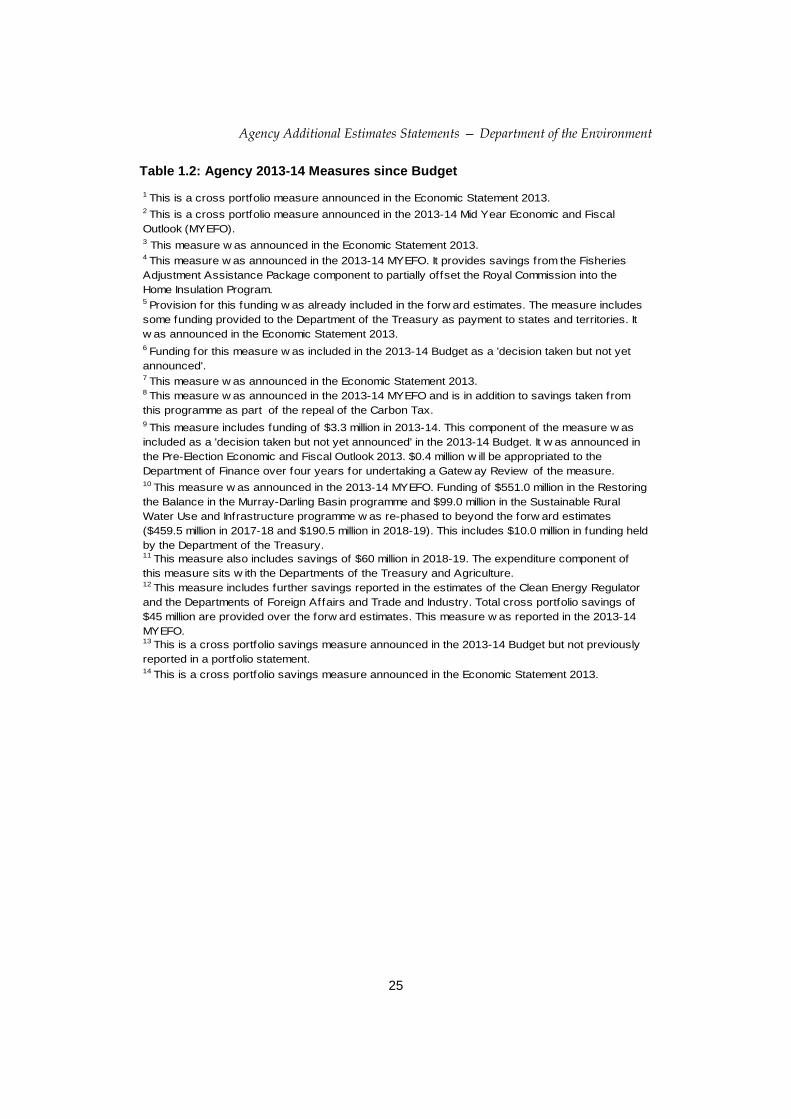
Table 1.2: Agency 2013-14 Measures since Budget
1 This is a cross portfolio measure announced in the Economic Statement 2013.
11 This measure also includes savings of $60 million in 2018-19. The expenditure component of
this measure sits w ith the Departments of the Treasury and Agriculture.
14 This is a cross portfolio savings measure announced in the Economic Statement 2013.
10 This measure w as announced in the 2013-14 MYEFO. Funding of $551.0 million in the Restoring
the Balance in the Murray-Darling Basin programme and $99.0 million in the Sustainable Rural
Water Use and Infrastructure programme w as re-phased to beyond the forw ard estimates
($459.5 million in 2017-18 and $190.5 million in 2018-19). This includes $10.0 million in funding held
by the Department of the Treasury.
13 This is a cross portfolio savings measure announced in the 2013-14 Budget but not previously
reported in a portfolio statement.
5 Provision for this funding w as already included in the forw ard estimates. The measure includes
some funding provided to the Department of the Treasury as payment to states and territories. It
w as announced in the Economic Statement 2013.
6 Funding for this measure w as included in the 2013-14 Budget as a 'decision taken but not yet
announced'.
12 This measure includes further savings reported in the estimates of the Clean Energy Regulator
and the Departments of Foreign Affairs and Trade and Industry. Total cross portfolio savings of
$45 million are provided over the forw ard estimates. This measure w as reported in the 2013-14
MYEFO.
9 This measure includes funding of $3.3 million in 2013-14. This component of the measure w as
included as a 'decision taken but not yet announced' in the 2013-14 Budget. It w as announced in
the Pre-Election Economic and Fiscal Outlook 2013. $0.4 million w ill be appropriated to the
Department of Finance over four years for undertaking a Gatew ay Review of the measure.
4 This measure w as announced in the 2013-14 MYEFO. It provides savings from the Fisheries
Adjustment Assistance Package component to partially offset the Royal Commission into the
Home Insulation Program.
3 This measure w as announced in the Economic Statement 2013.
8 This measure w as announced in the 2013-14 MYEFO and is in addition to savings taken from
this programme as part of the repeal of the Carbon Tax.
2 This is a cross portfolio measure announced in the 2013-14 Mid Year Economic and Fiscal
Outlook (MYEFO).
7 This measure w as announced in the Economic Statement 2013.
Agency Additional Estimates Statements — Department of the Environment
26
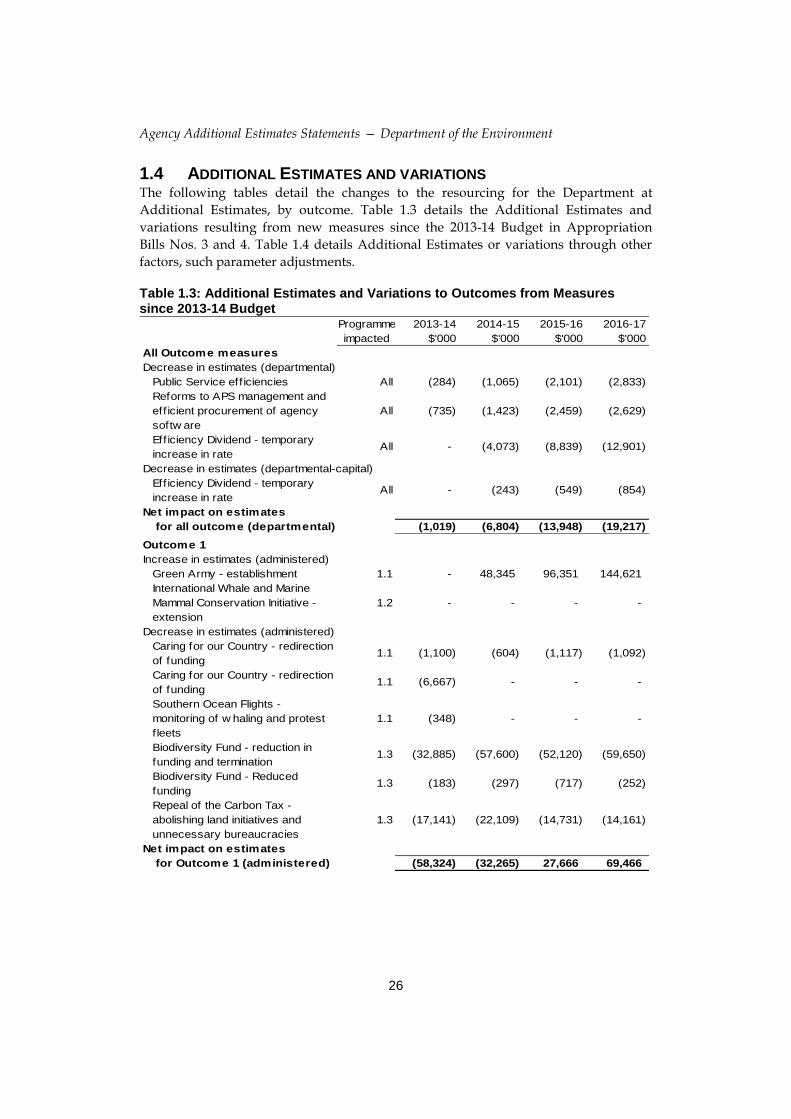
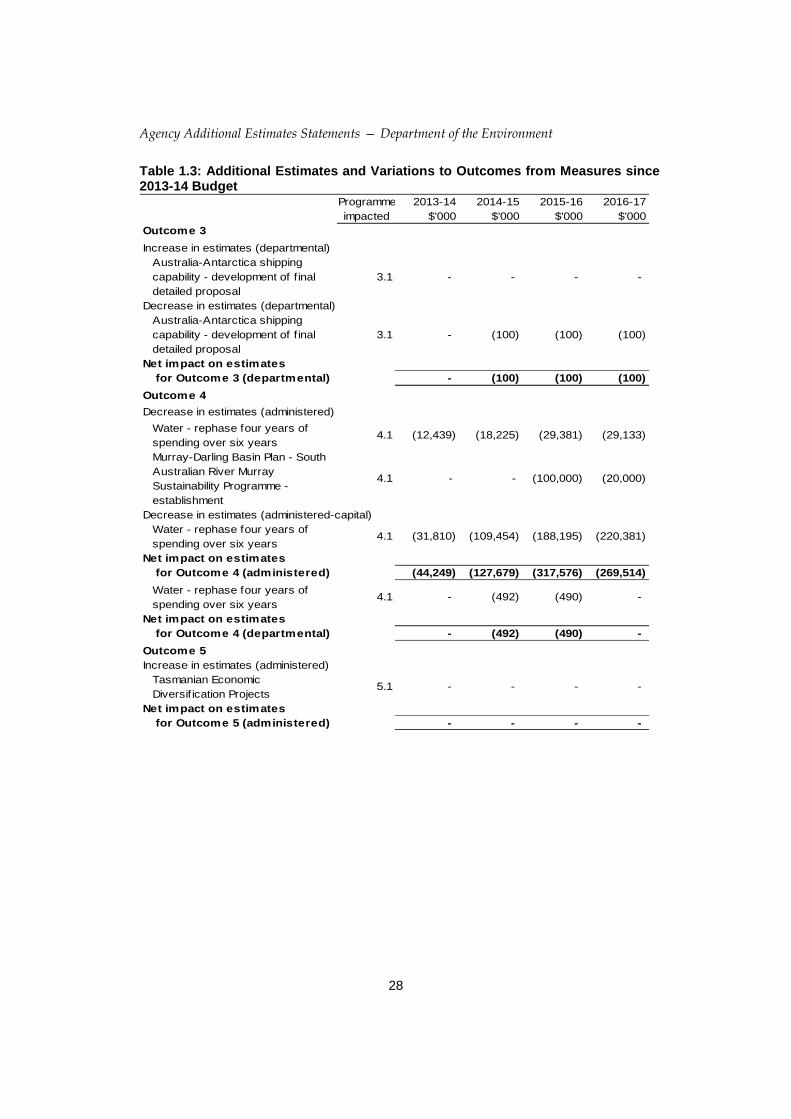
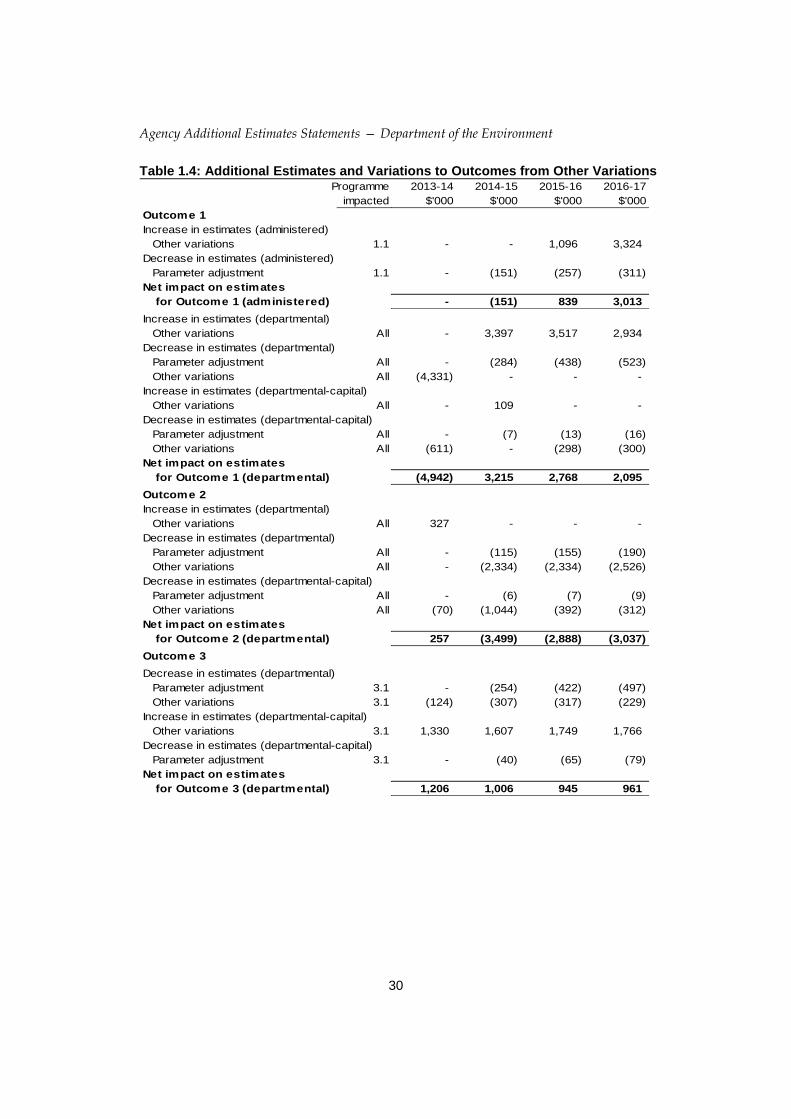
1.4 ADDITIONAL ESTIMATES AND VARIATIONS
The following tables detail the changes to the resourcing for the Department at
Additional Estimates, by outcome. Table 1.3 details the Additional Estimates and
variations resulting from new measures since the 2013-14 Budget in Appropriation
Bills Nos. 3 and 4. Table 1.4 details Additional Estimates or variations through other
factors, such parameter adjustments.
Table 1.3: Additional Estimates and Variations to Outcomes from Measures since 2013-14 Budget
Programme 2013-14 2014-15 2015-16 2016-17
impacted $'000 $'000 $'000 $'000
All Outcome measures
Decrease in estimates (departmental)
Public Service eff iciencies All (284) (1,065) (2,101) (2,833)
Reforms to APS management and
eff icient procurement of agency
softw are
All (735) (1,423) (2,459) (2,629)
Efficiency Dividend - temporary
increase in rateAll - (4,073) (8,839) (12,901)
Decrease in estimates (departmental-capital)
Eff iciency Dividend - temporary
increase in rateAll - (243) (549) (854)
Net impact on estimates
for all outcome (departmental) (1,019) (6,804) (13,948) (19,217)
Outcome 1
Increase in estimates (administered)
Green Army - establishment 1.1 - 48,345 96,351 144,621
International Whale and Marine
Mammal Conservation Initiative -
extension
1.2 - - - -
Decrease in estimates (administered)
Caring for our Country - redirection
of funding1.1 (1,100) (604) (1,117) (1,092)
Caring for our Country - redirection
of funding1.1 (6,667) - - -
Southern Ocean Flights -
monitoring of w haling and protest
f leets
1.1 (348) - - -
Biodiversity Fund - reduction in
funding and termination1.3 (32,885) (57,600) (52,120) (59,650)
Biodiversity Fund - Reduced
funding1.3 (183) (297) (717) (252)
Repeal of the Carbon Tax -
abolishing land initiatives and
unnecessary bureaucracies
1.3 (17,141) (22,109) (14,731) (14,161)
Net impact on estimates
for Outcome 1 (administered) (58,324) (32,265) 27,666 69,466
Agency Additional Estimates Statements — Department of the Environment
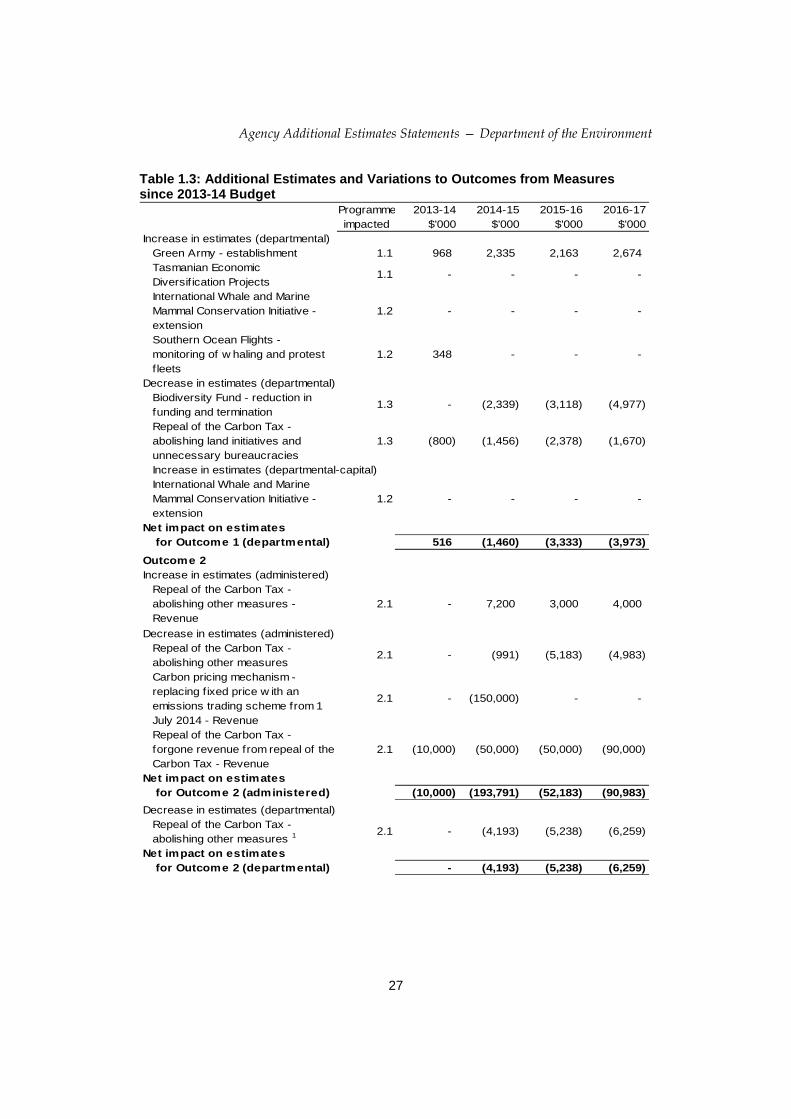
27
Table 1.3: Additional Estimates and Variations to Outcomes from Measures since 2013-14 Budget
Programme 2013-14 2014-15 2015-16 2016-17
impacted $'000 $'000 $'000 $'000
Increase in estimates (departmental)
Green Army - establishment 1.1 968 2,335 2,163 2,674
Tasmanian Economic
Diversif ication Projects1.1 - - - -
International Whale and Marine
Mammal Conservation Initiative -
extension
1.2 - - - -
Southern Ocean Flights -
monitoring of w haling and protest
f leets
1.2 348 - - -
Decrease in estimates (departmental)
Biodiversity Fund - reduction in
funding and termination1.3 - (2,339) (3,118) (4,977)
Repeal of the Carbon Tax -
abolishing land initiatives and
unnecessary bureaucracies
1.3 (800) (1,456) (2,378) (1,670)
Increase in estimates (departmental-capital)
International Whale and Marine
Mammal Conservation Initiative -
extension
1.2 - - - -
Net impact on estimates
for Outcome 1 (departmental) 516 (1,460) (3,333) (3,973)
Outcome 2
Increase in estimates (administered)
Repeal of the Carbon Tax -
abolishing other measures -
Revenue
2.1 - 7,200 3,000 4,000
Decrease in estimates (administered)
Repeal of the Carbon Tax -
abolishing other measures2.1 - (991) (5,183) (4,983)
Carbon pricing mechanism -
replacing f ixed price w ith an
emissions trading scheme from 1
July 2014 - Revenue
2.1 - (150,000) - -
Repeal of the Carbon Tax -
forgone revenue from repeal of the
Carbon Tax - Revenue
2.1 (10,000) (50,000) (50,000) (90,000)
Net impact on estimates
for Outcome 2 (administered) (10,000) (193,791) (52,183) (90,983)
Decrease in estimates (departmental)
Repeal of the Carbon Tax -
abolishing other measures 1 2.1 - (4,193) (5,238) (6,259)
Net impact on estimates
for Outcome 2 (departmental) - (4,193) (5,238) (6,259)
Agency Additional Estimates Statements — Department of the Environment
28
Table 1.3: Additional Estimates and Variations to Outcomes from Measures since 2013-14 Budget
Programme 2013-14 2014-15 2015-16 2016-17
impacted $'000 $'000 $'000 $'000
Outcome 3
Increase in estimates (departmental)
Australia-Antarctica shipping
capability - development of f inal
detailed proposal
3.1 - - - -
Decrease in estimates (departmental)
Australia-Antarctica shipping
capability - development of f inal
detailed proposal
3.1 - (100) (100) (100)
Net impact on estimates
for Outcome 3 (departmental) - (100) (100) (100)
Outcome 4
Decrease in estimates (administered)
Water - rephase four years of
spending over six years4.1 (12,439) (18,225) (29,381) (29,133)
Murray-Darling Basin Plan - South
Australian River Murray
Sustainability Programme -
establishment
4.1 - - (100,000) (20,000)
Decrease in estimates (administered-capital)
Water - rephase four years of
spending over six years4.1 (31,810) (109,454) (188,195) (220,381)
Net impact on estimates
for Outcome 4 (administered) (44,249) (127,679) (317,576) (269,514)
Water - rephase four years of
spending over six years4.1 - (492) (490) -
Net impact on estimates
for Outcome 4 (departmental) - (492) (490) -
Outcome 5
Increase in estimates (administered)
Tasmanian Economic
Diversif ication Projects5.1 - - - -
Net impact on estimates
for Outcome 5 (administered) - - - -
Agency Additional Estimates Statements — Department of the Environment
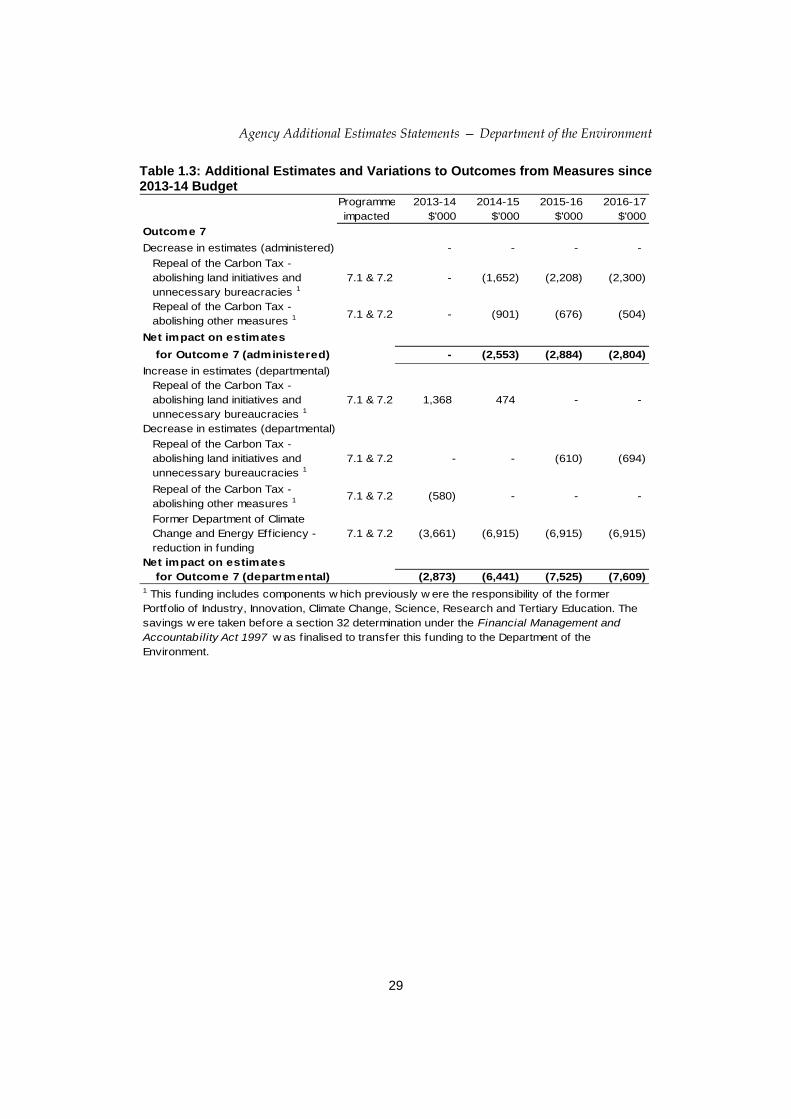
29
Table 1.3: Additional Estimates and Variations to Outcomes from Measures since 2013-14 Budget
Programme 2013-14 2014-15 2015-16 2016-17
impacted $'000 $'000 $'000 $'000
Outcome 7
Decrease in estimates (administered) - - - -
Repeal of the Carbon Tax -
abolishing land initiatives and
unnecessary bureacracies 1
7.1 & 7.2 - (1,652) (2,208) (2,300)
Repeal of the Carbon Tax -
abolishing other measures 1 7.1 & 7.2 - (901) (676) (504)
Net impact on estimates
for Outcome 7 (administered) - (2,553) (2,884) (2,804)
Increase in estimates (departmental)
Repeal of the Carbon Tax -
abolishing land initiatives and
unnecessary bureaucracies 1
7.1 & 7.2 1,368 474 - -
Decrease in estimates (departmental)
Repeal of the Carbon Tax -
abolishing land initiatives and
unnecessary bureaucracies 1
7.1 & 7.2 - - (610) (694)
Repeal of the Carbon Tax -
abolishing other measures 1 7.1 & 7.2 (580) - - -
Former Department of Climate
Change and Energy Efficiency -
reduction in funding
7.1 & 7.2 (3,661) (6,915) (6,915) (6,915)
Net impact on estimates
for Outcome 7 (departmental) (2,873) (6,441) (7,525) (7,609)
1 This funding includes components w hich previously w ere the responsibility of the former
Portfolio of Industry, Innovation, Climate Change, Science, Research and Tertiary Education. The
savings w ere taken before a section 32 determination under the Financial Management and
Accountability Act 1997 w as f inalised to transfer this funding to the Department of the
Environment.
Agency Additional Estimates Statements — Department of the Environment
30
Table 1.4: Additional Estimates and Variations to Outcomes from Other Variations Programme 2013-14 2014-15 2015-16 2016-17
impacted $'000 $'000 $'000 $'000
Outcome 1
Increase in estimates (administered)
Other variations 1.1 - - 1,096 3,324
Decrease in estimates (administered)
Parameter adjustment 1.1 - (151) (257) (311)
Net impact on estimates
for Outcome 1 (administered) - (151) 839 3,013
Increase in estimates (departmental)
Other variations All - 3,397 3,517 2,934
Decrease in estimates (departmental)
Parameter adjustment All - (284) (438) (523)
Other variations All (4,331) - - -
Increase in estimates (departmental-capital)
Other variations All - 109 - -
Decrease in estimates (departmental-capital)
Parameter adjustment All - (7) (13) (16)
Other variations All (611) - (298) (300)
Net impact on estimates
for Outcome 1 (departmental) (4,942) 3,215 2,768 2,095
Outcome 2
Increase in estimates (departmental)
Other variations All 327 - - -
Decrease in estimates (departmental)
Parameter adjustment All - (115) (155) (190)
Other variations All - (2,334) (2,334) (2,526)
Decrease in estimates (departmental-capital)
Parameter adjustment All - (6) (7) (9)
Other variations All (70) (1,044) (392) (312)
Net impact on estimates
for Outcome 2 (departmental) 257 (3,499) (2,888) (3,037)
Outcome 3
Decrease in estimates (departmental)
Parameter adjustment 3.1 - (254) (422) (497)
Other variations 3.1 (124) (307) (317) (229)
Increase in estimates (departmental-capital)
Other variations 3.1 1,330 1,607 1,749 1,766
Decrease in estimates (departmental-capital)
Parameter adjustment 3.1 - (40) (65) (79)
Net impact on estimates
for Outcome 3 (departmental) 1,206 1,006 945 961
Agency Additional Estimates Statements — Department of the Environment
31
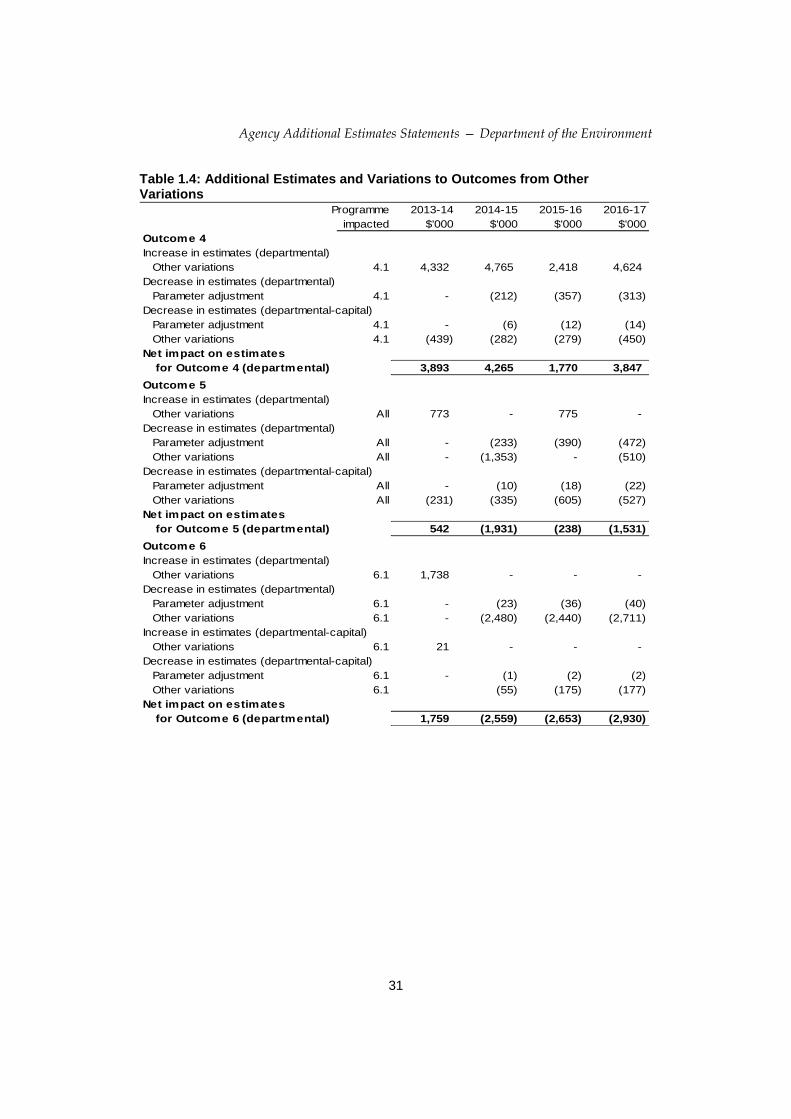
Table 1.4: Additional Estimates and Variations to Outcomes from Other Variations
Programme 2013-14 2014-15 2015-16 2016-17
impacted $'000 $'000 $'000 $'000
Outcome 4
Increase in estimates (departmental)
Other variations 4.1 4,332 4,765 2,418 4,624
Decrease in estimates (departmental)
Parameter adjustment 4.1 - (212) (357) (313)
Decrease in estimates (departmental-capital)
Parameter adjustment 4.1 - (6) (12) (14)
Other variations 4.1 (439) (282) (279) (450)
Net impact on estimates
for Outcome 4 (departmental) 3,893 4,265 1,770 3,847
Outcome 5
Increase in estimates (departmental)
Other variations All 773 - 775 -
Decrease in estimates (departmental)
Parameter adjustment All - (233) (390) (472)
Other variations All - (1,353) - (510)
Decrease in estimates (departmental-capital)
Parameter adjustment All - (10) (18) (22)
Other variations All (231) (335) (605) (527)
Net impact on estimates
for Outcome 5 (departmental) 542 (1,931) (238) (1,531)
Outcome 6
Increase in estimates (departmental)
Other variations 6.1 1,738 - - -
Decrease in estimates (departmental)
Parameter adjustment 6.1 - (23) (36) (40)
Other variations 6.1 - (2,480) (2,440) (2,711)
Increase in estimates (departmental-capital)
Other variations 6.1 21 - - -
Decrease in estimates (departmental-capital)
Parameter adjustment 6.1 - (1) (2) (2)
Other variations 6.1 (55) (175) (177)
Net impact on estimates
for Outcome 6 (departmental) 1,759 (2,559) (2,653) (2,930)
Agency Additional Estimates Statements — Department of the Environment
32
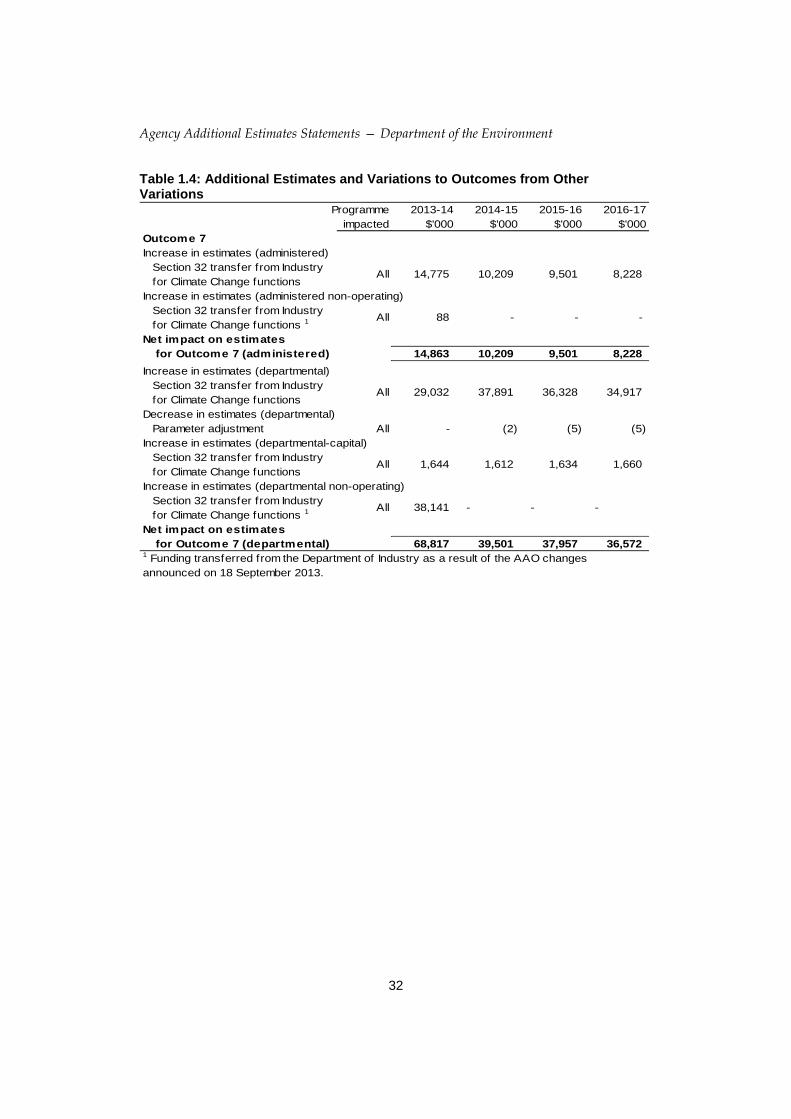
Table 1.4: Additional Estimates and Variations to Outcomes from Other Variations
Programme 2013-14 2014-15 2015-16 2016-17
impacted $'000 $'000 $'000 $'000
Outcome 7
Increase in estimates (administered)
Section 32 transfer from Industry
for Climate Change functionsAll 14,775 10,209 9,501 8,228
Increase in estimates (administered non-operating)
Section 32 transfer from Industry
for Climate Change functions 1 All 88 - - -
Net impact on estimates
for Outcome 7 (administered) 14,863 10,209 9,501 8,228
Increase in estimates (departmental)
Section 32 transfer from Industry
for Climate Change functionsAll 29,032 37,891 36,328 34,917
Decrease in estimates (departmental)
Parameter adjustment All - (2) (5) (5)
Increase in estimates (departmental-capital)
Section 32 transfer from Industry
for Climate Change functionsAll 1,644 1,612 1,634 1,660
Increase in estimates (departmental non-operating)
Section 32 transfer from Industry
for Climate Change functions 1 All 38,141 - - -
Net impact on estimates
for Outcome 7 (departmental) 68,817 39,501 37,957 36,5721 Funding transferred from the Department of Industry as a result of the AAO changes
announced on 18 September 2013.
Agency Additional Estimates Statements — Department of the Environment
33
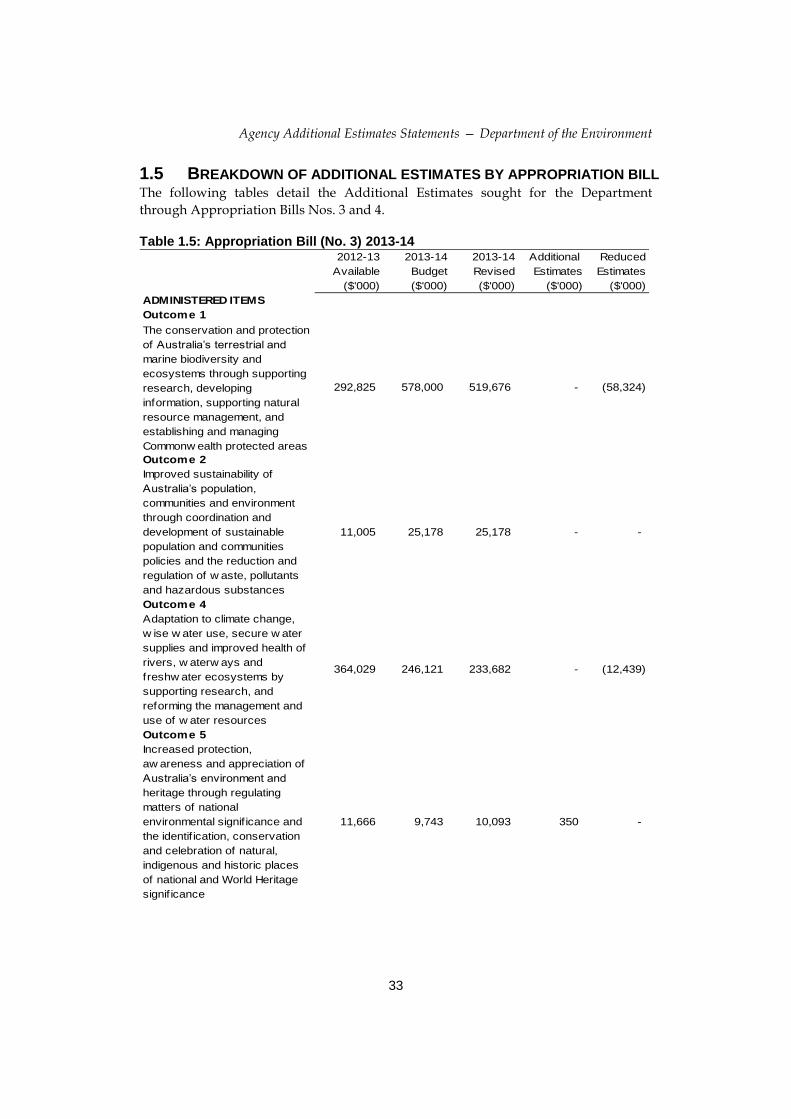
1.5 BREAKDOWN OF ADDITIONAL ESTIMATES BY APPROPRIATION BILL
The following tables detail the Additional Estimates sought for the Department
through Appropriation Bills Nos. 3 and 4.
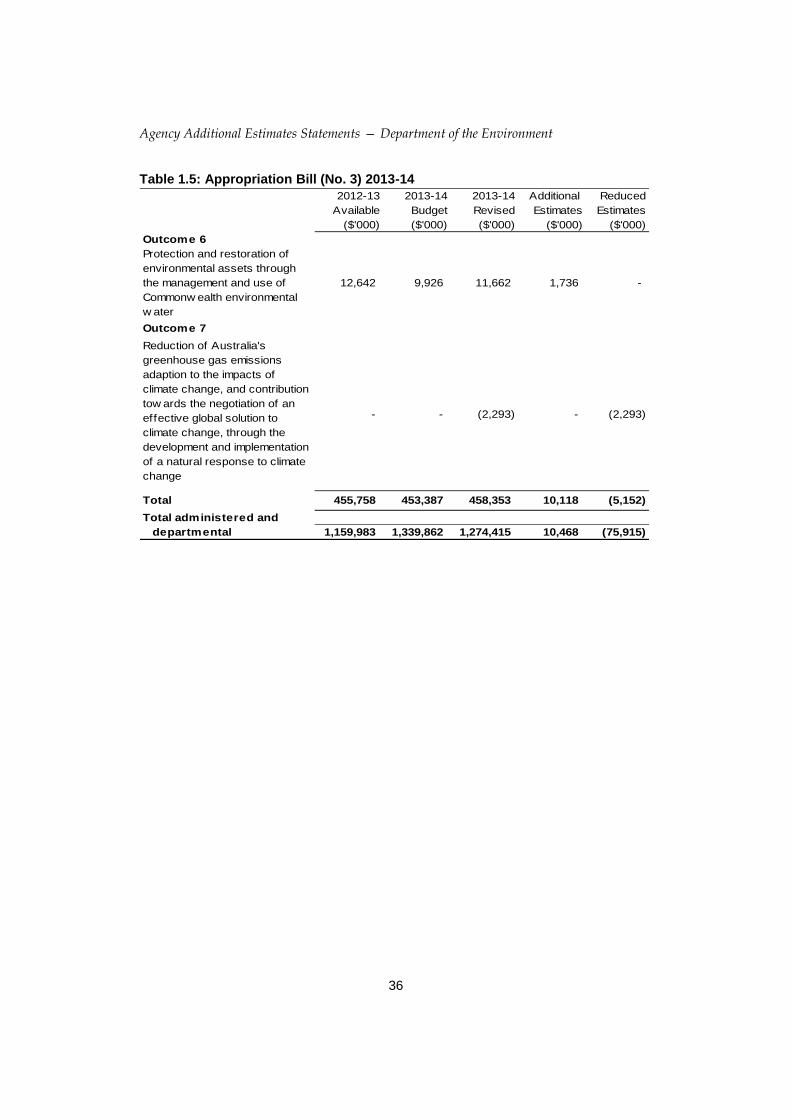
Table 1.5: Appropriation Bill (No. 3) 2013-14 2012-13 2013-14 2013-14 Additional Reduced
Available Budget Revised Estimates Estimates
($'000) ($'000) ($'000) ($'000) ($'000)
ADMINISTERED ITEMS
Outcome 1
The conservation and protection
of Australia’s terrestrial and
marine biodiversity and
ecosystems through supporting
research, developing
information, supporting natural
resource management, and
establishing and managing
Commonw ealth protected areas
292,825 578,000 519,676 - (58,324)
Outcome 2
Improved sustainability of
Australia’s population,
communities and environment
through coordination and
development of sustainable
population and communities
policies and the reduction and
regulation of w aste, pollutants
and hazardous substances
11,005 25,178 25,178 - -
Outcome 4
Adaptation to climate change,
w ise w ater use, secure w ater
supplies and improved health of
rivers, w aterw ays and
freshw ater ecosystems by
supporting research, and
reforming the management and
use of w ater resources
364,029 246,121 233,682 - (12,439)
Outcome 5
Increased protection,
aw areness and appreciation of
Australia’s environment and
heritage through regulating
matters of national
environmental signif icance and
the identif ication, conservation
and celebration of natural,
indigenous and historic places
of national and World Heritage
signif icance
11,666 9,743 10,093 350 -
Agency Additional Estimates Statements — Department of the Environment
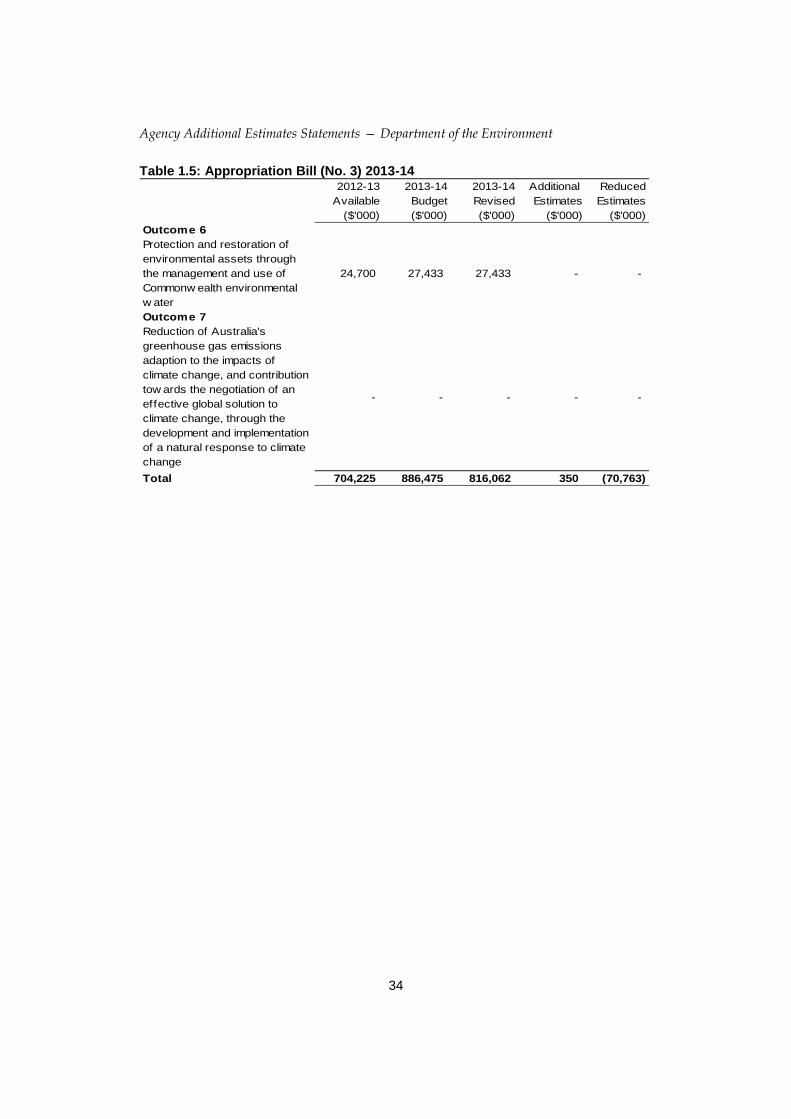
34
Table 1.5: Appropriation Bill (No. 3) 2013-14 2012-13 2013-14 2013-14 Additional Reduced
Available Budget Revised Estimates Estimates
($'000) ($'000) ($'000) ($'000) ($'000)
Outcome 6
Protection and restoration of
environmental assets through
the management and use of
Commonw ealth environmental
w ater
24,700 27,433 27,433 - -
Outcome 7
Reduction of Australia's
greenhouse gas emissions
adaption to the impacts of
climate change, and contribution
tow ards the negotiation of an
effective global solution to
climate change, through the
development and implementation
of a natural response to climate
change
- - - - -
Total 704,225 886,475 816,062 350 (70,763)
Agency Additional Estimates Statements — Department of the Environment
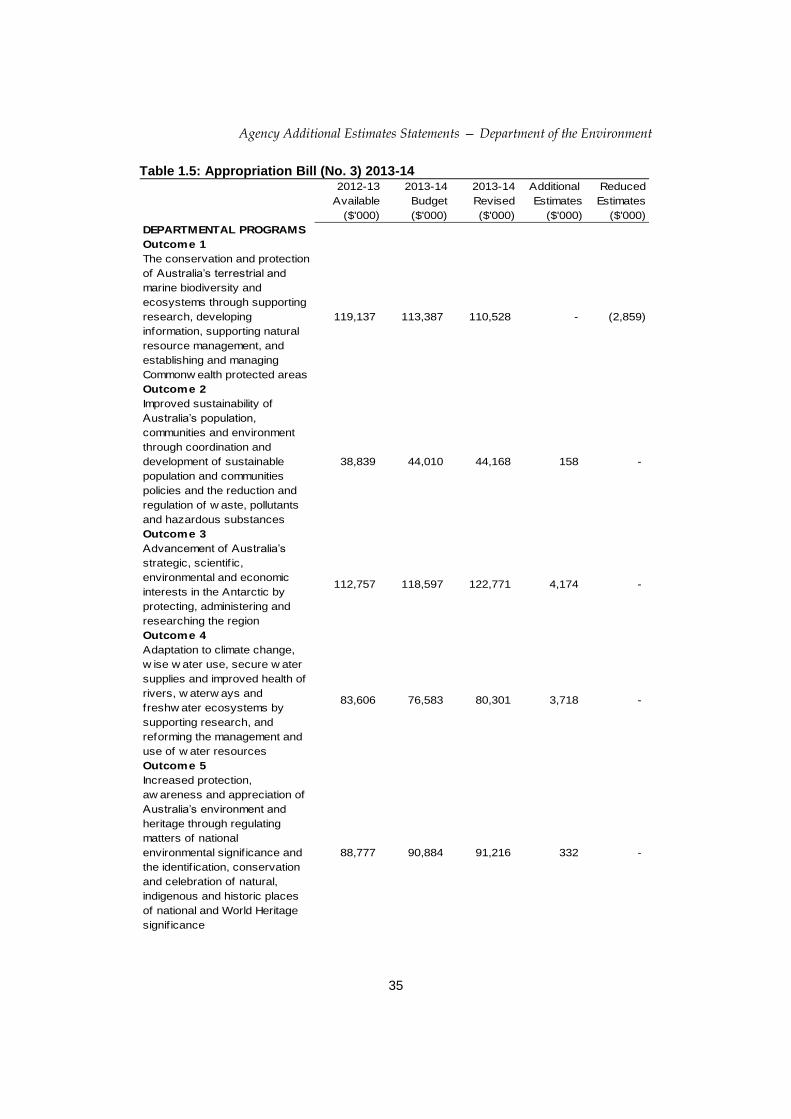
35
Table 1.5: Appropriation Bill (No. 3) 2013-14 2012-13 2013-14 2013-14 Additional Reduced
Available Budget Revised Estimates Estimates
($'000) ($'000) ($'000) ($'000) ($'000)
DEPARTMENTAL PROGRAMS
Outcome 1
The conservation and protection
of Australia’s terrestrial and
marine biodiversity and
ecosystems through supporting
research, developing
information, supporting natural
resource management, and
establishing and managing
Commonw ealth protected areas
119,137 113,387 110,528 - (2,859)
Outcome 2
Improved sustainability of
Australia’s population,
communities and environment
through coordination and
development of sustainable
population and communities
policies and the reduction and
regulation of w aste, pollutants
and hazardous substances
38,839 44,010 44,168 158 -
Outcome 3
Advancement of Australia’s
strategic, scientif ic,
environmental and economic
interests in the Antarctic by
protecting, administering and
researching the region
112,757 118,597 122,771 4,174 -
Outcome 4
Adaptation to climate change,
w ise w ater use, secure w ater
supplies and improved health of
rivers, w aterw ays and
freshw ater ecosystems by
supporting research, and
reforming the management and
use of w ater resources
83,606 76,583 80,301 3,718 -
Outcome 5
Increased protection,
aw areness and appreciation of
Australia’s environment and
heritage through regulating
matters of national
environmental signif icance and
the identif ication, conservation
and celebration of natural,
indigenous and historic places
of national and World Heritage
signif icance
88,777 90,884 91,216 332 -
Agency Additional Estimates Statements — Department of the Environment
36
Table 1.5: Appropriation Bill (No. 3) 2013-14
2012-13 2013-14 2013-14 Additional Reduced
Available Budget Revised Estimates Estimates
($'000) ($'000) ($'000) ($'000) ($'000)
Outcome 6
Protection and restoration of
environmental assets through
the management and use of
Commonw ealth environmental
w ater
12,642 9,926 11,662 1,736 -
Outcome 7
Reduction of Australia's
greenhouse gas emissions
adaption to the impacts of
climate change, and contribution
tow ards the negotiation of an
effective global solution to
climate change, through the
development and implementation
of a natural response to climate
change
- - (2,293) - (2,293)
Total 455,758 453,387 458,353 10,118 (5,152)
Total administered and
departmental 1,159,983 1,339,862 1,274,415 10,468 (75,915)
Agency Additional Estimates Statements — Department of the Environment
37
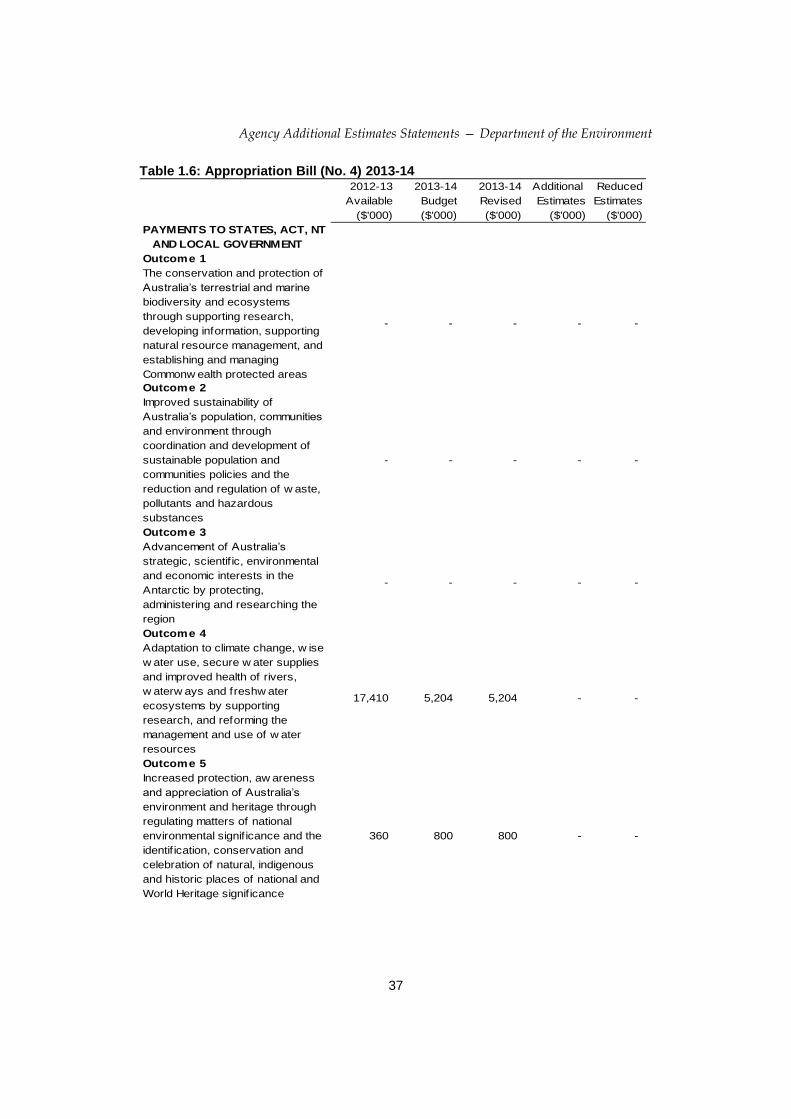
Table 1.6: Appropriation Bill (No. 4) 2013-14 2012-13 2013-14 2013-14 Additional Reduced
Available Budget Revised Estimates Estimates
($'000) ($'000) ($'000) ($'000) ($'000)
PAYMENTS TO STATES, ACT, NT
AND LOCAL GOVERNMENT
Outcome 1
The conservation and protection of
Australia’s terrestrial and marine
biodiversity and ecosystems
through supporting research,
developing information, supporting
natural resource management, and
establishing and managing
Commonw ealth protected areas
- - - - -
Outcome 2
Improved sustainability of
Australia’s population, communities
and environment through
coordination and development of
sustainable population and
communities policies and the
reduction and regulation of w aste,
pollutants and hazardous
substances
- - - - -
Outcome 3
Advancement of Australia’s
strategic, scientif ic, environmental
and economic interests in the
Antarctic by protecting,
administering and researching the
region
- - - - -
Outcome 4
Adaptation to climate change, w ise
w ater use, secure w ater supplies
and improved health of rivers,
w aterw ays and freshw ater
ecosystems by supporting
research, and reforming the
management and use of w ater
resources
17,410 5,204 5,204 - -
Outcome 5
Increased protection, aw areness
and appreciation of Australia’s
environment and heritage through
regulating matters of national
environmental signif icance and the
identif ication, conservation and
celebration of natural, indigenous
and historic places of national and
World Heritage signif icance
360 800 800 - -
Agency Additional Estimates Statements — Department of the Environment
38
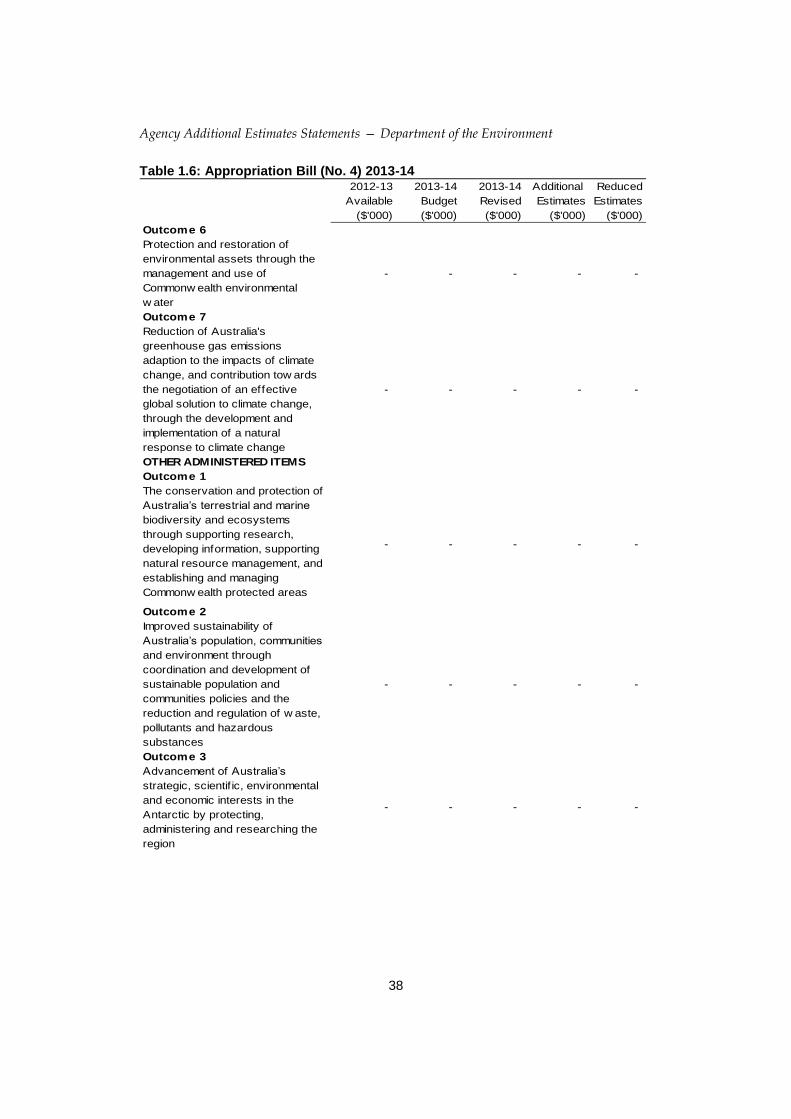
Table 1.6: Appropriation Bill (No. 4) 2013-14 2012-13 2013-14 2013-14 Additional Reduced
Available Budget Revised Estimates Estimates
($'000) ($'000) ($'000) ($'000) ($'000)
Outcome 6
Protection and restoration of
environmental assets through the
management and use of
Commonw ealth environmental
w ater
- - - - -
Outcome 7
Reduction of Australia's
greenhouse gas emissions
adaption to the impacts of climate
change, and contribution tow ards
the negotiation of an effective
global solution to climate change,
through the development and
implementation of a natural
response to climate change
- - - - -
OTHER ADMINISTERED ITEMS
Outcome 1
The conservation and protection of
Australia’s terrestrial and marine
biodiversity and ecosystems
through supporting research,
developing information, supporting
natural resource management, and
establishing and managing
Commonw ealth protected areas
- - - - -
Outcome 2
Improved sustainability of
Australia’s population, communities
and environment through
coordination and development of
sustainable population and
communities policies and the
reduction and regulation of w aste,
pollutants and hazardous
substances
- - - - -
Outcome 3
Advancement of Australia’s
strategic, scientif ic, environmental
and economic interests in the
Antarctic by protecting,
administering and researching the
region
- - - - -
Agency Additional Estimates Statements — Department of the Environment
39
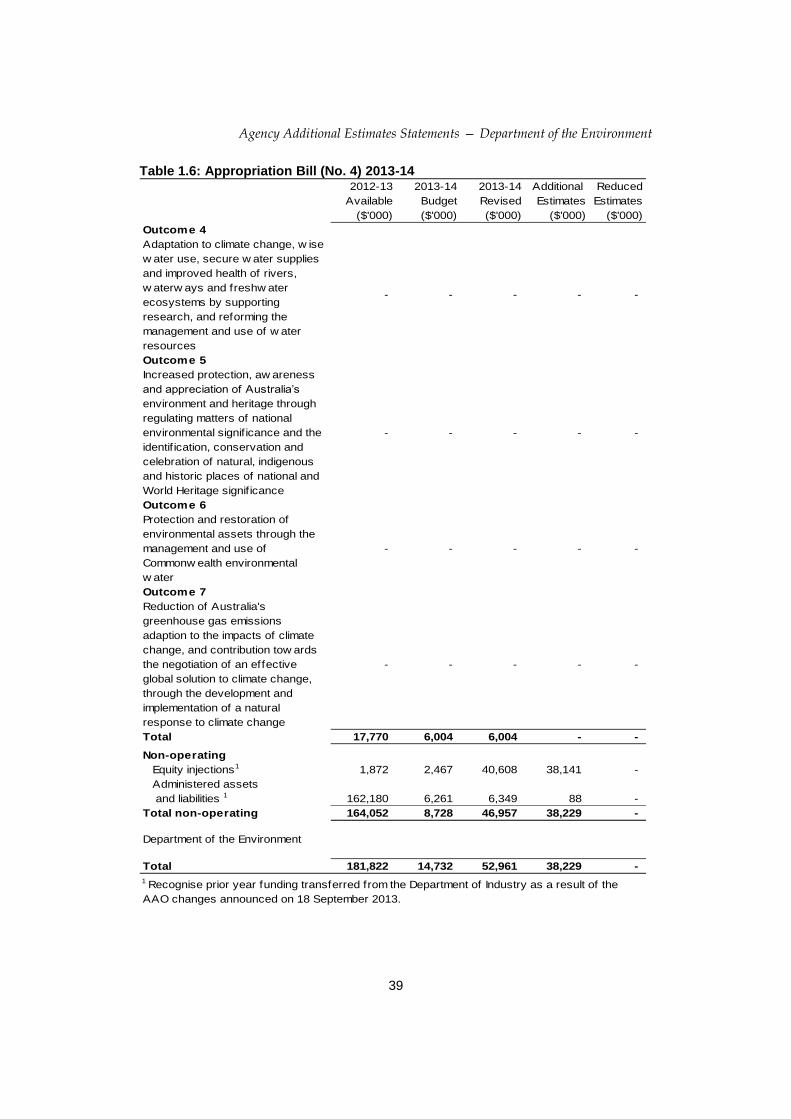
Table 1.6: Appropriation Bill (No. 4) 2013-14 2012-13 2013-14 2013-14 Additional Reduced
Available Budget Revised Estimates Estimates
($'000) ($'000) ($'000) ($'000) ($'000)
Outcome 4
Adaptation to climate change, w ise
w ater use, secure w ater supplies
and improved health of rivers,
w aterw ays and freshw ater
ecosystems by supporting
research, and reforming the
management and use of w ater
resources
- - - - -
Outcome 5
Increased protection, aw areness
and appreciation of Australia’s
environment and heritage through
regulating matters of national
environmental signif icance and the
identif ication, conservation and
celebration of natural, indigenous
and historic places of national and
World Heritage signif icance
- - - - -
Outcome 6
Protection and restoration of
environmental assets through the
management and use of
Commonw ealth environmental
w ater
- - - - -
Outcome 7
Reduction of Australia's
greenhouse gas emissions
adaption to the impacts of climate
change, and contribution tow ards
the negotiation of an effective
global solution to climate change,
through the development and
implementation of a natural
response to climate change
- - - - -
Total 17,770 6,004 6,004 - -
Non-operating
Equity injections1 1,872 2,467 40,608 38,141 -
Administered assets
and liabilities 1 162,180 6,261 6,349 88 -
Total non-operating 164,052 8,728 46,957 38,229 -
Department of the Environment
Total 181,822 14,732 52,961 38,229 -
1 Recognise prior year funding transferred from the Department of Industry as a result of the
AAO changes announced on 18 September 2013.
Agency Additional Estimates Statements — Department of the Environment
40
Section 2: Revisions to Agency Resources and Planned Performance
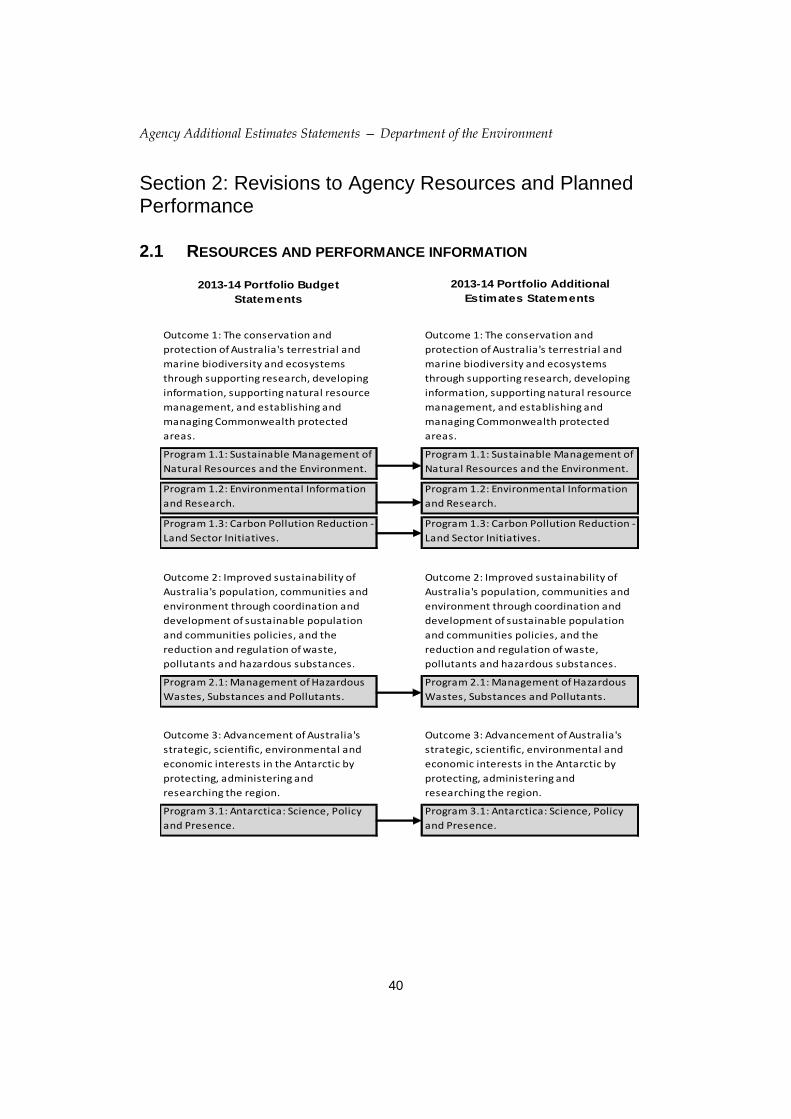
2.1 RESOURCES AND PERFORMANCE INFORMATION
2013-14 Portfolio Budget
Statements
2013-14 Portfolio Additional
Estimates Statements
Outcome 1: The conservation and
protection of Australia's terrestrial and
marine biodiversity and ecosystems
through supporting research, developing
information, supporting natural resource
management, and establishing and
managing Commonwealth protected
areas.
Outcome 1: The conservation and
protection of Australia's terrestrial and
marine biodiversity and ecosystems
through supporting research, developing
information, supporting natural resource
management, and establishing and
managing Commonwealth protected
areas.
Program 1.1: Sustainable Management of
Natural Resources and the Environment.
Program 1.1: Sustainable Management of
Natural Resources and the Environment.
Program 1.2: Environmental Information
and Research.
Program 1.2: Environmental Information
and Research.
Program 1.3: Carbon Pollution Reduction -
Land Sector Initiatives.
Program 1.3: Carbon Pollution Reduction -
Land Sector Initiatives.
Outcome 2: Improved sustainability of
Australia's population, communities and
environment through coordination and
development of sustainable population
and communities policies, and the
reduction and regulation of waste,
pollutants and hazardous substances.
Outcome 2: Improved sustainability of
Australia's population, communities and
environment through coordination and
development of sustainable population
and communities policies, and the
reduction and regulation of waste,
pollutants and hazardous substances.
Program 2.1: Management of Hazardous
Wastes, Substances and Pollutants.
Program 2.1: Management of Hazardous
Wastes, Substances and Pollutants.
Outcome 3: Advancement of Australia's
strategic, scientific, environmental and
economic interests in the Antarctic by
protecting, administering and
researching the region.
Outcome 3: Advancement of Australia's
strategic, scientific, environmental and
economic interests in the Antarctic by
protecting, administering and
researching the region.
Program 3.1: Antarctica: Science, Policy
and Presence.
Program 3.1: Antarctica: Science, Policy
and Presence.
Agency Additional Estimates Statements — Department of the Environment
41
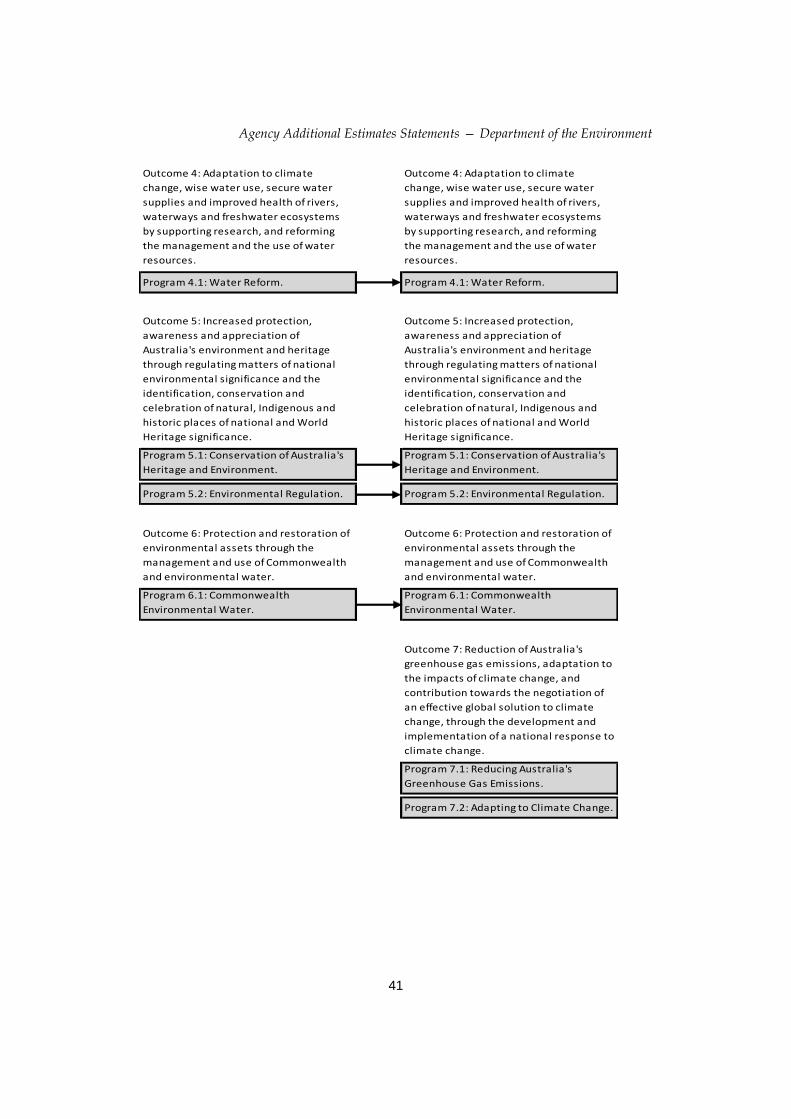
Outcome 4: Adaptation to climate
change, wise water use, secure water
supplies and improved health of rivers,
waterways and freshwater ecosystems
by supporting research, and reforming
the management and the use of water
resources.
Outcome 4: Adaptation to climate
change, wise water use, secure water
supplies and improved health of rivers,
waterways and freshwater ecosystems
by supporting research, and reforming
the management and the use of water
resources.
Program 4.1: Water Reform. Program 4.1: Water Reform.
Outcome 5: Increased protection,
awareness and appreciation of
Australia's environment and heritage
through regulating matters of national
environmental significance and the
identification, conservation and
celebration of natural, Indigenous and
historic places of national and World
Heritage significance.
Program 5.1: Conservation of Australia's
Heritage and Environment.
Program 5.1: Conservation of Australia's
Heritage and Environment.
Program 5.2: Environmental Regulation. Program 5.2: Environmental Regulation.
Outcome 6: Protection and restoration of
environmental assets through the
management and use of Commonwealth
and environmental water.
Outcome 6: Protection and restoration of
environmental assets through the
management and use of Commonwealth
and environmental water.
Program 6.1: Commonwealth
Environmental Water.
Program 6.1: Commonwealth
Environmental Water.
Outcome 7: Reduction of Australia's
greenhouse gas emissions, adaptation to
the impacts of climate change, and
contribution towards the negotiation of
an effective global solution to climate
change, through the development and
implementation of a national response to
climate change.
Program 7.1: Reducing Australia's
Greenhouse Gas Emissions.
Program 7.2: Adapting to Climate Change.
Agency Additional Estimates Statements — Department of the Environment
42
OUTCOME 1: THE CONSERVATION AND PROTECTION OF AUSTRALIA’S
TERRESTRIAL AND MARINE BIODIVERSITY AND ECOSYSTEMS THROUGH
SUPPORTING RESEARCH, DEVELOPING INFORMATION, SUPPORTING
NATURAL RESOURCE MANAGEMENT, AND ESTABLISHING AND
MANAGING COMMONWEALTH PROTECTED AREAS.
Outcome 1 Strategy
The Department is committed to conserving and protecting Australia’s unique
biodiversity through provision of policy advice and the delivery of programmes,
information and research.
The Department is progressing design and implementation of the following
commitments, which will amend the Outcome 1 Strategy published in the 2013-14
Budget:
the National Landcare Programme will replace the Caring for our Country
initiative in 2014-15;
Reef 2050 Plan will contribute to the long term environmental protection of the
Great Barrier Reef;
the Government’s Commonwealth marine reserves proclaimed in November
2012 will be reviewed; and
the Green Army will be established.
The Green Army measure, announced in the 2013-14 Mid Year Economic and Fiscal
Outlook, will deliver local projects that support regional, national and international
conservation management objectives while also providing skills and training to
participants. The Department is supporting the Government’s natural resource
management priorities, in particular, a simple, local and long term approach, through
implementation of the National Landcare Programme.
The Department has made a contribution of $0.3 million in 2013-14 to undertake three
surveillance flights over the Southern Ocean.
Agency Additional Estimates Statements — Department of the Environment
43
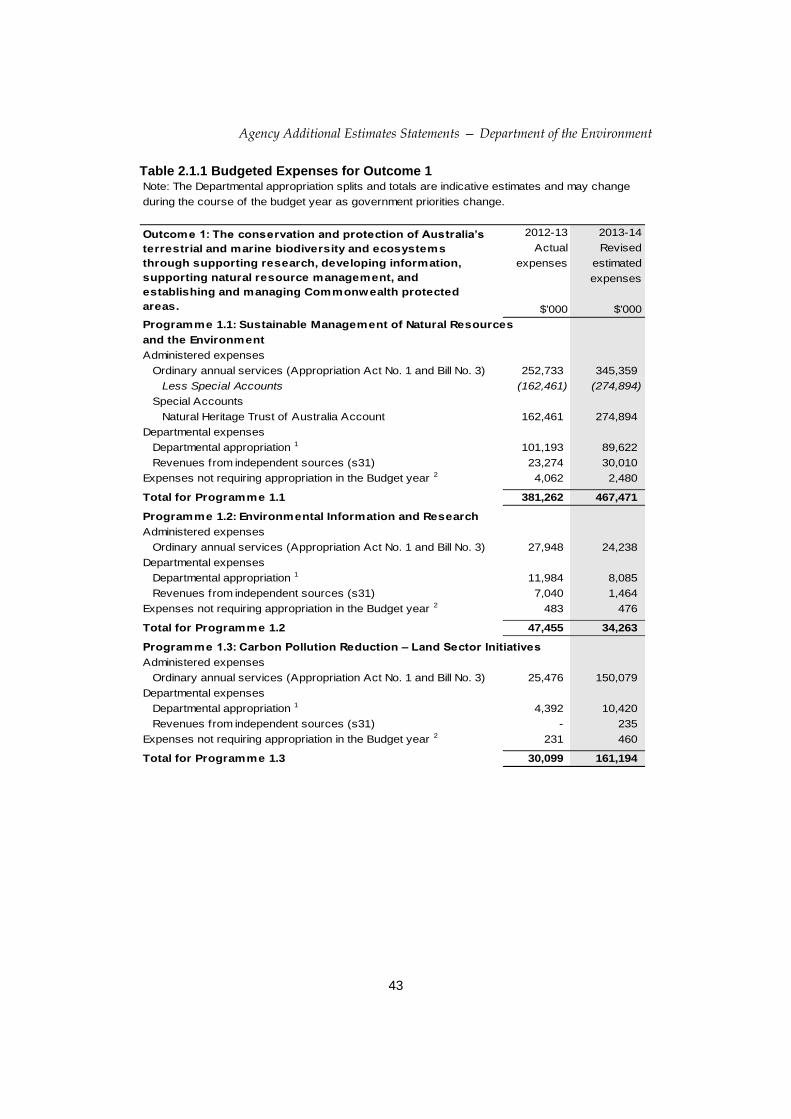
Table 2.1.1 Budgeted Expenses for Outcome 1 Note: The Departmental appropriation splits and totals are indicative estimates and may change
during the course of the budget year as government priorities change.
2012-13 2013-14
Actual Revised
expenses estimated
expenses
$'000 $'000
Programme 1.1: Sustainable Management of Natural Resources
and the Environment
Administered expenses
Ordinary annual services (Appropriation Act No. 1 and Bill No. 3) 252,733 345,359
Less Special Accounts (162,461) (274,894)
Special Accounts
Natural Heritage Trust of Australia Account 162,461 274,894
Departmental expenses
Departmental appropriation 1 101,193 89,622
Revenues from independent sources (s31) 23,274 30,010
Expenses not requiring appropriation in the Budget year 2 4,062 2,480
Total for Programme 1.1 381,262 467,471
Programme 1.2: Environmental Information and Research
Administered expenses
Ordinary annual services (Appropriation Act No. 1 and Bill No. 3) 27,948 24,238
Departmental expenses
Departmental appropriation 1 11,984 8,085
Revenues from independent sources (s31) 7,040 1,464
Expenses not requiring appropriation in the Budget year 2 483 476
Total for Programme 1.2 47,455 34,263
Programme 1.3: Carbon Pollution Reduction – Land Sector Initiatives
Administered expenses
Ordinary annual services (Appropriation Act No. 1 and Bill No. 3) 25,476 150,079
Departmental expenses
Departmental appropriation 1 4,392 10,420
Revenues from independent sources (s31) - 235
Expenses not requiring appropriation in the Budget year 2 231 460
Total for Programme 1.3 30,099 161,194
Outcome 1: The conservation and protection of Australia’s
terrestrial and marine biodiversity and ecosystems
through supporting research, developing information,
supporting natural resource management, and
establishing and managing Commonwealth protected
areas.
Agency Additional Estimates Statements — Department of the Environment
44
Table 2.1.1 Budgeted Expenses for Outcome 1 2012-13 2013-14
Actual Revised
expenses estimated
expenses
$'000 $'000
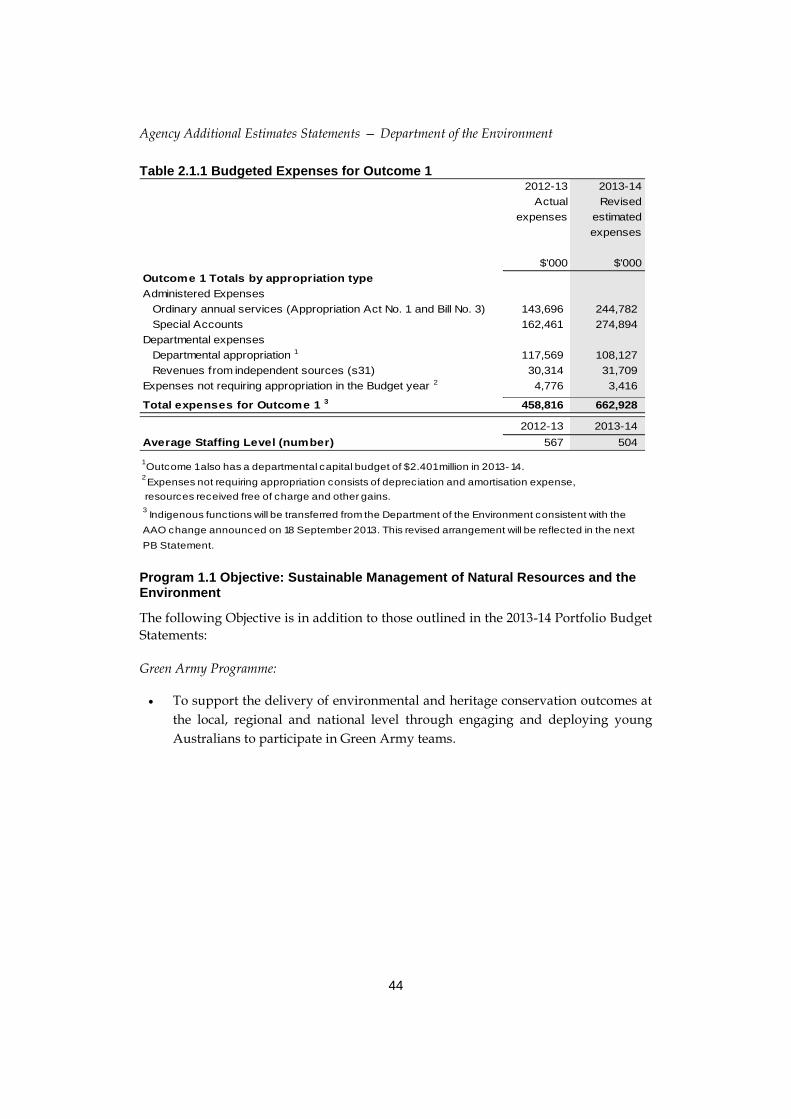
Outcome 1 Totals by appropriation type
Administered Expenses
Ordinary annual services (Appropriation Act No. 1 and Bill No. 3) 143,696 244,782
Special Accounts 162,461 274,894
Departmental expenses
Departmental appropriation 1 117,569 108,127
Revenues from independent sources (s31) 30,314 31,709
Expenses not requiring appropriation in the Budget year 2 4,776 3,416
Total expenses for Outcome 1 3 458,816 662,928
2012-13 2013-14
Average Staffing Level (number) 567 504
1 Outcome 1 also has a departmental capital budget of $2.401 million in 2013- 14.
2 Expenses not requiring appropriation consists of depreciation and amortisation expense,
resources received free of charge and other gains.
3 Indigenous functions will be transferred from the Department of the Environment consistent with the
AAO change announced on 18 September 2013. This revised arrangement will be reflected in the next
PB Statement.
Program 1.1 Objective: Sustainable Management of Natural Resources and the Environment
The following Objective is in addition to those outlined in the 2013-14 Portfolio Budget
Statements:
Green Army Programme:
To support the delivery of environmental and heritage conservation outcomes at
the local, regional and national level through engaging and deploying young
Australians to participate in Green Army teams.

Agency Additional Estimates Statements — Department of the Environment
45
Program 1.1 Expenses: Sustainable Management of Natural Resources and the Environment
2012-13 2013-14 2014-15 2015-16 2016-17
Actual Revised Forw ard Forw ard Forw ard
budget year 1 year 2 year 3
$'000 $'000 $'000 $'000 $'000
Annual administered expenses:
Caring for our Country: 1
Natural Heritage Trust 162,461 274,894 279,952 330,945 333,000
Less Special Accounts (162,461) (274,894) (279,952) (330,945) (333,000)
Environmental Stew ardship
Programme 11,046 14,404 14,730 16,033 17,459
Working on Country 57,337 46,783 51,227 52,035 52,610
Tasmanian Forests Agreement -
Implementation Package 20,280 1,000 7,720 1,000 -
Caring for our Country - National
Wildlife Corridor Plan 1,609 3,807 - - -
Great Barrier Reef Foundation -
contribution - 3,125 3,125 3,125 3,125
Grants to Voluntary Environment,
Sustainability and Heritage
Organisations - 1,346 1,345 1,344 1,342
Green Army - - 48,345 97,447 147,945
Special Account Expenses:
Natural Heritage Trust of
Australia Account 162,461 274,894 279,952 330,945 333,000
Annual departmental expenses:
Departmental Programme Support 2 122,967 119,632 113,562 111,245 110,299
Grants to Voluntary Environment,
Sustainability and Heritage
Organisations 1,500 - - - -
Expenses not requiring appropriation
in the Budget year:
Depreciation and amortisation 3,099 2,377 2,722 1,557 1,438
Other 3 963 103 118 118 123
Total programme expenses 381,262 467,471 522,846 614,849 667,341
1 Part of Caring for our Country funding has been transferred to the Department of the Treasury
in 2012- 13 to enable payments required under the Federal Financial Relations Act 2009.2 Includes other revenue in addition to Appropriation and Sale of Goods and Services.
3 Includes resources received free of charge, other gains and impairment of financial assets.
Agency Additional Estimates Statements — Department of the Environment
46
Program 1.1 Deliverables
The following Deliverables are in addition to those outlined in the 2013-14 Portfolio
Budget Statements:
Green Army Programme:
Green Army Programme Guidelines, describing the design and delivery of the
programme are produced.
A tender process to assess and select suitable service provider/s is undertaken.
A project selection process will be conducted to assess and select suitable Green
Army projects for Rounds 1 and 2.
Program 1.1 Key Performance Indicators
The following Key Performance Indicators are in addition to those outlined in the
2013-14 Portfolio Budget Statements:
Green Army Programme:
Completion of initial programme design, with the programme ready for delivery
from 1 July 2014.
Engagement of one or more service providers to recruit and deploy Green Army
teams from 1 July 2014.
Selection of up to 250 projects, via competitive assessment rounds (Rounds 1 and
2), for Green Army team deployment from 1 July 2014.
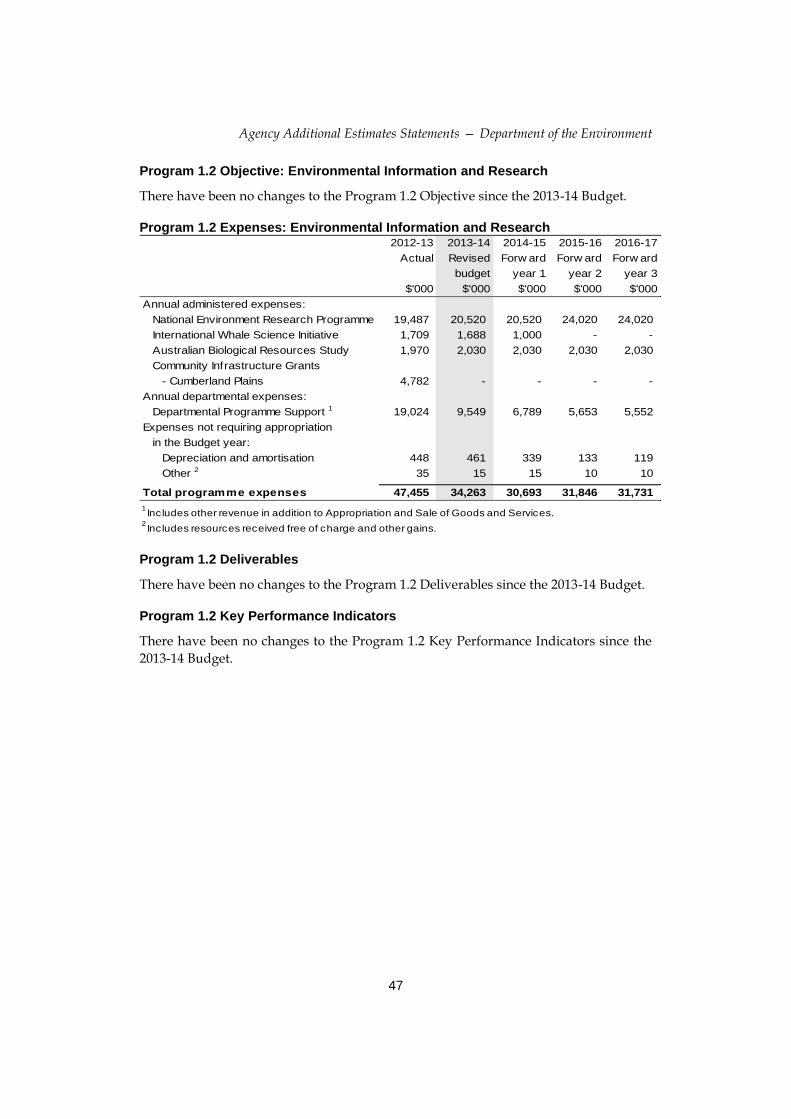
Agency Additional Estimates Statements — Department of the Environment
47
Program 1.2 Objective: Environmental Information and Research
There have been no changes to the Program 1.2 Objective since the 2013-14 Budget.
Program 1.2 Expenses: Environmental Information and Research 2012-13 2013-14 2014-15 2015-16 2016-17
Actual Revised Forw ard Forw ard Forw ard
budget year 1 year 2 year 3
$'000 $'000 $'000 $'000 $'000
Annual administered expenses:
National Environment Research Programme 19,487 20,520 20,520 24,020 24,020
International Whale Science Initiative 1,709 1,688 1,000 - -
Australian Biological Resources Study 1,970 2,030 2,030 2,030 2,030
Community Infrastructure Grants
- Cumberland Plains 4,782 - - - -
Annual departmental expenses:
Departmental Programme Support 1 19,024 9,549 6,789 5,653 5,552
Expenses not requiring appropriation
in the Budget year:
Depreciation and amortisation 448 461 339 133 119
Other 2 35 15 15 10 10
Total programme expenses 47,455 34,263 30,693 31,846 31,731
1 Includes other revenue in addition to Appropriation and Sale of Goods and Services.
2 Includes resources received free of charge and other gains.
Program 1.2 Deliverables
There have been no changes to the Program 1.2 Deliverables since the 2013-14 Budget.
Program 1.2 Key Performance Indicators
There have been no changes to the Program 1.2 Key Performance Indicators since the
2013-14 Budget.

Agency Additional Estimates Statements — Department of the Environment
48
Program 1.3 Objective: Carbon Pollution Reduction – Land Sector Initiatives
There have been no changes to the Program 1.3 Objectives since the 2013-14 Budget,
noting that the key programmes delivered under Programme 1.3 will be abolished as
part of the repeal of the carbon tax. Existing programme commitments will be
honoured, but no new commitments will be entered into.
the Biodiversity Fund will terminate on 30 June 2018;
the Indigenous Carbon Farming Fund will terminate on 30 June 2017;
the Land Sector Carbon and Biodiversity Board has been abolished; and
Regional Natural Resource Management (NRM) Planning for Climate Change
will terminate on 30 June 2016.
Program 1.3 Expenses: Carbon Pollution Reduction – Land Sector Initiatives 2012-13 2013-14 2014-15 2015-16 2016-17
Actual Revised Forw ard Forw ard Forw ard
budget year 1 year 2 year 3
$'000 $'000 $'000 $'000 $'000
Annual administered expenses:
Biodiversity Fund 20,452 129,405 85,867 70,165 42,423
Regional NRM Planning for Climate
Change 3,744 18,000 1,146 1,245 -
Indigenous Carbon Farming Fund 1,280 2,674 735 - -
Annual departmental expenses:
Departmental Programme Support 1 4,392 10,655 7,534 7,986 6,067
Expenses not requiring appropriation
in the Budget year:
Depreciation and amortisation 219 440 334 255 170
Other 2 12 20 15 20 15
Total programme expenses 30,099 161,194 95,631 79,671 48,675
1 Includes other revenue in addition to Appropriation and Sale of Goods and Services.
2 Includes resources received free of charge and other gains.
Program 1.3 Deliverables
There have been no changes to the Program 1.3 Deliverables since the 2013-14 Budget,
noting that the key programmes delivered under Programme 1.3 will be abolished as
part of the repeal of the carbon tax.
Program 1.3 Key Performance Indicators
There have been no changes to the Program 1.3 Key Performance Indicators since the
2013-14 Budget, noting that the key programmes delivered under Programme 1.3 will
be abolished as part of the repeal of the carbon tax.
Agency Additional Estimates Statements — Department of the Environment
49
OUTCOME 2: IMPROVED SUSTAINABILITY OF AUSTRALIA’S
POPULATION, COMMUNITIES AND ENVIRONMENT THROUGH
COORDINATION AND DEVELOPMENT OF SUSTAINABLE POPULATION AND
COMMUNITIES POLICIES, AND THE REDUCTION AND REGULATION OF
WASTE, POLLUTANTS AND HAZARDOUS SUBSTANCES.
Outcome 2 Strategy
The following Strategy updates that outlined in the 2013-14 Portfolio Budget
Statements.
On 13 November 2013, the Government introduced bills into the Parliament to repeal
the equivalent carbon price on synthetic greenhouse gases. The application of an
equivalent carbon price to synthetic greenhouse gases commenced on 1 July 2012 and
is planned to be repealed from 1 July 2014.
On 8 November 2013, the Government announced its decision to abolish the National
Sustainability Council, with the functions of the Council to be absorbed by the
Department.
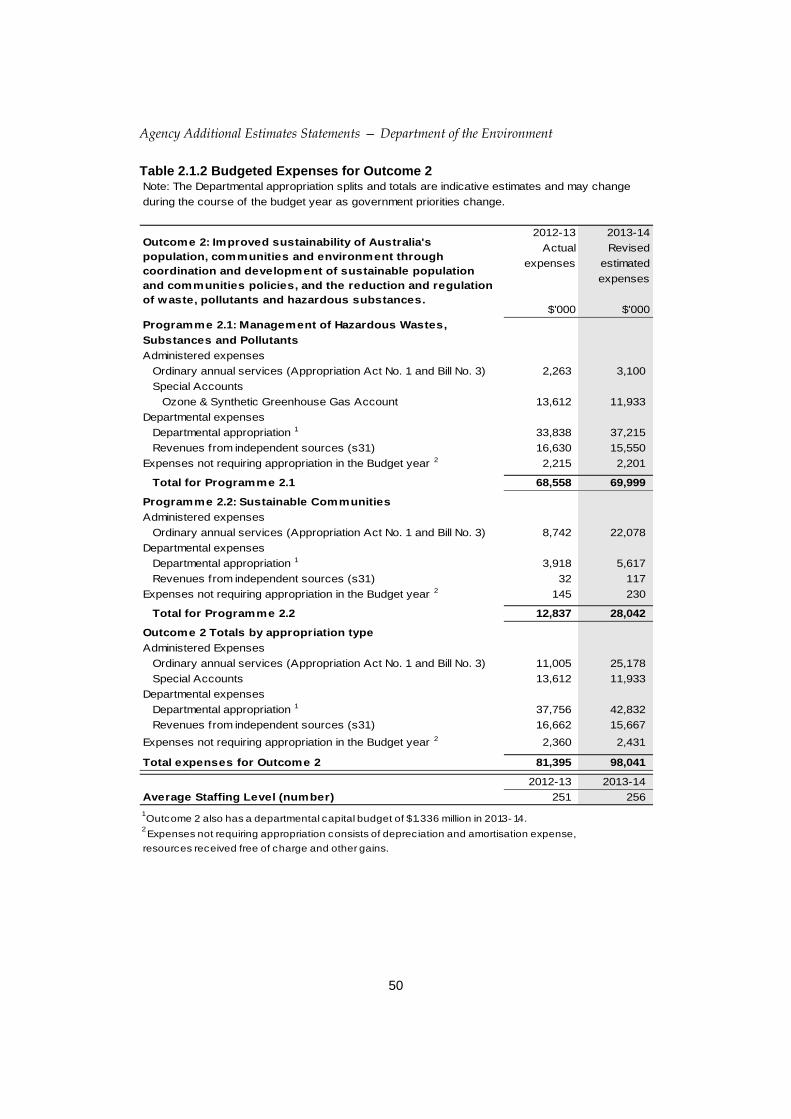
Agency Additional Estimates Statements — Department of the Environment
50
Table 2.1.2 Budgeted Expenses for Outcome 2 Note: The Departmental appropriation splits and totals are indicative estimates and may change
during the course of the budget year as government priorities change.
2012-13 2013-14
Actual Revised
expenses estimated
expenses
$'000 $'000
Programme 2.1: Management of Hazardous Wastes,
Substances and Pollutants
Administered expenses
Ordinary annual services (Appropriation Act No. 1 and Bill No. 3) 2,263 3,100
Special Accounts
Ozone & Synthetic Greenhouse Gas Account 13,612 11,933
Departmental expenses
Departmental appropriation 1 33,838 37,215
Revenues from independent sources (s31) 16,630 15,550
Expenses not requiring appropriation in the Budget year 2 2,215 2,201
Total for Programme 2.1 68,558 69,999
Programme 2.2: Sustainable Communities
Administered expenses
Ordinary annual services (Appropriation Act No. 1 and Bill No. 3) 8,742 22,078
Departmental expenses
Departmental appropriation 1 3,918 5,617
Revenues from independent sources (s31) 32 117
Expenses not requiring appropriation in the Budget year 2 145 230
Total for Programme 2.2 12,837 28,042
Outcome 2 Totals by appropriation type
Administered Expenses
Ordinary annual services (Appropriation Act No. 1 and Bill No. 3) 11,005 25,178
Special Accounts 13,612 11,933
Departmental expenses
Departmental appropriation 1 37,756 42,832
Revenues from independent sources (s31) 16,662 15,667
Expenses not requiring appropriation in the Budget year 2 2,360 2,431
Total expenses for Outcome 2 81,395 98,041
2012-13 2013-14
Average Staffing Level (number) 251 256
1 Outcome 2 also has a departmental capital budget of $1.336 million in 2013- 14.
2 Expenses not requiring appropriation consists of depreciation and amortisation expense,
resources received free of charge and other gains.
Outcome 2: Improved sustainability of Australia's
population, communities and environment through
coordination and development of sustainable population
and communities policies, and the reduction and regulation
of waste, pollutants and hazardous substances.
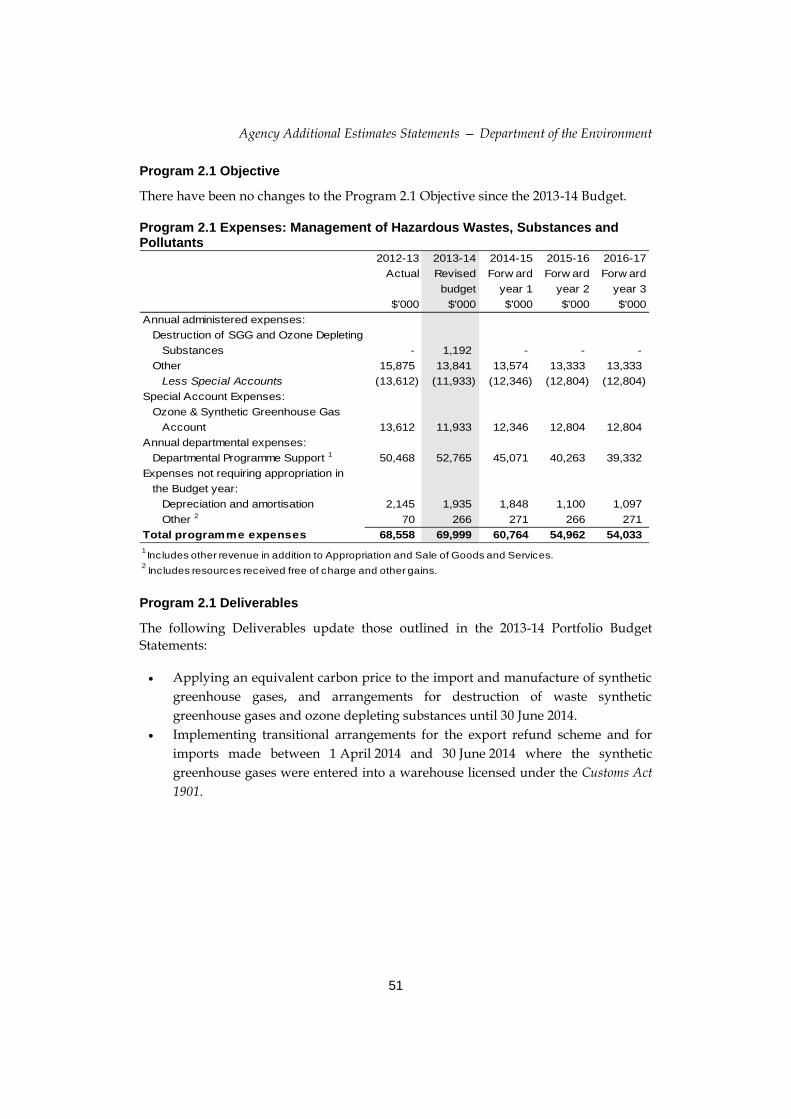
Agency Additional Estimates Statements — Department of the Environment
51
Program 2.1 Objective
There have been no changes to the Program 2.1 Objective since the 2013-14 Budget.
Program 2.1 Expenses: Management of Hazardous Wastes, Substances and Pollutants
2012-13 2013-14 2014-15 2015-16 2016-17
Actual Revised Forw ard Forw ard Forw ard
budget year 1 year 2 year 3
$'000 $'000 $'000 $'000 $'000
Annual administered expenses:
Destruction of SGG and Ozone Depleting
Substances - 1,192 - - -
Other 15,875 13,841 13,574 13,333 13,333
Less Special Accounts (13,612) (11,933) (12,346) (12,804) (12,804)
Special Account Expenses:
Ozone & Synthetic Greenhouse Gas
Account 13,612 11,933 12,346 12,804 12,804
Annual departmental expenses:
Departmental Programme Support 1 50,468 52,765 45,071 40,263 39,332
Expenses not requiring appropriation in
the Budget year:
Depreciation and amortisation 2,145 1,935 1,848 1,100 1,097
Other 2 70 266 271 266 271
Total programme expenses 68,558 69,999 60,764 54,962 54,033
1 Includes other revenue in addition to Appropriation and Sale of Goods and Services.
2 Includes resources received free of charge and other gains.
Program 2.1 Deliverables
The following Deliverables update those outlined in the 2013-14 Portfolio Budget
Statements:
Applying an equivalent carbon price to the import and manufacture of synthetic
greenhouse gases, and arrangements for destruction of waste synthetic
greenhouse gases and ozone depleting substances until 30 June 2014.
Implementing transitional arrangements for the export refund scheme and for
imports made between 1 April 2014 and 30 June 2014 where the synthetic
greenhouse gases were entered into a warehouse licensed under the Customs Act
1901.
Agency Additional Estimates Statements — Department of the Environment
52
Program 2.1 Key Performance Indicators
The following Key Performance Indicator updates those outlined in the 2013-14
Portfolio Budget Statements:
The implementation of the equivalent carbon price on imports and manufacture
of synthetic greenhouse gases and arrangements for destruction of waste
synthetic green house gases is planned to be repealed from 1 July 2014 as part of
the Government’s repeal of the carbon tax.

Agency Additional Estimates Statements — Department of the Environment
53
Program 2.2 Objective
There have been no changes to the Program 2.2 Objective since the 2013-14 Budget.
Program 2.2 Expenses: Sustainable Communities 2012-13 2013-14 2014-15 2015-16 2016-17
Actual Revised Forw ard Forw ard Forw ard
budget year 1 year 2 year 3
$'000 $'000 $'000 $'000 $'000
Annual administered expenses:
Sustainable Australia - Suburban Jobs 1 8,742 22,078 8,736 - -
Annual departmental expenses:
Departmental Programme Support 2 3,950 5,734 5,250 3,156 3,081
Expenses not requiring appropriation in
the Budget year:
Depreciation and amortisation 137 220 223 64 57
Other 3 8 10 10 5 5
Total programme expenses 12,837 28,042 14,219 3,225 3,143
1 For the Sustainable Australia - Sustainable Planning Initiative refer to Programme 5.2 Environmental
Regulation in Table 2.1.5.2 Includes other revenue in addition to Appropriation and Sale of Goods and Services.
3 Includes resources received free of charge and other gains.
Program 2.2 Deliverables
With the abolition of the National Sustainability Council the Government is giving
consideration to how the Council’s functions will be absorbed by the Department.
Program 2.2 Key Performance Indicators
There have been no changes to the Program 2.2 Key Performance Indicators since the
2013-14 Budget.

Agency Additional Estimates Statements — Department of the Environment
54
OUTCOME 3: ADVANCEMENT OF AUSTRALIA’S STRATEGIC, SCIENTIFIC, ENVIRONMENTAL AND ECONOMIC INTERESTS IN THE ANTARCTIC BY
PROTECTING, ADMINISTERING AND RESEARCHING THE REGION.
Outcome 3 Strategy
The following Strategy is in addition to that outlined in the 2013-14 Portfolio Budget
Statements.
The Department is supporting preparation of a 20 Year Australian Antarctic Strategic
Plan. This involves a comprehensive review of Australia’s Antarctic engagement,
including: Australia’s Antarctic strategic interests; capacity to undertake and support
priority science; presence in the Antarctic; and international engagement.
Table 2.1.3 Budgeted Expenses for Outcome 3 Note: The Departmental appropriation splits and totals are indicative estimates and may change
during the course of the budget year as government priorities change.
2012-13 2013-14
Actual Revised
expenses estimated
expenses
$'000 $'000
Programme 3.1: Antarctica: Science, Policy and Presence
Departmental expenses
Departmental appropriation 1 101,783 104,485
Revenues from independent sources (s31) 33,039 32,259
Expenses not requiring appropriation in the Budget year 2 50,217 49,290
Total for Programme 3.1 185,039 186,034
Outcome 3 Totals by appropriation type
Departmental expenses
Departmental appropriation 1 101,783 104,485
Revenues from independent sources (s31) 33,039 32,259
Expenses not requiring appropriation in the Budget year 2 50,217 49,290
Total expenses for Outcome 3 185,039 186,034
2012-13 2013-14
Average Staffing Level (number) 403 402
1 Outcome 3 also has a departmental capital budget of $15.660 million in 2013- 14.
2 Expenses not requiring appropriation consists of depreciation and amortisation expense,
approved operating loss, resources received free of charge and other gains.
Outcome 3: Advancement of Australia’s strategic, scientific,
environmental and economic interests in the Antarctic by
protecting, administering and researching the region.
Program 3.1 Objective
There have been no changes to the Program 3.1 Objective since the 2013-14 Budget.
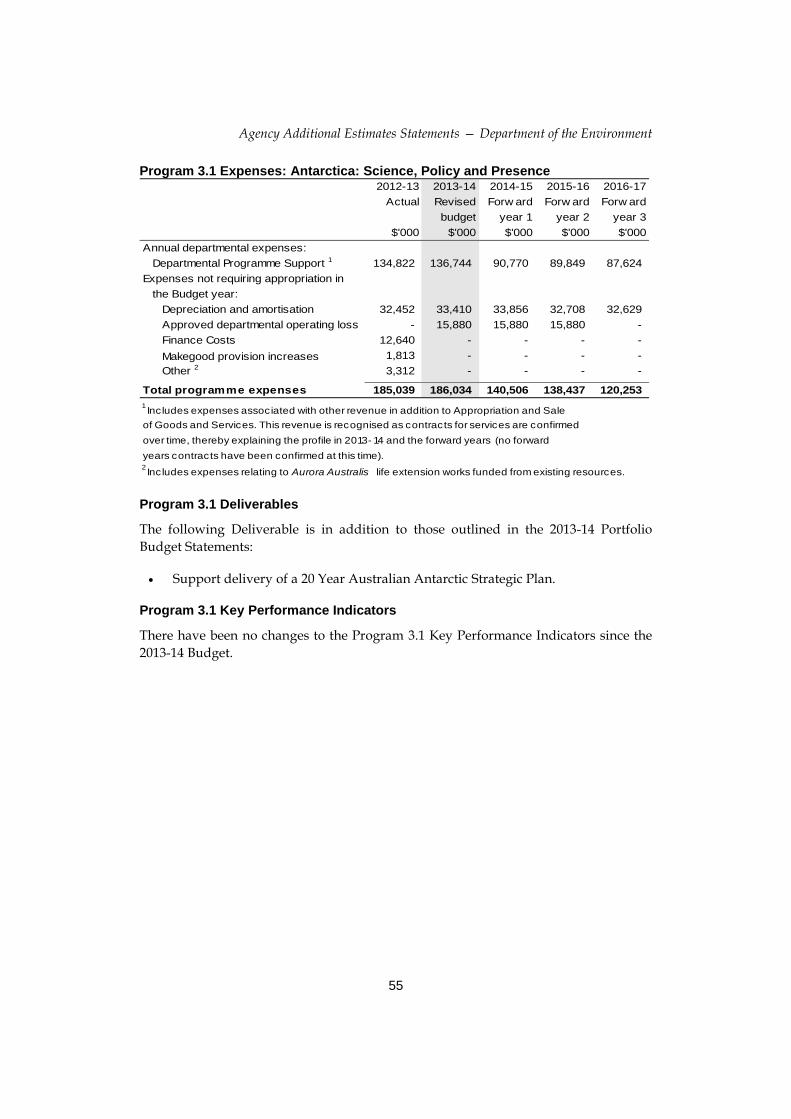
Agency Additional Estimates Statements — Department of the Environment
55
Program 3.1 Expenses: Antarctica: Science, Policy and Presence 2012-13 2013-14 2014-15 2015-16 2016-17
Actual Revised Forw ard Forw ard Forw ard
budget year 1 year 2 year 3
$'000 $'000 $'000 $'000 $'000
Annual departmental expenses:
Departmental Programme Support 1 134,822 136,744 90,770 89,849 87,624
Expenses not requiring appropriation in
the Budget year:
Depreciation and amortisation 32,452 33,410 33,856 32,708 32,629
Approved departmental operating loss - 15,880 15,880 15,880 -
Finance Costs 12,640 - - - -
Makegood provision increases 1,813 - - - -
Other 2 3,312 - - - -
Total programme expenses 185,039 186,034 140,506 138,437 120,253
1 Includes expenses associated with other revenue in addition to Appropriation and Sale
of Goods and Services. This revenue is recognised as contracts for services are confirmed
over time, thereby explaining the profile in 2013- 14 and the forward years (no forward
years contracts have been confirmed at this time).2 Includes expenses relating to Aurora Australis life extension works funded from existing resources.
Program 3.1 Deliverables
The following Deliverable is in addition to those outlined in the 2013-14 Portfolio
Budget Statements:
Support delivery of a 20 Year Australian Antarctic Strategic Plan.
Program 3.1 Key Performance Indicators
There have been no changes to the Program 3.1 Key Performance Indicators since the
2013-14 Budget.
Agency Additional Estimates Statements — Department of the Environment
56
OUTCOME 4: ADAPTATION TO CLIMATE CHANGE, WISE WATER USE, SECURE WATER SUPPLIES AND IMPROVED HEALTH OF RIVERS, WATERWAYS AND FRESHWATER ECOSYSTEMS BY SUPPORTING
RESEARCH, AND REFORMING THE MANAGEMENT AND USE OF WATER
RESOURCES.
Outcome 4 Strategy
The following Strategy is in addition to that outlined in the 2013-14 Portfolio Budget
Statements.
A measure announced in the 2013-14 Mid Year Economic Fiscal Outlook re-phases
$650.0 million of spending on water buybacks and infrastructure from four years to six
years. The Restoring the Balance in the Murray-Darling Basin programme and the
Sustainable Rural Water Use and Infrastructure programme have been amalgamated
to provide greater flexibility in managing the Government’s water reform priorities,
reflecting the Government’s commitment to restoring the Murray-Darling Basin to
health while ensuring the viability of the Basin’s food and fibre producing
communities.
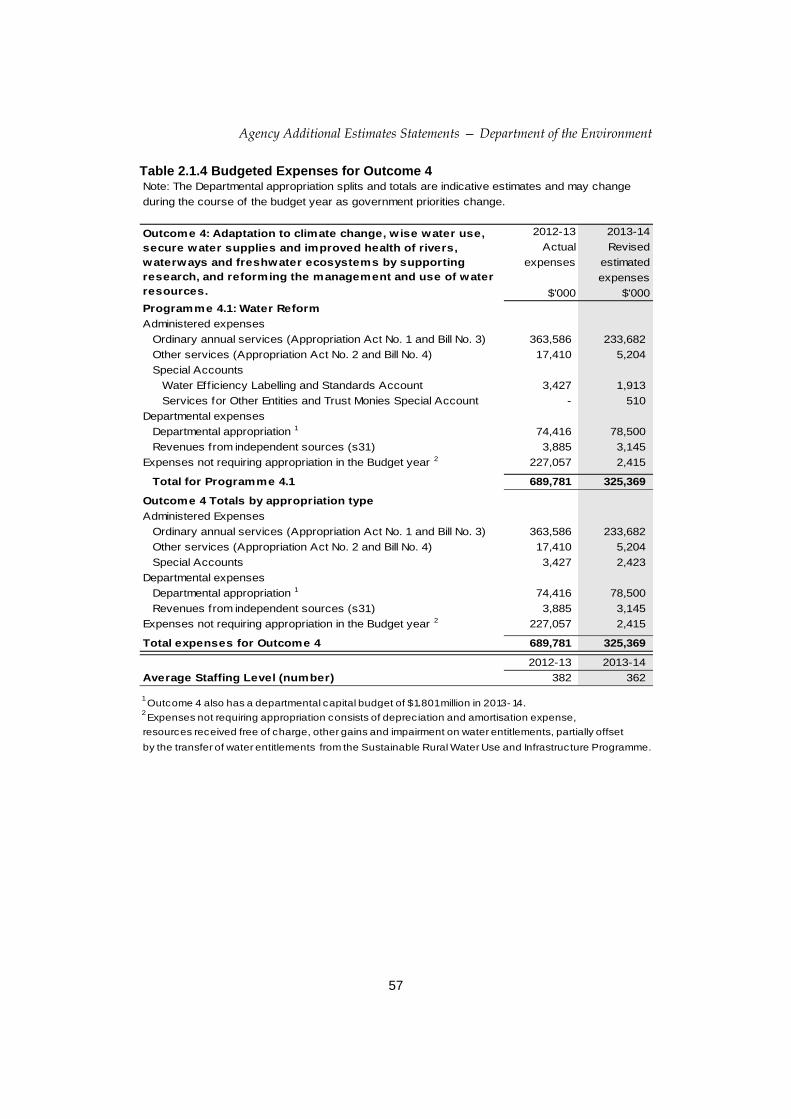
Agency Additional Estimates Statements — Department of the Environment
57
Table 2.1.4 Budgeted Expenses for Outcome 4 Note: The Departmental appropriation splits and totals are indicative estimates and may change
during the course of the budget year as government priorities change.
2012-13 2013-14
Actual Revised
expenses estimated
expenses
$'000 $'000
Programme 4.1: Water Reform
Administered expenses
Ordinary annual services (Appropriation Act No. 1 and Bill No. 3) 363,586 233,682
Other services (Appropriation Act No. 2 and Bill No. 4) 17,410 5,204
Special Accounts
Water Eff iciency Labelling and Standards Account 3,427 1,913
Services for Other Entities and Trust Monies Special Account - 510
Departmental expenses
Departmental appropriation 1 74,416 78,500
Revenues from independent sources (s31) 3,885 3,145
Expenses not requiring appropriation in the Budget year 2 227,057 2,415
Total for Programme 4.1 689,781 325,369
Outcome 4 Totals by appropriation type
Administered Expenses
Ordinary annual services (Appropriation Act No. 1 and Bill No. 3) 363,586 233,682
Other services (Appropriation Act No. 2 and Bill No. 4) 17,410 5,204
Special Accounts 3,427 2,423
Departmental expenses
Departmental appropriation 1 74,416 78,500
Revenues from independent sources (s31) 3,885 3,145
Expenses not requiring appropriation in the Budget year 2 227,057 2,415
Total expenses for Outcome 4 689,781 325,369
2012-13 2013-14
Average Staffing Level (number) 382 362
1 Outcome 4 also has a departmental capital budget of $1.801 million in 2013- 14.
2 Expenses not requiring appropriation consists of depreciation and amortisation expense,
resources received free of charge, other gains and impairment on water entitlements, partially offset
by the transfer of water entitlements from the Sustainable Rural Water Use and Infrastructure Programme.
Outcome 4: Adaptation to climate change, w ise water use,
secure water supplies and improved health of rivers,
waterways and freshwater ecosystems by supporting
research, and reforming the management and use of water
resources.
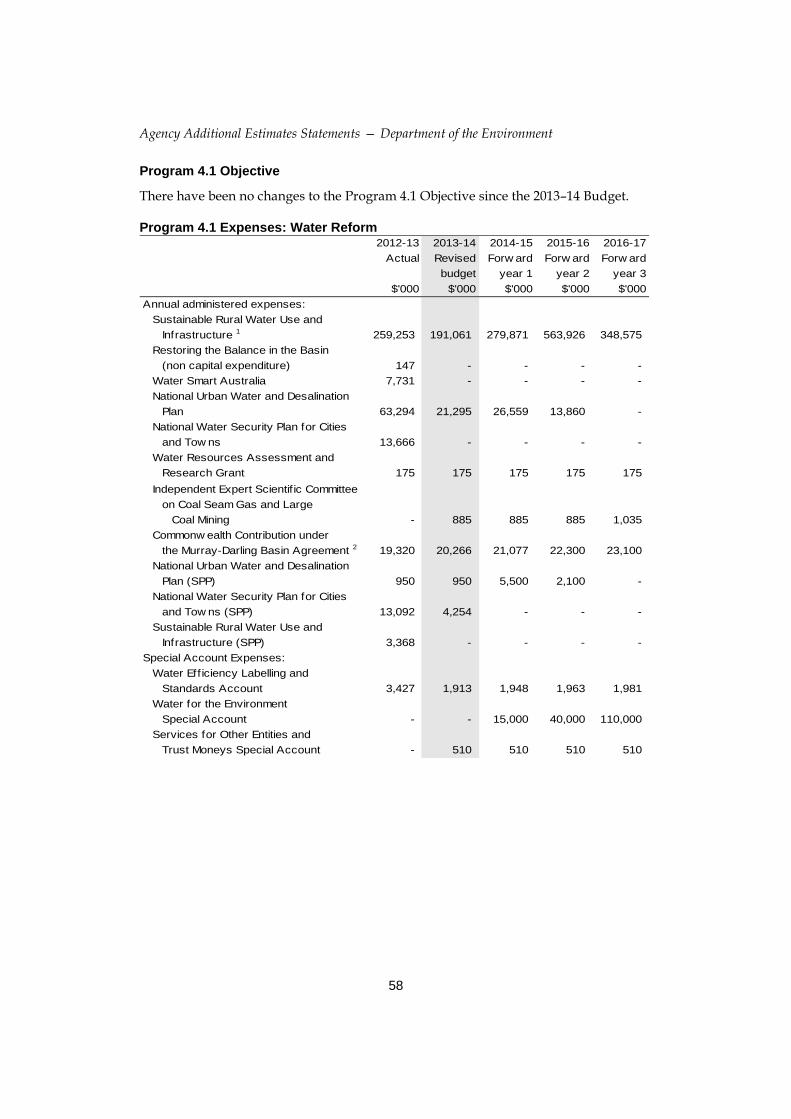
Agency Additional Estimates Statements — Department of the Environment
58
Program 4.1 Objective
There have been no changes to the Program 4.1 Objective since the 2013–14 Budget.
Program 4.1 Expenses: Water Reform 2012-13 2013-14 2014-15 2015-16 2016-17
Actual Revised Forw ard Forw ard Forw ard
budget year 1 year 2 year 3
$'000 $'000 $'000 $'000 $'000
Annual administered expenses:
Sustainable Rural Water Use and
Infrastructure 1 259,253 191,061 279,871 563,926 348,575
Restoring the Balance in the Basin
(non capital expenditure) 147 - - - -
Water Smart Australia 7,731 - - - -
National Urban Water and Desalination
Plan 63,294 21,295 26,559 13,860 -
National Water Security Plan for Cities
and Tow ns 13,666 - - - -
Water Resources Assessment and
Research Grant 175 175 175 175 175
Independent Expert Scientif ic Committee
on Coal Seam Gas and Large
Coal Mining - 885 885 885 1,035
Commonw ealth Contribution under
the Murray-Darling Basin Agreement 2 19,320 20,266 21,077 22,300 23,100
National Urban Water and Desalination
Plan (SPP) 950 950 5,500 2,100 -
National Water Security Plan for Cities
and Tow ns (SPP) 13,092 4,254 - - -
Sustainable Rural Water Use and
Infrastructure (SPP) 3,368 - - - -
Special Account Expenses:
Water Eff iciency Labelling and
Standards Account 3,427 1,913 1,948 1,963 1,981
Water for the Environment
Special Account - - 15,000 40,000 110,000
Services for Other Entities and
Trust Moneys Special Account - 510 510 510 510
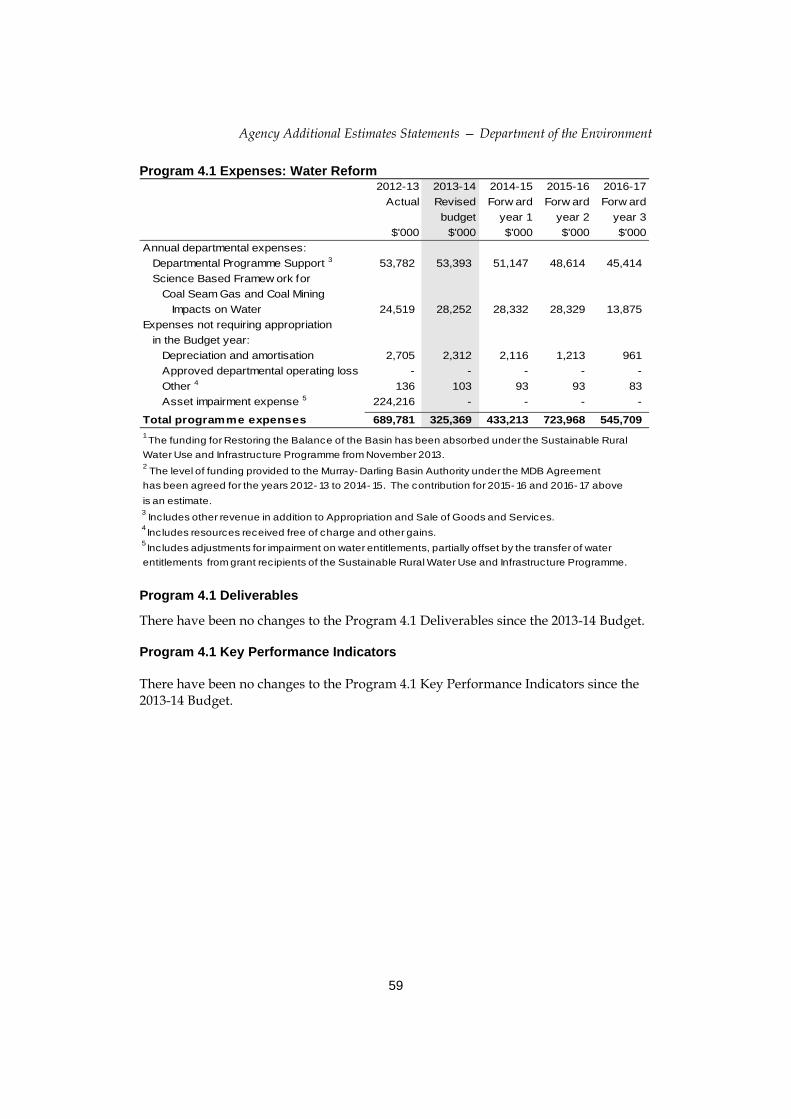
Agency Additional Estimates Statements — Department of the Environment
59
Program 4.1 Expenses: Water Reform 2012-13 2013-14 2014-15 2015-16 2016-17
Actual Revised Forw ard Forw ard Forw ard
budget year 1 year 2 year 3
$'000 $'000 $'000 $'000 $'000
Annual departmental expenses:
Departmental Programme Support 3 53,782 53,393 51,147 48,614 45,414
Science Based Framew ork for
Coal Seam Gas and Coal Mining
Impacts on Water 24,519 28,252 28,332 28,329 13,875
Expenses not requiring appropriation
in the Budget year:
Depreciation and amortisation 2,705 2,312 2,116 1,213 961
Approved departmental operating loss - - - - -
Other 4 136 103 93 93 83
Asset impairment expense 5 224,216 - - - -
Total programme expenses 689,781 325,369 433,213 723,968 545,709
1 The funding for Restoring the Balance of the Basin has been absorbed under the Sustainable Rural
Water Use and Infrastructure Programme from November 2013.2 The level of funding provided to the Murray- Darling Basin Authority under the MDB Agreement
has been agreed for the years 2012- 13 to 2014- 15. The contribution for 2015- 16 and 2016- 17 above
is an estimate.3 Includes other revenue in addition to Appropriation and Sale of Goods and Services.
4 Includes resources received free of charge and other gains.
5 Includes adjustments for impairment on water entitlements, partially offset by the transfer of water
entitlements from grant recipients of the Sustainable Rural Water Use and Infrastructure Programme. Program 4.1 Deliverables
There have been no changes to the Program 4.1 Deliverables since the 2013-14 Budget.
Program 4.1 Key Performance Indicators
There have been no changes to the Program 4.1 Key Performance Indicators since the 2013-14 Budget.
Agency Additional Estimates Statements — Department of the Environment
60
OUTCOME 5: INCREASED PROTECTION, AWARENESS AND
APPRECIATION OF AUSTRALIA’S ENVIRONMENT AND HERITAGE
THROUGH REGULATING MATTERS OF NATIONAL ENVIRONMENTAL
SIGNIFICANCE AND THE IDENTIFICATION, CONSERVATION AND
CELEBRATION OF NATURAL, INDIGENOUS AND HISTORIC PLACES OF
NATIONAL AND WORLD HERITAGE SIGNIFICANCE.
Outcome 5 Strategy
The following Strategy is in addition to that outlined in the 2013-14 Portfolio Budget
Statements.
A key aspect of the Department’s responsibilities is the administration of the Environment Protection and Biodiversity Conservation Act 1999 (EPBC Act). The Department is working with the Government to implement the following election commitments:
Regulatory reform to reduce regulation. This includes reducing duplication of
assessments and approvals by creating a one stop shop for environmental
approvals under the EPBC Act by using state and territory government systems;
Streamlining approval processes for offshore petroleum activities with the
National Offshore Petroleum Safety and Environmental Management Authority
serving as the sole Commonwealth assessor of offshore development.
Priorities include working with the states and territories to streamline assessment
processes between jurisdictions, progressively publishing more guidance to help
proponents understand and meet the requirements of the EPBC Act, and to maintain
the focus on the increased use of strategic approaches under the EPBC Act.

Agency Additional Estimates Statements — Department of the Environment
61
Table 2.1.5 Budgeted Expenses for Outcome 5 Note: The Departmental appropriation splits and totals are indicative estimates and may change
during the course of the budget year as government priorities change.
2012-13 2013-14
Actual Revised
expenses estimated
expenses
$'000 $'000
Programme 5.1: Conservation of Australia's Heritage and
Environment
Administered expenses
Ordinary annual services (Appropriation Act No. 1 and Bill No. 3) 11,668 9,342
Departmental expenses
Departmental appropriation 1 36,639 27,330
Revenues from independent sources (s31) 5,784 5,945
Expenses not requiring appropriation in the Budget year 2 1,929 1,372
Total for Programme 5.1 56,020 43,989
Programme 5.2: Environmental Regulation
Administered expenses
Ordinary annual services (Appropriation Act No. 1 and Bill No. 3) - 751
Other services (Appropriation Act No. 2 and Bill No. 4) 360 800
Departmental expenses
Departmental appropriation 1 51,574 60,522
Revenues from independent sources (s31) 3,247 4,354
Expenses not requiring appropriation in the Budget year 2 3,522 3,825
Total for Programme 5.2 58,703 70,252
Outcome 5 Totals by appropriation type
Administered Expenses
Ordinary annual services (Appropriation Act No. 1 and Bill No. 3) 11,668 10,093
Other services (Appropriation Act No. 2 and Bill No. 4) 360 800
Departmental expenses
Departmental appropriation 1 88,213 87,852
Revenues from independent sources (s31) 9,031 10,299
Expenses not requiring appropriation in the Budget year 2 5,451 5,197
Total expenses for Outcome 5 3 114,723 114,241
2012-13 2013-14
Average Staffing Level (number) 583 556
1 Outcome 5 has a departmental capital budget of $3.364 million in 2013- 14.
2 Expenses not requiring appropriation consists of depreciation and amortisation expense,
resources received free of charge and other gains. 3 Indigenous functions will be transferred from the Department of the Environment consistent with the AAO
change announced on 18 September 2013. This revised arrangement will be reflected in the next PB
Statement.
Outcome 5: Increased protection, awareness and
appreciation of Australia’s environment and heritage
through regulating matters of national environmental
significance and the identification, conservation and
celebration of natural, indigenous and historic places of
national and World Heritage significance.
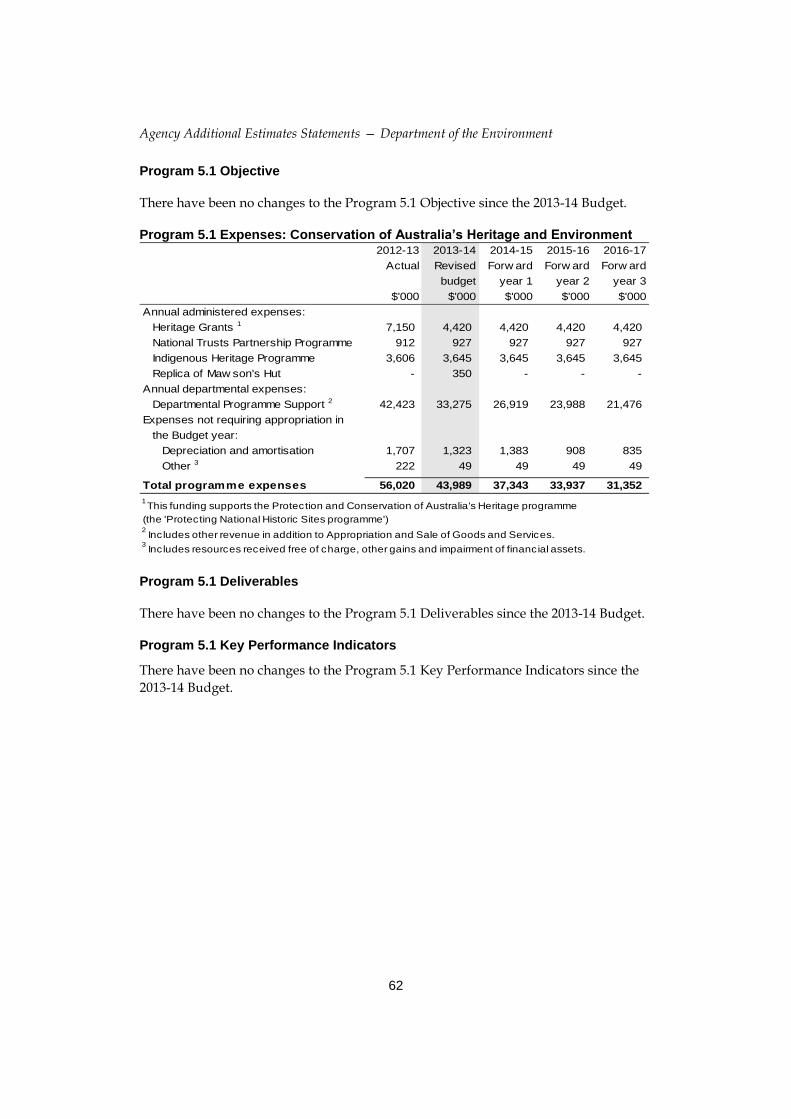
Agency Additional Estimates Statements — Department of the Environment
62
Program 5.1 Objective
There have been no changes to the Program 5.1 Objective since the 2013-14 Budget.
Program 5.1 Expenses: Conservation of Australia’s Heritage and Environment 2012-13 2013-14 2014-15 2015-16 2016-17
Actual Revised Forw ard Forw ard Forw ard
budget year 1 year 2 year 3
$'000 $'000 $'000 $'000 $'000
Annual administered expenses:
Heritage Grants 1 7,150 4,420 4,420 4,420 4,420
National Trusts Partnership Programme 912 927 927 927 927
Indigenous Heritage Programme 3,606 3,645 3,645 3,645 3,645
Replica of Maw son's Hut - 350 - - -
Annual departmental expenses:
Departmental Programme Support 2 42,423 33,275 26,919 23,988 21,476
Expenses not requiring appropriation in
the Budget year:
Depreciation and amortisation 1,707 1,323 1,383 908 835
Other 3 222 49 49 49 49
Total programme expenses 56,020 43,989 37,343 33,937 31,352
1 This funding supports the Protection and Conservation of Australia's Heritage programme
(the 'Protecting National Historic Sites programme')2 Includes other revenue in addition to Appropriation and Sale of Goods and Services.
3 Includes resources received free of charge, other gains and impairment of financial assets.
Program 5.1 Deliverables
There have been no changes to the Program 5.1 Deliverables since the 2013-14 Budget.
Program 5.1 Key Performance Indicators
There have been no changes to the Program 5.1 Key Performance Indicators since the
2013-14 Budget.
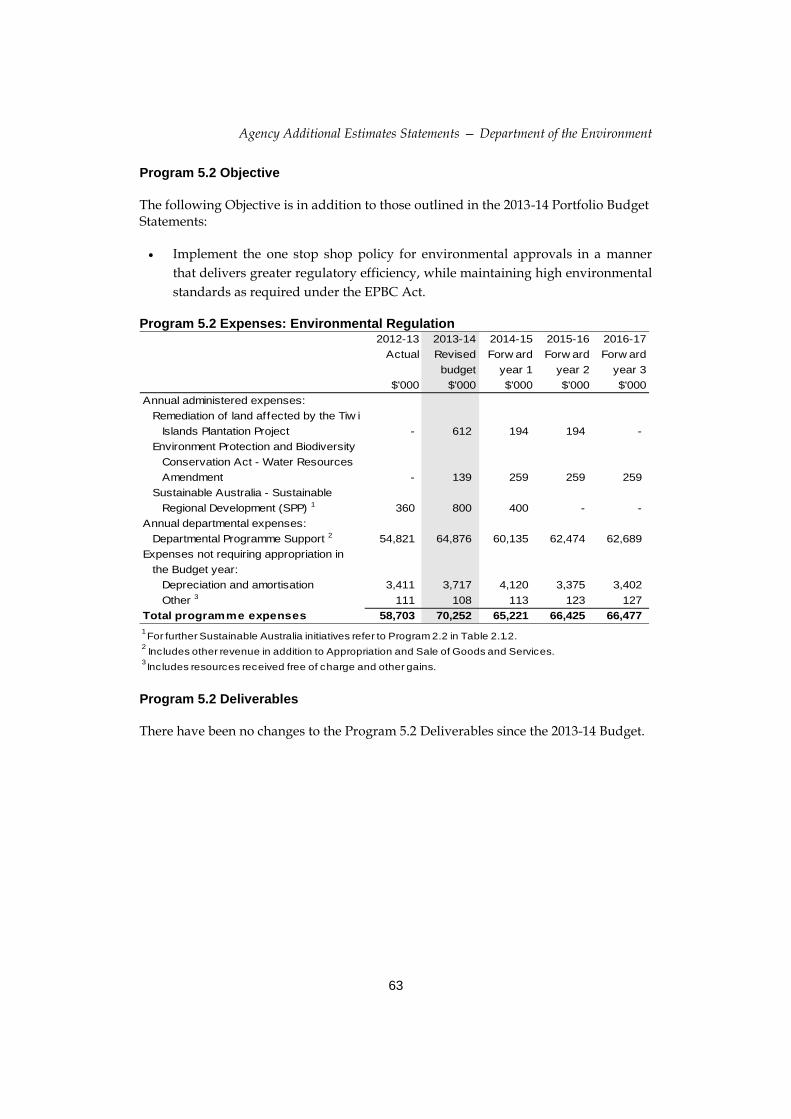
Agency Additional Estimates Statements — Department of the Environment
63
Program 5.2 Objective
The following Objective is in addition to those outlined in the 2013-14 Portfolio Budget Statements:
Implement the one stop shop policy for environmental approvals in a manner
that delivers greater regulatory efficiency, while maintaining high environmental
standards as required under the EPBC Act.
Program 5.2 Expenses: Environmental Regulation 2012-13 2013-14 2014-15 2015-16 2016-17
Actual Revised Forw ard Forw ard Forw ard
budget year 1 year 2 year 3
$'000 $'000 $'000 $'000 $'000
Annual administered expenses:
Remediation of land affected by the Tiw i
Islands Plantation Project - 612 194 194 -
Environment Protection and Biodiversity
Conservation Act - Water Resources
Amendment - 139 259 259 259
Sustainable Australia - Sustainable
Regional Development (SPP) 1 360 800 400 - -
Annual departmental expenses:
Departmental Programme Support 2 54,821 64,876 60,135 62,474 62,689
Expenses not requiring appropriation in
the Budget year:
Depreciation and amortisation 3,411 3,717 4,120 3,375 3,402
Other 3 111 108 113 123 127
Total programme expenses 58,703 70,252 65,221 66,425 66,477
1 For further Sustainable Australia initiatives refer to Program 2.2 in Table 2.1.2.
2 Includes other revenue in addition to Appropriation and Sale of Goods and Services.
3 Includes resources received free of charge and other gains.
Program 5.2 Deliverables
There have been no changes to the Program 5.2 Deliverables since the 2013-14 Budget.
Agency Additional Estimates Statements — Department of the Environment
64
Program 5.2 Key Performance Indicators
The following Key Performance Indicators are in addition to those outlined in the 2013-14 Portfolio Budget Statements:
All assessment bilateral agreements with state and territory governments
reviewed and updated.
Signed Memorandum of Understanding with each jurisdiction that commits to
streamlining environmental assessments and negotiate an approval bilateral
agreement and to prioritise strategic assessments and other complementary
streamlining measures.
Approval bilateral agreements, as comprehensive in scope as possible, negotiated
with all willing jurisdictions whilst maintaining environmental standards
established in the EPBC Act.
Development of an assurance framework for the one stop shop that provides
confidence about the implementation of the approval bilateral agreements.
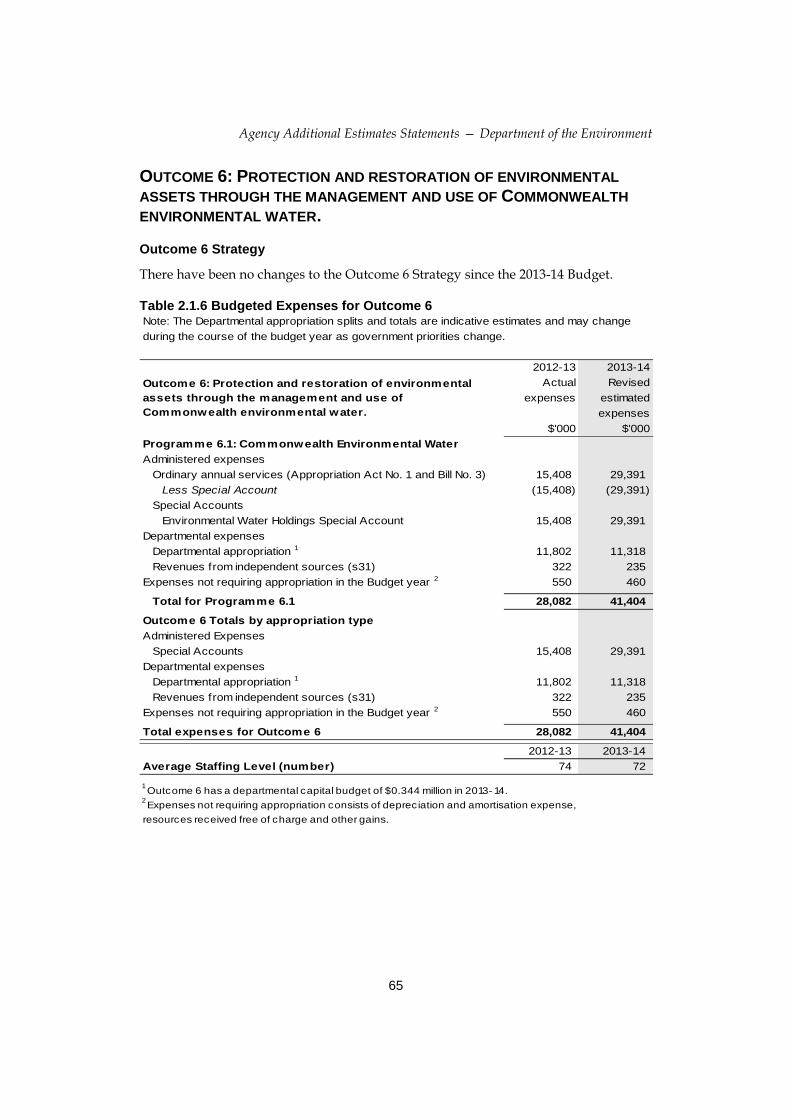
Agency Additional Estimates Statements — Department of the Environment
65
OUTCOME 6: PROTECTION AND RESTORATION OF ENVIRONMENTAL
ASSETS THROUGH THE MANAGEMENT AND USE OF COMMONWEALTH
ENVIRONMENTAL WATER.
Outcome 6 Strategy
There have been no changes to the Outcome 6 Strategy since the 2013-14 Budget.
Table 2.1.6 Budgeted Expenses for Outcome 6 Note: The Departmental appropriation splits and totals are indicative estimates and may change
during the course of the budget year as government priorities change.
2012-13 2013-14
Actual Revised
expenses estimated
expenses
$'000 $'000
Programme 6.1: Commonwealth Environmental Water
Administered expenses
Ordinary annual services (Appropriation Act No. 1 and Bill No. 3) 15,408 29,391
Less Special Account (15,408) (29,391)
Special Accounts
Environmental Water Holdings Special Account 15,408 29,391
Departmental expenses
Departmental appropriation 1 11,802 11,318
Revenues from independent sources (s31) 322 235
Expenses not requiring appropriation in the Budget year 2 550 460
Total for Programme 6.1 28,082 41,404
Outcome 6 Totals by appropriation type
Administered Expenses
Special Accounts 15,408 29,391
Departmental expenses
Departmental appropriation 1 11,802 11,318
Revenues from independent sources (s31) 322 235
Expenses not requiring appropriation in the Budget year 2 550 460
Total expenses for Outcome 6 28,082 41,404
2012-13 2013-14
Average Staffing Level (number) 74 72
1 Outcome 6 has a departmental capital budget of $0.344 million in 2013- 14.
2 Expenses not requiring appropriation consists of depreciation and amortisation expense,
resources received free of charge and other gains.
Outcome 6: Protection and restoration of environmental
assets through the management and use of
Commonwealth environmental water.

Agency Additional Estimates Statements — Department of the Environment
66
Program 6.1 Objective
There have been no changes to the Program 6.1 Objective since the 2013-14 Budget.
Program 6.1 Expenses: Commonwealth Environmental Water 2012-13 2013-14 2014-15 2015-16 2016-17
Actual Revised Forw ard Forw ard Forw ard
budget year 1 year 2 year 3
$'000 $'000 $'000 $'000 $'000
Annual administered expenses:
Commonw ealth Environmental Water
Office 15,408 29,391 26,226 28,021 29,160
Less Special Accounts:
Environmental Water Holdings
Special Account (15,408) (29,391) (26,226) (28,021) (29,160)
Special Account Expenses:
Environmental Water Holdings
Special Account 15,408 29,391 26,226 28,021 29,160
Annual departmental expenses:
Departmental Programme Support 1 12,124 11,553 5,759 5,031 4,075
Expenses not requiring appropriation
in the Budget year:
Depreciation and amortisation 525 440 223 128 113
Other 2 25 20 10 10 10
Total programme expenses 28,082 41,404 32,218 33,190 33,358
1 Includes other revenue in addition to Appropriation and Sale of Goods and Services.
2 Includes resources received free of charge and other gains.
Program 6.1 Deliverables
There have been no changes to the Program 6.1 Deliverables since the 2013-14 Budget.
Program 6.1 Key Performance Indicators
There have been no changes to the Program 6.1 Key Performance Indicators since the 2013-14 Budget.
Agency Additional Estimates Statements — Department of the Environment
67
OUTCOME 7: REDUCTION OF AUSTRALIA’S GREENHOUSE GAS
EMISSIONS, ADAPTATION TO THE IMPACTS OF CLIMATE CHANGE, AND
CONTRIBUTION TOWARDS THE NEGOTIATION OF AN EFFECTIVE GLOBAL
SOLUTION TO CLIMATE CHANGE, THROUGH THE DEVELOPMENT AND
IMPLEMENTATION OF A NATIONAL RESPONSE TO CLIMATE CHANGE.
Outcome 7 Strategy
The Department contributes to the Government’s Clean Air policy through its work implementing policies and programmes that will reduce Australia’s greenhouse gas emissions and facilitate adaptation to climate impacts. It further contributes to the reduction of cost of living pressures on households through supporting the repeal of the carbon tax. This strategy is delivered through the following areas of activity:
Achieving Australia’s greenhouse gas emissions reduction targets through
mechanisms that drive cost effective emissions reductions, including through
implementation of the Government’s Direct Action plan and support for
renewable energy technologies.
Supporting Australia’s capacity to adapt to a changing climate through well-
coordinated climate science, and practical guidance to assist decision makers.
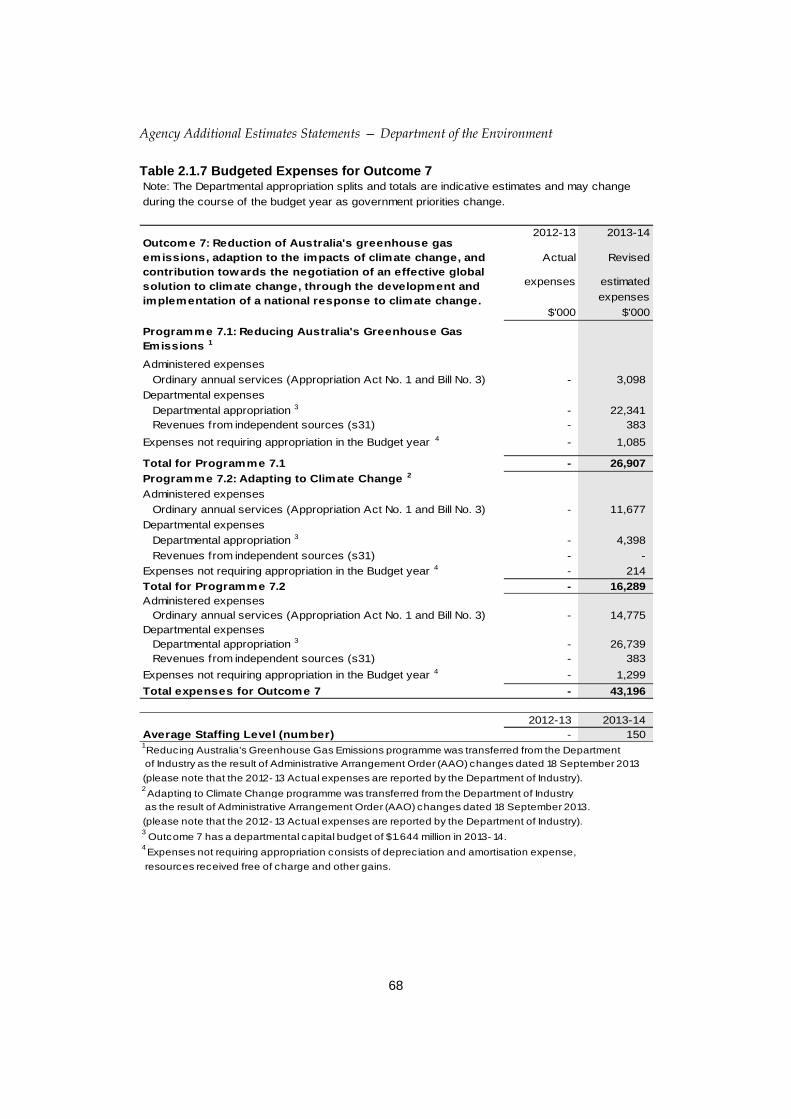
Agency Additional Estimates Statements — Department of the Environment
68
Table 2.1.7 Budgeted Expenses for Outcome 7 Note: The Departmental appropriation splits and totals are indicative estimates and may change
during the course of the budget year as government priorities change.
2012-13 2013-14
Actual Revised
expenses estimated
expenses
$'000 $'000
Programme 7.1: Reducing Australia's Greenhouse Gas
Emissions 1
Administered expenses
Ordinary annual services (Appropriation Act No. 1 and Bill No. 3) - 3,098
Departmental expenses
Departmental appropriation 3 - 22,341
Revenues from independent sources (s31) - 383
Expenses not requiring appropriation in the Budget year 4 - 1,085
Total for Programme 7.1 - 26,907
Programme 7.2: Adapting to Climate Change 2
Administered expenses
Ordinary annual services (Appropriation Act No. 1 and Bill No. 3) - 11,677
Departmental expenses
Departmental appropriation 3 - 4,398
Revenues from independent sources (s31) - -
Expenses not requiring appropriation in the Budget year 4 - 214
Total for Programme 7.2 - 16,289
Administered expenses
Ordinary annual services (Appropriation Act No. 1 and Bill No. 3) - 14,775
Departmental expenses
Departmental appropriation 3 - 26,739
Revenues from independent sources (s31) - 383
Expenses not requiring appropriation in the Budget year 4 - 1,299
Total expenses for Outcome 7 - 43,196
2012-13 2013-14
Average Staffing Level (number) - 150 1 Reducing Australia's Greenhouse Gas Emissions programme was transferred from the Department
of Industry as the result of Administrative Arrangement Order (AAO) changes dated 18 September 2013
(please note that the 2012- 13 Actual expenses are reported by the Department of Industry).2 Adapting to Climate Change programme was transferred from the Department of Industry
as the result of Administrative Arrangement Order (AAO) changes dated 18 September 2013.
(please note that the 2012- 13 Actual expenses are reported by the Department of Industry).3 Outcome 7 has a departmental capital budget of $1.644 million in 2013- 14.
4 Expenses not requiring appropriation consists of depreciation and amortisation expense,
resources received free of charge and other gains.
Outcome 7: Reduction of Australia's greenhouse gas
emissions, adaption to the impacts of climate change, and
contribution towards the negotiation of an effective global
solution to climate change, through the development and
implementation of a national response to climate change.

Agency Additional Estimates Statements — Department of the Environment
69
Program 7.1 Objective: Reducing Australia’s Greenhouse Gas Emissions
The Objective of Program 7.1 is to deliver Australia’s greenhouse gas emissions reduction targets through mechanisms that drive cost effective emissions reductions, including through the Direct Action Plan that includes the Emissions Reduction Fund (ERF) as a core element and development and deployment of renewable energy technologies.
Program 7.1 components contribute to achieving the objectives by:
providing incentives to encourage the transition towards low emissions and
energy efficient technologies, processes and products through the
implementation of the ERF;
encouraging investment in renewable electricity generation through the
Renewable Energy Target;
providing incentives to reduce emissions in the land sector through the
implementation of the Carbon Farming Initiative (CFI) and associated
programmes through the Direct Action Plan; and
providing opportunities for businesses to measure and assess their carbon
footprint through the Carbon Neutral Programme.
Program 7.1 Expenses: Reducing Australia’s Greenhouse Gas Emissions 2012-13 2013-14 2014-15 2015-16 2016-17
Actual Revised Forw ard Forw ard Forw ard
budget year 1 year 2 year 3
$'000 $'000 $'000 $'000 $'000
Annual administered expenses:
Extending the benefits of the Carbon
Farming initiative - 3,025 909 475 428
Carbon Farming Skills - 73 250 - -
Annual departmental expenses:
Departmental Programme Support 1 - 22,724 27,674 25,862 24,678
Expenses not requiring appropriation
in the Budget year:
Depreciation and amortisation - 1,085 2,157 1,806 680
Total programme expenses - 26,907 30,990 28,143 25,786
1 Includes other revenue in addition to Appropriation and Sale of Goods and Services.
Agency Additional Estimates Statements — Department of the Environment
70
Program 7.1 Deliverables
Develop and consult with the community through both the Green and White
papers on the detailed design of the ERF.
Finalisation of legislative amendments to implement the ERF, CFI and repeal the
carbon tax legislation.
Development of methodologies under the ERF, including legislative components.
Contribution to the Government’s 2014 review of the Renewable Energy Target.
Development of methodologies to include the CFI under the Direct Action Plan.
Provision of advice to the Department of Foreign Affairs and Trade in support of
international negotiations in relation to the land sector and international
accounting rules.
Program 7.1 Key Performance Indicators
Timely legislative amendments to amend the CFI and repeal the carbon tax
legislation.
Timely development and delivery of new methodologies under the CFI and ERF.
Effective contribution to the 2014 review of the Renewable Energy Target.
The Methodology Development Program will expand opportunities under the
CFI by supporting the development of estimation methodologies for new
abatement activities.
The Indigenous Carbon Farming Fund is supporting Indigenous participation in
the CFI through the development of methodologies and tools that will enable
crediting of abatement activities likely to have high Indigenous participation.
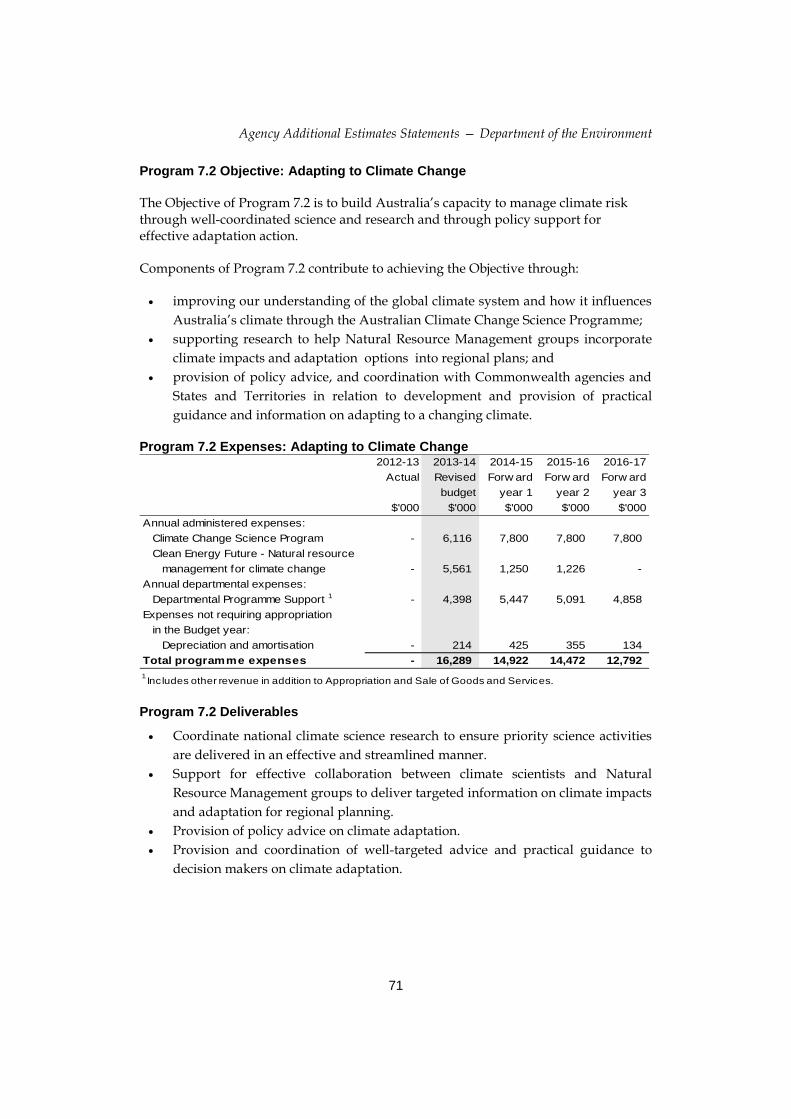
Agency Additional Estimates Statements — Department of the Environment
71
Program 7.2 Objective: Adapting to Climate Change
The Objective of Program 7.2 is to build Australia’s capacity to manage climate risk through well-coordinated science and research and through policy support for effective adaptation action.
Components of Program 7.2 contribute to achieving the Objective through:
improving our understanding of the global climate system and how it influences
Australia’s climate through the Australian Climate Change Science Programme;
supporting research to help Natural Resource Management groups incorporate
climate impacts and adaptation options into regional plans; and
provision of policy advice, and coordination with Commonwealth agencies and
States and Territories in relation to development and provision of practical
guidance and information on adapting to a changing climate.
Program 7.2 Expenses: Adapting to Climate Change 2012-13 2013-14 2014-15 2015-16 2016-17
Actual Revised Forw ard Forw ard Forw ard
budget year 1 year 2 year 3
$'000 $'000 $'000 $'000 $'000
Annual administered expenses:
Climate Change Science Program - 6,116 7,800 7,800 7,800
Clean Energy Future - Natural resource
management for climate change - 5,561 1,250 1,226 -
Annual departmental expenses:
Departmental Programme Support 1 - 4,398 5,447 5,091 4,858
Expenses not requiring appropriation
in the Budget year:
Depreciation and amortisation - 214 425 355 134
Total programme expenses - 16,289 14,922 14,472 12,792
1 Includes other revenue in addition to Appropriation and Sale of Goods and Services.
Program 7.2 Deliverables
Coordinate national climate science research to ensure priority science activities
are delivered in an effective and streamlined manner.
Support for effective collaboration between climate scientists and Natural
Resource Management groups to deliver targeted information on climate impacts
and adaptation for regional planning.
Provision of policy advice on climate adaptation.
Provision and coordination of well-targeted advice and practical guidance to
decision makers on climate adaptation.
Agency Additional Estimates Statements — Department of the Environment
72
Program 7.2 Key Performance Indicators
Timely, high quality, robust, evidence-based advice that meets ministerial
expectations and informs Government decisions.
Well-targeted information on climate projections that meet the needs of
government, business and communities.
Effective administration of the Natural Resource Management Planning for
Climate Change Fund (Stream 2) with timely delivery of information on climate
change impacts and adaptation.
Agency Additional Estimates Statements — Department of the Environment
73
Section 3: Explanatory Tables and Budgeted Financial Statements
3.1 EXPLANATORY TABLES
Estimates of Special Account Flows
Special Accounts provide a means to set aside and record amounts used for specified
purposes. Table 3.1.1 shows the expected additions (receipts) and reductions
(payments) for each account used by the Department. The corresponding table in the
2013-14 PB Statements is Table 3.1.2.
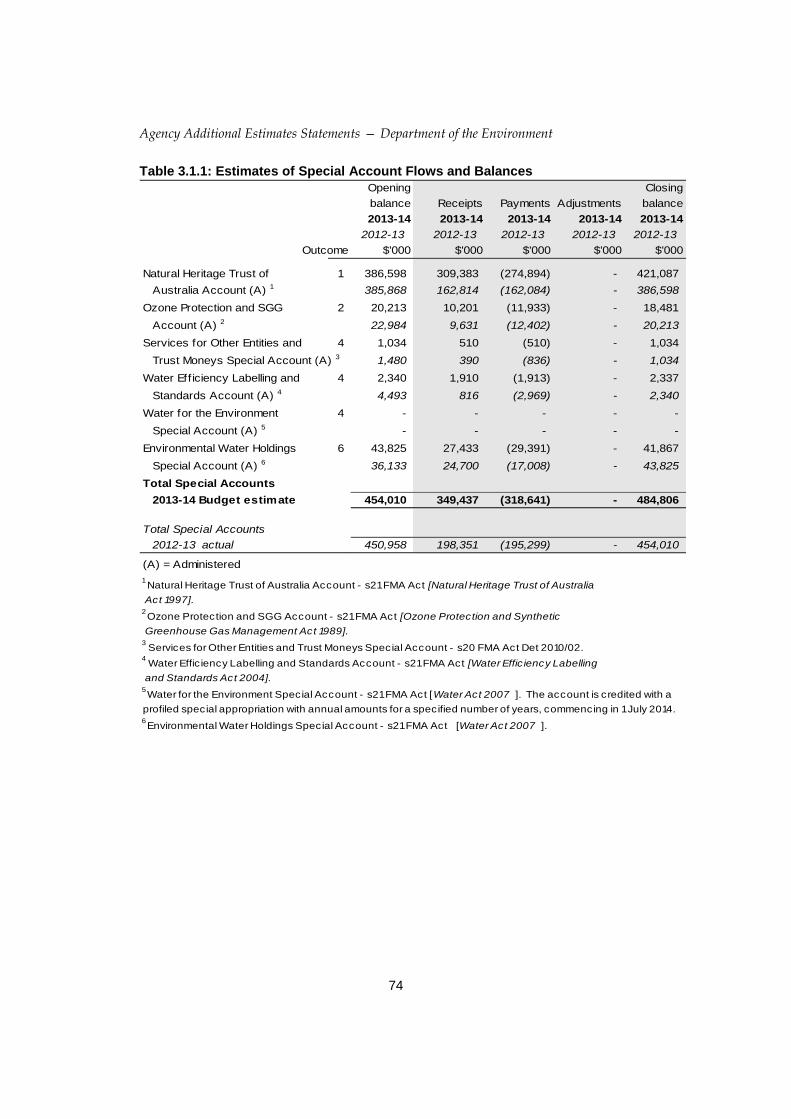
Agency Additional Estimates Statements — Department of the Environment
74
Table 3.1.1: Estimates of Special Account Flows and Balances
Opening Closing
balance Receipts Payments Adjustments balance
2013-14 2013-14 2013-14 2013-14 2013-14
2012-13 2012-13 2012-13 2012-13 2012-13
Outcome $'000 $'000 $'000 $'000 $'000
Natural Heritage Trust of 1 386,598 309,383 (274,894) - 421,087
Australia Account (A) 1 385,868 162,814 (162,084) - 386,598
Ozone Protection and SGG 2 20,213 10,201 (11,933) - 18,481
Account (A) 2 22,984 9,631 (12,402) - 20,213
Services for Other Entities and 4 1,034 510 (510) - 1,034
Trust Moneys Special Account (A) 3 1,480 390 (836) - 1,034
Water Eff iciency Labelling and 4 2,340 1,910 (1,913) - 2,337
Standards Account (A) 4 4,493 816 (2,969) - 2,340
Water for the Environment 4 - - - - -
Special Account (A) 5 - - - - -
Environmental Water Holdings 6 43,825 27,433 (29,391) - 41,867
Special Account (A) 6 36,133 24,700 (17,008) - 43,825
Total Special Accounts
2013-14 Budget estimate 454,010 349,437 (318,641) - 484,806
Total Special Accounts
2012-13 actual 450,958 198,351 (195,299) - 454,010
(A) = Administered
1 Natural Heritage Trust of Australia Account - s21 FMA Act [Natural Heritage Trust of Australia
Act 1997].2 Ozone Protection and SGG Account - s21 FMA Act [Ozone Protection and Synthetic
Greenhouse Gas Management Act 1989].3 Services for Other Entities and Trust Moneys Special Account - s20 FMA Act Det 2010/02.
4 Water Effic iency Labelling and Standards Account - s21 FMA Act [Water Effic iency Labelling
and Standards Act 2004].5 Water for the Environment Special Account - s21 FMA Act [Water Act 2007 ]. The account is credited with a
profiled special appropriation with annual amounts for a specified number of years, commencing in 1 July 2014.6 Environmental Water Holdings Special Account - s21 FMA Act [Water Act 2007 ].
Agency Additional Estimates Statements — Department of the Environment
75
3.2 BUDGETED FINANCIAL STATEMENTS
3.2.1 Analysis of Budgeted Financial Statements
Changes to departmental and administered budgeted financial statements since the
2013-14 Portfolio Budget Statements include the actual financial results for 2012-13, the
Administrative Arrangement Order (AAO) dated 18 September 2013, new measures,
revised estimates of revenue and indexation updates.
3.2.2 Budgeted Financial Statements
Departmental Financial Statements
Comprehensive Income Statement
The changes in Departmental expense, income and revenue estimates are primarily
attributable to the:
the transfer of funding to the Department as a result of the AAO dated 18
September 2013, and outlined in table 1.4;
new measures announced since budget, which encompass both expense and
savings measures as outlined in tables 1.2 and 1.3; and
income from independent sources, (including associated expenses) being revised.
Balance Sheet
The budgeted departmental balance sheet has been updated for the impact of:
the 2012-13 actuals which changed the opening balances for 2013-14; and
the transfer of asset and liability balances as a result of the AAO dated 18
September 2013.
Agency Additional Estimates Statements — Department of the Environment
76
Administered
Schedule of budgeted income and expenses
Changes to income administered on behalf of the Government include:
a reduction to Synthetic Greenhouse Gases Equivalent Carbon Price programme,
which is accounted for as Taxation revenue; and
gains from water entitlement assets received free of charge in accordance with
the terms and conditions of the National Partnership on Water for the Future.
The reduction in taxation revenue is attributable to both a measure in table 1.3 and an
estimates variation to align with revised revenue forecasts.
The revised schedule for Administered expenses reflects:
the transfer of funding to the Department as a result of the AAO dated 18
September 2013, and outlined in table 1.4; and
the new measures which encompass both expense and savings measures as
outlined in tables 1.2 and 1.3.
Schedule of budgeted assets and liabilities
The overall change to the budgeted administered balance sheet primarily reflects the
update of the 2012-13 actuals which resulted in changed opening balances for 2013-14.
The taxation receivable has also been adjusted for the reduction to revenue raised from
the Synthetic Greenhouse Gases Equivalent Carbon Price programme.
.
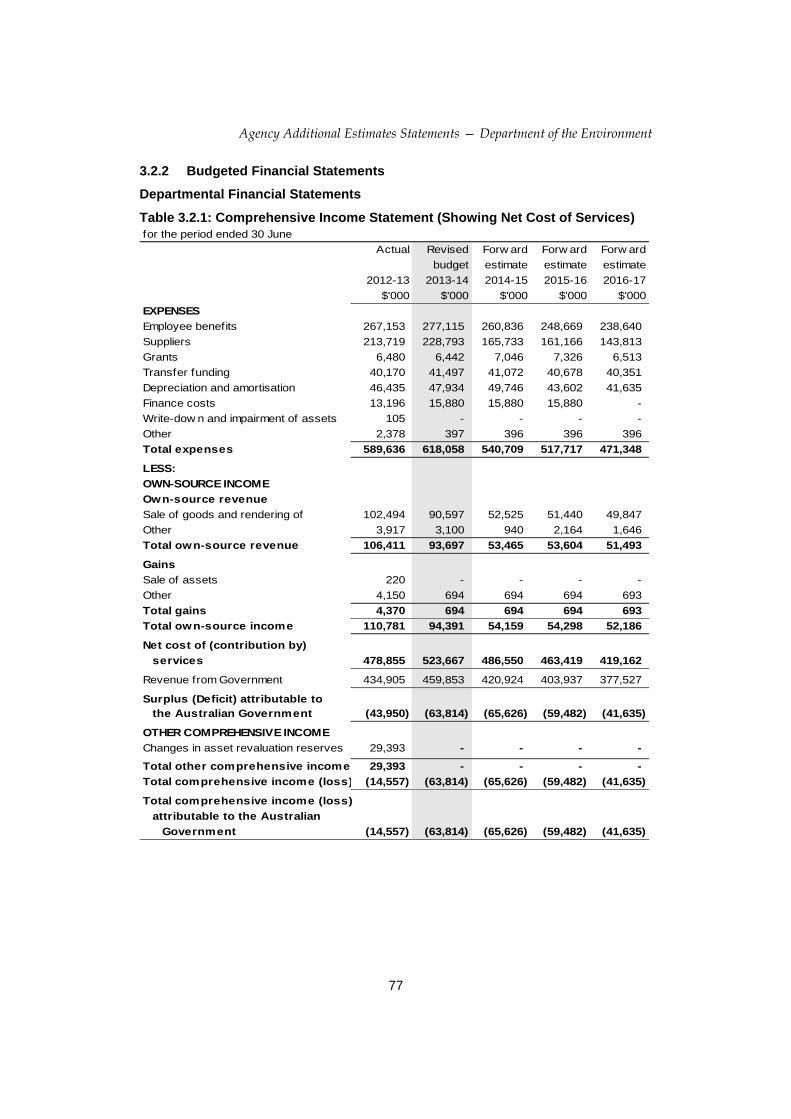
Agency Additional Estimates Statements — Department of the Environment
77
3.2.2 Budgeted Financial Statements
Departmental Financial Statements
Table 3.2.1: Comprehensive Income Statement (Showing Net Cost of Services)
for the period ended 30 June
Actual Revised Forw ard Forw ard Forw ard
budget estimate estimate estimate
2012-13 2013-14 2014-15 2015-16 2016-17
$'000 $'000 $'000 $'000 $'000
EXPENSES
Employee benefits 267,153 277,115 260,836 248,669 238,640
Suppliers 213,719 228,793 165,733 161,166 143,813
Grants 6,480 6,442 7,046 7,326 6,513
Transfer funding 40,170 41,497 41,072 40,678 40,351
Depreciation and amortisation 46,435 47,934 49,746 43,602 41,635
Finance costs 13,196 15,880 15,880 15,880 -
Write-dow n and impairment of assets 105 - - - -
Other 2,378 397 396 396 396
Total expenses 589,636 618,058 540,709 517,717 471,348
LESS:
OWN-SOURCE INCOME
Own-source revenue
Sale of goods and rendering of
services
102,494 90,597 52,525 51,440 49,847
Other 3,917 3,100 940 2,164 1,646
Total own-source revenue 106,411 93,697 53,465 53,604 51,493
Gains
Sale of assets 220 - - - -
Other 4,150 694 694 694 693
Total gains 4,370 694 694 694 693
Total own-source income 110,781 94,391 54,159 54,298 52,186
Net cost of (contribution by)
services 478,855 523,667 486,550 463,419 419,162
Revenue from Government 434,905 459,853 420,924 403,937 377,527
Surplus (Deficit) attributable to
the Australian Government (43,950) (63,814) (65,626) (59,482) (41,635)
OTHER COMPREHENSIVE INCOME
Changes in asset revaluation reserves 29,393 - - - -
Total other comprehensive income 29,393 - - - -
Total comprehensive income (loss) (14,557) (63,814) (65,626) (59,482) (41,635)
Total comprehensive income (loss)
attributable to the Australian
Government (14,557) (63,814) (65,626) (59,482) (41,635)

Agency Additional Estimates Statements — Department of the Environment
78
Table 3.2.1: Comprehensive Income Statement (Showing Net Cost of Services)
Note: Impact of Net Cash Appropriation Arrangements
2012-13 2013-14 2014-15 2015-16 2016-17
$'000 $'000 $'000 $'000 $'000
Total Comprehensive Income
(loss) less depreciation/amortisation
expenses previously funded through
revenue appropriations 31,878 (15,880) (15,880) (15,880) -
plus depreciation/amortisation expenses
previously funded through revenue
appropriations 1 46,435 47,934 49,746 43,602 41,635
Total Comprehensive Income
(loss) - as per the Statement of
Comprehensive Income (14,557) (63,814) (65,626) (59,482) (41,635)
Prepared on Australian Accounting Standards basis.
1 From 2010- 11, the Government introduced net cash appropriation arrangements where
Appropriation Act No.1 or Bill No. 3 revenue appropriations for the depreciation/amortisation
expenses of FMA Act agencies were replaced with a separate capital budget (the Departmental
Capital Budget, or DCB) provided through Appropriation Act No. 1 or Bill No. 3 equity
appropriations. For information regarding DCBs, please refer to Table 3.2.5 Departmental Capital
Budget Statement.
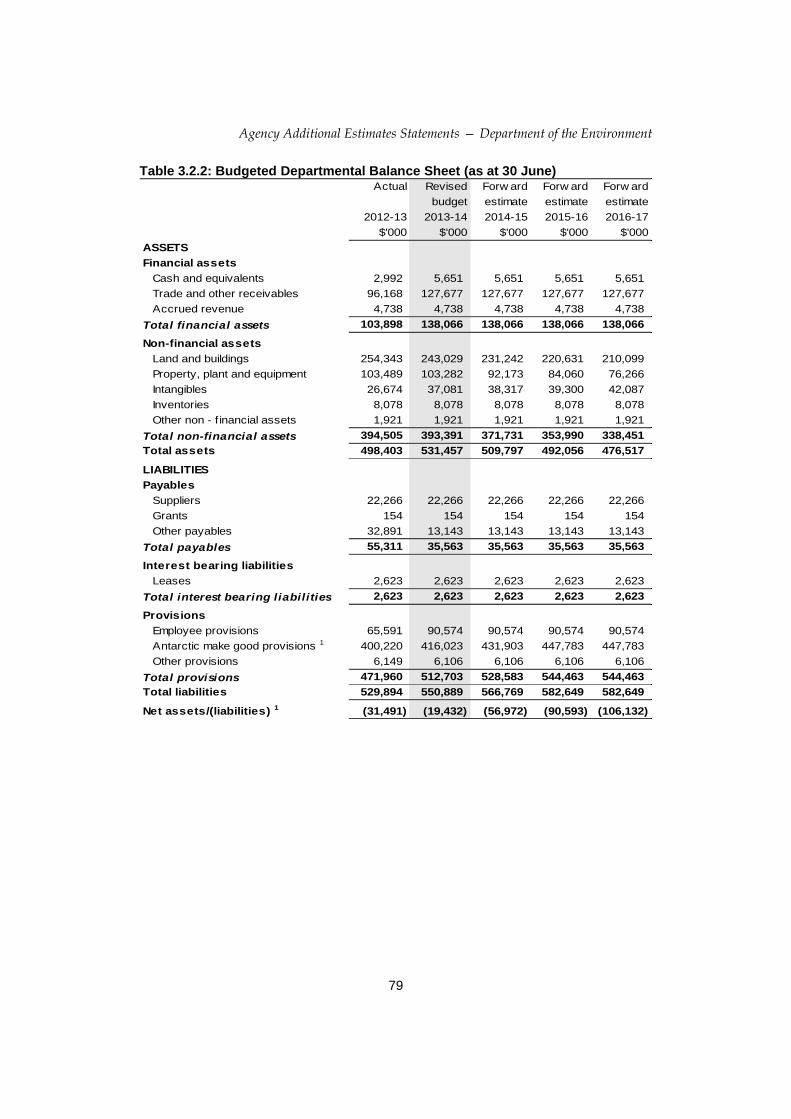
Agency Additional Estimates Statements — Department of the Environment
79
Table 3.2.2: Budgeted Departmental Balance Sheet (as at 30 June) Actual Revised Forw ard Forw ard Forw ard
budget estimate estimate estimate
2012-13 2013-14 2014-15 2015-16 2016-17
$'000 $'000 $'000 $'000 $'000
ASSETS
Financial assets
Cash and equivalents 2,992 5,651 5,651 5,651 5,651
Trade and other receivables 96,168 127,677 127,677 127,677 127,677
Accrued revenue 4,738 4,738 4,738 4,738 4,738
Total financial assets 103,898 138,066 138,066 138,066 138,066
Non-financial assets
Land and buildings 254,343 243,029 231,242 220,631 210,099
Property, plant and equipment 103,489 103,282 92,173 84,060 76,266
Intangibles 26,674 37,081 38,317 39,300 42,087
Inventories 8,078 8,078 8,078 8,078 8,078
Other non - f inancial assets 1,921 1,921 1,921 1,921 1,921
Total non-financial assets 394,505 393,391 371,731 353,990 338,451
Total assets 498,403 531,457 509,797 492,056 476,517
LIABILITIES
Payables
Suppliers 22,266 22,266 22,266 22,266 22,266
Grants 154 154 154 154 154
Other payables 32,891 13,143 13,143 13,143 13,143
Total payables 55,311 35,563 35,563 35,563 35,563
Interest bearing liabilities
Leases 2,623 2,623 2,623 2,623 2,623
Total interest bearing liabilities 2,623 2,623 2,623 2,623 2,623
Provisions
Employee provisions 65,591 90,574 90,574 90,574 90,574
Antarctic make good provisions 1 400,220 416,023 431,903 447,783 447,783
Other provisions 6,149 6,106 6,106 6,106 6,106
Total provisions 471,960 512,703 528,583 544,463 544,463
Total liabilities 529,894 550,889 566,769 582,649 582,649
Net assets/(liabilities) 1 (31,491) (19,432) (56,972) (90,593) (106,132)
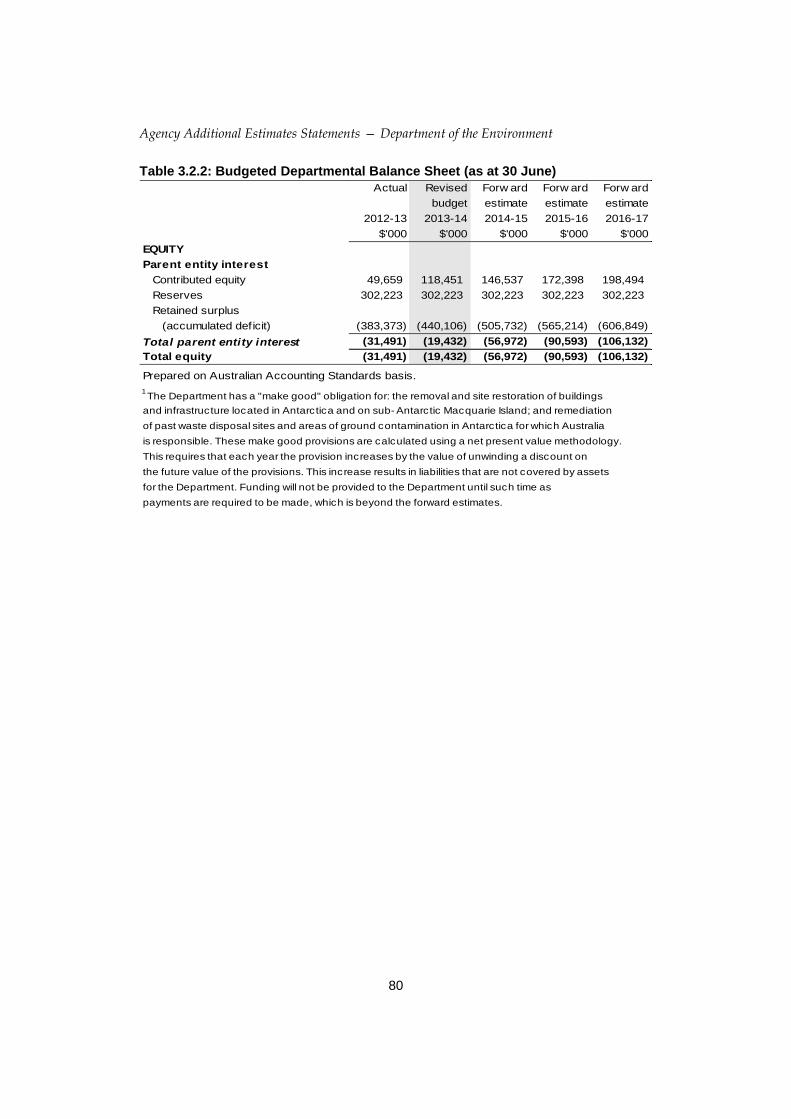
Agency Additional Estimates Statements — Department of the Environment
80
Table 3.2.2: Budgeted Departmental Balance Sheet (as at 30 June)
Actual Revised Forw ard Forw ard Forw ard
budget estimate estimate estimate
2012-13 2013-14 2014-15 2015-16 2016-17
$'000 $'000 $'000 $'000 $'000
EQUITY
Parent entity interest
Contributed equity 49,659 118,451 146,537 172,398 198,494
Reserves 302,223 302,223 302,223 302,223 302,223
Retained surplus
(accumulated deficit) (383,373) (440,106) (505,732) (565,214) (606,849)
Total parent entity interest (31,491) (19,432) (56,972) (90,593) (106,132)
Total equity (31,491) (19,432) (56,972) (90,593) (106,132)
Prepared on Australian Accounting Standards basis.
1 The Department has a "make good" obligation for: the removal and site restoration of buildings
and infrastructure located in Antarctica and on sub- Antarctic Macquarie Island; and remediation
of past waste disposal sites and areas of ground contamination in Antarctica for which Australia
is responsible. These make good provisions are calculated using a net present value methodology.
This requires that each year the provision increases by the value of unwinding a discount on
the future value of the provisions. This increase results in liabilities that are not covered by assets
for the Department. Funding will not be provided to the Department until such time as
payments are required to be made, which is beyond the forward estimates.
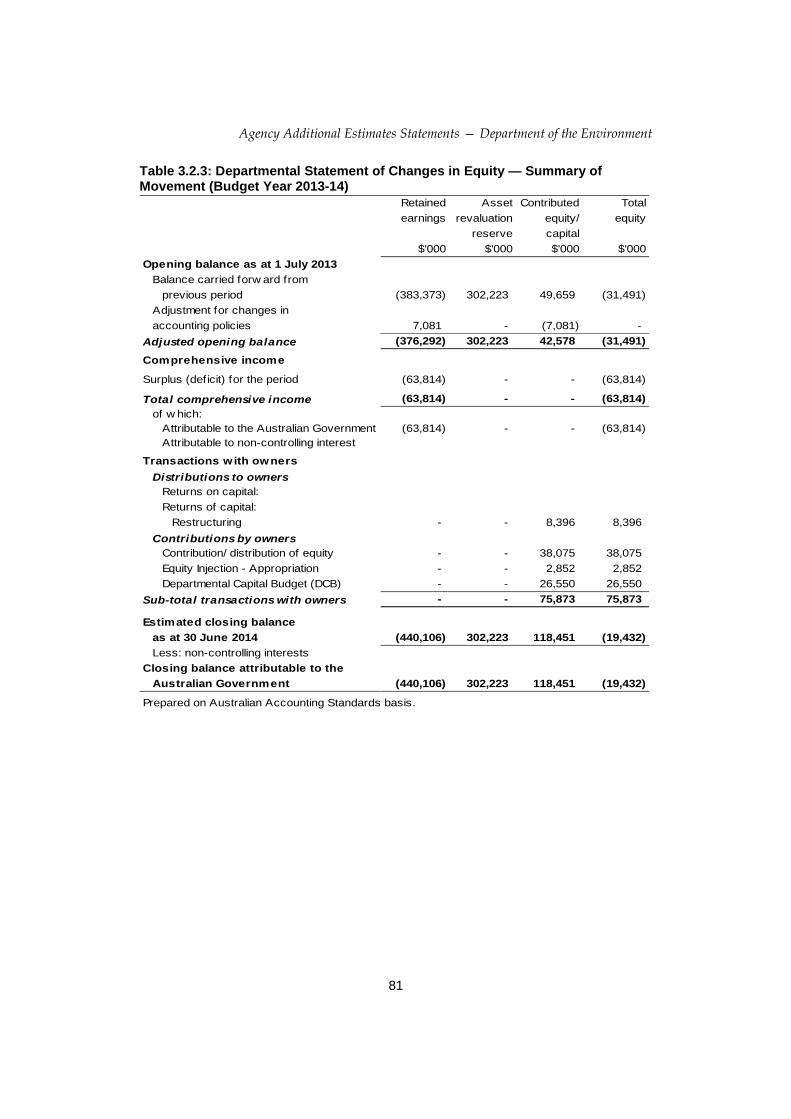
Agency Additional Estimates Statements — Department of the Environment
81
Table 3.2.3: Departmental Statement of Changes in Equity — Summary of Movement (Budget Year 2013-14)
Retained Asset Contributed Total
earnings revaluation equity/ equity
reserve capital
$'000 $'000 $'000 $'000
Opening balance as at 1 July 2013
Balance carried forw ard from
previous period (383,373) 302,223 49,659 (31,491)
Adjustment for changes in
accounting policies 7,081 - (7,081) -
Adjusted opening balance (376,292) 302,223 42,578 (31,491)
Comprehensive income
Surplus (deficit) for the period (63,814) - - (63,814)
Total comprehensive income (63,814) - - (63,814)
of w hich:
Attributable to the Australian Government (63,814) - - (63,814)
Attributable to non-controlling interest
Transactions with owners
Distributions to owners
Returns on capital:
Returns of capital:
Restructuring - - 8,396 8,396
Contributions by owners
Contribution/ distribution of equity - - 38,075 38,075
Equity Injection - Appropriation - - 2,852 2,852
Departmental Capital Budget (DCB) - - 26,550 26,550
Sub-total transactions with owners - - 75,873 75,873
Estimated closing balance
as at 30 June 2014 (440,106) 302,223 118,451 (19,432)
Less: non-controlling interests
Closing balance attributable to the
Australian Government (440,106) 302,223 118,451 (19,432)
Prepared on Australian Accounting Standards basis.
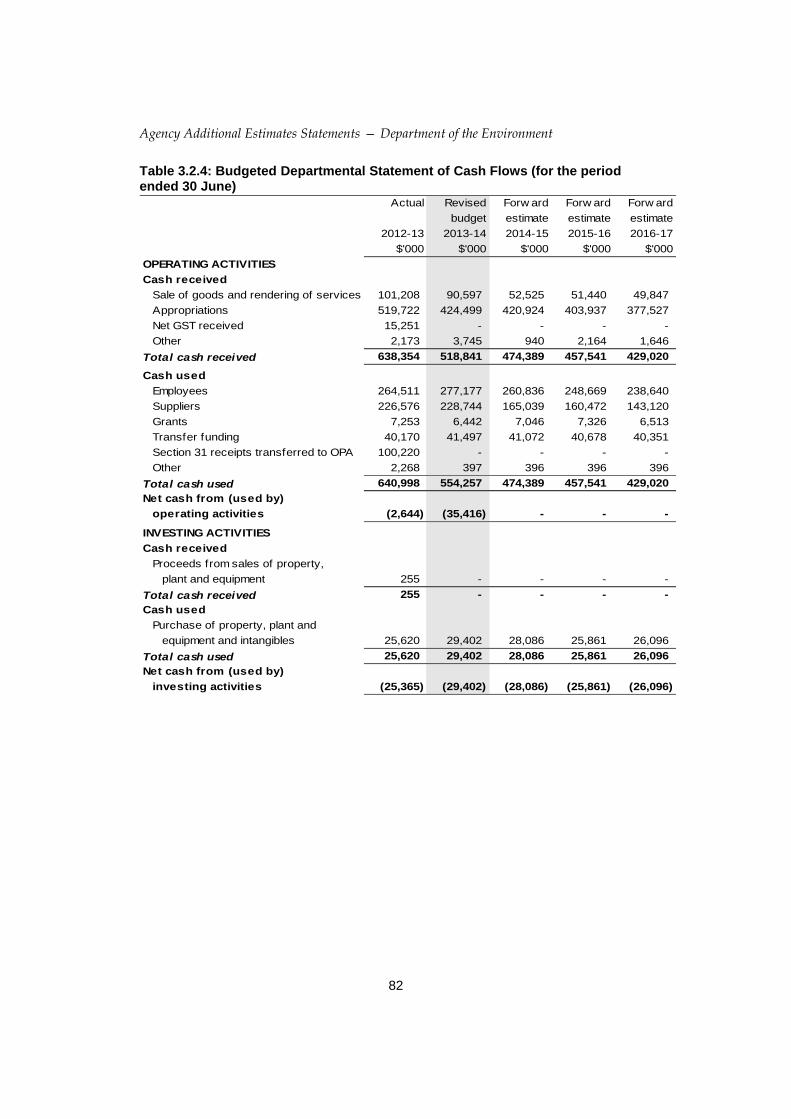
Agency Additional Estimates Statements — Department of the Environment
82
Table 3.2.4: Budgeted Departmental Statement of Cash Flows (for the period ended 30 June)
Actual Revised Forw ard Forw ard Forw ard
budget estimate estimate estimate
2012-13 2013-14 2014-15 2015-16 2016-17
$'000 $'000 $'000 $'000 $'000
OPERATING ACTIVITIES
Cash received
Sale of goods and rendering of services 101,208 90,597 52,525 51,440 49,847
Appropriations 519,722 424,499 420,924 403,937 377,527
Net GST received 15,251 - - - -
Other 2,173 3,745 940 2,164 1,646
Total cash received 638,354 518,841 474,389 457,541 429,020
Cash used
Employees 264,511 277,177 260,836 248,669 238,640
Suppliers 226,576 228,744 165,039 160,472 143,120
Grants 7,253 6,442 7,046 7,326 6,513
Transfer funding 40,170 41,497 41,072 40,678 40,351
Section 31 receipts transferred to OPA 100,220 - - - -
Other 2,268 397 396 396 396
Total cash used 640,998 554,257 474,389 457,541 429,020
Net cash from (used by)
operating activities (2,644) (35,416) - - -
INVESTING ACTIVITIES
Cash received
Proceeds from sales of property,
plant and equipment 255 - - - -
Total cash received 255 - - - -
Cash used
Purchase of property, plant and
equipment and intangibles 25,620 29,402 28,086 25,861 26,096
Total cash used 25,620 29,402 28,086 25,861 26,096
Net cash from (used by)
investing activities (25,365) (29,402) (28,086) (25,861) (26,096)
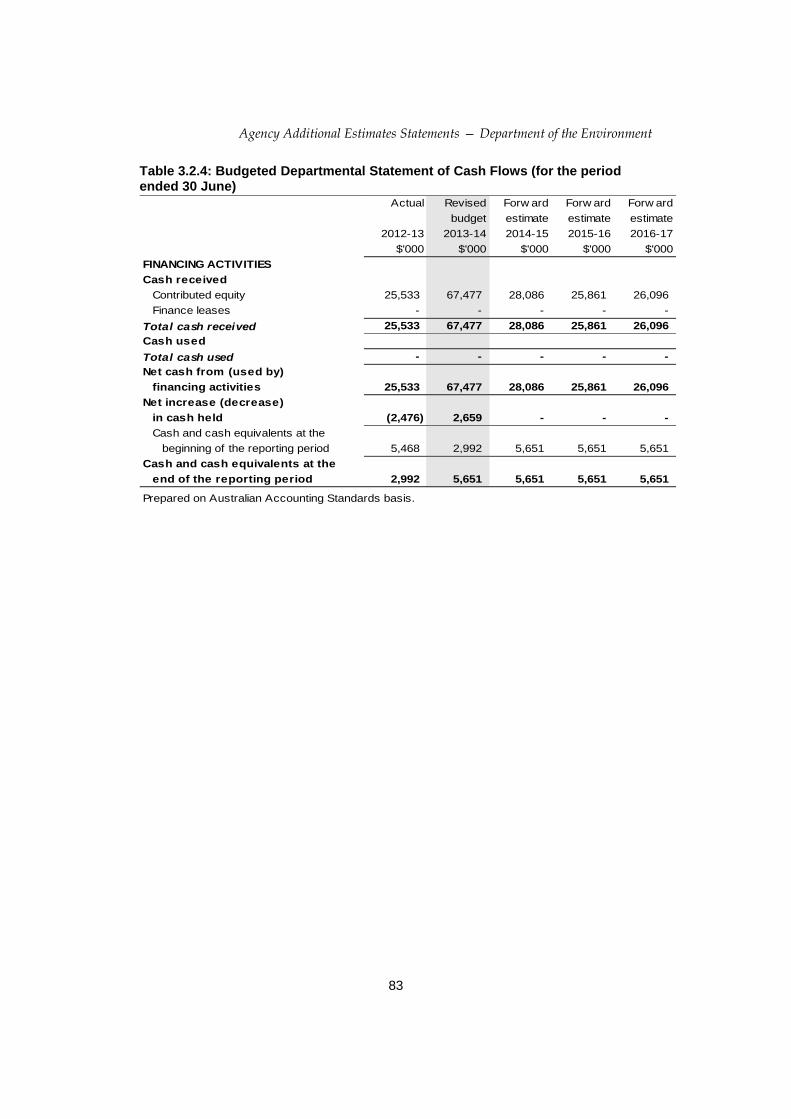
Agency Additional Estimates Statements — Department of the Environment
83
Table 3.2.4: Budgeted Departmental Statement of Cash Flows (for the period ended 30 June)
Actual Revised Forw ard Forw ard Forw ard
budget estimate estimate estimate
2012-13 2013-14 2014-15 2015-16 2016-17
$'000 $'000 $'000 $'000 $'000
FINANCING ACTIVITIES
Cash received
Contributed equity 25,533 67,477 28,086 25,861 26,096
Finance leases - - - - -
Total cash received 25,533 67,477 28,086 25,861 26,096
Cash used
Total cash used - - - - -
Net cash from (used by)
financing activities 25,533 67,477 28,086 25,861 26,096
Net increase (decrease)
in cash held (2,476) 2,659 - - -
Cash and cash equivalents at the
beginning of the reporting period 5,468 2,992 5,651 5,651 5,651
Cash and cash equivalents at the
end of the reporting period 2,992 5,651 5,651 5,651 5,651
Prepared on Australian Accounting Standards basis.
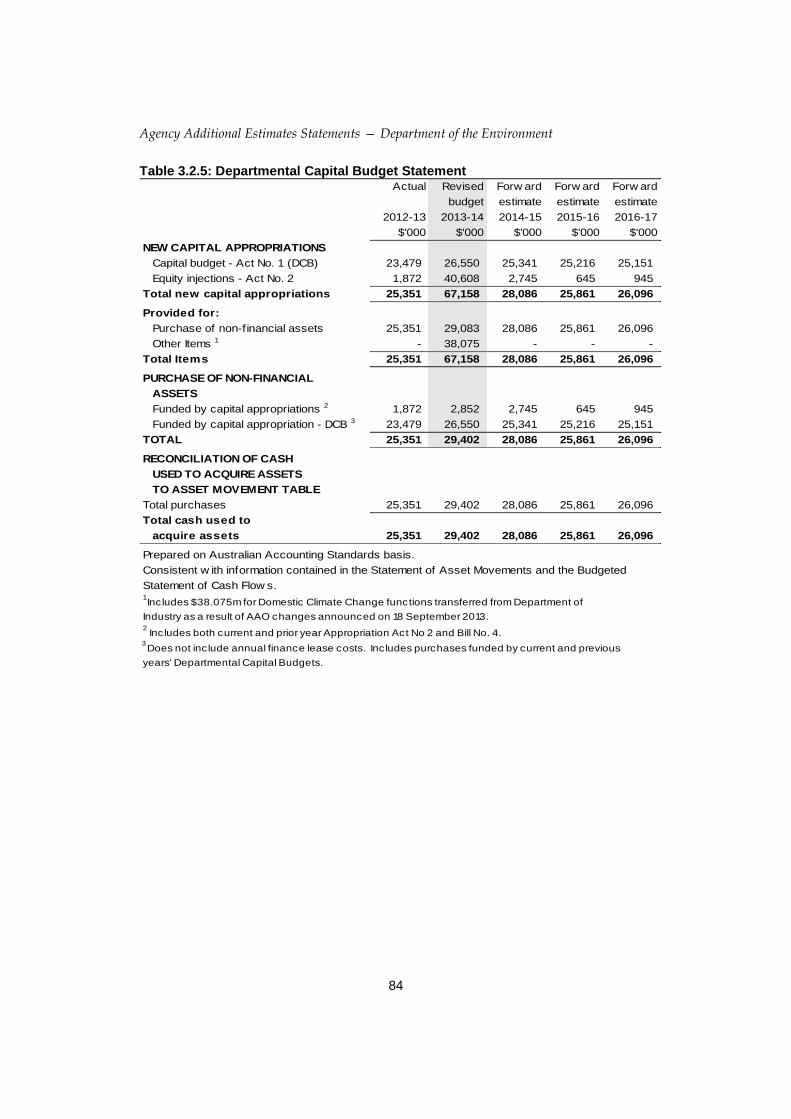
Agency Additional Estimates Statements — Department of the Environment
84
Table 3.2.5: Departmental Capital Budget Statement Actual Revised Forw ard Forw ard Forw ard
budget estimate estimate estimate
2012-13 2013-14 2014-15 2015-16 2016-17
$'000 $'000 $'000 $'000 $'000
NEW CAPITAL APPROPRIATIONS
Capital budget - Act No. 1 (DCB) 23,479 26,550 25,341 25,216 25,151
Equity injections - Act No. 2 1,872 40,608 2,745 645 945
Total new capital appropriations 25,351 67,158 28,086 25,861 26,096
Provided for:
Purchase of non-financial assets 25,351 29,083 28,086 25,861 26,096
Other Items 1 - 38,075 - - -
Total Items 25,351 67,158 28,086 25,861 26,096
PURCHASE OF NON-FINANCIAL
ASSETS
Funded by capital appropriations 2 1,872 2,852 2,745 645 945
Funded by capital appropriation - DCB 3 23,479 26,550 25,341 25,216 25,151
TOTAL 25,351 29,402 28,086 25,861 26,096
RECONCILIATION OF CASH
USED TO ACQUIRE ASSETS
TO ASSET MOVEMENT TABLE
Total purchases 25,351 29,402 28,086 25,861 26,096
Total cash used to
acquire assets 25,351 29,402 28,086 25,861 26,096
Prepared on Australian Accounting Standards basis.
Consistent w ith information contained in the Statement of Asset Movements and the Budgeted
Statement of Cash Flow s.1 Includes $38.075m for Domestic Climate Change functions transferred from Department of
Industry as a result of AAO changes announced on 18 September 2013.2 Includes both current and prior year Appropriation Act No 2 and Bill No. 4.
3 Does not include annual finance lease costs. Includes purchases funded by current and previous
years' Departmental Capital Budgets.
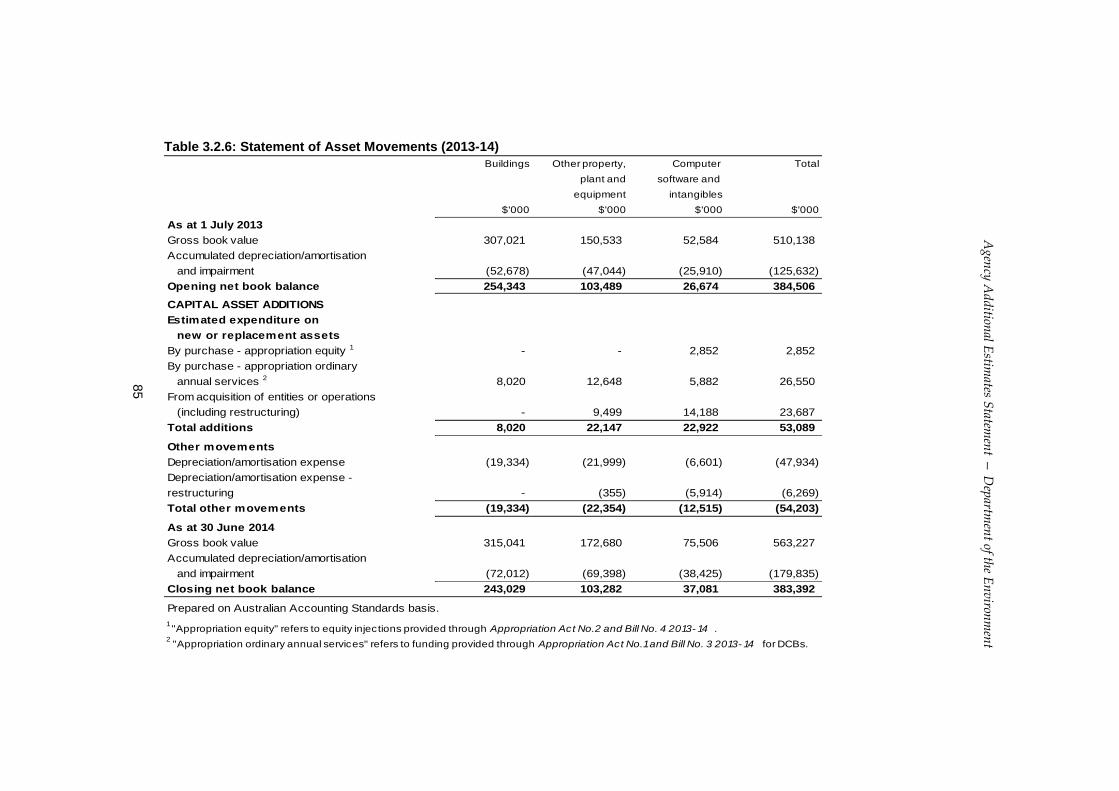
85
Ag
ency
Ad
dition
al Estim
ates Statem
ent —
Dep
artmen
t of the E
nv
ironm
ent
Table 3.2.6: Statement of Asset Movements (2013-14)
Buildings Other property, Computer Total
plant and software and
equipment intangibles
$'000 $'000 $'000 $'000
As at 1 July 2013
Gross book value 307,021 150,533 52,584 510,138
Accumulated depreciation/amortisation
and impairment (52,678) (47,044) (25,910) (125,632)
Opening net book balance 254,343 103,489 26,674 384,506
CAPITAL ASSET ADDITIONS
Estimated expenditure on
new or replacement assets
By purchase - appropriation equity 1 - - 2,852 2,852
By purchase - appropriation ordinary
annual services 2 8,020 12,648 5,882 26,550
From acquisition of entities or operations
(including restructuring) - 9,499 14,188 23,687
Total additions 8,020 22,147 22,922 53,089
Other movements
Depreciation/amortisation expense (19,334) (21,999) (6,601) (47,934)
Depreciation/amortisation expense -
restructuring - (355) (5,914) (6,269)
Total other movements (19,334) (22,354) (12,515) (54,203)
As at 30 June 2014
Gross book value 315,041 172,680 75,506 563,227
Accumulated depreciation/amortisation
and impairment (72,012) (69,398) (38,425) (179,835)
Closing net book balance 243,029 103,282 37,081 383,392
Prepared on Australian Accounting Standards basis.
1 "Appropriation equity" refers to equity injections provided through Appropriation Act No.2 and Bill No. 4 2013- 14 .
2 "Appropriation ordinary annual services" refers to funding provided through Appropriation Act No.1 and Bill No. 3 2013- 14 for DCBs.

Agency Additional Estimates Statement — Department of the Environment
86
Schedule of Administered Activity
Table 3.2.7: Schedule of Budgeted Income and Expenses Administered on Behalf of Government (for the period ended 30 June)
Actual Revised Forw ard Forw ard Forw ard
budget estimate estimate estimate
2012-13 2013-14 2014-15 2015-16 2016-17
$'000 $'000 $'000 $'000 $'000
EXPENSES ADMINISTERED ON
BEHALF OF GOVERNMENT
Suppliers 106,226 57,155 53,897 58,857 54,971
Subsidies - - - - -
Grants 516,348 794,808 883,960 1,246,551 1,114,331
Depreciation and amortisation 425 - - - -
Write-dow n and impairment
of assets 344,332 - - - -
Other 868 1,192 - - -
Total expenses administered
on behalf of Government 968,199 853,155 937,857 1,305,408 1,169,302
LESS:
OWN-SOURCE INCOME
Own-source revenue
Taxation revenue
Other 101,810 99,099 122 145 1,498
Total taxation revenue 101,810 99,099 122 145 1,498
Non-taxation revenue
Sale of goods and rendering
of services 572 1,530 1,530 1,530 1,530
Fees and fines 8,268 9,324 24,183 28,718 20,978
Interest 693 525 285 97 38
Grant repayments - - - - -
Other 2,589 3,178 2,228 2,228 15,465
Total non-taxation revenue 12,122 14,557 28,226 32,573 38,011
Total own-source revenues
administered on behalf of
Government 113,932 113,656 28,348 32,718 39,509
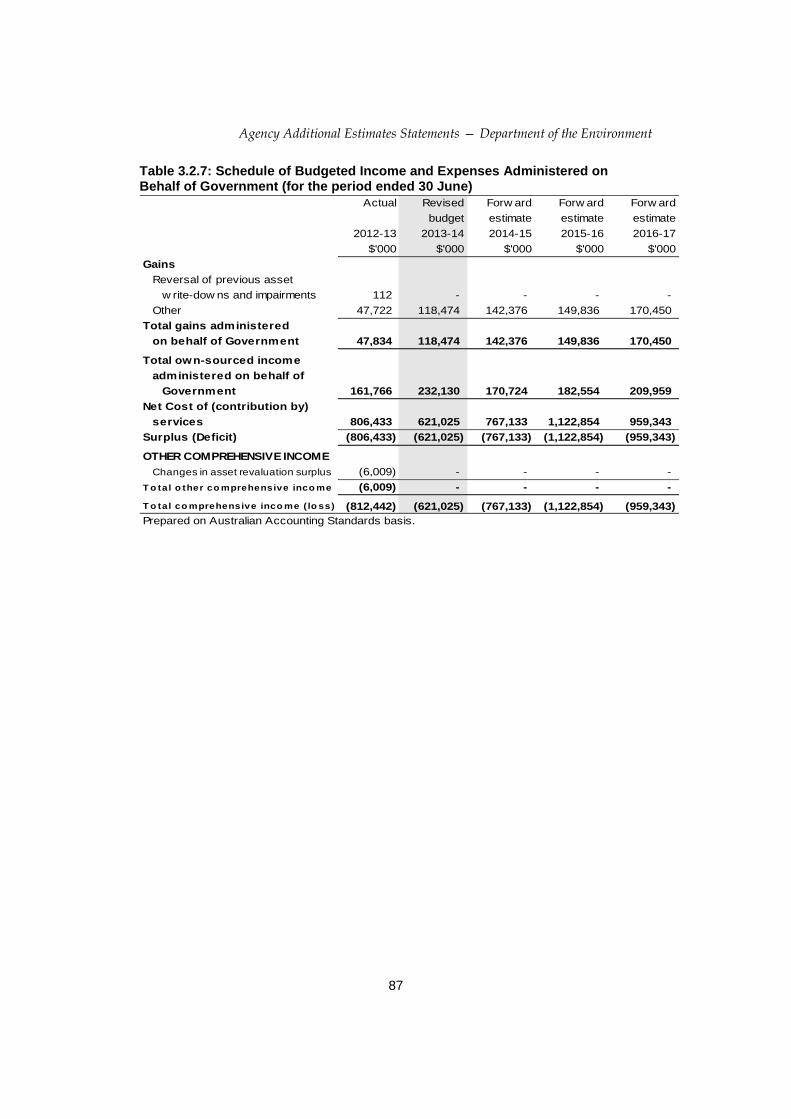
Agency Additional Estimates Statements — Department of the Environment
87
Table 3.2.7: Schedule of Budgeted Income and Expenses Administered on Behalf of Government (for the period ended 30 June)
Actual Revised Forw ard Forw ard Forw ard
budget estimate estimate estimate
2012-13 2013-14 2014-15 2015-16 2016-17
$'000 $'000 $'000 $'000 $'000
Gains
Reversal of previous asset
w rite-dow ns and impairments 112 - - - -
Other 47,722 118,474 142,376 149,836 170,450
Total gains administered
on behalf of Government 47,834 118,474 142,376 149,836 170,450
Total own-sourced income
administered on behalf of
Government 161,766 232,130 170,724 182,554 209,959
Net Cost of (contribution by)
services 806,433 621,025 767,133 1,122,854 959,343
Surplus (Deficit) (806,433) (621,025) (767,133) (1,122,854) (959,343)
OTHER COMPREHENSIVE INCOME
Changes in asset revaluation surplus (6,009) - - - -
T o tal o ther co mprehensive inco me (6,009) - - - -
T o tal co mprehensive inco me ( lo ss) (812,442) (621,025) (767,133) (1,122,854) (959,343)
Prepared on Australian Accounting Standards basis.

Agency Additional Estimates Statements — Department of the Environment
88
Table 3.2.8: Schedule of Budgeted Assets and Liabilities Administered on Behalf of Government (as at 30 June)
Actual Revised Forw ard Forw ard Forw ard
budget estimate estimate estimate
2012-13 2013-14 2014-15 2015-16 2016-17
$'000 $'000 $'000 $'000 $'000
ASSETS ADMINISTERED ON
BEHALF OF GOVERNMENT
Financial assets
Cash and cash equivalents - - - - -
Receivables 13,551 11,216 8,906 8,120 5,785
Taxation receivables 22,806 35,000 - - -
Other investments 561,520 562,045 562,045 562,045 562,045
Total financial assets 597,877 608,261 570,951 570,165 567,830
Non-financial assets
Land and buildings 1,467 1,467 1,467 1,467 1,467
Property, plant and equipment 506,448 506,448 506,448 506,448 506,448
Inventories 12,559 12,559 12,559 12,559 12,559
Intangibles 1,874,779 2,065,775 2,279,575 2,495,017 2,750,629
Total non-financial assets 2,395,253 2,586,249 2,800,049 3,015,491 3,271,103
Total assets administered
on behalf of Government 2,993,130 3,194,510 3,371,000 3,585,656 3,838,933
LIABILITIES ADMINISTERED ON
BEHALF OF GOVERNMENT
Payables
Suppliers 7,103 7,103 7,103 7,103 7,103
Grants 23,058 23,058 23,058 23,058 23,058
Other 63 63 63 63 63
Total payables 30,224 30,224 30,224 30,224 30,224
Total liabilities administered
on behalf of Government 30,224 30,224 30,224 30,224 30,224
Net assets/(liabilities) 2,962,906 3,164,286 3,340,776 3,555,432 3,808,709
Prepared on Australian Accounting Standards basis.
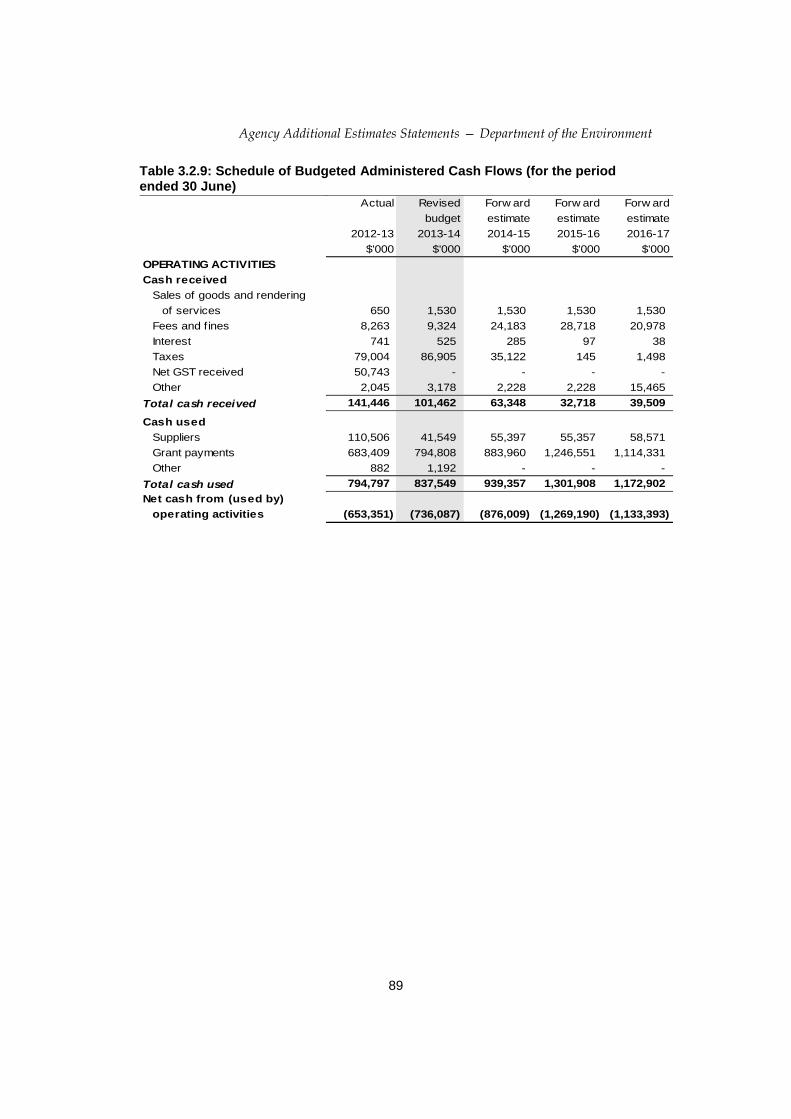
Agency Additional Estimates Statements — Department of the Environment
89
Table 3.2.9: Schedule of Budgeted Administered Cash Flows (for the period ended 30 June)
Actual Revised Forw ard Forw ard Forw ard
budget estimate estimate estimate
2012-13 2013-14 2014-15 2015-16 2016-17
$'000 $'000 $'000 $'000 $'000
OPERATING ACTIVITIES
Cash received
Sales of goods and rendering
of services 650 1,530 1,530 1,530 1,530
Fees and fines 8,263 9,324 24,183 28,718 20,978
Interest 741 525 285 97 38
Taxes 79,004 86,905 35,122 145 1,498
Net GST received 50,743 - - - -
Other 2,045 3,178 2,228 2,228 15,465
Total cash received 141,446 101,462 63,348 32,718 39,509
Cash used
Suppliers 110,506 41,549 55,397 55,357 58,571
Grant payments 683,409 794,808 883,960 1,246,551 1,114,331
Other 882 1,192 - - -
Total cash used 794,797 837,549 939,357 1,301,908 1,172,902
Net cash from (used by)
operating activities (653,351) (736,087) (876,009) (1,269,190) (1,133,393)
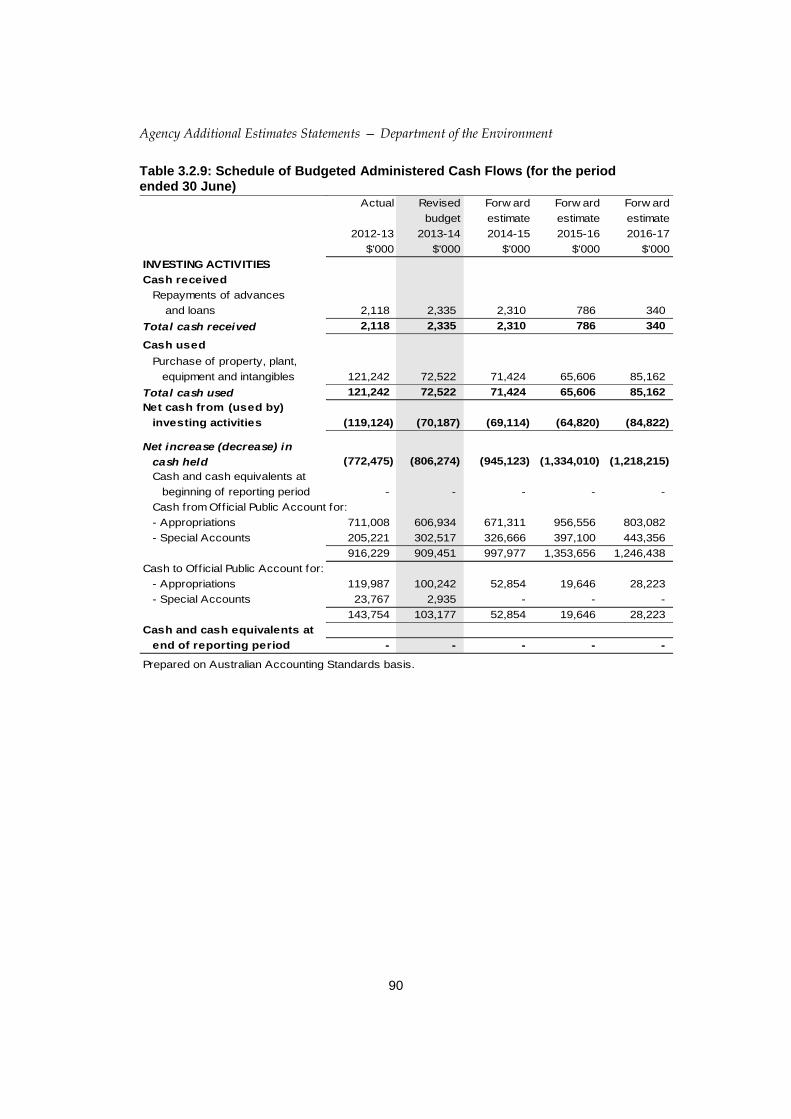
Agency Additional Estimates Statements — Department of the Environment
90
Table 3.2.9: Schedule of Budgeted Administered Cash Flows (for the period ended 30 June)
Actual Revised Forw ard Forw ard Forw ard
budget estimate estimate estimate
2012-13 2013-14 2014-15 2015-16 2016-17
$'000 $'000 $'000 $'000 $'000
INVESTING ACTIVITIES
Cash received
Repayments of advances
and loans 2,118 2,335 2,310 786 340
Total cash received 2,118 2,335 2,310 786 340
Cash used
Purchase of property, plant,
equipment and intangibles 121,242 72,522 71,424 65,606 85,162
Total cash used 121,242 72,522 71,424 65,606 85,162
Net cash from (used by)
investing activities (119,124) (70,187) (69,114) (64,820) (84,822)
Net increase (decrease) in
cash held (772,475) (806,274) (945,123) (1,334,010) (1,218,215)
Cash and cash equivalents at
beginning of reporting period - - - - -
Cash from Official Public Account for:
- Appropriations 711,008 606,934 671,311 956,556 803,082
- Special Accounts 205,221 302,517 326,666 397,100 443,356
916,229 909,451 997,977 1,353,656 1,246,438
Cash to Official Public Account for:
- Appropriations 119,987 100,242 52,854 19,646 28,223
- Special Accounts 23,767 2,935 - - -
143,754 103,177 52,854 19,646 28,223
Cash and cash equivalents at
end of reporting period - - - - -
Prepared on Australian Accounting Standards basis.
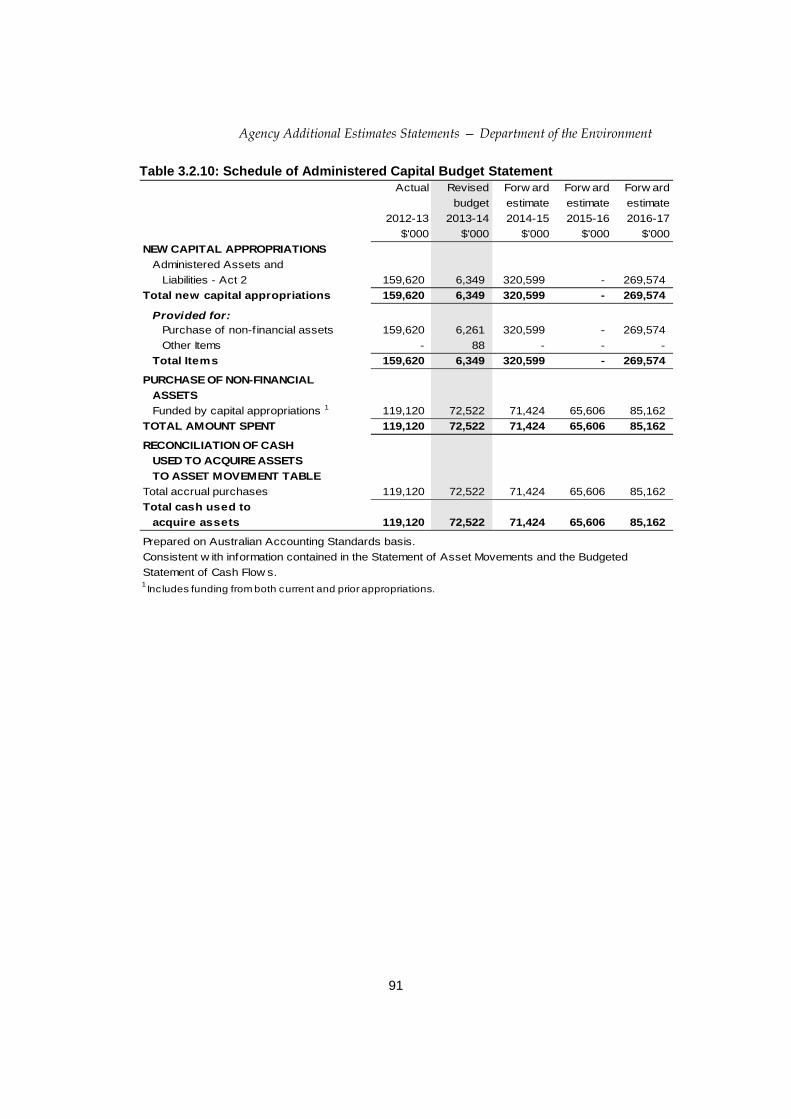
Agency Additional Estimates Statements — Department of the Environment
91
Table 3.2.10: Schedule of Administered Capital Budget Statement
Actual Revised Forw ard Forw ard Forw ard
budget estimate estimate estimate
2012-13 2013-14 2014-15 2015-16 2016-17
$'000 $'000 $'000 $'000 $'000
NEW CAPITAL APPROPRIATIONS
Administered Assets and
Liabilities - Act 2 159,620 6,349 320,599 - 269,574
Total new capital appropriations 159,620 6,349 320,599 - 269,574
Provided for:
Purchase of non-financial assets 159,620 6,261 320,599 - 269,574
Other Items - 88 - - -
Total Items 159,620 6,349 320,599 - 269,574
PURCHASE OF NON-FINANCIAL
ASSETS
Funded by capital appropriations 1 119,120 72,522 71,424 65,606 85,162
TOTAL AMOUNT SPENT 119,120 72,522 71,424 65,606 85,162
RECONCILIATION OF CASH
USED TO ACQUIRE ASSETS
TO ASSET MOVEMENT TABLE
Total accrual purchases 119,120 72,522 71,424 65,606 85,162
Total cash used to
acquire assets 119,120 72,522 71,424 65,606 85,162
Prepared on Australian Accounting Standards basis.
Consistent w ith information contained in the Statement of Asset Movements and the Budgeted
Statement of Cash Flow s.1 Includes funding from both current and prior appropriations.
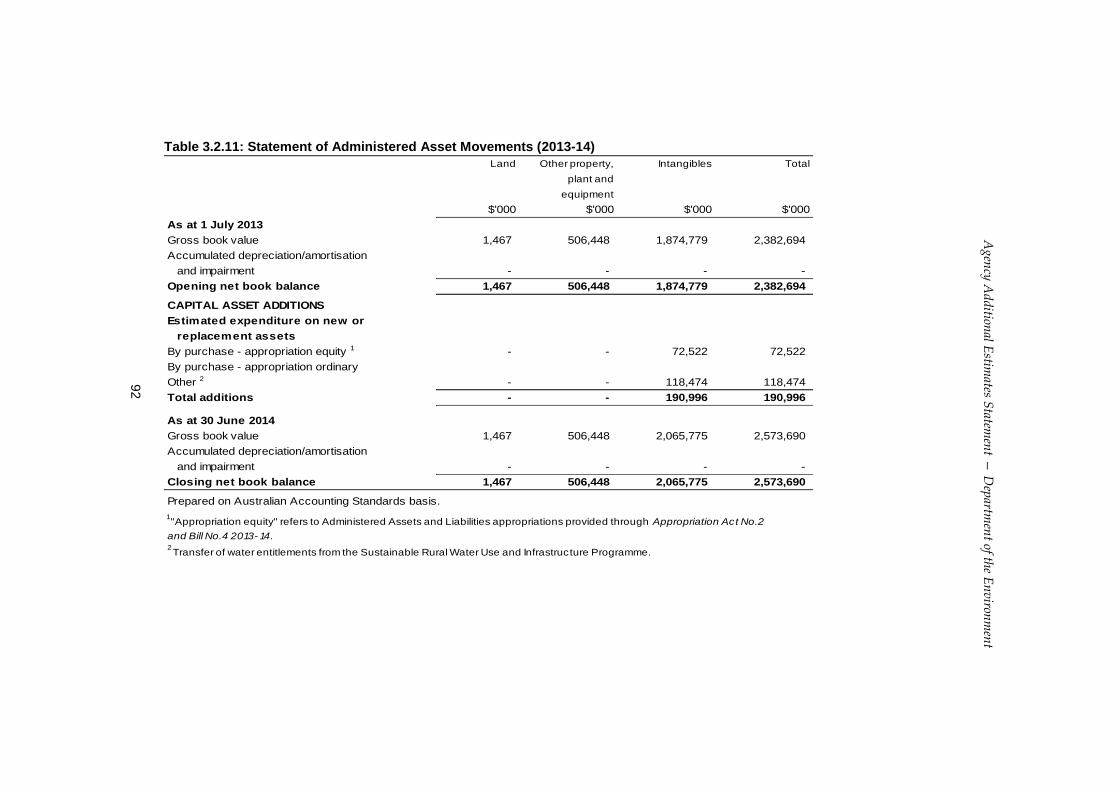
92
Ag
ency
Ad
dition
al Estim
ates Statem
ent —
Dep
artmen
t of the E
nv
ironm
ent
Table 3.2.11: Statement of Administered Asset Movements (2013-14)
Land Other property, Intangibles Total
plant and
equipment
$'000 $'000 $'000 $'000
As at 1 July 2013
Gross book value 1,467 506,448 1,874,779 2,382,694
Accumulated depreciation/amortisation
and impairment - - - -
Opening net book balance 1,467 506,448 1,874,779 2,382,694
CAPITAL ASSET ADDITIONS
Estimated expenditure on new or
replacement assets
By purchase - appropriation equity 1 - - 72,522 72,522
By purchase - appropriation ordinary
Other 2 - - 118,474 118,474
Total additions - - 190,996 190,996
As at 30 June 2014
Gross book value 1,467 506,448 2,065,775 2,573,690
Accumulated depreciation/amortisation
and impairment - - - -
Closing net book balance 1,467 506,448 2,065,775 2,573,690
Prepared on Australian Accounting Standards basis.
1 "Appropriation equity" refers to Administered Assets and Liabilities appropriations provided through Appropriation Act No.2
and Bill No.4 2013- 14.2 Transfer of water entitlements from the Sustainable Rural Water Use and Infrastructure Programme.
93
CLEAN ENERGY REGULATOR
Section 1: Agency Overview and Resources ........................................................... 95
1.1 Strategic Direction .................................................................................................. 95
1.2 Agency Resource Statement ................................................................................. 95
1.3 Agency Measures Table ........................................................................................ 97
1.4 Additional Estimates and Variations ...................................................................... 99
1.5 Breakdown of Additional Estimates by Appropriation Bill .................................... 100
Section 2: Revisions to Agency Outcomes and Planned Performance .............. 101
2.1 Resources and Performance Information ............................................................ 101
Section 3: Explanatory Tables and Budgeted Financial Statements ................... 103
3.1 Explanatory Tables .............................................................................................. 103
3.2 Budgeted Financial Statements ........................................................................... 104
Agency Additional Estimates Statements — Clean Energy Regulator
94

Agency Additional Estimates Statements — Clean Energy Regulator
95
CLEAN ENERGY REGULATOR
Section 1: Agency Overview and Resources
1.1 STRATEGIC DIRECTION
Details of the Clean Energy Regulator’s strategic direction and program structures are
contained in the 2013-14 Industry, Innovation, Climate Change, Science, Research and
Tertiary Education 2013-14 Portfolio Budget Statements.
The adjustment to the Clean Energy Regulator’s revenue and expenses, in the forward
years, reflects the Government’s commitment to repeal the carbon pricing mechanism.
The additional appropriation of $14.4 million over three years was provided to fund
the previous Government’s commitment to the early delivery of the flexible price
period and included accelerating delivery of other core capability.
The Clean Energy Regulator’s appropriation is reduced by $10.2 million over the
Budget and forward years through Government savings measures, parameter
adjustments and efficiency dividends.
1.2 AGENCY RESOURCE STATEMENT
The Agency Resource Statement details the resourcing for the Clean Energy Regulator
at Additional Estimates. Table 1.1 outlines the total resourcing available from all
sources for the 2013-14 Budget year, including variations through Appropriation Bill
Nos. 3 and 4, Special Appropriations and Special Accounts.
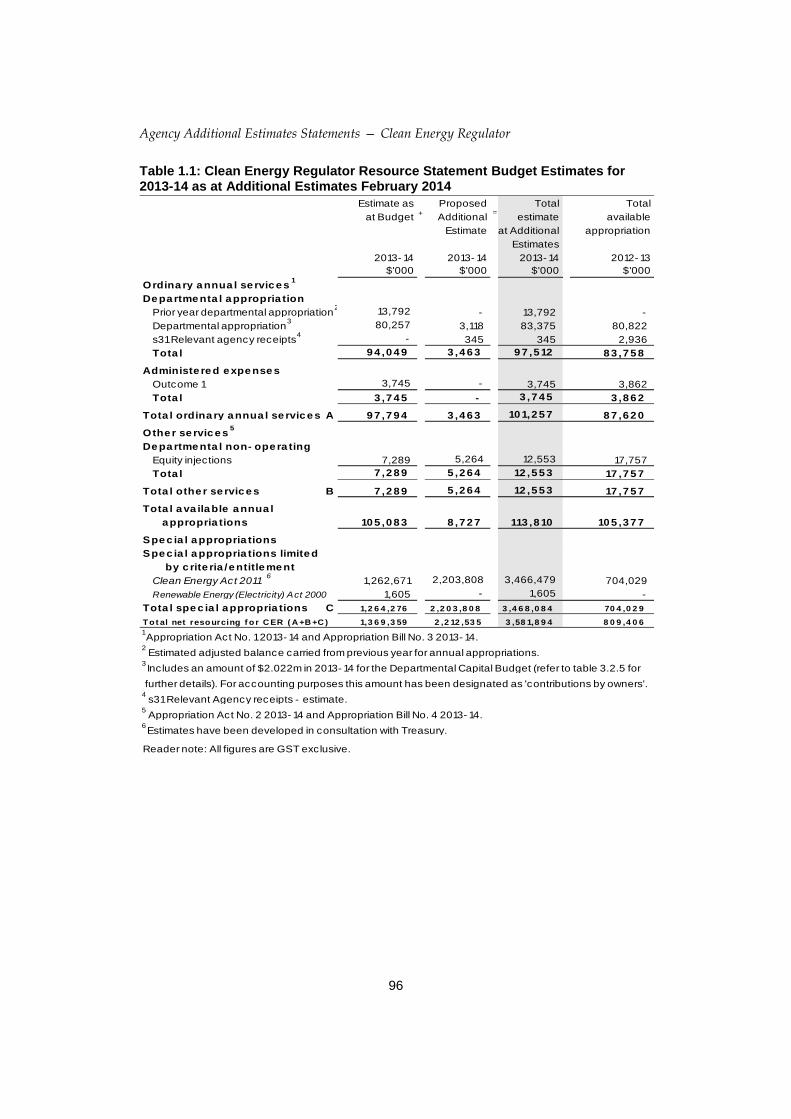
Agency Additional Estimates Statements — Clean Energy Regulator
96
Table 1.1: Clean Energy Regulator Resource Statement Budget Estimates for 2013-14 as at Additional Estimates February 2014
Estimate as Proposed Total Total
at Budget+
Additional=
estimate available
Estimate at Additional appropriation
Estimates
2013- 14 2013- 14 2013- 14 2012- 13
$'000 $'000 $'000 $'000
Ordina ry a nnua l se rvic e s1
De pa rtme nta l a ppropria tion
Prior year departmental appropriation2
13,792 - 13,792 -
Departmental appropriation3
80,257 3,118 83,375 80,822
s31 Relevant agency receipts4
- 345 345 2,936
Tota l 9 4 ,0 4 9 3 ,4 6 3 9 7 ,5 12 8 3 ,7 5 8
Administe re d e xpe nse s
Outcome 1 3,745 - 3,745 3,862
Tota l 3 ,7 4 5 - 3 ,7 4 5 3 ,8 6 2
Tota l ordina ry a nnua l se rvic e s A 9 7 ,7 9 4 3 ,4 6 3 10 1,2 5 7 8 7 ,6 2 0
Othe r se rvic e s5
De pa rtme nta l non- ope ra ting
Equity injections 7,289 5,264 12,553 17,757
Tota l 7 ,2 8 9 5 ,2 6 4 12 ,5 5 3 17 ,7 5 7
Tota l othe r se rvic e s B 7 ,2 8 9 5 ,2 6 4 12 ,5 5 3 17 ,7 5 7
Tota l a va ila ble a nnua l
a ppropria tions 10 5 ,0 8 3 8 ,7 2 7 113 ,8 10 10 5 ,3 7 7
Spe c ia l a ppropria tions
Spe c ia l a ppropria tions limite d
by c rite ria /e ntitle me nt
Clean Energy Act 20116
1,262,671 2,203,808 3,466,479 704,029
Renewable Energy (Electricity) Act 2000 1,605 - 1,605 -
Tota l spe c ia l a ppropria tions C 1,2 6 4 ,2 76 2 ,2 0 3 ,8 0 8 3 ,4 6 8 ,0 8 4 70 4 ,0 2 9
Tot al net resourcing f o r C ER ( A +B +C ) 1,3 6 9 ,3 59 2 ,2 12 ,53 5 3 ,58 1,8 9 4 8 0 9 ,4 0 6
1 Appropriation Act No. 1 2013- 14 and Appropriation Bill No. 3 2013- 14.
2 Estimated adjusted balance carried from previous year for annual appropriations.
3 Includes an amount of $2.022m in 2013- 14 for the Departmental Capital Budget (refer to table 3.2.5 for
further details). For accounting purposes this amount has been designated as 'contributions by owners'.4 s31 Relevant Agency receipts - estimate.
5 Appropriation Act No. 2 2013- 14 and Appropriation Bill No. 4 2013- 14.
6 Estimates have been developed in consultation with Treasury.
Reader note: All figures are GST exclusive.

Agency Additional Estimates Statements — Clean Energy Regulator
97
1.3 AGENCY MEASURES TABLE
Table 1.2 summarises new Government measures taken since the 2013-14 Budget. The
table is split into revenue, expense and capital measures, with the affected program
identified.
Table 1.2: Agency 2013-14 Measures since Budget
Program 2013-14 2014-15 2015-16 2016-17
$'000 $'000 $'000 $'000
Revenue measures
Carbon pricing mechanism - replacing
f ixed price w ith an emissions trading
scheme from 1 July 20141 1.1
Administered revenues - (6,970,000) - -
Total - (6,970,000) - -
Repeal of the carbon tax - forgone
revenue from the repeal of the carbon 1.1
Administered revenues - (2,020,000) (4,230,001) (6,220,000)
Total - (2,020,000) (4,230,001) (6,220,000)
Total revenue measures
Administered - (8,990,000) (4,230,001) (6,220,000)
Total - (8,990,000) (4,230,001) (6,220,000)
Expense measures
Carbon pricing mechanism - reforms
to energy security fund1 1.1
Administered expenses - 245,225 (512,972) (781,135)
Total - 245,225 (512,972) (781,135)
Carbon pricing mechanism - replacing
f ixed price w ith an emissions trading
scheme from 1 July 20141 1.1
Administered expenses - (3,140,516) - -
Departmental expenses 3,694 2,754 688 -
Total 3,694 (3,137,762) 688 -
Repeal of the carbon tax - abolishing
business compensation1 1.1
Administered expenses - (679,230) (1,408,621) (2,192,376)
Total - (679,230) (1,408,621) (2,192,376)
Repeal of the carbon tax - abolishing
energy market compensation 1.1
Administered expenses - (513,806) - -
Total - (513,806) - -
Former Department of Climate Change
and Energy Efficiency - reduction in
funding 1.1
Departmental expenses (449) (847) (847) (847)
Total (449) (847) (847) (847)

Agency Additional Estimates Statements — Clean Energy Regulator
98
Table 1.2: Agency 2013-14 Measures since Budget
Program 2013-14 2014-15 2015-16 2016-17
$'000 $'000 $'000 $'000
Public Services eff iciencies2 1.1
Departmental expenses (8) (39) (86) (119)
Total (8) (39) (86) (119)
Reforms to the APS management and
eff icient procurement of agency
softw are 1.1
Departmental expenses (119) (150) (196) (118)
Total (119) (150) (196) (118)
Efficiency Dividend - temporary
increase in the rate 1.1
Departmental expenses - (812) (1,775) (2,746)
Total - (812) (1,775) (2,746)
Total expense measures
Administered - (4,088,327) (1,921,593) (2,973,511)
Departmental 3,118 906 (2,216) (3,830)
Total 3,118 (4,087,421) (1,923,809) (2,977,341)
Capital measures
Carbon pricing mechanism - replacing
f ixed price w ith an emissions trading
scheme from 1 July 2014 1.1
Departmental capital 5,264 2,027 - -
Total 5,264 2,027 - -
Total capital measures
Departmental 5,264 2,027 - -
Total 5,264 2,027 - -
Prepared on a Government Financial Statistics (f iscal) basis.1 Estimates have been developed in consultation w ith Treasury.
2 Public Services eff iciencies w ere announced in the 2013-14 Budget but have not been
previously reported in the Portfolio Statements
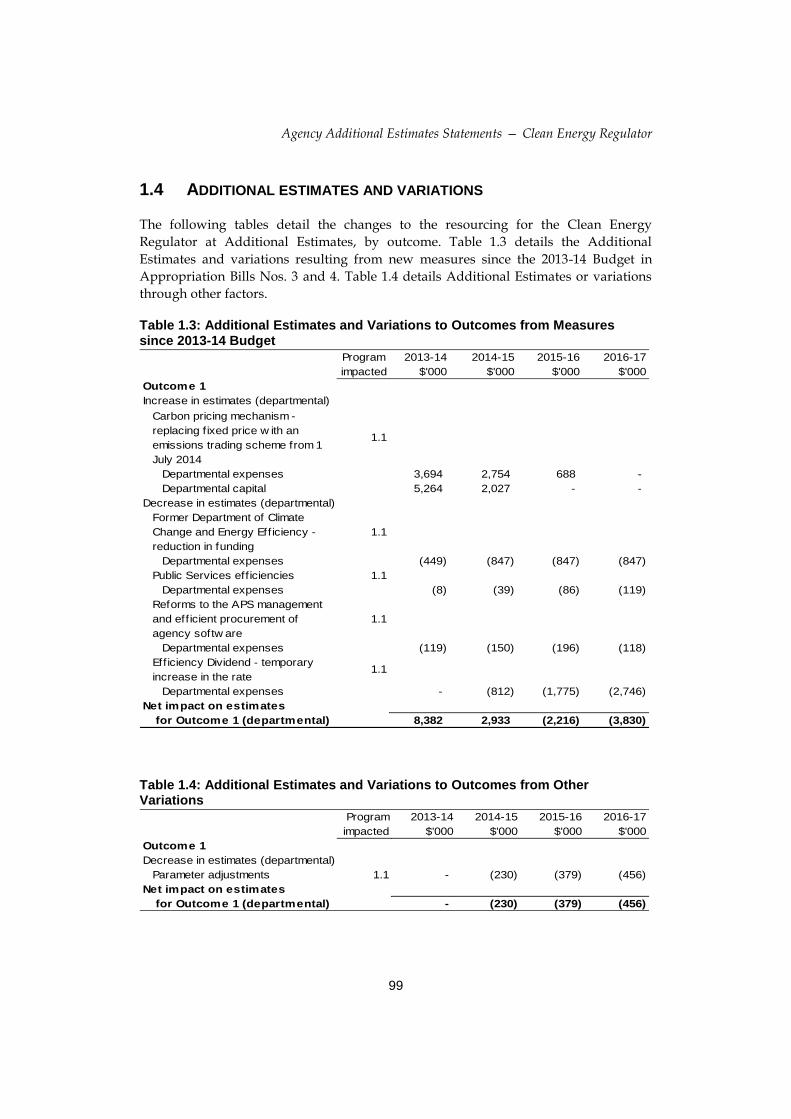
Agency Additional Estimates Statements — Clean Energy Regulator
99
1.4 ADDITIONAL ESTIMATES AND VARIATIONS
The following tables detail the changes to the resourcing for the Clean Energy
Regulator at Additional Estimates, by outcome. Table 1.3 details the Additional
Estimates and variations resulting from new measures since the 2013-14 Budget in
Appropriation Bills Nos. 3 and 4. Table 1.4 details Additional Estimates or variations
through other factors.
Table 1.3: Additional Estimates and Variations to Outcomes from Measures since 2013-14 Budget
Program 2013-14 2014-15 2015-16 2016-17
impacted $'000 $'000 $'000 $'000
Outcome 1
Increase in estimates (departmental)
Carbon pricing mechanism -
replacing f ixed price w ith an
emissions trading scheme from 1
July 2014
1.1
Departmental expenses 3,694 2,754 688 -
Departmental capital 5,264 2,027 - -
Decrease in estimates (departmental)
Former Department of Climate
Change and Energy Efficiency -
reduction in funding
1.1
Departmental expenses (449) (847) (847) (847)
Public Services eff iciencies 1.1
Departmental expenses (8) (39) (86) (119)
Reforms to the APS management
and eff icient procurement of
agency softw are
1.1
Departmental expenses (119) (150) (196) (118)
Efficiency Dividend - temporary
increase in the rate1.1
Departmental expenses - (812) (1,775) (2,746)
Net impact on estimates
for Outcome 1 (departmental) 8,382 2,933 (2,216) (3,830)
Table 1.4: Additional Estimates and Variations to Outcomes from Other Variations
Program 2013-14 2014-15 2015-16 2016-17
impacted $'000 $'000 $'000 $'000
Outcome 1
Decrease in estimates (departmental)
Parameter adjustments 1.1 - (230) (379) (456)
Net impact on estimates
for Outcome 1 (departmental) - (230) (379) (456)
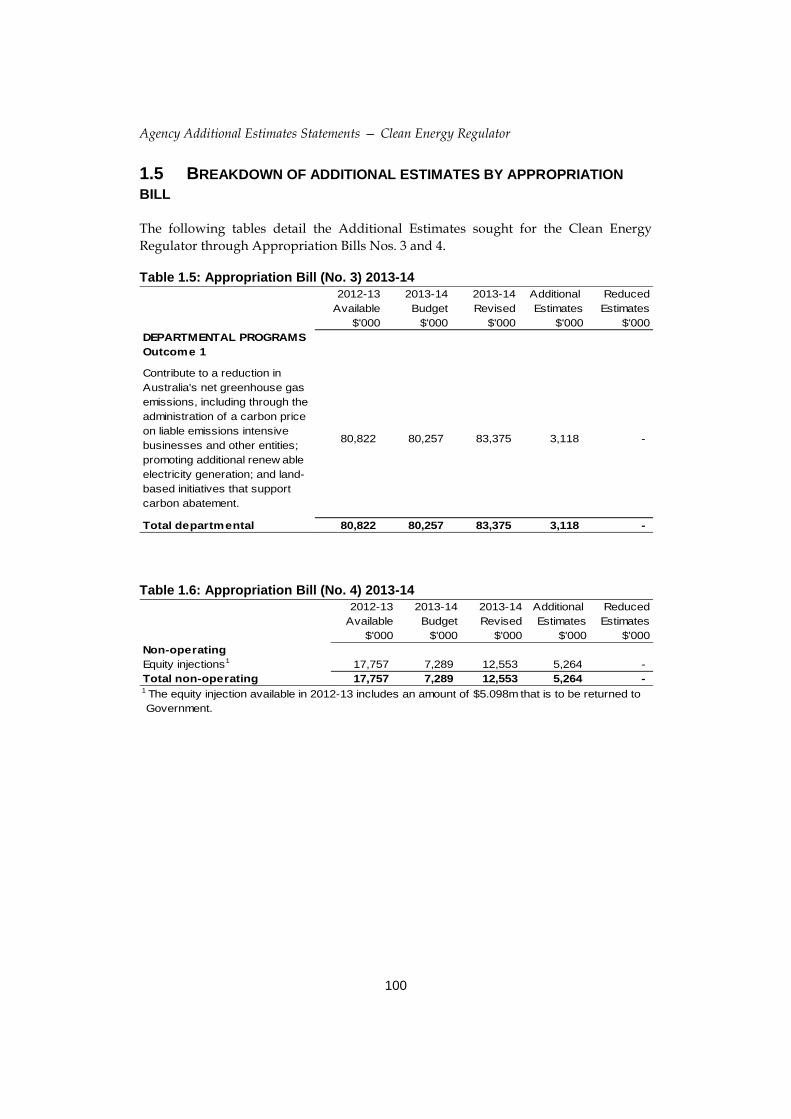
Agency Additional Estimates Statements — Clean Energy Regulator
100
1.5 BREAKDOWN OF ADDITIONAL ESTIMATES BY APPROPRIATION
BILL
The following tables detail the Additional Estimates sought for the Clean Energy
Regulator through Appropriation Bills Nos. 3 and 4.
Table 1.5: Appropriation Bill (No. 3) 2013-14
2012-13 2013-14 2013-14 Additional Reduced
Available Budget Revised Estimates Estimates
$'000 $'000 $'000 $'000 $'000
DEPARTMENTAL PROGRAMS
Outcome 1
Contribute to a reduction in
Australia's net greenhouse gas
emissions, including through the
administration of a carbon price
on liable emissions intensive
businesses and other entities;
promoting additional renew able
electricity generation; and land-
based initiatives that support
carbon abatement.
80,822 80,257 83,375 3,118 -
Total departmental 80,822 80,257 83,375 3,118 -
Table 1.6: Appropriation Bill (No. 4) 2013-14
2012-13 2013-14 2013-14 Additional Reduced
Available Budget Revised Estimates Estimates
$'000 $'000 $'000 $'000 $'000
Non-operating
Equity injections1 17,757 7,289 12,553 5,264 -
Total non-operating 17,757 7,289 12,553 5,264 -1 The equity injection available in 2012-13 includes an amount of $5.098m that is to be returned to
Government.

Agency Additional Estimates Statements — Clean Energy Regulator
101
Section 2: Revisions to Agency Resources and Planned Performance
2.1 RESOURCES AND PERFORMANCE INFORMATION
Complete details of the Clean Energy Regulator’s resources and performance
information are contained in the 2013-14 Industry, Innovation, Climate Change,
Science, Research and Tertiary Education 2013-14 Portfolio Budget Statements.
OUTCOME 1
Outcome 1 Strategy
There has been no change to the Clean Energy Regulator’s outcome strategy since the
2013-14 Portfolio Budget Statements.
Table 2.1: Budgeted Expenses for Outcome 1
2012-13 2013-14
Actual Revised
expenses Estimated
expenses
$'000 $'000
Program 1.1: Clean Energy Regulator
Administered expenses
Ordinary annual services (Appropriation Act No. 1 and Bill No. 3) 4,270 3,745
Special appropriations1 704,029 3,468,084
Departmental expenses2
Departmental appropriation3 79,228 81,698
Expenses not requiring appropriation in the Budget year3 249,834 82,724
Total for Program 1.1 1,037,361 3,636,251
Outcome 1 Totals by appropriation type
Administered Expenses
Ordinary annual services (Appropriation Act No. 1 and Bill No. 3) 4,270 3,745
Special appropriations1 704,029 3,468,084
Departmental expenses2
Departmental appropriation3 79,228 81,698
Expenses not requiring appropriation in the Budget year4 249,834 82,724
Total expenses for Outcome 1 1,037,361 3,636,251
2012-13 2013-14
Average Staffing Level (number) 349 3441 Estimates have been developed in consultation w ith Treasury.2 Outcome 1 also has a departmental capital budget of $2.022 million in 2013-143 Departmental Appropriation combines "Ordinary annual services (Appropriation Act No. 1 and
Bill No. 3)" and "Revenue from independent sources (s31)".4 Expenses not requiring appropriation in the Budget year is made up of depreciation and
amortisation expense, make good expense, other gains, w rite-dow n of assets, liability for
buy-back of free permits and surrender of carbon credits.
Outcome 1: Contribute to a reduction in Australia's net greenhouse
gas emissions, including through the administration of a carbon
price on liable emissions intensive businesses and other entities;
promoting additional renew able electricity generation; and land-
based initiatives that support carbon abatement.

Agency Additional Estimates Statements — Clean Energy Regulator
102
Program 1.1 Objective
No changes have occurred to the program objectives since the 2013-14 Portfolio Budget
Statements.
Program 1.1 Expenses 2012-13 2013-14 2014-15 2015-16 2016-17
Actual Revised Forw ard Forw ard Forw ard
budget year 1 year 2 year 3
$'000 $'000 $'000 $'000 $'000
Annual administered expenses:
Administered item 4,270 3,745 3,817 3,817 3,817
Special Appropriations: `
Clean Energy Act 2011 1 704,029 3,466,479 - -
Renewable Energy (Electricity) Act 2000 - 1,605 2,588 2,947 2,617
Program support 79,228 81,698 77,166 74,310 73,525
Expenses not requiring appropriation in
the Budget year2 249,834 82,724 12,751 14,184 14,220
Total program expenses 1,037,361 3,636,251 96,322 95,258 94,1791 Estimates have been developed in consultation w ith Treasury.2 Expenses not requiring appropriation in the Budget year is made up of depreciation and
amortisation expense, make good expense, other gains, w rite-dow n of assets, liability for
buy-back of free permits and surrender of carbon credits.
Program 1.1 Deliverables
No changes have occurred to the program deliverables since the 2013-14 Portfolio
Budget Statements.
Program 1.1 Key Performance Indicators
No changes have occurred to the program key performance indicators since the
2013-14 Portfolio Budget Statements.
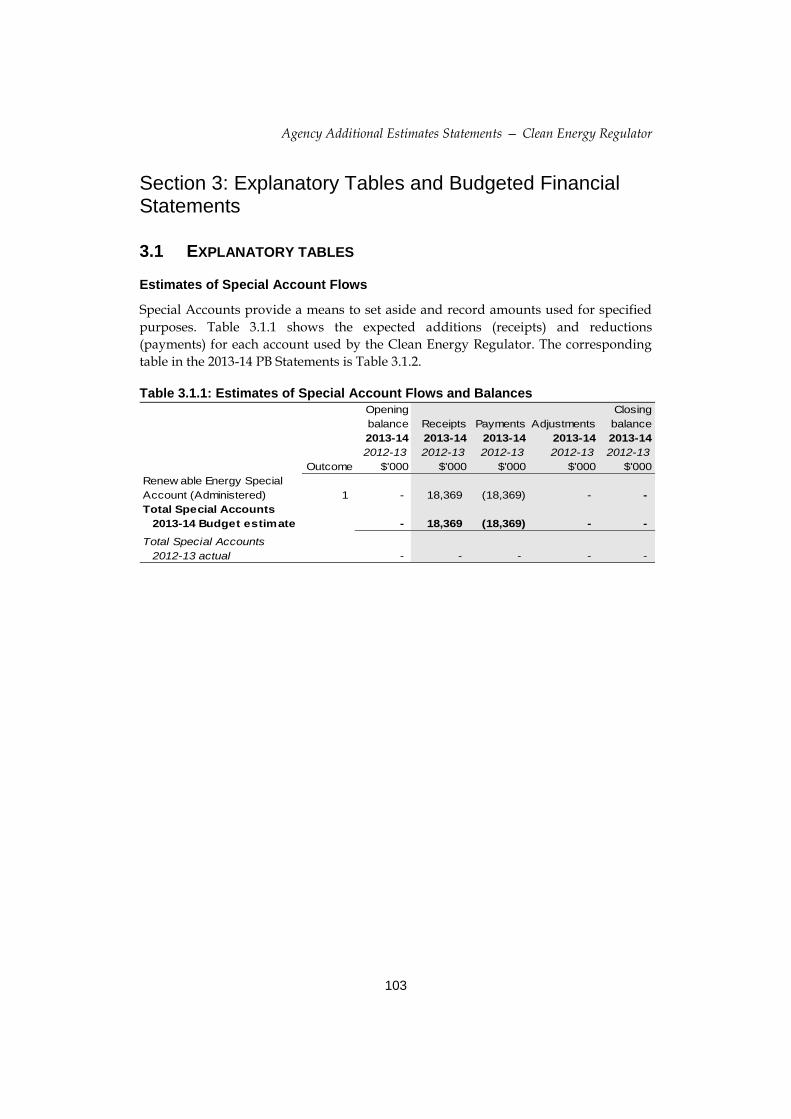
Agency Additional Estimates Statements — Clean Energy Regulator
103
Section 3: Explanatory Tables and Budgeted Financial Statements
3.1 EXPLANATORY TABLES
Estimates of Special Account Flows
Special Accounts provide a means to set aside and record amounts used for specified
purposes. Table 3.1.1 shows the expected additions (receipts) and reductions
(payments) for each account used by the Clean Energy Regulator. The corresponding
table in the 2013-14 PB Statements is Table 3.1.2.
Table 3.1.1: Estimates of Special Account Flows and Balances
Opening Closing
balance Receipts Payments Adjustments balance
2013-14 2013-14 2013-14 2013-14 2013-14
2012-13 2012-13 2012-13 2012-13 2012-13
Outcome $'000 $'000 $'000 $'000 $'000
Renew able Energy Special
Account (Administered) 1 - 18,369 (18,369) - -
Total Special Accounts
2013-14 Budget estimate - 18,369 (18,369) - -
Total Special Accounts
2012-13 actual - - - - -

Agency Additional Estimates Statements — Clean Energy Regulator
104
3.2 BUDGETED FINANCIAL STATEMENTS
3.2.1 Analysis of Budgeted Financial Statements
The Clean Energy Regulator is budgeting to incur expenses of $98.8 million in 2013-14.
The Clean Energy Regulator is budgeting for a break-even position in 2013-14
excluding non-appropriated expenses relating to depreciation and amortisation.
3.2.2 Budgeted Financial Statements
Departmental Financial Statements
Table 3.2.1: Comprehensive Income Statement (Showing Net Cost of Services)
for the period ended 30 June
Actual Revised Forw ard Forw ard Forw ard
budget estimate estimate estimate
2012-13 2013-14 2014-15 2015-16 2016-17
$'000 $'000 $'000 $'000 $'000
EXPENSES
Employee benefits 40,679 44,265 43,100 42,694 42,242
Suppliers 38,752 37,433 34,066 31,616 31,283
Depreciation and amortisation 13,030 17,059 12,751 14,184 14,220
Finance costs 30 - - - -
Write-dow n and impairment of assets 2,524 - - - -
Losses from asset sales 123 - - - -
Total expenses 95,138 98,757 89,917 88,494 87,745
LESS:
OWN-SOURCE INCOME
Own-source revenue
Sale of goods and rendering of services 429 345 - - -
Total own-source revenue 429 345 - - -
Gains
Other gains 1,181 - - - -
Total gains 1,181 - - - -
Total own-source income 1,610 345 - - -
Net cost of (contribution by)
services 93,528 98,412 89,917 88,494 87,745
Revenue from Government 78,799 81,353 77,166 74,310 73,525
Surplus (Deficit) (14,729) (17,059) (12,751) (14,184) (14,220)
OTHER COMPREHENSIVE INCOME
Items not subject to subsequent
reclassification to profit or loss
Changes in asset revaluation surplus 3,581 - - - -
Total other comprehensive income 3,581 - - - -
Total comprehensive income (loss) (11,148) (17,059) (12,751) (14,184) (14,220)

Agency Additional Estimates Statements — Clean Energy Regulator
105
Table 3.2.1: Comprehensive Income Statement (Showing Net Cost of Services)
Note: Impact of Net Cash Appropriation Arrangements
2012-13 2013-14 2014-15 2015-16 2016-17
$'000 $'000 $'000 $'000 $'000
Total Comprehensive Income
(loss) excluding depreciation/
amortisation expenses
previously funded through
revenue appropriations 1,882 - - - -
less depreciation/amortisation expenses
previously funded through revenue
appropriations1 13,030 17,059 12,751 14,184 14,220
Total Comprehensive Income
(loss) - as per the Statement of
Comprehensive Income (11,148) (17,059) (12,751) (14,184) (14,220)
Prepared on Australian Accounting Standards basis.1 From 2010-11, the Government introduced net cash appropriation arrangements w here
Appropriation Act No. 1 or Bill No. 3 revenue appropriations for the depreciation/amortisation
expenses of FMA Act agencies w ere replaced w ith a separate capital budget (the Departmental
Capital Budget, or DCB) provided through Appropriation Act No. 1 or Bill No. 3 equity
appropriations. For information regarding DCBs, please refer to Table 3.2.5 Departmental Capital
Budget Statement.
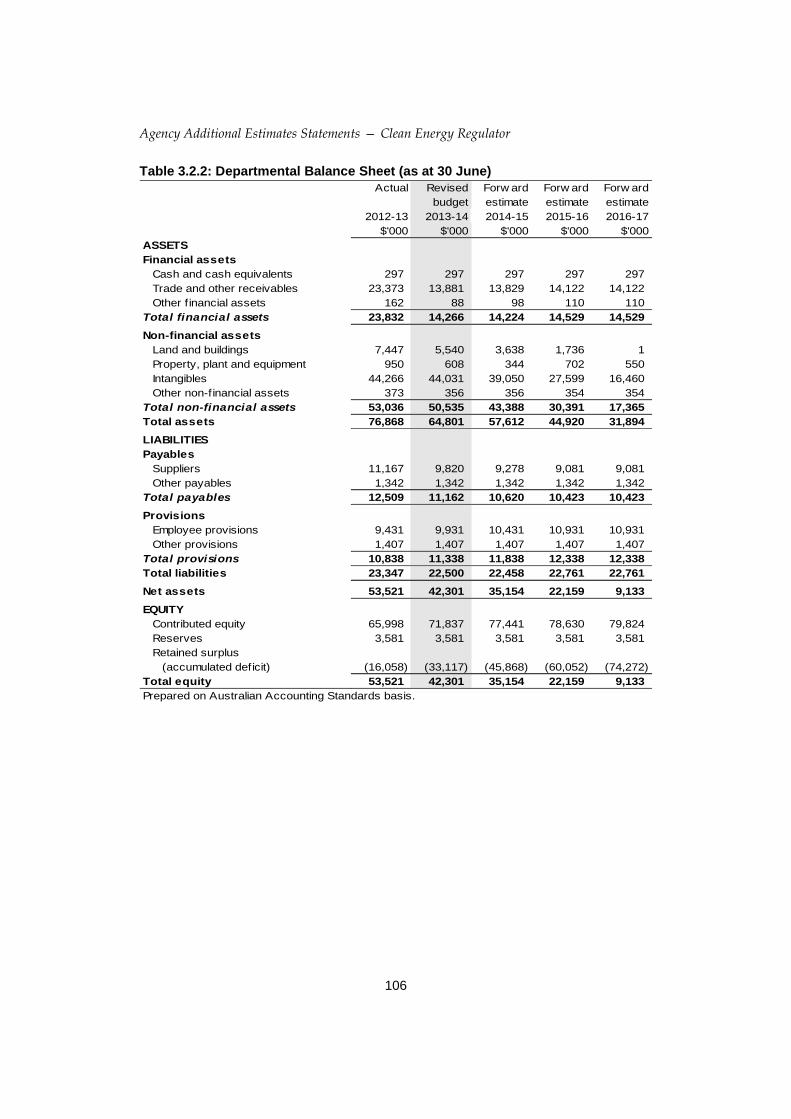
Agency Additional Estimates Statements — Clean Energy Regulator
106
Table 3.2.2: Departmental Balance Sheet (as at 30 June)
Actual Revised Forw ard Forw ard Forw ard
budget estimate estimate estimate
2012-13 2013-14 2014-15 2015-16 2016-17
$'000 $'000 $'000 $'000 $'000
ASSETS
Financial assets
Cash and cash equivalents 297 297 297 297 297
Trade and other receivables 23,373 13,881 13,829 14,122 14,122
Other f inancial assets 162 88 98 110 110
Total financial assets 23,832 14,266 14,224 14,529 14,529
Non-financial assets
Land and buildings 7,447 5,540 3,638 1,736 1
Property, plant and equipment 950 608 344 702 550
Intangibles 44,266 44,031 39,050 27,599 16,460
Other non-financial assets 373 356 356 354 354
Total non-financial assets 53,036 50,535 43,388 30,391 17,365
Total assets 76,868 64,801 57,612 44,920 31,894
LIABILITIES
Payables
Suppliers 11,167 9,820 9,278 9,081 9,081
Other payables 1,342 1,342 1,342 1,342 1,342
Total payables 12,509 11,162 10,620 10,423 10,423
Provisions
Employee provisions 9,431 9,931 10,431 10,931 10,931
Other provisions 1,407 1,407 1,407 1,407 1,407
Total provisions 10,838 11,338 11,838 12,338 12,338
Total liabilities 23,347 22,500 22,458 22,761 22,761
Net assets 53,521 42,301 35,154 22,159 9,133
EQUITY
Contributed equity 65,998 71,837 77,441 78,630 79,824
Reserves 3,581 3,581 3,581 3,581 3,581
Retained surplus
(accumulated deficit) (16,058) (33,117) (45,868) (60,052) (74,272)
Total equity 53,521 42,301 35,154 22,159 9,133
Prepared on Australian Accounting Standards basis.
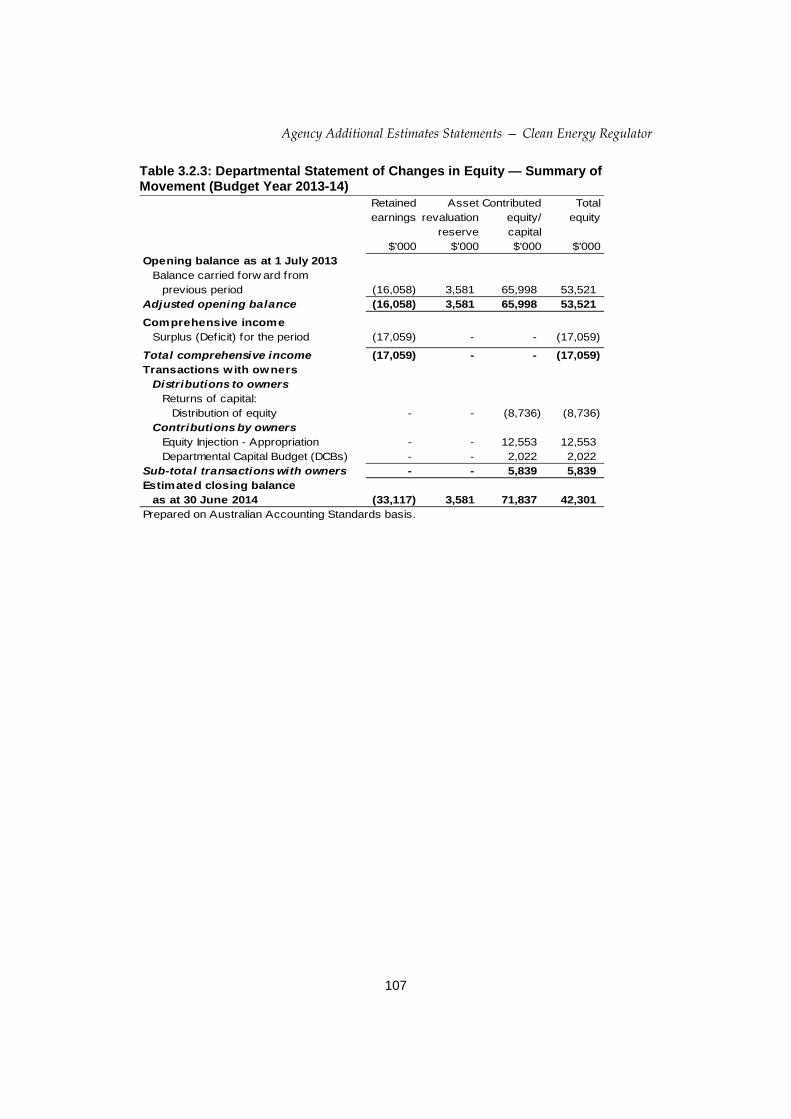
Agency Additional Estimates Statements — Clean Energy Regulator
107
Table 3.2.3: Departmental Statement of Changes in Equity — Summary of Movement (Budget Year 2013-14)
Retained Asset Contributed Total
earnings revaluation equity/ equity
reserve capital
$'000 $'000 $'000 $'000
Opening balance as at 1 July 2013
Balance carried forw ard from
previous period (16,058) 3,581 65,998 53,521
Adjusted opening balance (16,058) 3,581 65,998 53,521
Comprehensive income
Surplus (Deficit) for the period (17,059) - - (17,059)
Total comprehensive income (17,059) - - (17,059)
Transactions with owners
Distributions to owners
Returns of capital:
Distribution of equity - - (8,736) (8,736)
Contributions by owners
Equity Injection - Appropriation - - 12,553 12,553
Departmental Capital Budget (DCBs) - - 2,022 2,022
Sub-total transactions with owners - - 5,839 5,839
Estimated closing balance
as at 30 June 2014 (33,117) 3,581 71,837 42,301
Prepared on Australian Accounting Standards basis.
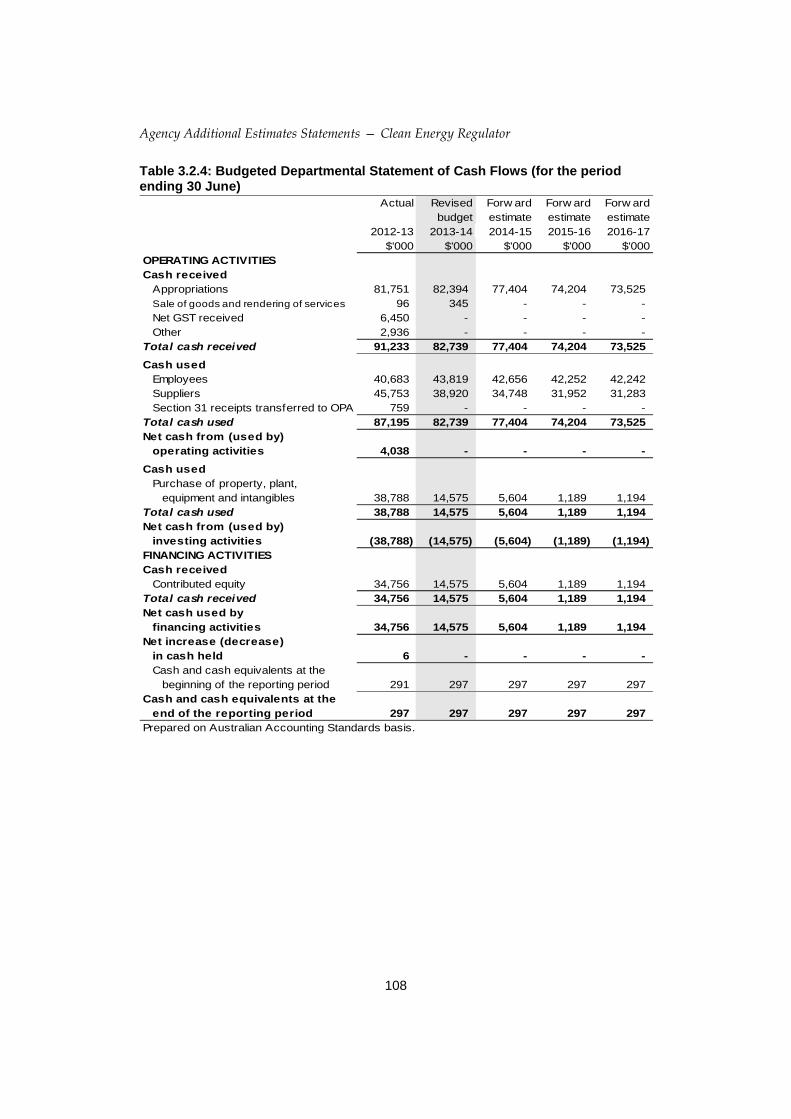
Agency Additional Estimates Statements — Clean Energy Regulator
108
Table 3.2.4: Budgeted Departmental Statement of Cash Flows (for the period ending 30 June)
Actual Revised Forw ard Forw ard Forw ard
budget estimate estimate estimate
2012-13 2013-14 2014-15 2015-16 2016-17
$'000 $'000 $'000 $'000 $'000
OPERATING ACTIVITIES
Cash received
Appropriations 81,751 82,394 77,404 74,204 73,525
Sale of goods and rendering of services 96 345 - - -
Net GST received 6,450 - - - -
Other 2,936 - - - -
Total cash received 91,233 82,739 77,404 74,204 73,525
Cash used
Employees 40,683 43,819 42,656 42,252 42,242
Suppliers 45,753 38,920 34,748 31,952 31,283
Section 31 receipts transferred to OPA 759 - - - -
Total cash used 87,195 82,739 77,404 74,204 73,525
Net cash from (used by)
operating activities 4,038 - - - -
Cash used
Purchase of property, plant,
equipment and intangibles 38,788 14,575 5,604 1,189 1,194
Total cash used 38,788 14,575 5,604 1,189 1,194
Net cash from (used by)
investing activities (38,788) (14,575) (5,604) (1,189) (1,194)
FINANCING ACTIVITIES
Cash received
Contributed equity 34,756 14,575 5,604 1,189 1,194
Total cash received 34,756 14,575 5,604 1,189 1,194
Net cash used by
financing activities 34,756 14,575 5,604 1,189 1,194
Net increase (decrease)
in cash held 6 - - - -
Cash and cash equivalents at the
beginning of the reporting period 291 297 297 297 297
Cash and cash equivalents at the
end of the reporting period 297 297 297 297 297
Prepared on Australian Accounting Standards basis.
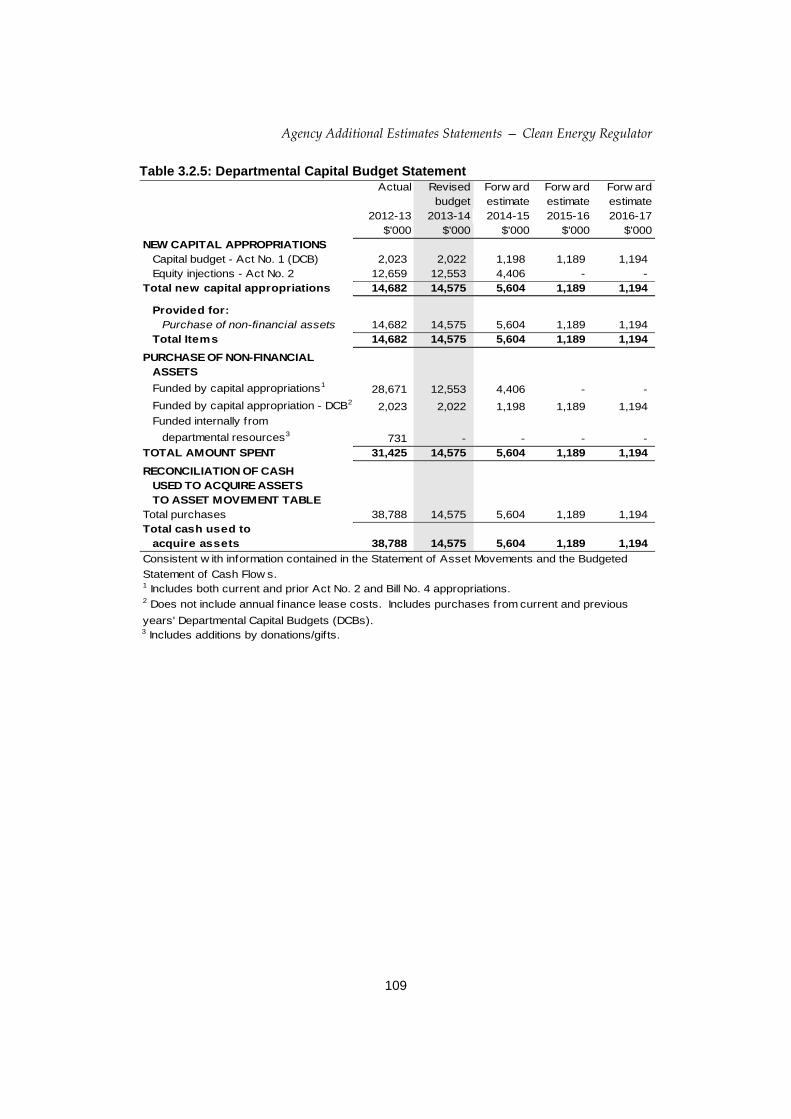
Agency Additional Estimates Statements — Clean Energy Regulator
109
Table 3.2.5: Departmental Capital Budget Statement Actual Revised Forw ard Forw ard Forw ard
budget estimate estimate estimate
2012-13 2013-14 2014-15 2015-16 2016-17
$'000 $'000 $'000 $'000 $'000
NEW CAPITAL APPROPRIATIONS
Capital budget - Act No. 1 (DCB) 2,023 2,022 1,198 1,189 1,194
Equity injections - Act No. 2 12,659 12,553 4,406 - -
Total new capital appropriations 14,682 14,575 5,604 1,189 1,194
Provided for:
Purchase of non-financial assets 14,682 14,575 5,604 1,189 1,194
Total Items 14,682 14,575 5,604 1,189 1,194
PURCHASE OF NON-FINANCIAL
ASSETS
Funded by capital appropriations128,671 12,553 4,406 - -
Funded by capital appropriation - DCB22,023 2,022 1,198 1,189 1,194
Funded internally from
departmental resources3731 - - - -
TOTAL AMOUNT SPENT 31,425 14,575 5,604 1,189 1,194
RECONCILIATION OF CASH
USED TO ACQUIRE ASSETS
TO ASSET MOVEMENT TABLE
Total purchases 38,788 14,575 5,604 1,189 1,194
Total cash used to
acquire assets 38,788 14,575 5,604 1,189 1,194
Consistent w ith information contained in the Statement of Asset Movements and the Budgeted
Statement of Cash Flow s.1 Includes both current and prior Act No. 2 and Bill No. 4 appropriations.2 Does not include annual f inance lease costs. Includes purchases from current and previous
years' Departmental Capital Budgets (DCBs).3 Includes additions by donations/gifts.
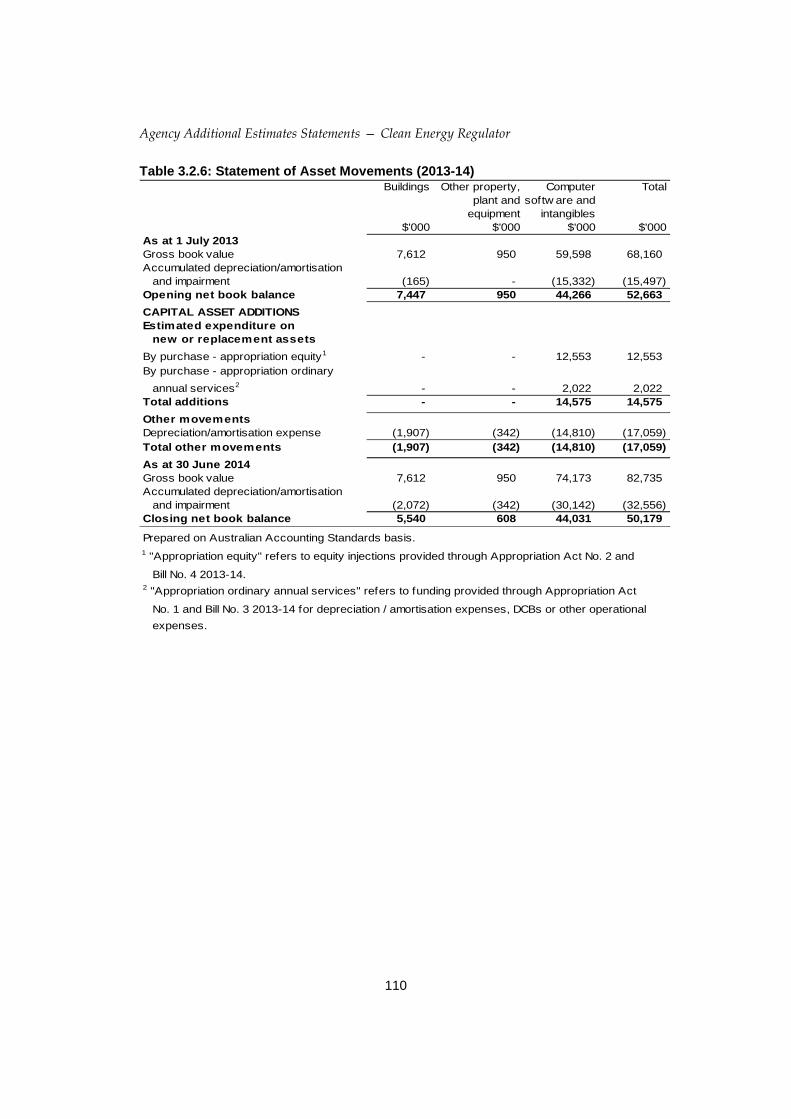
Agency Additional Estimates Statements — Clean Energy Regulator
110
Table 3.2.6: Statement of Asset Movements (2013-14) Buildings Other property, Computer Total
plant and softw are and
equipment intangibles
$'000 $'000 $'000 $'000
As at 1 July 2013
Gross book value 7,612 950 59,598 68,160
Accumulated depreciation/amortisation
and impairment (165) - (15,332) (15,497)
Opening net book balance 7,447 950 44,266 52,663-
CAPITAL ASSET ADDITIONS
Estimated expenditure on
new or replacement assets
By purchase - appropriation equity1 - - 12,553 12,553
By purchase - appropriation ordinary
annual services2 - - 2,022 2,022
Total additions - - 14,575 14,575
Other movements
Depreciation/amortisation expense (1,907) (342) (14,810) (17,059)
Total other movements (1,907) (342) (14,810) (17,059)
As at 30 June 2014
Gross book value 7,612 950 74,173 82,735
Accumulated depreciation/amortisation
and impairment (2,072) (342) (30,142) (32,556)
Closing net book balance 5,540 608 44,031 50,179
Prepared on Australian Accounting Standards basis.
1 "Appropriation equity" refers to equity injections provided through Appropriation Act No. 2 and
Bill No. 4 2013-14.2 "Appropriation ordinary annual services" refers to funding provided through Appropriation Act
No. 1 and Bill No. 3 2013-14 for depreciation / amortisation expenses, DCBs or other operational
expenses.
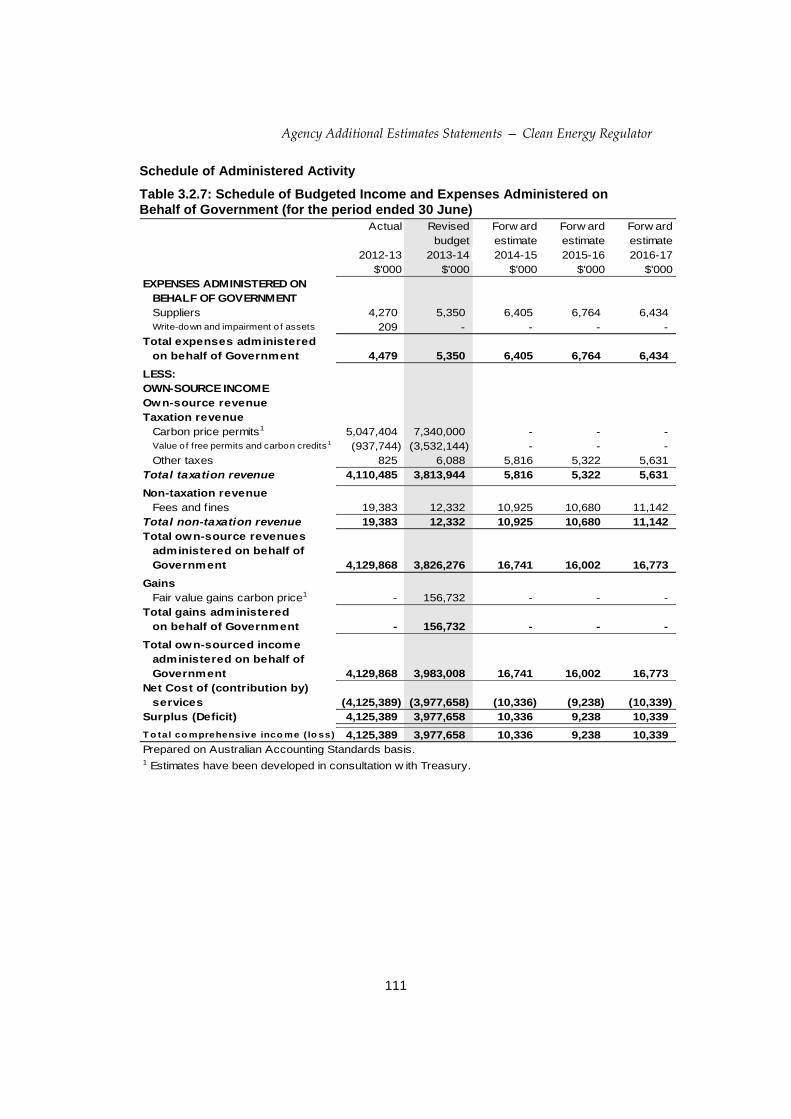
Agency Additional Estimates Statements — Clean Energy Regulator
111
Schedule of Administered Activity
Table 3.2.7: Schedule of Budgeted Income and Expenses Administered on Behalf of Government (for the period ended 30 June)
Actual Revised Forw ard Forw ard Forw ard
budget estimate estimate estimate
2012-13 2013-14 2014-15 2015-16 2016-17
$'000 $'000 $'000 $'000 $'000
EXPENSES ADMINISTERED ON
BEHALF OF GOVERNMENT
Suppliers 4,270 5,350 6,405 6,764 6,434
Write-down and impairment o f assets 209 - - - -
Total expenses administered
on behalf of Government 4,479 5,350 6,405 6,764 6,434
LESS:
OWN-SOURCE INCOME
Own-source revenue
Taxation revenue
Carbon price permits1 5,047,404 7,340,000 - - -
Value of free permits and carbon credits1 (937,744) (3,532,144) - - -
Other taxes 825 6,088 5,816 5,322 5,631
Total taxation revenue 4,110,485 3,813,944 5,816 5,322 5,631
Non-taxation revenue
Fees and fines 19,383 12,332 10,925 10,680 11,142
Total non-taxation revenue 19,383 12,332 10,925 10,680 11,142
Total own-source revenues
administered on behalf of
Government 4,129,868 3,826,276 16,741 16,002 16,773
Gains
Fair value gains carbon price1 - 156,732 - - -
Total gains administered
on behalf of Government - 156,732 - - -
Total own-sourced income
administered on behalf of
Government 4,129,868 3,983,008 16,741 16,002 16,773
Net Cost of (contribution by)
services (4,125,389) (3,977,658) (10,336) (9,238) (10,339)
Surplus (Deficit) 4,125,389 3,977,658 10,336 9,238 10,339
T o tal co mprehensive inco me ( lo ss) 4,125,389 3,977,658 10,336 9,238 10,339
Prepared on Australian Accounting Standards basis.1 Estimates have been developed in consultation w ith Treasury.
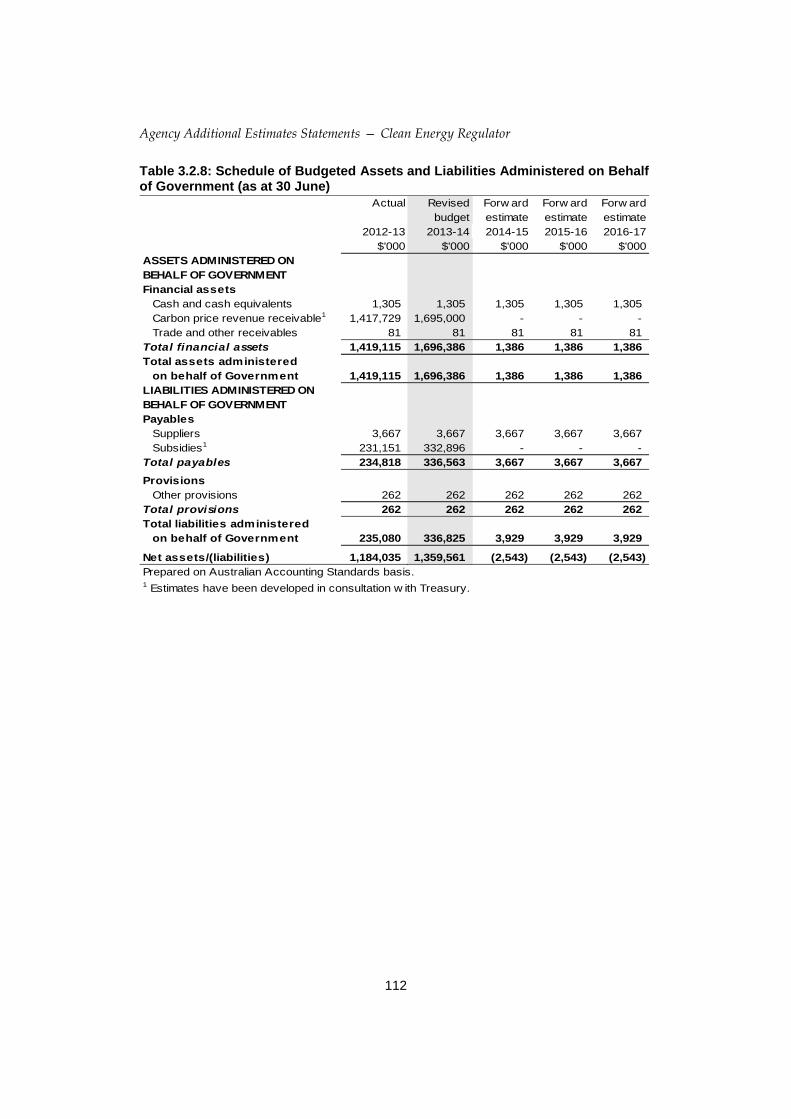
Agency Additional Estimates Statements — Clean Energy Regulator
112
Table 3.2.8: Schedule of Budgeted Assets and Liabilities Administered on Behalf of Government (as at 30 June)
Actual Revised Forw ard Forw ard Forw ard
budget estimate estimate estimate
2012-13 2013-14 2014-15 2015-16 2016-17
$'000 $'000 $'000 $'000 $'000
ASSETS ADMINISTERED ON
BEHALF OF GOVERNMENT
Financial assets
Cash and cash equivalents 1,305 1,305 1,305 1,305 1,305
Carbon price revenue receivable1 1,417,729 1,695,000 - - -
Trade and other receivables 81 81 81 81 81
Total financial assets 1,419,115 1,696,386 1,386 1,386 1,386
Total assets administered
on behalf of Government 1,419,115 1,696,386 1,386 1,386 1,386
LIABILITIES ADMINISTERED ON
BEHALF OF GOVERNMENT
Payables
Suppliers 3,667 3,667 3,667 3,667 3,667
Subsidies1 231,151 332,896 - - -
Total payables 234,818 336,563 3,667 3,667 3,667
Provisions
Other provisions 262 262 262 262 262
Total provisions 262 262 262 262 262
Total liabilities administered
on behalf of Government 235,080 336,825 3,929 3,929 3,929
Net assets/(liabilities) 1,184,035 1,359,561 (2,543) (2,543) (2,543)
Prepared on Australian Accounting Standards basis.1 Estimates have been developed in consultation w ith Treasury.
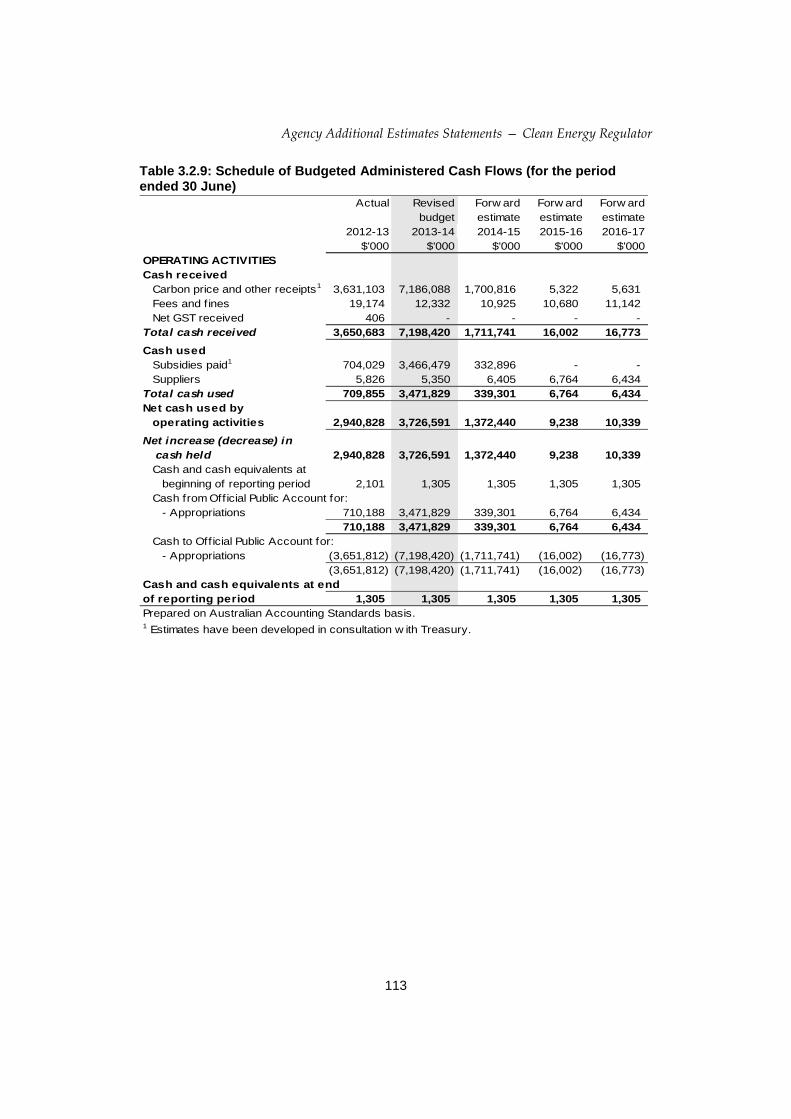
Agency Additional Estimates Statements — Clean Energy Regulator
113
Table 3.2.9: Schedule of Budgeted Administered Cash Flows (for the period ended 30 June)
Actual Revised Forw ard Forw ard Forw ard
budget estimate estimate estimate
2012-13 2013-14 2014-15 2015-16 2016-17
$'000 $'000 $'000 $'000 $'000
OPERATING ACTIVITIES
Cash received
Carbon price and other receipts1 3,631,103 7,186,088 1,700,816 5,322 5,631
Fees and fines 19,174 12,332 10,925 10,680 11,142
Net GST received 406 - - - -
Total cash received 3,650,683 7,198,420 1,711,741 16,002 16,773
Cash used
Subsidies paid1 704,029 3,466,479 332,896 - -
Suppliers 5,826 5,350 6,405 6,764 6,434
Total cash used 709,855 3,471,829 339,301 6,764 6,434
Net cash used by
operating activities 2,940,828 3,726,591 1,372,440 9,238 10,339
Net increase (decrease) in
cash held 2,940,828 3,726,591 1,372,440 9,238 10,339
Cash and cash equivalents at
beginning of reporting period 2,101 1,305 1,305 1,305 1,305
Cash from Official Public Account for:
- Appropriations 710,188 3,471,829 339,301 6,764 6,434
710,188 3,471,829 339,301 6,764 6,434
Cash to Official Public Account for:
- Appropriations (3,651,812) (7,198,420) (1,711,741) (16,002) (16,773)
(3,651,812) (7,198,420) (1,711,741) (16,002) (16,773)
Cash and cash equivalents at end
of reporting period 1,305 1,305 1,305 1,305 1,305
Prepared on Australian Accounting Standards basis.1 Estimates have been developed in consultation w ith Treasury.
Agency Additional Estimates Statements — Clean Energy Regulator
114
Notes to the Financial Statements
The statements have been prepared in accordance with:
Finance Minister’s Orders (FMOs), being the Financial Management and
Accountability Orders;
Australian Equivalents of International Financial Reporting Standards (AEIFRS)
issued by the Australian Accounting Standards Board (AASB) that apply for the
reporting period; and
interpretations issued by the AASB and Urgent Issues Group (UIG) that apply
for the reporting period.
The statements have been prepared on an accrual basis and are in accordance with
historical cost principles except for certain assets, which, as noted, are at valuation.
Departmental
Income
Income includes the following items:
Revenues from Government—amounts appropriated to the Agency.
Goods and Services—revenue is recognised upon the delivery of goods and
services to customers.
Expenses
All expenses are recognised on an accrual basis, as and when these can be reliably
estimated.
Assets
Land, buildings, plant and equipment are carried at their fair value.
Non-current assets are reviewed at balance date for internal and external indications of
impairment. Where indications of impairment are identified for an asset, its
recoverable amount is determined and where lower than its carrying amount, written
down to that amount.
The Department’s intangible assets comprise the acquisition of software configured for
internal use and internally developed software. These assets are carried at cost less
accumulated amortisation and accumulated impairment losses.

Agency Additional Estimates Statements — Clean Energy Regulator
115
Liabilities
Liabilities for services rendered by employees are recognised at the reporting date to
the extent that they have not been settled. The liability for employee benefits includes
provision for annual leave and long service leave.
Liabilities for ‘short-term employee benefits’ (as defined in AASB 119) and termination
benefits due within twelve months of balance date are measured at their nominal
amounts. The nominal amount is calculated with regard to the rates expected to be
paid on settlement of the liability. All other employee benefit liabilities are measured
as the present value of the estimated future cash outflows to be made in respect of
services provided by employees up to the reporting date.
Trade creditors and accruals are recognised at their nominal amounts, being the
amounts at which the liabilities will be settled which represent their fair value.
Liabilities are recognised to the extent that the goods or services have been received
(and irrespective of having been invoiced).
Administered
Administered items are accounted for on the same basis and using the same policies as
for departmental items, including the application of Australian Accounting Standards.