Embed Size (px)
Citation preview

PORTFOLIO ADDITIONAL ESTIMATES STATEMENTS 2008-09
DEFENCE PORTFOLIO
EXPLANATIONS OF ADDITIONAL ESTIMATES 2008-09

© Commonwealth of Australia 2008
ISBN 978-0-642-29693-1
This work is copyright. Apart from any use as permitted under the Copyright Act 1968, no part may be reproduced by any process without prior written permission from the Commonwealth. Requests and inquiries concerning reproduction and rights should be addressed to the:
Commonwealth Copyright Administration Attorney-General’s Department Robert Garran Offices National Circuit BARTON ACT 2600
Or posted at Website: www.ag.gov.au/cca
Printed by: Blue Star Print

THE MINISTER FOR DEFENCE THE HON JOEL FITZGIBBON MP
28 NOV 1008 President of the Senate Australian Senate Parliament House CANBERRA ACT 2600
Speaker House of Representatives Parliament House CANBERRA ACT 2600
Dear Mr President and Mr Speaker
I hereby submit Portfolio Additional Estimates Statements in support of the 2008-09 Additional Estimates for the Department of Defence, the Defence Materiel Organisation and Defence Housing Australia.
These statements have been developed, and are submitted to the Parliament, as a statement on the funding requirements being sought for the Defence Portfolio.
I present these statements by virtue of my ministerial responsibility for accountability to the Parliament and, through it, the public.
Yours sincerely
~ON


TABLE OF CONTENTS
User Guide ....................................................................................................................ix Structure of the Portfolio Additional Estimates Statements .................................... xii
Portfolio Overview.....................................................................................................xvii
PART ONE – DEPARTMENT OF DEFENCE
Section One – Defence overview and resources Chapter One - Overview .........................................................................................5 Overview ...................................................................................................................7 Strategic direction .....................................................................................................7 Overview of the 2008-09 Additional Estimates .........................................................7 Organisational structure..........................................................................................11
Chapter Two - Resourcing ...................................................................................13 Defence resourcing.................................................................................................15 Defence resourcing statement ................................................................................17 Funding from Government ......................................................................................19 Funding from other sources ....................................................................................23 Funding for operations ............................................................................................24 Appropriations .........................................................................................................27 Payments to Defence Materiel Organisation ..........................................................28 Payments to Defence Housing Australia ................................................................29
Chapter Three – Defence Reform........................................................................31
Chapter Four – Capital Investment Program .....................................................33 Overview .................................................................................................................35 Defence Capability Plan..........................................................................................36 The Approved Major Capital Investment Program..................................................36 Capital facilities projects .........................................................................................37 Other investments...................................................................................................49 Capital receipts .......................................................................................................49
Chapter Five - People ...........................................................................................51 Workforce overview ................................................................................................53 Workforce summary................................................................................................53
v
Section Two – Outcomes and planned performance Chapter Six – Planned Outcome Performance ..................................................59 Outcomes and performance information ................................................................61 Output descriptions .................................................................................................61 Outcome One – Australia’s national interests are protected and advanced through the provision of military capabilities and the promotion of security and stability ....64
Output Group 1.1 – Office of the Secretary and CDF................................................... 66 Output Group 1.2 – Navy capabilities........................................................................... 67 Output Group 1.3 – Army capabilities........................................................................... 69 Output Group 1.4 – Air Force capabilities .................................................................... 70 Output Group 1.5 – Intelligence capabilities................................................................. 71 Output Group 1.6 – Defence Support.......................................................................... 72 Output Group 1.7 – Defence Science and Technology ................................................ 73 Output Group 1.8 – Chief Information Officer............................................................... 74 Output Group 1.9 – Vice Chief of the Defence Force................................................... 75 Output Group 1.10 – Joint Operations Command ........................................................ 76 Output Group 1.11 – Capability Development.............................................................. 77 Output Group 1.12 – Chief Finance Officer .................................................................. 78 Output Group 1.13 – People Strategies and Policy...................................................... 79 Output Group 1.14 – Superannuation and Housing Support Services for Current and Retired Defence Personnel and other Administered Items........................................... 80
Outcome Two – Military operations and other tasks directed by the Government to achieve the desired results .....................................................................................81
Resource statement ..................................................................................................... 81 Output Group 2.1 – Operations contributing to the security of the immediate neighbourhood ............................................................................................................. 82 Output Group 2.2 – Operations supporting wider interests .......................................... 83
Outcome Three – Defence’s support to the Australian community and civilian authorities to achieve the desired results ...............................................................84
Resource statement ..................................................................................................... 84 Output Group 3.1 – Defence contribution to National Support Tasks in Australia ........ 85
Section Three – Explanatory Tables and Financial Statements Chapter Seven – Explanatory Tables and Budgeted Financial Statements ...89 Explanatory Tables .................................................................................................91 Australian Government Indigenous expenditure.....................................................92 Discretionary Grants ...............................................................................................93 Budgeted Financial Statements ..............................................................................94 Analysis of Departmental budgeted financial statements.......................................94 2008-09 Departmental budgeted financial statement...........................................100 Analysis of administered activity ...........................................................................106 2008-09 schedule of administered activity............................................................107 Notes to the budgeted financial statements..........................................................110
vi

PART TWO – DEFENCE MATERIEL ORGANISATION
Section One – Defence Materiel Organisation overview and resources Chapter One – Defence Materiel Organisation overview................................123 Overview ...............................................................................................................125 Overview of the 2008-09 Budget ..........................................................................125 Organisational structure........................................................................................125
Chapter Two – Defence Materiel Organisation resourcing ............................127 Resourcing for 2008-09 ........................................................................................129
Chapter Three – Management reforms and governance ................................133 Governing the DMO ..............................................................................................135
Chapter Four – Defence Materiel Organisation people...................................137
Section Two – Defence Materiel Organisation outcomes and planned performance
Chapter Five – Planned outcome performance ...............................................143 Outcome and Performance Information................................................................145 Summary of outcome and contribution to outcome ..............................................145 Performance and evaluation information for the DMO outcome ..........................146
Section Three – Defence Materiel Organisation explanatory tables and financial statements
Chapter Six – Explanatory tables ......................................................................175 Explanatory Tables ...............................................................................................177 Estimates of variations to Average Staffing Level ................................................178
Chapter Seven – Budgeted financial statements ............................................179 Analysis of budgeted financial statements............................................................181 Notes to the budgeted financial statements..........................................................186
PART THREE – DEFENCE HOUSING AUSTRALIA Overview ...............................................................................................................188 Budgeted financial statements..............................................................................188
vii

viii

USER GUIDE TO THE
PORTFOLIO ADDITIONAL ESTIMATES STATEMENTS


User Guide
USER GUIDE
The purpose of the Portfolio Additional Estimates Statements (PAES), like that of the Portfolio Budget Statements, is to inform Senators and Members of Parliament and the public of the proposed allocation of resources to Government outcomes by agencies within the portfolio. However, unlike the Portfolio Budget Statements, the PAES summarise only the changes in resourcing by outcome since the Budget, that is, they update the resourcing for the agency. The PAES include for the first time an Agency Resource Statement, in addition to the information on new measures and the Appropriation Bills.
The PAES facilitate understanding of the proposed appropriations in Appropriation Bills (No. 3 and No. 4) 2008-09. In this sense the PAES is declared by the Additional Estimates Appropriation Bills to be a ‘relevant document’ to the interpretation of the Bills according to section 15AB of the Acts Interpretation Act 1901.
Whereas the Mid-Year Economic and Fiscal Outlook 2008-09 is a mid-year budget report which provides updated information to allow the assessment of the Government’s fiscal performance against its fiscal strategy, the PAES update the most recent budget appropriations for agencies within the portfolio.
xi

User Guide
STRUCTURE OF THE PORTFOLIO ADDITIONAL ESTIMATES STATEMENTS
The PAES are presented in three parts with subsections.
Chapter One Overview Chapter One provides an update of Defence’s budget, Defence’s strategic objectives and environment, and Defence’s organisational structure.
Chapter Two Resourcing Chapter Two provides an update of Defence’s finances for 2008 09, including a revision of Defence’s budget and measures, and an update of Defence’s purchaser provider arrangements.
Chapter Three Defence Reform Chapter Three provides an update of the implementation of internal reforms and efficiencies.
Chapter Four Capital Investment Chapter Four provides an update of Defence’s capital budget Program including medium and major capital facilities projects, other capital
purchases and capital receipts.
Chapter Five People Chapter Five provides an update on Defence’s personnel initiatives and workforce summary.
Chapter Six Planned Outcome Chapter Six provides an update of the cost and performance targets Performance for Defence’s outcomes and outputs.
Chapter Seven Explanatory Tables Chapter Seven provides an update of Defence’s budgeted financial and Budgeted Financial Statements statements.
PART TWO: DEFENCE MATERIEL ORGANISATION
Chapter One Overview The overview provides an update of the Defence Materiel Organisation’s (DMO) challenges and opportunities, and structure.
Chapter Two Resourcing The resourcing chapter provides an update on the DMO’s appropriations, cost recovery arrangements and purchaser provider arrangements.
Chapter Three Management Reforms This chapter provides an update of the DMO’s reforms. and Governance
Chapter Four People This chapter provides an update of the DMO’s personnel initiatives and the organisation’s workforce overview.
Chapter Five Planned Outcome This chapter provides an update of the DMO’s outcome and outputs, Performance planned performance targets and planned evaluations.
Chapter Six Explanatory Tables This chapter provides an update of the DMO’s budgeted financial statements.
PART THREE: DEFENCE HOUSING AUSTRALIA
This section provides an update of Defence Housing Australia’s performance forecasts, outcome and output information, and budgeted financial statements.
APPENDIX
A list of tables and figures, a glossary and a list of acronyms and abbreviations.
xii

User Guide
STYLES AND CONVENTIONS
(a) The following notations may be used:
NEC/nec not elsewhere classified
AEST Australian Eastern Standard Time
- nil
.. not zero, but rounded to zero
na not applicable (unless otherwise specified)
nfp not for publication
$m $ million
(b) Figures in tables and in the text may be rounded. Discrepancies in tables between totals and sums of components are due to rounding.
INQUIRIES
Should you have any inquiries regarding this publication please contact
Director Ministerial and Parliamentary Reporting R1-5-A036 Department of Defence CANBERRA ACT 2600
Telephone: (02) 6265 6277 Email: [email protected]
A copy of this document can be located on the Australian Government Budget website at www.budget.gov.au and the Defence website at www.defence.gov.au/budget.
REFERENCES
Previous years’ Defence Portfolio Budget Statements, Portfolio Additional Estimates Statements and Annual Reports can be found at www.defence.gov.au/budget.
xiii


PORTFOLIO OVERVIEW


Portfolio Overview
PORTFOLIO OVERVIEW
The Department of Defence’s portfolio structure and outcomes remain as reported in the Portfolio Budget Statements 2008-09.
xvii

PART ONE
DEPARTMENT OF DEFENCE


SECTION ONE
DEFENCE OVERVIEW AND RESOURCES


CHAPTER ONE —OVERVIEW
OVERVIEW
STRATEGIC DIRECTION
OVERVIEW OF THE 2008-09 ADDITIONAL ESTIMATES
ORGANISATIONAL STRUCTURE

Chapter One - Overview
OVERVIEW AND STRATEGIC DIRECTION
The overview and strategic direction for the Department of Defence remain as reported in the Portfolio Budget Statements 2008-09.
OVERVIEW OF THE 2008-09 ADDITIONAL ESTIMATES
As part of the 2008-09 Budget, the Government provided $13.4b in new funding to Defence over a 10 year period. This included additional funding for Defence operations in Iraq, East Timor and Afghanistan in the forward estimates period and the continuation of the Government’s commitment to the three per cent per annum real growth in funding to Defence through to 2017-18. Defence’s supplementation for price indexation and the newly established Savings and Efficiency Program funded all other budget measures and the 2008-09 costs of operations.
Significant changes since the 2008-09 Budget Defence’s funding across 10 years has increased by $8.1b since the 2008-09 Budget. The major contributor to this is an increase of $7,963.2m for a range of budget adjustments, including $12,309.0m for movements in foreign exchange and a reduction of $4,286.9m for movements in price.
In addition there are five measures which affect Defence funding:
• $3.0m for Australia’s contribution to the United Kingdom-led initiative to augment helicopter capability in Afghanistan
• $92.3m for the net additional cost of extending Operation Catalyst until 30 June 2009 • $15.5m for infrastructure upgrades in the Middle East • $0.2m for implementation of Operation Sunlight • a reduction of $5.1m for a reduced Austr alian Defence Force (ADF) presence in East Timor.
Variations in Defence funding over 10 years are shown in Table 1.1.1 below and further details are provided in Chapter Two – Resourcing.
7

Table 1.1.1—Additional departmental funding provided to Defence since the 2008-09 Budget 2008-09
$m 2009-10
$m 2010-11
$m 2011-12
$m Total FE
$m 2012-13
$m 2013-14
$m 2014-15
$m 2015-16
$m 2016-17
$m 2017-18
$m Total
$m Additional Measures (2008-09 MYEFO outturned prices)
Expenditure Measures
Afghanistan – helicopter capability 3.0 - - - 3.0 - - - - - - 3.0 Australian Strategic Policy Institute – continuation of funding Electronic countermeasures equipment
-
-
-
-
-
-
-
-
-
-
-
-
-
-
-
-
-
-
-
-
-
-
-
-Iraq – contribution to international stabilisation activities 92.3 - - - 92.3 - - - - - - 92.3 Operations in the Middle East – operational efficiencies project - - - - - - - - - - - -Operations in the Middle East – infrastructure upgrade and expansion 15.5 - - - 15.5 - - - - - - 15.5
Implementation of Operation Sunlight 0.2 - - - 0.2 - - - - - - 0.2
1 Sub-total expenditure measures 111.0 - - - 111.0 - - - - - - 111.0
Savings Measures
East Timor – reduced ADF presence -5.1 - - - -5.1 - - - - - - -5.1
2 Sub-total savings measures -5.1 - - - -5.1 - - - - - - -5.1
3 Total budget measures (1+2) 105.8 - - - 105.8 - - - - - - 105.8
Update of price indexation[1]
Other budget adjustments (2008-09 Budget outturned prices)
-18.2 -149.2 -155.0 -423.7 -746.1 -466.1 -504.6 -544.9 -599.3 -657.7 -768.2 -4,286.9
Foreign exchange movements[1] 582.7 1,347.7 1,337.0 1,185.9 4,453.3 1,158.8 1,127.6 1,218.2 1,329.4 1,440.0 1,581.7 12,309.0 Reprogramming of the Enhanced Land Force (ELF) -207.8 -69.4 9.7 231.2 -36.3 -37.9 74.4 6.7 5.5 5.6 -0.4 17.6 Reprogramming of the Approved
[2] Major Capital Investment ProgramReinvestment of savings from Approved Major Capital Investment Program[2]
-514.0
-
-
-
217.5
-
-564.0
-
-860.5
-
98.0
-
-35.0
-
-295.0
56.0
73.0
-
-524.0
-
1,538.0
-
-5.5
56.0
Reprogramming of intelligence project -6.3 - - - -6.3 - - - - 7.4 - 1.1
Efficiency Dividend - adjustment -1.8 -2.9 -3.9 - -8.5 - - - - - - -8.5 Bring forward of 2007-08 reprogramming 307.0 - - - 307.0 - -220.6 -117.6 - - - -31.2 Bring forward of 2007-08 reprogramming - operations[3] - - - - - -166.0 - - - - - -166.0

2008-09 $m
2009-10 $m
2010-11 $m
2011-12 $m
Total FE $m
2012-13 $m
2013-14 $m
2014-15 $m
2015-16 $m
2016-17 $m
2017-18$m
Total $m
Reconciliation of 2007-08 operations expenditure Defence Home Ownership Assistance Scheme[4]
29.4 - - -
1.8 2.3 3.1 4.0
29.4
11.2
- - - - - - 29.4
4.9 5.9 6.2 6.5 6.8 6.8 48.3
4 Total other budget adjustments[5] 172.8 1,128.5 1,408.4 433.4 3,143.0 591.7 447.7 329.6 815.1 278.1 2,357.9 7,963.2
5 Total additional funding (3+4)[5] 278.6 1,128.5 1,408.4 433.4 3,248.9 591.7 447.7 329.6 815.1 278.1 2,357.9 8,069.0 Notes 1. Price and foreign exchange convert the other budget adjustments into 2008-09 MYEFO outturned prices. 2. The $514m reprogrammed from 2008-09 under the Approved Major Capital Investment Program includes $50m of cost savings which will be harvested for investment in 2014-15 ($56m outturned). 3. $155m for operations not spent in 2007-08 has been brought forward from 2012-13 ($166m outturned) and returned to Government. 4. The Defence Home Ownership Assistance Scheme adjustment is a transfer from administered to departmental appropriation (refer to serial 11 Table 1.2.1) which has no change on total
resourcing. 5. 2008-09 MYEFO outturned prices as a result of application of price and foreign exchange adjustments.
Chapter One - Overview
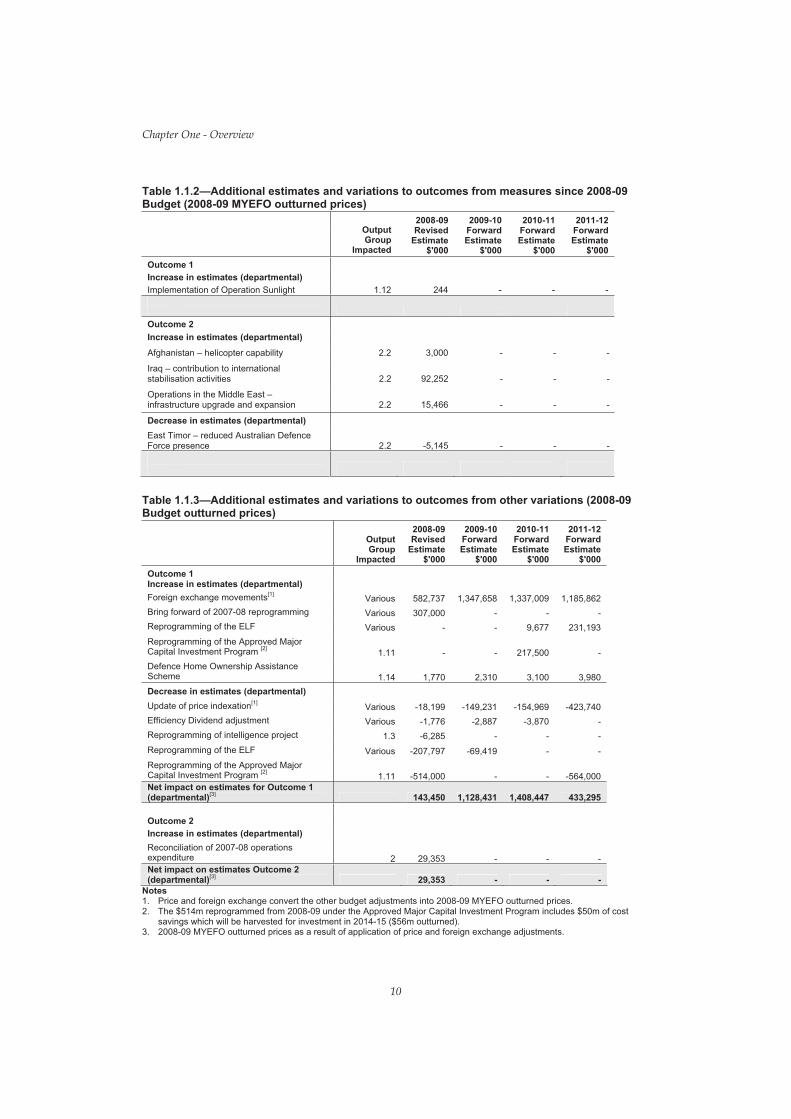
Table 1.1.2—Additional estimates and variations to outcomes from measures since 2008-09 Budget (2008-09 MYEFO outturned prices)
2008-09 2009-10 2010-11 2011-12 Output Revised Forward Forward Forward Group Estimate Estimate Estimate Estimate
Impacted $'000 $'000 $'000 $'000 Outcome 1 Increase in estimates (departmental) Implementation of Operation Sunlight 1.12 244 - - -Net impact on estimates for Outcome 1 (departmental) 244 - - -Outcome 2 Increase in estimates (departmental)
Afghanistan – helicopter capability 2.2 3,000 - - -
Iraq – contribution to international stabilisation activities 2.2 92,252 - - -
Operations in the Middle East – infrastructure upgrade and expansion 2.2 15,466 - - -
Decrease in estimates (departmental) East Timor – reduced Australian Defence Force presence 2.2 -5,145 - - -Net impact on estimates for Outcome 2 (departmental) 105,573 - - -
Table 1.1.3—Additional estimates and variations to outcomes from other variations (2008-09 Budget outturned prices)
2008-09 2009-10 2010-11 2011-12 Output Revised Forward Forward Forward Group Estimate Estimate Estimate Estimate
Impacted $'000 $'000 $'000 $'000 Outcome 1 Increase in estimates (departmental) Foreign exchange movements[1] Various 582,737 1,347,658 1,337,009 1,185,862 Bring forward of 2007-08 reprogramming Various 307,000 - - -Reprogramming of the ELF Various - - 9,677 231,193 Reprogramming of the Approved Major Capital Investment Program [2] 1.11 - - 217,500 -Defence Home Ownership Assistance Scheme 1.14 1,770 2,310 3,100 3,980 Decrease in estimates (departmental) Update of price indexation[1] Various -18,199 -149,231 -154,969 -423,740 Efficiency Dividend adjustment Various -1,776 -2,887 -3,870 -Reprogramming of intelligence project 1.3 -6,285 - - -Reprogramming of the ELF Various -207,797 -69,419 - -Reprogramming of the Approved Major Capital Investment Program [2] 1.11 -514,000 - - -564,000 Net impact on estimates for Outcome 1 (departmental)[3] 143,450 1,128,431 1,408,447 433,295
Outcome 2 Increase in estimates (departmental)Reconciliation of 2007-08 operations expenditure 2 29,353 - - -Net impact on estimates Outcome 2 (departmental)[3] 29,353 - -
Notes 1. Price and foreign exchange convert the other budget adjustments into 2008-09 MYEFO outturned prices. 2. The $514m reprogrammed from 2008-09 under the Approved Major Capital Investment Program includes $50m of cost
savings which will be harvested for investment in 2014-15 ($56m outturned). 3. 2008-09 MYEFO outturned prices as a result of application of price and foreign exchange adjustments.
10

Chapter One - Overview
ORGANISATIONAL STRUCTURE
Senior executive changes Professor Robert Clark was appointed to the position of Chief Defence Scientist on 13 October 2008.
Organisational structure changes The organisational structure remains as reported on the Portfolio Budget Statements 2008-09.
Organisational structure Figure 1.1 (on the following page) depicts the organisational structure as at 2 December 2008.
11

Figure 1.1 —Defence organisational chart as at 2 December 2008
Minister for Defence Hon Joel Fitzgibbon MP
Minister for Defence Science and Personnel
The Hon Warren Snowdon MP
Parliamentary Secretary Defence Procurement
The Hon Greg Combet AM MP
Parliamentary Secretary Defence Support
he Hon Dr Mike Kelly AM MP
Secretary Mr Nick Warner
****
(1)
Chief of the Defence Force ACM Angus Houston
****
(1)
Offic e of the Secretary & Chief of Defence Force Group
Judge Advocate General MAJGEN The Hon Justice
Richard Tracey ** (1) (2)
Chief Military Judge BRIG Ian Westwood
* (1) (2)
Director Military Prosecutions BRIG Lyn McDade
* (1) (2)
Inspector Gener al ADF Mr Geoff Earley
** (1) (3)
Inspector General Mr Ray Bromwich
(acting) ** (4)
Deputy Secretary White Paper Mr Michael Pezzullo
***
Deputy Secretary Strategy, Coordination and Governance
Mr Peter Jennings (acting) ***
T
Vice Chief of the Defence Force LTGEN David Hurley
*** (1)
Chief of Joint Operations LTGEN Mark Evans
***
Chief of Navy VADM Russ Crane
*** (1) (5)
Chief of Army LTGEN Ken Gillespie
*** (1) (5)
Chief of Air Force AIRMRSHL Mark Binskin
*** (1) (5)
Chief Capability Development VADM Matthew Tripovich
***
Chief Finance Officer Mr Phillip Prior
***
Chief Information Officer Mr Greg Farr
***
Deputy Secretary Defence Support
Mr Martin Bowles ***
Deputy Secretary Intelligence, Security and International Policy
Mr Stephen Merchant ***
Deputy Secretary People Strategies and Policy
Mr Phil Minns ***
Chief Defence Scientist Professor Robert Clark
***
Defence Materiel Organisation
Chief Executive Officer Dr Stephen Gumley
(6)
General Manager Programs Mr Warren King
***
General Manager Systems Mr Kim Gillis
***
General Manager Corporate Ms Jane Wolfe
***
* Stars refer to ADF Star rank or SES Band levels. (1) Statutory appointment. (2) Reports directly to the Minister for Defence in accordance with Section 196A of the Defence Force Discipline Act 1982. (3) The Inspector-General ADF is directly responsible to the Chief of the Defence Force (CDF).
(4) The Inspector-General reports directly to the Secretary and CDF. (5) Section 9(3) of the Defence Act 1903 requires the Service Chiefs to advise the Minister on matters relating to their command. (6) Under the agreed business model for DMO as a prescribed agency, the CEO DMO Ministerial Directive identifies that the CEO DMO is directly accountable to the Minister for DMO’s performance but remains accountable to the Secretary and CDF.

CHAPTER TWO — RESOURCING
DEFENCE RESOURCING
DEFENCE RESOURCE STATEMENT
FUNDING FROM GOVERNMENT
FUNDING FROM OTHER SOURCES
FUNDING FOR OPERATIONS
PAYMENTS TO DEFENCE MATERIEL ORGANISATION
PAYMENTS TO DEFENCE HOUSING AUSTRALIA


Chapter Two - Resourcing
DEFENCE RESOURCING
Departmental funding (serial 10 of Table 1.2.1 overleaf) is the most common way of presenting the Defence budget. The total level of departmental funding in 2008-09 has increased by $337.6m to $23,027.9m compared with $22,690.3m in the 2008-09 Budget. The revised total Defence funding is comprised of:
• an appropriation for departmental outputs ($20.2b)
• an equity injection ($1.8b)
• drawdown of appropriations carried forward from previous years ($114.7m)
• net capital receipts ($65.7m)
• own source revenue ($811.2m).
The net increase in funding is made up of:
• an increase of $278.6m in departmental appropriations resulting from
o an increase of $105.8m associated with departmental budget measures (refer Serial 3 of Table 1.1.1)
o an increase of $172.8m for other budget adjustments (refer serial 4 of Table 1.1.1)
• an increase of $59.7m in the drawdown of appropriations carried forward (refer Serial 5 of Table 1.2.1) related mainly to using cash to meet the liability for the effect of a stronger Australian dollar on foreign exchange rates in 2007-08
• a decrease of $0.7m in own source revenue (refer Serial 8 in Table 1.2.1).
The 2008-09 revised estimate for total Defence funding of $23,027.9m is 1.5 per cent more than the estimate made in the 2008-09 Budget.
15
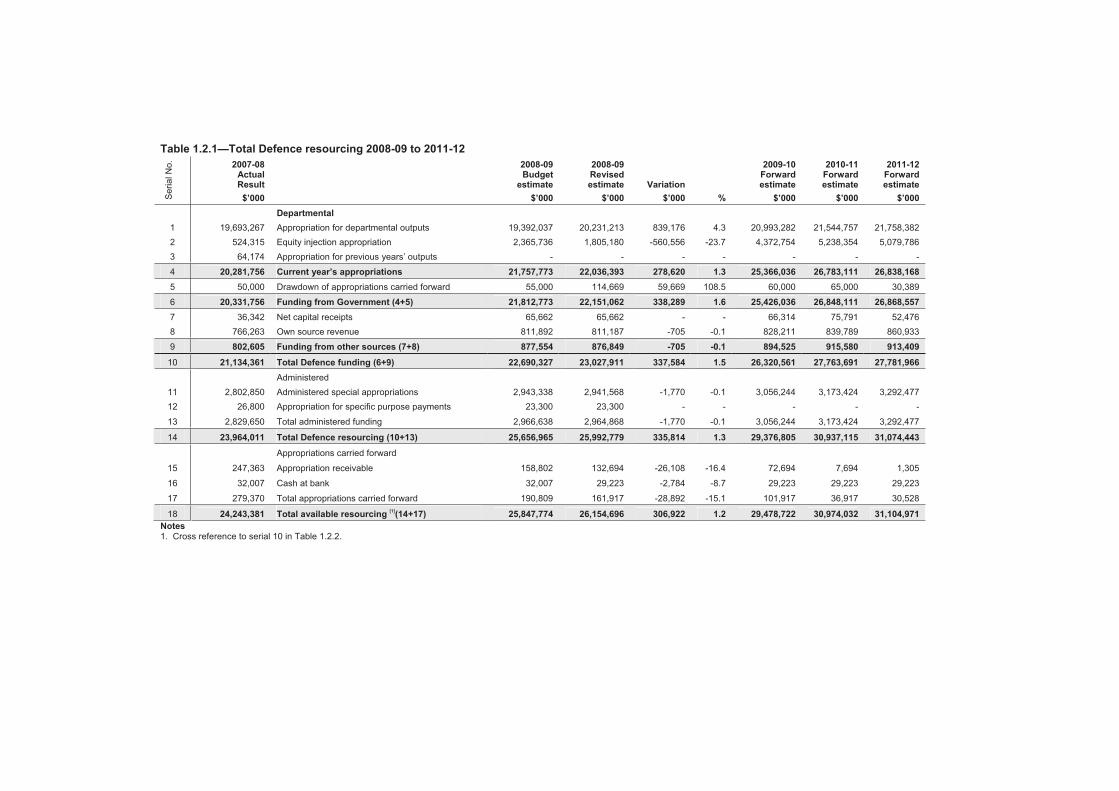
Table 1.2.1—Total Defence resourcing 2008-09 to 2011-12 2007-08 Actual Result
$’000
2008-09Budget
estimate $’000
2008-09Revised estimate
$’000 Variation
$’000 %
2009-10Forwardestimate
$’000
2010-11Forwardestimate
$’000
2011-12Forward estimate
$’000 Departmental
19,693,267 Appropriation for departmental outputs 19,392,037 20,231,213 839,176 4.3 20,993,282 21,544,757 21,758,382524,315 Equity injection appropriation 2,365,736 1,805,180 -560,556 -23.7 4,372,754 5,238,354 5,079,786
64,174 Appropriation for previous years’ outputs - - - - - -
20,281,756 Current year’s appropriations 21,757,773 22,036,393 278,620 1.3 25,366,036 26,783,111 26,838,168-
50,000 Drawdown of appropriations carried forward 55,000 114,669 59,669 108.5 60,000 65,000 30,389
20,331,756 Funding fr om Government (4+5) 21,812,773 22,151,062 338,289 1.6 25,426,036 26,848,111 36,342 Net capital receipts 65,662 65,662 - - 66,314 75,791
26,868,557 52,476
766,263 Own source revenue 811,892 811,187 -705 -0.1 828,211 839,789 860,933
802,605 Funding from other sources (7+8) 877,554 876,849 -705 -0.1 894,525 915,580 913,409
21,134,361 Total Defence funding (6+9) 22,690,327 23,027,911 337,584 1.5 26,320,561 27,763,691 27,781,966Administered
2,802,850 Administered special appropriations 2,943,338 2,941,568 -1,770 -0.1 3,056,244 3,173,424 3,292,477 26,800 Appropriation for specific purpose payments 23,300 23,300 - - - - -
2,829,650 Total administered funding 2,966,638 2,964,868 -1,770 -0.1 3,056,244 3,173,424 3,292,477
23,964,011 Total Defence resourcing (10+13) 25,656,965 25,992,779 335,814 1.3 29,376,805 30,937,115
Appropriations carried forward
247,363 Appropriation receivable 158,802 132,694 -26,108 -16.4 72,694 7,694
31,074,443
1,305
32,007 Cash at bank 32,007 29,223 -2,784 -8.7 29,223 29,223 29,223
Total appropriations carried forward 190,809 161,917 -28,892 -15.1 101,917 36,917 30,528
24,243,381
279,370
Total available resourcing [1] (14+17) 25,847,774 26,154,696 306,922 1.2 29,478,722 30,974,032 31,104,971
Ser
ial N
o.
123
4
5
6
78
9
10
1112
13
14
15
16
17
18Notes1. Cross reference to serial 10 in Table 1.2.2.
Chapter Two - Resourcing
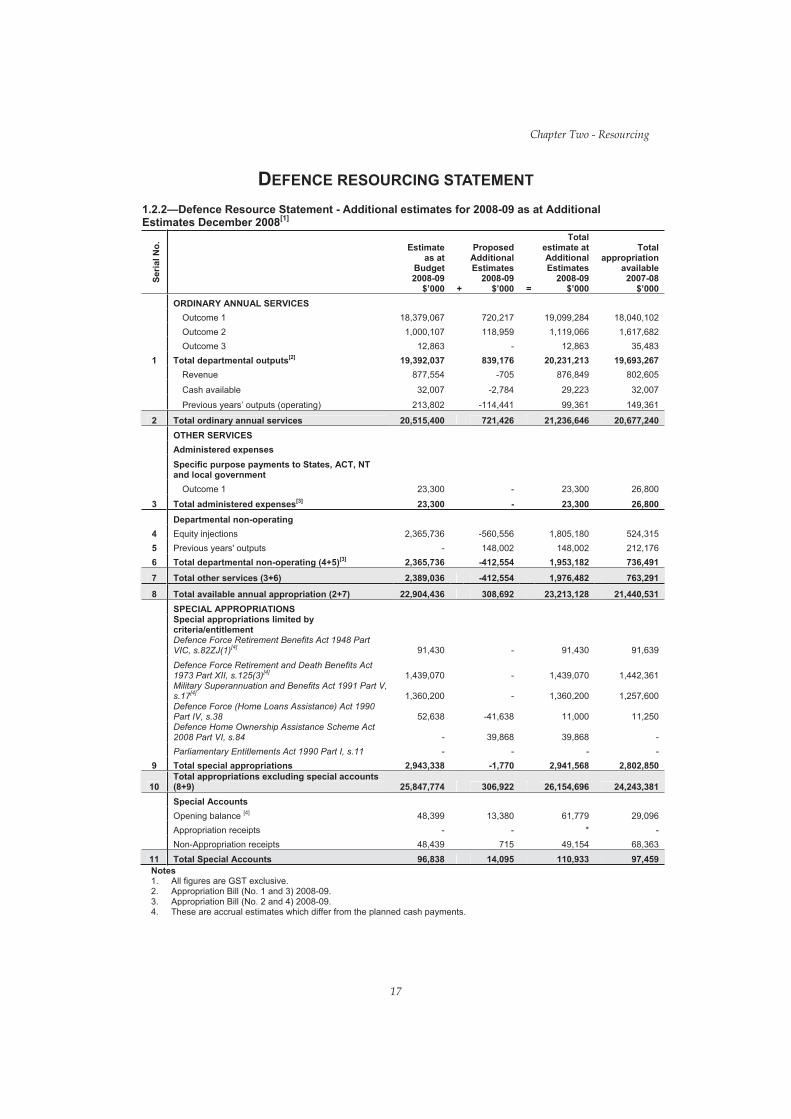
DEFENCE RESOURCING STATEMENT
1.2.2—Defence Resource Statement - Additional estimates for 2008-09 as at Additional Estimates December 2008[1]
Total Estimate Proposed estimate at Total
Seria
l No.
as at Additional Additional appropriation Budget Estimates Estimates available 2008-09 2008-09 2008-09 2007-08
$’000 + $’000 = $’000 $’000
1
ORDINARY ANNUAL SERVICES Outcome 1 Outcome 2 Outcome 3
Total departmental outputs[2]
Revenue
Cash available
Previous years’ outputs (operating)
18,379,067 1,000,107
12,863 19,392,037
877,554
32,007
213,802
720,217 118,959
-839,176
-705
-2,784
-114,441
19,099,284 1,119,066
12,863 20,231,213
876,849
29,223
99,361
18,040,102 1,617,682
35,483 19,693,267
802,605
32,007
149,361
2 Total ordinary annual services 20,515,400 721,426 21,236,646 20,677,240
3
OTHER SERVICES Administered expenses Specific purpose payments to States, ACT, NT and local government
Outcome 1
Total administered expenses[3] 23,300
23,300 -
-23,300
23,300 26,800
26,800 Departmental non-operating
4 Equity injections 2,365,736 -560,556 1,805,180 524,315 5 Previous years' outputs - 148,002 148,002 212,176 6 Total departmental non-operating (4+5)[3] 2,365,736 -412,554 1,953,182 736,491
7 Total other services (3+6) 2,389,036 -412,554 1,976,482 763,291
8 Total available annual appropriation (2+7) 22,904,436 308,692 23,213,128 21,440,531 SPECIAL APPROPRIATIONS Special appropriations limited by criteria/entitlement Defence Force Retirement Benefits Act 1948 Part VIC, s.82ZJ(1)[4] 91,430 - 91,430 91,639
Defence Force Retirement and Death Benefits Act 1973 Part XII, s.125(3)[4]
Military Superannuation and Benefits Act 1991 Part V, s.17[4]
Defence Force (Home Loans Assistance) Act 1990 Part IV, s.38 Defence Home Ownership Assistance Scheme Act 2008 Part VI, s.84
1,439,070
1,360,200
52,638
-
-
-
-41,638
39,868
1,439,070
1,360,200
11,000
39,868
1,442,361
1,257,600
11,250
-Parliamentary Entitlements Act 1990 Part I, s.11 - - - -
9 Total special appropriations 2,943,338 -1,770 2,941,568 2,802,850
10 Total appropriations excluding special accounts (8+9) 25,847,774 306,922 26,154,696 24,243,381 Special Accounts Opening balance [4] 48,399 13,380 61,779 29,096 Appropriation receipts - - * -Non-Appropriation receipts 48,439 715 49,154 68,363
11 Total Special Accounts 96,838 14,095 110,933 97,459 Notes 1. All figures are GST exclusive. 2. Appropriation Bill (No. 1 and 3) 2008-09. 3. Appropriation Bill (No. 2 and 4) 2008-09. 4. These are accrual estimates which differ from the planned cash payments.
17

Chapter Two - Resourcing
Table 1.2.3—Third party drawdowns from and on behalf of other agencies 2008-09
$’000
Drawdowns Revenue received from the Defence Materiel Organisation for the provision of services 328,744
Payments made to the Defence Materiel Organisation for the provision of goods and services 9,370,899
Payments made to Defence Housing Australia for the provision of services (departmental) 542,198
Payments made to the Department of Veterans’ Affairs for the provision of services (departmental) 2,661
18

Chapter Two - Resourcing
FUNDING FROM GOVERNMENT
2008-09 Additional Measures Since the 2008-09 Budget, the Government has approved 8 new measures for Defence. Table 1.2.4 shows the additional measures approved by the Government since the 2008-09 Budget. These measures are detailed in subsequent paragraphs.
Table 1.2.4—Defence 2008-09 additional measures[1][2]
2008-09 2009-10 2010-11 2011-12 Output Revised Forward Forward Forward Group estimate estimate estimate estimate Total
$'000 $'000 $'000 $'000 $'000 Expense Measures Departmental Measures Australian Strategic Policy Institute – continuation of funding 1.1 - - - - -Afghanistan – helicopter capability 2.2 3,000 - - - 3,000 Electronic countermeasures equipment 2.2 - - - - -Iraq – contribution to international stabilisation activities 2.2 87,764 - - - 87,764 Operations in the Middle East – operational efficiencies project 2.2 - - - - -Operations in the Middle East – infrastructure upgrade and expansion 2.2 3,987 - - - 3,987 Implementation of Operation Sunlight 1.12 244 - - - 244 East Timor – reduced Australian Defence Force presence 2.2 -5,145 - - - -5,145
1 Sub-total Departmental Measures 89,850 89,850 Administered Measures
- - - - -2 Sub-total administered measures - - - - -3 Total Expense Measures (1+2) 89,850 - - - 89,850
Capital Measures Electronic countermeasures equipment 2.2 - - - - -Iraq – contribution to international stabilisation activities 2.2 4,488 - - - 4,488 Operations in the Middle East -infrastructure upgrade and expansion 2.2 11,479 - - - 11,479
4 Total Capital Measures 15,967 - - - 15,967 5 Total new budget measures (3+4) 105,817 - - - 105,817 Notes 1. Measures are reported on a Government Financial Statistics basis. Where Defence absorbs the cost of a measure, the
fiscal impact is zero. 2. Cross reference to Table 1.1.1 for the total cost of those measures with expense and capital elements.
AUSTRALIAN STRATEGIC POLICY INSTITUTE – CONTINUATION OF FUNDING
The Government will provide $2.8m in 2008-09 to support the work of the Australian Strategic Policy Institute (ASPI). The ASPI produces independent analysis of defence and security issues relevant to Australia to support government decision-making in strategic and defence issues. The cost of this measure will be met from within the existing resourcing of Defence.
19
Chapter Two - Resourcing
AFGHANISTAN – HELICOPTER CAPABILITY
The Government will provide $3.0 million in 2008-09 as Australia’s contribution to the United Kingdom-led initiative to augment helicopter capability in Afghanistan. The contribution gives effect to a commitment made at the North Atlantic Treaty Organisation (NATO) summit held in Bucharest in April 2008. The contribution will fund advanced pilot training and technical upgrades to enable more NATO helicopters to be deployed to Afghanistan in support of International Security Assistance Force operations.
ELECTRONIC COUNTERMEASURES EQUIPMENT
The Government will provide $76.2m (including capital funding of $67.2m) over two years from 2008-09 for electronic countermeasures equipment. This equipment is for the protection of Australian Defence Force personnel, including in Afghanistan and Iraq. The equipment will provide an enhanced level of protection against improvised explosive devices. The cost of this measure will be met from within the existing resourcing of Defence.
IRAQ – CONTRIBUTION TO INTERNATIONAL STABILISATION ACTIVITIES
The Government will provide $92.3m in 2008-09 (including $4.5m for capital) for the net additional costs of extending Operation CATALYST until 30 June 2009. The operation is Australia’s military contribution to stabilisation and reconstruction activities in Iraq.
OPERATIONS IN THE MIDDLE EAST – COMMAND AND CONTROL ENHANCEMENT
In 2007-08, Defence initiated a study to scope options for improving the delivery of robust operational support measures to deployed forces in the Middle East. The Government will provide $17.2m, being $1.7m for the scoping study and $15.5m for the phased delivery of enhanced infrastructure and consolidation of resources. The cost of the scoping study will be met from within Defence resources.
IMPLEMENTATION OF OPERATION SUNLIGHT
The Government will provide $0.2m in 2008-09 for implementation of Operation Sunlight to improve budget transparency.
EAST TIMOR – REDUCED AUSTRALIAN DEFENCE FORCE PRESENCE
The Government has decided that the Australian Defence Force presence in East Timor will be reduced from approximately 750 to 650 personnel by early 2009, reflecting improvements in the country’s security situation. This reduction is expected to lead to a saving of $5.1m in 2008-09 in respect of allowances and logistics support costs.
20

Chapter Two - Resourcing
Other budget adjustments In addition to the above measures, the following adjustments will be made to Defence’s Departmental estimates.
Table 1.2.5—Variations in Defence funding provided by the Government since the 2008-09 Budget[1] (2008-09 Budget outturned prices)
2008-09 2009-10 2010-11 2011-12 Revised Forward Forward Forward estimate estimate estimate estimate Total
Outcome $’000 $’000 $’000 $’000 $'000 Other budget adjustments Update of price indexation[2] 1 -18,199 -149,231 -154,969 -423,740 -746,139Foreign exchange movements[2] 1 582,737 1,347,658 1,337,009 1,185,862 4,453,266Reprogramming of the Enhanced Land Force (ELF) 1 -207,797 -69,419 9,677 231,193 -36,346Reprogramming of the Approved Major Capital Investment Program[3][4] 1 -514,000 - 217,500 -564,000 -860,500Reprogramming of intelligence project 1 -6,285 - - - -6,285 Efficiency Dividend - adjustment 1 -1,776 -2,887 -3,870 - -8,533 Bring forward of 2007-08 reprogramming 1 307,000 - - - 307,000 Bring forward of 2007-08 reprogramming - operations[4] 2 - - - - -Reconciliation of 2007-08 operations expenditure 2 29,353 - - - 29,353Defence Home Ownership Assistance Scheme 1 1,770 2,310 3,100 3,980 11,160
Total other budget adjustments 172,803 1,128,431 1,408,447 433,295 3,142,976 Notes 1. Cross reference to serial 4 of Table 1.1.1. 2. Price and foreign exchange convert the other budget adjustments into 2008-09 MYEFO outturned prices. 3. The $514m reprogrammed from 2008-09 under the Approved Major Capital Investment Program includes $50m of cost
savings which will be harvested for use in 2014-15 ($56m outturned – refer Table 1.1.1). 4. The bring-forward of $155m for operations from 2012-13 ($166m outturned – refer Table 1.1.1), which was reprogrammed
as part of the 2007-08 underspend, has been returned to Government and has a zero impact on 2008-09.
UPDATE OF PRICE INDEXATION
The Defence budget is price updated at each budget milestone to reflect movements in the non–farm Gross Domestic Product (GDP) deflator. As a result, funding to Defence for price movements has been decreased by $18.2m in 2008-09, as part of an additional reduction of $746.1m over the forward estimate years.
FOREIGN EXCHANGE MOVEMENTS
Under the ‘no-win-no-loss’ arrangements, Defence is required to return to the Government any surplus foreign exchange supplementation for an appreciation of the Australian dollar relative to other currencies. Conversely, where the Australian dollar depreciates relative to other currencies, Defence is supplemented under these arrangements. Defence will receive $582.7m in 2008-09, having taken into account movements in exchange rates since the 2008-09 Budget. Over the current year and forward estimates a total of $4,453.3m will be provided.
REPROGRAMMING OF THE ENHANCED LAND FORCE (ELF) Following an analysis of the start-up rate for ELF, $207.8m has been reprogrammed from 2008-09 into later years. This was the result of it not being possible to invest in facilities development as quickly as originally planned.
21

Chapter Two - Resourcing
REPROGRAMMING OF THE APPROVED MAJOR CAPITAL INVESTMENT PROGRAM
Following a comprehensive program review of 230 major projects, an amount of $514.0m has been reprogrammed from 2008-09. This is predominantly due to unanticipated contractor delays and revised estimates for Foreign Military Sales. Of this amount, $50m is cost savings which will be harvested for investment in 2014-15 ($56m outturned).
REPROGRAMMING OF AN INTELLIGENCE PROJECT
An amount of $6.3m will be reprogrammed beyond the forward estimates.
EFFICIENCY DIVIDEND - ADJUSTMENT
In order to ensure consistency in the methodology of calculating the efficiency dividend, an adjustment was needed to the amounts charged in the 2007-08 Additional Estimates for the increase in the rate of the dividend from one percent per annum to 1.25% for the three years from 2008-09 to 2010-11. The total effect of the adjustment over the three years is to increase the dividend, and hence savings to the Government, by $8.5m.
BRING FORWARD OF 2007-08 REPROGRAMMING
In the 2008-09 Budget, an amount of $679.7m was reprogrammed from 2007-08 to 2012-13 and beyond as a result of an anticipated underspend in 2007-08 by Defence and the Defence Materiel Organisation. An amount of $307.0m (2008-09 Budget outturned prices) will be brought forward from 2013-14 and 2014-15 back to 2008-09 to meet emerging pressures. In addition, an amount of $155m of the reprogramming for operations has been brought forward from 2012-13 ($166m outturned) and returned to Government.
RECONCILIATION OF ‘NO-WIN-NO-LOSS’ 2007-08 OPERATIONS EXPENDITURE
Operations funding is provided to Defence on a ‘no-win-no-loss’ basis and is subject to annual reconciliation by Defence and the Department of Finance and Deregulation. Following the reconciliation of 2007-08 expenditure, Defence will be supplemented $29.4m.
DEFENCE HOME OWNERSHIP ASSISTANCE SCHEME
The Defence Home Ownership Assistance Scheme Act 2008 does not cover the administration costs of this scheme which were included in the estimates of administered funds when the Scheme was announced as a measure in the 2007-08 Budget. This adjustment transfers the estimated administration costs of the scheme ($1.8m in 2008-09 and $11.2m over the forward estimates) from administered to departmental appropriations.
22

FUNDING FROM OTHER SOURCES
Table 1.2.1 provides details of the funding Defence will receive in 2008-09 in addition to funding from Government. This funding consists of net capital receipts and own source revenue. Further details of these funding sources are provided below.
Net capital receipts There have been no variations to Defence’s net capital receipts since the 2008-09 Budget.
Own source Revenue Serial 8 of Table 1.2.1 shows the resources retained by Defence in accordance with Regulation 15 of the Financial Management and Accountability Act 1997. Variations to Defence’s planned own source revenue since the 2008-09 Budget are shown in Table 1.2.6.
Table 1.2.6—Variation in Defence’s own source revenue 2008-09 2009-10 2010-11 2011-12 Budget Forward Forward Forward
estimate estimate estimate estimate $'000 $'000 $'000 $'000
Previous estimate as published in the Portfolio Budget Statements 2008-09[1] 811,892 832,956 844,554 874,014
Variation in own source revenue -705 -4,745 -4,765 -13,081 Own source revenue 811,187 828,211 839,789 860,933 Notes 1. As published in the Portfolio Budget Statements 2008-09 Table 1.2.1 serial 8.
Chapter Two - Resourcing
23

Chapter Two - Resourcing
FUNDING FOR OPERATIONS
The ADF is involved in a number of deployments around the world, including United Nations peacekeeping and regional assistance missions, and border protection and domestic security operations. Defence plans to spend $1,218.9m on the net additional costs of its operational deployments in 2008–09, or $170.1m more than the budget estimate. The revised estimates for all operations are shown in Table 1.2.7. Details of 2008–09 adjustments of $170.2m are as follows:
• operations in Iraq ($133.2m) • operations in Afghanistan ($42.1m) • operations in East Timor (-$5.1m) The major variations compared with the budget are detailed in Table 1.2.7 below.
Table 1.2.7—Revised cost estimates for operations 2007-08 2008-09 2008-09 2009-10 2010-11 2011-12
Actual Budget Revised Forward Forward Forward Operation Result Estimate Estimate Variation Estimate Estimate Estimate
$m $m $m $m $m $m $m Operation Astute 205.6 174.3 169.1 -5.1 18.7 -
Operation Slipper [1] [2] 394.9 618.9 661.0 42.1 130.8 2.9 Operation Resolute 7.0 12.8 12.8 - 13.0 13.3 Operation Catalyst [3] 501.5 215.7 348.9 133.2 51.7 -
Operation Anode 23.7 27.1 27.1 - - - Operation Deluge 4.0 - - - - - Operation Outreach 12.3 - - - - - Total Net Additional Costs 1,149.1 1,048.7 1,218.9 170.2 214.2 16.2
Notes 1. The 2008-09 Revised Estimate includes a carry forward from 2007-08 of $15.6m for rapid acquisition of force protection
equipment. 2. Government approved $76.2m for additional force protection equipment. 3. The 2008-09 Revised Estimate includes a carry forward from 2007-08 of $23.9m for rapid acquisition of force protection
equipment.
OPERATIONS IN EAST TIMOR (OPERATION ASTUTE) Operation Astute is the Australian Government’s response to a request from the Government of East Timor to assist in the restoration of stability, security and confidence to their country. The Government has approved a reduced ADF presence in East Timor by early 2009 to 650 personnel, expected to be a saving of $5.1m in 2008-09 for reduced personnel allowances and logistic support costs.
The revised estimate for 2008–09 is $169.1m which is $5.1m less than the 2008–09 Budget.
OPERATIONS IN AFGHANISTAN (OPERATION SLIPPER) Operation Slipper is the ADF’s contribution to the international coalition against terrorism. In 2008-09, Defence plans to spend $26.5m for additional force protection measures and has also carried forward funding of $15.6m from 2007-08 for outstanding rapid acquisitions. Further, Government has also approved $49.7m in 2009-10 for force protection measures.
The revised estimate for 2008–09 is $661.0m which is $42.1m more than the 2008–09 Budget.
OPERATIONS IN IRAQ (OPERATION CATALYST) Operation Catalyst is the ADF’s contribution to Multinational Force efforts to develop a secure and stable environment in Iraq and assist national recovery programs. The Government has extended the ADF deployment to June 2009 and has approved an additional $92.3m in 2008-09 to fund the continuation of the operation. The Government has also approved $17.2m in 2008-09 for a scoping
24

Chapter Two - Resourcing
study and delivery of enhanced infrastructure and consolidation of resources. Additionally, $23.9m has been carried forward from 2007-08 for outstanding rapid acquisition of force protection measures and additional equipment purchases.
The revised estimate for 2008–09 is $348.9m which is $133.2m more than the 2008–09 Budget.
OTHER OPERATIONS
There are no changes since the 2008–09 Budget in respect of Operations Resolute, Anode, Deluge and Outreach.
HISTORICAL AND PLANNED EXPENDITURE ON OPERATIONS
Table 1.2.8 shows the historical and planned expenditure on operations since 1999-2000 when the ADF deployed to East Timor. The figures reflect actual expenditure over the period 1999-2000 to 2007-08 and current planned expenditure. Overall, Defence has spent or is planning to spend $8.7b on the net additional costs of operations for which the Government has provided supplementary funding of $7.6b.
25

Table 1.2.8—Net additional cost of operations from 1999-2000 to 2011-12
Operation
1999-00 Actual Result
$m
2000-01 Actual Result
$m
2001-02 Actual Result
$m
2002-03 Actual Result
$m
2003-04 Actual Result
$m
2004-05 Actual Result
$m
2005-06 Actual Result
$m
2006-07 Actual Result
$m
2007-08 2008-09 Revised
Estimate
$m
Actual Result
$m
2009-10 Forward Estimate
$m
2010-11 Forward Estimate
$m
2011-12 Forward Estimate
$m
Total
$m
Operation Astute[1] 598.1 798.5 632.9 579.3 554.0 27.4 23.9 191.4 205.6 169.1 18.7 - 3,798.9
Operation Bel Isi
Operation Slipper[2]
Operation Resolute[3]
Operation Catalyst[4]
-
-
-
-
20.0
-
-
-
10.1
320.0
22.2
-
14.6
176.0
27.8
285.3
3.0
-5.0
15.9
240.6
-
-
11.9
284.9
-
91.0
9.8
351.4
-
223.3
9.3
398.5
394.9
7.0
501.5
-
661.0
12.8
348.9
-
130.8
13.0
51.7
-
2.9
13.3
-
-
47.7
1,994.9
143.0
2,462.8
Operation Anode - - - - 90.4 27.6 12.9 17.3 23.7 27.1 - - - 199.0
Operation Sumatra Assist - - - - - 37.0 7.5 - - - - - 44.5
Operation Acolyte - - - - - 0.1 10.4 - - - - - 10.5
Operation Deluge - - - - - - - 2.7 4.0 - - - - 6.7
Operation Pakistan Assist - - - - - - 9.8 - - - - - 9.8
Operation Outreach - - - - - - - - 12.3 - - - - 12.3
Total Net Additional Costs 598.1 818.5 985.2 1,083.0 898.9 388.9 516.7 842.5 1,149.1 1,218.9 214.2 16.2 - 8,730.0
Sources of Funding for Operations:
Government Supplementation 598.1 818.5 985.2 1,083.0 898.9 388.9 506.9 842.5 1,127.5 115.4[5] 164.4 16.2 7,545.4
Department of Foreign Affairs and Trade [6] - - - - - - 9.1 - - - - - 9.1
Department of Defence (Absorbed) - - - - - - 0.7 - 21.6[7] 1,103.4[8] 49.7 [9] - 1,175.4
Total Cost 598.1 818.5 985.2 1,083.0 898.9 388.9 516.7 842.5 1,149.1[10] 1,218.9[11] 214.2 16.2 - 8,730.0
Notes: 1. Includes force generation funding from 1999-00 to 2003-04, with an ongoing amount of $448.9m included in Defence's funding base from 2004-05. 2. The 2008-09 revised estimate includes a carry forward from 2007-08 of $15.6m and an additional $26.5m for rapid acquisition of force protection equipment. 3. Previously Operations Relex and Relex II. 4. The 2008-09 revised estimate includes a carry forward from 2007-08 of $23.9m for outstanding rapid acquisition of force protection equipment. 5. Includes funding for Operation Resolute extension ($12.8m), Operation Catalyst extension ($92.3m), enhanced infrastructure and consolidation of resources ($15.5m) and a reduction of
personnel in East Timor (-$5.1m). 6. Defence was reimbursed $9.1m for the net additional cost of Operation Pakistan Assist by the Department of Foreign Affairs and Trade through the existing aid budget. 7. Defence has been required to absorb a total of $21.6m for force protection measures. This includes $10.8m each for Operation Slipper and Operation Catalyst. 8. Defence funded $1035.9m from internal Defence efficiency measures ($209.4m), and increases in the non-farm GDP deflator that is used to adjust Defence funding for price increases ($826.5m).
Defence also funded $66.0m relating to carry forwards from 2007-08 ($39.5m), purchases of rapid acquisition equipment ($26.5m) and rebasing of ADF personnel ($1.7m). 9. Defence has been required to absorb $76.2m for Operation Slipper for additional rapid acquisition purchases, comprising $26.5m in 2008-09 and $49.7m in 2009-10 10. The variation between the 2007-08 revised estimate and the actual result is due to an underspend of $165.0m. 11. The variation between the 2008-09 PBS and revised estimate includes a reduction of personnel in East Timor (-$5.1m), a scoping study and delivery of enhanced infrastructure and consolidation
of resources ($17.1m), the extension of operations in Iraq ($92.3m), additional force protection measures ($26.5m) and the carry over of rapid acquisition purchases ($39.5m). The helicopter initiative ($3.0m) has not been included in the cost of operations as it is not part of a specific operation.
26

APPROPRIATIONS
Annual Appropriations Defence’s annual appropriations will increase by $278.6m to $22,036.4m (refer also to serials 1 through 4 in Table 1.2.1). This includes an increase of $839.2m for departmental outputs and a decrease of $560.6m for the equity injection. Defence will seek a determination by the Minister for Finance and Deregulation, under Section 9 of the Appropriation Act (No 2) 2008-09, to decrease the equity injection appropriation.
Table 1.2.9—Appropriation Bill (No 3) 2008-09 2007-08
available $'000
2008-09 Budget
$'000
2008-09 revised
$'000
Additional estimates
$'000
Reduced estimates
$'000 DEPARTMENTAL OUTPUTS Outcome 1 Australia's national interests are protected and advanced through the provision of military capabilities and the promotion of security and stability
Outcome 2 Military operations and other tasks directed by the Government to achieve the desired results
Outcome 3 Defence's support to the Australian community and civilian authorities to achieve the desired results
18,040,102
1,617,682
35,483
18,379,067
1,000,107
12,863
19,099,284
1,119,066
12,863
720,217 -
118,959 -
- -
Total 19,693,267 19,392,037 20,231,213 839,176
Table 1.2.10—Appropriation Bill (No 4) 2008-09 2007-08
available$'000
2008-09Budget
$'000
2008-09revised
$'000
Additional Estimates
$'000
Reduced estimates
$'000
PAYMENTS TO STATES, ACT, NT AND LOCAL GOVERNMENT 26,800 23,300 23,000 - -Total 26,800 23,300 23,000 - -
Non-operating
Equity injections 524,315 2,365,736 1,805,180 - - 560,556
Previous years' outputs [1] 64,174 - - - -
Total non-operating 588,489 2,365,736 1,805,180 - - 560,556
- 560,556 Total 615,289 2,389,036 1,828,480 -
Chapter Two - Resourcing
Note 1. $64,174m was fully utilised in 2007-08 and is therefore not part of 2008-09 budget estimates.
27

Chapter Two - Resourcing
PAYMENTS TO THE DEFENCE MATERIEL ORGANISATION
Table 1.2.11—Total Payment to the DMO in 2008-09 2008-09 2008-09 Budget Revised
estimate estimate Variation $m $m $m
Unapproved Major Capital Equipment Projects (Defence Capability Plan) 277.6 188.1 -89.5
Major Capital Equipment Projects 3,989.1 3,888.4 -100.7
Acquisition Service Fee 373.1 374.2 1.1
1 Sub total Major Capital Investment Projects 4,639.8 4,450.7 -189.1
Approved Navy minor projects 22.9 23.2 0.3
Approved Army minor projects 62.4 45.1 -17.4
Approved Air Force minor projects 31.9 20.8 -11.1
Approved Joint Logistics minor projects 5.3 8.3 3.0
Approved Chief Information Officer minor projects 1.4 1.5 0.1
Approved Intelligence, Security & International Policy minor projects 0.0 4.9 4.9
2 Sub total approved minor programs 124.0 103.8 -20.2
Unapproved Navy minor projects 1.9 2.1 0.2
Unapproved Army minor projects 0.0 18.4 18.4
Unapproved Air Force minor projects 7.9 16.2 8.3
Unapproved Joint Logistics minor projects 7.3 5.1 -2.2
Unapproved Chief Information Officer minor projects 0.0 0.0 0.0
3 Sub total unapproved minor programs 17.1 41.8 24.7
4 Sub total minor programs (2+3) 141.1 145.6 4.5
5 Total acquisition (DMO output 1) (1+4) 4,781.0 4,596.4 -184.6
Navy sustainment 1,346.8 1,371.3 24.5
Army sustainment 1,314.0 1,506.4 192.4
Air Force sustainment 1,255.2 1,340.7 85.5
Chief Information Officer sustainment 41.1 26.5 -14.6
Intelligence, Security and International Policy sustainment 49.4 49.1 -0.3
HQJOC Sustainment 2.8 2.8 0.0
VCDF sustainment 0.0 34.9 34.9
Defence Capability Plan (operating costs) 136.6 46.0 -90.6
Sub Total 4,145.9 4,377.7 232.0
Service fee 396.9 396.8 -0.1
6
7
Total sustainment (DMO output 2) 4,542.6 4,774.5 231.9
Total planned payments to DMO (5+6) 9,323.6[1] 9,370.9 47.3 Notes 1. This figure does not match the DMO resource table on p129 of Part 2, because it has been adjusted to take into account a
reprogramming activity which should have been included in the 2008-09 Budget Estimates.
Further details in relation to the DMO can be found in Section Two.
28

Chapter Two - Resourcing
PAYMENTS TO DEFENCE HOUSING AUSTRALIA
Control Arrangements There have been the following changes to the DHA Board members since the publication of the Portfolio Budgets Statements 2008-09:
Chairman Mr D Volker AO Commercial Director The Hon JAL (Sandy) Macdonald[1]
Note 1. The Hon. JAL (Sandy) Macdonald replaced Ms SA Chaplain as one of the Commercial Directors.
There have been the following changes to the Advisory Committee members since the publication of the Portfolio Budgets Statements 2008-09:
DCN Rear Admiral DR Thomas AM DCAF Air Vice Marshal G Brown
Resourcing DHA provides housing and relocation services for ADF members. The revised estimate for 2008-09 for the purchase of these services from DHA is $542.2m, compared with the estimate of $443.6m in the Portfolio Budget Statements 2008-09, an increase of around $98.6m. The variations in the cost of the provision of these services are due to increases in the cost of housing and relocation services, mainly associated with market rental increases.
29


CHAPTER THREE – DEFENCE REFORM
This chapter remains as was reported in the Portfolio Budget Statements 2008-09.


CHAPTER FOUR — CAPITAL INVESTMENT PROGRAM
OVERVIEW
DEFENCE CAPABILITY PLAN
THE APPROVED MAJOR CAPITAL INVESTMENT PROGRAM
CAPITAL FACILITIES PROJECTS
OTHER INVESTMENTS
CAPITAL RECEIPTS


Chapter Four – Capital Investment Program
OVERVIEW
The Capital Investment Program is comprised of the Defence Capability Plan, the Approved Major Capital Equipment Program, the Capital Facilities Program, Other Capital Purchases, and Capital Receipts.
The Capital Investment Program for 2008-09, including capital receipts, has decreased by $295.5m to $6,060.2m since the 2008-09 Budget. Table 1.4.1 shows the revised investment program by both its capital and operating elements and an explanation of the variations in each element of the Capital Investment Program follows.
Table 1.4.1—Variation in the Capital Investment Program 2008-09
Group/Item Description
2008-09 Budget
Estimate $m
2008-09 Revised
Estimate $m
Variation $m
1 Defence Capability Plan 405.7 188.2 -217.5
2 Approved Major Capital Investment Program 4,419.9 4,321.2 -98.7
3 Major Capital Investment Program (1+2) 4,825.6 4,509.4 -316.2
4 Capital Facilities 838.3 758.3 -80.0
5 Other Investment 757.4 858.2 100.8
6
Total Capital Investment Program (3+4+5)
- Capital Component[1]
6,421.4
5,950.5
6,125.9
5,646.5
-295.5
-304.0
- Operating Component 470.8 479.3 8.6
7 Net Capital Receipts[2]
Net Capital Investment Program [3] (6+7)
-65.7
6,355.7
-65.7
6,060.2
0.0
-295.5 Notes: 1. Cross reference with Budgeted Financial Statements Table 1.7.11 2. Cross reference with Table 1.4.6 3. Capital Investment Program incorporates the effect of reprogramming the Enhanced Land Force and Approved Major
Capital Investment Program as outlined in Chapter Two – Resourcing. Table 1.2.5.
35

Chapter Four– Capital Investment Program
DEFENCE CAPABILITY PLAN
Since the previous White Paper was released in 2000, more than 197 major projects or phases of projects have been approved with an approximate cost of $47.1b. Further projects will be considered for approval in 2008-09.
The reduction in the Defence Capability Plan of $217.5m does not represent a real decrease in funding for major capital, but rather the progressive transfer of funding for newly approved projects to the DMO and Defence Groups ($222.0m) offset by exchange and other variations of $4.5m. An amount of $86.3m has been transferred to the DMO and a further $45.5m to Defence groups so that further development work and acquisition action can proceed. As part of the Additional Estimates, an amount of $90.2m has been reprogrammed out of 2008-09 to meet programming requirements for the Enhanced Land Force.
Major projects recently approved by the Government Major projects approved since the 2008-09 Budget include:
SECOND PASS APPROVAL
• Capability Assurance Program 1 (AIR 5276 CAP 1)
• C-130J Block Upgrade Project (AIR 5440 Phase 1) - one year of Global Program Arrangements
• Tactical Information Exchange Domain - Data Links (JP 2089 Phase 2A)
• LAND 106 Enhanced Land Force Additional Upgraded M113 Armoured Personnel Carriers.
FIRST PASS APPROVAL
• Overlander Field Vehicles and Trailers (LAND 121 Phase 4)
• Seahawk Capability Assurance Program 1 (AIR 9000 SCAP 1).
THE APPROVED MAJOR CAPITAL INVESTMENT PROGRAM
The Approved Major Capital Investment Program has decreased overall by $98.7m since the 2008-09 Budget to $4,321.2m. This includes a decrease in the DMO element of the program of $99.6m, for the following reasons:
• Reprogramming of $514.0m to future years to meet the expected funding requirements
• A net foreign exchange adjustment of $396.8m
• Transfers between the investment and sustainment budgets of $34.5m
• Transfers of funding to the Approved Major Capital Investment Program for new projects of $52.1m.
An overview of the Top 30 projects in the Approved Major Capital Investment Program can be found in Section Two – Defence Materiel Organisation.
The element of the program not managed by DMO has increased by $0.9m. This is due to funding transferred from the Defence Capability Plan to Defence groups.
36

Chapter Four – Capital Investment Program
CAPITAL FACILITIES PROJECTS
The capital facilities program comprises approved and unapproved major and medium projects.
The Major Capital Facilities Program has decreased by $80m to $758m since the 2008-09 Budget. This is due largely to reprogramming the Enhanced Land Force Stage 1 capital facilities project. There are a number of other outstanding budget transfers which will result in a rise in the projected budget outcome against this program once completed.
Approved major capital facilities projects Major capital facilities projects have expenditure over $15m and are subject to Government approval and review by the Joint Statutory Committee on Public Works (PWC). Medium facilities projects have expenditure between $250,000 and $15m. Projects between $5m and $15m are subject to Government approval, but are not reviewed by the PWC. Projects under $5m are approved by departmental delegates. Details of these projects are provided in this section.
Table 1.4.2 and the following descriptions provide details on progress and expenditure since the 2008-09 Budget on major capital facilities projects.
37

Chapter Four– Capital Investment Program
Table 1.4.2—Approved major capital facilities projects by state and federal electorate Total
Estimated Expenditure
$m
Cumulative Expenditure to
30 June 2008 $m
2008-09 Budget
Estimate $m
2008-09 Additional
Estimate $m
Variation$m
NEW SOUTH WALES Eden-Monaro
Headquarters Joint Operations Command
Command, Control, Communications, Computing and Intelligence Systems 99.7[1] 43.1 42.1 56.6 14.5
Gilmore
HMAS Albatross Multi Role Helicopter Facilities [2] [3] 137.2 - - 5.1 5.1
Hughes
Holsworthy Special Operations Working Accommodation and Base Redevelopment Stage 1 207.7 171.1 13.0 14.6 1.6
171 Aviation Squadron Relocation 92.0 70.1 17.0 13.2 -3.8
Newcastle
Williamtown RAAF Williamtown Redevelopment Stage 1 and Airborne Early Warning and Control Works and Multi Role Tanker Transport Pavement Works 132.7 [4] 117.0 15.4 12.0 -3.4
Total New South Wales 669.3 401.3 87.5 101.5 14.0 VICTORIA Indi Bandiana
Joint Logistics Unit Victoria – Warehousing [5] 36.4 - - 3.0 3.0
Jagajaga
Watsonia Defence Force School of Signals 101.3 2.6 60.0 25.0 -35.0
McEwen
Monegeetta Land Engineering Agency Test Services Relocation 35.9 - 20.0 10.0 -10.0
Total Victoria 173.6 2.6 80.0 38.0 -42.0 QUEENSLAND Blair
Amberley RAAF Amberley Redevelopment Stage 3 331.5 12.5 130.0 150.0 20.0 Heavy Airlift Capability – Permanent Facilities [6] 268.2 11.3 80.0 80.0 -Australian Super Hornet Facilities [7] 111.7 - - 16.0 16.0
Brisbane
Enoggera
Base Redevelopment Stage 1 80.2 - - 25.5 25.5
Multi Role Helicopter Facilities [2] [3] - - - 7.0 7.0
Groom
Oakey
Multi Role Helicopter Facilities [2] [3] - - - 8.2 8.2
Leichhardt
38

Y
Cairns HMAS Cairns Redevelopment 76.3 52.1 18.0 18.0 -
Herbert
Townsville Lavarack Barracks Redevelopment Stage 4 207.2 42.3 69.0 69.0 -Heavy Airlift Capability – Permanent Facilities [6] - - 10.0 14.0 4.0
Multi Role Helicopter Facilities [2] [3] - - - 7.7 7.7
Total Queensland 1,075.1 118.2 307.0 395.4 88.4 SOUTH AUSTRALIA
Wakefield Edinburgh Defence Precinct
Hardened and Networked Army Facilities 597.4 [8] - - 85.0 85.0
RAAF Edinburgh Heavy Airlift Capability – Permanent Facilities [6] - 1.7 20.0 20.0 -
Total South Australia 597.4 1.7 20.0 105.0 85.0 WESTERN AUSTRALIA
Pearce RAAF Pearce – Redevelopment Stage 1 142.2 0.7 34.0 36.8 2.8 Heavy Airlift Capability – Permanent Facilities [6] - - 0.2 0.2 -
Total Western Australia 142.2 0.7 34.2 37.0 2.8 NORTHERN TERRITORY Lingiari RAAF Tindal
Redevelopment Stage 5 58.7 - - 2.0 2.0
Airborne Early Warning and Control Aircraft Facilities 64.2 - - 4.8 4.8
Timber Creek Bradshaw Field Training Area Infrastructure 72.6 64.8 7.6 6.5 -1.1
Solomon
Darwin Darwin Naval Base – Patrol Boat Facilities 19.2 13.2 1.4 2.0 0.6 Robertson Barracks Redevelopment 72.1 - - 9.7 9.7
RAAF Darwin Redevelopment Stage 2 49.8 - - 1.8 1.8 Heavy Airlift Capability – Permanent Facilities [6] - 1.6 20.0 16.0 -4.0
Total Northern Territory 336.6 79.6 29.0 42.8 13.8 AUSTRALIAN CAPITAL TERRITORFraser
HMAS Creswell Redevelopment 83.6 - 9.7 6.0 -3.7
Total Australian Capital Territory 83.6 - 9.7 6.0 -3.7
Chapter Four – Capital Investment Program
39

OTHER Malaysia Royal Malaysian Air Force – Butterworth
Australian Defence Force Facilities Rationalisation 23.6 0.5 14.0 11.5 -2.5
Total Other 23.6 0.5 14.0 11.5 -2.5
Programming Adjustments - - -28.9 -161.8 -132.9 TOTAL 3,101.4 604.6 552.5 575.4 22.9
Chapter Four– Capital Investment Program
Notes 1. Increase in approved budget is related to price supplementation, out-turning, land acquisition, relocation and project
management. 2. Multi Role Helicopter Facilities – Permanent Facilities has an approved budget of $168.7m covering four locations: HMAS
Albatross (Nowra); RAAF Townsville; the Army Aviation Centre (Oakey); and Gallipoli Barracks, Enoggera (Brisbane). 3. Multi Role Helicopter Facilities – Permanent Facilities budget excludes $31.5m for simulation facilities being delivery by the
DMO and is reported by the DMO. 4. The budget figure is the approved project budgets for the RAAF Williamtown Redevelopment Stage 1 and Airborne Early
Warning and Control Works projects and the addition of the Multi Role Tanker Transport Pavement Works project. Budget amended subsequent to publication of Portfolio Budget Statements 2008-09.
5. Project approved after publication of the Portfolio Budget Statements 2008-09. 6. RAAF Amberley Heavy Airlift Capability – Permanent Facilities has an approved budget of $268.2m covering five locations,
RAAF Amberley, RAAF Edinburgh, RAAF Darwin, RAAF Townsville and RAAF Pearce. 7. The $117.1m budget for Australian Super Hornet facilities includes both the development and delivery phase budgets. The
delivery phase budget of $111.7m may need to be adjusted to reflect the final expenditure from the development phase. 8. The $623.7m budget for Hardened and Networked Army facilities includes the development and delivery phase budgets.
The delivery phase budget of $597.4m has been updated to reflect the final expenditure from the development phase.
The descriptions of the major capital facilities projects remain as reported for approved projects in the Portfolio Budget Statements 2008-09 except for the following information:
New South Wales
Multi Role Helicopter Facilities The project received parliamentary clearance in June 2008. Construction is expected to commence in late 2008 with completion expected in 2010.
Holsworthy—Special Operations Working Accommodation and Base Redevelopment Stage 1 The expenditure forecast in the Portfolio Budget Statements 2008-09 has been revised to reflect the 2007-08 outcome and the current construction program. Completion of the project is currently scheduled for 2009.
Williamtown—RAAF Williamtown Redevelopment Stage 1 and Airborne Early Warning and Control Works and Multi Role Tanker Transport Pavement Works This project has provided a major upgrade to the base infrastructure. The remaining project element, construction of an Ordnance Loading Complex, has commenced. Expenditure has been revised to reflect the current construction program. Completion is anticipated in 2009.
Victoria
Bandiana—Joint Logistics Unit Victoria Warehousing The project received parliamentary clearance in September 2008. Construction is expected to commence in late 2008 and be completed in 2010.
Watsonia—Defence Force School of Signals Construction commenced in October 2008 after delays were experienced in tendering the works. Completion is now scheduled for 2011.
40
Chapter Four – Capital Investment Program
Monegeetta—Land Engineering Agency Test Services Relocation Construction is expected to commence by early 2009 after delays were experienced in tendering the works. Completion remains scheduled for 2010.
Queensland
Amberley—RAAF Amberley Redevelopment Stage 3 Construction started in 2008 and is on schedule. Expenditure has been revised to reflect the updated project schedule. Key facilities are planned to be completed progressively from 2010 through to late 2011.
RAAF Amberley—Australian Super Hornet Facilities This project will provide new, expanded and modified facilities and infrastructure at RAAF Amberley to support the introduction of the Super Hornet aircraft. Parliamentary clearance was received in October 2008. Construction is expected to commence by early 2009 and be completed in late 2010.
Enoggera—Base Redevelopment Stage 1 The project received parliamentary clearance in June 2008. Site facilities were established in August 2008 and procurement of subcontractors is progressing. Construction is expected to be completed in 2010.
South Australia
Edinburgh Defence Precinct—Hardened and Networked Army Facilities The project received parliamentary clearance in June 2008. Construction is expected to commence in late 2008.
Northern Territory
Katherine—RAAF Tindal Redevelopment Stage 5 The project received parliamentary clearance in June 2008. Construction is expected to commence in 2009, with completion expected in 2011.
Katherine—RAAF Tindal Airborne Early Warning and Control Facilities The project received parliamentary clearance in June 2008. Construction is expected to commence in 2009, with completion expected in 2011.
Timber Creek—Bradshaw Field Training Area Infrastructure The residual works remain scheduled for completion by late 2008. Expenditure has been revised to reflect the current construction program.
Darwin—Darwin Naval Base Patrol Boat Facilities Expenditure has been revised to reflect delays experienced in obtaining satisfactory tenders for the remaining works. These remaining minor works are now scheduled for completion in 2009.
Darwin—Robertson Barracks Redevelopment Parliamentary clearance was obtained in June 2008. Construction is expected to commence in 2009, with completion expected in 2011.
Darwin—RAAF Darwin Redevelopment Stage 2 The project received parliamentary clearance in June 2008. Construction is expected to commence in 2009, with completion expected in 2011.
41

Chapter Four– Capital Investment Program
Australian Capital Territory
HMAS Creswell Redevelopment Expenditure has been revised downwards to reflect the extended design and procurement phase of the project. The project is expected to be complete in 2010.
Malaysia
RMAF Butterworth—Australian Defence Force Facilities Rationalisation Expenditure forecast in the Portfolio Budget Statements 2008-09 has been revised to reflect the updated construction program. Construction commenced in 2008 and is planned to be completed in 2010.
Status of Major Projects foreshadowed for Government and/or Parliamentary Joint Statutory Committee on Public Works Consideration in 2008-09 During 2008-09, Defence expects to present a number of facilities proposals to the Government and the PWC. Table 1.4.3 provides details of the proposed major capital projects expected to be referred to the PWC in 2008-09. In some cases, the projects may require the Government’s approval before referral to the committee.
42

Chapter Four – Capital Investment Program
Table 1.4.3—Program of Major Works (by state, federal electorate and locality)
Actual/Indicative Referral Date Hearing Date [1]
VICTORIA Indi Bandiana: Joint Logistics Unit Victoria – Warehousing Expediency motion
4 September 2008 McEwen Puckapunyal Redevelopment 6 November 2008 In development
QUEENSLAND Blair Amberley: RAAF Amberley – Australian Super Hornet Facilities
20 August 2008 Expediency motion23 October 2008
Brisbane Enoggera: Base Redevelopment Stage 1 Expediency motion
25 June 2008 RAAF Townsville
Additional Chinook Helicopter Facilities November 2009 February 2010 In development
SOUTH AUSTRALIA Wakefield Edinburgh Defence Precinct: Hardened and Networked Army Facilities
Expediency motion25 June 2008
Edinburgh: RAAF Edinburgh Redevelopment Stage 2 February 2009 April 2009 In development
NORTHERN TERRITORY Solomon Darwin: RAAF Darwin Redevelopment Stage 2 Expediency motion
25 June 2008 Darwin: Robertson Barracks Redevelopment (includes Land 907 and Hardened and Networked Army projects)
Expediency motion25 June 2008
Lingiari Katherine: RAAF Tindal Redevelopment Stage 5
Expediency motion25 June 2008
Katherine: RAAF Tindal Airborne Early Warning and Control Facilities
Expediency motion25 June 2008
VARIOUS LOCATIONS Multi Role Helicopter Facilities Expediency motion
25 June 2008 Enhanced Land Force – Facilities Stage 1 November 2008 January 2009 In development
Actual/Indicative Current Status
January 2009 In development Note 1. Hearing dates will be subject to the Committee’s consideration and agreement.
The descriptions for the proposed major capital facilities remain as reported in the Portfolio Budget Statements 2008-09.
Approved projects under private financing arrangements
The descriptions for the approved projects under private financing arrangements remain as reported in the Portfolio Budget Statements 2008-09 except for the following information:
Eden-Monaro—Headquarters Joint Operations Command The building infrastructure for the Headquarters Joint Operations Command Project was handed over to Defence by the contractors, Praeco Pty Ltd, on 9 July 2008, when the financial lease and service payments began. There is $36.8m (including GST) budgeted for these payments in 2008-09.
43
Chapter Four– Capital Investment Program
Single Living Environment and Accommodation Precinct (Single LEAP)
Holsworthy – Single LEAP Construction of 600 Living-In Accommodation (LIA) units at Holsworthy Barracks is substantially completed. Construction commenced in February 2007 with the operational phase expected to commence in mid November 2008.
Enoggera – Single LEAP Construction of 500 LIA units at Gallipoli Barracks is well advanced. Construction began in May 2007 with the 30 year operational phase expected to commence two months ahead of schedule in early 2009.
RAAF Amberley – Single LEAP Construction of 295 LIA units at Amberley is complete. Construction began in April 2007 with the 30 year operational phase beginning on 16 June 2008.
Approved projects being developed for private financing arrangements
Project Single Living Environment and Accommodation Precinct (Single LEAP) Phase 2 Project Single LEAP Phase 2 represents an extension to the Phase 1 requirements for permanent Living-in-Accommodation to meet Defence’s previously identified priorities. Project Single LEAP Phase 2 will provide 3,535 contemporary units and associated facilities and services at a further 17 ADF bases across Australia as identified in Table 1.4.9 (page 54) in the Portfolio Budget Statements 2008-09.
Following review by the PWC, Phase 2 was approved by Parliament in June 2007. The two-stage tendering process for Phase 2 commenced with an Expression of Interest stage beginning in October 2006 that resulted in the short listing of four consortia consisting of: Living In Partnerships; Pinnacle Housing (LEAP2); Plenary Living; and Ubique Infrastructure Services. The tender evaluation process has been finalised and an announcement of the preferred proponent is anticipated in late 2008.
Other major capital facilities projects foreshadowed for 2008-09
Defence Site Platypus Contamination Remediation The Sydney Harbour Federation Trust is planning for the future use of the site and will undertake the necessary contamination remediation, in accordance with the requirements of the NSW Environment Protection Authority.
Approved medium capital facilities projects
Table 1.4.4 shows spending in 2008-09 for medium facilities projects.
44
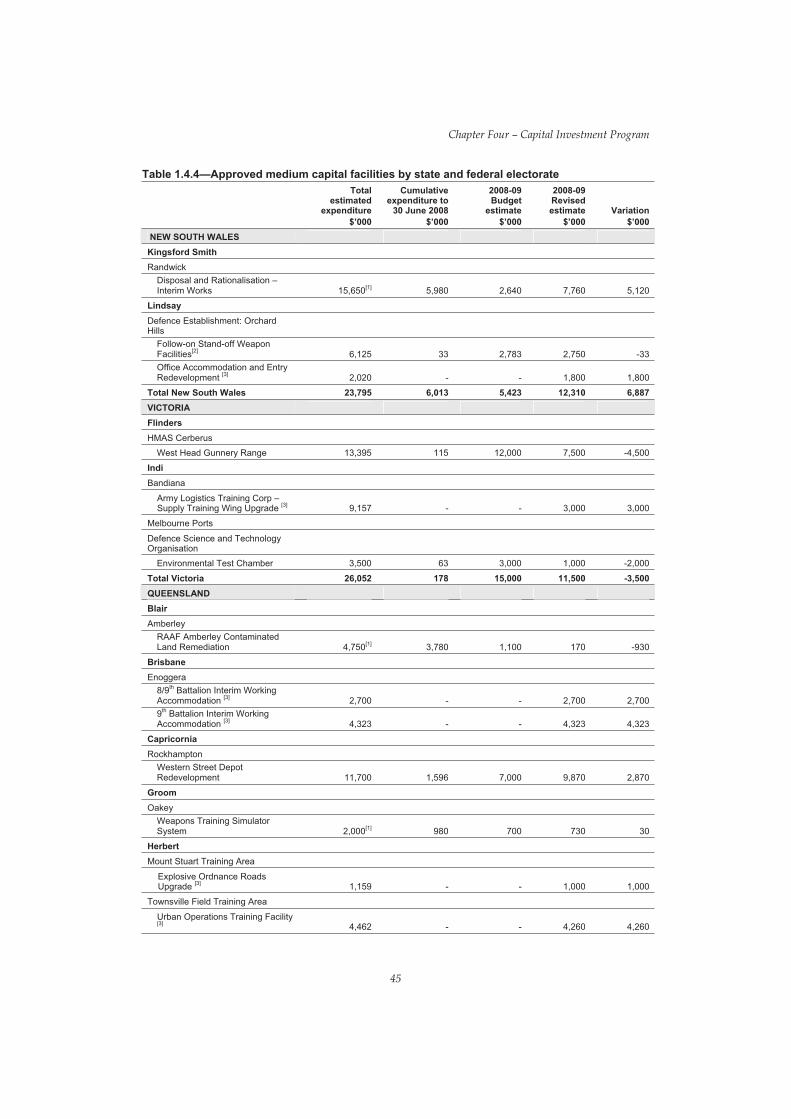
Chapter Four – Capital Investment Program
Table 1.4.4—Approved medium capital facilities by state and federal electorate
45
Total Cumulative 2008-09 2008-09 estimated
expenditure $’000
expenditure to 30 June 2008
$’000
Budget estimate
$’000
Revised estimate
$’000 Variation
$’000 NEW SOUTH WALES Kingsford Smith Randwick
Disposal and Rationalisation – Interim Works 15,650[1] 5,980 2,640 7,760 5,120
Lindsay Defence Establishment: Orchard Hills
Follow-on Stand-off Weapon Facilities[2] 6,125 33 2,783 2,750 -33Office Accommodation and Entry Redevelopment [3] 2,020 - - 1,800 1,800
Total New South Wales 23,795 6,013 5,423 12,310 6,887 VICTORIA
Flinders HMAS Cerberus
West Head Gunnery Range 13,395 115 12,000 7,500 -4,500
Indi Bandiana
Army Logistics Training Corp – Supply Training Wing Upgrade [3] 9,157 - - 3,000 3,000
Melbourne Ports
Defence Science and Technology Organisation
Environmental Test Chamber 3,500 63 3,000 1,000 -2,000
Total Victoria 26,052 178 15,000 11,500 -3,500 QUEENSLAND
Blair Amberley
RAAF Amberley Contaminated Land Remediation 4,750[1] 3,780 1,100 170 -930
Brisbane Enoggera
8/9th Battalion Interim Working Accommodation [3] 2,700 - - 2,700 2,7009th Battalion Interim Working Accommodation [3] 4,323 - - 4,323 4,323
Capricornia Rockhampton
Western Street Depot Redevelopment 11,700 1,596 7,000 9,870 2,870
Groom Oakey
Weapons Training Simulator System 2,000[1] 980 700 730 30
Herbert Mount Stuart Training Area
Explosive Ordnance Roads Upgrade [3] 1,159 - - 1,000 1,000
Townsville Field Training Area
Urban Operations Training Facility [3] 4,462 - - 4,260 4,260
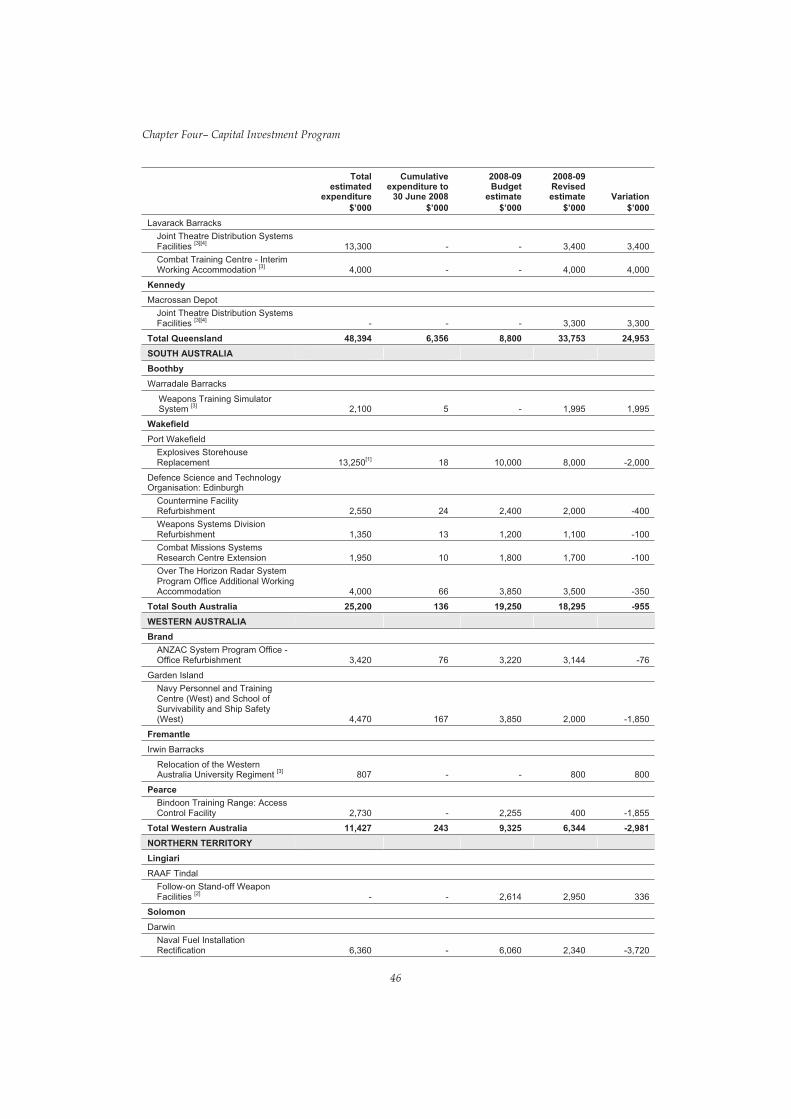
Total estimated
expenditure $’000
Cumulative expenditure to
30 June 2008 $’000
2008-09 Budget
estimate $’000
2008-09 Revised estimate
$’000 Variation
$’000 Lavarack Barracks
Joint Theatre Distribution Systems Facilities [3][4] 13,300 - - 3,400 3,400 Combat Training Centre - Interim Working Accommodation [3] 4,000 - - 4,000 4,000
Kennedy
Macrossan Depot Joint Theatre Distribution Systems Facilities [3][4] - - - 3,300 3,300
Total Queensland 48,394 6,356 8,800 33,753 24,953 SOUTH AUSTRALIA
Boothby Warradale Barracks
Weapons Training Simulator [3] System 2,100 5 - 1,995 1,995
Wakefield
Port Wakefield Explosives Storehouse Replacement 13,250[1] 18 10,000
Defence Science and Technology Organisation: Edinburgh
Countermine Facility Refurbishment 2,550 24 2,400 2,000 -400Weapons Systems Division Refurbishment 1,350 13 1,200 1,100 -100Combat Missions Systems Research Centre Extension 1,950 10 1,800 1,700 -100Over The Horizon Radar System Program Office Additional Working Accommodation 4,000 66 3,850 3,500 -350
Total South Australia 25,200 136 19,250 18,295 -955 WESTERN AUSTRALIA
Brand ANZAC System Program Office - Office Refurbishment 3,420 76 3,220 3,144 -76
Garden Island
Navy Personnel and Training Centre (West) and School of
Survivability and Ship Safety (West) 4,470 167 3,850 2,000 -1,850
Fremantle
Irwin Barracks
Relocation of the Western Australia University Regiment [3] 807 - - 800 800
Pearce Bindoon Training Range: Access
Control Facility 2,730 - 2,255 400 -1,855
Total Western Australia 11,427 243 9,325 6,344 -2,981 NORTHERN TERRITORY Lingiari
RAAF Tindal Follow-on Stand-off Weapon Facilities [2] - - 2,614 2,950 336
Solomon
Darwin Naval Fuel Installation Rectification 6,360 - 6,060 2,340 -3,720
Chapter Four– Capital Investment Program
46
8,000 -2,000
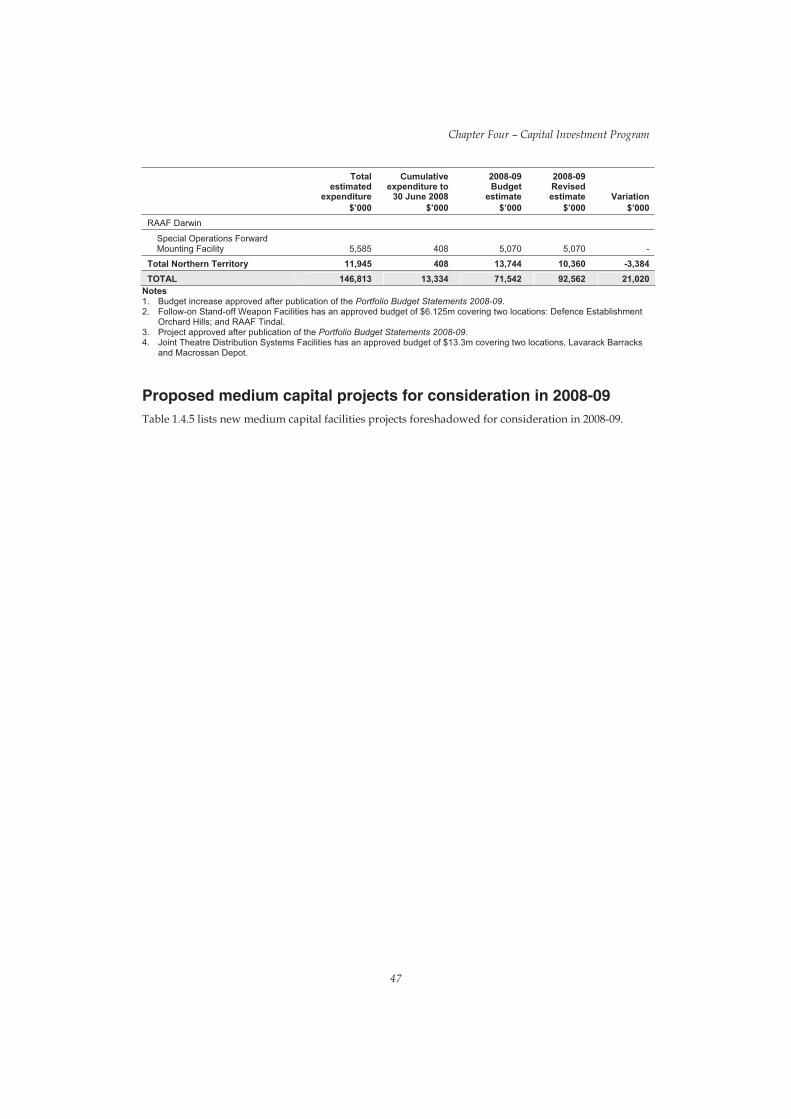
Total Cumulative 2008-09 2008-09 estimated expenditure to Budget Revised
expenditure 30 June 2008 estimate estimate Variation $’000 $’000 $’000 $’000 $’000
RAAF Darwin
Special Operations Forward Mounting Facility 5,585 408 5,070 5,070 -
Total Northern Territory 11,945 408 13,744 10,360 -3,384 TOTAL 146,813 13,334 71,542 92,562 21,020
Chapter Four – Capital Investment Program
Notes 1. Budget increase approved after publication of the Portfolio Budget Statements 2008-09. 2. Follow-on Stand-off Weapon Facilities has an approved budget of $6.125m covering two locations: Defence Establishment
Orchard Hills; and RAAF Tindal. 3. Project approved after publication of the Portfolio Budget Statements 2008-09. 4. Joint Theatre Distribution Systems Facilities has an approved budget of $13.3m covering two locations, Lavarack Barracks
and Macrossan Depot.
Proposed medium capital projects for consideration in 2008-09 Table 1.4.5 lists new medium capital facilities projects foreshadowed for conside ration in 2008-09.
47

Chapter Four– Capital Investment Program
Table 1.4.5—Proposed medium capital projects for consideration in 2008-09.
48
Federal Electorate Locality Status
NEW SOUTH WALES Lindsay Orchard Hills: Office Accommodation and Entry Redevelopment
Orchard Hills: Modification of Standard Missile Test Facility Hughes Liverpool Military Area: High Voltage Reticulation System Upgrade Hunter Singleton: School of Infantry: Urban Operations Training Facility Wentworth HMAS Watson: Bridge Simulator
Approved In development In development In development In development
VICTORIA Indi McEwen Gippsland
Bandiana: Supply Wing Army Logistics Training Centre Upgrade Land Engineering Agency: Proving Ground Perimeter Security
RAAF East Sale: School of Air Traffic – Tower Visual Simulator Facility Extension
Approved In development In development
QUEENSLAND Capricornia
Flynn
Groom Herbert
Shoalwater Bay Training Area: Camp Growl Stage 2 Field Firing Target System
3 Phase Power Supply Over the Horizon Radar: 3 Phase Power Supply
Oakey Fuel Farm upgrade Lavarack Barracks: Stockpile Remediation
Mount Stuart Training Area: Explosive Ordnance Depot Townsville Field Training Area: Urban Operations Training Facility
In development In development In development Cancelled by Sponsor In development Withdrawn: incorporated into major capital facilities project Approved Approved
SOUTH AUSTRALIA Boothby
Wakefield Warradale Barracks: Weapons Training Simulation System Facility
Port Wakefield: Battery Firing Facility Port Wakefield: Vibration Test Facility
Edinburgh Defence Precinct: Minor Units Facilities Woomera Prohibited Area: Disposal Explosive Ordnance Storage Facilities
Approved In development In development In development In development
WESTERN AUSTRALIA Curtin Swanbourne: Campbell Barracks: Helicopter Underwater Escape Training
Facility Swanbourne: Campbell Barracks: Project REDFIN Facilities Stage 1A
In development
In development
TASMANIA Bass Franklin
Scottsdale: Specific Nutritional Capability Fort Direction: Explosive Ordnance Upgrade
In development In development
NORTHERN TERRITORY Solomon Darwin: Shoal Bay Receiving Station Facilities Upgrade
Timber Creek: Bradshaw Field Training Area – Instrumented Air Weapons Range Robertson Barracks: 1 Aviation Regiment Facilities Upgrade Robertson Barracks: Barracks Power Supply Upgrade
In development In development
In development In development
AUSTRALIAN CAPITAL TERRITORY Fraser 1 Joint Public Affairs Unit Facility
Data Centre Infrastructure Upgrade Majura Field Training Area: Camp Blake Kitchen Upgrade
In development In development In development
VARIOUS LOCATIONS
Countermine Capability Facilities (Land 144) Special Operations: National Storage Facilities Joint Theatre Distribution Systems Facilities
In development In development Approved
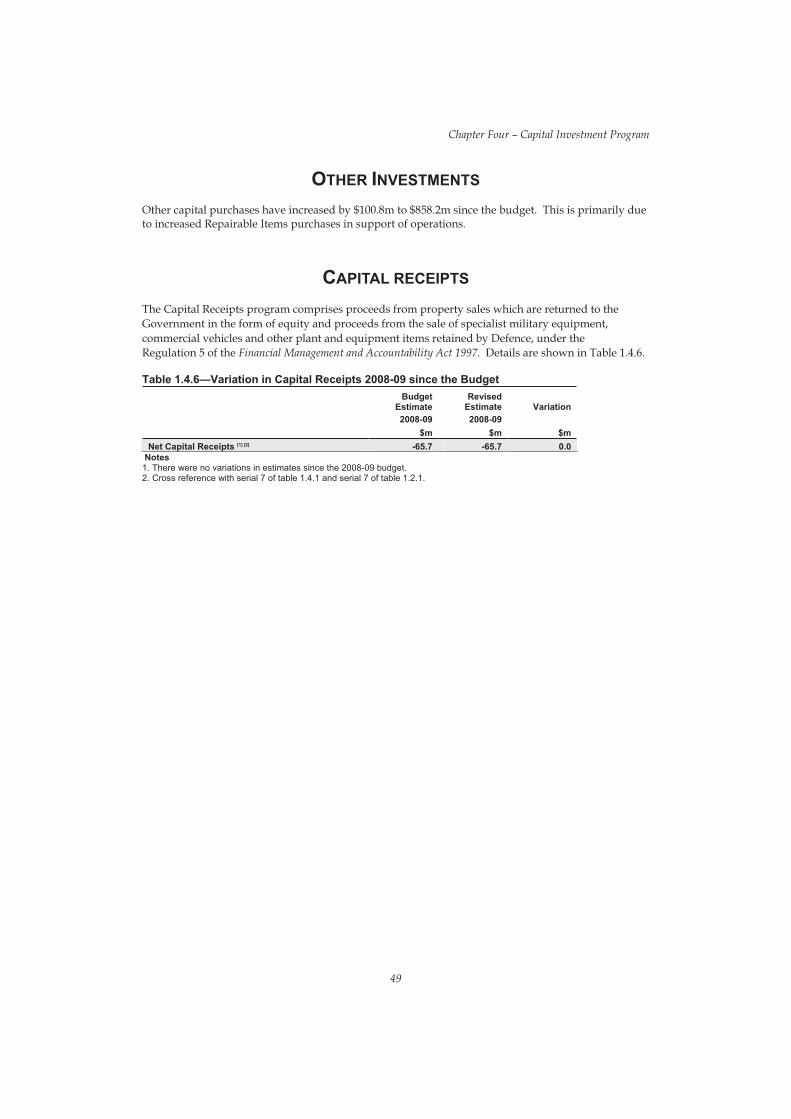
Chapter Four – Capital Investment Program
OTHER INVESTMENTS
Other capital purchases have increased by $100.8m to $858.2m since the budget. This is primarily due to increased Repairable Items purchases in support of operations.
CAPITAL RECEIPTS
The Capital Receipts program comprises proceeds from property sales which are returned to the Government in the form of equity and proceeds from the sale of specialist military equipment, commercial vehicles and other plant and equipment items retained by Defence, under the Regulation 5 of the Financial Management and Accountability Act 1997. Details are shown in Table 1.4.6.
Table 1.4.6—Variation in Capital Receipts 2008-09 since the Budget Budget
Estimate Revised
Estimate Variation 2008-09 2008-09
$m $m $m Net Capital Receipts [1] [2] -65.7 -65.7 0.0
Notes 1. There were no variations in estimates since the 2008-09 budget. 2. Cross reference with serial 7 of table 1.4.1 and serial 7 of table 1.2.1.
49


CHAPTER FIVE —PEOPLE
WORKFORCE OVERVIEW
WORKFORCE SUMMARY


Chapter Five – People
WORKFORCE OVERVIEW
Defence’s workforce priorities remain as reported in the Portfolio Budget Statements 2008-09.
WORKFORCE SUMMARY
The revised strength of the Defence workforce (excluding the DMO civilian workforce, which is shown separately in Part 2 – Defence Materiel Organisation) is shown in Table 1.5.1 below. The revised strength of the total workforce in 2008-09 is forecast to be 63 more than the 2008-09 Budget Estimate of 90,581, including ADF employees (+1), civilian APS staff (+61) and Professional Service Providers (+1).
Table 1.5.1—Planned workforce allocation for the 2008-09 revised and forward estimates 2008-09 Budget
Estimate
2008-09 Revised
Estimate Variation
2009-10 Forward Estimate
2010-11 Forward Estimate
2011-12 Forward
Estimates
ADF Permanent Force
Navy 13,230 13,231 1 13,671 13,753
13,745
Army 27,461 27,463 2 28,350 28,904 29,649
Air Force 14,056 14,054 -2 14,168 14,220 14,113
1 Total Permanent Force 54,747 54,748 1 56,189 56,877 57,507
Active Reserve Force
Navy 2,000 2,000 - 2,050 2,050
2,100
Army 14,600 14,600 - 14,600 14,600 14,600
Air Force 1,700 2,000 300 2,100 2,200 2,300
2 Sub-total Active Reserve Force 18,300 18,600 300 18,750 18,850 19,000
High Readiness Reserve
Navy - - - - - -
Army 715 715 - 1,080 1,360 1,560
Air Force 900 600 -300 600 600 600
3 Sub-total High Readiness Reserve 1,615 1,315 -300 1,680 1,960 2,160
4 Total Reserves (2+3) 19,915 19,915 - 20,430 20,810 21,160
5 Total ADF Employees (1+4) 74,662 74,663 1 76,619 77,687 78,667
6 7 Professional Service Providers [1]
Australian Public Service 14,754
1,165
14,815
1,166
61
1
14,827
1,166
14,845
1,165
14,832
1,165
8 Total Civilian Employees (6+7)
9 Total Workforce Strength (5+8)
15,919
90,581
15,981
90,644
62
63
15,993
92,612
16,010
93,697
15,997
94,664 Note 1. PSPs are individuals under contract filling APS line positions.
53

Chapter Five - People
Over the next three years, the total workforce is funded to grow by 4,020 from the revised estimate of 90,644 in 2008-09 to 94,664 in 2011-12.
Table 1.5.2—Breakdown of personnel numbers by service and rank 2008-09 Budget
Estimate 2008-09
Revised Estimate [1] Navy
1 Star and above 48 48
Senior Officers [2] 476 476
Officers 2,822 2,822
Other Ranks 9,784 9,785
Gap Year Participants [3] 100 100
Sub total: Permanent Navy
Reserve Forces [4]
13,230
2,000
13,231
2,000
Total Navy 15,230 15,231 [1] Army
1 Star and above 74 73
Senior Officers [2] 719 720
Officers 4,978 5,031
Other Ranks 21,190 21,139
Gap Year Participants [3] 500 500
Sub-total: Permanent Army
Reserve Forces [4]
27,461
15,315
27,463
15,315
Total Army 42,776 42,778
Air Force [1]
1 Star and above 49 49
Senior Officers [2] 585 583
Officers 3,837 3,837
Other Ranks 9,335 9,335
Gap Year Participants [3] 250 250
Sub-total: Permanent Air Force 14,056 14,054
Reserve Forces [4] 2,600 2,600
Total Air Force 16,656 16,654 [1] APS
Senior Executives [5] 122 124
Senior Officers [2] 3,874 3,941
Other APS Staff 10,758 10,750
Sub-total APS 14,754 14,815
Professional Service Providers [6] 1,165 1,166
Total Workforce 90,581 90,644 Notes 1. Permanent Forces and APS numbers are forecasts of the average strength for 2008-09. Numbers for the APS and PSPs
excludes the DMO. 2. Senior Officers are of Colonel or Lieutenant Colonel rank equivalent and substantive Australian Public Service Executive
Level 1 and 2. 3. ADF Recruitment and Retention Initiative 4. Reserve figures represent the actual numbers of Active and High Readiness Reservists who render service. Reservists on
full-time service are reported in the Permanent Force. 5. The figures for Senior Executive Service include the Secretary of the Department of Defence. 6. Professional Service Providers are individuals under contract filling APS line positions.
54

Chapter Five – People
Employee expenses The revised estimate for employee expenses in 2008–09 is $8,127.3m, representing an increase of $186.0m from the 2008–09 budget estimate of $7,941.3m. Details are shown in Table 1.5.3
Table 1.5.3—Revisions to employee expenses Budget
Estimate 2008-09
$m
Revised Estimate 2008-09
$m Variation
$m
Forward Estimate 2009-10
$m
Forward Estimate 2010-11
$m
Forward Estimate 2011-12
$m Military Employee
Permanent Salary, Allowances, Superannuation and Leave Housing Health Services
5,353.8 481.3 245.8
5,545.3 481.3 246.4
191.5 -
0.6
6,028.7 497.7 263.8
6,329.7 513.7 288.3
6,512.1 536.7 302.2
Fringe Benefits Tax Reserves Salary and Allowances
300.0 192.2
298.9 192.2
-1.1 -
314.5 197.7
347.0 200.4
358.1 202.6
Sub-total Military Employee Expenses 6,573.1 6,764.1 191.0 7,302.4 7,679.1 7,911.7 Civilian Employee
Salary, Allowances, Superannuation and Leave Other Expenses including Fringe Benefits Tax
1,361.8
6.4
1,356.8
6.4
-5.0
-
1,303.6
6.7
1,418.9
7.3
1,402.8
7.6
Sub-total Civilian Employee Expenses 1,368.2 1,363.2 -5.0 1,310.3 1,426.2 1,410.4 Total Employees 7,941.3 8,127.3 186.0 8,612.7 9,105.3 9,322.1
55

SECTION TWO
OUTCOMES AND PLANNED PERFORMANCE


CHAPTER SIX —PLANNED OUTCOME PERFORMANCE
OUTCOMES AND PERFORMANCE INFORMATION
OUTPUT DESCRIPTIONS
OUTCOME ONE – AUSTRALIA’S NATIONAL INTERESTS ARE PROTECTED AND ADVANCED THROUGH THE PROVISION OF MILITARY CAPABILITIES AND THE PROMOTION OF SECURITY AND STABILITY
OUTCOME TWO – MILITARY OPERATIONS AND OTHER TASKS DIRECTED BY THE GOVERNMENT TO ACHIEVE THE DESIRED RESULTS
OUTCOME THREE – DEFENCE’S SUPPORT TO THE AUSTRALIAN COMMUNITY AND CIVILIAN AUTHORITIES TO ACHIEVE THE DESIRED RESULTS


Chapter Six –Planned Outcome Performance
OUTCOMES AND PERFORMANCE INFORMATION
&
OUTPUT DESCRIPTIONS
Defence’s outcome and output structure remains as reported in the Portfolio Budget Statements 2008-09, except for Health Services transferring from Output 1.6 Defence Support to Output 1.9 Vice Chief of the Defence Force. As part of the transfer, Health Services was also renamed Joint Health Command.
61
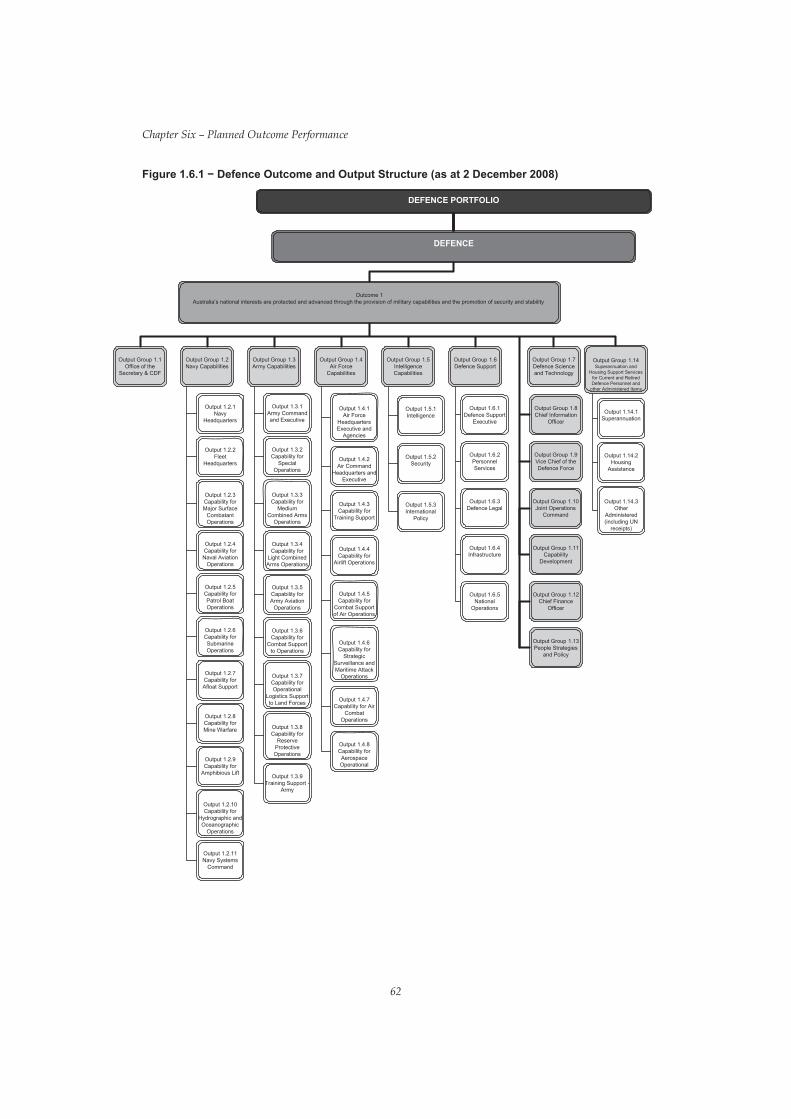
Chapter Six – Planned Outcome Performance
Figure 1.6.1 í Defence Outcome and Output Structure (as at 2 December 2008)
DEFENCE PORTFOLIO
DEFENCE
Outcome 1 Australia’s national interests are protected and advanced through the provision of military capabilities and the promotion of security and stability
Output Group 1.2 Navy Capabilities
Output 1.2.1 Navy
Headquarters
Output 1.2.2 Fleet
Headquarters
Output 1.2.3 Capability for Major Surface
Combatant Operations
Output 1.2.4 Capability for Naval Aviation
Operations
Output 1.2.5 Capability for Patrol Boat Operations
Output 1.2.6 Capability for Submarine Operations
Output 1.2.7 Capability for Afloat Support
Output 1.2.8 Capability for Mine Warfare
Output 1.2.9 Capability for
Amphibious Lift
Output 1.2.10 Capability for
Hydrographic and Oceanographic
Operations
Output 1.2.11 Navy Systems
Command
Output Group 1.3 Army Capabilities
Output Group 1.4 Air Force
Capabilities
Output 1.3.2 Capability for
Special Operations
Output 1.3.3 Capability for
Medium Combined Arms
Operations
Output 1.3.1 Army Command and Executive
Output 1.3.4 Capability for
Light Combined Arms Operations
Output 1.3.6 Capability for
Combat Support to Operations
Output 1.3.5 Capability for Army Aviation
Operations
Output 1.3.7 Capability for Operational
Logistics Support to Land Forces
Output 1.3.8 Capability for
Reserve Protective Operations
Output 1.3.9 Training Support
Army
Output 1.4.2 Air Command
Headquarters and Executive
Output 1.4.3 Capability for
Training Support
Output 1.4.1 Air Force
Headquarters Executive and
Agencies
Output 1.4.4 Capability for
Airlift Operations
Output 1.4.6 Capability for
Strategic Surveillance and Maritime Attack
Operations
Output 1.4.5 Capability for
Combat Support of Air Operations
Output 1.4.7 Capability for Air
Combat Operations
Output 1.4.8 Capability for Aerospace Operational
Output Group 1.5 Intelligence Capabilities
Output Group 1.6 Defence Support
Output Group 1.7 Defence Science and Technology
Output Group 1.8 Chief Information
Officer
Output Group 1.9 Vice Chief of the Defence Force
Output Group 1.14 Superannuation and
Housing Support Services for Current and Retired Defence Personnel and
other Administered Items
Output 1.6.2 Personnel Services
Output 1.6.1 Defence Support
Executive
Output 1.6.4 Infrastructure
Output 1.6.5 National
Operations
Output 1.6.3 Defence Legal
Output 1.14.2 Housing
Assistance
Output 1.14.3 Other
Administered (including UN
receipts)
Output 1.14.1 Superannuation
Output Group 1.1 Office of the
Secretary & CDF
Output 1.5.3 International
Policy
Output 1.5.2 Security
Output 1.5.1 Intelligence
Output Group 1.10 Joint Operations
Command
Output Group 1.11 Capability
Development
Output Group 1.12 Chief Finance
Officer
Output Group 1.13 People Strategies
and Policy
62
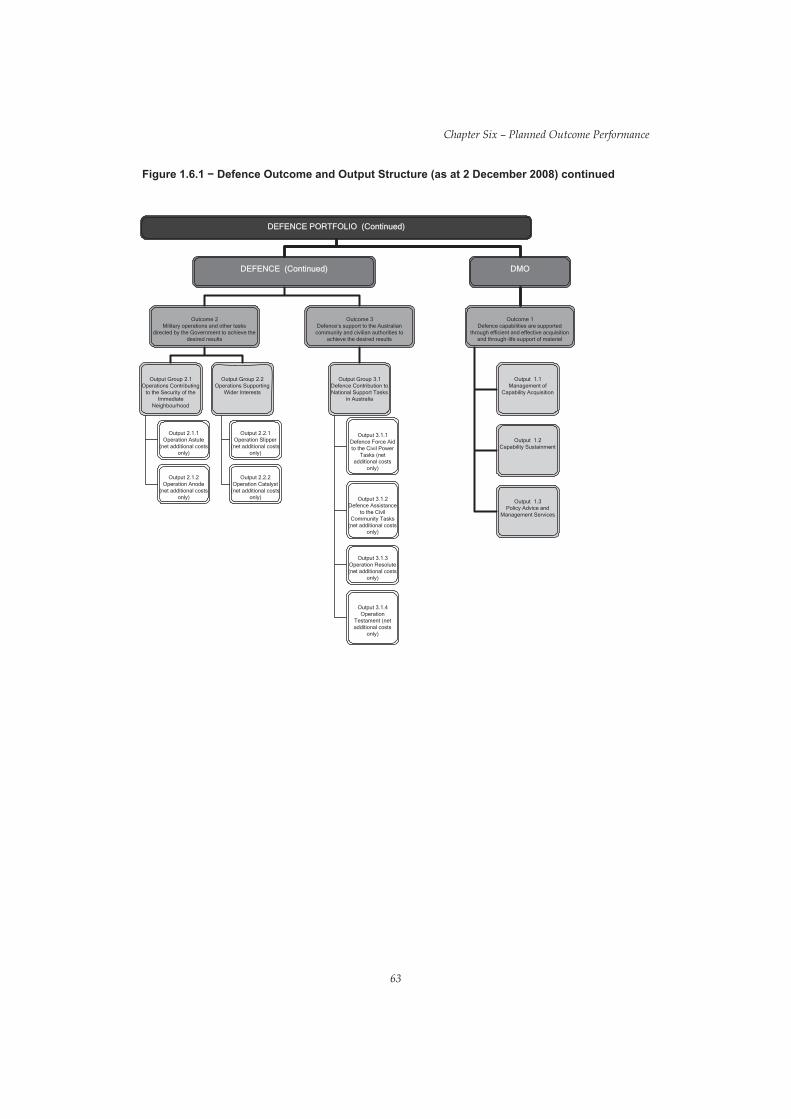
Chapter Six – Planned Outcome Performance
Figure 1.6.1 í Defence Outcome and Output Structure (as at 2 December 2008) continued
DEFENCE PORTFOLIO (Continued)
DEFENCE (Continued) DMO
Outcome 2 Military operations and other tasks
directed by the Government to achieve the desired results
Outcome 3 Defence’s support to the Australian community and civilian authorities to
achieve the desired results
Outcome 1 Defence capabilities are supported
through efficient and effective acquisition and through-life support of materiel
Output Group 2.1 Operations Contributing
to the Security of the Immediate
Neighbourhood
Output 2.1.1 Operation Astute
(net additional costs only)
Output 2.1.2 Operation Anode
(net additional costs only)
Output Group 2.2 Operations Supporting
Wider Interests
Output 2.2.1 Operation Slipper
(net additional costs only)
Output 2.2.2 Operation Catalyst
(net additional costs only)
Output Group 3.1 Defence Contribution to National Support Tasks
in Australia
Output 3.1.1 Defence Force Aid to the Civil Power
Tasks (net additional costs
only)
Output 3.1.2 Defence Assistance
to the Civil Community Tasks
(net additional costs only)
Output 3.1.3 Operation Resolute (net additional costs
only)
Output 3.1.4 Operation
Testament (net additional costs
only)
Output 1.1 Management of
Capability Acquisition
Output 1.2 Capability Sustainment
Output 1.3 Policy Advice and
Management Services
63

OUTCOME ONE – AUSTRALIA’S NATIONAL INTERESTS ARE PROTECTED AND ADVANCED THROUGH THE PROVISION OF
MILITARY CAPABILITIES AND THE PROMOTION OF SECURITY AND STABILITY
The strategy for this Outcome remains as reported in the Portfolio Budget Statements 2008-09.
Resource Statement Table 1.6.1 provides additional detail of Budget appropriations and the total resourcing for Outcome 1: Australia’s national interests are protected and advanced through the provision of military capabilities and the promotion of security and stability.
Table 1.6.1—Total Resources Available for Outcome One[1][2]
2008-09 Budget
estimate $’000
2008-09 Revised esti
$’000mate
2009-10 Forward esti
$’000mate
2010-11 Forward estimate
2011-12 Forward estimate
$’000Var
$’000 iation
Outcome One: Australia’s national interests are protected and advanced through the provision of military capabilities and the promotion of security and stability
$’000
Output group 1.1—Office of the Secretary and CDF Revenues from other sources 981
Departmental outputs 82,848
892
87,883
-90
5,036
904
79,592
914
80,573
933
80,115
Output group 1.2—Navy Capabilities Revenues from other sources 52,697
Departmental outputs 3,636,215
52,490
3,812,268
-206
176,052
44,453
3,757,757
44,367
3,693,598
46,042
3,728,921
Output group 1.3—Army Capabilities Revenues from other sources 65,986
Departmental outputs 4,568,693
59,803
4,795,768
-6,183
227,074
60,581
4,829,350
61,307
4,853,861
62,595
5,069,763
Output group 1.4—Air Force Capabilities Revenues from other sources 115,981
Departmental outputs 3,866,691
105,114
3,837,250
-10,867
-29,441
105,800
3,764,204
107,069
3,647,074
109,317
3,635,181
Output group 1.5—Intelligence Capabilities Revenues from other sources 36,269
Departmental outputs 647,795
32,947
629,247
-3,322
-18,548
33,652
667,967
26,371
657,337
24,180
666,807
Output group 1.6—Defence Support Administered items -specific purpose payment 23,300
Revenues from other sources 228,643
Departmental outputs 3,108,623
23,300
208,539
3,244,835
-
-20,104
136,211
-
214,682
3,365,865
-
219,781
3,479,449
-
228,118
3,523,760
Output group 1.7—Defence Science and Technology Revenues from other sources 24,537
Departmental outputs 351,990
25,390
385,070
853
33,081
31,262
397,442
31,637
388,882
32,302
391,042
Output group 1.8—Chief Information Officer Revenues from other sources 6,383
Departmental outputs 699,984
5,785
656,375
-598
-43,609
5,329
671,559
4,497
666,080
4,591
667,883
Chapter Six – Planned Outcome Performance
64

Output group 1.9—Vice Chief of the Defence Force Revenues from other sources 273,713 263,250 -10,463 266,673 269,874 275,537
Departmental outputs 262,016 325,503 63,487 322,349 315,648 324,044
Output group 1.10—Joint Operations Command Revenues from other sources 481 436 -45 441 447 456
Departmental outputs 48,437 38,763 -9,675 29,514 29,501 29,458
Output group 1.11—Capability Development Revenues from other sources - - - - - -
Departmental outputs 342,919 179,240 -163,679 485,103 552,339 890,149
Output group 1.12—Chief Finance Officer Revenues from other sources 6,220 44,826 38,606 64,434 73,525 76,862
Departmental outputs 421,723 736,970 315,248 2,091,881 2,798,403 2,389,263
Output group 1.13—People Strategies and Policy Revenues from other sources - - - - - -
Departmental outputs 341,132 370,112 28,980 360,882 365,765 361,997
Output group 1.14—Superannuation and Housing Support Services for Current and Retired Defence Personnel and other Administered Items Special appropriations: Defence Force Retirement Benefits Act, 1948 Part VIC, s.82ZJ (1)[3]
91,430 91,430 - 90,897
Defence Force Retirement and Death Benefits Act, 1973 Part XII, s.125 (3)[3]
90,301 89,590
1,439,070 1,439,070 - 1,430,693
Military Superannuation and Benefits Act, 1991 Part V, s.17[3]
1,360,200 1,360,200 - 1,465,300
Defence Force (Home Loans Assistance) Act, 1990 Part IV, s.38[3]
52,638 11,000 -41,638 6,000
Defence Home Ownership Assistance Scheme Act 2008 Part VI, s.84[3]
- 39,868 39,868 63,354
Parliamentary Entitlements Act, 1990 Part I, s.11[3] - - - -
1,421,299
1,573,500
6,000
82,324
-
1,410,110
1,686,600
6,000
100,177
-
Administered items 2,943,338 2,941,568 -1,770 3,056,244 3,173,424 3,292,477
Total resourcing Total departmental outputs 18,379,067 19,099,284 720,217 20,823,465 21,528,510 21,758,383
Total administered items 2,966,638 2,964,868 -1,770 3,056,244 3,173,424 3,292,477
Total revenue from other sources (s. 31)[4] 811,892 799,472 -12,420 828,211 839,789 860,933
Equity Injection 2,365,736 1,805,180 -560,556 4,372,754 5,238,354 5,079,787 Total resources for outcome 1 24,523,332 24,668,804 145,472 29,080,674 30,780,077 30,991,580
Chapter Six – Planned Outcome Performance
Notes 1. Departmental outputs = Expenses – Total income. 2. Revenues from other sources = Total revenue. 3. These are accrual estimates. 4. Does not include Net Capital Receipts (NCR). NCR forms part of the Capital Budget Statement (refer table 1.7.11 on p104).
65

Output Group 1.1 – Office of the Secretary and CDF
Performance information is as reported in the Portfolio Budget Statements 2008-09.
Cost summary for Output Group 1.1 Table 1.6.2—Cost summary
2008-09 Budget
estimate $’000
2008-09 Revised estimate
$’000 Variation
$’000
2009-10 Forward estimate
$’000
2010-11 Forward estimate
$’000
2011-12 Forward estimate
$’000
EXPENSES
Employees
Suppliers
Grants
Depreciation and amortisation
Finance cost Write-down of assets and impairment of assets
Net losses from sale of assets
Other expenses
Total expenses
53,564
29,812
89
354
– – – – – –
10
– – – – – –
– – – – – –
83,829
54,893
33,307
89
486
–
88,775
1,329
3,495
–
132
-10
4,946
54,063
25,832
90
511
–
80,496
55,778
25,007
91
611
–
81,487
57,619
22,740
93
596
–
81,048
INCOME
Revenues
Goods and services
Other revenue
Total revenue
Gains Reversals of previous asset write-downs
Net gain from sale of assets
Other gains
Total gains
Total income
-979
-3
-981
– – – – – –
– – – – – –
– – – – – –
– – – – – –
-981
-887
-5
-892
-892
92
-2
90
90
-899
-5
-904
-904
-909
-5
-914
-914
-928
-5
-933
-933
Net cost of 1.1 Office of the Secretary and CDF 82,848 87,883 5,036 79,592 80,573 80,115
Chapter Six – Planned Outcome Performance
66

Chapter Six – Planned Outcome Performance
Output Group 1.2 – Navy Capabilities
Performance information is as reported in the Portfolio Budget Statements 2008-09 except for the following revisions.
Table 1.6.3—2008-09 Force Element Targets
Output Vessel/Aircraft/Unit/Chart Production Number Budget Estimate Revised Estimate
1.2.4 Squirrels 13 4,000 Flying Hours 3,200 Flying Hours[1]
1.2.6 Submarines 6 684 URD 762 URD[2]
1.2.8 Coastal mine hunters 6 2,088 URD 2,071 URD[3]
Auxiliary minesweepers 2 730 URD 638 URD[4]
1.2.9 Heavy landing craft 6 1,958 URD 1,911 URD[5]
Survey motor launches 4 1,148 URD 1,016 URD[6]
1.2.10 Laser airborne depth sounder aircraft 1 900 Flying Hours 600 Flying Hours[7]
Defence Support: New Military Geographic Information (MGI) products/editions 10 30[8]
Notes 1. The decrease in Squirrel flying hours is due to a reduction in the number of pilot trainees. Navy is actively managing the
number of aircrew trainees in the system following the reduction in demand associated with the cancellation of the Super Seasprite program.
2. Unit Ready Days (URD) are the number of days that a force element is available for tasking, by the Fleet Commander, either outside of major maintenance and within planned readiness requirements or in accordance with contracted availability. The increase in the submarine URD is due to rescheduling of maintenance periods for HMAS Farncomb.
3. The decrease in the URD target for coastal mine hunters is due to the refit for HMAS Huon being brought forward to June 2009.
4. The decrease in the URD target for the auxiliary minesweepers is due to a refit extension for MSA Bandicoot as a result of a defect in the main propulsion shaft.
5. The decrease in the URD target for the heavy landing craft is due to the postponement of a mariner skills evaluation, following major maintenance, for HMAS Balikpapan from December 2008 to February 2009.
6. The decrease in the survey motor launches URD is due to an amendment of the upgrade schedule as a result of availability of the slipway and to take advantage of optimal tides for slipping. HMA Ships Mermaid and Paluma are now entering upgrades in early October 2008 and late November 2008, respectively, rather than late October and early December as originally planned.
7. The decrease in the laser airborne depth sounder aircraft flying hours is due to delays in the sensor upgrade. The aircraft was originally due to return to service in August 2008, but has been delayed because of technical issues from validation testing that identified key system deficiencies.
8. The increase in the target number for the new military geographic information products/editions is due to additional requirements for Border Protection Command.
67

Chapter Six – Planned Outcome Performance
Cost summary for Output Group 1.2 Table 1.6.4—Cost summary
2008-09 2008-09 2009-10 2010-11 2011-12 Budget
estimate Revised estimate Variation
Forward estimate
Forward estimate
Forward estimate
EXPENSES
$’000 $’000 $’000 $’000 $’000 $’000
Employees 1,312,505 1,346,212 33,707 1,410,417 1,470,492 1,533,008
Suppliers 1,355,147 1,458,069 102,922 1,410,229 1,370,479 1,434,890
Grants – – – – – –
Depreciation and amortisation 1,015,076 935,102 -79,974 850,648 750,025 659,350
Finance cost – 90,006 90,006 90,006 90,006 90,006
Write-down of assets and impairment of assets 31,684 58,663 26,979 62,822 76,074 76,094
Net losses from sale of assets – – – – – –
Other expenses – – – – – –
Total expenses 3,714,412 3,888,052 173,640 3,824,122 3,757,076 3,793,348
INCOME
Revenues Goods and services -47,647 -43,183 4,464 -44,353 -44,269 -45,939
Other revenue -5,049 -9,307 -4,258 -100 -98 -103
Total revenue -52,697 -52,490 206 -44,453 -44,367 -46,042
Gains Reversals of previous asset write-downs -25,500 -23,294 2,206 -21,912 -19,111 -18,385 Net gain from sale of assets – – – – – – Other gains – – – – – – Total gains -25,500 -23,294 2,206 -21,912 -19,111 -18,385 Total income -78,197 -75,784 2,412 -66,365 -63,478 -64,427
Net cost of 1.2 Navy Capabilities 3,636,215 3,812,268 176,052 3,757,757 3,693,598 3,728,921
68

Output Group 1.3 – Army Capabilities
Performance information is as reported in the Portfolio Budget Statements 2008-09 except for the following revisions.
Table 1.6.5—2008-09 Force Element Targets Aircraft Number Budget Estimate 2008-09
Flying Hours Revised Estimate
2008-09 Flying Hours
CH-47D Chinook 6 1,270 1,570[1]
Note 1. Increase due to operational flying hours for Operation Slipper.
Cost summary for Output Group 1.3 Table 1.6.6—Cost summary
2008-09 Budget
estimate $’000
2008-09 Revised estimate
$’000 Variation
$’000
2009-10 Forward estimate
$’000
2010-11 Forward estimate
$’000
2011-12 Forward estimate
$’000
EXPENSES
Employees
Suppliers
Grants
Depreciation and amortisation
Finance cost Write-down of assets and impairment of assets
Net losses from sale of assets
Other expenses
Total expenses
2,566,784
1,474,789
78
616,608
– – – – – –
18,121
– – – – – –
– – – – – –
4,676,379
2,676,425
1,732,040
10,078
446,579
29,935
4,895,057
109,641
257,251
10,000
-170,029
11,814
218,677
2,829,774
1,663,000
79
421,981
17,062
4,931,896
2,924,354
1,657,385
80
367,589
9,154
4,958,562
3,105,277
1,713,790
81
350,412
5,564
5,175,124
INCOME
Revenues
Goods and services
Other revenue
Total revenue
Gains
Reversals of previous asset write-downs
Net gain from sale of assets
Other gains
Total gains
Total income
-65,986
– – – – – –
-65,986
-41,700 -38,163
–
– – – – – –
-41,700
-107,686
-59,803
-59,803
-1,323
-39,486
-99,289
6,183
6,183
3,537 -40,172
-1,323
2,214
8,397
-60,581
-60,581
-1,793
-41,965
-102,546
-61,307
-61,307
-41,204
-2,190
-43,394
-104,701
-62,595
-62,595
-39,869
-2,897
-42,766
-105,361
Net cost of 1.3 Army Capabilities 4,568,693 4,795,768 227,074 4,829,350 4,853,861 5,069,763
Chapter Six – Planned Outcome Performance
69

Output Group 1.4 – Air Force Capabilities
Performance information is as reported in the Portfolio Budget Statements 2008-09 except for the following revisions.
Table 1.6.7—2008-09 Force Element Targets Output 1.4.4: Capability for Airlift Operations
Aircraft Number Budget Estimate 2008-09 Flying Hours
Revised Estimate 2008-09 Flying Hours
C-17 Globemaster III 4 5,000 4,000[1]
Note 1. Reduction due to a number of factors including logistics, crewing and aircraft modifications that should be incrementally
improved during 2008-09 and fully remediated in 2009-10.
Cost summary for Output Group 1.4 Table 1.6.8—Cost summary
2008-09 2008-09 2009-10 2010-11 2011-12 Budget
estimate Revised estimate Variation
Forward estimate
Forward estimate
Forward estimate
$’000 $’000 $’000 $’000 $’000 $’000
EXPENSES
Employees 1,340,578 1,378,432 37,854 1,426,118 1,487,684 1,544,839
Suppliers 1,479,011 1,615,457 136,446 1,593,501 1,557,546 1,631,522
Grants – – – – – –
Depreciation and amortisation 1,176,091 938,132 -237,959 838,461 695,908 553,755
Finance cost – 7,885 7,885 7,885 7,885 7,885
Write-down of assets and impairment of assets 19,693 32,407 12,714 36,907 39,520 47,864
Net losses from sale of assets – – – – – –
Other expenses – – – – – –
Total expenses 4,015,372 3,972,313 -43,060 3,902,872 3,788,543 3,785,865
INCOME
Revenues
Goods and services -115,981 -105,114 10,867 -105,800 -107,069 -109,317
Other revenue – – – – – –
Total revenue -115,981 -105,114 10,867 -105,800 -107,069 -109,317
Gains
Reversals of previous asset write-downs -32,700 -29,949 2,751 -32,868 -34,400 -41,367
Net gain from sale of assets – – – – – –
Other gains – – – – – –
Total gains -32,700 -29,949 2,751 -32,868 -34,400 -41,367
Total income -148,681 -135,063 13,618 -138,668 -141,469 -150,684
Net cost of 1.4 Air Force Capabilities 3,866,691 3,837,250 -29,442 3,764,204 3,647,074 3,635,181
Chapter Six – Planned Outcome Performance
70

Output Group 1.5 – Intelligence Capabilities
Performance information is as reported in the Portfolio Budget Statements 2008-09.
Cost summary for Output Group 1.5 Table 1.6.9—Cost summary
2008-09 Budget
estimate $’000
2008-09 Revised estimate
$’000 Variation
$’000
2009-10 Forward estimate
$’000
2010-11 Forward estimate
$’000
2011-12 Forward estimate
$’000
EXPENSES
Employees
Suppliers
Grants
Depreciation and amortisation
Finance cost Write-down of assets and impairment of assets
Net losses from sale of assets
Other expenses
Total expenses
269,147
353,441
– – – – – –
59,885
– – – – – –
1,591
– – – – – –
– – – – – –
684,064
275,959
347,816
42,207
205
666,187
6,812
-5,625
-17,678
-1,386
-17,877
295,523
370,398
35,566
132
701,619
309,260
350,390
24,058
–
683,708
317,246
350,539
23,202
–
690,987
INCOME
Revenues
Goods and services
Other revenue
Total revenue
Gains
Reversals of previous asset write-downs
Net gain from sale of assets
Other gains
Total gains
Total income
-36,188
-81
-36,269
–
– – – – – –
– – – – – –
–
-36,269
-32,797
-150
-32,947
-3,993
-3,993
-36,940
3,391
-69
3,322
-3,993
-3,993
-671
-33,500
-152
-33,652
–
–
-33,652
-26,217
-154
-26,371
–
–
-26,371
-24,023
-157
-24,180
–
–
-24,180
Net cost of 1.5 Intelligence Capabilities 647,795 629,247 -18,548 667,967 657,337 666,807
Chapter Six – Planned Outcome Performance
Defence Cooperation Program
Performance information is as reported in the Portfolio Budget Statements 2008-09.
71
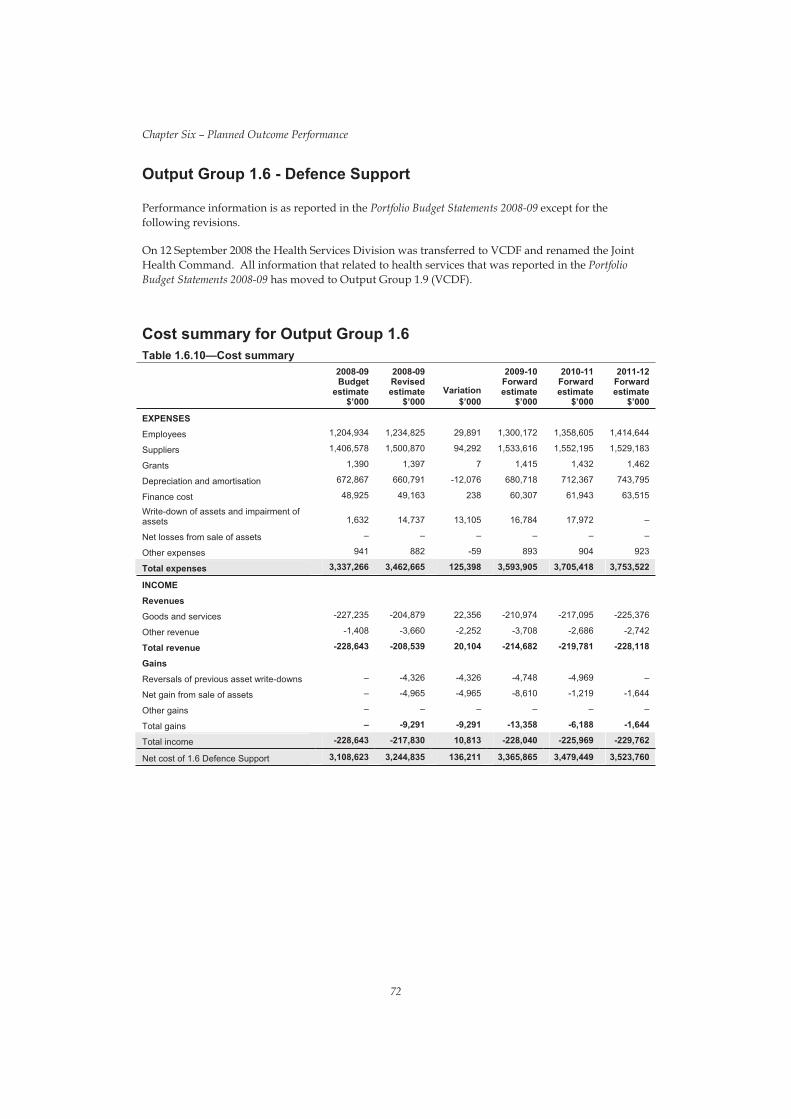
Chapter Six – Planned Outcome Performance
Output Group 1.6 - Defence Support
Performance information is as reported in the Portfolio Budget Statements 2008-09 except for the following revisions.
On 12 September 2008 the Health Services Division was transferred to VCDF and renamed the Joint Health Command. All information that related to health services that was reported in the Portfolio Budget Statements 2008-09 has moved to Output Group 1.9 (VCDF).
Cost summary for Output Group 1.6 Table 1.6.10—Cost summary
2008-09 Budget
estimate $’000
2008-09 Revised estimate
$’000 Variation
$’000
2009-10 Forward estimate
$’000
2010-11 Forward estimate
$’000
2011-12 Forward estimate
$’000
EXPENSES
Employees
Suppliers
Grants
Depreciation and amortisation
Finance cost Write-down of assets and impairment of assets
Net losses from sale of assets
Other expenses
Total expenses
1,204,934
1,406,578
1,390
672,867
48,925
1,632
–
941
3,337,266
1,234,825
1,500,870
1,397
660,791
49,163
14,737
–
882
3,462,665
29,891
94,292
7
-12,076
238
13,105
–
-59
125,398
1,300,172
1,533,616
1,415
680,718
60,307
16,784
–
893
3,593,905
1,358,605
1,552,195
1,432
712,367
61,943
17,972
–
904
3,705,418
1,414,644
1,529,183
1,462
743,795
63,515
–
–
923
3,753,522
INCOME
Revenues
Goods and services
Other revenue
Total revenue
Gains
Reversals of previous asset write-downs
Net gain from sale of assets
Other gains
Total gains
Total income
-227,235
-1,408
-228,643
–
–
–
–
-228,643
-204,879
-3,660
-208,539
-4,326
-4,965
–
-9,291
-217,830
22,356
-2,252
20,104
-4,326
-4,965
–
-9,291
10,813
-210,974
-3,708
-214,682
-4,748
-8,610
–
-13,358
-228,040
-217,095
-2,686
-219,781
-4,969
-1,219
–
-6,188
-225,969
-225,376
-2,742
-228,118
–
-1,644
–
-1,644
-229,762
Net cost of 1.6 Defence Support 3,108,623 3,244,835 136,211 3,365,865 3,479,449 3,523,760
72
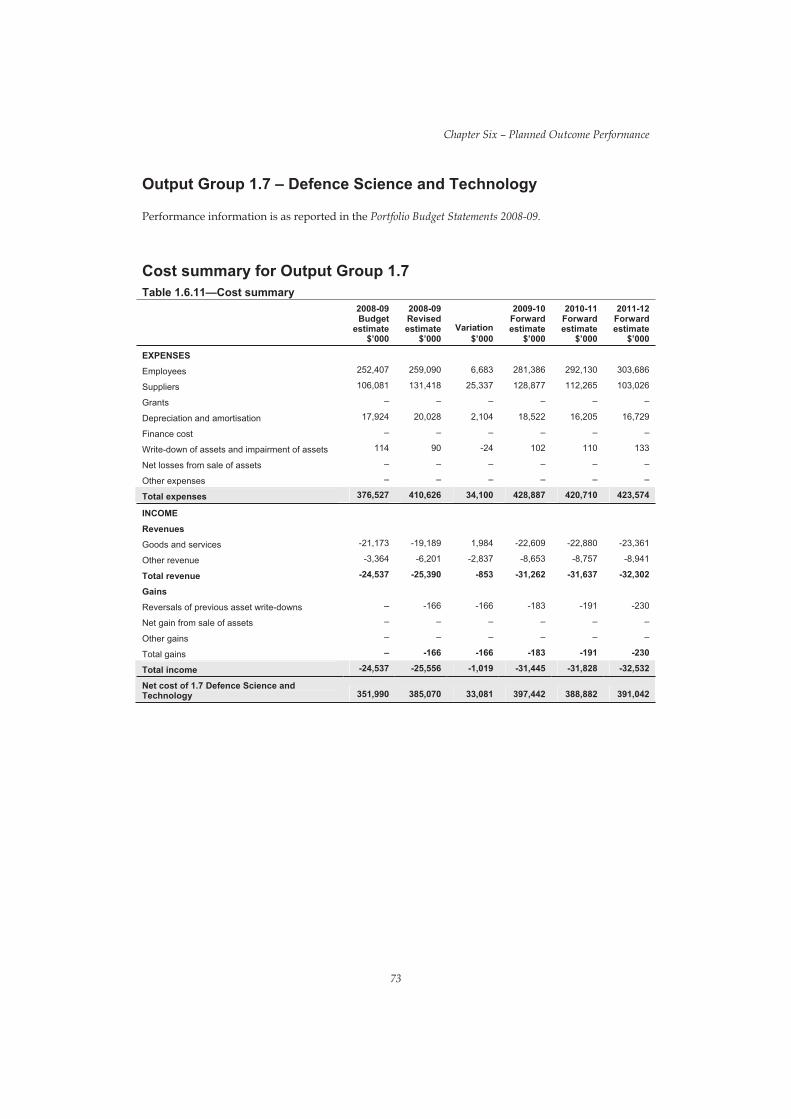
Output Group 1.7 – Defence Science and Technology
Performance information is as reported in the Portfolio Budget Statements 2008-09.
Cost summary for Output Group 1.7 Table 1.6.11—Cost summary
2008-09 Budget
estimate $’000
2008-09 Revised estimate
$’000 Variation
$’000
2009-10 Forward estimate
$’000
2010-11 Forward estimate
$’000
2011-12 Forward estimate
$’000
EXPENSES
Employees
Suppliers
Grants
Depreciation and amortisation
Finance cost
Write-down of assets and impairment of assets
Net losses from sale of assets
Other expenses
Total expenses
252,407
106,081
– – – – – –
17,924
– – – – – –
114
– – – – – –
– – – – – –
376,527
259,090
131,418
20,028
90
410,626
6,683
25,337
2,104
-24
34,100
281,386
128,877
18,522
102
428,887
292,130
112,265
16,205
110
420,710
303,686
103,026
16,729
133
423,574
INCOME
Revenues
Goods and services
Other revenue
Total revenue
Gains
Reversals of previous asset write-downs
Net gain from sale of assets
Other gains
Total gains
Total income
-21,173
-3,364
-24,537
–
– – – – – –
– – – – – –
–
-24,537
-19,189
-6,201
-25,390
-166
-166
-25,556
1,984
-2,837
-853
-166
-166
-1,019
-22,609
-8,653
-31,262
-183
-183
-31,445
-22,880
-8,757
-31,637
-191
-191
-31,828
-23,361
-8,941
-32,302
-230
-230
-32,532
Net cost of 1.7 Defence Science and Technology 351,990 385,070 33,081 397,442 388,882 391,042
Chapter Six – Planned Outcome Performance
73

Output Group 1.8 – Chief Information Officer
Performance information is as reported in the Portfolio Budget Statements 2008-09.
Cost summary for Output Group 1.8 Table 1.6.12—Cost summary
2008-09 Budget
estimate $’000
2008-09 Revised estimate
$’000 Variation
$’000
2009-10 Forward estimate
$’000
2010-11 Forward estimate
$’000
2011-12 Forward estimate
$’000
EXPENSES
Employees
Suppliers
Grants
Depreciation and amortisation
Finance cost Write-down of assets and impairment of assets
Net losses from sale of assets
Other expenses
Total expenses
90,698
524,144
– – – – – –
89,102
– – – – – –
2,423
– – – – – –
– – – – – –
706,367
92,948
488,970
80,242
–
662,160
2,250
-35,174
-8,860
-2,423
-44,207
96,585
502,955
77,348
–
676,888
99,287
493,131
78,159
–
670,577
106,416
489,022
77,036
–
672,474
INCOME
Revenues
Goods and services
Other revenue
Total revenue
Gains
Reversals of previous asset write-downs
Net gain from sale of assets
Other gains
Total gains
Total income
-6,383
– – – – – –
-6,383
– – – – – –
– – – – – –
– – – – – –
– – – – – –
-6,383
-5,785
-5,785
-5,785
598
598
598
-5,329
-5,329
-5,329
-4,497
-4,497
-4,497
-4,591
-4,591
-4,591
Net cost of 1.8 Chief Information Officer 699,984 656,375 -43,609 671,559 666,080 667,883
Chapter Six – Planned Outcome Performance
74
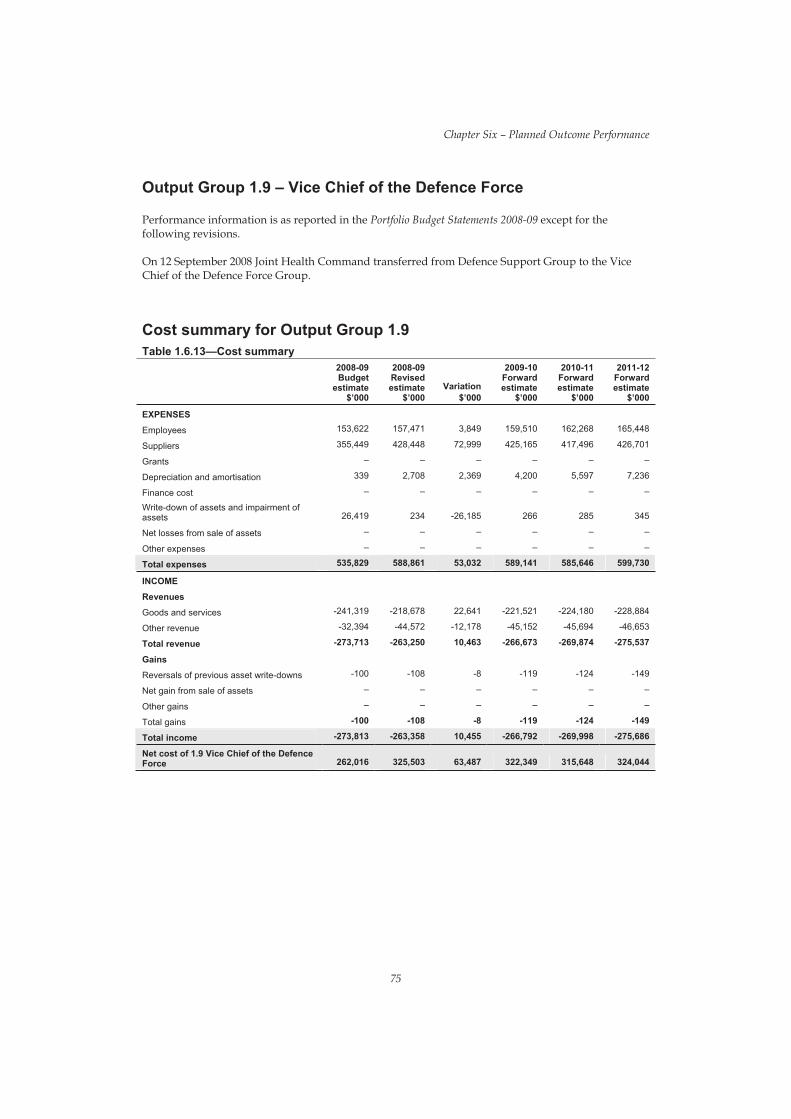
Chapter Six – Planned Outcome Performance
Output Group 1.9 – Vice Chief of the Defence Force
Performance information is as reported in the Portfolio Budget Statements 2008-09 except for the following revisions.
On 12 September 2008 Joint Health Command transferred from Defence Support Group to the Vice Chief of the Defence Force Group.
Cost summary for Output Group 1.9
75
Table 1.6.13—Cost summary 2008-09 Budget
estimate $’000
2008-09 Revised estimate
$’000 Variation
$’000
2009-10 Forward estimate
$’000
2010-11 Forward estimate
$’000
2011-12 Forward estimate
$’000
EXPENSES
Employees
Suppliers
Grants
Depreciation and amortisation
Finance cost Write-down of assets and impairment of assets
Net losses from sale of assets
Other expenses
Total expenses
153,622
355,449
– – – – – –
339
– – – – – –
26,419
– – – – – –
– – – – – –
535,829
157,471
428,448
2,708
234
588,861
3,849
72,999
2,369
-26,185
53,032
159,510 162,268
425,165
4,200
266
589,141
417,496
5,597
285
585,646
165,448
426,701
7,236
345
599,730
INCOME
Revenues
Goods and services
Other revenue
Total revenue
Gains
Reversals of previous asset write-downs
Net gain from sale of assets
Other gains
Total gains
Total income
-241,319
-32,394
-273,713
-100
– – – – – –
– – – – – –
-100
-273,813
-218,678
-44,572
-263,250
-108
-108
-263,358
22,641
-12,178
10,463
-8
-8
10,455
-221,521
-45,152
-266,673
-119
-119
-266,792
-224,180
-45,694
-269,874
-124
-124
-269,998
-228,884
-46,653
-275,537
-149
-149
-275,686
Net cost of 1.9 Vice Chief of the Defence Force 262,016 325,503 63,487 322,349 315,648 324,044

Output Group 1.10 – Joint Operations Command
Performance information is as reported in the Portfolio Budget Statements 2008-09.
Cost summary for Output Group 1.10 Table 1.6.14—Cost summary
EXPENSES
Employees
Suppliers
Grants
Depreciation and amortisation
Finance cost Write-down of assets and impairment of assets
Net losses from sale of assets
Other expenses
Total expenses
INCOME
Revenues
Goods and services
Other revenue
Total revenue
Gains Reversals of previous asset write-downs
Net gain from sale of assets
Other gains
Total gains
Total income
2008-09 Budget
estimate $’000
6,177
40,161
– – – – – –
2,587
– – – – – –
-6
– – – – – –
– – – – – –
48,918
-481
– – – – – –
-481
– – – – – –
– – – – – –
– – – – – –
– – – – – –
-481
2008-09 Revised estimate
$’000
6,330
32,838
31
–
39,199
-436
-436
-436
Variation $’000
153
-7,323
-2,556
6
-9,720
45
45
45
2009-10 Forward estimate
$’000
2010-11 Forward estimate
$’000
2011-12 Forward estimate
$’000
6,668
23,226
61
–
29,955
7,049
22,807
92
–
29,948
7,331
22,461
122
–
29,914
-441
-441
-441
-447
-447
-447
-456
-456
-456
Net cost of 1.10 Joint Operations Command 48,437 38,763 -9,675 29,514 29,501 29,458
Chapter Six – Planned Outcome Performance
76

Output Group 1.11 – Capability Development
Performance information is as reported in the Portfolio Budget Statements 2008-09.
Cost summary for Output Group 1.11 Table 1.6.15—Cost summary
2008-09 Budget
estimate $’000
2008-09 Revised estimate
$’000 Variation
$’000
2009-10 Forward estimate
$’000
2010-11 Forward estimate
$’000
2011-12 Forward estimate
$’000
EXPENSES
Employees
Suppliers
Grants
Depreciation and amortisation
Finance cost Write-down of assets and impairment of assets
Net losses from sale of assets
Other expenses
Total expenses
24,712
317,938
– – – – – –
269
– – – – – –
– – – – – –
– – – – – –
– – – – – –
342,919
25,325
153,431
484
179,240
613
-164,507
215
-163,679
24,308
460,571
224
485,103
24,737
527,483
119
552,339
25,238
864,800
111
890,149
INCOME
Revenues
Goods and services
Other revenue
Total revenue
Gains Reversals of previous asset write-downs
Net gain from sale of assets
Other gains
Total gains
Total income
– – – – – –
– – – – – –
– – – – – –
– – – – – –
– – – – – –
– – – – – –
– – – – – –
– – – – – –
Net cost of 1.11 CapabilityDevelopment 342,919 179,240 -163,679 485,103 552,339 890,149
Chapter Six – Planned Outcome Performance
77

Table 1.6.16—Cost summary 2008-09 Budget
estimate $’000
2008-09 Revised estimate
$’000 Variation
$’000
2009-10 Forward estimate
$’000
2010-11 Forward estimate
$’000
2011-12 Forward estimate
$’000
EXPENSES
Employees
Suppliers
Grants
Depreciation and amortisation
Finance cost Write-down of assets and impairment of assets
Net losses from sale of assets
Other expenses
Total expenses
374,090
31,172
–
2,148
–
28,230
–
2
435,642
289,368
49,250
-8
523,226
-98,129
225,399
–
60
989,174
-84,722
18,078
-8
521,078
-98,129
197,169
–
58
553,532
632,808
865,484
-9
752,676
-97,891
183,495
–
29
2,336,601
811,985
1,259,899
-9
913,448
-97,891
153,456
–
29
3,040,926
633,173
1,071,424
-7
869,019
-97,891
114,870
–
21
2,591,116
INCOME
Revenues
Goods and services
Other revenue
Total revenue
Gains Reversals of previous asset write-downs
Net gain from sale of assets
Other gains
Total gains
Total income
-2,975
-3,245
-6,220
–
–
-7,700
-7,700
-13,920
-18,520
-26,306
-44,826
-200,508
830
-7,700
-207,378
-252,204
-15,545
-23,061
-38,606
-200,508
830
–
-199,678
-238,284
-75,265
10,831
-64,434
-173,824
1,238
-7,700
-180,286
-244,720
-84,488
10,963
-73,525
-161,627
329
-7,700
-168,998
-242,523
-88,464
11,602
-76,862
-117,567
276
-7,700
-124,991
-201,853
Net cost of 1.12 Chief Finance Officer 421,723 736,970 315,248 2,091,881 2,798,403 2,389,263
Chapter Six – Planned Outcome Performance
Output Group 1.12 – Chief Finance Officer
Performance information is as reported in the Portfolio Budget Statements 2008-09.
Cost summary for Output Group 1.12
78

Output Group 1.13 – People Strategies and Policy
Performance information is as reported in the Portfolio Budget Statements 2008-09.
Cost summary for Output Group 1.13 Table 1.6.17—Cost summary
2008-09 Budget
estimate $’000
2008-09 Revised estimate
$’000 Variation
$’000
2009-10 Forward estimate
$’000
2010-11 Forward estimate
$’000
2011-12 Forward estimate
$’000
EXPENSES
Employees
Suppliers
Grants
Depreciation and amortisation
Finance cost Write-down of assets and impairment of assets
Net losses from sale of assets
Other expenses
Total expenses
86,058
248,102
–
6,884
–
88
–
341,132
–
88,193
281,801
–
118
–
–
–
–
370,112
2,135
33,699
–
-6,766
–
122
-88
–
–
28,980
95,402
265,358
–
–
–
–
–
360,882
101,707
263,963
–
95
–
–
–
–
365,765
108,147
253,770
–
80
–
–
–
361,997
–
INCOME
Revenues
Goods and services
Other revenue
Total revenue
Gains
Reversals of previous asset write-downs
Net gain from sale of assets
Other gains
Total gains
Total income
– – – – – –
– – – – – –
– – – – – –
– – – – – –
– – – – – –
– – – – – –
– – – – – –
– – – – – –
Net cost of 1.13 People Strategies and Policy 341,132 370,112 28,980 360,882 365,765 361,997
Chapter Six – Planned Outcome Performance
79

Output Group 1.14 – Superannuation and Housing Support Servicesfor Current and Retired Defence Personnel and Other Administered Items
Performance information is as reported in the Portfolio Budget Statements 2008-09.
Cost Summary of Output Group 1.14 Table 1.6.18—Cost summary
2008-09 Budget
estimate $’000
2008-09 Revised estimate
$’000 Variation
$’000
2009-10 Forward estimate
$’000
2010-11 Forward estimate
$’000
2011-12 Forward estimate
$’000
EXPENSES
Net foreign exchange losses
Housing subsidies
Retention benefits
Military superannuation benefits
Total expenses
–
52,638
42,000
2,848,700
2,943,338
–
50,868
42,000
2,848,700
2,941,568
–
-1,770
–
–
-1,770
–
69,354
40,000
2,946,890
3,056,244
–
88,324
38,000
3,047,100
3,173,424
–
106,177
36,000
3,150,300
3,292,477
REVENUE
Interest
Net foreign exchange gain
Dividends
Licence fees Military superannuation contributions
Other
Total revenue -796,741 -777,567 19,174 -815,565 -824,871 -883,720
-13
–
-60,448
-4,711
-731,000
-569
-187
–
-41,100
-4,711
-731,000
-569
-174
–
19,348
–
–
–
13
–
-42,800
-12,775
-760,000
-3
13
–
-44,200
-20,681
-760,000
-3
13
–
-64,058
-26,672
-793,000
-3
Net cost of output group 1.14 2,146,597 2,164,001 17,404 2,240,679 2,348,553 2,408,757
Chapter Six – Planned Outcome Performance
80

OUTCOME WO ILITARY PERATIONS AND THER ASKS DIRECTED BY THE GOVERNMENT TO ACHIEVE THE DESIRED
RESULTS
Performance information is as reported in the Portfolio Budget Statements 2008-09.
Resource Statement Table 1.6.19 provides additional detail of Budget appropriations and the total resourcing for outcome 2: Military operations and other tasks directed by Government to achieve the desired results.
Table 1.6.19—Total resources available for Outcome Two
T – M O O T
2008-09 Budget
estimate $’000
2008-09 Revised estimate
$’000 Variation
$’000
2009-10 Forward estimate
$’000
2010-11 Forward estimate
$’000
2011-12 Forward estimate
$’000 Outcome Two: Military operations and other tasks directed by Government achieve the desired results
Output group 2.1 – Operations Contributing to the Security of the Immediate Neighbourhood
Revenues from other sources - 11,715 Departmental outputs 202,311 197,166 Output group 2.2 – Operations Supporting Wider Interests
11,715
-5,145
- - -
18,700 - -
Revenues from other sources Departmental outputs Total resources for outcome 2
-
797,796
1,000,107
-
921,900
1,130,781
-
124,104
130,674
-
138,057
156,757
- -
2,860 -
2,860 -
Chapter Six – Planned Outcome Performance
81

Chapter Six – Planned Outcome Performance
Output Group 2.1 – Operations contributing to the security of the immediate neighbourhood
Cost summary for Output Group 2.1
82
Table 1.6.20—Cost summary 2008–09 Budget
estimate $’000
2008-09 Revised estimate
$’000 Variation
$’000
2009-10 Forward estimate
$’000
2010-11 Forward estimate
$’000
2011-12 Forward estimate
$’000
EXPENSES
Employees
Suppliers
Grants
Depreciation and amortisation
Finance cost Write-down of assets and impairment of assets
Net losses from sale of assets
Other expenses
Total expenses
45,618
156,693
– – – – – –
– – – – – –
– – – – – –
– – – – – –
– – – – – –
– – – – – –
202,311
43,526 -2,092
165,355
208,881
8,662
6,570
–
18,700
18,700
–
–
–
–
–
–
INCOME
Revenues
Goods and services
Other revenue
Total revenue
Gains
Reversals of previous asset write-downs
Net gain from sale of assets
Other gains
Total gains
Total income
–
– – – – – –
–
– – – – – –
– – – – – –
– – – – – –
– – – – – –
– -11,715 -11,715
-11,715
-11,715
-11,715
-11,715
–
–
–
–
–
–
–
–
–
Net cost of 2.1 Operations contributing to the security of the immediate
neighbourhood 202,311 197,166 -5,145 18,700 – –

2008-09 Budget
estimate $’000
2008-09 Revised estimate
$’000 Variation
$’000
2009-10 Forward estimate
$’000
2010-11 Forward estimate
$’000
2011-12 Forward estimate
$’000
EXPENSES
Employees
Suppliers
Grants
Depreciation and amortisation
Finance cost Write-down of assets and impairment of assets
Net losses from sale of assets
Other expenses
Total expenses
160,418
637,378
– – – – – –
– – – – – –
– – – – – –
– – – – – –
– – – – – –
– – – – – –
797,796
198,300
723,600
921,900
37,882
86,222
124,104
–
138,057
138,057
–
2,860
2,860
–
–
–
INCOME
Revenues
Goods and services
Other revenue
Total revenue
Gains
Reversals of previous asset write-downs
Net gain from sale of assets
Other gains
Total gains
Total income
– – – – – –
– – – – – –
– – – – – –
– – – – – –
– – – – – –
– – – – – –
– – – – – –
– – – – – –
Net cost of 2.2 Operations supporting wider interests 797,796 921,900 124,104 138,057 2,860 –
Chapter Six – Planned Outcome Performance
Output Group 2.2 – Operations supporting wider interests
Cost summary for Output Group 2.2 Table 1.6.21—Cost summary
83
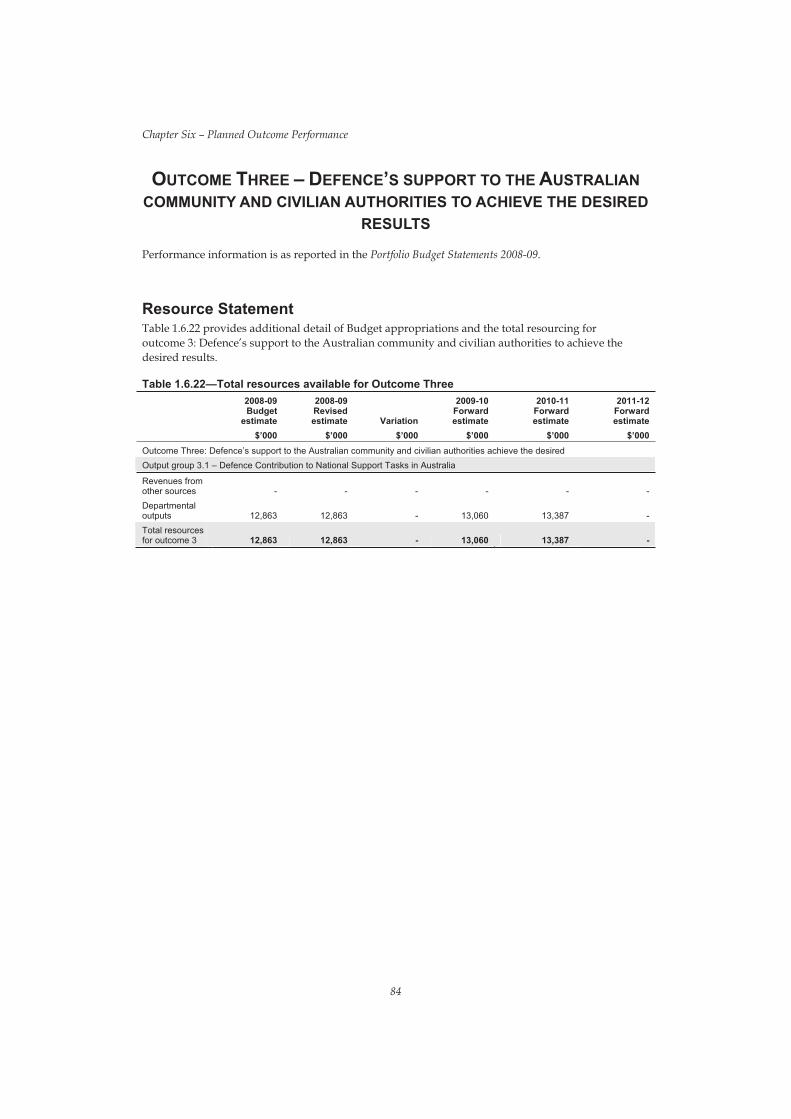
Chapter Six – Planned Outcome Performance
OUTCOME THREE – DEFENCE’S SUPPORT TO THE AUSTRALIAN COMMUNITY AND CIVILIAN AUTHORITIES TO ACHIEVE THE DESIRED
RESULTS
Performance information is as reported in the Portfolio Budget Statements 2008-09.
Resource Statement Table 1.6.22 provides additional detail of Budget appropriations and the total resourcing for outcome 3: Defence’s support to the Australian community and civilian authorities to achieve the desired results.
Table 1.6.22—Total resources available for Outcome Three 2008-09 2008-09 2009-10 2010-11 2011-12 Budget Revised Forward Forward Forward
estimate estimate Variation estimate estimate estimate $’000 $’000 $’000 $’000 $’000 $’000
Outcome Three: Defence’s support to the Australian community and civilian authorities achieve the desired Output group 3.1 – Defence Contribution to National Support Tasks in Australia
Revenues from other sources - - - - - -Departmental outputs 12,863 12,863 - 13,060 13,387 -Total resources for outcome 3 12,863 12,863 - 13,060 13,387 -
84

Output Group 3.1 – Defence Contribution to National Support Tasks in Australia
Cost summary for Output Group 3.1 Table 1.6.23—Cost summary
2008-09 Budget
estimate $’000
2008-09 Revised estimate
$’000 Variation
$’000
2009-10 Forward estimate
$’000
2010-11 Forward estimate
$’000
2011-12 Forward estimate
$’000
EXPENSES
Employees
Suppliers
Grants
Depreciation and amortisation
Finance cost Write-down of assets and impairment of assets
Net losses from sale of assets
Other expenses
Total expenses
–
12,863
–
–
–
–
–
–
12,863
–
12,863
–
–
–
–
–
–
12,863
–
–
–
–
–
–
–
–
–
–
13,060
–
–
–
–
–
–
13,060
–
13,387
–
–
–
–
–
–
13,387
–
–
–
–
–
–
–
–
–
INCOME
Revenues
Goods and services
Other revenue
Total revenue
Gains
Reversals of previous asset write-downs
Net gain from sale of assets
Other gains
Total gains
Total income
–
–
–
–
–
–
–
–
–
– –
–
–
–
–
–
–
–
–
–
–
–
–
–
–
–
–
–
–
–
–
–
–
–
–
–
–
–
–
–
–
–
–
–
–
–
–
–
Net cost of 3.1 Defence Contribution to National Support Tasks in
Australia 12,863 12,863 – 13,060 13,387 –
Chapter Six – Planned Outcome Performance
85


SECTION THREE
EXPLANATORY TABLES AND FINANCIAL STATEMENTS


CHAPTER SEVEN —EXPLANATORY TABLES AND BUDGETED FINANCIAL
STATEMENTS
EXPLANATORY TABLES
BUDGETED FINANCIAL STATEMENTS


Chapter Seven – Explanatory Tables and Budgeted Financial Statements
EXPLANATORY TABLES
Reconciliation of total available appropriation The Defence Resource Statement (Table 1.2.2) details the total available appropriation available to an agency from all sources. For departmental appropriations, this includes carry-forward amounts as well as amounts appropriated at Budget and Additional Estimates. As agencies incur and are funded for future liabilities, general depreciation and employee entitlements, the total amount of departmental appropriation available to an agency is unlikely to be fully utilised in the Budget year. Outcome resource statements include details of the expected use of available resources in contributing towards outcomes in the Budget year. The difference between the agency level resource statement and the sum of all outcome resource statements is the expected carry-forward amount of resources for the 2009-10 Budget year, including amounts related to meeting future obligations to maintain the agency’s asset base and to meet employee entitlement liabilities. Table 1.7.1 reconciles the total available.
Table 1.7.1—Reconciliation of total available appropriation and outcomes 2008-09
$'000 Total available departmental operating appropriation (outputs)
Less total attributed in outcome resource statements
Estimated departmental operating appropriation carry-forward for 2008-09 (outputs)
20,393,130
20,231,213
161,917
Special account flows Special accounts provide a means to set aside and record amounts used for specified purposes. Special accounts can be created by a Finance Minister’s Determination under the Financial Management and Accountability Act 1997 or under separate enabling legislation. Table 1.7.2 shows the expected additions (receipts) and reductions (payments) for each account used by Defence.
91
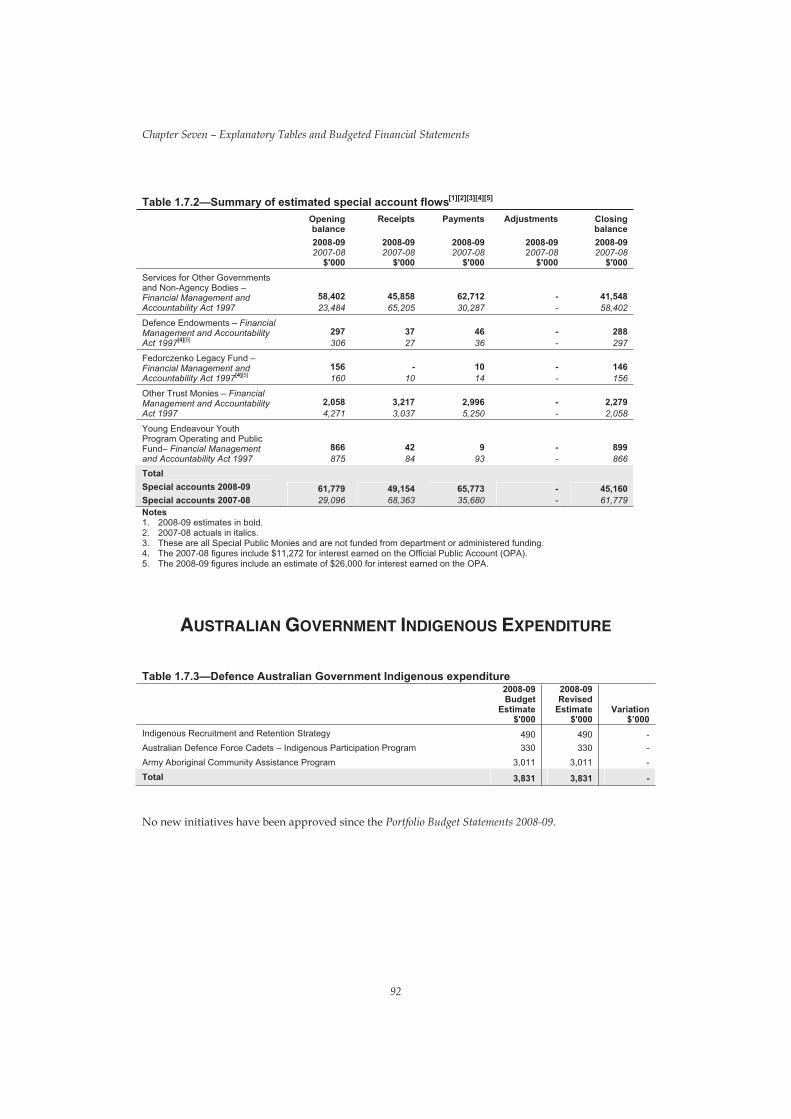
[1][2][3][4][5]Table 1.7.2—Summary of estimated special account flows Opening balance
Receipts Payments Adjustments Closing balance
2008-09 2007-08
$'000
2008-09 2007-08
$'000
2008-09 2007-08
$'000
2008-09 2007-08
$'000
2008-09 2007-08
$'000 Services for Other Governments and Non-Agency Bodies – Financial Management and Accountability Act 1997
58,402 23,484
45,858 65,205
62,712 30,287
- 41,548 - 58,402
Defence Endowments – Financial Management and Accountability Act 1997[4][5]
297 306
37 27
46 36
- 288 - 297
Fedorczenko Legacy Fund – Financial Management and Accountability Act 1997[4][5]
156 160
-10
10 14
- 146 - 156
Other Trust Monies – Financial Management and Accountability Act 1997
2,058 4,271
3,217 3,037
2,996 5,250
- 2,279 - 2,058
Young Endeavour Youth Program Operating and Public Fund– Financial Management and Accountability Act 1997 Total
866 875
42 84
9 93
- 899 - 866
Special accounts 2008-09 Special accounts 2007-08
61,779 29,096
49,154 68,363
65,773 35,680
- 45,160 - 61,779
Notes 1. 2008-09 estimates in bold. 2. 2007-08 actuals in italics. 3. These are all Special Public Monies and are not funded from department or administered funding. 4. The 2007-08 figures include $11,272 for interest earned on the Official Public Account (OPA). 5. The 2008-09 figures include an estimate of $26,000 for interest earned on the OPA.
AUSTRALIAN GOVERNMENT INDIGENOUS EXPENDITURE
Table 1.7.3—Defence Australian Government Indigenous expenditure
Chapter Seven – Explanatory Tables and Budgeted Financial Statements
2008-09 Budget
Estimate $'000
2008-09 Revised
Estimate $'000
Variation $’000
Indigenous Recruitment and Retention Strategy Australian Defence Force Cadets – Indigenous Participation Program Army Aboriginal Community Assistance Program Total
490 330
3,011
3,831
490 330
3,011
3,831
---
-
No new initiatives have been approved since the Portfolio Budget Statements 2008-09.
92
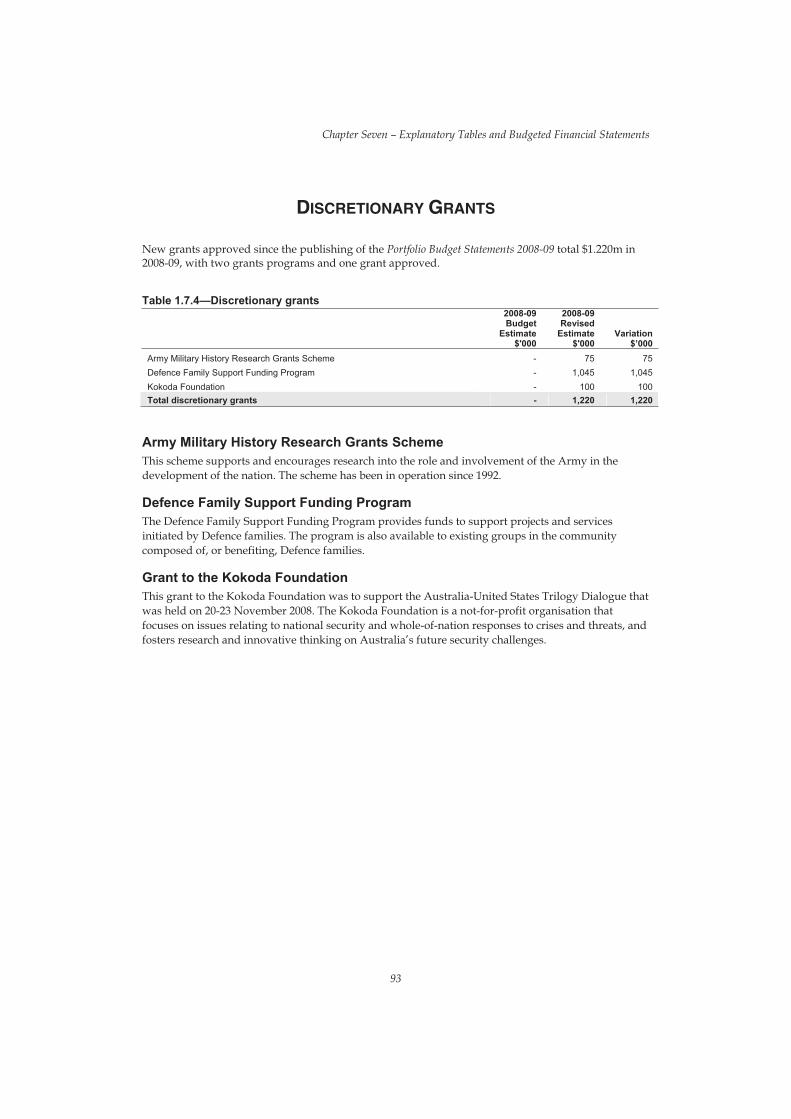
Chapter Seven – Explanatory Tables and Budgeted Financial Statements
DISCRETIONARY GRANTS
New grants approved since the publishing of the Portfolio Budget Statements 2008-09 total $1.220m in 2008-09, with two grants programs and one grant approved.
Table 1.7.4—Discretionary grants 2008-09 2008-09 Budget Revised
Estimate Estimate Variation $'000 $'000 $’000
Army Military History Research Grants Scheme - 75 75 Defence Family Support Funding Program - 1,045 1,045
Kokoda Foundation - 100 100 Total discretionary grants - 1,220 1,220
Army Military History Research Grants Scheme This scheme supports and encourages research into the role and involvement of the Army in the development of the nation. The scheme has been in operation since 1992.
Defence Family Support Funding Program The Defence Family Support Funding Program provides funds to support projects and services initiated by Defence families. The program is also available to existing groups in the community composed of, or benefiting, Defence families.
Grant to the Kokoda Foundation This grant to the Kokoda Foundation was to support the Australia-United States Trilogy Dialogue that was held on 20-23 November 2008. The Kokoda Foundation is a not-for-profit organisation that focuses on issues relating to national security and whole-of-nation responses to crises and threats, and fosters research and innovative thinking on Australia’s future security challenges.
93
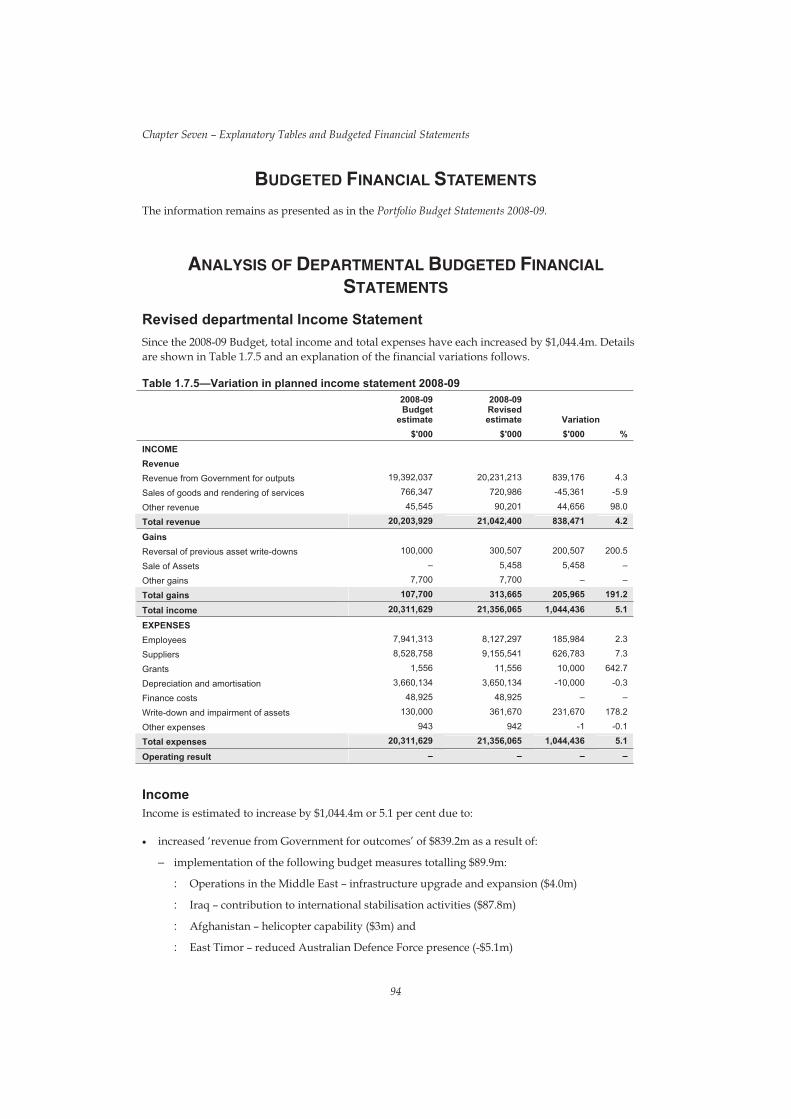
Chapter Seven – Explanatory Tables and Budgeted Financial Statements
BUDGETED FINANCIAL STATEMENTS
The information remains as presented as in the Portfolio Budget Statements 2008-09.
ANALYSIS OF DEPARTMENTAL BUDGETED FINANCIAL
STATEMENTS
Revised departmental Income Statement Since the 2008-09 Budget, total income and total expenses have each increased by $1,044.4m. Details are shown in Table 1.7.5 and an explanation of the financial variations follows.
Table 1.7.5—Variation in planned income statement 2008-09 2008-09 Budget
estimate
2008-09 Revised estimate Variation
$'000 $'000 $'000 % INCOME
Revenue
Revenue from Government for outputs 19,392,037 20,231,213 839,176 4.3
Sales of goods and rendering of services 766,347 720,986 -45,361 -5.9
Other revenue 45,545 90,201 44,656 98.0
Total revenue 20,203,929 21,042,400 838,471 4.2
Gains
Reversal of previous asset write-downs 100,000 300,507 200,507 200.5
Sale of Assets – 5,458 5,458 –
Other gains 7,700 7,700 – –
Total gains 107,700 313,665 205,965 191.2
Total income 20,311,629 21,356,065 1,044,436 5.1
EXPENSES
Employees 7,941,313 8,127,297 185,984 2.3
Suppliers 8,528,758 9,155,541 626,783 7.3
Grants 1,556 11,556 10,000 642.7
Depreciation and amortisation 3,660,134 3,650,134 -10,000 -0.3
Finance costs 48,925 48,925 – –
Write-down and impairment of assets 130,000 361,670 231,670 178.2
Other expenses Total expenses
943 20,311,629
942 21,356,065
-1 1,044,436
-0.1 5.1
Operating result – – – –
Income Income is estimated to increase by $1,044.4m or 5.1 per cent due to:
• increased ‘revenue from Government for outcomes’ of $839.2m as a result of:
– implementation of the following budget measures totalling $89.9m:
: Operations in the Middle East – infrastructure upgrade and expansion ($4.0m)
: Iraq – contribution to international stabilisation activities ($87.8m)
: Afghanistan – helicopter capability ($3m) and
: East Timor – reduced Australian Defence Force presence (-$5.1m)
94

Chapter Seven – Explanatory Tables and Budgeted Financial Statements
: Implementation of Operation Sunlight ($0.2m).
– other budget adjustments totalling $749.3m:
: Budget remediation to realign capital/recurrent split of expenditure ($278.2m)
: a revision to the price parameters used in the 2008-09 Budget – operating component only (-$12.1m)
: movements in foreign exchange reflecting the difference between current foreign exchange parameters and those on which the 2008-09 Budget was based ($153.3m)
: bring forward of 2007-08 reprogramming ($307.0m)
: other reprogramming – operating component only (-$6.5m)
: reconciliation of 2007-08 operations expenditure ($29.4m)
: Defence Home Ownership Assistance Scheme administration costs ($1.8m)
: Efficiency Dividend adjustment (-$1.8m).
• decreased ‘sales of goods and rendering of services’ (-$45.4m) offset by increased ‘other revenue’ ($44.7m) because of a change in categories.
• an increase in ‘reversals of previous asset write-downs’ due to revised estimates based on actual outcome of 2007-08 ($200.5m)
• increased sale of assets ($5.5m).
Expenses Expenses are estimated to increase by $1,044.4m or 5.1 per cent due to:
• an increase in ‘employee’ expenses of $186.0m resulting from:
– implementation of the following budget measures:
: Iraq – contribution to international stabilisation activities ($37.9m) and
: East Timor – reduced Australian Defence Force presence (-$2.1m )
– Budget remediation to realign capital/recurrent split of expenditure ($146.5m)
– movements in foreign exchange reflecting the difference between current foreign exchange parameters and those on which the 2008-09 Budget was based ($3.6m).
• an increase in ‘suppliers’ expenses of $626.8m resulting from:
– implementation of the following budget measures:
: Iraq – contribution to international stabilisation activities ($49.9m)
: Afghanistan – helicopter capability ($3.0m)
: Operations in the Middle East – infrastructure upgrade and expansion ($3.9m)
: East Timor – reduced Australian Defence Force presence (-$3.0m)
: Operation Sunlight – improved Budget transparency ($0.2m).
– other budget adjustments:
: bring forward of 2007-08 reprogramming ($307.0m)
: movements in foreign exchange reflecting the difference between current foreign exchange parameters and those on which the 2008-09 Budget was based ($149.7m)
: Budget remediation to realign capital/recurrent split of expenditure ($98.5m)
95

Chapter Seven – Explanatory Tables and Budgeted Financial Statements
: reconciliation of 2007-08 operations expenditure ($29.4m)
: a revision to the price parameters used in the 2008-09 Budget – operating component only (-$12.1m)
: Defence Home Ownership Assistance Scheme administration costs ($1.8m)
: Efficiency Dividend adjustment (-$1.8m).
• an increase in ‘write-down and impairment of assets’ due to revised estimates based on actual for 2007-08 ($231.7m).
REVISED DEPARTMENTAL BALANCE SHEET
Since the 2008-09 Budget, Defence’s net asset value has increased by $96.5m or 0.2 per cent. Details are shown in Table 1.7.6 and an explanation of the financial variations follows.
96
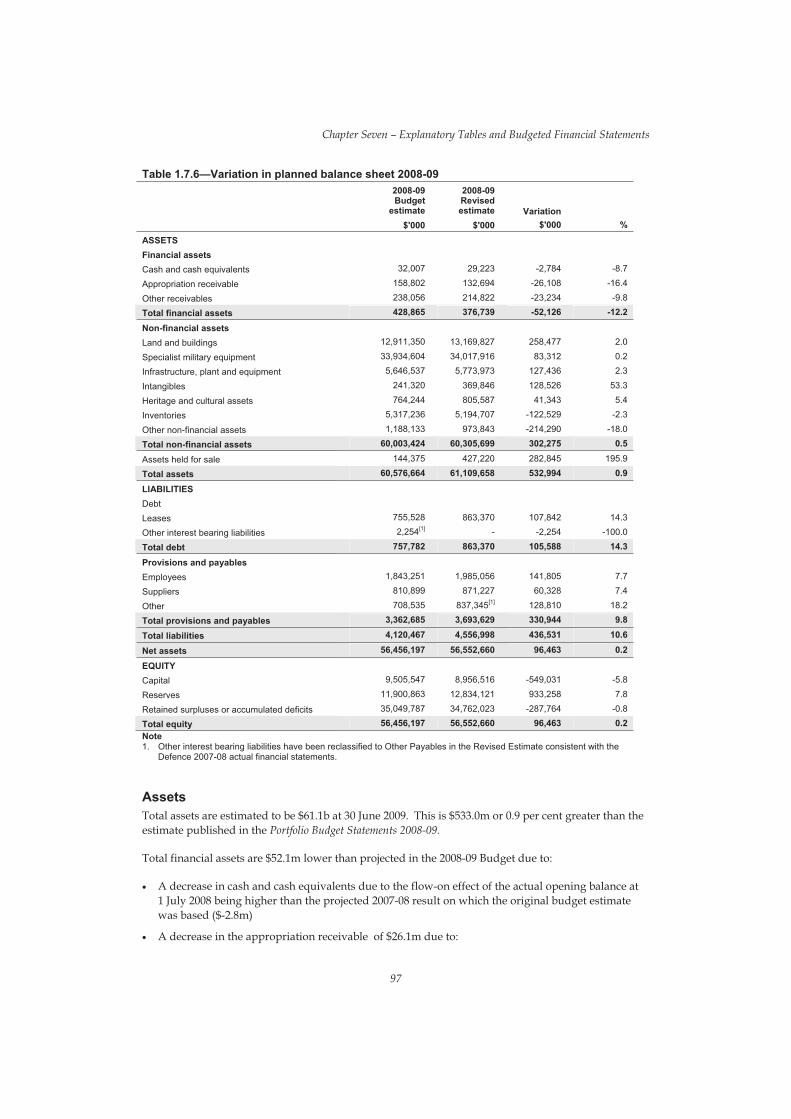
Table 1.7.6—Variation in planned balance sheet 2008-09 2008-09 Budget
estimate $'000
2008-09 Revised estimate
$'000 Variation
$'000 %
ASSETS Financial assets Cash and cash equivalents Appropriation receivable Other receivables Total financial assets
32,007 158,802 238,056 428,865
29,223 132,694 214,822 376,739
-2,784 -26,108 -23,234 -52,126
-8.7 -16.4
-9.8 -12.2
Non-financial assets Land and buildings Specialist military equipment Infrastructure, plant and equipment Intangibles Heritage and cultural assets Inventories Other non-financial assets Total non-financial assets
12,911,350 33,934,604
5,646,537 241,320 764,244
5,317,236 1,188,133
60,003,424
13,169,827 34,017,916
5,773,973 369,846 805,587
5,194,707 973,843
60,305,699
258,477 83,312
127,436 128,526
41,343 -122,529 -214,290 302,275
2.0 0.2 2.3
53.3 5.4
-2.3 -18.0
0.5
Assets held for sale Total assets
144,375 60,576,664
427,220 61,109,658
282,845 532,994
195.9 0.9
LIABILITIES Debt Leases Other interest bearing liabilities Total debt
755,528 2,254[1]
757,782
863,370 -
863,370
107,842 -2,254
105,588
14.3 -100.0
14.3
Provisions and payables Employees Suppliers Other Total provisions and payables
1,843,251
810,899 708,535
3,362,685
1,985,056 871,227
837,345[1]
3,693,629
141,805 60,328
128,810 330,944
7.7 7.4
18.2 9.8
Total liabilities 4,120,467 4,556,998 436,531 10.6
Net assets 56,456,197 56,552,660 96,463 0.2
EQUITY Capital Reserves Retained surpluses or accumulated deficits
Total equity
9,505,547
11,900,863 35,049,787 56,456,197
8,956,516 12,834,121 34,762,023 56,552,660
-549,031 933,258
-287,764 96,463
-5.8 7.8
-0.8 0.2
Chapter Seven – Explanatory Tables and Budgeted Financial Statements
Note 1. Other interest bearing liabilities have been reclassified to Other Payables in the Revised Estimate consistent with the
Defence 2007-08 actual financial statements.
Assets Total assets are estimated to be $61.1b at 30 June 2009. This is $533.0m or 0.9 per cent greater than the estimate published in the Portfolio Budget Statements 2008-09.
Total financial assets are $52.1m lower than projected in the 2008-09 Budget due to:
• A decrease in cash and cash equivalents due to the flow-on effect of the actual opening balance at 1 July 2008 being higher than the projected 2007-08 result on which the original budget estimate was based ($-2.8m)
• A decrease in the appropriation receivable of $26.1m due to:
97

Chapter Seven – Explanatory Tables and Budgeted Financial Statements
– the flow-on effect of the actual opening balance being higher than the projected 2007-08 result ($33.6m)
– hand-back of ‘no-win-no-loss’ 2007-08 operations expenditure (-$10.1m)
– hand-back of ‘no-win-no-loss’ 2007-08 gain from a stronger Australian dollar in 2007-08 (-$39.6m)
– carry-over of SAS Trust Fund contribution (-$10.0).
Total non-financial assets are $302.3m higher than projected due to:
• the budgeted value of ‘land and buildings’ will grow by $258.5m due to:
– the flow-on effect of the actual opening balance being higher than the projected 2007-08 result ($368.7m)
– Budget remediation to realign capital/recurrent split of expenditure (-$131.7m)
– Operations in the Middle East – infrastructure upgrade and expansion ($11.5m)
– Other adjustments ($10.0m).
• the budgeted value of ‘specialist military equipment’ assets will increase by $83.3m due to:
– An increase due to the flow-on effect of the actual opening balance at 1 July 2008 being higher than the projected 2007-08 result on which the original budget estimate was based ($502.1m)
– a decrease in the value of planned asset purchases in line with revised price parameters used in the 2008-09 Additional Estimates (-$6.1m)
– movements in foreign exchange reflecting the difference between current foreign exchange parameters and those on which the 2008-09 Budget was based ($429.4m)
– reprogramming of the Approved Major Capital Investment Program (-$514.0m)
– Budget remediation to realign capital/recurrent split of expenditure (-$331.1m)
– Iraq – contribution to international stabilisation activities ($3.0m).
• the budgeted value of ‘infrastructure, plant and equipment’ assets will increase by $127.4m due to:
– actual opening balance being higher than the projected 2007-08 result ($66.3m)
– Budget remediation to realign capital/recurrent split of expenditure ($59.6m)
– Iraq – contribution to international stabilisation activities ($1.5m).
• the budgeted value of ‘intangibles’ will increase by $128.5m due to
– actual opening balance being higher than the projected 2007-08 result ($112.5m)
– Budget remediation to realign capital/recurrent split of expenditure ($16.0m).
• the budgeted value of ‘heritage and cultural assets’ will increase by $41.3m due to an actual opening balance higher than projected.
• the budgeted value of ‘inventories’ will decrease by $122.5m due to:
– Budget remediation to realign capital/recurrent split of expenditure (-$115.0m)
– Other movements (-$7.5m).
• the budgeted value of ‘other non-financial assets’ will decrease by $214.3m due to reprogramming of the Approved Major Capital Investment Program.
Assets held for sale are $282.8m higher than projected due to the actual opening balance being higher than projected.
98

Chapter Seven – Explanatory Tables and Budgeted Financial Statements
Liabilities Total liabilities are estimated to be $4.6b at 30 June 2009. This is $436.5m or 10.6 per cent higher than projected in the Portfolio Budget Statements 2008-09.
Total debt is $105.6m higher than projected in the 2008-09 Budget.
Total provisions and payables are $330.9m higher than projected due to:
– an increase in ‘employee provisions’ ($141.8m)
– an increase in ‘supplier payables’ ($60.3m)
– an increase in ‘other provisions and payables’ ($128.8m).
Equity Equity is estimated to be $56.6b at 30 June 2009. This represents an increase of $96.5m or 0.2 per cent from the estimate published in the Portfolio Budget Statements 2008-09.
Capital (contributed equity) is the amount that the Government as owner has invested in Defence. Restructuring activities, equity appropriations and returns made by Defence to the Official Public Account are included in the calculation of contributed equity.
• capital will reduce by $549.0m due to:
– a decrease in equity injection resulting from:
: actual opening balance higher than projected ($50.9m)
: Budget remediation to realign capital/recurrent split of expenditure (-$278.0m)
: movements in foreign exchange reflecting the difference between current foreign exchange parameters and those on which the 2008-09 Budget was based ($389.9m)
: reprogramming of the Approved Major Capital Investment Program (-$514.0m)
: reprogramming of the Enhanced Land Force (-$207.6m)
: a revision to the price parameters used in the 2008-09 Budget – capital component only (-$6.1m)
: Operations in the Middle East - infrastructure upgrade and expansion ($11.5m)
: Iraq – contribution to international stabilisation activities ($4.5m)
• Reserves represent the Asset Revaluation Reserves of Defence and are affected by asset revaluation activities undertaken during the year. Reserves will increase by $933.3m due to the actual opening balance being higher than projected
• Retained surpluses or accumulated deficits represent the cumulative surpluses or deficits of Defence. The surplus is forecast to decrease by $287.8m due to the actual opening balance being higher than projected.
99

2008-09 DEPARTMENTAL BUDGETED FINANCIAL STATEMENTS
Table 1.7.7—Budgeted departmental income statement 2007-08 2008-09 2009-10 2010-11 2011-12
Actual Revised Budget
Forward estimate
Forward estimate
Forward estimate
$'000 $'000 $'000 $'000 $'000
INCOME Revenue
Revenues from Government 19,693,267 20,231,213 20,993,282 21,544,757 21,758,383 Sales of Goods and Services 688,840 720,986 781,272 793,358 813,934 Other revenue 83,306 90,201 46,939 46,431 46,999
Total revenue 20,465,413 21,042,400 21,821,493 22,384,546 22,619,316
Gains Reversals of previous asset write-downs 615,330 300,507 273,826 261,626 217,567 Sale of assets – 5,458 9,165 3,080 4,265 Foreign exchange 1,077 – – – – Other gains
Total gains
Total income
3,295 7,700 7,700 7,700 7,700
619,702 313,665 290,691 272,406 229,532
21,085,115 21,356,065 22,112,184 22,656,952 22,848,848
EXPENSES Employees 7,510,296 8,127,297 8,612,734 9,105,336 9,322,072 Suppliers 8,454,080 9,155,541 9,438,038 9,626,302 9,914,375 Grants 18,000 11,556 1,575 1,594 1,629 Depreciation and amortisation 3,654,874 3,650,134 3,681,038 3,564,273 3,301,443 Finance costs 44,146 48,925 60,307 61,943 63,515 Write-down of assets and impairment of assets 1,948,141 361,670 317,570 296,571 244,870 Losses from sale of assets 2,152 – – – – Other expenses
Total expenses 54,815 942 922 933 944
21,686,504 21,356,065 22,112,184 22,656,952 22,848,848
Net surplus or (deficit) attributable to the Australian Government
-601,389 – – – –
Chapter Seven – Explanatory Tables and Budgeted Financial Statements
100

Chapter Seven – Explanatory Tables and Budgeted Financial Statements
Table 1.7.8—Budgeted departmental balance sheet
101
2007-08 2008-09 2009-10 2010-11 2011-12 Actual Revised Forward Forward Forward
Budget estimate estimate estimate
ASSETS $'000 $'000 $'000 $'000 $'000
Financial assets
Cash and cash equivalents 29,223 29,223 29,223 29,223 29,223 Appropriation Receivable 247,363 132,694 72,694 7,694 1,305 Other receivables 214,822 214,822 214,822 214,822 214,822
Total financial assets 491,408 376,739 316,739 251,739 245,350
Non-financial assets Land and buildings 12,568,074 13,169,827 13,758,006 14,525,955 15,318,673 Infrastructure, plant and equipment 5,857,848 5,773,973 5,643,163 5,548,251 5,425,459 Specialist Military Equipment 32,447,754 34,017,916 37,786,614 42,409,709 47,018,070 Intangibles 357,625 369,846 385,741 401,416 389,035 Heritage and cultural 805,587 805,587 805,587 805,587 805,587 Inventories 4,952,862 5,194,707 5,547,221 5,728,933 5,981,105 Prepayments
Total non-financial assets Assets held for sale
1,055,217 973,843 842,436 710,761 516,780 58,044,967 60,305,699 64,768,768 70,130,612 75,454,709
427,220 427,220 427,220 427,220 427,220 Total assets 58,963,595 61,109,658 65,512,727 70,809,571 76,127,279
LIABILITIES Payables
Suppliers 857,995 871,227 894,561 917,896 965,228 Other payables
Total Payables 197,170 197,170 197,170 197,170 197,170
1,055,165 1,068,397 1,091,731 1,115,066 1,162,398
Interest bearing liabilities Leases 404,988 863,370 822,633 781,182 739,519
Total interest bearing liabilities 404,988 863,370 822,633 781,182 739,519
Provisions Employees 1,856,704 1,985,056 2,126,128 2,347,705 2,612,005
Restoration, decontamination and decommissioning 615,572 615,572 615,572 615,572 615,572 Other provisions
Total provisions Total liabilities NET ASSETS EQUITY
24,603 24,603 24,603 24,603 24,603
2,496,879 2,625,232 2,766,304 2,987,880 3,252,181 3,957,032 4,556,998 4,680,667 4,884,128 5,154,098
55,006,563 56,552,660 60,832,060 65,925,443 70,973,181
Contributed equity 7,388,861 8,956,516 13,252,463 18,364,902 23,412,641 Reserves 12,834,121 12,834,121 12,834,121 12,834,121 12,834,121 Retained surpluses or accumulated deficits
Total equity Current assets
34,783,581 34,762,023 34,745,476 34,726,420 34,726,419 55,006,563 56,552,660 60,832,060 65,925,443 70,973,181 2,615,082 2,495,871 1,586,395 1,389,720 1,189,350
Non-current assets 56,348,513 58,613,787 63,926,332 69,419,851 74,937,929 Current liabilities 2,820,126 3,247,714 3,335,852 3,480,855 3,673,259 Non-current liabilities 1,136,906 1,309,284 1,344,816 1,403,273 1,480,838

Chapter Seven – Explanatory Tables and Budgeted Financial Statements
Table 1.7.9—Budgeted departmental statement of cash flows
2007-08 2008-09 2009-10 2010-11 2011-12 Actual Revised Forward Forward Forward
Budget estimate estimate estimate
OPERATING ACTIVITIES $'000 $'000 $'000 $'000 $'000
Cash Received
Goods and Services 579,628 765,682 766,918 770,943 783,322 GST Receipts from Customers 17,034 18,655 19,206 19,774 20,357 Appropriations 19,659,706 20,231,213 20,993,282 21,544,757 21,758,383 GST Received from ATO 443,097 418,658 433,201 448,248 463,818 Other Cash Received 114,174 45,505 45,829 45,306 45,850 Cash transfer from the Official Public Account (receivables)
Total cash received 50,000 114,669 60,000 65,000 30,389
20,863,639 21,594,382 22,318,436 22,894,028 23,102,119
Cash Used Employees 7,248,681 7,819,037 8,312,367 8,681,925 9,030,606 Suppliers 7,733,976 7,991,960 8,385,235 8,300,310 8,701,836 GST payments 459,476 437,313 452,407 468,022 484,175 Grants 17,894 11,556 1,575 1,594 1,629 Other Cash Used 800 942 922 933 944
Total cash used Net cash from or (used by) operating activities
15,460,827 16,260,808 17,152,506 17,452,784 18,219,190
5,402,812 5,333,574 5,165,930 5,441,244 4,882,929
INVESTING ACTIVITIES Cash Received
Proceeds from sales of land and buildings 24,486 176,248 118,344 184,656 48,313 Proceeds from sales of infrastructure, plant and equipment 40,300 108,930 41,324 36,105 36,211 Proceeds from sales of specialist military equipment 2 – 1,238 329 276 Other cash received
Total cash received 595 – – – –
65,383 285,178 160,906 221,090 84,800
Cash used Purchase of land and buildings 608,490 678,139 1,134,249 1,358,506 1,163,986 Purchase of specialist military equipment 3,603,107 4,410,297 6,635,082 7,421,933 7,070,566 Purchase of infrastructure, plant and equipment 210,055 516,744 380,188 355,809 275,137 Purchase of intangibles 60,287 41,366 44,264 46,431 18,890 Purchase of inventory 1,446,140 1,430,178 1,317,447 1,476,070 1,387,973 Finance costs 15,193 48,925 60,307 61,943 63,515 Other cash used
Total cash used Net cash from or (used by) investing activities FINANCING ACTIVITIES
12,478 – – – –
5,955,750 7,125,649 9,571,537 10,720,692 9,980,067
-5,890,367 -6,840,471 -9,410,631 -10,499,602 -9,895,267
Cash received Appropriations - contributed equity
Total cash received 1,998,630 1,805,180 4,372,754 5,238,354 5,079,787 1,998,630 1,805,180 4,372,754 5,238,354 5,079,787
Cash Used
Repayment of debt 24,039 39,200 34,699 35,026 35,401 Cash to the Official Public Account [1]
Total cash used 1,490,897 259,083 93,354 144,970 32,048
1,514,936 298,283 128,053 179,996 67,449 67,449
102

Net cash from or (used by) financing activities Net increase (decrease) in cash and cash equivalents held
Cash and cash equivalents at beginning of reporting period Effect of exchange rate movements on cash at the beginning of the reporting period
Cash and cash equivalents at end of reporting period
483,694 1,506,897 4,244,701 5,058,358 5,012,338
-3,861 – – – –
32,007
1,077
29,223
–
29,223
–
29,223
–
29,223
–
29,223 29,223 29,223 29,223 29,223 Note 1. Return of proceeds from the sales of property, net of the cost of sales and drawdown from the Official Public Account.
Chapter Seven – Explanatory Tables and Budgeted Financial Statements
Table 1.7.10—Departmental statement of changes in equity — summary of movement (Budget year 2008-09)
103
Accumulated Asset Contributed Total results revaluation
reserve equity/
capital Equity
Opening balance as at 1 July 2008 $'000 $'000 $'000 $'000
Balance carried forward from previous period Adjustment for changes in accounting policy
34,783,581 12,834,121 7,388,861 55,006,563
Adjusted opening balance
– – – –
34,783,581 12,834,121 7,388,861 55,006,563
Income and expense Asset revaluation movements
Sub-total income and expense recognised directly in equity
– – – –
– – – –
Net operating result – – – –
Total income and expenses attributable to the Australian Government Transactions with owners
– –
– –
Distribution to owners Returns of capital:
Restructuring – – – –Other -21,558 – -237,525 -259,083
Contributions by owners Appropriation (Equity Injection) – – 1,805,180 1,805,180
Other: Restructuring
Sub-total transaction with owners Transfers between equity components
– – – –-21,558 – 1,567,655 1,546,097
Estimated closing balance as at 30 June 2009
– – – –
34,762,023 12,834,121 8,956,516 56,552,660
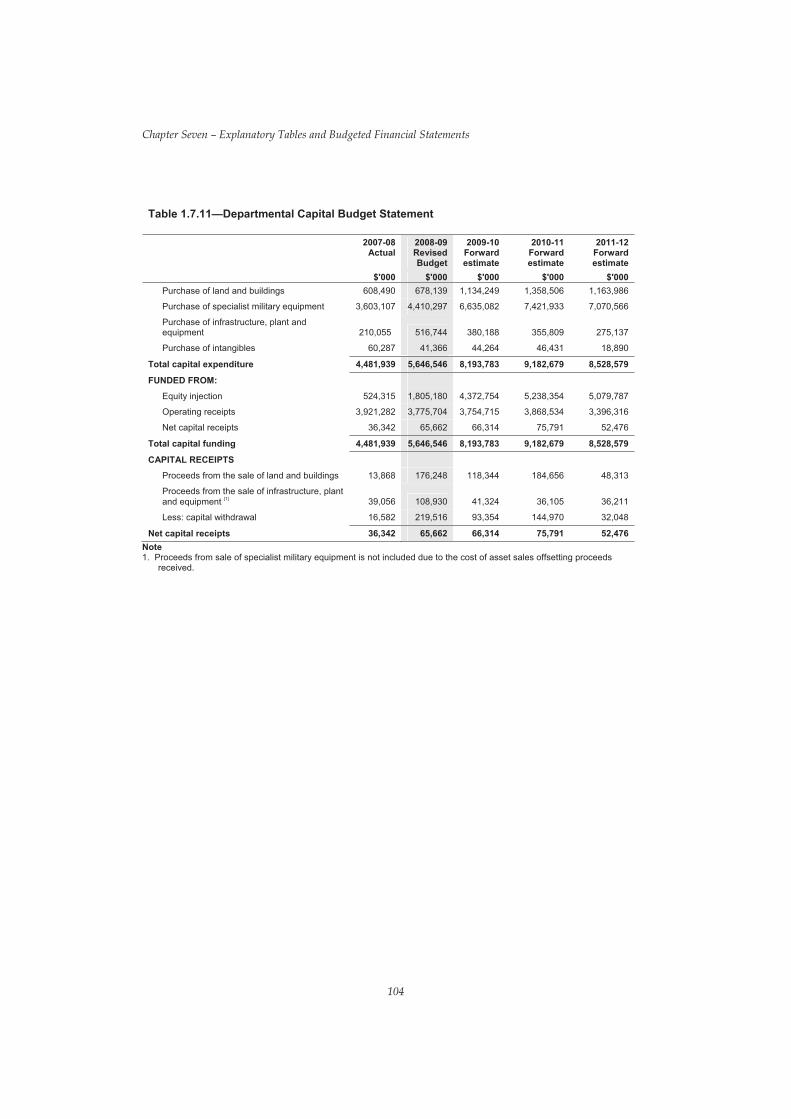
Table 1.7.11—Departmental Capital Budget Statement
2007-08 2008-09 2009-10 2010-11 2011-12 Actual Revised Forward Forward Forward
Budget estimate estimate estimate $'000 $'000 $'000 $'000 $'000
Purchase of land and buildings 608,490 678,139 1,134,249 1,358,506 1,163,986
Purchase of specialist military equipment 3,603,107 4,410,297 6,635,082 7,421,933 7,070,566
Purchase of infrastructure, plant and equipment 210,055 516,744 380,188 355,809 275,137
Purchase of intangibles 60,287 41,366 44,264 46,431 18,890
Total capital expenditure 4,481,939 5,646,546 8,193,783 9,182,679 8,528,579
FUNDED FROM:
Equity injection 524,315 1,805,180 4,372,754 5,238,354 5,079,787
Operating receipts 3,921,282 3,775,704 3,754,715 3,868,534 3,396,316
Net capital receipts 36,342 65,662 66,314 75,791 52,476
Total capital funding 4,481,939 5,646,546 8,193,783 9,182,679 8,528,579
CAPITAL RECEIPTS
Proceeds from the sale of land and buildings 13,868 176,248 118,344 184,656 48,313
Proceeds from the sale of infrastructure, plant and equipment [1] 39,056 108,930 41,324 36,105 36,211
Less: capital withdrawal
Net capital receipts
16,582 219,516 93,354 144,970 32,048
36,342 65,662 66,314 75,791 52,476
Chapter Seven – Explanatory Tables and Budgeted Financial Statements
Note 1. Proceeds from sale of specialist military equipment is not included due to the cost of asset sales offsetting proceeds
received.
104
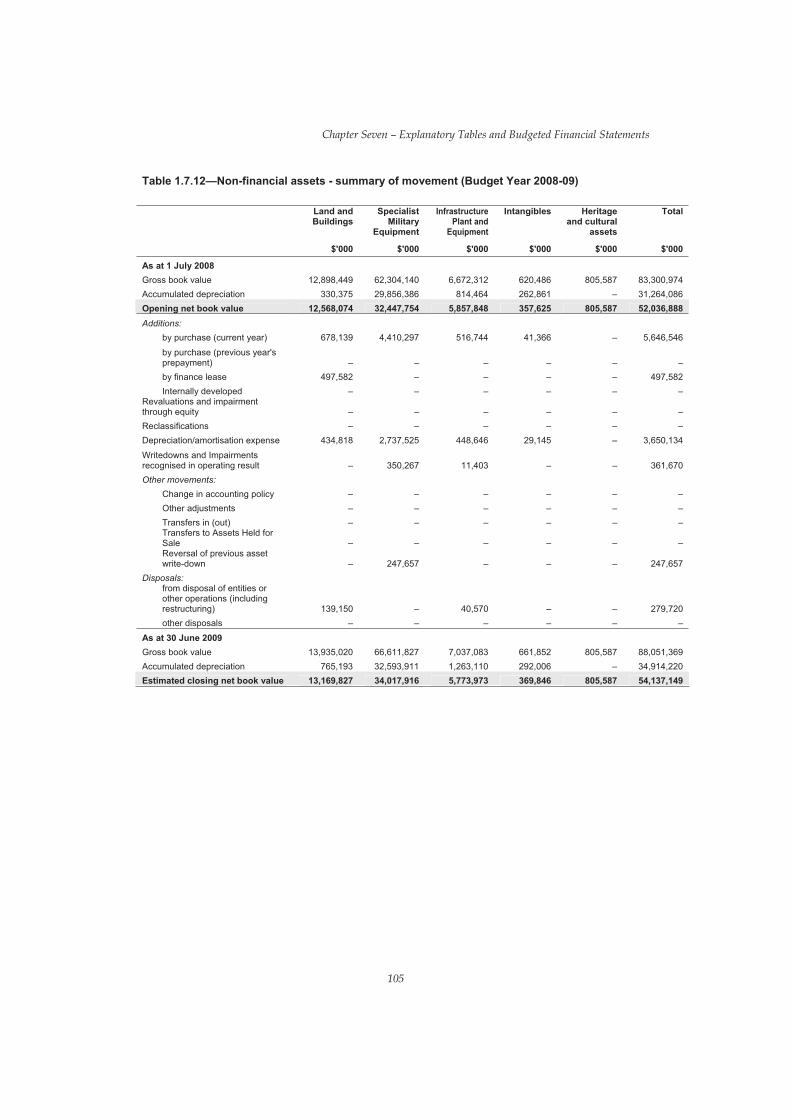
Table 1.7.12—Non-financial assets - summary of movement (Budget Year 2008-09)
Land and Buildings
Specialist Military
Equipment
Infrastructure Plant and Equipment
Intangibles Heritage and cultural
assets
Total
As at 1 July 2008
$'000
$'000
$'000 $'000 $'000 $'000
Gross book value 12,898,449 62,304,140 6,672,312 620,486 805,587 83,300,974 Accumulated depreciation 330,375 29,856,386 814,464 262,861 – 31,264,086 Opening net book value 12,568,074 32,447,754 5,857,848 357,625 805,587 52,036,888 Additions:
by purchase (current year) 678,139 4,410,297 516,744 41,366 – 5,646,546 by purchase (previous year's prepayment) – – – – – –
by finance lease 497,582 – – – –
497,582 Internally developed – – – – – –
Revaluations and impairment through equity – – – – – –Reclassifications – – – – – –Depreciation/amortisation expense 434,818 2,737,525 448,646 29,145 – 3,650,134 Writedowns and Impairments recognised in operating result – 350,267 11,403 – – 361,670 Other movements:
Change in accounting policy – – – – – – Other adjustments – – – – – –Transfers in (out) – – – – – – Transfers to Assets Held for Sale – – – – – –Reversal of previous asset write-down – 247,657 – – – 247,657
Disposals: from disposal of entities or other operations (including restructuring) 139,150 – 40,570 – – 279,720 other disposals – – – – – –
As at 30 June 2009 Gross book value 13,935,020 66,611,827 7,037,083 661,852 805,587 88,051,369 Accumulated depreciation 765,193 32,593,911 1,263,110 292,006 – 34,914,220 Estimated closing net book value 13,169,827 34,017,916 5,773,973 369,846 805,587 54,137,149
Chapter Seven – Explanatory Tables and Budgeted Financial Statements
105

ANALYSIS OF ADMINISTERED ACTIVITY Administered expenses are those managed by Defence on behalf of the Government. They normally relate to activities governed by eligibility rules and conditions established by the Government or Parliament. Defence has three categories of administered expenses: military superannuation, housing assistance and other. These are described in further detail in Chapter Six – Planned Outcome Performance in output group 1.14.
Revised Administered Income and Expenses Defence is budgeting to receive $777.6m in income for administered items in 2008-09 and plans to have expenses of $2,964.9m. Details are shown in 1.7.13 and an explanation of the financial variations follow.
Table 1.7.13—Variation to budgeted income and expenses administered on behalf of Government
2008-09 Budget
estimate $'000
2008-09 Revised estimate
$'000 Variation
$'000
% INCOME administered on behalf of Government
60,448 13
Interest
41,187100
174 1,338.5 Dividends -19,348 -32.0 Military superannuation contributions 731,000 731,000 – – License fees 4,711 4,711 – – United Nations Reimbursements 569 569
-19,174
– – Total income administered on behalf of Government 7
523,300
2,638
96,741 77
23,30050,868
7,567 -2.4 EXPENSES administered on behalf of Government Subsidies -1,770 -3.4 Grants – –
Military retention benefits 42,000 42,000 – – Military superannuation benefits 2,848,700 2,848,700
-1,770
– – Total expenses administered on behalf of Government 2,966,638 2,964,868 -0.1
Chapter Seven – Explanatory Tables and Budgeted Financial Statements
Income Income administered on behalf of the Government will decrease by $19.2m due to:
• an increase in interest from DHA ($0.2m)
• a decrease in dividends from DHA (-$19.3m).
Expenses Expenses administered on behalf of the Government will decrease by $1.8m due to:
• a decrease in subsidies in line with actuals (-$1.8m).
106

2008-09 SCHEDULE OF ADMINISTERED ACTIVITY
Table 1.7.14—Schedule of budgeted income and expenses administered on behalf of government
2007-08 2008-09 2009-10 2010-11 2011-12 Actual Revised Forward Forward Forward
Budget estimate estimate estimate $'000 $'000 $'000 $'000 $'000
INCOME ADMINISTERED ON BEHALF OF
GOVERNMENT Revenue
Interest 124 187 13 13 13 Dividends 134,263 41,100 42,800 44,200 64,058 Military superannuation contributions 756,982 731,000 760,000 760,000 793,000 License fees – 4,711 12,775 20,681 26,672 Other 255 569 3 3 3
Total revenues administered on behalf of Government 891,624 777,567 815,591 824,897 883,746 EXPENSES ADMINISTERED ON BEHALF OF
GOVERNMENT Subsidies 11,284 50,868 69,354 88,324 106,177 Aircraft leasing costs 4,327 – – – – Grants 26,800 23,300 – – – Military retention benefits 31,405 42,000 40,000 38,000 36,000 Military superannuation benefits 2,818,000 2,848,700 2,946,890 3,047,100 3,150,300
Total expenses administered on behalf of Government 2,891,816 2,964,868 3,056,244 3,173,424 3,292,477
Chapter Seven – Explanatory Tables and Budgeted Financial Statements
107
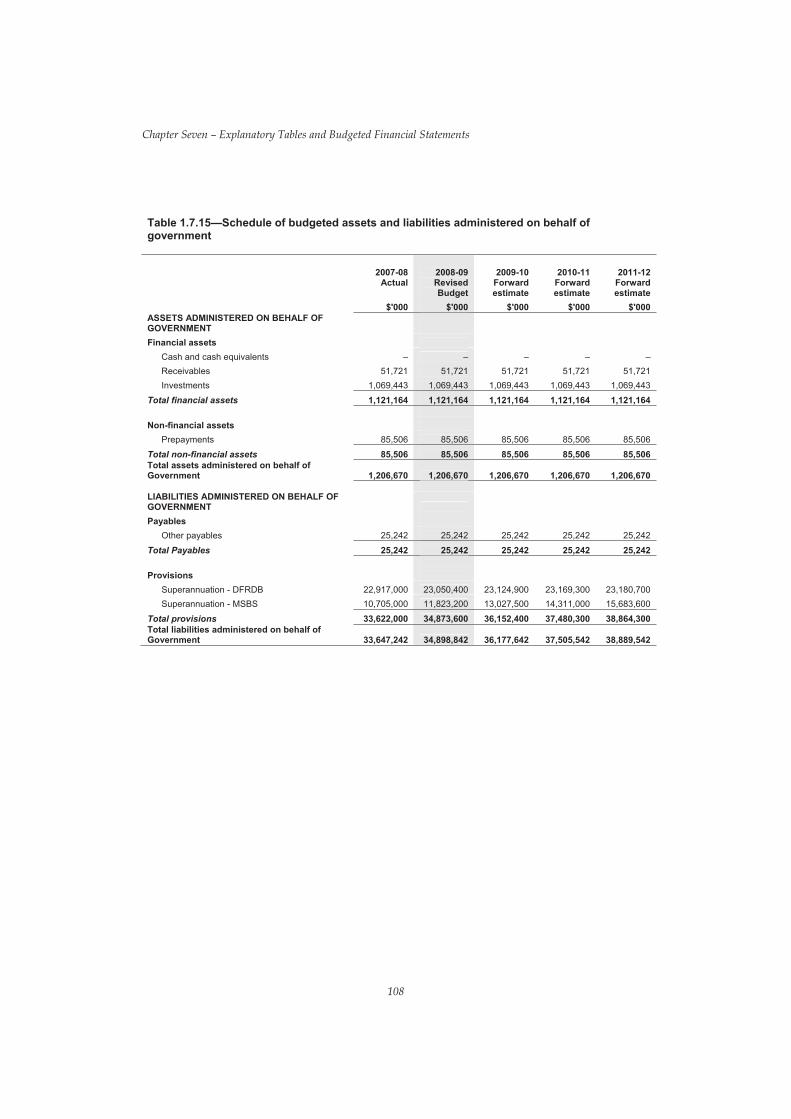
Table 1.7.15—Schedule of budgeted assets and liabilities administered on behalf of government
2007-08 2008-09 2009-10 2010-11 2011-12 Actual Revised Forward Forward Forward
Budget estimate estimate estimate
ASSETS ADMINISTERED ON BEHALF OF $'000 $'000 $'000 $'000 $'000
GOVERNMENT Financial assets
Cash and cash equivalents – – – – – Receivables 51,721 51,721 51,721 51,721 51,721 Investments 1,069,443 1,069,443 1,069,443 1,069,443 1,069,443
Total financial assets 1,121,164 1,121,164 1,121,164 1,121,164 1,121,164
Non-financial assets Prepayments
Total non-financial assets 85,506 85,506 85,506 85,506 85,506
85,506 85,506 85,506 85,506 85,506 Total assets administered on behalf of
Government 1,206,670 1,206,670 1,206,670 1,206,670 1,206,670
LIABILITIES ADMINISTERED ON BEHALF OF GOVERNMENT
Payables Other payables
Total Payables 25,242 25,242 25,242 25,242 25,242
25,242 25,242 25,242 25,242 25,242
Provisions Superannuation - DFRDB 22,917,000 23,050,400 23,124,900 23,169,300 23,180,700 Superannuation - MSBS
Total provisions Total liabilities administered on behalf of
10,705,000 11,823,200 13,027,500 14,311,000 15,683,600
33,622,000 34,873,600 36,152,400 37,480,300 38,864,300
Government 33,647,242 34,898,842 36,177,642 37,505,542 38,889,542
Chapter Seven – Explanatory Tables and Budgeted Financial Statements
108

Table 1.7.16—Schedule of budgeted cash flows administered on behalf of government
2007-08 2008-09 2009-10 2010-11 2011-12 Actual Revised Forward Forward Forward
Budget estimate estimate estimate
OPERATING ACTIVITIES $'000 $'000 $'000 $'000 $'000
Cash Received
Interest 146 187 13 13 13Military superannuation contributions 790,924 731,569 760,003 760,003 793,003
License fee – 4,711 12,775 20,681 26,672Net GST received from ATO 175 – – – –Other 284 – – – –
Total operating cash received 791,529 736,467 772,791 780,697 819,688
Cash Used Military benefits 1,517,426 1,672,100 1,709,100 1,757,200 1,802,300Aircraft leasing costs 4,502 – – – –
Subsidies 12,200 50,868 69,354 88,324 106,177Grants 26,800 23,300 – – –
Total operating cash used Net cash from or (used by) operating activities
1,560,928 1,746,268 1,778,454 1,845,524 1,908,477
-769,399 -1,009,801 -1,005,663 -1,064,827 -1,088,789
INVESTING ACTIVITES Cash Received
Dividends 83,604 41,100 42,800 44,200 64,058Total investing cash received
Net cash from or (used by) investing activities Net increase (decrease) in cash held
Cash at the beginning of reporting period
83,604 41,100 42,800 44,200 64,058
83,604 41,100 42,800 44,200 64,058-685,795 -968,701 -962,863 -1,020,627 -1,024,731
39 – – – –Cash from the Official Public Account for appropriations 1,560,929 1,748,038 1,780,764 1,848,624 1,912,457Cash to the Official Public Account -875,173 -779,337 -817,901 -827,997 -887,726Effect of exchange rate movements on cash at the beginning of the reporting period
Cash at end of reporting period – – – – –– – – – –
Chapter Seven – Explanatory Tables and Budgeted Financial Statements
109
Chapter Seven – Explanatory Tables and Budgeted Financial Statements
NOTES TO THE BUDGETED FINANCIAL STATEMENTS
NOTE 1 – KEY ACCOUNTING POLICIES
1.1 Budgeted Financial Statements Overview Budgeted financial statements have been included to show the planned financial performance over the 2008-09 budget year, and each of the following forward years from 2009-10 to 2011-12.
The budgeted income statement, balance sheet, cash flow statement, capital budget statement, equity schedule and asset movement schedule are provided to show the revenues, expenses, assets, liabilities and equity of Defence. These budgeted statements contain estimates prepared in accordance with the requirements of the Government’s financial budgeting and reporting framework.
Budgeted financial estimates are provided for both departmental and administered financial items. Departmental, or controlled, financial items are revenues, expenses, assets and liabilities over which Defence has discretion, responsibility and authority. Departmental financial statements represent the financial performance of Defence in delivering its outputs.
Administered financial estimates include revenues, expenses, assets and liabilities that Defence administers on behalf of the Government, but over which Defence does not have management control.
1.2 Budgeted Departmental Financial Statements and Schedule of Budgeted Administered Activity Note that the term ‘budgeted financial statements’ and ‘statements’ are used interchangeably.
Under the Government’s accrual-based budgeting framework, and consistent with Australian Accounting Standards, transactions that agencies control (departmental transactions) are separately budgeted for and reported, compared to transactions that agencies do not have control over (administered transactions). This ensures that agencies are only held fully accountable for the transactions over which they have control.
• Departmental expenses include employee and supplier expenses and other administrative costs, which are incurred by Defence in providing its goods and services.
• Administered items are revenues, expenses, assets and liabilities that are managed by Defence on behalf of the Government according to set Government directions of which Defence does not have management control. These include military superannuation contributions, payments received from the United Nations and foreign governments, bank interest and dividends paid by Defence Housing Australia.
1.3 Appropriations in the Accrual Budgeting Framework Under the Government’s accrual budgeting framework, separate annual appropriations are provided for:
• departmental output appropriations (representing the Government’s funding for outputs from agencies)
• departmental capital appropriations (representing investments by the Government for either additional equity in or loans to agencies)
• administered expense appropriations (representing estimated administered expenses relating to an existing outcome, a new outcome or a Specific Purpose Payment to the states)
• administered capital appropriations (represent increases in administered equity through funding non-expense administered payments).
110

Chapter Seven – Explanatory Tables and Budgeted Financial Statements
Special appropriations fund the majority of payments from the Consolidated Revenue Fund (especially those that are entitlement driven or involve transfers to state and territory governments).
1.4 Basis of Accounting The budgeted statements have been prepared in accordance with:
• Finance Minister’s Orders (FMOs), being the Financial Management and Accountability Orders (Financial Statements for reporting periods ending on or after 1 July 2007)
• Applicable Australian Accounting Standards and Interpretations issued by the Australian Accounting Standards Board (AASB).
The budgeted income statement and balance sheet have been prepared on an accrual basis and are in accordance with the historic cost convention, except for certain assets which, as noted (refer to items 1.12 and 1.14), are at fair value. Except where stated, no allowance is made for the effect of changing prices on the results or financial position.
Administered revenues, expenses, assets and liabilities and cash flows reported in the Schedules of Administered Activity are accounted for on the same basis and using the same policies as for departmental items, except as otherwise stated in Note 1.19.
1.5 Revenue
Revenues from the Australian Government Departmental outputs appropriation for the year are recognised as revenue, except for certain amounts which relate to activities that are reciprocal in nature, in which case revenue is recognised only when it has been earned.
Defence operates on a just in time draw-down basis that has resulted in undrawn appropriations at year end being reflected as a receivable. This receivable is available for draw-down to meet future obligations.
Other Revenue Revenue from the sale of goods is recognised upon delivery of the goods to the customer. Revenue is recognised from services at the time the service is provided. Revenue from disposal of non-current assets is recognised when control of the asset has passed to the buyer.
1.6 Transactions with the Australian Government
Equity Injection Equity injection represents an additional contribution to Defence by the Australian Government, which is over and above the revenue from the Government for the price of outputs. Equity injections are used to fund capital expenditure and are recognised directly into equity in that period.
Other Distributions to Owners including Return of Capital The Finance Minister’s Orders require that distributions to owners be debited to Contributed Equity, unless in the nature of a dividend.
1.7 Employee Benefits Defence’s workforce comprises two employment components: Australian Public Service (APS, i.e. civilians) and Australian Defence Force (ADF, i.e. military) personnel. Employee benefits for each workforce component are based on the relevant employment agreements and legislation.
Liabilities for services rendered by employees are recognised at the reporting date to the extent that they have not been settled.
111
Chapter Seven – Explanatory Tables and Budgeted Financial Statements
Liabilities for wages and salaries (including non-monetary benefits) and annual leave expected to be settled within 12 months of the reporting date are measured at their nominal amounts. The nominal amount is calculated with regard to the rates expected to be paid on settlement of the liability. Employee benefits expected to be settled more than 12 months after the end of the reporting date are measured at the present value of the estimated future cash outflows to be made in respect of services provided by employees up to the reporting date.
Leave The liability for employee benefits includes provision for annual leave and long service leave. No provision has been made for sick leave as all sick leave is non-vesting and the average sick leave taken in future years by employees of Defence is estimated to be less than the annual entitlement for sick leave.
The leave liabilities are calculated on the basis of employees’ remuneration, including Defence’s employer superannuation contribution rates to the extent that the leave is likely to be taken during service rather than paid out on termination. Where there is a legal obligation to payment of leave within 12 months, even when payment is not expected, the liability is disclosed as current.
The liability for long service leave is determined by reference to the work of the Australian Government Actuary. The estimate of the present value of the liability takes into account attrition rates and pay increases through promotion and inflation.
The liability for annual leave for APS and ADF employees reflects the value of total annual leave entitlements of all such employees and is recognised at the nominal amount, or discounted to the present value for amounts not expected to be taken or paid within 12 months.
Superannuation on-costs have been added to the provisions for annual leave and long-service leave in respect of both APS and ADF employees.
Separation and Redundancy Provision is made for separation and redundancy benefit payments when Defence has developed a detailed formal plan for the terminations and has informed those affected that the terminations will be carried out.
Superannuation Permanently-appointed APS employees and Defence contribute to the Commonwealth Superannuation Scheme (CSS), the Public Sector Superannuation Scheme (PSS), the PSS Accumulation Plan (PSSAP) and other superannuation schemes held outside the Commonwealth. The CSS and PSS are defined benefit schemes for the Australian Government. The PSSAP is a defined contribution scheme.
The liability for defined benefits is recognised in the financial statements of the Australian Government and is settled by the Australian Government in due course. This liability is reported by the Department of Finance and Deregulation as an administered item.
Defence makes employer contributions to the Australian Government at rates determined by an actuary to be sufficient to meet the cost to the Government of the superannuation entitlements of the department’s employees. Defence accounts for these contributions as if they were contributions to defined contribution plans in accordance with AASB 119.
The Defence Force Retirement and Death Benefits Scheme (DFRDB) and the Military Superannuation and Benefits Scheme (MSBS) are defined benefit superannuation plans for ADF members. Defence accounts for these contributions in the Budgeted Departmental Statements as if they were contributions to defined contribution plans in accordance with AASB 119. The liability for DFRDB and MSBS is recognised in the Budgeted Schedules of Administered Activity.
112

Chapter Seven – Explanatory Tables and Budgeted Financial Statements
1.8 Leases A distinction is made between finance leases and operating leases. Finance leases effectively transfer from the lessor to the lessee substantially all the risks and benefits incidental to ownership of leased non-current assets. In operating leases, the lessor effectively retains substantially all such risks and benefits.
Where a non-current asset is acquired by means of a finance lease, the asset is capitalised and recognised at the lower of the fair value of the leased asset and the present value of minimum lease payments at the commencement of the lease term. A liability is recognised at the same time for the same amount. Non-current assets acquired under a finance lease are depreciated/amortised over the useful life of the asset. Lease payments are allocated between the principal component and the interest expense.
Operating lease payments are expensed on a straight line basis over the term of the lease, which is representative of the pattern of benefits derived from the leased assets. Any contingent rent components of the lease are recognised as an expense in the period in which the amount of the increase/decrease is applied.
Lease incentives taking the form of ‘free’ leasehold improvements and rent holidays are recognised as liabilities. These liabilities are reduced by allocating lease payments between rental expense and reduction of liability.
1.9 Cash and Cash Equivalents Cash and Cash Equivalents means notes and coins held, as well as any deposits held at call with a bank or financial institution. Cash and Cash Equivalents are recognised at the nominal amount.
1.10 Receivables Receivables for goods and services, which have 30 day terms, are recognised at the nominal amounts due less any allowance for doubtful debt s. The collectability of receivables is assessed periodically with allowance made for doubtful debts when there is objective evidence that Defence will not be able to collect the debt. No allowance is made for Australian Government, foreign government and employee debts as they are deemed to be collectable unless there is objective evidence to the contrary.
1.11 Acquisition of Assets Assets are recorded at cost on acquisition except as stated below. The cost of acquisition includes the fair value of assets transferred in exchange and liabilities undertaken.
Assets acquired at no cost or for nominal consideration are initially recognised as as sets and revenues at their fair value as at the date of acquisition, unless acquired as a consequence of restructuring of administrative arrangements. In the latter case, assets are initially recognised as contributions by owners at the amounts at which they were recognised in the transferor agency’s accounts immediately prior to the restructuring.
1.12 Property, Plant and Equipment including Land, Buildings and Infrastructure
Asset Recognition Threshold Purchases of property, plant and equipment are recognised initially at cost in the Budgeted Balance Sheet where they meet the capitalisation threshold. The capitalisation thresholds for the classes of assets are detailed in the table below.
113

Chapter Seven – Explanatory Tables and Budgeted Financial Statements
Table 1.7.17—Capitalisation Threshold for Various Asset Classes Asset Class Capitalisation
Threshold ($) Land 0.01 Buildings 5,000.00 Specialised military equipment (SME) including - SME in use; and 0.01 Repairable items Infrastructure 5,000.00 Heritage and cultural 5,000.00 Intangibles including – 150,000.00 Computer software – Purchased Computer software - Internally generated; and Other intangibles Other plant and equipment (OP&E) 2,000.00
Revaluations Land, buildings, plant and equipment are measured and disclosed at fair value. Valuations are conducted with sufficient frequency to ensure that the carrying values of assets do not materially differ from the assets fair value as at reporting date. The regularity of independent valuations depends upon the volatility of movements in market values for the relevant assets.
In accordance with the Finance Minister’s Orders, Specialist Military Equipment is carried at cost. Assets Under Construction are also not revalued but are carried at cost. In addition to reviewing expenditures from the point of rollout into service, Assets Under Construction expenditures are now also considered on a whole-of-life basis. They are subject to impairment testing annually and prior to being transferred into use.
Depreciation and Amortisation Non-current assets having limited useful lives are systematically depreciated/amortised over their estimated useful lives on a straight-line basis.
Heritage and cultural assets within Defence have been assessed to have indefinite lives. These heritage and cultural assets are stored, managed, displayed, repaired and restored in ways that will maintain their cultural or heritage value over time.
Depreciation and amortisation rates (useful lives) and methods are reviewed at each reporting date and necessary adjustments are recognised in the current, or current and future reporting periods, as appropriate. Residual values are re-estimated for a change in prices only when assets are revalued.
Decontamination and Restoration Costs Where a legal or constructive obligation arises on acquisition to restore an asset back to its original condition, the net present value of estimated restoration costs are capitalised and added to the cost of the underlying asset and depreciated over the asset’s useful life. A corresponding provision is recognised for the restoration obligation costs. When discounting is used, the carrying amount of the provision is adjusted to reflect the unwinding of the discount and this is recognised as a finance expense.
Where a legal or constructive obligation arises as a result of the operations of Defence (i.e. use of the assets) the present value of the costs of restoration is recognised as an expense in the period in which the obligation arises.
Asset Disposals The gain or loss on disposal of property, plant and equipment is determined as the difference between the carrying amount of the asset at the time of disposal and the proceeds of disposal, less any cost of disposal.
114

Chapter Seven – Explanatory Tables and Budgeted Financial Statements
Impairment of Non-Current Assets Non-current assets carried at cost or fair value are assessed annually for indications of impairment. Where indications of impairment exist, the recoverable amount of the asset is estimated and compared to the asset’s carrying amount. If the recoverable amount is less than its carrying amount, the carrying amount is reduced to the recoverable amount and the reduction is to be shown as an impairment loss expense.
1.13 Inventory Defence's inventory is for its own consumption and it does not ordinarily hold inventory for sale. If sales are made they represent disposal of inventory surplus to requirements and minor fuel sales.
Inventory held for distribution is measured at cost, adjusted where applicable for loss of service potential.
Defence has implemented a policy to identify and provide for potential excess stocks.
Costs incurred in bringing each item of inventory (primarily explosive ordnance and general stores) to its present location and condition that are capable of being allocated on a reasonable basis are assigned to inventory. The costs of inventories are assigned by using the weighted average cost formula.
1.14 Intangibles Defence’s intangibles primarily comprise externally acquired and internally-developed computer software for internal use. Intangibles with gross values greater than $150,000 are capitalised.
Acquired intellectual property may form part of the acquisition of particular tangible assets and in such cases is reflected in the value reported for the relevant non financial asset class within the Budgeted Balance Sheet.
Defence carries intangible assets at cost or, where an active market exists, at fair value less any subsequent accumulated amortisation and accumulated impairment losses.
The service potential of non-current intangible assets is reviewed annually. If an intangible asset is regarded as being impaired, the asset is written down to reflect its remaining service potential.
Intangibles are amortised on a straight-line basis over their anticipated useful life.
1.15 Investments Investments held on behalf of the Australian Government are included as administered assets and are brought to account at the value of the Australian Government’s share of the net assets of the entity. This is a requirement of the Finance Ministers’ Orders. Administered investments in controlled entities are not consolidated because their consolidation is relevant only at the whole-of-government level.
1.16 Foreign Currency Transactions denominated in a foreign currency are converted at the exchange rate on the date of transaction. Foreign currency receivables and payables are translated at the exchange rate current as at the balance date. Exchange gains and losses are brought to account in determining the operating result for the year.
115
Chapter Seven – Explanatory Tables and Budgeted Financial Statements
1.17 Taxation Defence’s activities are exempt from all forms of taxation except fringe benefits tax, the goods and services tax (GST), and certain excise and customs duties.
Revenues, expenses and assets are recognised net of GST except:
• where the amount of GST incurred is not recoverable from the Australian Taxation Office
• for receivables and payables (which are shown inclusive of GST in the Budgeted Balance Sheet).
1.18 Insurance Defence has insured for key insurable risks, excluding workers compensation, through the Government’s insurable risk managed fund, called ‘Comcover’. Workers compensation is through Comcare.
1.19 Schedules of Budgeted Administered Activity Administered revenues, expenses, assets, liabilities and cash flows are disclosed in the Schedules of Administered Activity.
Except where otherwise stated below, administered items are accounted for on the same basis and using the same policies as for departmental items, including the application Australian Accounting Standards and Interpretations issued by the AASB.
Revenue collected by Defence, for use by the Australian Government rather than Defence, is Administered Revenue. Collections are transferred to the Official Public Account maintained by the Department of Finance and Deregulation. Conversely, cash is drawn down from the Official Public Account to make payments under parliamentary appropriations on behalf of the Australian Government. These transfers to and from the Official Public Account are reported as adjustments to the administered cash held by Defence on behalf of the Government and reported as such in the Budgeted Statement of Cash Flows in the Schedule of Administered Activity. Thus the Budgeted Schedules of Administered Activity largely reflect the Australian Government’s transactions, through Defence, with parties outside the Australian Government.
Administered Revenue All administered revenues relate to activities performed by Defence on behalf of the Australian Government. Administered revenues mainly comprise military superannuation contributions, payments received from the United Nations and foreign governments, bank interest and dividends paid by Defence Housing Australia.
Administered Expenses All administered expenses relate to activities performed by Defence on behalf of the Australian Government. Administered expenses mainly comprise unfunded military superannuation benefits, ADF housing subsidies and ADF retention benefits.
Administered Investments Defence reports the Australian Government’s capital investment in Defence Housing Australia. The investment is classified as ‘available for sale’ and is measured at fair value using the net assets valuation approach in accordance with the FMOs. The investment is subject to impairment testing.
Military Retention Benefits Certain categories of ADF personnel who are members of the Military Superannuation and Benefits Scheme and have had 15-years of service receive retention benefits as an incentive for continued service. Retention benefit payments are initially recorded as prepayments and written down over the period of service.
116
Chapter Seven – Explanatory Tables and Budgeted Financial Statements
Military Superannuation The Defence Force Retirement and Death Benefits Scheme (DFRDB) and the Military Superannuation Benefits Scheme (MSBS) are defined benefit superannuation plans for ADF members. Contributions, benefit payments and the provision for unfunded obligations are reflected in the Budgeted Schedules of Administered Activity.
The DFRDB is a fully unfunded scheme but the MSBS is a partly-funded scheme. MSBS member contributions are paid into the MSBS fund that is controlled by the MSBS Board and are therefore not reflected in the Budgeted Schedules of Administered Activity. The Australian Government on behalf of the MSBS Fund makes funded benefit payments to members of the scheme and the Australian Government is reimbursed by the MSBS fund for these payments.
The Australian Government Actuary estimates the unfunded provisions and expected future cash flows as at 30 June each year. These estimates are reflected in the Budgeted Schedules of Administered Activity. The Australian Government Actuary completes a full review of the unfunded liabilities (a long-term cost report) every three years.
117

PART TWO
DEFENCE MATERIEL ORGANISATION


SECTION ONE
DEFENCE MATERIEL ORGANISATION OVERVIEW AND RESOURCES


CHAPTER ONE — DEFENCE MATERIEL ORGANISATION
OVERVIEW
OVERVIEW
OVERVIEW OF THE 2008-09 ADDITIONAL ESTIMATES
ORGANISATIONAL STRUCTURE

Part Two – Defence Materiel Organisation
OVERVIEW
The DMO’s mission is to equip and sustain the Australian Defence Force (ADF). The DMO is currently managing over 215 major projects, over 180 minor projects and 99 sustainment schedules, across more than 40 locations in Australia and overseas.
OVERVIEW OF THE 2008—09 ADDITIONAL ESTIMATES
The 2008-09 DMO revised estimates are around $9.7b in departmental funding. This is approximately $0.1b higher than the funding estimated at the 2008-09 Budget mainly as a consequence of increase in sustainment activity ($0.1b), movement of foreign exchange rate ($0.5b) and reprogramming of cash flow requirements (-$0.5b).
Strategic priorities for 2008—09 Results will be reported in the Defence Annual Report 2008-09, Volume 2.
Defence Procurement and Sustainment Review The Review was completed in September and the Minister for Defence, the Hon Joel Fitzgibbon MP, tabled the Review report, entitled Going to the Next Level, in Parliament on 23 September 2008.
The Review concluded that the Kinnaird recommendations have been very successful in improving the system but more work needs to be done. The Review made 46 recommendations across five areas:
• The Strategy and Needs Analysis of Capability Planning
• Defining the Requirements of Capability
• The Capability Acquisition Process
• Sustaining and Disposing of Capability
• Driving Cultural Change in the DMO.
The Government is currently considering its response to the Review.
ORGANISATIONAL STRUCTURE
Senior Executive changes Ms Gillian Marks, General Counsel, concluded her tenure with the DMO on 31 October 2008.
125
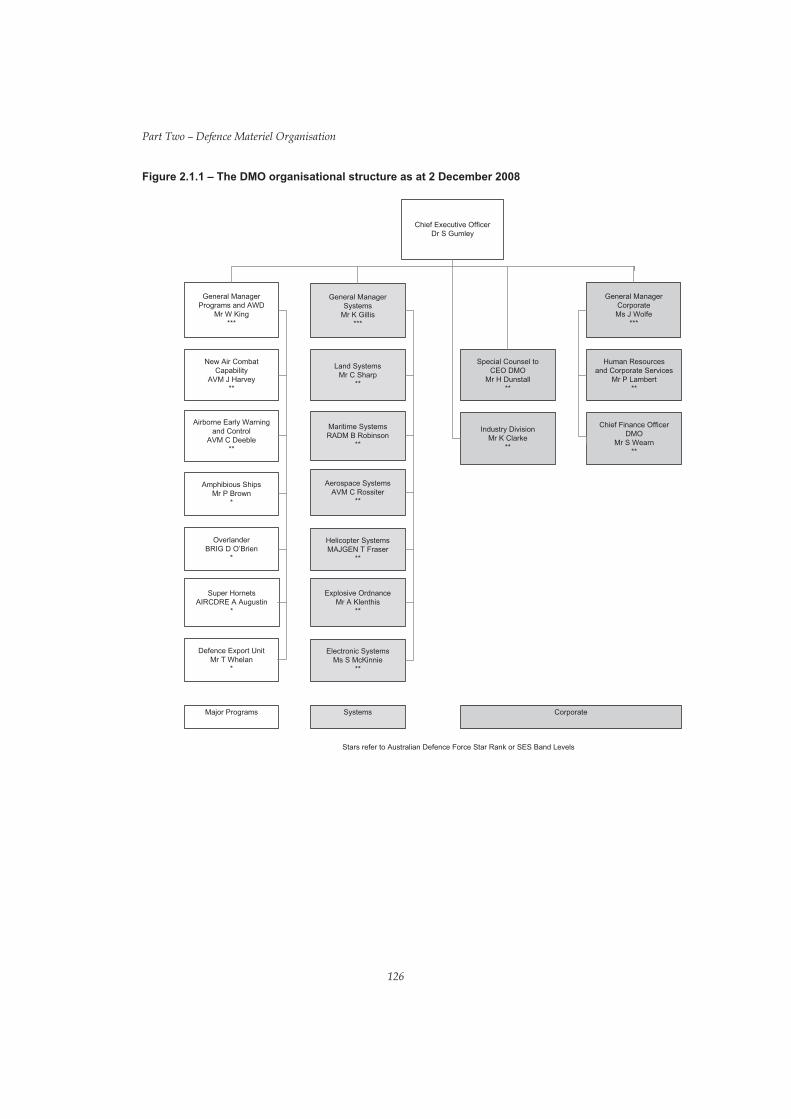
Figure 2.1.1 – The DMO organisational structure as at 2 December 2008
Chief Executive Officer Dr S Gumley
General Manager Programs and AWD
Mr W King ***
General Manager Systems
Mr K Gillis ***
Industry Division Mr K Clarke
**
Special Counsel to CEO DMO
Mr H Dunstall **
Maritime Systems RADM B Robinson
**
Land Systems Mr C Sharp
**
Human Resources and Corporate Services
Mr P Lambert **
New Air Combat Capability
AVM J Harvey **
Airborne Early Warning and Control
AVM C Deeble **
Aerospace Systems AVM C Rossiter
**
Electronic Systems Ms S McKinnie
**
Helicopter Systems MAJGEN T Fraser
**
Explosive Ordnance Mr A Klenthis
**
Chief Finance Officer DMO
Mr S Wearn **
Major Programs Systems Corporate
Stars refer to Australian Defence Force Star Rank or SES Band Levels
Defence Export Unit Mr T Whelan
*
Super Hornets AIRCDRE A Augustin
*
Amphibious Ships Mr P Brown
*
Overlander BRIG D O’Brien
*
General Manager Corporate Ms J Wolfe
***
Part Two – Defence Materiel Organisation
126

CHAPTER TWO — DEFENCE MATERIEL ORGANISATION
RESOURCING
RESOURCING FOR 2008-09


RESOURCING FOR 2008–09 Agency resource statement The Agency Resource Statement details the resourcing for the DMO at Additional Estimates. Table 2.2.1 outlines the total resourcing available from all sources for the 2008-09 Budget year, including variations through Appropriation Bills No.3 and special accounts.
Table 2.2.1—DMO resource statement — Additional Estimates for 2008-09 as at Additional Estimates December 2008
Estimates at Proposed
Additional Total Estimate at Additional Total Available
Budget Estimates Estimates Appropriation2008-09 2008-09 2008-09 2007-08
$'000 $'000 $'000 $'000
Ordinary Annual Services
Outcome 1[1] 94,960 - 94,960 93,256
s31 Relevant agency receipts[2] - - - -
Total ordinary annual services A 94,960 - 94,960 93,256
Total other services B - - -
Total Available Annual
Appropriations (A+B) 94,960 - 94,960 93,256
Total Special Appropriations C - - -
Total Appropriations excluding
Special Accounts 94,960 - 94,960 93,256
Special Accounts
Opening balance[3] 978,530 9,332 987,862 564,819
Appropriation Receipts 94,960 - 94,960 93,256
Appropriation Receipts - other agencies[4] 9,418,881 -47,982 9,370,899 9,201,828
Non-Appropriation receipts to
Special Accounts 82,507 5,971 88,478 101,562
Total Special Account D 10,574,878 -32,679 10,542,199 9,961,465
Total resourcing
A+B+C+D 10,669,838 -32,679 10,637,159 10,054,721
Less appropriations drawn from -94,960 - -94,960 -93,256
annual or special appropriations above
and credited to special accounts
Total net resourcing for DMO 10,574,878 -32,679 10,542,199 9,961,465
Part Two – Defence Materiel Organisation
Notes 1. Appropriation Bill (No.1) 2008-09. 2. Total s31 Relevant Agency receipts – estimate. 3. Estimated opening balance for special accounts. For further information on special accounts see Table 2.6.1. 4. Appropriation receipts from Defence annual and special appropriations for 2008-09 included above.
Reader note: All figures are GST exclusive.
129

Part Two – Defence Materiel Organisation
Table 2.2.2—Third party drawdowns from and on behalf of other agencies Estimate at
Estimate at Additional Budget 2008-09
Estimates 2008-09
$'000 $'000 Payments made to other agencies for the provision of services 318,105 328,744
Table 2.2.3—Prior year Annual Appropriations Carried Forward and Special Account Opening Balances finalised in Agency Annual Report
Estimate $'000
Actual $'000
Total Adjustment $'000
Departmental outputs - ordinary annual services 93,256 93,256 -Departmental - non- operating - equity injections - - -Special account opening balances 978,530 987,862 9,332
Additional Estimates and Variations Table 2.2.4 details the changes to the resourcing for the DMO at Additional Estimates, by outcome. It details Additional Estimates or variations through other factors, such as indexation adjustments.
Table 2.2.4—Additional Estimates and variations to outcomes from other variations Output
Impacted 2008-09
$'000 2009-10
$'000 2010-11
$'000 2011-12
$'000
Outcome 1 Decrease in estimates (departmental) Indexation adjustments 1.3 - -647 -629 -1,557
Net impact on estimates for Outcome 1 (departmental) - -647 -629 -1,557
130

Part Two – Defence Materiel Organisation
Breakdown of Additional Estimates by Appropriation Bill Table 2.2.5 details the Additional Estimates sought for the DMO through Appropriation Bills No.3.
Table 2.2.5—Appropriation Bill (No. 3) 2008-09 2007-08 2008-09 2008-09 Additional Reduced
Available $'000[1]
Budget $'000
revised $'000
estimates $'000
estimates $'000
DEPARTMENTAL OUTPUTS Outcome 1
Defence capabilities are supported through efficient and effective acquisition and through-life support of materiel 93,256 94,960 94,960 - -Total 93,256 94,960 94,960 - -
Notes 1. 2007-08 available appropriation included to allow a comparison of this year's appropriation with what was made available
for use in the previous year.
Reader Note: Available appropriation is the amount available to be drawn down, and is equal to: Budget Appropriation + Additional Estimates Appropriation + Advance from the Finance Minister – Savings Rephasings - Other Reductions +/- Section 32
131


CHAPTER THREE — MANAGEMENT REFORMS AND GOVERNANCE
GOVERNING THE DMO


Chapter Three – Management reforms and governance
Information remains as reported in the Defence Portfolio Budget Statements 2008-09 except for the following information.
Vision The DMO’s vision is to become the premier program management, logistics and engineering services organisation in Australia.
GOVERNING THE DMO A new Ministerial Directive was signed by the Minister for Defence, the Hon Joel Fitzgibbon MP on 28 July 2008.
The Ministerial Directive provides a mechanism to define the relationship between the Minister and the CEO DMO.
135


CHAPTER FOUR — DEFENCE MATERIEL ORGANISATION PEOPLE
DMO PEOPLE


DMO PEOPLE
Approved increases in the DMO workforce positions have resulted in a revised estimate of 7,658. Variation to the DMO and Defence workforce numbers as shown in Table 2.4.1. The ADF workforce numbers are also included in the Defence People Chapter in Part One.
Table 2.4.1—Breakdown of personnel numbers by service and rank / level [1]
Budget Estimate
Revised Estimate
2008-09 2008-09 Variation Variation % APS [2]
Senior Executives [3] 35 35 0 0 Senior Officers [4] 1,405 1,444 39 3 Other APS Staff 3,935 3,911 -24 -1 Sub-total : APS [5] 5,375 5,390 15 0 Professional Service Provider (PSP) [6] 255 267 12 5 Sub-total civilian workforce 5,630 5,657 27 0
NAVY Star Ranked Officers 8 8 0 0 Senior Officers [4] 51 51 0 0 Junior Officers 138 135 -3 -2 Other Ranks 156 155 -1 -1
Sub-total : Permanent Navy Reserve Force[7]
353 140
349 140
-4 0
-1 0
Sub-total Navy 493 489 -4 -1 ARMY
Star Ranked Officers 6 6 0 0 Senior Officers [4] 54 54 0 0 Junior Officers 200 201 1 1 Other Ranks 211 210 -1 0
Sub-total : Permanent Army Reserve Force[7]
471 70
471 70
0 0
0 0
Sub-total Army 541 541 0 0 AIR FORCE Star Ranked Officers 9 9 0 0 Senior Officers[4] 91 95 4 4 Junior Officers 466 466 0 0 Other Ranks 369 366 -3 -1 Sub-total : Permanent Air Force 935 936 1 0 Reserve Force[7] 35 35 0 0 Sub-total Air Force 970 971 1 0
Sub-total ADF permanent workforce 1,759 1,756 -3 0 Expected ADF Shortfalls 0 0 0 0
Sub-total permanent ADF workforce 1,759 1,756 -3 0 Sub-total ADF Reserves Force 245 245 0 0 Total DMO Workforce 7,634 7,658 24 0
Part Two – Defence Materiel Organisation
Notes 1. Reflects the APS, PSP, ADF permanent and reserve forces for 2008–09. Numbers for the Permanent Forces includes
Reservists undertaking Continuous Full Time Service. 2. Includes 15 Full Time Equivalent for unapproved projects. 3. The figures for Senior Executive Service include CEO-DMO and General Managers. 4. Senior Officers are of Colonel or Lieutenant Colonel rank equivalent and substantive APS Executive Level 1 and 2. 5. These figures include the 5 per cent efficiency savings. 6. PSPs are individuals with specialist skills under contract to fill line positions. 7. ADF Reserve figures represent numbers of active Reservists (excluding Reservists undertaking full-time service and
Foreign Service Reservists) who rendered service during 2008-09 and additional DMO ADF Reservist bids for 2008-09.
139


SECTION TWO
DEFENCE MATERIEL ORGANISATION OUTCOMES AND PLANNED PERFORMANCE


CHAPTER FIVE — PLANNED OUTCOME AND PERFORMANCE
OUTCOME AND PERFORMANCE INFORMATION
SUMMARY OF OUTCOME AND CONTRIBUTION TO OUTCOME
PERFORMANCE AND EVALUATION INFORMATION FOR THE DMO OUTCOME
OUTPUT 1.1 - MANAGEMENT OF CAPABILITY ACQUISITION
OUTPUT 1.2 – MANAGEMENT OF CAPABILITY SUSTAINMENT
OUTPUT 1.3 – PROVISION OF POLICY ADVICE AND MANAGEMENT SERVICES


Part Two – Defence Materiel Organisation
OUTCOME AND PERFORMANCE INFORMATION
Performance information is as reported in the Portfolio Budget Statements 2008-09, except for the revisions detailed in this chapter.
The total price of outputs estimates have primarily increased to reflect movement of exchange rate, increase in sustainment activities and reprogramming of cash flow for major projects estimates to future years.
SUMMARY OF OUTCOME AND CONTRIBUTION TO OUTCOME
The relationship between activities of the DMO and its outcome is summarised in Figure 2.5.1 in terms of accrual-based prices rather than cash received from Defence and the Government. Prices have been updated in accordance with the revised estimates.
Figure 2.5.1—Contributions to outcome and outputs
Defence Materiel Organisation
Total Price of Outputs: $9,744.062m (2008-09 PBS: $9,647.336m)
Total Departmental outcome appropriation: $94.960m (2008-09 PBS: $94.960m)
Administered Appropriation: Nil
Outcome 1 Defence capabilities are supported through efficient and effective acquisition and through-life support of materiel
Total price: $9,744.062m (2008-09 PBS: $9,647.336m)
(Total Departmental outcome appropriation: $94.960m) (2008-09 PBS: $94.960m)
Administered Appropriation: Nil
Output 1.1 Management of Capability
Acquisition
Total price: $4,523.730m (2008-09 PBS: $4,677.908m)
Output 1.2 Management of Capability
Sustainment
Total price: $5,117.317m (2008-09 PBS: $4,866.624m)
Output 1.3 Provision of Policy Advice and
Management Services
Total price: $103.015m (2008-09 PBS: $102.804m)
Department output appropriation: $94.960m
(2008-09 PBS: $94.960m)
145

Part Two – Defence Materiel Organisation
PERFORMANCE AND EVALUATION INFORMATION FOR THE DMO OUTCOME
Information remains as reported in the Defence Portfolio Budget Statements 2008-09.
Output 1.1—Management of capability acquisition Separate Materiel Acquisition Agreements between the Defence customer and the CEO DMO covers each capability project. Each agreement specifies the project in terms of the scope to be delivered, the schedule for delivery, and the budget that is available. The scope description is a reference to underlying capability specifications and key measures of capability effectiveness as selected by the customer. The schedule description outlines key milestones. The budget information provides current estimates against programmed expenditure.
The revised planned resource use for Output 1.1 is $4,523.7m in 2008-09, a decrease of $154.2m from the 2008-09 budget estimate. Planned resources include $188.1m of currently unapproved major capital projects. The transfer to the DMO of these funds will be subject to Defence obtaining project approval during 2008-09.
Australian defence industry involvement in major capital equipment projects will be reported as an appendix in the Defence Annual Report 2008–09.
APPROVED MAJOR CAPITAL EQUIPMENT PROJECTS
The DMO is currently managing over 215 major projects. A major capital equipment project is defined as a project with strategic importance and is part of the Defence Capability Plan.
TOP 30 PROJECTS BY 2008-09 FORECAST EXPENDITURE
Table 2.5.1 lists the top 30 Government approved projects by forecast expenditure for 2008-09. Schedules for delivery of the capability are included in the descriptions of the Top 30 projects.
146

Table 2.5.1—Top 30 acquisition projects by forecast expenditure in 2008-09
Project Number
Approved Projec t Expenditure
$m
Cumulative Expenditure to
30 June 2008 $m
Budget Estimate 2008-09
$m
Revised Estimate 2008-09[1]
$m Variation
$m Explanation of Variation[2]
Aerospace Systems Division
AP-3C Electronic Support Measure Upgrade
AIR 5276 Phase 8B
127 15 30 17 -13
Contractor workforce and facilities constraints associated with resources shared by Airborne Early Warning & Control has created some initial schedule slippage. These constraints have been addressed and the schedule rebaselined. The rebaselining also reflects the opportunit y provided by BAE Systems acquisition of Tenix Defence to combine
equipment delivery with aircraft integration allowing the latter to be commenced later than previousl y planned. The decrease in expenditure is due to reprogramming milestone payments from 2008-09 to 2011-12 and 2012-13.
F/A-18 Hornet Upgrade AIR 5376 Phase 2
1,983 1,258 125 95 -30
Foreign Military Sales (FMS) deliveries for Hornet Upgrade Phase 2 are on schedule. 2008-09 budget estimates programmed FMS payments of $43m have been made on delivery of supplies in advance of USN disbursements. As a result, the FMS case is now paid in advance requiring reduced expenditure in 2008-09.
F/A-18 Hornet Upgrade – Structural Refurbishment
AIR 5376 Phase 3.2
919 164 100 83 -17
Planned expenditure for 2008-09 has been reduced by $4m on account of work completed, ahead of schedule, in the previous year. The remaining variance for 2008-09 plan is attributed to work associated with the Centre Barrel Replacement (CBR) program, where costs are no w better defined and are now expected to be completed at prices less than
those previously estimated. Secondly, the reduction in planned expenditure is also attributed to the reduction in aircraft requiring CBR. With no further aircraft planned to be inducted for CBR after December 2008, this translates to reduced expenditure in the second half of 2008-09.
ADF Air to Air Refueling Capability AIR 5402 1,997 560 260 315 55 Variation attributable to global update.
Maritime Patrol and Response Aircraft System
AIR 7000 Phase 2
155 0 51 21 -30
Commencement of collaboration with the USN on Spiral 1 of its Multi Mission Maritime Aircraft (MMA) program has slipped because of delays in the USN program. The Spiral 1 program and project planning has no w matured to enable finalisation of the MoU, including rephasing of the MoU fee over a number of years to provide better value for money.
Airborne Surveillance for Land Operations
JP 129 Phase 2
147 7 25 29 4 Variation attributable to global update.
C-17 Globemaster III AIR 8000 Phase 3
1,974 1,296 23 22 -1 Variation attributable to global update.
Part Two – Defence Materiel Organisation

ProjectNumber
Approved ProjectExpenditure
$m
Cumulative Expenditure to
30 June 2008 $m
Budget Estimate 2008-09
$m
Revised Estimate 2008-09[1]
$m Variation
$m Explanation of Variation[2]
Airborne Early Warning and Control Program – Project
Wedgetail
Airborne Early Warning and Control Aircraft
AIR 5077 Phase 3
3,999 2,511 68 38 -30 Decrease primarily driven by further slippage in the System Acquisition Contract schedule, offset by a number of minor variances in other project cost elements.
Air Warfare Destroyer Program
Air Warfare Destroyer – Build SEA 4000 Phase 3
7,872 441 600 694 94 The revised estimate increase is due to the latest exchange and global
up date process. There has been no other change to the previously submitted PBS data.
Bridging Air Combat Capability—Super Hornet
Bridging Air Combat Capability Super Hornet
AIR 5349 Phase 1
3,915 341 564 560 -4
While the revised 2008-09 forecast is a minor variation from previous estimates, it represents the aggregation of large variations in planned expenditure. Estimates for 2008-09 were increased by $127m due to a declining exchange rate, but were offset by a higher than planned achievement in 2007-08 (-$129m) and minor re-programming (-$2m). The higher than anticipated FMS payment of $129m in June 2008 was the result of USN efforts focused to award production contracts ahead of schedule. The project remains on-schedule to deliver aircraft in 2010.
Electronic Systems Division New Air Defence Command and Control Systems for Control and Reporting Units 2 & 3 (2CRU/3CRU)
AIR 5333 272 114 27 30 3 Minor adjustments within the various components of the project including the Prime Contract, work being carried out Defence, and work being carried out by other contractors.
Electronic Warfare Self Protection for Selected ADF Aircraft – Echidna
AIR 5416 Phase 2
314 175 67 52 -15
Milestone payments against the ALR-2002 Full Rate Production contract occurred in 2007-08. The Black Hawk simulator upgrade has been
aligned to the Interim Electronic Warfare Self Protection configuration now scheduled for 2009-10, slippage of software development and delay
with the induction of the prototype aircraft have also occurred.
Next Generation Satellite Program
JP 2008 Phase 4
1,000 18 79 61 -18 Reduced expenditure reflects revised financial milestones for Australia’s contribution to the Wideband Global Satellite program.
High Frequency Modernisation (HFMOD)
JP 2043 Phase 3A
652 361 28 7 -21 Revised estimate is the result of schedule delays by the prime contractor in completing integration and test activities.

ProjectNumber
Approved ProjectExpenditure
$m
Cumulative Expenditure to
30 June 2008 $m
Budget Estimate 2008-09
$m
Revised Estimate 2008-09[1]
$m Variation
$m Explanation of Variation[2]
Explosive Ordnance Division
Follow-on Stand-Off Weapon AIR 5418 Phase 1
413 105 50 47 -3 The variation is principally due to a combination of FMS payments made in 2007-08, previously planned for payment in 2008-09, and exchange rate variations associated with USD payments.
Lightweight Torpedo Replacement
JP 2070 Phase 3
317 94 52 48 -4
This variation relates to slippage of a significant contract milestone. This resulted from a delay in securing some items from subcontractors, which
ultimately impacted on delivery of the items to Australia. These will now be delivered into Australia in 2009-10, but this delay will not impact the achievement of the Phase 3 schedule.
Explosive Ordnance Reserve Stocks
JP 2085 Phase 1B
214 147 33 26 -7 The variation is due to delays in finalising the FMS case and previously
planned payments for Excalibur Precision Guided Munitions slipped to 2009-10.
Mulwala Redevelopment Project JP 2086 Phase 1
367 56 171 144 -27
Expenditure has been reprogrammed from 2008-09 to 2009-10 due to an 8-12 week delay in design and construction activities resulting from the
contractor's inability to recruit for design activities, and a delay encountered by the contractor in gaining State Government planning approvals.
Helicopter Systems Division
Armed Reconnaissance Helicopter
AIR 87 Phase 2
2,078 1,310 172 125 -47 Variation is due to the revised payment regime and Integrated Master Schedule developed from the Deed of Agreement and subsequent contract changes resolving the disputed issues with the contractor.
Multi Role Helicopter AIR 9000 Phase 2
3,997 818 273 298 25 The forecast $25m increase in expenditure is due to updated economic parameters being applied to the project plan.
Land Systems Division Upgrade of M-113 Armoured Vehicles LAND 106 649 317 100 105 5 Variation attributable to global update.
Bushmaster Infantry Mobility Vehicle Project Bushranger
LAND 116 Phase 3
916 392 82 85 3 Variation attributable to global update.
Maritime Systems Division
Guided Missile Frigate Upgrade Implementation
SEA 1390 Phase 2
1,526 1,172 118 109 -9 Variation is due to prime contractor work being ahead of schedule and payments in 2007-08, and corrections for the FMS Case related to Additional Ship Crew Training.
Standard Missile Replacement (SM-1)
SEA 1390 Phase 4B
625 181 79 62 -17 The reduction in planned expenditure is due to cost savings in the procurement of missiles.
Part Two – Defence Materiel Organisation
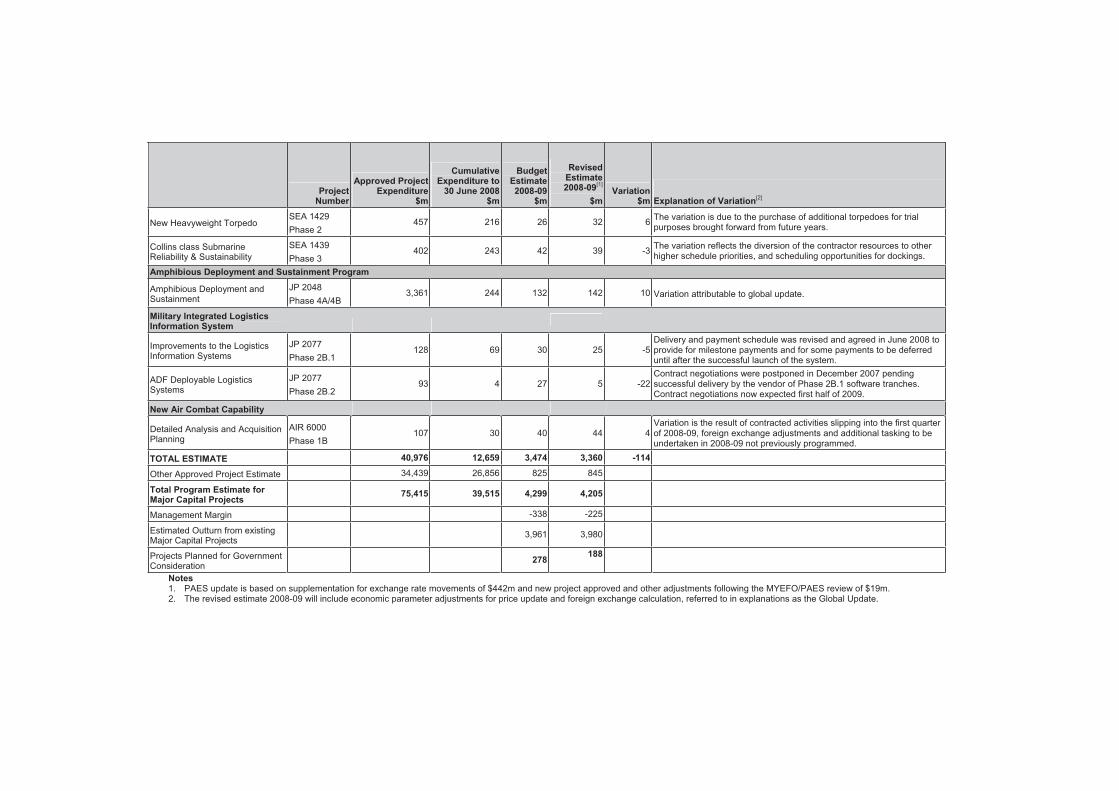
ProjectNumber
SEA 1429 Phase 2
Approved ProjectExpenditure
$m
457
Cumulative Expenditure to
30 June 2008 $m
216
Budget Estimate 2008-09
$m
26
Revised Estimate 2008-09[1]
$m
32
Variation $m
6
Explanation of Variation[2]
The variation is due to the purchase of additional torpedoes for trial purposes brought forward from future years. New Heavyweight Torpedo
Collins class Submarine Reliability & Sustainability
SEA 1439 Phase 3
402 243 42 39 -3 The variation reflects the diversion of the contractor resources to other higher schedule priorities, and scheduling opportunities for dockings.
Amphibious Deployment and Sustainment Program
Amphibious Deployment and Sustainment
JP 2048 Phase 4A/4B
3,361 244 132 142 10 Variation attributable to global update.
Military Integrated Logistics Information System
Improvements to the Logistics Information Systems
JP 2077 Phase 2B.1
128 69 30 25 -5 Delivery and payment schedule was revised and agreed in June 2008 to provide for milestone payments and for some payments to be deferred until after the successful launch of the system.
ADF Deployable Logistics Systems
JP 2077 Phase 2B.2
93 4 27 5 -22 Contract negotiations were postponed in December 2007 pending successful delivery by the vendor of Phase 2B.1 software tranches. Contract negotiations now expected first half of 2009.
New Air Combat Capability
Detailed Analysis and Acquisition Planning
AIR 6000 Phase 1B
107 30 40 44 4 Variation is the result of contracted activities slipping into the first quarter of 2008-09, foreign exchange adjustments and additional tasking to be undertaken in 2008-09 not previously programmed.
TOTAL ESTIMATE 40,976 12,659 3,474 3,360 -114
Other Approved Project Estimate 34,439 26,856 825 845
Total Program Estimate for Major Capital Projects 75,415 39,515 4,299 4,205
Management Margin -338 -225
Estimated Outturn from existing Major Capital Projects
3,961 3,980
Projects Planned for Government Consideration
278 188
Notes 1. PAES update is based on supplementation for exchange rate movements of $442m and new project approved and other adjustments following the MYEFO/PAES review of $19m. 2. The revised estimate 2008-09 will include economic parameter adjustments for price update and foreign exchange calculation, referred to in explanations as the Global Update.

Part Two – Defence Materiel Organisation
TOP 30 PROJECT DESCRIPTIONS
Information relating to the following projects remains as reported in the Defence Portfolio Budget Statements 2008-09:
• Lightweight Torpedo Replacement-JP 2070 Phase 3
• Improvements to the Logistics Information System-JP 2077 Phase 2B.1
• ADF Deployable Logistics Scheme-JP 2077 Phase 2B.2.
UPDATED INFORMATION ON TOP 30 PROJECTS
Information remains as reported in the Defence Portfolio Budget Statements 2008-09, except for the following:
Aerospace Systems Division
AP-3C Electronic Support Measure Upgrade—AIR 5276 Phase 8B Contractor: BAE Systems Australia Limited.
At contract award, the Initial Operating Capability (IOC), including modification of four AP-3C aircraft, the Operational Mission Simulator, Software Support Facility and Part Task Trainers, was planned for August 2011.
BAE have had to divert technical resources from this project to manage technical and performance issues on the Electronic Support Measures on the AEW&C project for which they are a sub-contractor to Boeing. The project is also reliant on some deliverables from the AEW&C project. This has resulted in a revised IOC of August 2012.
F/A-18 Hornet Upgrade—AIR 5376 Phase 2 Contractor:
• The Boeing Company (United States) – for Avionics Upgrade
• The Boeing Company (United States) – for Electronic Warfare Self Protection Suite Aircraft Technical Integration
• United States Navy – for Aircraft Software Integration and Radar Warning Receiver Acquisition
• SAAB (Sweden) – for Supplementary Counter Measures Dispensing Systems
• Elta (Israel) – for Active Radio Frequency Electronic Counter Measures Systems
• Raytheon Australia – for Simulator Upgrade.
The acquisition contract for the Electronic Counter-Measures Jammer was signed in May 2008 and the acquisition contract for Supplementary Counter-Measures Dispensing System in July 2008. The Interim Electronic Warfare capability, which introduces the replacement Radar Warning Receiver into service, is on schedule for completion by the end of 2008. The full-rate, mature, electronic warfare aircraft modification program is expected to commence in mid 2009, following the release of a Request for Tender in September 2008. Tender responses due to be submitted by December 2008.
The new Tactical Operation Flight Trainers (simulators) are operational, with ongoing enhancements planned to keep pace with the aircraft modifications being introduced under the Phase 2 project.
151

Part Two – Defence Materiel Organisation
F/A-18 Hornet Upgrade—Structural Refurbishment—AIR 5376 Phase 3.2 Contractor:
• L-3 Communications MAS Inc (Canada) for the Centre Barrel Replacement program, which includes Non-Recurring Engineering/Modification and Production Installation
• Boeing Australia Ltd – for Structural Refurbishment Program 1 Delta Production Installation (Contract Expires 30 November 2008)
• BAE Systems Australia – for Structural Refurbishment Program 1 Delta Production Installation (Contract Expires 30 November 2008)
• Interim contracting arrangements will be in use until mid 2009, when a new contract is planned to be in place to conduct Structural Refurbishment Program 1 Delta Production Installation.
In May 2008 an engineering study was completed that showed the fatigue life of the Centre Barrel could be extended beyond the current limits, resulting in a reduction in the number of aircraft requiring Centre Barrel Replacement (CBR). The DMO and Capability Development Group has re-scoped the project to reduce the number of CBR to 10, but also to introduce new structural refurbishment work to address several emerging ageing aircraft issues such as corrosion in undercarriages, wings and other structural locations.
A total of 10 CBR (including two prototypes) have been contracted to L–3 Communications MAS (Canada).
The first CBR prototype aircraft is complete and has returned to service. The second prototype is undergoing rebuild at BAE Systems Australia in Williamtown, NSW under sub-contract to L–3 Communications MAS (Canada). Production has commenced on a further six aircraft with the last two aircraft to be commenced in December 2008.
Structural Refurbishment Program 1 Delta Production Installation is continuing, with 16 aircraft completed to date and three more due by the end of 2008. A further 23 aircraft will undergo these modifications under the new contract in 2009-12.
ADF Air to Air Refuelling Capability—AIR 5402 Contractor:
• EADS CASA, Spain (Acquisition)
• Qantas Airways Ltd (Through–Life Support).
A significant shortfall in expenditure for 2007-08 was transferred to 2008-09 due to delays by EADS CASA for conversion and test planning milestones that were not completed until August 2008. This increase in 2008-09 expenditure has been offset by reprogramming to account for consequent slippage into 2009-10, resulting in only a small net increase to expenditure in 2008-09. The second phase of testing has commenced following installation of military systems and software.
Flight testing is expected to commence by end-2008 and continue to the third quarter of 2009. The six month slippage in schedule will not be recovered and delivery of the first aircraft is now expected in the fourth quarter of 2009. The second A330 aircraft arrived at Qantas Australian Conversion Centre in Brisbane in June 2008 and has commenced modifications.
Maritime Patrol and Resp onse Aircraft System—AIR 7000 Phase 2 Contractor: The Boeing Company (USA) through a cooperative arrangement with the USN.
152

Part Two – Defence Materiel Organisation
This project seeks to replace the AP-3C Orion with the P-8A Poseidon through a cooperative program with the USN. The P-8A Spiral 1 Cooperative Development program will enable the Commonwealth to participate with the USN in the development of the P-8A Poseidon weapon system, reducing the risks and costs for subsequent Commonwealth acquisition. Project activity during 2008-09 will focus on finalising the P-8A Spiral 1 Cooperative Development MoU, and commencing the development of the Production, Sustainment and Follow-on Development (PSFD) MoU for later acquisition. The cooperative development program will enable the Commonwealth to participate in the development of requirements for the Spiral 1 upgrade and to gain visibility of the baseline P-8A design and performance capabilities. The cooperative acquisition strategy with the USN aims to reduce the risk and cost of participating in the production, testing and through-life support of the P-8A weapon system.
Project activity during 2008-09 will focus on finalising the P-8A Spiral 1 Cooperative Development MoU, collaborating with the USN on the P-8A Spiral 1 Systems Design and Development activity, and commencing negotiations of the PSFD MoU.
Airborne Surveillance for Land Operations—JP 129 Phase 2 Contractor: Contractor not yet selected.
The DMO had contracted Boeing Australia Limited, with its principal subcontractor, Israel Aerospace Industries Limited, to provide and support a Tactical Unmanned Aerial Vehicle system. Boeing experienced difficulty delivering the full contracted capability to a schedule and at a risk acceptable to Defence, so the acquisition and in-service support contracts were terminated on 4 September 2008.
In accordance with the deed of settlement, all moneys due to the Commonwealth have been receipted.
Defence now intends to restart the project with an emphasis on fielded systems which can be delivered and deployed in minimum time.
C-17 Globemaster III—AIR 8000 Phase 3 Contractor: The Boeing Company (USA) under a FMS Arrangement with the US Government.
Initial training of Air Force personnel has been completed, with training of the complete squadron cadre of pilots, loadmasters and maintenance personnel continuing until December 2008 after which the Air Force will manage ongoing training requirements. Role expansion to include Air Drop and high-dependency patient Aero-Medical Evacuation is occurring progressively in 2008-09 as planned. This requires specialist equipment to be procured, personnel trained and airworthiness accreditation to be obtained.
Airborne Early Warning and Control Program
Airborne Early Warning and Control Aircraft—AIR 5077 Phase 3 Contractor: The Boeing Company (USA).
On 10 June 2008, Boeing advised a further schedule delay of approximately 10 months to the delivery of the first fully mission capable aircraft, due to continuing problems associated with sub–system integration and radar and electronic support measures maturity. Boeing now proposes delivery of the first aircraft in January 2010, a total delay of 38 months against the contract baseline.
In order to minimise the impact of this latest delay, Boeing has proposed to the Commonwealth that it would deliver two aircraft in July 2009 with sufficient capability to enable the ADF to commence training and bed–down its logistics support systems. Defence continues to review the underlying details of the proposed revised Boeing schedule but assesses that there is still residual technical and schedule risk to the delivery of the first two aircraft in July 2009.
153
Part Two – Defence Materiel Organisation
Defence is now planning to establish an initial operating capability by end of 2011 and final operating capability by end of 2012.
Because of the schedule delays, the first three aircraft are being used to finalise the Developmental Acceptance Testing phase. The remaining three aircraft are scheduled to complete their modification programs mid to late 2010.
The initial Airborne Early Warning and Control System (AEW&C) facility at RAAF Tindal is approximately 85 per cent complete and will now be finalised when work begins on the rest of the Tindal precinct. Construction of the main Tindal facilities was approved by Parliament in June 2008. The Operational Flight Trainer was delivered in June 2008, with final acceptance planned for March 2009.
Air Warfare Destroyer Program
Air Warfare Destroyer—Build—SEA 4000 Phase 3 Contractor: This Program is being delivered under an Alliance contract arrangement (the Alliance-Based Target Incentive Agreement, ABTIA) between ASC AWD Shipbuilder Pty Ltd, Raytheon Australia Pty Ltd and the Commonwealth (CoA) represented by the DMO.
In addition to the ABTIA, the CoA entered into a Platform System Design contract with Navantia S.A., the ship designer. Supply of the Aegis Combat System by the USN is via a FMS agreement.
A decision on whether to acquire a fourth AWD will be made in the context of the current Defence White Paper Force Structure Review.
Overall the project is on schedule and there have been no real cost increases to the project nor draw down of contingency. All major milestones have been achieved to date.
The AWD Alliance has released a range of Requests for Tenders (RFT) covering combat system equipment and hull block and module fabrication. The contract for the AWD Sonar System has been awarded to United Kingdom firm Ultra Electronics. Infrastructure work progressed on schedule at the South Australian State Government’s Common User Facility and ASC shipyard.
The major milestones to be achieved in the near future are the Preliminary Design Review in December 2008 and the selection of the Hull Block manufacturers in early 2009.
The readiness of shipyard infrastructure in Adelaide to support block fabrication in late 2009 is critical to the successful start of hull construction. Any delay in completing this infrastructure work is likely to affect the schedule for first ship delivery. All parties are working cooperatively to ensure the facilities are delivered on schedule. To date, construction of the Common User Facility and ASC shipyard is on schedule.
If information from equipment vendors is not available when required by the Platform System Designer (Navantia), there will be a delay in delivering production data packages to block fabricators. To mitigate this risk, the alliance has a two–pronged strategy; to work closely with vendors and the staged release of information to the Platform System Designer. The recent delivery of a major data drop to Navantia of Vendor Furnished Information (VFI) has considerably alleviated this risk.
154

Part Two – Defence Materiel Organisation
Bridging Air Combat Capability—Super Hornet
Bridging Air Combat Capability—AIR 5349 Phase 1 Contractor: The Boeing Company (USA) under a FMS arrangement with the US Government.
The Super Hornet program is on schedule for delivery of Australia’s first six aircraft in the second quarter of 2010. The aircraft and ancillary equipment are being purchased under FMS arrangements with the US Government. Aircraft production contract signature occurred in late July 2008 with savings of some USD $225m on original FMS estimates. Contracts have also been awarded for aircraft engines and a number of items of ancillary equipment.
Electronic Systems Division
New Air D efence Command and Control Systems—AIR 5333 Contractor: Boeing Australia Limited.
The contractor commenced installation work at RAAF Tindal and associated sites in May 2008. This has progressed well and is expected to be completed in early 2009. Completion of the project’s critical design review in July 2008 allowed the project to enter the integration and test phase, which will commence at RAAF Tindal in late 2008. Software development and provision of Government-furnished obligations continues in parallel with the testing activities during the 2008-09 period.
The Commonwealth and Boeing signed a Deed of Settlement, Release and Amendment on 17 October 2008 which settled the project’s long-running commercial issues.
Software development risk is being managed through the use of Commonwealth resident teams, and active monitoring of contractor performance through software development–related metrics.
Electronic Warfare Self Protection—AIR 5416 Phase 2 Contractor:
• BAE Systems – Phase 2A
• BAE Systems (formerly Tenix Defence) – Phase 2B.
Phase 2A – Modifications to the first Black Hawk commenced June 2008 and ground and flight testing is planned to commence early 2009. Chinook modification kits will be retained for installation once aircraft can be made available from operational commitments.
Phase 2B – All 12 C-130H aircraft have been modified with the last aircraft delivered to Air Force by BAE Systems in April 2008. This phase of the Echidna project is being prepared for closure.
The software development aspects of the Electronic Warfare Controller for Phase 2A are extremely complex. There is a medium risk that software developmental problems could affect the overall project delivery schedule although with solid progress shown by BAE Systems during 2008, this risk is diminishing.
Next Generation Satellite Program—JP 2008 Phase 4 Contractor: The Boeing Company (USA) via the US Government under a MoU.
The first satellite, Wideband Global Satellite (WGS) F1, with a footprint over the Pacific Ocean has been providing operational capability to Australia since June 2008. WGSF2 launch date has slipped three to four months and will now most likely occur in December 2008. There will be no financial impact in relation to expenditure on the contract as the Australian financial commitment relates to
155

Part Two – Defence Materiel Organisation
WGS satellite six (SV6). The project is progressing the interim anchoring solution to allow indigenous anchoring of WGS from the eastern and western seaboard.
High Frequency Modernisation—JP 2043 Phase 3A Contractor: Boeing Australia Ltd.
The first stage of the project has replaced the capability provided by the former Navy sites and Air Force stations. The second stage, to provide increased levels of automation, improved capability, enhanced security and survivability, reduced reliance on staff and to incorporate the new equipment into mobile platforms, is currently being implemented.
Due to difficulties with certain complex elements of design and integration and testing acceptance of the full final fixed network capability which was originally planned for 2008 may now be delayed until 2011. However, a recent independent technical review has confirmed the viability of the design and that there are no potential barriers to successful completion. A schedule review has also been conducted, to inform the way ahead and to enable revised delivery dates to be set. As the difficulties being experienced also affect the design of the mobile upgrade equipment, there is a flow on effect to completion of upgrades to mobile platforms.
Explosive Ordnance Division
Follow-on Stand-off Weapon—Air 5418 Phase 1 Contractor: An FMS case was established with the US Air Force in July 2006 to supply AGM-158 Joint Air-to-Surface Standoff Missiles (JASSM). A commercial contract was signed with Lockheed Martin Missiles and Fire Control in September 2006 for support to integration of JASSM with F/A-18A/B aircraft and supply of technical data and documentation for JASSM airworthiness certification and conduct of a maritime interdiction capability study.
A major risk was realised in mid 2008 when technical issues were encountered by the USN with the development of the F/A-18A/B operational flight program. Whilst the issues have been resolved, achievement of an IOC will be delayed by up to six months to June 2010. Flight testing of the new operational flight program continues. Data and hardware items acquired under FMS and the Lockheed Martin contract continued to be delivered on schedule. Lockheed Martin’s simulation studies to model missile performance in a maritime environment have progressed. During 2008–10 missile and aircraft integration testing will continue with testing being undertaken in Australia and the US, culminating in a live missile firing in Australia in early 2010.
Explosive Ordnance Reserve Stocks—JP 2085 Phase 1B Contractors: Multiple purchase contracts with Australian and overseas munitions suppliers.
The major focus for the remainder of 2008-09 will be on the establishment of arrangements for the Navy 5 inch projectile procurement and delivery to Army of Excalibur’s IOC by January 2009. The project expects to deliver Army with its Final Operational Capability for all medium artillery units by December 2009.
The major risk for this project continues to be related to the schedule and costs associated with acquisition and integration of 155mm Artillery Precision Guided Munition with the Australian M198 Gun System. Rigorous review of system specifications, and participation in or visibility of the US Government test program, combined with regular communication with the relevant overseas government agencies will provide higher quality indications of cost and schedule change.
156
Part Two – Defence Materiel Organisation
Mulwala Redevelopment Project—JP 2086 Phase 1 Contractor: Bovis Lend Lease.
Design and construction activities are currently running approximately three months behind schedule as a result of contractor delays in achieving necessary State Government planning approvals. The contractor is reviewing the design and construction schedules with the aim of recovering slippage through undertaking parallel work packages.
Practical completion of construction is scheduled for July 2010 and completion of qualification of propellants for use in ADF ammunition is scheduled for September 2011. Certification of ammunition using the qualified products is scheduled for March 2013.
Helicopter Systems Division
Armed Reconnaissance Helicopter—AIR 87 Phase 2 Contractor: Australia Aerospace.
As at 17 October 2008, the Commonwealth had accepted 12 Tiger Armed Reconnaissance Helicopters (ARH), the software support facility, the ground mission management system, facilities in Darwin, Northern Territory, and Oakey, Queensland, training courseware and four of the six ground training devices. The thirteenth ARH is in the process of being accepted.
Delivery of the remaining nine aircraft and the completion of delivery of all supplies is presently the subject of further detailed scheduling to enable Army to conduct operational test and evaluation in 2009–10. Australia has now trained a total of 17 ARH pilots. This includes Battle Captains, instructors and test pilots. A further three pilots and seven Battle captains are currently in training and should qualify by the end of November 2008. A group of seven Army combat aviators (experienced operational helicopter pilots) were trained during 2008 as the emphasis shifts from instructors towards operational crews for the 1st Aviation Regiment. ARH Tiger has now flown in excess of 3,000 hours, mainly in support of training in Australia. The Australian flight hours’ achievement is about 30 per cent of the international Tiger fleet that includes France, Germany and Spain.
Payments to Australian Aerospace have resumed although one-third was retained pending completion of the contract changes implementing the Deed of Agreement. These are expected to be signed during December 2008. The project has experienced a much improved rate of achievement since dispute resolution.
As part of the settlement, Australian Aerospace has provided two EC–135 helicopters in Darwin for ARH aircrew currency training at a rate of 1,600 hours per year. In addition, three ARH were relocated from Oakey in Queensland to Robertson Barracks in Darwin in late June 2008, to further achieve training objectives.
Mission equipment test and acceptance is progressing well. The final ARH Weapon Test Campaign was completed successfully by Air Operations Support Group in September 2008 and will result in a Hellfire Missile clearance and certification for the ARH.
Multi Role Helicopter—AIR 9000 Phase 2 Contractors: Australian Aerospace, CAE Australia.
The first four aircraft have been manufactured in France; the remaining 42 have commenced assembly at Australian Aerospace’s Brisbane facility.
The third MRH-90 arrived from France on 22 June 2008 and was accepted by the DMO on 7 August 2008. The fourth MRH-90 has completed a data collection task required for the design of the
157
Part Two – Defence Materiel Organisation
full flight and mission sim ulators being developed by CAE Australia and was delivered from France on 14 November 2008 by RAAF C-17. This aircraft is scheduled for acceptance on 5 December 2008. The first Australian assembled aircraft remains on schedule for acceptance on 17 December 2008.
Contracts are currently being awarded for the construction of facilities in Townsville, Oakey, Brisbane and Nowra. A RFT is being developed for the provision of Ground Training Devices.
Land Systems Division
Upgrade of M-113 Armoured Vehicles—LAND 106 Contractor: BAE Systems Australia (formerly Tenix Defence).
Production vehicles required to commence crew and maintenance training have now been delivered. Procurement of initial spares, special tools and test equipment to support the introduction of vehicles has commenced and will continue in parallel with vehicle production.
Results of the comprehensive development test program to date are positive; however, a medium technical risk will remain until all testing is complete in 2009. The contractor has advised that the delivery of the last vehicle will be as contracted in December 2010. To achieve this the contractor is preparing additional facilities in Williamstown, VIC and Wingfield, SA to convert vehicle hulls. The DMO assesses that this remains a high risk production schedule subject to how quickly the contractor can ramp up hull conversions at the alternative facilities.
Bushmaster Infantry Mobility Vehicle-Project Bushranger—LAND 116 Phase 3 Contractor: Thales Australia (formerly known as ADI Ltd).
The project is acquiring 737 vehicles in seven variants, an increase of 14 vehicles since the release of the Portfolio Budget Statements 2008-09.
One hundred and two Enhanced Land Force vehicles have been delivered with the remaining 42 to be delivered by March 2009. Successful negotiations with Thales have resulted in a contract amendment for the procurement of an additional 293 Bushmaster vehicles for the protected mobility medium requirement for Land 121 Overlander Phase 3. Delivery will commence in May 2009 and will be completed by June 2012. The through–life support contract will be amended to include the additional vehicles.
All weapon stations and Fire Suppression Systems have been delivered, with the delivery of spall curtains to commence in late 2008. The weapon stations have been fitted to deployed vehicles, with the Fire Suppression Systems and spall curtains to commence fitment to deployed vehicles in early 2009.
Maritime Systems Division
Guided Missile Frigate Upgrade Implementation—SEA 1390 Phase 2 Contractor: Thales Australia (formerly known as ADI Ltd).
HMAS Darwin was provisionally accepted by Navy in August 2008. The last of the upgrades in HMAS Newcastle is still on schedule for provisional acceptance in June 2009. HMA Ships Sydney, Melbourne and Darwin are operating under Navy control, progressing towards initial operational release in early 2009. Electronic Surveillance and Underwater Warfare Systems performance deficiencies continue to be addressed in HMAS Melbourne. HMA Ships Sydney and Darwin have been accepted from the contractor.
158
Part Two – Defence Materiel Organisation
Standard Missile Replacement—SEA 1390 Phase 4B Contractor: The DMO is the Procurement Coordinator, supported by the US Department of Defense under an FMS arrangement and commercial contracts. Original Equipment Manufacturers are engaged through commercial contracts to mitigate delivery risk of the Standard Missile (SM-2) capability.
An initial number of SM-2 tactical missiles and spare missile sections were received in Australia in September 2008.
Software development and integration under FMS arrangements has commenced with the Stage 1 Critical Design Review held in late August 2008. Integration testing of the various equipment and software items has commenced. These activities will culminate in integration of the Weapon Control System software which has commenced in the US. Continuing software development, integration and testing will follow with initial shipboard fielding in Australia in late 2009.
New Heavyweight Torpedo—SEA 1429 Phase 2 Contractor: US Department of Defense under a MoU with work performed by Raytheon and the US Naval Undersea Warfare Center.
HMAS Waller successfully undertook a live heavyweight torpedo firing at RIMPAC 2008 and sinking an ex-USN Destroyer, proving the integrated replacement combat system with the new heavyweight torpedo capability. Installation of heavyweight torpedo modifications in HMAS Farncomb are complete with the boat currently undertaking sea trials and expected to be operational in early 2009. Installations in HMA Ships Dechaineux and Sheean are progressing satisfactorily, however HMAS Dechaineux is now expected to complete her Full Cycle Docking in late 2009. Progressive shipments of torpedoes to Australia continue to meet RAN requirements. Additional estimated spend for 2008-09 allows for the purchase of an additional torpedo for trials purposes, which was originally scheduled for purchase in future years.
The installation schedule is synchronised with the submarine docking program and any change in that program is a medium risk to the project delivery schedule.
Collins Class Submarine Reliability & Sustainability—SEA 1439 Phase 3 Contractor: ASC Pty Ltd is the submarine builder and designer for through-life support activities, engaged under a through-life support agreement for up to 25 years, with work packages for all submarine-related projects and product contracted annually.
The project scope is comprised of several sub-projects which separately address a number of submarine reliability and sustainability conditions. The documentation and delivery of each subproject is subject firstly to the availability of funding and contractor resources, and then the timing of submarine maintenance periods. Overall, this project competes for funding and platform availability as a lower priority than two other submarine-related projects SEA1439 Phase 4A and SEA1429 Phase2.
As a result, the achievement of the budget for 2008-09 is dependent on the opportunities for contracted resources and maintenance periods against the other projects’ competing priorities.
A number of sub-projects’ modifications were progressed successfully to schedule. The expenditure underachievement for 2008-09 reflects specialist design and production work not performed on this project.
Limited contractor specialist design and production capacity continues as a medium risk. Contracting work packages on an annual basis under the through-life support agreement is a medium risk to controlling costs within the capped project budget.
159

Part Two – Defence Materiel Organisation
Amphibious Ships
Amphibious Deployment and Sustainment—JP 2048 Phase 4A/B Contractor: BAE Systems Australia (formerly Tenix Defence).
Steel was cut for the first ship on 23 September 2008. Ship 01 (HMAS Canberra) is due for acceptance in January 2014 and Ship 02 (HMAS Adelaide) in August 2015.
The main risk of technical regulatory acceptance is assessed as high and is being mitigated through early implementation of rigorous oversight of technical and engineering issues. Significant risks of authorisation of contract variations and Intellectual Property controls through the sale of the prime contractor organisation are being mitigated by rigorous project management.
New Air Combat Capability
Detailed Analysis and Acquisition Planning—AIR 6000 Phase 1B Contractor: Lockheed Martin Aeronautics is contracted to the US Government for the F-35 Lightning II Joint Strike Fighter (JSF) System Development and Demonstration (SDD) and the JSF PSFD phases of the JSF program. Lockheed Martin is teamed with Northrop Grumman and BAE Systems for the JSF air vehicle. Pratt and Whitney and the General Electric/Rolls Royce Fighter Engine Team are the primes for the two engines being developed for the F-35.
Defence analysis is focussed on the F-35 Block 3 Conventional Take Off & Landing (CTOL) variant. The ongoing analysis indicates that the CTOL F-35, if it matures as planned, and when integrated into the networked ADF, will meet the ADF's future air combat needs.
Key decisions on the scope and timing of the project are expected to be made in the context of the new Defence White Paper, Force Structure Review and subsequent Defence Capability Plan. On current planning, Second Pass is planned for June 2009.
160

Project number
Financial year(s)
reported in Top 30
Approvedproject
expenditure$m
Cumulative expenditure to
30 June 2008 $m
Budget estimate 2008-09
$m
Revised Estimate 2008-09
$m Variation
$m Status Report Aerospace Systems
Hornet Upgrade Project – Target Designation System
AIR 5376 Phase 2.4
2006-07 152 86 15 20 5 Initial Operational Capability achieved in June
2007. The project is on schedule and Final Operational Capability is expected by December 2009.
P–3C Update Implementation
AIR 5276 Phase 2
2004-05 2007-08 908 864 12 8 -4
Both acoustics and avionics processors continue to be delivered on schedule. Radar: a senior level Project
Management Review was conducted in October 2008 to address on going schedule delays, reporting and other project management issues. Outcomes included visibility to senior Elta management of project position, Elta delivering a revised schedule in November 2008 for comment and a status report.
F/A–18 Hornet Structural Refurbishment Program
AIR 5376 Phase 3.1
2004-05 127 100 6 3 -3 Work program on schedule and within budget.
Strategic Air Lift Capability AIR 5216 Phase 1
2005-06 1,047 1,021 3 1 -2 Remaining project activity relates to deliveries of some components of outstanding spares procurement.
Amphibious Vessels
Maritime Operations Support Capability
SEA 1654 Phase 2A
2005-06 2006-07 145 129 5 5 - Project schedule is continuing on track and spend is
estimated as programmed.
Electronic Systems
MILSATCOM Terrestrial Infrastructure
JP 2008 Phase 3E
2004-05 2005-06 2007-08
210 187 11 14 3 The project has commenced the systems integration phase,
with the Theatre broadcast software roll-out currently underway. The project remains on schedule for delivery in
December 2009.
Current Status of Acquisition Projects not included in the Top 30 Table 2.5.2 provides an update on the status of major projects reported in the last five financial years. These projects dropped below the Top 30 expenditure thresholds at the time of producing the Portfolio Budget Statements 2008-09.
Table 2.5.2—Status of previously reported Top 30 projects

Project number
Financial year(s)
reported in Top 30
Approvedproject
expenditure$m
Cumulative expenditure to
30 June 2008 $m
Budget estimate 2008-09
$m
Revised Estimate 2008-09
$m Variation
$m Status Report
Jindalee Radar Network JP 2025 Phase 3 & 4
2004-05 2005-06 2006-07
1,248 1,226 6 2 -4
A 46-month maintenance and support contract expired on 16 February 2007. Subsequent maintenance contracts are managed from Sustainment (Output 1.2). The residual activities on this project relate to the finalisation of the capability’s support environment. Integration of grid power into the radar sites at Longreach has not proven cost effective and so will not be pursued. The project will now investigate the possibility of utilising alternative power generation technology.
Explosive Ordnance
Air to Air Weapons Capability
AIR 5400 Phase 1/2
2004-05 317 286 - 1 1 Capability is in service. Project closure action has been delayed until early 2009 pending clarification of guidance transfer approval and project closure processes.
Air to Surface Stand-Off Weapon Capability
AIR 5398 Phase 1
2004-05 449 399 - - -Capability is in service. Project closure action has been delayed until early 2009 pending clarification of guidance transfer approval and project closure processes.
Air to Air Weapons Follow-On Buy
AIR 5400 Phase 3
2004-05 184 143 - - -Capability is in service. Project closure action has been delayed until early 2009 pending clarification of guidance transfer approval and project closure processes.
Lightweight Torpedo Replacement
JP 2070 Phase 2
2004-05 2005-06 2006-07 2007-08
347 195 17 19 2
The first successful MU90 Torpedo exercise firing in Australia was achieved in June 2008 and the Torpedo Maintenance and Integration Facility at HMAS Stirling was opened in July 2008. Surface integration is tracking well. Air Integration has been put on hold pending the outcomes of the White Paper.
Evolved SeaSparrow Missile
SEA 1428 Phase 2B/3
2004-05 279 245 6 8 2 The capability is in service and deployed. Deliveries of some support items, spares and remediation work on the test station remain outstanding.

Project number
Financial year(s)
reported in Top 30
Approvedproject
expenditure$m
Cumulative expenditure to
30 June 2008 $m
Budget estimate 2008-09
$m
Revised Estimate 2008-09
$m Variation
$m Status Report Helicopter Systems
Anzac Ship Helicopter SEA 1411 Phase 1
2004-05 2005-06 2006-07
1,114 953 13 2 -11
On 5 March 2008, the Minister for Defence announced the Government’s intention to cancel the Seasprite program and enter into negotiations with Kaman Aerospace Corporation to terminate the contract. On 20 March 2008, the Australian Government and the Contractor reached mutual agreement to cancel the project subject to US Government approval. One element of the agreement is that at least 50 per cent of the proceeds will be provided to the Commonwealth. The first stage of a two-part US Government approval
was obtained on 8 August 2008, granting authority to transfer the Seasprite aircraft and equipment to the US under Kaman control. The aircraft and equipment were shipped from Australia late October/early November 2008, and the title transfer to Kaman is expected to be progressed after their arrival in the US.
Land Systems
Direct Fire Guided Weapon
Ground Surveillance Radar
Australian Light Armoured vehicles
LAND 40 Phase 1
LAND 53 Phase 1E
LAND 112 Phase 3
2004-05
2004-05
2005-06
147
81
690
123
81
588
17
-
2
4
-
2
-13
-
Full Operational Capability was achieved in March 2008, and the Javelin weapon system is currently transitioning into service.
Project has been completed and closed.
-
All prime equipment has been delivered. ASLAV Surveillance prototype is undergoing test and evaluation. Crew Procedural
Trainer has been introduced into service and a Through Life Support contract is being established. Extensions to ASLAV
hangers and support facilities are being planned by Infrastructure Division.

Project number
Financial year(s)
reported in Top 30
2005-06
Approvedproject
expenditure$m
93
Cumulative expenditure to
30 June 2008 $m
56
Budget estimate 2008-09
$m
Revised Estimate 2008-09
$m
6
Variation $m
-
Status Report
Bulk Liquid Tankers ($2.626m) – project has been completed and closed. Heavy Recovery Vehicle ($33.525m) – project has been completed and closed. Mack Noise Reduction ($14.000m) – in contract. Passenger/Cargo Restraint & Separation – Unimog and Mack Gun Tractors ($11.427m)– in contract – due for completion and closure in 2009. Passenger/Cargo Restraint & Separation – Land Rover ($11.000m). Regional Force Surveillance Vehicle – in contract. Land Rover Handling Upgrade – project has been completed and closed.
General Service Field Vehicles – Overlander
LAND 121 Phase 2 6
Tank Replacement Project LAND 907 Phase 1
2005-06 2006-07 2007-08
575 425 9 5 -4
Project is on schedule and within budget. All major capability platforms have been delivered and are in service. Current focus is to establish a Through Life Support contract, Leopard Tank disposal and the acquisition of Tank Urban Survivability kits.
Maritime Systems
Anzac Ship Anti-Ship Missile Defence
SEA 1448 Phase 2B
2007-08 453 75 22 57 35
Under the revised acquisition strategy, industry contract negotiations are progressing, and the phased array radar demonstrations were successful in November 2008. Production of the prototype phased array radar mast continues on schedule.
Anzac Ship Project SEA 1348 Phase 2
2004-05 2005-06 2006-07 2007-08
5,379 5,343 19 4 -15 The last ship was delivered in June 2006. Contractor warranty works are progressing as well as essential standardisation upgrades to ships.
Collins Replacement Combat System
SEA 1439 Phase 4A
2004-05 2005-06 2006-07 2007-08
457 390 19 19 -Installations in HMA submarines Dechaineux and Sheean are progressing satisfactorily, and the system has been proven in HMAS Waller.
Anzac Ship Anti-Ship Missile Defence
SEA 1448 Phase 2A
2004-05 2005-06 2006-07 2007-08
375 146 21 23 2 Production and integration successes with infra-red search and track and upgraded combat management system hardware and software continue. Delivery of all hardware and software continues to meet capability on schedule.

Project number
Financial year(s)
reported in Top 30
Approvedproject
expenditure$m
Cumulative expenditure to
30 June 2008 $m
Budget estimate 2008-09
$m
Revised Estimate 2008-09
$m Variation
$m Status Report
Armidale-class Patrol Boat SEA 1444 Phase 1
2004-05 2005-06 2006-07 2007-08
534 461 15 16 1 Navy’s operational release is planned for early 2009. All patrol boats are engaged in operations.
Ships Self Defence Capability – RAPID Acquisition
SEA 1779 Phase 1
2007-08 54 24 16 17 1 Installation in all ships (Manoora, Kanimbla and Tobruk) is 97 per cent complete.
Underwater and Surface Warfighting Upgrade Program
SEA 1348 Phase 3
2004-05 161 132 5 6 1 Harpoon systems installation will continue in 2008-09 along with associated activities and tasks in support of the Harpoon systems.

Part Two – Defence Materiel Organisation
Minor Capital Investment Programs Minor capital projects deliver capability to meet emerging enhancement, replacement or new requirements of relatively low values and are funded from allocations outside the Defence Capability Plan. There are five Defence Minor Capital Investment Programs, funded by the Capability Managers through Materiel Acquisition Agreements as described in Chapter Two. There are currently over 180 minor projects with an average value of $7.0m.
OUTPUT 1.2-MANAGEMENT OF CAPABILITY SUSTAINMENT
Sustainment involves the provision of in-service support for specialist military equipment, including platforms, fleets and systems, operated by Defence. Typical services include repair and maintenance, engineering, supply, configuration management and disposal action. The level of the DMO’s service provision is linked to the level of capability preparedness directed by the CDF, which, in turn, is determined by the Government’s funded requirements for the level of Defence capability.
The DMO's sustainment services to Defence, and the price the DMO receives for these services, are formalised in Materiel Sustainment Agreements between the DMO and Defence Capability Managers.
The revised planned resource use for Output 1.2 is $5,117.3m in 2008-09, an increase of $250.7m from the 2008-09 budget estimate. Planned resources include $46.027m of expected net personnel and operating costs being triggered and subsequently approved by Defence during 2008-09.
Table 2.5.3 lists the Top 20 Sustainment products ranked by forecast expenditure in 2008–09. The key activities associated with the key deliverables under each Materiel Sustainment Agreement are addressed in the product descriptions. There are currently seven Materiel Sustainment Agreements under management in Output 1.2 incorporating 99 sustainment schedules.
166

Table 2.5.3—Top 20 sustainment products by forecast expenditure in 2008-09 Budget Estimate
2008-09 $m
Revised Estimate 2008-09
$m Variation
$m Explanation of Variation[1]
Aerospace Systems Division
P-3C/AP-3C Orion Weapons System 135 137 2 Variation attributable to Global Update offset by reduced operational supplementation funding.
F/A-18 Hornet Weapons System 133 130 -3 The revised estimate reflects a combination of cost savings, Global Update and a reduced Net Personnel Operating Cost allocation.
C-130J-30 Weapons System 127 136 9 Variation attributable to Global Update and minor variations.
F-111 Weapons System 120 120 - -
Lead-In Fighter Hawk 127 Weapons System 88 88 - -
C-17 Globemaster III 86 94 8 Variation attributable to Global Update.
C-130H Weapons System 68 61 -7 Revised application of operational supplementation funding.
Electronic Systems Division
Wide Area Surveillance Capability 76 75 -1 Minor change following a Branch review, and also includes a change in the attribution of the DMO’s indirect costs.
Battlespace Communications Systems 70 105 35 The estimate represents additional operations funding provided by Defence. However the likelihood is that these funds will be returned to Defence this financial year.
Explosive Ordnance Division
Explosive Ordnance – Air Force, Navy, Army 373 453 80 Variation is attributable to new capability recently introduced into service, realignment of budget, Explosive Ordnance reforms and price variation.
Helicopter Systems Division
Multi Role Helicopter MRH90 87[2] 95 8 Variation attributable to Global Update. It is expected that the actual achievement will be less than this when adjusted for the MRH90 flying rate
that has been below the planned rate.
Black Hawk S70A-9 Weapons System 73 73 0 -
Land Systems Division
B Vehicles 117 126 9 Variation is the result of Army's reprioritisation of funding for additional sustainment activities for B Vehicles.
Commercial Vehicle Fleet 94 82 -12 Variation is the result of one off savings identified by the Commercial Vehicle program in 2008-09.

Budget Estimate2008-09
$m
Revised Estimate 2008-09
$m Variation
$m Explanation of Variation[1]
ADF Clothing and Equipment 76 94 18 Variation is the result of Army's reprioritisation of funding for additional sustainment activities for clothing and support to operations.
Maritime Systems Division
Fuels and Lubricants – Navy, Army, Air Force 442 428 -14 The decrease is the result of the contribution to the efficiency dividend and price indexation adjustments.
Collins class submarines 296 304 8 Variation attributable to Global Update and rollover of funds for work not finalised in 2007-08, offset by a contribution to the efficiency dividend.
Anzac class frigate 255 270 15 The increase is the result of the rollover of funds for inventory not delivered in 2007-08.
Adelaide class frigate 112 113 1 Inclusion of Operations funding offset by a contribution to the efficiency dividend.
Mine Hunter Coastal 61 58 -3 The decrease is the result of the contribution to the efficiency dividend.
Subtotal Top 20 Sustainment Products 2,889 3,042 153 Notes 1. The revised estimate 2008-09 will include economic parameter adjustments for price update and foreign exchange calculation, referred to in explanations as the Global Update. 2. This was erroneously reported in the Portfolio Budget Statements 2008-09 p191 as $127m.

Part Two – Defence Materiel Organisation
UPDATED INFORMATION ON DMO SUSTAINMENT PRODUCTS
Aerospace Systems Division Information remains as reported in the Defence Portfolio Budget Statements 2008-09, except for the following:
Aerospace Systems Products
P-3C/AP-3C Orion Weapons System Some AP-3C Orion aircraft recently reached their structural safe design life, and as a result a Safety-By-Inspection regime of targeted additional structural inspections is being undertaken.
F/A-18 Hornet Weapons System A new contracting strategy has been developed to provide through-life support for deeper maintenance and modifications to the Hornet. Contracts are expected to be in place by December 2008. The scope of work reflects a decrease in workload associated with completion of the AIR5376 Phase 2.2 modification program in December 2008, and the reduction in scope of AIR5376 Phase 3.2 from 49 CBR to 10 as a result of fatigue life extensions supported by Defence Science and Technology Organisation testing.
Electronic Systems Division Information remains as reported in the Defence Portfolio Budget Statements 2008-09, except for the following:
A new contract for the operation, maintenance and support of the Harold E Holt facility at Exmouth, WA, is being developed for release to tender in 2009. Approval to close the Navy Transmission Station Darriman in Sale, Vic, is expected from Navy within the next 12 months.
The major new Air Traffic Control Radar and Air Defence Radar systems are expected to transition to sustainment in mid-2009. The in-service support arrangements for the recently delivered Australian Defence Air Traffic System, including radar mechanical maintenance, have commenced and are working well.
One of the four new systems is deployed to the Middle East Area of Operations in support of Operation Slipper. Major upgrades to the interim Regional Operations Centre software are continuing on a six-monthly cycle.
Efficiency measures across all products managed by the Division continue to be identified and implemented: Two recent radio purchases under sustainment support to operations, achieved 10 per cent and 30 per cent savings respectively. By altering the maintenance concept on Satellite ground equipment approaching life-of-type from “preventive” to “on-condition”, savings of 50 per cent over the original contract have been achieved.
Electronic Systems Products
Battlespace Communications Systems A new contract to improve the in-service support of the ADF's Battlespace trunk communications suite is in place with BAE Systems Australia. BAE Systems has successfully ramped-up to meet commencement of operation in October 2008.
Availability of sufficient contracting resources to effect new contracts or contract changes is a risk to achieving sustainment savings efficiencies in a timely manner.
169

Part Two – Defence Materiel Organisation
Explosive Ordnance Division Information remains as reported in the Defence Portfolio Budget Statements 2008-09, except for the following:
Explosive Ordnance Product
Explosive Ordnance-Navy, Army, Air Force The ability to provide munitions products in the required quantities to Navy, Army and Air Force continues to be impacted by high global demand. Price increases due to this high demand are being encountered. In an effort to reduce the supply chain risks associated with high consumption and critical items, opportunities for greater indigenous manufacturing are being actively explored. Price increases will place pressures on the sustainment budgets of Navy, Army, and Air Force from 2009-10.
Helicopter Systems Division Information remains as reported in the Defence Portfolio Budget Statements 2008-09, except for the following:
Helicopter System Products
Multi Role Helicopter MRH90 Three MRH90 helicopters have been accepted into service, and over the course of 2008-09 a further five helicopters will be delivered.
The planned rate of effort for the year was 600 hours, however this will not be met due to issues with the initial supply of spares for the aircraft. The rate of effort will progressively build to the mature state of 10,300 hours per year by 2014-15.
Land Systems Division Information remains as reported in the Defence Portfolio Budget Statements 2008-09, except for the following:
In 2007-08 Land Systems Division completed 32 rapid acquisition projects at a total cost of $49.282m. In 2008-09, the division is progressing 14 rapid acquisition projects with an approved budget of approximately $93.973m. These will be delivered during 2008-09.
Land Systems Products
ADF Clothing The ADF Clothing and Personal Equipment Procurement Plan for the period 2009-2013 released in October 2008, advises industry on the tendering activities that will establish standing offer agreements for the acquisition of combat and non-combat clothing.
Maritime Systems Division Information remains as reported in the Defence Portfolio Budget Statements 2008-09, except for the following:
An additional challenge for sustainment during 2008-09 is managing the budgetary impact of the volatile price of oil, and the large reduction in the exchange rate, on the procurement of fuel.
OUTPUT 1.3—PROVISION OF POLICY ADVICE AND MANAGEMENT SERVICES
The DMO’s direct appropriation for Output 1.3 of $94.960m has not changed since the 2008-09 budget.
170

Part Two – Defence Materiel Organisation
The revised price for Output 1.3 is $103.015m in 2008-09, an increase of $0.211m from the 2008-09 budget estimate.
171


SECTION THREE
DEFENCE MATERIEL ORGANISATION EXPLANATORY TABLES AND FINANCIAL
STATEMENTS

CHAPTER SIX — EXPLANATORY TABLES
EXPLANATORY TABLES
ESTIMATES OF VARIATIONS TO AVERAGE STAFFING LEVEL

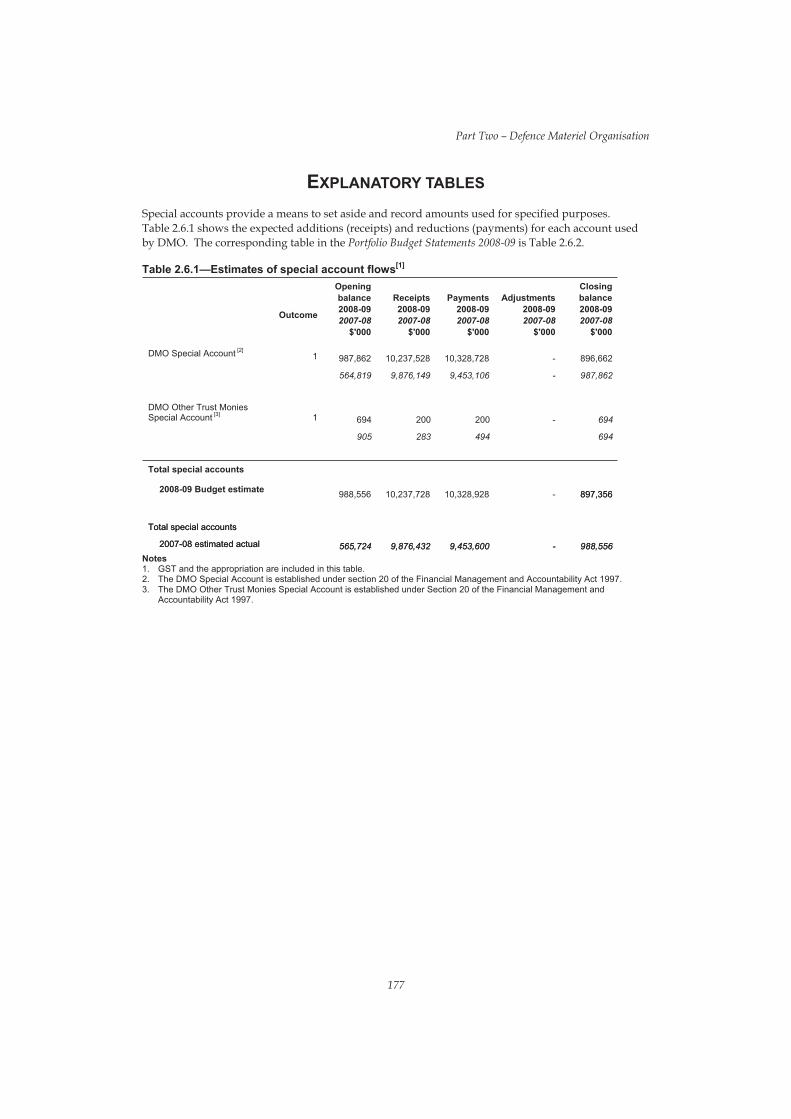
Part Two – Defence Materiel Organisation
EXPLANATORY TABLES
Special accounts provide a means to set aside and record amounts used for specified purposes. Table 2.6.1 shows the expected additions (receipts) and reductions (payments) for each account used by DMO. The corresponding table in the Portfolio Budget Statements 2008-09 is Table 2.6.2.
[1] Table 2.6.1—Estimates of special account flowsOpening Closing balance Receipts Payments Adjustments balance
Outcome 2008-09 2007-08
2008-09 2007-08
2008-09 2007-08
2008-09 2007-08
2008-09 2007-08
$'000 $'000 $'000 $'000 $'000
DMO Special Account [2] 1 987,862 10,237,528 10,328,728 - 896,662
564,819 9,876,149 9,453,106 - 987,862
DMO Other Trust Monies Special Account [3] 1 694 200 200 - 694
905 283 494 694
Total special accounts
2008-09 Budget estimate 988,556 10,237,728 10,328,928 - 897,356 897,356
Total special accounts Total special accounts
2007-08 estimat2007-08 estimated actual ed actual 565,724 565,724 9,876,432 9,876,432 9,453,600 9,453,600 -- 988,556 988,556 Notes 1. GST and the appropriation are included in this table. 2. The DMO Special Account is established under section 20 of the Financial Management and Accountability Act 1997. 3. The DMO Other Trust Monies Special Account is established under Section 20 of the Financial Management and
Accountability Act 1997.
177

Part Two – Defence Materiel Organisation
ESTIMATES OF VARIATIONS TO AVERAGE STAFFING LEVEL
Changes in Average Staff Level (ASL) are presented in the Portfolio Additional Estimates Statements at the whole of agency level to demonstrate any movements since Budget. The ASL figures for Budget were reported in agency Portfolio Budget Statements 2008-09 in the Outcome Resourcing Table 2.5.2.
Table 2.6.2—Average Staffing Level (ASL)[1]
2008-09 Budget
2008-09 Revised Variation
Outcome 1
Defence capabilities are supported through efficient and effective acquisition and through-life support of materiel
5,375 5,390 15 Total 5,375 5,390 15
Note: 1. Average staffing levels do not include military staff posted to the DMO, as military staff remain employees of Defence
and are included in its staffing numbers. The average staffing levels for military staff posted to the DMO is provided in Chapter 4.
178

CHAPTER SEVEN — BUDGETED FINANCIAL STATEMENTS
ANALYSIS OF BUDGETED FINANCIAL STATEMENTS
NOTES TO THE BUDGETED FINANCIAL STATEMENTS


Part Two – Defence Materiel Organisation
ANALYSIS OF BUDGETED FINANCIAL STATEMENTS
Revisions to the budgeted departmental financial statements for the DMO since the Portfolio Budget Statements 2008-09 are presented in this section.
Budgeted income statement An increase in the DMO’s estimated income and expenditure for 2008-09 ($96.7m) is largely a result of the movements as detailed below:
• supplementation due to foreign exchange rates ($531.9m)
• the reprogramming of major capital projects cash flow to future years (-$514.0m)
• increase in sustainment funding ($145.8m)
• decreases predominantly in approved major capital investment, unapproved major capital investment and minor capital investment (-$67.0m).
Budgeted departmental balance sheet The balance sheet has been updated to reflect the 2007-08 audited financial statements and adjustments to the budgeted income statement described above.
Statement of cash flows The estimated cash flows have been updated to reflect the changes in the income statement and balance sheet as noted above and in particular:
• increase in goods and services ($38.0m) reflecting the reprogramming of major capital cash flow, foreign exchange and sustainment increases
• inclusion of an estimate ($20.0m) of interest from overseas bank accounts which is returned to the OPA when receipted
• changes to foreign government activities and GST receipts ($64.0m).
181
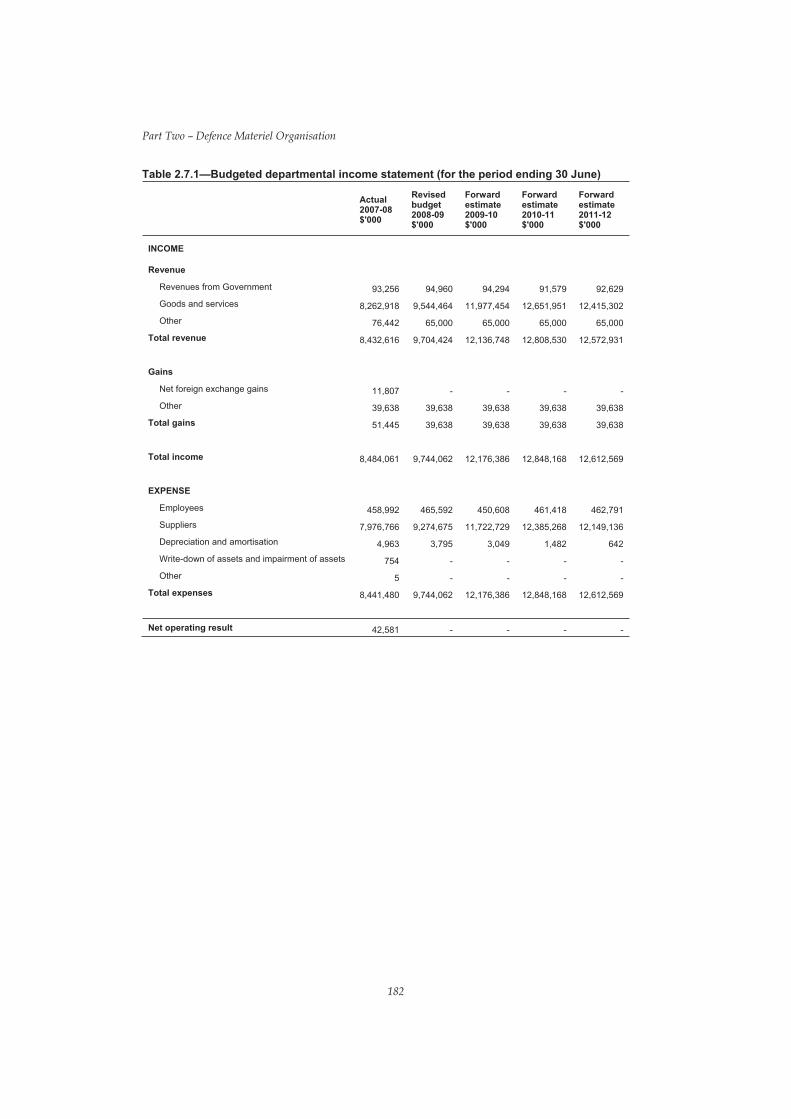
Part Two – Defence Materiel Organisation
Table 2.7.1—Budgeted departmental income statement (for the period ending 30 June)
Actual 2007-08 $'000
Revised budget 2008-09 $'000
Forward estimate 2009-10 $'000
Forward estimate 2010-11 $'000
Forward estimate 2011-12 $'000
INCOME
Revenue
Revenues from Government 93,256 94,960 94,294 91,579 92,629 Goods and services 8,262,918 9,544,464 11,977,454 12,651,951 12,415,302 Other 76,442 65,000 65,000 65,000 65,000
Total revenue 8,432,616 9,704,424 12,136,748 12,808,530 12,572,931
Gains
Net foreign exchange gains 11,807 - - - -Other 39,638 39,638 39,638 39,638 39,638
Total gains 51,445 39,638 39,638 39,638 39,638
Total income 8,484,061 9,744,062 12,176,386 12,848,168 12,612,569
EXPENSE
Employees 458,992 465,592 450,608 461,418 462,791 Suppliers 7,976,766 9,274,675 11,722,729 12,385,268 12,149,136 Depreciation and amortisation 4,963 3,795 3,049 1,482 642 Write-down of assets and impairment of assets 754 - - - -Other 5 - - - -
Total expenses 8,441,480 9,744,062 12,176,386 12,848,168 12,612,569
Net operating result 42,581 - - - -
182
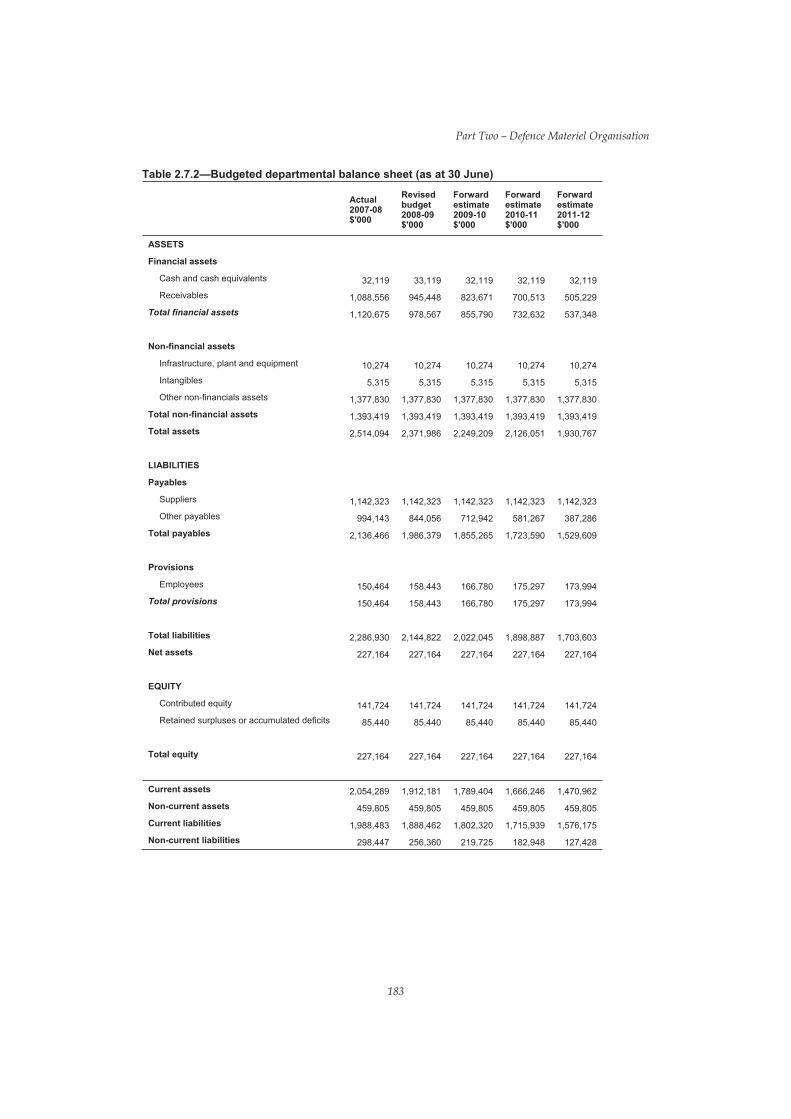
Part Two – Defence Materiel Organisation
Table 2.7.2—Budgeted departmental balance sheet (as at 30 June)
Actual 2007-08 $'000
Revised budget 2008-09 $'000
Forward estimate 2009-10 $'000
Forward estimate 2010-11 $'000
Forward estimate 2011-12 $'000
ASSETS
Financial assets
Cash and cash equivalents 32,119 33,119 32,119 32,119 32,119 Receivables 1,088,556 945,448 823,671 700,513 505,229
Total financial assets 1,120,675 978,567 855,790 732,632 537,348
Non-financial assets
Infrastructure, plant and equipment 10,274 10,274 10,274 10,274 10,274 Intangibles 5,315 5,315 5,315 5,315 5,315 Other non-financials assets 1,377,830 1,377,830 1,377,830 1,377,830 1,377,830
Total non-financial assets 1,393,419 1,393,419 1,393,419 1,393,419 1,393,419 Total assets 2,514,094 2,371,986 2,249,209 2,126,051 1,930,767
LIABILITIES
Payables
Suppliers 1,142,323 1,142,323 1,142,323 1,142,323 1,142,323 Other payables 994,143 844,056 712,942 581,267 387,286
Total payables 2,136,466 1,986,379 1,855,265 1,723,590 1,529,609
Provisions
Employees 150,464 158,443 166,780 175,297 173,994 Total provisions 150,464 158,443 166,780 175,297 173,994
Total liabilities 2,286,930 2,144,822 2,022,045 1,898,887 1,703,603 Net assets 227,164 227,164 227,164 227,164 227,164
EQUITY
Contributed equity 141,724 141,724 141,724 141,724 141,724 Retained surpluses or accumulated deficits 85,440 85,440 85,440 85,440 85,440
Total equity 227,164 227,164 227,164 227,164 227,164
Current assets 2,054,289 1,912,181 1,789,404 1,666,246 1,470,962 Non-current assets 459,805 459,805 459,805 459,805 459,805 Current liabilities 1,988,483 1,888,462 1,802,320 1,715,939 1,576,175 Non-current liabilities 298,447 256,360 219,725 182,948 127,428
183

Table 2.7.3—Budgeted departmental statement of cash flows (for the period ended 30 June)
OPERATING ACTIVITIES
Cash received
Goods and services
Appropriations 52,000 9
20,000
4,960
11,968,117
94,294
12,643,434 12,416,605
91,579 Interest
Net GST received 479,504 800,663 845
20,000
,863
20,000
Other cash received
Total cash received 8,803,882 10,3
85,000
49,728 12,948,074 13,665,876 13,424,120
Cash used
Employees 446,966 442,271 452,901 Suppliers
Net GST paid 533,857 632,283 800,663 845,863 829,886 Other cash used
Total cash used 8,789,356 10,344,933 12,946,025 13,664,394 Net cash from or (used by) operating activities
Actual 2007-08 $'000
8,207,991 9,466,577
18,591
45,796
7,789,942
18,591
14,526
Revised budget 2008-09 $'000
683,191
9,2
457,613
35,037
20,000
4,795
Forward estimate 2009-10 $'000
20,000
65,000
11,683,091
20,000
2,049
Forward estimate 2010-11 $'000
65,000
12,345,630
20,000
1,482
13,423,478
Forward estimate 2011-12$'000
92,629
829,886
65,000
12,1
464,094
09,498
20,000
642
INVESTING ACTIVITIES
Cash used
Purchase of property, plant and equipment
Total cash used
Net cash from or (used by) investing activities
Net increase or (decrease) in cash held
Cash at the beginning of the reporting period
4,374
4,374
-4,374
10,152
21,967
3,795
3,795
-3,795
1,000
32,119
3,049
3,049
-3,049
-1,000
33,119
1,482
1,482
-1,482
-
32,119
642
642
-642
32,119
Cash at the end of the reporting period 32,119 33,119 32,119 32,119 32,119
Part Two – Defence Materiel Organisation
184
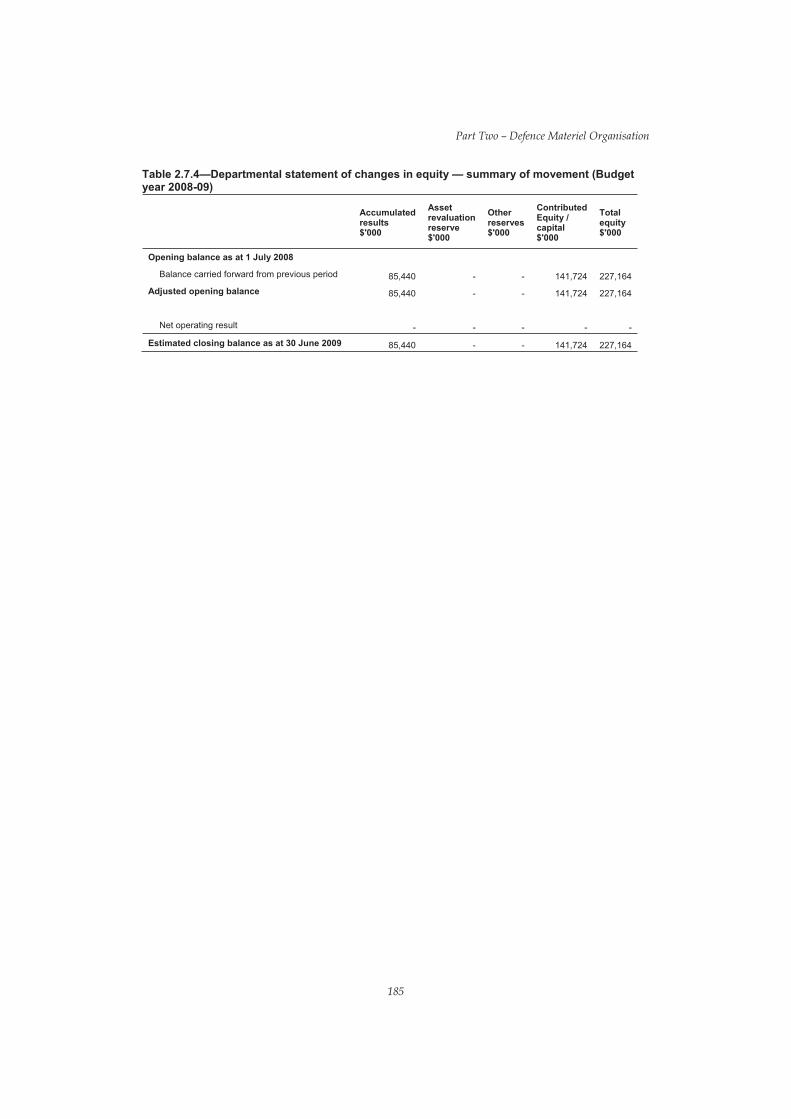
Table 2.7.4—Departmental statement of changes in equity — summary of movement (Budget year 2008-09)
Accumulated results $'000
Asset revaluation
reserve $'000
Other reserves $'000
Contributed Equity /
capital$'000
Total equity
$'000
Opening balance as at 1 July 2008
Balance carried forward from previous period
Adjusted opening balance 85,440
85,440
-
-
-
-
141,724
141,724
227,164
227,164
Net operating result
Estimated closing balance as at 30 June 2009
-
85,440
-
-
-
-
-
141,724
-
227,164
Part Two – Defence Materiel Organisation
185

Part Two – Defence Materiel Organisation
NOTES TO THE BUDGETED FINANCIAL STATEMENTS
The notes to the Budgeted Financial Statements remain as reported in the Portfolio Budget Statements 2008-09.
186
PART THREE
DEFENCE HOUSING AUSTRALIA

Part Three – Defence Housing Australia
OVERVIEW
The overview, including outcome and output information, remains as reported in the Portfolio Budget Statements 2008-09.
BUDGETED FINANCIAL STATEMENTS
The following budgeted financial statements for DHA are presented in this section.
Budgeted Income Statement This statement provides the expected financial results for DHA by identifying full accrual expenses and revenue s.
Budgeted Balance Sheet Shows the financial position of DHA. It enables decision makers to track the management of DHA’s assets and liabilities.
Statement of Cash Flows Budgeted cash flows, as reflected in the statement of cash flows, provide information on the extent and nature of cash flows by categorising them into expected cash flows from operating activities, investment activities and financing activities.
Capital Budget Statement Shows all proposed capital expenditure funded from internal sources, including borrowings. Capital outlays on sale and leaseback stock is shown in Operating Activities in the Statement of Cash Flows.
Non-Financial Assets – Summary of Movement This statement shows only the budget year 2008-09.
188

Table 3.1.1—Budgeted Income Statement Projected
Results Forward Estimate
Revised Estimate
Forward Estimate
Forward Estimate
Forward Estimate
2007-08 2008-09 2008-09 2009-10 2010-11 2011-12 $’000 $’000 $’000 $’000 $’000 $’000
REVENUE Revenue from ordinary activities Goods and services 783,112 835,869 776,946 852,252 845,125 840,498 Interest 7,053 2,661 4,838 7,263 7,880 10,888 Net gain from sale of assets 487 581 115 74 93 101
Fair Value Gains- Investment Property Revenues from ordinary activities EXPENSE
42,415 40,870 40,870 44,415 43,565 44,113 833,067 879,981 822,769 904,004 896,663 895,600
Employees 53,808 55,960 54,280 57,003 59,285 62,384 Suppliers 654,403 702,817 634,349 698,111 690,300 680,919 Depreciation and amortisation Expenses from ordinary activities (excluding borrowing costs expense)
Borrowing costs expense Operating profit before Income Tax from ordinary activities Income Tax Expense Net surplus or deficit attributable tothe Commonwealth
13,230 15,493 15,866 15,564 14,932 14,808
721,441 774,270 745,365 815,093 808,082 802,224 22,246 31,538 28,374 31,570 31,587 32,176
89,380 74,173 49,030 57,341 56,994 61,200 24,903 11,861 18,556 16,421 15,518 16,147
64,477 62,312 30,474 40,920 41,476 45,053
Part Three – Defence Housing Australia
189

Table 3.1.2—Budgeted Balance Sheet Projected
Results 2007-08
$’000
Forward Estimate 2008-09
$’000
Revised Estimate 2008-09
$’000
Forward Estimate 2009-10
$’000
Forward Estimate 2010-11
$’000
Forward Estimate 2011-12
$’000
ASSETS
Financial assets
Cash 34,430 43,055 62,736 39,738 43,571 46,932
Receivables 163,543 148,741 155,043 148,948 143,659 139,189
Accrued Revenue 18,032 18,737 15,701 16,803 17,855 18,941
Other Financial Assets
Total financial assets
Non-financial assets
22,986 23,785 20,213 20,960 21,358 20,587
238,991 234,318 253,693 226,449 226,443 225,649
Land and buildings
Infrastructure, plant and equipment
Inventories
1,360,410
12,490
683,191
1,352,277
10,501
762,406
1,307,838
13,344
726,031
1,317,137
14,765
787,168
1,303,638
16,600
828,584
1,272,560
18,503
880,224
Assets Held for Sale 30,851 43,154 54,077 51,710 40,705 67,685
Tax Assets
Total non-financial assets
Total Assets
LIABILITIES
14,963 13,092 25,052 21,921 19,181 16,783
2,101,905 2,181,430 2,126,342 2,192,701 2,208,708 2,255,755
2,340,896 2,415,748 2,380,035 2,419,150 2,435,151 2,481,404
Interest bearing liabilities
Loans 400,000 475,000 450,000 475,000 475,000 500,000
Provisions
Employees
Trade Creditors
8,866
4,981
10,138
5,033
10,032
4,451
11,510
4,483
13,047
4,516
14,677
4,491
Provision 110,865 104,807 67,679 67,884 68,096 68,316
Current Tax Liabilities 18,948 - 2,769 2,287 2,162 1,556
Provision for dividend - 42,137 39,402 37,224 38,726
Prepayment Received
Other Payables and Accrued Expenses
Total Payables and Provisions
Total liabilities
Equity
Contributed equity
Reserves
17,342
12,074
17,920
9,129
27,649
7,285
28,424
8,620
28,577
8,969
28,719
9,321
173,076 147,027 162,002 162,610 162,591 165,806
573,076 622,027 612,002 637,610 637,591 665,806
249,148
1,417,452
249,148
1,458,322
249,148
1,443,740
249,148
1,455,725
249,148
1,467,492
249,148
1,479,203
Total accumulated results
Total equity
Total liabilities and equity
101,220 86,251 75,145 76,667 80,920 87,247
1,767,820 1,793,721 1,768,033 1,781,540 1,797,560 1,815,598
2,340,896 2,415,748 2,380,035 2,419,150 2,435,151 2,481,404
Part Three – Defence Housing Australia
190

Table 3.1.3—Statement of Cash Flows Projected
Results Forward Estimate
Revised Estimate
Forward Estimate
Forward Estimate
Forward Estimate
2007-08 2008-09 2008-09 2009-10 2010-11 2011-12 $’000 $’000 $’000 $’000 $’000 $’000
OPERATING ACTIVITIES
Cash received
Goods and services 785,411 825,755 776,929 842,952 834,622 830,424
Interest 8,372 2,217 4,282 6,561 6,953 9,902
GST 4,400 - 0 0 0 0
Other
Total cash received
Cash used
4 - 59 0 0 0
798,187 827,972 781,270 849,513 841,575 840,326
Employees 70,441 72,077 58,217 55,786 58,016 61,014
Payment to Suppliers 728,122 732,394 749,220 761,147 733,377 733,017
GST Payments to Suppliers 928 - 0 0 0 0
Tax 224 29,863 31,480 13,772 12,902 14,355
Interest
Total cash used
Net cash from/(used by) operating activities
INVESTING ACTIVITIES
27,336 31,538 28,374 31,570 31,587 32,176
827,051 865,872 867,291 862,275 835,882 840,562
(28,864) (37,900) (86,021) (12,762) 5,693 (236)
Cash received
Proceeds from sales of property, plant and equipment
Total cash received
Cash used
66,135 127,803 157,232 107,704 116,331 118,132
66,135 127,803 157,232 107,704 116,331 118,132
Purchase of property, plant and equipment
Total cash used
Net cash from (used by investing activities)
174,422 121,247 69,566 100,803 78,789 102,312
174,422 121,247 69,566 100,803 78,789 102,312
(108,287) 6,556 87,666 6,901 37,542 15,820
FINANCING ACTIVITIES
Cash received
Proceeds from loans 60,000 75,000 50,000 25,000 0 25,000
Proceeds from other activities
Total cash received
Cash used
-
60,000 75,000 50,000 25,000 0 25,000
Repayment of loans
Dividends paid
Total cash used
Net cash from/(used by) financing activities
Net increase/(decrease) in cash held
Cash at the beginning of the reporting period
Cash at the end of the reporting period
58,700 35,031 44,279 42,137 39,402 37,224
58,700 35,031 44,279 42,137 39,402 37,224
1,300 39,969 5,721 (17,137) (39,402) (12,224)
(135,851) 8,625 7,366 (22,998) 3,833 3,360
170,281 34,430 55,370 62,736 39,738 43,571
34,430 43,055 62,736 39,738 43,571 46,931
Part Three – Defence Housing Australia
191

Table 3.1.4—Capital Budget Statement[1]
Projected Results
Forward Estimate
Revised Estimate
Forward Estimate
Forward Estimate
Forward Estimate
2007-08 2008-09 2008-09 2009-10 2010-11 2011-12
CAPITAL APPROPRIATIONS $’000 $’000 $’000 $’000 $’000 $’000
Total loans
Total 60,000 75,000 50,000 25,000 0 25,000
60,000 75,000 50,000 25,000 0 25,000 PURCHASE OF NON CURRENT ASSETS Funded internally by Departmental resources
TOTAL 125,000 48,000 66,000 55,000 65,000 70,000
125,000 48,000 66,000 55,000 65,000 70,000 Note 1. Table 4 shows purchases of property, plant and equipment and includes housing stock intended to be kept as
Defence Housing Australia core stock. Sale and Leaseback housing stock is now recorded as inventory. Cost of acquisition/construction of inventory is shown in Operating activities in the Statement of Cash Flows. Previously, costs of acquisition/construction of all housing stock, whether intended for sale or to be kept as core stock, was shown as Investing Activities.
Table 3.1.5: Non-Financial Assets – Summary of Movement (Budget Year 2008-09)
Part Three – Defence Housing Australia
192
Gross Value as at 1 July 2007
Additions
Disposals
Revaluation increments
Land
$’000
Buildings
$’000
Total Land and Buildings
$’000
Other infrastructure
plant and equipment
$’000
Total
$’000
L&B IP&E
held for sale
$’000
Total
$’000
832,757
24,197
0
0
466,877
31,901
0
0
1,299,634
56,098
0
0
37,313
6,167
0
0
1,336,947
62,265
0
0
120,964
0
-114,781
0
1,457,911
62,265
-114,781
0
Transfers to Assets Held for
Sale -23,947 -23,947 -47,894 0 -47,894 47,894 0
Gross value 30 June 2008 833,007 474,831 1,307,838 43,480 1,351,318 54,077 1,405,395
Accumulated Depreciation as at 1 July 2007
Charge for the reporting
period
Disposals
Revaluations
Accumulated Depreciation as at 30 June 2008
Net Book Value as at 30 June
0
0
0
0
-11,871
11,871
0
-11,871
0
11,871
-26,141
-3,995
0
-26,141
-15,866
0
11,871
0
0
0
0
-26,141
-15,866
0
11,871
0 0 0 -
30,136 -
30,136 -
30,136
2008 833,007 474,831 1,307,838 13,344 1,321,182 54,077 1,375,259

Table 3.1.6—Defence Housing Australia (DHA) resource statement budget estimates for 2008-09 as at Budget May 2008
Estimate of prior year amounts Proposed Total Total
available in at Budget Estimate Estimate Source 2008-09 2008-09 2008-09 2008-09 $'000 + $'000 = $’000 $'000
Opening Balance/Reserves at Bank - -
REVENUE FROM GOVERNMENT
Ordinary Annual Services[1]
Outcome 1- Defence DHA:01 556,089 556,089 Total ordinary annual services 556,089 556,089
Total Annual Appropriations 556,089 556,089
Total Funds from Government 556,089 556,089 FUNDS FROM OTHER SOURCES
Interest 4,838 4,838
Sale of goods and services 220,857 220,857
Other 115 115
Total 225,810 225,810
Total net resourcing for Agency 781,899 781,899
Note 1. Appropriation Bill (No.1) 2008-09. 2. All figures are GST exclusive.
CRF - Consolidated Revenue Fund
DHA is not directly appropriated as it is a Commonwealth Authorities and Companies Act body. Appropriations are made to Department of Defence which are then paid to DHA and are considered 'departmental' for all purposes.
Part Three – Defence Housing Australia
193