Embed Size (px)
Citation preview
Portfolio Additional Estimates Statements 2017-18
Human Services Portfolio
Explanations of Additional Estimates 2017-18
© Commonwealth of Australia 2018
ISBN 978-1-76070-412-4
This publication is available for your use under a Creative Commons BY Attribution 3.0 Australia licence, with the exception of the Commonwealth Coat of Arms, the Department of Human Services’ logo, photographs, images, signatures and where otherwise stated. The full licence terms are available from http://creativecommons.org/licenses/by/3.0/au/legalcode.
Use of Department of Human Services’ material under a Creative Commons BY Attribution 3.0 Australia licence requires you to attribute the work (but not in any way that suggests that the Department of Human Services endorses you or your use of the work):
Department of Human Services’ material used 'as supplied'
Provided you have not modified or transformed Department of Human Services’ material in any way including, for example, by changing the Department of Human Services’ text; calculating percentage changes; graphing or charting data; or deriving new statistics from published Department of Human Services’ statistics – then Department of Human Services prefers the following attribution:
Source: The Australian Government Department of Human Services
Derivative material
If you have modified or transformed Department of Human Services’ material, or derived new material from those of the Department of Human Services’ in any way, then Department of Human Services prefers the following attribution:
Based on The Australian Government Department of Human Services’ data
Use of the Coat of Arms The terms under which the Coat of Arms can be used are set out on the It’s an Honour website (see www.itsanhonour.gov.au)
Other Uses Inquiries regarding this licence and any other use of this document are welcome to:
Mr Mark Jenkin, Chief Financial Officer, CFO Division, Department of Human Services, PO Box 7788, Canberra BC, ACT 2600 Australia.
iv
ABBREVIATIONS AND CONVENTIONS
The following notations may be used:
NEC/nec not elsewhere classified
- nil
.. not zero, but rounded to zero
na not applicable (unless otherwise specified)
nfp not for publication
$m $ million
$b $ billion
Figures in tables and in the text may be rounded. Figures in text are generally rounded to one decimal place, whereas figures in tables are generally rounded to the nearest thousand. Discrepancies in tables between totals and sums of components are due to rounding.
Enquiries
Should you have any enquiries regarding this publication please contact Mr Mark Jenkin, Chief Financial Officer in the Department of Human Services on (02) 6223 4350.
Links to Portfolio Budget Statements (including Portfolio Additional Estimates Statements and Portfolio Supplementary Additional Estimates Statements) can be located on the Australian Government Budget website at www.budget.gov.au.
USER GUIDE TO THE
PORTFOLIO ADDITIONAL ESTIMATES STATEMENTS

vii
USER GUIDE
The purpose of the 2017-18 Portfolio Additional Estimates Statements (PAES), like that of the Portfolio Budget Statements (PB Statements), is to inform Senators and Members of Parliament of the proposed allocation of resources to Government outcomes by entities within the portfolio. The focus of the PAES differs from the PB Statements in one important aspect. While the PAES includes an Entity Resource Statement to inform Parliament of the revised estimate of the total resources available to an entity, the focus of the PAES is on explaining the changes in resourcing by outcome(s) since the Budget. As such, the PAES provides information on new measures and their impact on the financial and/or non-financial planned performance of programs supporting those outcomes.
The PAES facilitates understanding of the proposed appropriations in Appropriation Bills (Nos. 3 and 4) and Appropriation (Parliamentary Departments) Bill (No. 2) 2017-2018. In this sense, the PAES is declared by the Additional Estimates Appropriation Bills to be a ‘relevant document’ to the interpretation of the Bills according to section 15AB of the Acts Interpretation Act 1901.
Whereas the Mid-Year Economic and Fiscal Outlook (MYEFO) 2017-18 is a mid-year budget report which provides updated information to allow the assessment of the Government’s fiscal performance against its fiscal strategy, the PAES update the most recent budget appropriations for entities within the portfolio.
viii
Structure of the Portfolio Additional Estimates Statements
The PAES are presented in three parts with subsections.
User guide
Provides a brief introduction explaining the purpose of the PAES.
Portfolio overview
Provides an overview of the portfolio, including a chart that outlines the outcomes for entities in the portfolio.
Entity Additional Estimates Statements
A statement (under the name of the entity) for each entity affected by Additional Estimates.
Section 1: Entity overview and resources
This section details the changes in total resources available to an entity, the impact of any measures since Budget, and impact of Appropriation Bills Nos. 3 and 4.
Section 2: Revisions to outcomes and planned performance
This section details changes to Government outcomes and/or changes to the planned performance of entity programs.
Section 3: Special account flows and budgeted financial statements
This section contains updated explanatory tables on special account flows and staffing levels and revisions to the budgeted financial statements.
Portfolio glossary
Explains key terms relevant to the Portfolio.
ix
CONTENTS
Portfolio overview ......................................................................................................... 3
Department of Human Services ................................................................................... 9
Portfolio glossary ........................................................................................................ 45


PORTFOLIO OVERVIEW

3
PORTFOLIO OVERVIEW
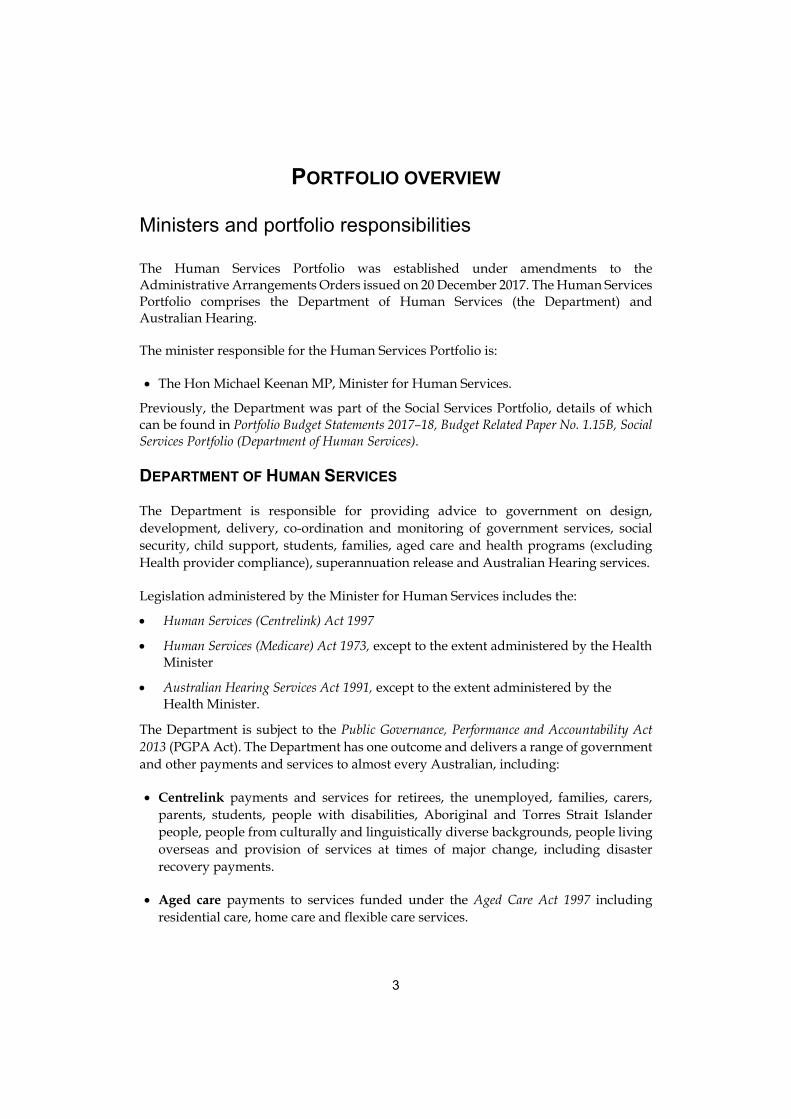
Ministers and portfolio responsibilities
The Human Services Portfolio was established under amendments to the Administrative Arrangements Orders issued on 20 December 2017. The Human Services Portfolio comprises the Department of Human Services (the Department) and Australian Hearing.
The minister responsible for the Human Services Portfolio is:
The Hon Michael Keenan MP, Minister for Human Services.
Previously, the Department was part of the Social Services Portfolio, details of which can be found in Portfolio Budget Statements 2017–18, Budget Related Paper No. 1.15B, Social Services Portfolio (Department of Human Services).
DEPARTMENT OF HUMAN SERVICES
The Department is responsible for providing advice to government on design, development, delivery, co-ordination and monitoring of government services, social security, child support, students, families, aged care and health programs (excluding Health provider compliance), superannuation release and Australian Hearing services.
Legislation administered by the Minister for Human Services includes the:
Human Services (Centrelink) Act 1997
Human Services (Medicare) Act 1973, except to the extent administered by the Health Minister
Australian Hearing Services Act 1991, except to the extent administered by the Health Minister.
The Department is subject to the Public Governance, Performance and Accountability Act 2013 (PGPA Act). The Department has one outcome and delivers a range of government and other payments and services to almost every Australian, including:
Centrelink payments and services for retirees, the unemployed, families, carers, parents, students, people with disabilities, Aboriginal and Torres Strait Islander people, people from culturally and linguistically diverse backgrounds, people living overseas and provision of services at times of major change, including disaster recovery payments.
Aged care payments to services funded under the Aged Care Act 1997 including residential care, home care and flexible care services.
Portfolio Overview
4
Health services and payments that support Australians such as Medicare, the Pharmaceutical Benefits Scheme, digital health, Private Health Insurance Rebate, the Australian Immunisation Register, the National Bowel Cancer Screening Register, the Australian Organ Donor Register, and related services for eligible veterans, their spouses and dependants.
Child Support services for separated parents to provide the financial and emotional support necessary for their children’s wellbeing.
The Department also delivers other services including the Tasmanian Freight Equalisation Scheme and Early Release of Superannuation, and whole of government services such as myGov.
Additional appropriation of $9.2 million is being sought through Appropriation Bill (No. 3) 2017-18 and $15.9 million through Appropriation Bill (No. 4) 2017-18 as a result of new measures and variations.
AUSTRALIAN HEARING
Australian Hearing is a Public Non-Financial Corporation (Trading) entity established under the Australian Hearing Services Act 1991. Accordingly, Australian Hearing is not reported in the Portfolio Budget Statements or Portfolio Additional Estimates Statements. Australian Hearing is a corporate Commonwealth entity under the PGPA Act and is governed by a board that is appointed by the Minister for Human Services.
Portfolio Overview
5
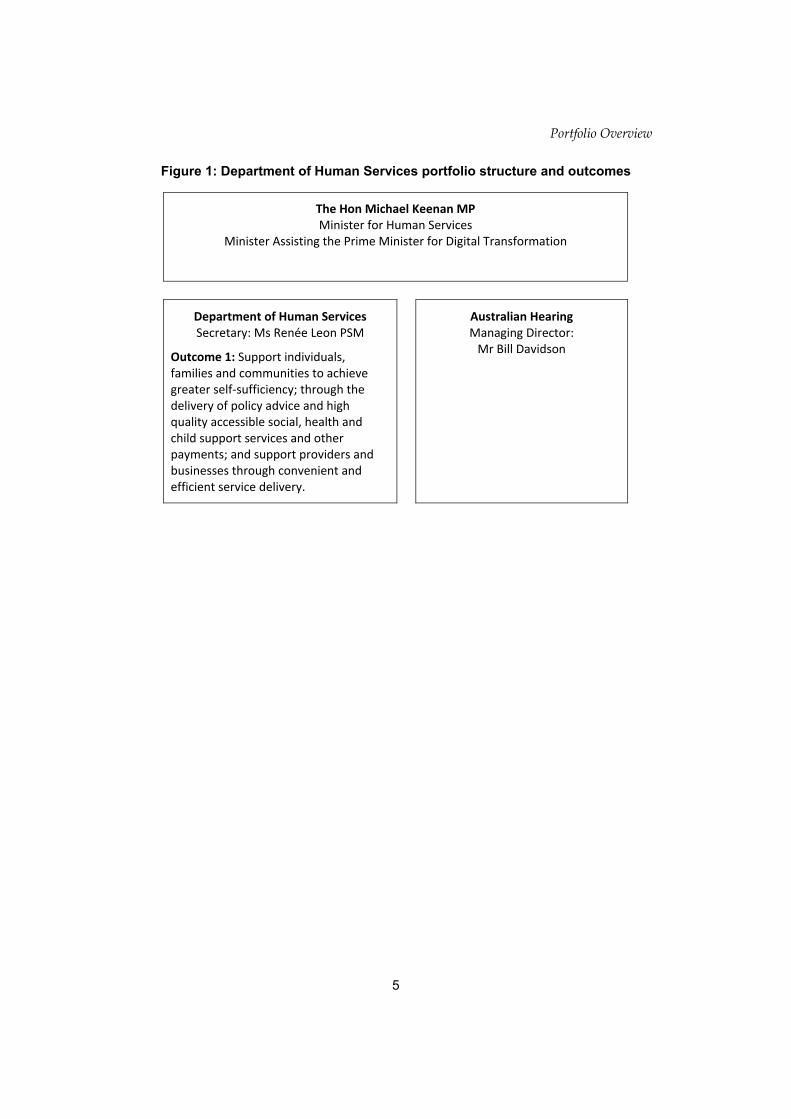
Figure 1: Department of Human Services portfolio structure and outcomes
The Hon Michael Keenan MP Minister for Human Services
Minister Assisting the Prime Minister for Digital Transformation
Department of Human Services Secretary: Ms Renée Leon PSM
Outcome 1: Support individuals, families and communities to achieve greater self‐sufficiency; through the delivery of policy advice and high quality accessible social, health and child support services and other payments; and support providers and businesses through convenient and efficient service delivery.
Australian Hearing Managing Director: Mr Bill Davidson

ENTITY ADDITIONAL ESTIMATES
STATEMENTS
Department of Human Services ................................................................................... 9


9
DEPARTMENT OF HUMAN SERVICES
Section 1: Entity overview and resources ................................................................ 11
1.1 Strategic direction statement .................................................................................. 11
1.2 Entity resource statement ...................................................................................... 11
1.3 Entity measures ..................................................................................................... 19
1.4 Additional estimates, resourcing and variations to outcomes ................................ 21
1.5 Breakdown of additional estimates by appropriation bill ....................................... 23
Section 2: Revisions to outcomes and planned performance ............................... 25
2. Changes to outcome and program structures .......................................................... 25
2.1 Budgeted expenses and performance for Outcome 1 ........................................... 25
2.1.1 Budgeted expenses for Outcome 1 .................................................................... 26
2.1.2 Performance criteria for Outcome 1 .................................................................... 28
Section 3: Special account flows and budgeted financial statements .................. 29
3.1 Special account flows ............................................................................................. 29
3.2 Budgeted financial statements ............................................................................... 31

11
DEPARTMENT OF HUMAN SERVICES
Section 1: Entity overview and resources
1.1 STRATEGIC DIRECTION STATEMENT
There have been no changes to the strategic direction statement since the publication of the 2017–18 PB Statements.
For full details refer to pages 13-14 of the Portfolio Budget Statements 2017–18, Budget Related Paper No. 1.15B, Social Services Portfolio (Department of Human Services).
1.2 ENTITY RESOURCE STATEMENT
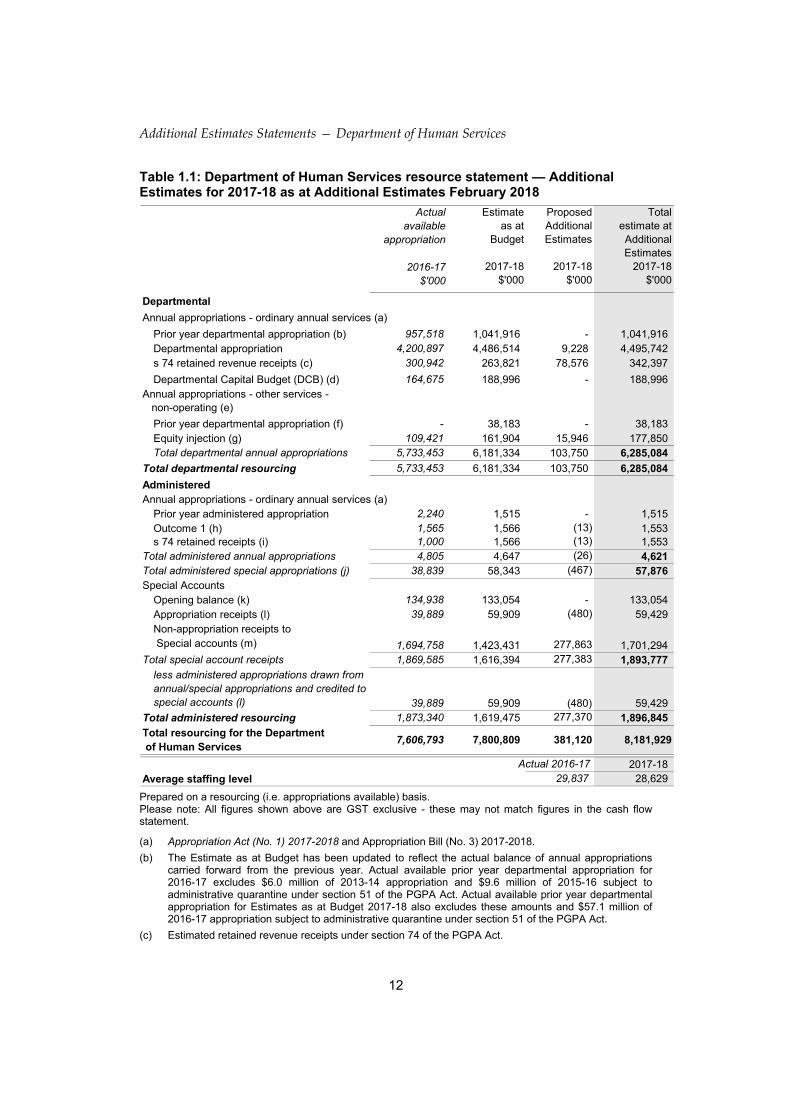
The Entity Resource Statement details the resourcing for the Department at Additional Estimates. Table 1.1 outlines the total resourcing available from all sources for the 2017-18 Budget year, including variations through Appropriation Bills No. 3 and No. 4, Special Appropriations and Special Accounts.
Additional Estimates Statements — Department of Human Services
12
Table 1.1: Department of Human Services resource statement — Additional Estimates for 2017-18 as at Additional Estimates February 2018
Actualavailable
appropriation
2016-17$'000
Estimateas at
Budget
2017-18$'000
Proposed Additional
Estimates
2017-18$'000
Total estimate at Additional Estimates
2017-18 $'000
Departmental
Annual appropriations - ordinary annual services (a)
Prior year departmental appropriation (b) 957,518 1,041,916 - 1,041,916 Departmental appropriation 4,200,897 4,486,514 9,228 4,495,742 s 74 retained revenue receipts (c) 300,942 263,821 78,576 342,397
Departmental Capital Budget (DCB) (d) 164,675 188,996 - 188,996 Annual appropriations - other services - non-operating (e)
Prior year departmental appropriation (f) - 38,183 - 38,183 Equity injection (g) 109,421 161,904 15,946 177,850 Total departmental annual appropriations 5,733,453 6,181,334 103,750 6,285,084
Total departmental resourcing 5,733,453 6,181,334 103,750 6,285,084
AdministeredAnnual appropriations - ordinary annual services (a)
Prior year administered appropriation 2,240 1,515 - 1,515 Outcome 1 (h) 1,565 1,566 (13) 1,553 s 74 retained receipts (i) 1,000 1,566 (13) 1,553
Total administered annual appropriations 4,805 4,647 (26) 4,621 Total administered special appropriations (j) 38,839 58,343 (467) 57,876 Special Accounts
Opening balance (k) 134,938 133,054 - 133,054 Appropriation receipts (l) 39,889 59,909 (480) 59,429 Non-appropriation receipts to Special accounts (m) 1,694,758 1,423,431 277,863 1,701,294
Total special account receipts 1,869,585 1,616,394 277,383 1,893,777
less administered appropriations drawn from annual/special appropriations and credited to special accounts (l) 39,889 59,909 (480) 59,429
Total administered resourcing 1,873,340 1,619,475 277,370 1,896,845
Total resourcing for the Department of Human Services
7,606,793 7,800,809 381,120 8,181,929
Actual 2016-17 2017-18Average staffing level 29,837 28,629
Prepared on a resourcing (i.e. appropriations available) basis. Please note: All figures shown above are GST exclusive - these may not match figures in the cash flow statement.
(a) Appropriation Act (No. 1) 2017-2018 and Appropriation Bill (No. 3) 2017-2018.
(b) The Estimate as at Budget has been updated to reflect the actual balance of annual appropriations carried forward from the previous year. Actual available prior year departmental appropriation for 2016-17 excludes $6.0 million of 2013-14 appropriation and $9.6 million of 2015-16 subject to administrative quarantine under section 51 of the PGPA Act. Actual available prior year departmental appropriation for Estimates as at Budget 2017-18 also excludes these amounts and $57.1 million of 2016-17 appropriation subject to administrative quarantine under section 51 of the PGPA Act.
(c) Estimated retained revenue receipts under section 74 of the PGPA Act.
Additional Estimates Statements — Department of Human Services
13
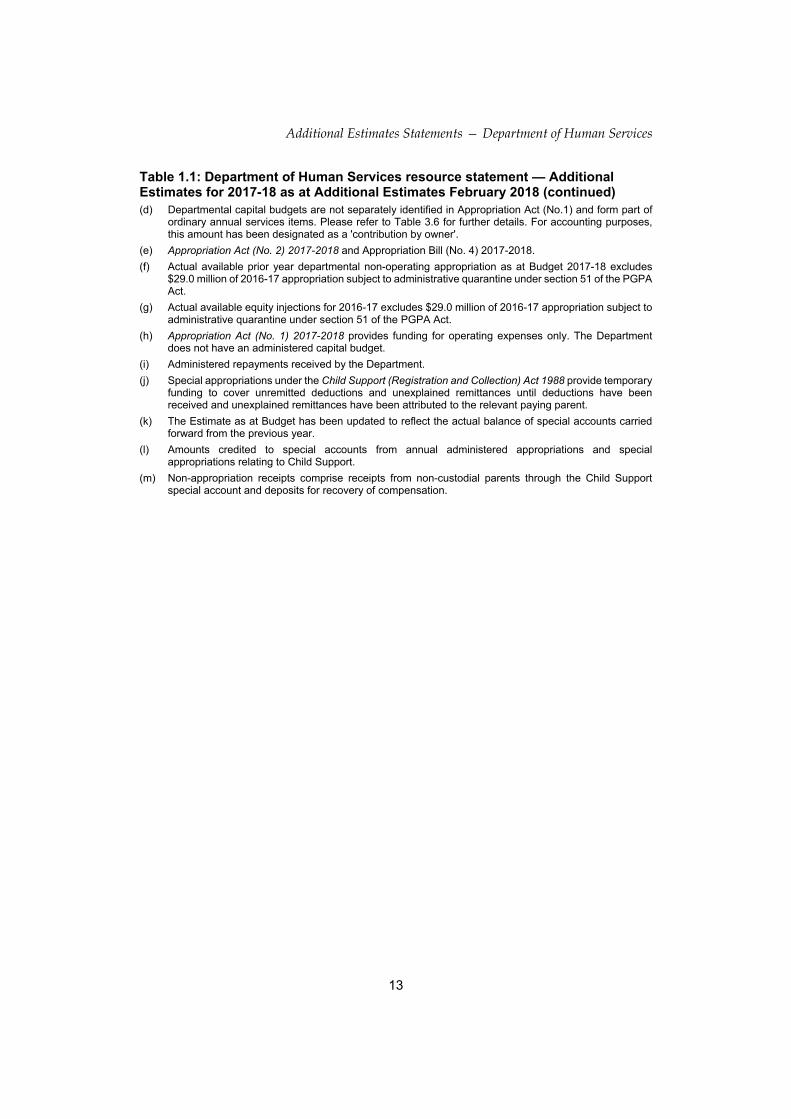
Table 1.1: Department of Human Services resource statement — Additional Estimates for 2017-18 as at Additional Estimates February 2018 (continued) (d) Departmental capital budgets are not separately identified in Appropriation Act (No.1) and form part of
ordinary annual services items. Please refer to Table 3.6 for further details. For accounting purposes, this amount has been designated as a 'contribution by owner'.
(e) Appropriation Act (No. 2) 2017-2018 and Appropriation Bill (No. 4) 2017-2018.
(f) Actual available prior year departmental non-operating appropriation as at Budget 2017-18 excludes $29.0 million of 2016-17 appropriation subject to administrative quarantine under section 51 of the PGPA Act.
(g) Actual available equity injections for 2016-17 excludes $29.0 million of 2016-17 appropriation subject to administrative quarantine under section 51 of the PGPA Act.
(h) Appropriation Act (No. 1) 2017-2018 provides funding for operating expenses only. The Department does not have an administered capital budget.
(i) Administered repayments received by the Department.
(j) Special appropriations under the Child Support (Registration and Collection) Act 1988 provide temporary funding to cover unremitted deductions and unexplained remittances until deductions have been received and unexplained remittances have been attributed to the relevant paying parent.
(k) The Estimate as at Budget has been updated to reflect the actual balance of special accounts carried forward from the previous year.
(l) Amounts credited to special accounts from annual administered appropriations and special appropriations relating to Child Support.
(m) Non-appropriation receipts comprise receipts from non-custodial parents through the Child Support special account and deposits for recovery of compensation.
Additional Estimates Statements — Department of Human Services
14
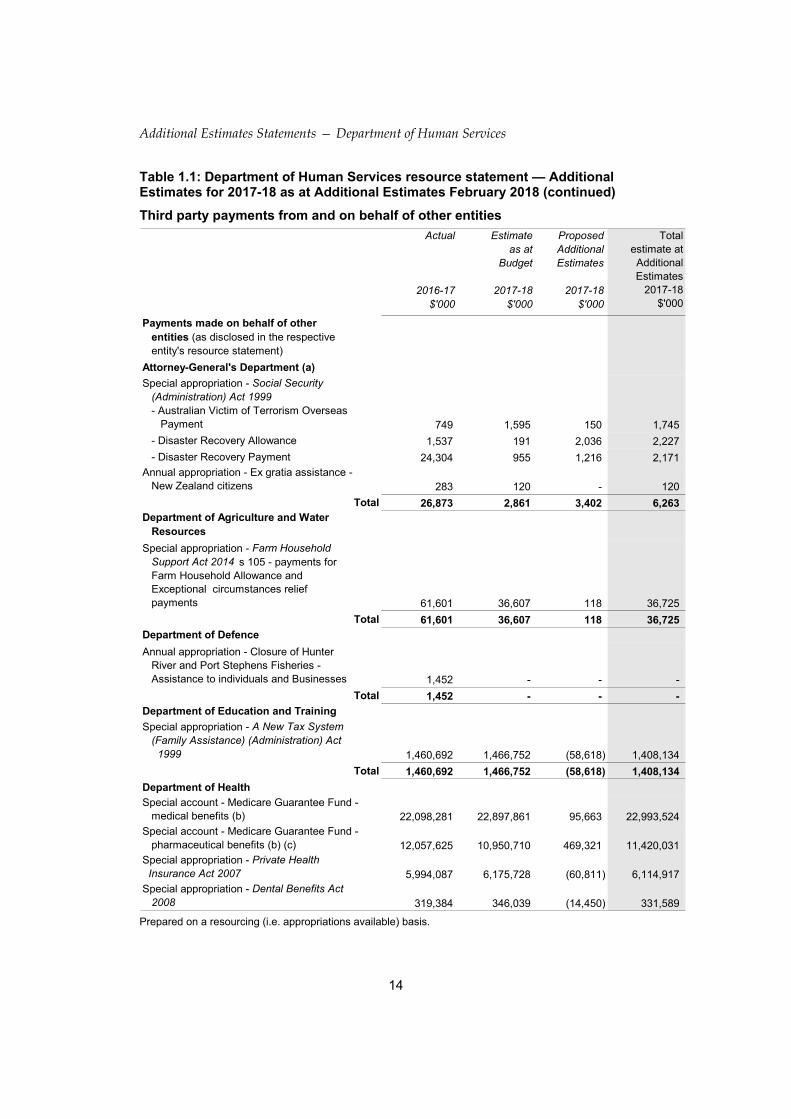
Table 1.1: Department of Human Services resource statement — Additional Estimates for 2017-18 as at Additional Estimates February 2018 (continued)
Third party payments from and on behalf of other entities
Actual
2016-17$'000
Estimateas at
Budget
2017-18$'000
ProposedAdditionalEstimates
2017-18$'000
Totalestimate atAdditionalEstimates
2017-18$'000
Payments made on behalf of other entities (as disclosed in the respective entity's resource statement)
Attorney-General's Department (a)
Special appropriation - Social Security (Administration) Act 1999 - Australian Victim of Terrorism Overseas Payment 749 1,595 150 1,745
- Disaster Recovery Allowance 1,537 191 2,036 2,227
- Disaster Recovery Payment 24,304 955 1,216 2,171 Annual appropriation - Ex gratia assistance - New Zealand citizens 283 120 - 120
Total 26,873 2,861 3,402 6,263 Department of Agriculture and Water Resources
Special appropriation - Farm Household Support Act 2014 s 105 - payments for Farm Household Allowance and Exceptional circumstances relief payments 61,601 36,607 118 36,725
Total 61,601 36,607 118 36,725 Department of Defence
Annual appropriation - Closure of Hunter River and Port Stephens Fisheries - Assistance to individuals and Businesses 1,452 - - -
Total 1,452 - - - Department of Education and Training
Special appropriation - A New Tax System (Family Assistance) (Administration) Act 1999 1,460,692 1,466,752 (58,618) 1,408,134
Total 1,460,692 1,466,752 (58,618) 1,408,134
Department of Health
Special account - Medicare Guarantee Fund - medical benefits (b) 22,098,281 22,897,861 95,663 22,993,524 Special account - Medicare Guarantee Fund - pharmaceutical benefits (b) (c) 12,057,625 10,950,710 469,321 11,420,031 Special appropriation - Private Health Insurance Act 2007 5,994,087 6,175,728 (60,811) 6,114,917 Special appropriation - Dental Benefits Act 2008 319,384 346,039 (14,450) 331,589
Prepared on a resourcing (i.e. appropriations available) basis.
Additional Estimates Statements — Department of Human Services
15
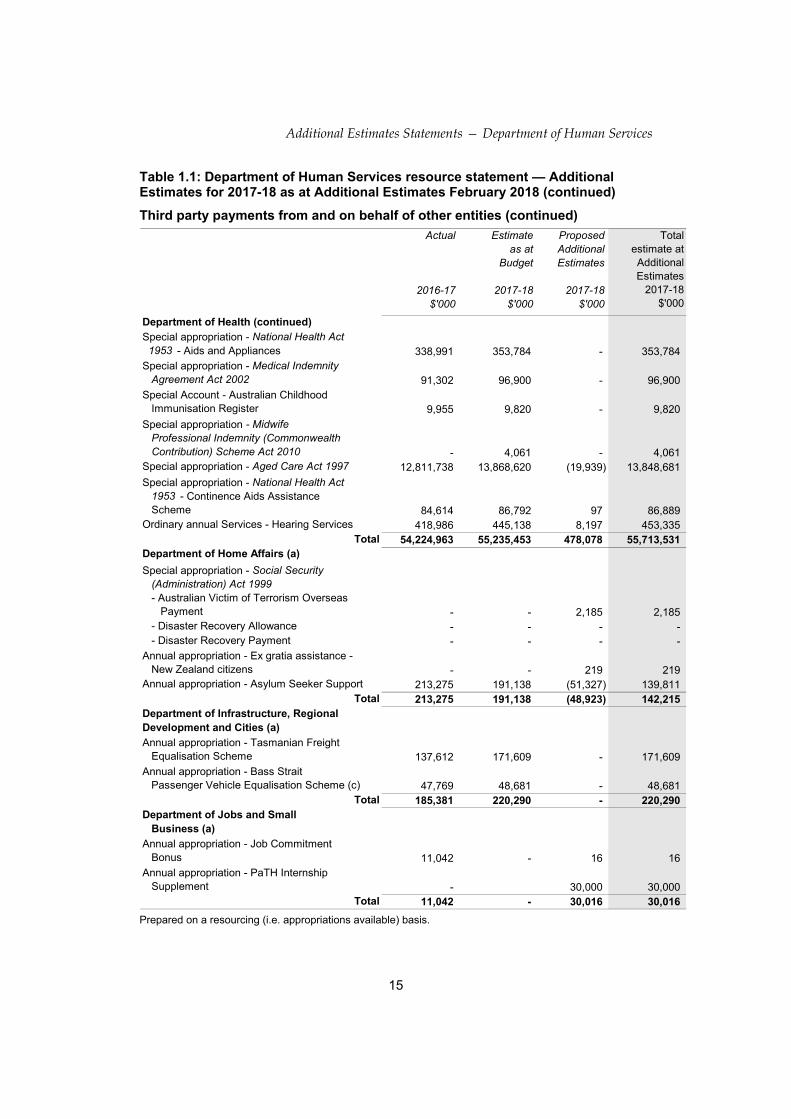
Table 1.1: Department of Human Services resource statement — Additional Estimates for 2017-18 as at Additional Estimates February 2018 (continued)
Third party payments from and on behalf of other entities (continued)
Actual
2016-17$'000
Estimateas at
Budget
2017-18$'000
ProposedAdditionalEstimates
2017-18$'000
Totalestimate atAdditionalEstimates
2017-18$'000
Department of Health (continued)
Special appropriation - National Health Act 1953 - Aids and Appliances 338,991 353,784 - 353,784 Special appropriation - Medical Indemnity Agreement Act 2002 91,302 96,900 - 96,900 Special Account - Australian Childhood Immunisation Register 9,955 9,820 - 9,820
Special appropriation - Midwife Professional Indemnity (Commonwealth Contribution) Scheme Act 2010 - 4,061 - 4,061 Special appropriation - Aged Care Act 1997 12,811,738 13,868,620 (19,939) 13,848,681
Special appropriation - National Health Act 1953 - Continence Aids Assistance Scheme 84,614 86,792 97 86,889 Ordinary annual Services - Hearing Services 418,986 445,138 8,197 453,335
Total 54,224,963 55,235,453 478,078 55,713,531 Department of Home Affairs (a)
Special appropriation - Social Security (Administration) Act 1999 - Australian Victim of Terrorism Overseas Payment - - 2,185 2,185 - Disaster Recovery Allowance - - - - - Disaster Recovery Payment - - - - Annual appropriation - Ex gratia assistance - New Zealand citizens - - 219 219 Annual appropriation - Asylum Seeker Support 213,275 191,138 (51,327) 139,811
Total 213,275 191,138 (48,923) 142,215 Department of Infrastructure, Regional Development and Cities (a)
Annual appropriation - Tasmanian Freight Equalisation Scheme 137,612 171,609 - 171,609 Annual appropriation - Bass Strait Passenger Vehicle Equalisation Scheme (c) 47,769 48,681 - 48,681
Total 185,381 220,290 - 220,290 Department of Jobs and Small Business (a)
Annual appropriation - Job Commitment Bonus 11,042 - 16 16 Annual appropriation - PaTH Internship Supplement - 30,000 30,000
Total 11,042 - 30,016 30,016
Prepared on a resourcing (i.e. appropriations available) basis.
Additional Estimates Statements — Department of Human Services
16
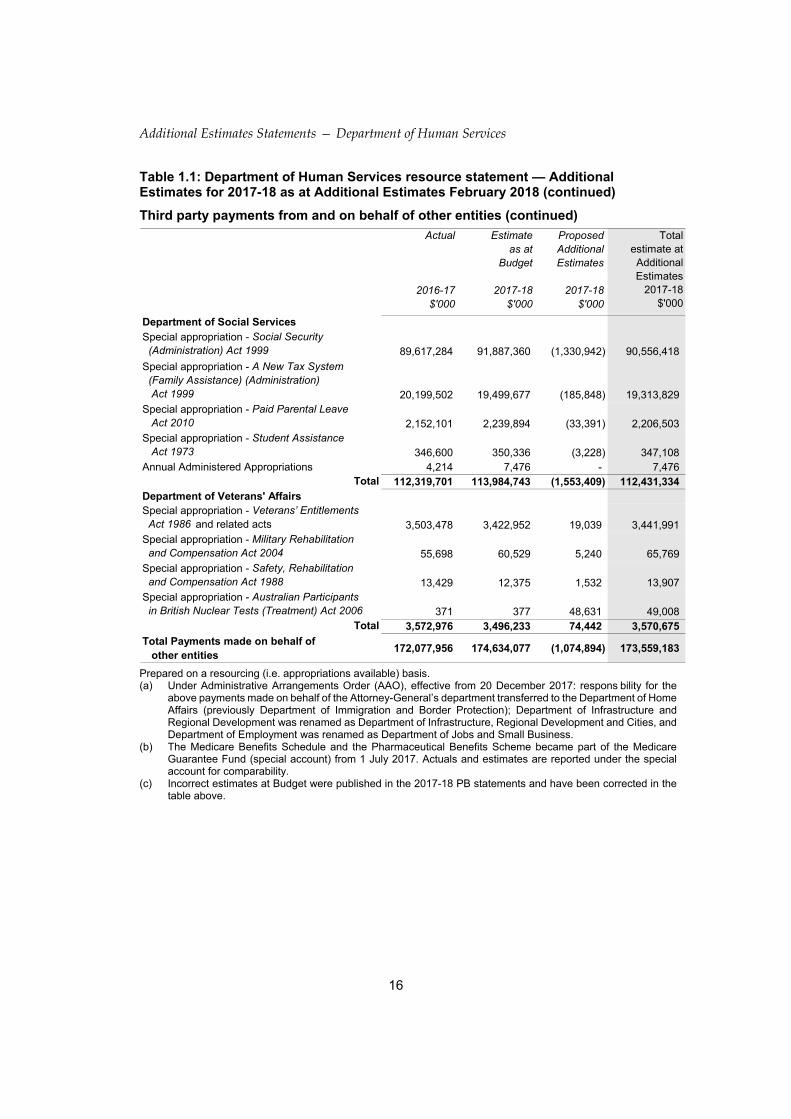
Table 1.1: Department of Human Services resource statement — Additional Estimates for 2017-18 as at Additional Estimates February 2018 (continued)
Third party payments from and on behalf of other entities (continued)
Actual
2016-17$'000
Estimateas at
Budget
2017-18$'000
ProposedAdditionalEstimates
2017-18$'000
Totalestimate atAdditionalEstimates
2017-18$'000
Department of Social Services
Special appropriation - Social Security (Administration) Act 1999 89,617,284 91,887,360 (1,330,942) 90,556,418
Special appropriation - A New Tax System (Family Assistance) (Administration) Act 1999 20,199,502 19,499,677 (185,848) 19,313,829 Special appropriation - Paid Parental Leave Act 2010 2,152,101 2,239,894 (33,391) 2,206,503 Special appropriation - Student Assistance Act 1973 346,600 350,336 (3,228) 347,108 Annual Administered Appropriations 4,214 7,476 - 7,476
Total 112,319,701 113,984,743 (1,553,409) 112,431,334 Department of Veterans' AffairsSpecial appropriation - Veterans’ Entitlements Act 1986 and related acts 3,503,478 3,422,952 19,039 3,441,991 Special appropriation - Military Rehabilitation and Compensation Act 2004 55,698 60,529 5,240 65,769 Special appropriation - Safety, Rehabilitation and Compensation Act 1988 13,429 12,375 1,532 13,907 Special appropriation - Australian Participants in British Nuclear Tests (Treatment) Act 2006 371 377 48,631 49,008
Total 3,572,976 3,496,233 74,442 3,570,675
Total Payments made on behalf of other entities
172,077,956 174,634,077 (1,074,894) 173,559,183
Prepared on a resourcing (i.e. appropriations available) basis. (a) Under Administrative Arrangements Order (AAO), effective from 20 December 2017: respons bility for the
above payments made on behalf of the Attorney-General’s department transferred to the Department of Home Affairs (previously Department of Immigration and Border Protection); Department of Infrastructure and Regional Development was renamed as Department of Infrastructure, Regional Development and Cities, and Department of Employment was renamed as Department of Jobs and Small Business.
(b) The Medicare Benefits Schedule and the Pharmaceutical Benefits Scheme became part of the Medicare Guarantee Fund (special account) from 1 July 2017. Actuals and estimates are reported under the special account for comparability.
(c) Incorrect estimates at Budget were published in the 2017-18 PB statements and have been corrected in the table above.
Additional Estimates Statements — Department of Human Services
17
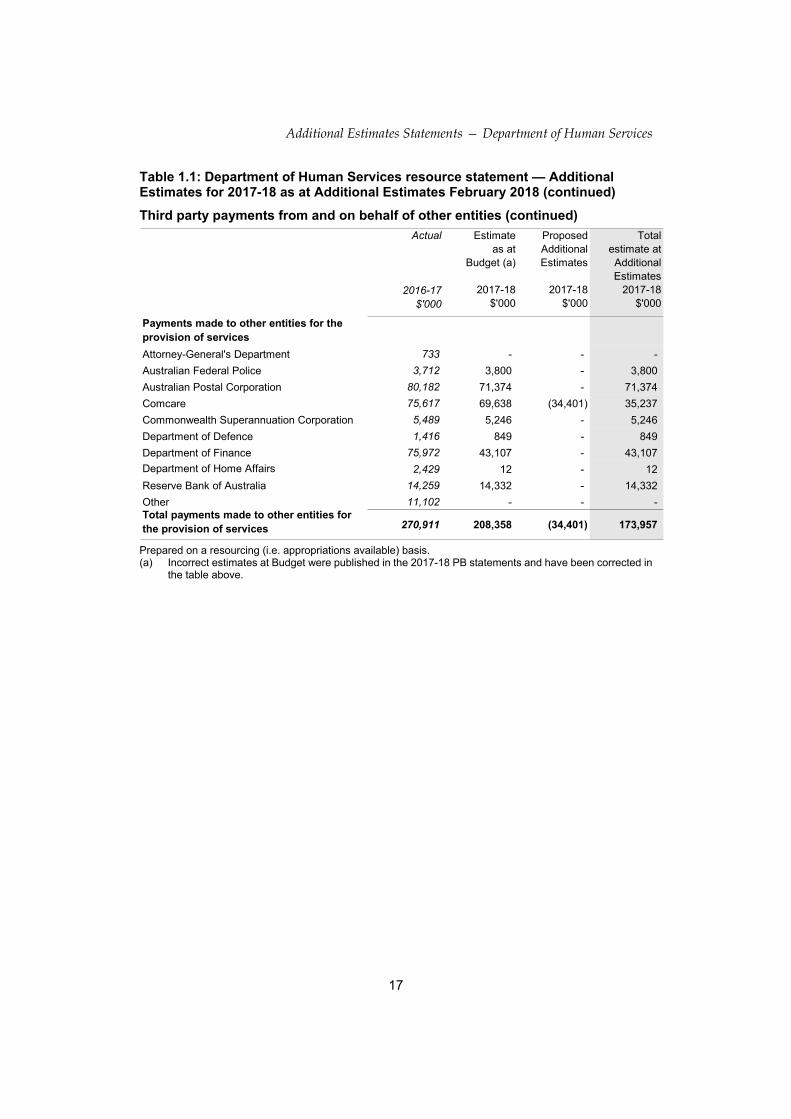
Table 1.1: Department of Human Services resource statement — Additional Estimates for 2017-18 as at Additional Estimates February 2018 (continued)
Third party payments from and on behalf of other entities (continued)
Actual
2016-17$'000
Estimateas at
Budget (a)
2017-18$'000
ProposedAdditionalEstimates
2017-18$'000
Totalestimate atAdditionalEstimates
2017-18$'000
Payments made to other entities for the provision of services
Attorney-General's Department 733 - - -
Australian Federal Police 3,712 3,800 - 3,800
Australian Postal Corporation 80,182 71,374 - 71,374
Comcare 75,617 69,638 (34,401) 35,237
Commonwealth Superannuation Corporation 5,489 5,246 - 5,246
Department of Defence 1,416 849 - 849
Department of Finance 75,972 43,107 - 43,107
Department of Home Affairs 2,429 12 - 12
Reserve Bank of Australia 14,259 14,332 - 14,332
Other 11,102 - - - Total payments made to other entities for the provision of services 270,911 208,358 (34,401) 173,957
Prepared on a resourcing (i.e. appropriations available) basis. (a) Incorrect estimates at Budget were published in the 2017-18 PB statements and have been corrected in
the table above.
Additional Estimates Statements — Department of Human Services
18
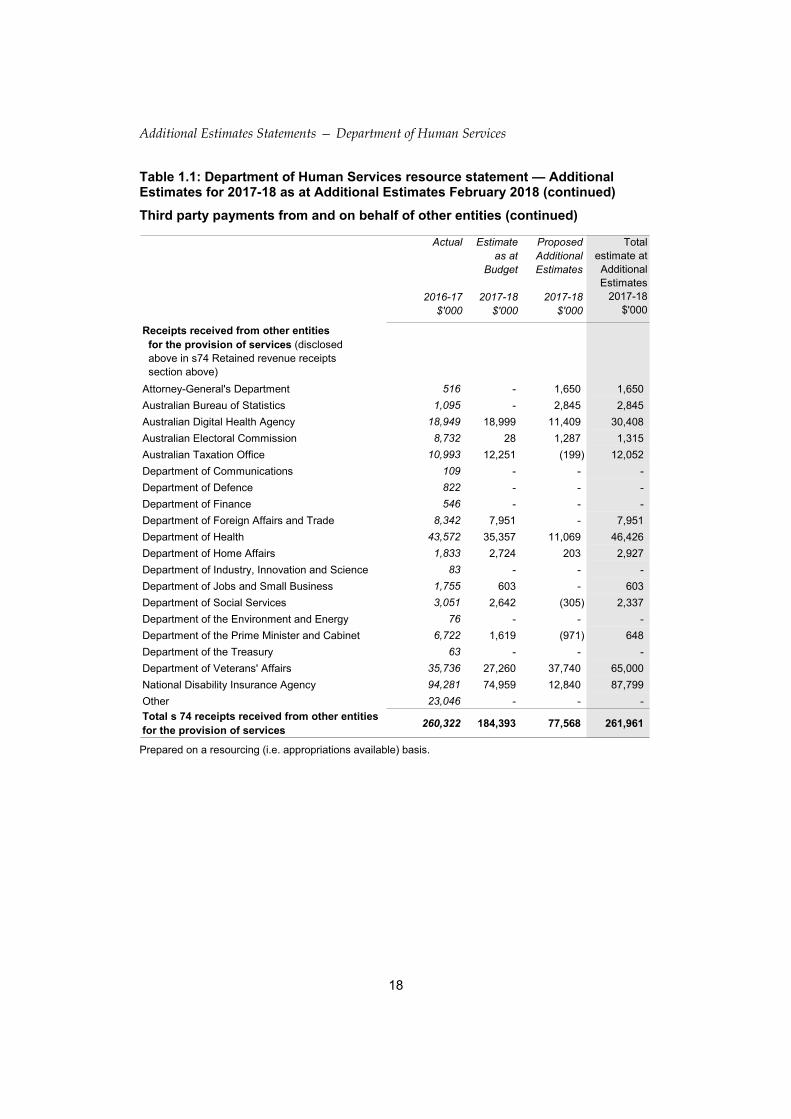
Table 1.1: Department of Human Services resource statement — Additional Estimates for 2017-18 as at Additional Estimates February 2018 (continued)
Third party payments from and on behalf of other entities (continued)
Actual
2016-17$'000
Estimateas at
Budget
2017-18$'000
ProposedAdditionalEstimates
2017-18$'000
Totalestimate atAdditionalEstimates
2017-18$'000
Receipts received from other entities for the provision of services (disclosed above in s74 Retained revenue receipts section above)
Attorney-General's Department 516 - 1,650 1,650
Australian Bureau of Statistics 1,095 - 2,845 2,845
Australian Digital Health Agency 18,949 18,999 11,409 30,408
Australian Electoral Commission 8,732 28 1,287 1,315
Australian Taxation Office 10,993 12,251 (199) 12,052
Department of Communications 109 - - -
Department of Defence 822 - - -
Department of Finance 546 - - -
Department of Foreign Affairs and Trade 8,342 7,951 - 7,951
Department of Health 43,572 35,357 11,069 46,426
Department of Home Affairs 1,833 2,724 203 2,927
Department of Industry, Innovation and Science 83 - - -
Department of Jobs and Small Business 1,755 603 - 603
Department of Social Services 3,051 2,642 (305) 2,337
Department of the Environment and Energy 76 - - -
Department of the Prime Minister and Cabinet 6,722 1,619 (971) 648
Department of the Treasury 63 - - -
Department of Veterans' Affairs 35,736 27,260 37,740 65,000
National Disability Insurance Agency 94,281 74,959 12,840 87,799
Other 23,046 - - -
Total s 74 receipts received from other entities for the provision of services
260,322 184,393 77,568 261,961
Prepared on a resourcing (i.e. appropriations available) basis.
Additional Estimates Statements — Department of Human Services
19
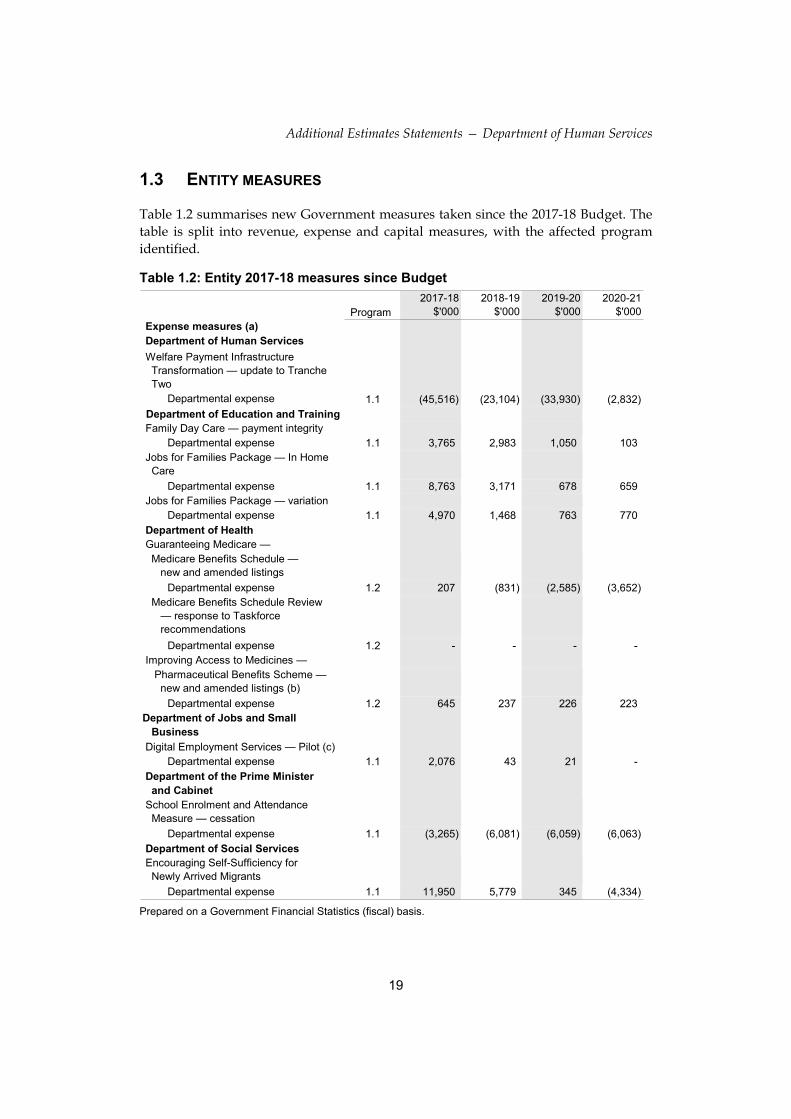
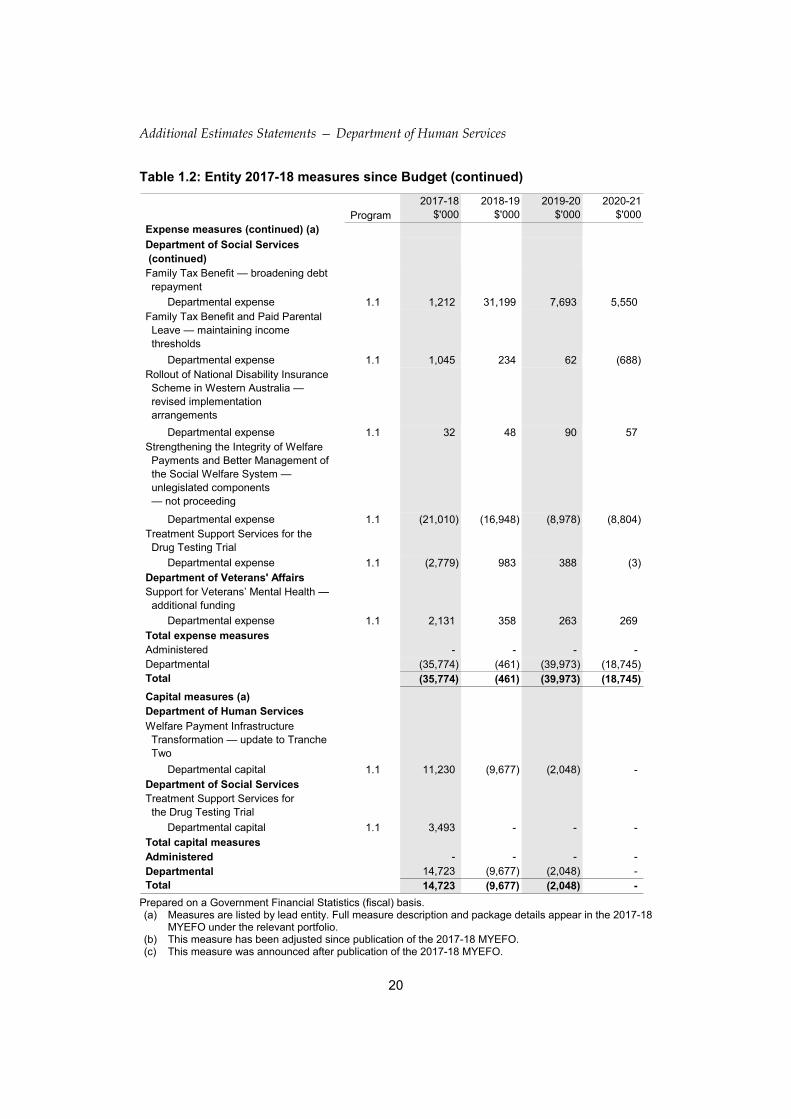
1.3 ENTITY MEASURES
Table 1.2 summarises new Government measures taken since the 2017-18 Budget. The table is split into revenue, expense and capital measures, with the affected program identified.
Table 1.2: Entity 2017-18 measures since Budget
Program 2017-18
$'000 2018-19
$'000 2019-20
$'000 2020-21
$'000 Expense measures (a) Department of Human Services
Welfare Payment Infrastructure Transformation — update to Tranche Two
Departmental expense 1.1 (45,516) (23,104) (33,930) (2,832) Department of Education and Training
Family Day Care — payment integrity Departmental expense 1.1 3,765 2,983 1,050 103
Jobs for Families Package — In Home Care
Departmental expense 1.1 8,763 3,171 678 659 Jobs for Families Package — variation
Departmental expense 1.1 4,970 1,468 763 770 Department of Health Guaranteeing Medicare — Medicare Benefits Schedule — new and amended listings
Departmental expense 1.2 207 (831) (2,585) (3,652) Medicare Benefits Schedule Review — response to Taskforce recommendations
Departmental expense 1.2 - - - - Improving Access to Medicines — Pharmaceutical Benefits Scheme — new and amended listings (b)
Departmental expense 1.2 645 237 226 223 Department of Jobs and Small Business
Digital Employment Services — Pilot (c) Departmental expense 1.1 2,076 43 21 -
Department of the Prime Minister and Cabinet School Enrolment and Attendance Measure — cessation
Departmental expense 1.1 (3,265) (6,081) (6,059) (6,063) Department of Social Services Encouraging Self-Sufficiency for Newly Arrived Migrants
Departmental expense 1.1 11,950 5,779 345 (4,334) Prepared on a Government Financial Statistics (fiscal) basis.
Additional Estimates Statements — Department of Human Services
20
Table 1.2: Entity 2017-18 measures since Budget (continued)
Program 2017-18
$'000 2018-19
$'000 2019-20
$'000 2020-21
$'000 Expense measures (continued) (a)
Department of Social Services (continued) Family Tax Benefit — broadening debt repayment
Departmental expense 1.1 1,212 31,199 7,693 5,550 Family Tax Benefit and Paid Parental Leave — maintaining income thresholds
Departmental expense 1.1 1,045 234 62 (688) Rollout of National Disability Insurance Scheme in Western Australia — revised implementation arrangements
Departmental expense 1.1 32 48 90 57 Strengthening the Integrity of Welfare Payments and Better Management of the Social Welfare System — unlegislated components — not proceeding
Departmental expense 1.1 (21,010) (16,948) (8,978) (8,804) Treatment Support Services for the Drug Testing Trial
Departmental expense 1.1 (2,779) 983 388 (3) Department of Veterans' Affairs Support for Veterans’ Mental Health — additional funding
Departmental expense 1.1 2,131 358 263 269 Total expense measures Administered - - - - Departmental (35,774) (461) (39,973) (18,745) Total (35,774) (461) (39,973) (18,745)
Capital measures (a) Department of Human Services
Welfare Payment Infrastructure Transformation — update to Tranche Two
Departmental capital 1.1 11,230 (9,677) (2,048) - Department of Social Services Treatment Support Services for the Drug Testing Trial
Departmental capital 1.1 3,493 - - - Total capital measures Administered - - - - Departmental 14,723 (9,677) (2,048) - Total 14,723 (9,677) (2,048) - Prepared on a Government Financial Statistics (fiscal) basis. (a) Measures are listed by lead entity. Full measure description and package details appear in the 2017-18
MYEFO under the relevant portfolio. (b) This measure has been adjusted since publication of the 2017-18 MYEFO. (c) This measure was announced after publication of the 2017-18 MYEFO.

Additional Estimates Statements — Department of Human Services
21
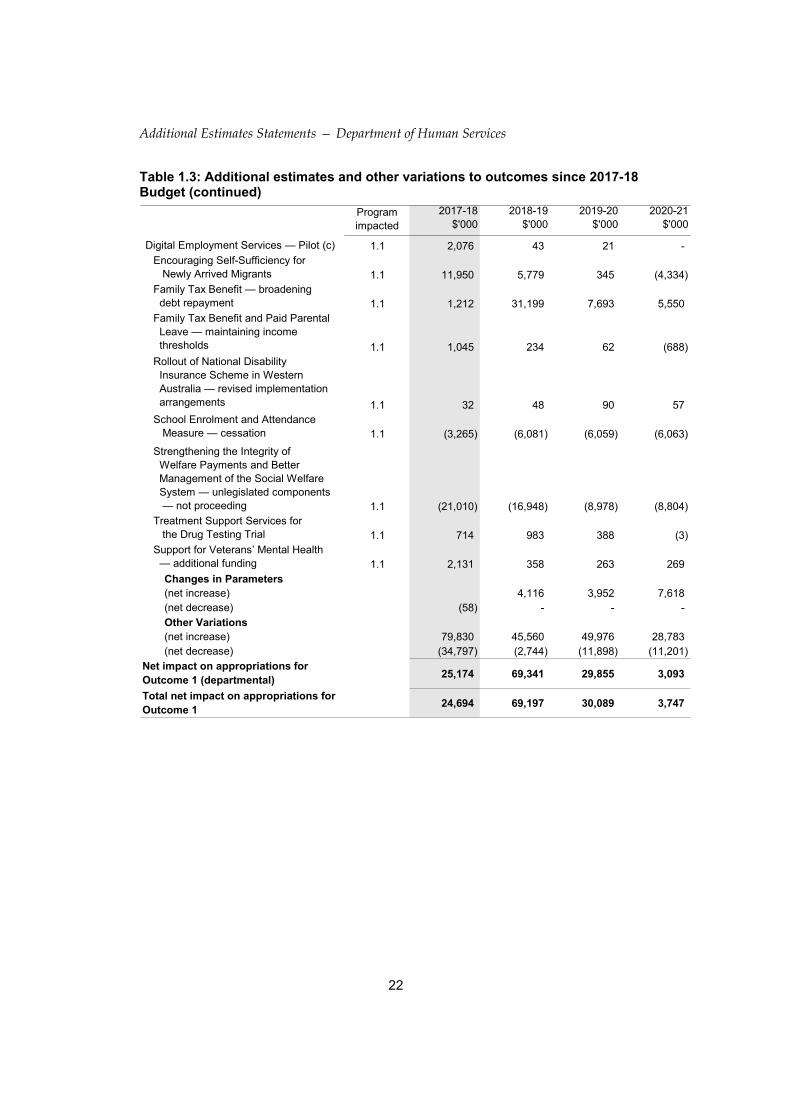
1.4 ADDITIONAL ESTIMATES, RESOURCING AND VARIATIONS TO
OUTCOMES
The following table details changes to resourcing for the Department at Additional Estimates, by outcome. Table 1.3 details the Additional Estimates resulting from new measures and other variations since the 2017-18 Budget in Appropriation Bills Nos. 3 and 4.
Table 1.3: Additional estimates and other variations to outcomes since 2017-18 Budget
Program impacted
2017-18$'000
2018-19$'000
2019-20$'000
2020-21$'000
Outcome 1Administered
Annual appropriationsOther Variations(net increase) 1.3 - - 6 7 (net decrease) 1.3 (13) (4) - -
Special appropriations (including Special Accounts)Other Variations(net increase) 1.3 - - 228 647 (net decrease) 1.3 (467) (140) - -
Net impact on appropriations for Outcome 1 (administered)
(480) (144) 234 654
DepartmentalAnnual appropriationsMeasures
Welfare Payment Infrastructure Transformation — update to Tranche Two 1.1 (34,286) (1,473) (5,713) (5,746)
Family Day Care — payment integrity 1.1 3,765 2,983 1,050 103Jobs for Families Package — In Home Care 1.1 8,763 3,171 678 659Jobs for Families Package — variation 1.1 4,970 1,468 763 770Guaranteeing Medicare —
Medicare Benefits Schedule — new and amended listings 1.2 207 (831) (2,585) (3,652)
Medicare Benefits Schedule Review — response to Taskforce recommendations 1.2 1,250 1,239 (419) (448)Improving Access to Medicines —
Pharmaceutical Benefits Scheme — new and amended listings 1.2 645 237 226 223
Additional Estimates Statements — Department of Human Services
22
Table 1.3: Additional estimates and other variations to outcomes since 2017-18 Budget (continued)
Program impacted
2017-18$'000
2018-19$'000
2019-20$'000
2020-21$'000
Digital Employment Services — Pilot (c) 1.1 2,076 43 21 -Encouraging Self-Sufficiency for Newly Arrived Migrants 1.1 11,950 5,779 345 (4,334)Family Tax Benefit — broadening debt repayment 1.1 1,212 31,199 7,693 5,550Family Tax Benefit and Paid Parental Leave — maintaining income thresholds 1.1 1,045 234 62 (688)Rollout of National Disability Insurance Scheme in Western Australia — revised implementation arrangements 1.1 32 48 90 57School Enrolment and Attendance Measure — cessation 1.1 (3,265) (6,081) (6,059) (6,063)
Strengthening the Integrity of Welfare Payments and Better Management of the Social Welfare System — unlegislated components — not proceeding 1.1 (21,010) (16,948) (8,978) (8,804)Treatment Support Services for the Drug Testing Trial 1.1 714 983 388 (3)Support for Veterans’ Mental Health — additional funding 1.1 2,131 358 263 269
Changes in Parameters(net increase) 4,116 3,952 7,618 (net decrease) (58) - - - Other Variations(net increase) 79,830 45,560 49,976 28,783 (net decrease) (34,797) (2,744) (11,898) (11,201)
Net impact on appropriations for Outcome 1 (departmental)
25,174 69,341 29,855 3,093
Total net impact on appropriations for Outcome 1
24,694 69,197 30,089 3,747
Additional Estimates Statements — Department of Human Services
23
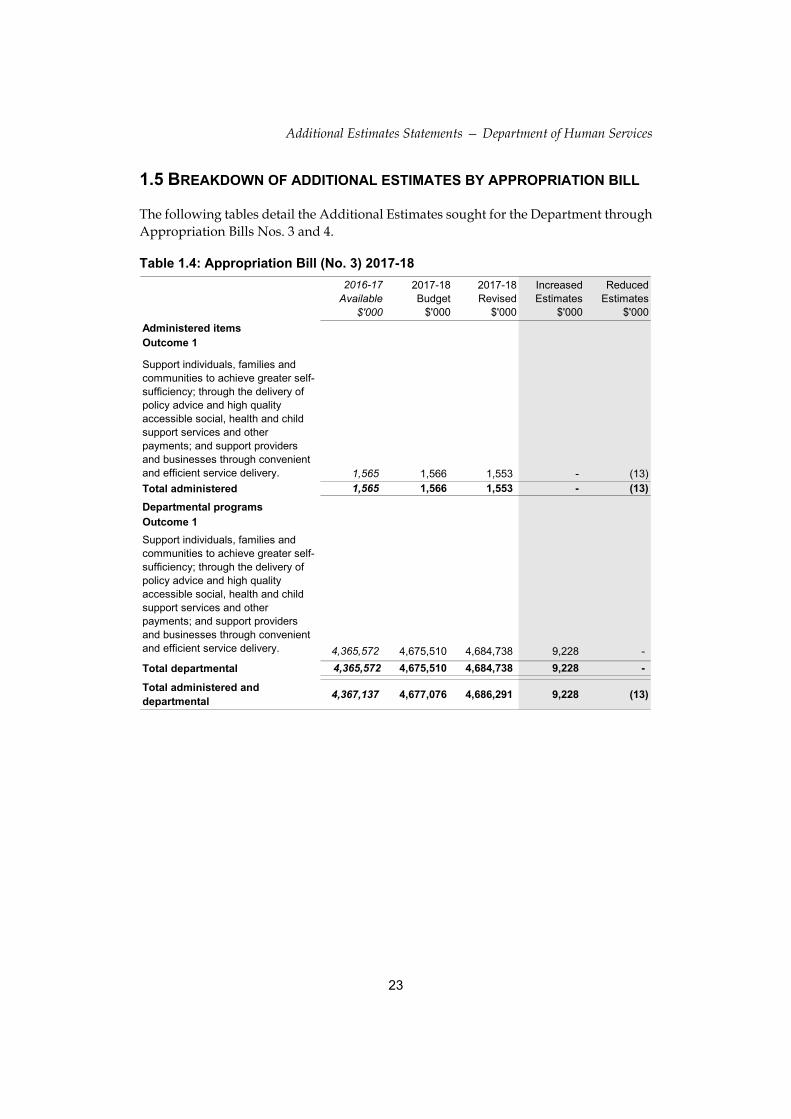
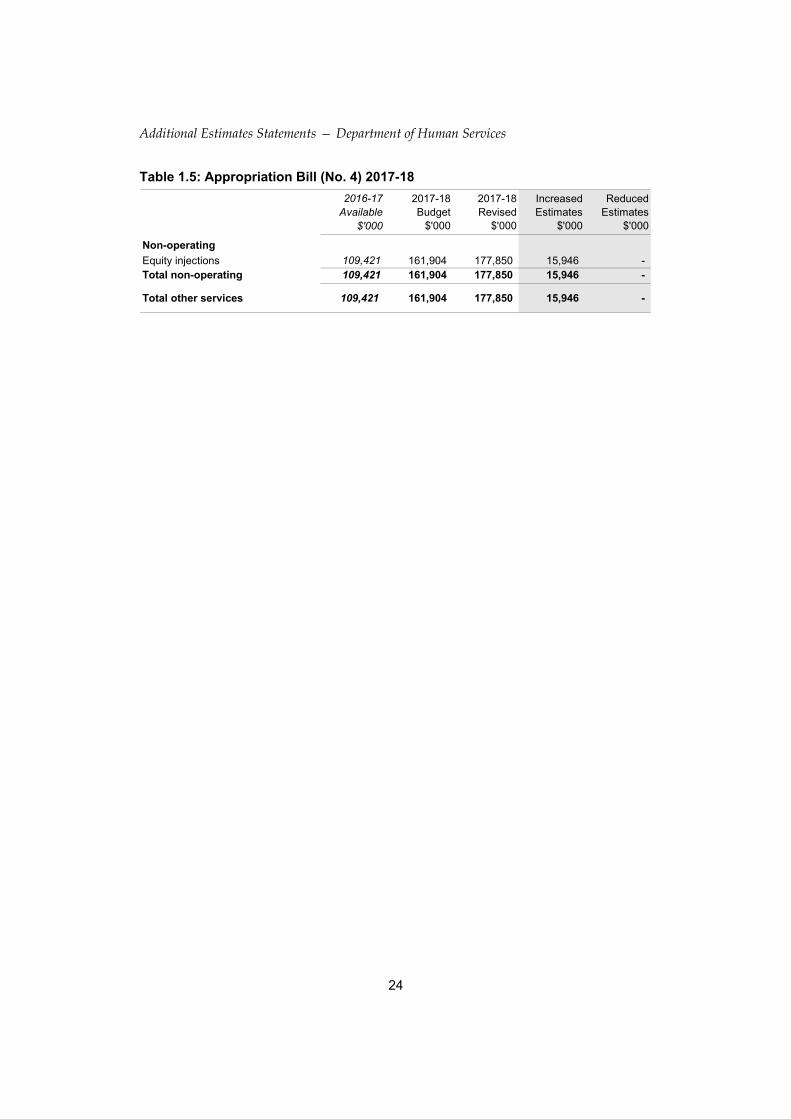
1.5 BREAKDOWN OF ADDITIONAL ESTIMATES BY APPROPRIATION BILL
The following tables detail the Additional Estimates sought for the Department through Appropriation Bills Nos. 3 and 4.
Table 1.4: Appropriation Bill (No. 3) 2017-18
2016-17Available
$'000
2017-18Budget
$'000
2017-18Revised
$'000
IncreasedEstimates
$'000
ReducedEstimates
$'000
Administered itemsOutcome 1
Support individuals, families and communities to achieve greater self-sufficiency; through the delivery of policy advice and high quality accessible social, health and child support services and other payments; and support providers and businesses through convenient and efficient service delivery. 1,565 1,566 1,553 - (13)
Total administered 1,565 1,566 1,553 - (13)
Departmental programs
Outcome 1
Support individuals, families and communities to achieve greater self-sufficiency; through the delivery of policy advice and high quality accessible social, health and child support services and other payments; and support providers and businesses through convenient and efficient service delivery. 4,365,572 4,675,510 4,684,738 9,228 -
Total departmental 4,365,572 4,675,510 4,684,738 9,228 -
Total administered and departmental
4,367,137 4,677,076 4,686,291 9,228 (13)
Additional Estimates Statements — Department of Human Services
24
Table 1.5: Appropriation Bill (No. 4) 2017-18
2016-17Available
$'000
2017-18Budget
$'000
2017-18Revised
$'000
IncreasedEstimates
$'000
ReducedEstimates
$'000
Non-operating
Equity injections 109,421 161,904 177,850 15,946 -Total non-operating 109,421 161,904 177,850 15,946 -
Total other services 109,421 161,904 177,850 15,946 -
Additional Estimates Statements — Department of Human Services
25
Section 2: Revisions to outcomes and planned performance
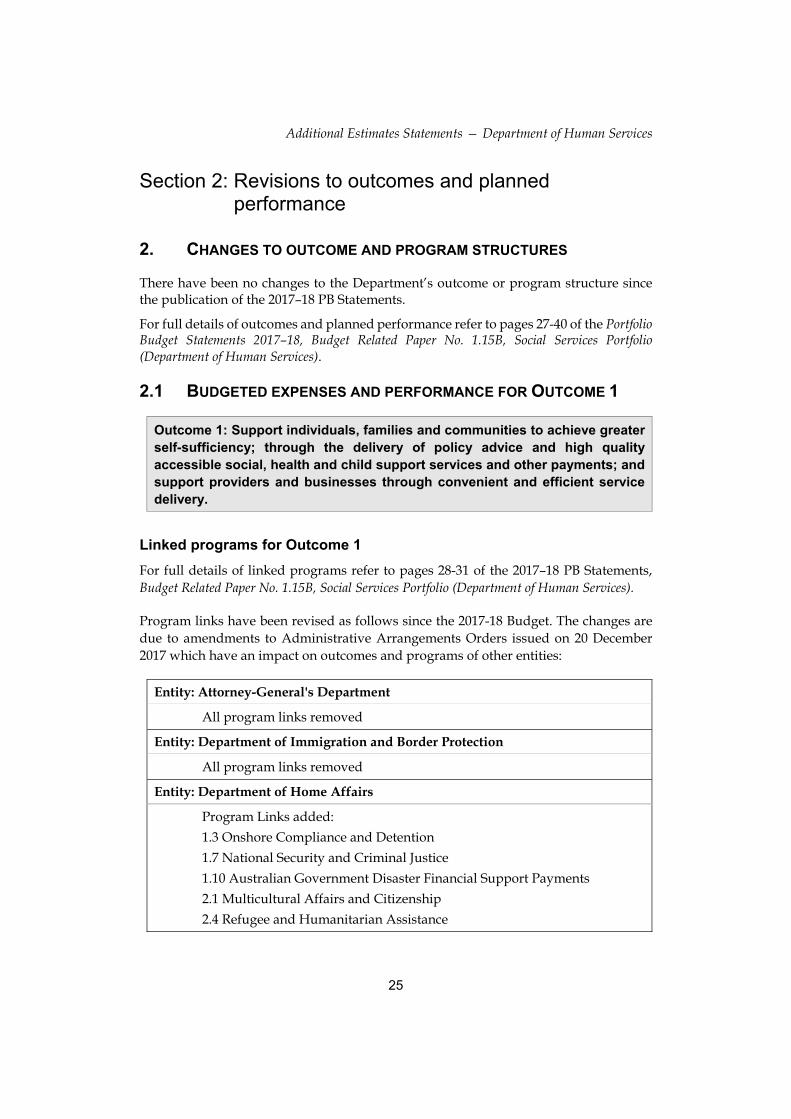
2. CHANGES TO OUTCOME AND PROGRAM STRUCTURES
There have been no changes to the Department’s outcome or program structure since the publication of the 2017–18 PB Statements.
For full details of outcomes and planned performance refer to pages 27-40 of the Portfolio Budget Statements 2017–18, Budget Related Paper No. 1.15B, Social Services Portfolio (Department of Human Services).
2.1 BUDGETED EXPENSES AND PERFORMANCE FOR OUTCOME 1
Outcome 1: Support individuals, families and communities to achieve greater self-sufficiency; through the delivery of policy advice and high quality accessible social, health and child support services and other payments; and support providers and businesses through convenient and efficient service delivery.
Linked programs for Outcome 1
For full details of linked programs refer to pages 28-31 of the 2017–18 PB Statements, Budget Related Paper No. 1.15B, Social Services Portfolio (Department of Human Services).
Program links have been revised as follows since the 2017-18 Budget. The changes are due to amendments to Administrative Arrangements Orders issued on 20 December 2017 which have an impact on outcomes and programs of other entities:
Entity: Attorney-General's Department
All program links removed
Entity: Department of Immigration and Border Protection
All program links removed
Entity: Department of Home Affairs
Program Links added:
1.3 Onshore Compliance and Detention
1.7 National Security and Criminal Justice
1.10 Australian Government Disaster Financial Support Payments
2.1 Multicultural Affairs and Citizenship
2.4 Refugee and Humanitarian Assistance
Additional Estimates Statements — Department of Human Services
26
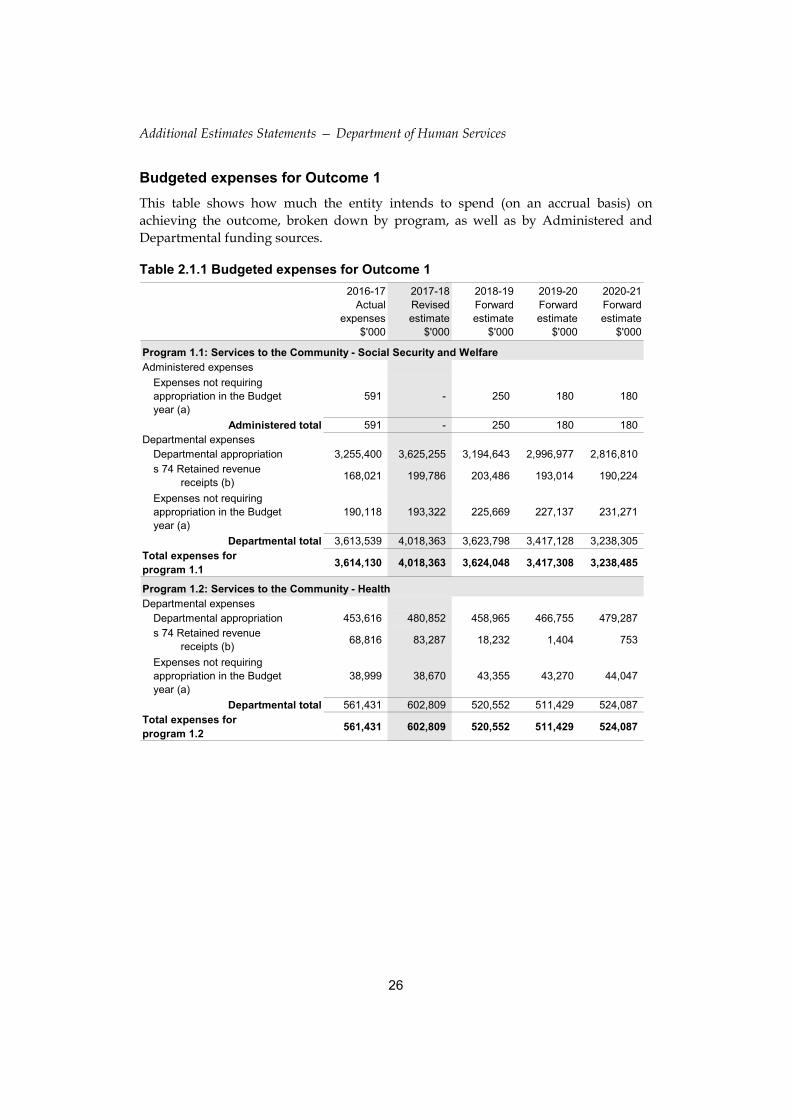
Budgeted expenses for Outcome 1
This table shows how much the entity intends to spend (on an accrual basis) on achieving the outcome, broken down by program, as well as by Administered and Departmental funding sources.
Table 2.1.1 Budgeted expenses for Outcome 1
2016-17Actual
expenses$'000
2017-18Revisedestimate
$'000
2018-19Forwardestimate
$'000
2019-20Forwardestimate
$'000
2020-21Forwardestimate
$'000
Administered expenses
Expenses not requiring appropriation in the Budget year (a)
591 - 250 180 180
Administered total 591 - 250 180 180 Departmental expenses
Departmental appropriation 3,255,400 3,625,255 3,194,643 2,996,977 2,816,810 s 74 Retained revenue receipts (b)
168,021 199,786 203,486 193,014 190,224
Expenses not requiring appropriation in the Budget year (a)
190,118 193,322 225,669 227,137 231,271
Departmental total 3,613,539 4,018,363 3,623,798 3,417,128 3,238,305 Total expenses for program 1.1
3,614,130 4,018,363 3,624,048 3,417,308 3,238,485
Departmental expensesDepartmental appropriation 453,616 480,852 458,965 466,755 479,287 s 74 Retained revenue receipts (b)
68,816 83,287 18,232 1,404 753
Expenses not requiring appropriation in the Budget year (a)
38,999 38,670 43,355 43,270 44,047
Departmental total 561,431 602,809 520,552 511,429 524,087 Total expenses for program 1.2
561,431 602,809 520,552 511,429 524,087
Program 1.2: Services to the Community - Health
Program 1.1: Services to the Community - Social Security and Welfare
Additional Estimates Statements — Department of Human Services
27
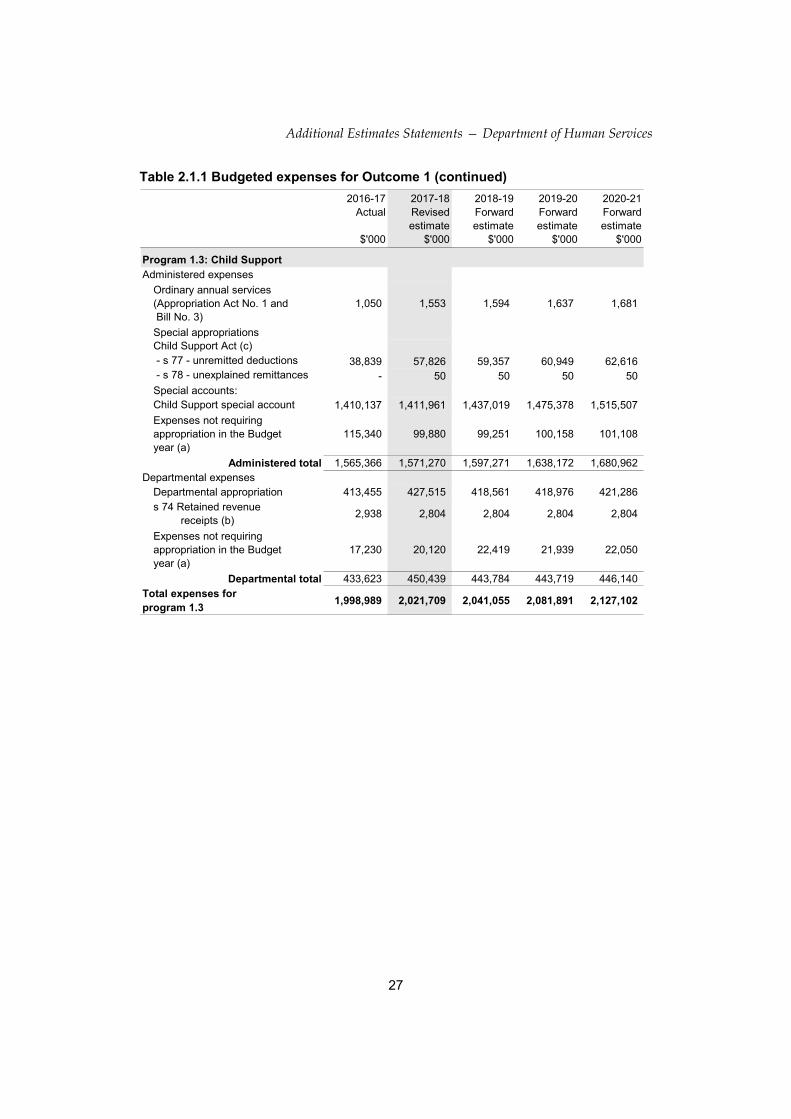
Table 2.1.1 Budgeted expenses for Outcome 1 (continued)
2016-17Actual
$'000
2017-18Revisedestimate
$'000
2018-19Forwardestimate
$'000
2019-20Forwardestimate
$'000
2020-21Forwardestimate
$'000
Administered expenses
Ordinary annual services (Appropriation Act No. 1 and Bill No. 3)
1,050 1,553 1,594 1,637 1,681
Special appropriationsChild Support Act (c) - s 77 - unremitted deductions 38,839 57,826 59,357 60,949 62,616 - s 78 - unexplained remittances - 50 50 50 50 Special accounts:Child Support special account 1,410,137 1,411,961 1,437,019 1,475,378 1,515,507
Expenses not requiring appropriation in the Budget year (a)
115,340 99,880 99,251 100,158 101,108
Administered total 1,565,366 1,571,270 1,597,271 1,638,172 1,680,962 Departmental expenses
Departmental appropriation 413,455 427,515 418,561 418,976 421,286 s 74 Retained revenue receipts (b)
2,938 2,804 2,804 2,804 2,804
Expenses not requiring appropriation in the Budget year (a)
17,230 20,120 22,419 21,939 22,050
Departmental total 433,623 450,439 443,784 443,719 446,140 Total expenses for program 1.3
1,998,989 2,021,709 2,041,055 2,081,891 2,127,102
Program 1.3: Child Support
Additional Estimates Statements — Department of Human Services
28
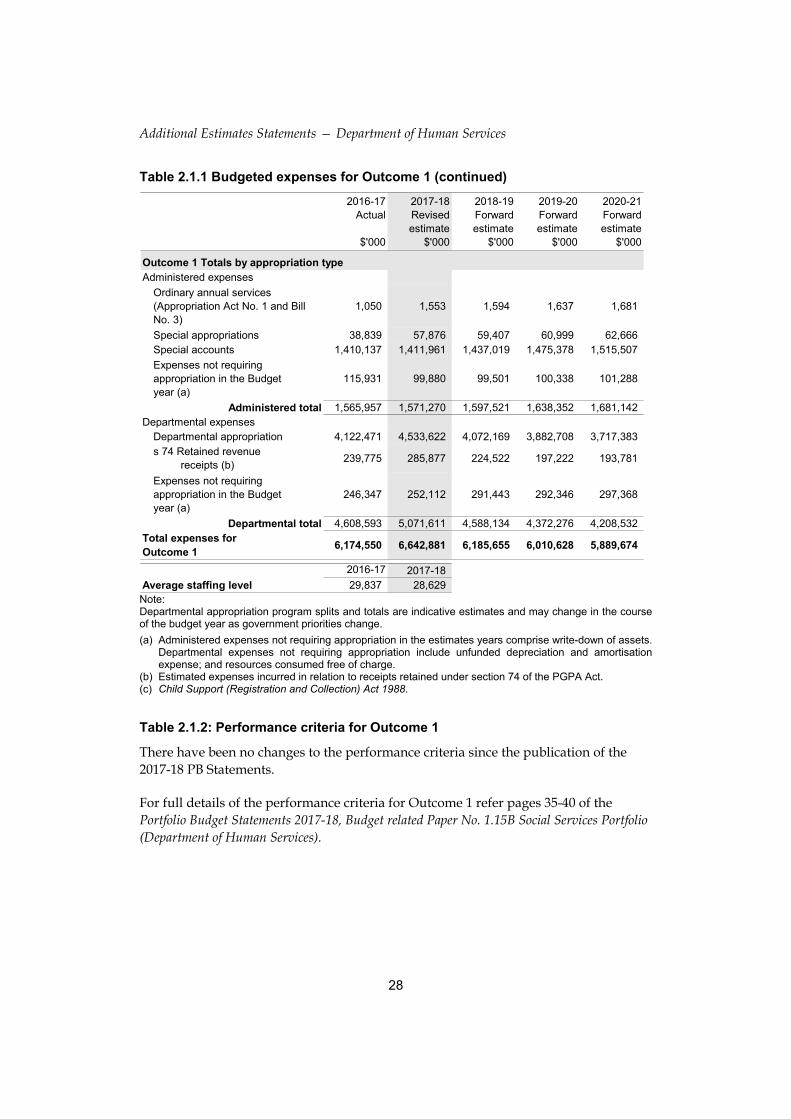
Table 2.1.1 Budgeted expenses for Outcome 1 (continued)
2016-17Actual
$'000
2017-18Revisedestimate
$'000
2018-19Forwardestimate
$'000
2019-20Forwardestimate
$'000
2020-21Forwardestimate
$'000
Administered expenses
Ordinary annual services (Appropriation Act No. 1 and Bill No. 3)
1,050 1,553 1,594 1,637 1,681
Special appropriations 38,839 57,876 59,407 60,999 62,666 Special accounts 1,410,137 1,411,961 1,437,019 1,475,378 1,515,507
Expenses not requiring appropriation in the Budget year (a)
115,931 99,880 99,501 100,338 101,288
Administered total 1,565,957 1,571,270 1,597,521 1,638,352 1,681,142 Departmental expenses
Departmental appropriation 4,122,471 4,533,622 4,072,169 3,882,708 3,717,383 s 74 Retained revenue receipts (b)
239,775 285,877 224,522 197,222 193,781
Expenses not requiring appropriation in the Budget year (a)
246,347 252,112 291,443 292,346 297,368
Departmental total 4,608,593 5,071,611 4,588,134 4,372,276 4,208,532 Total expenses forOutcome 1
6,174,550 6,642,881 6,185,655 6,010,628 5,889,674
2016-17 2017-18Average staffing level 29,837 28,629
Outcome 1 Totals by appropriation type
Note: Departmental appropriation program splits and totals are indicative estimates and may change in the course of the budget year as government priorities change.
(a) Administered expenses not requiring appropriation in the estimates years comprise write-down of assets. Departmental expenses not requiring appropriation include unfunded depreciation and amortisation expense; and resources consumed free of charge.
(b) Estimated expenses incurred in relation to receipts retained under section 74 of the PGPA Act. (c) Child Support (Registration and Collection) Act 1988.
Table 2.1.2: Performance criteria for Outcome 1
There have been no changes to the performance criteria since the publication of the 2017-18 PB Statements.
For full details of the performance criteria for Outcome 1 refer pages 35-40 of the Portfolio Budget Statements 2017-18, Budget related Paper No. 1.15B Social Services Portfolio (Department of Human Services).
Additional Estimates Statements — Department of Human Services
29
Section 3: Special account flows and budgeted financial statements
3.1 SPECIAL ACCOUNT FLOWS
Estimates of special account flows
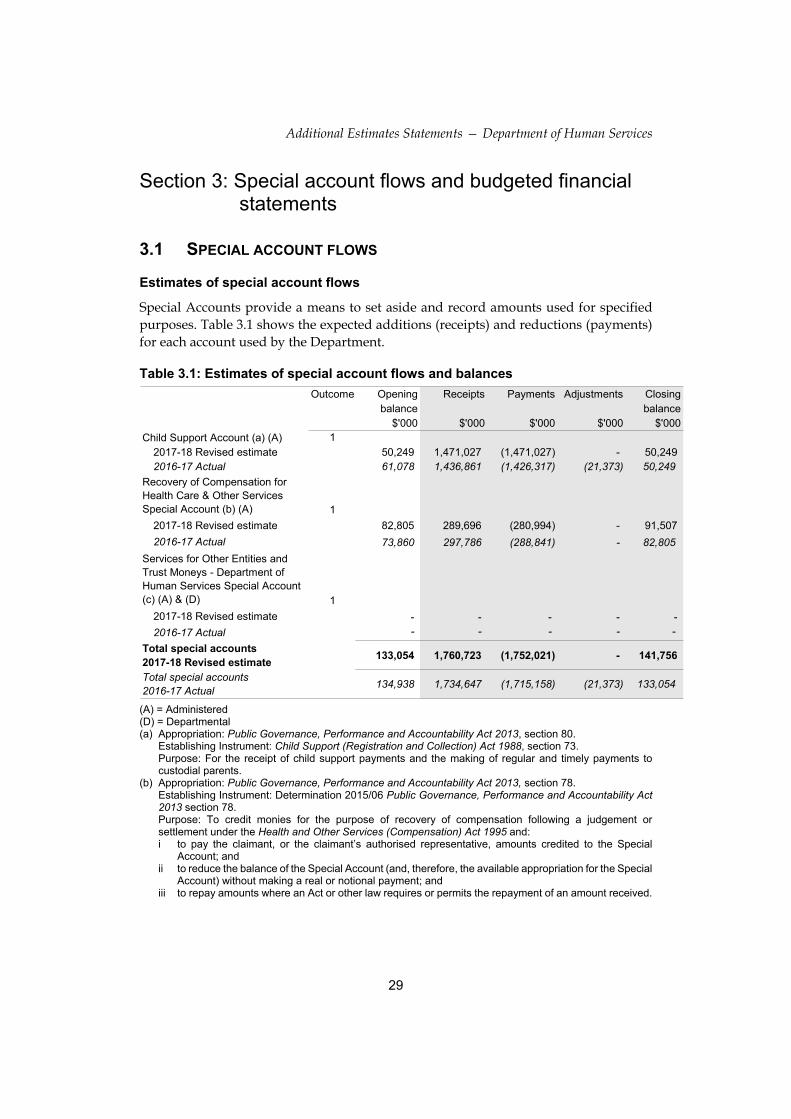
Special Accounts provide a means to set aside and record amounts used for specified purposes. Table 3.1 shows the expected additions (receipts) and reductions (payments) for each account used by the Department.
Table 3.1: Estimates of special account flows and balances
Outcome Opening Receipts Payments Adjustments Closingbalance balance
$'000 $'000 $'000 $'000 $'000Child Support Account (a) (A) 1
2017-18 Revised estimate 50,249 1,471,027 (1,471,027) - 50,2492016-17 Actual 61,078 1,436,861 (1,426,317) (21,373) 50,249
Recovery of Compensation for Health Care & Other Services Special Account (b) (A) 1
2017-18 Revised estimate 82,805 289,696 (280,994) - 91,507
2016-17 Actual 73,860 297,786 (288,841) - 82,805
Services for Other Entities and Trust Moneys - Department of Human Services Special Account (c) (A) & (D) 1
2017-18 Revised estimate - - - - -
2016-17 Actual - - - - -
Total special accounts 2017-18 Revised estimate
133,054 1,760,723 (1,752,021) - 141,756
Total special accounts 2016-17 Actual
134,938 1,734,647 (1,715,158) (21,373) 133,054
(A) = Administered (D) = Departmental (a) Appropriation: Public Governance, Performance and Accountability Act 2013, section 80.
Establishing Instrument: Child Support (Registration and Collection) Act 1988, section 73. Purpose: For the receipt of child support payments and the making of regular and timely payments to custodial parents.
(b) Appropriation: Public Governance, Performance and Accountability Act 2013, section 78. Establishing Instrument: Determination 2015/06 Public Governance, Performance and Accountability Act 2013 section 78. Purpose: To credit monies for the purpose of recovery of compensation following a judgement or settlement under the Health and Other Services (Compensation) Act 1995 and: i to pay the claimant, or the claimant’s authorised representative, amounts credited to the Special
Account; and ii to reduce the balance of the Special Account (and, therefore, the available appropriation for the Special
Account) without making a real or notional payment; and iii to repay amounts where an Act or other law requires or permits the repayment of an amount received.
Additional Estimates Statements — Department of Human Services
30
Table 3.1: Estimates of special account flows and balances (continued)
(c) Appropriation: Public Governance, Performance and Accountability Act 2013, section 78 Establishing Instrument: Determination 2011/13 Public Governance, Performance and Accountability Act 2013 section 78. Purpose: To credit and debit monies for the purpose of: i to disburse amounts held on trust or otherwise for the benefit of a person other than the
Commonwealth; ii to disburse amounts in connection with services performed on behalf of other governments and bodies
that are non-corporate Commonwealth entities; iii to repay amounts where an Act or other law requires or permits the repayment of an amount received;
and iv to reduce the balance of the Special Account (and, therefore, the available appropriation for the Special
Account) without making a real or notional payment. v This account has a nil balance. There were no transactions during 2016-17 or 2017-18.
Additional Estimates Statements — Department of Human Services
31
3.2 BUDGETED FINANCIAL STATEMENTS
3.2.1 Analysis of budgeted financial statements
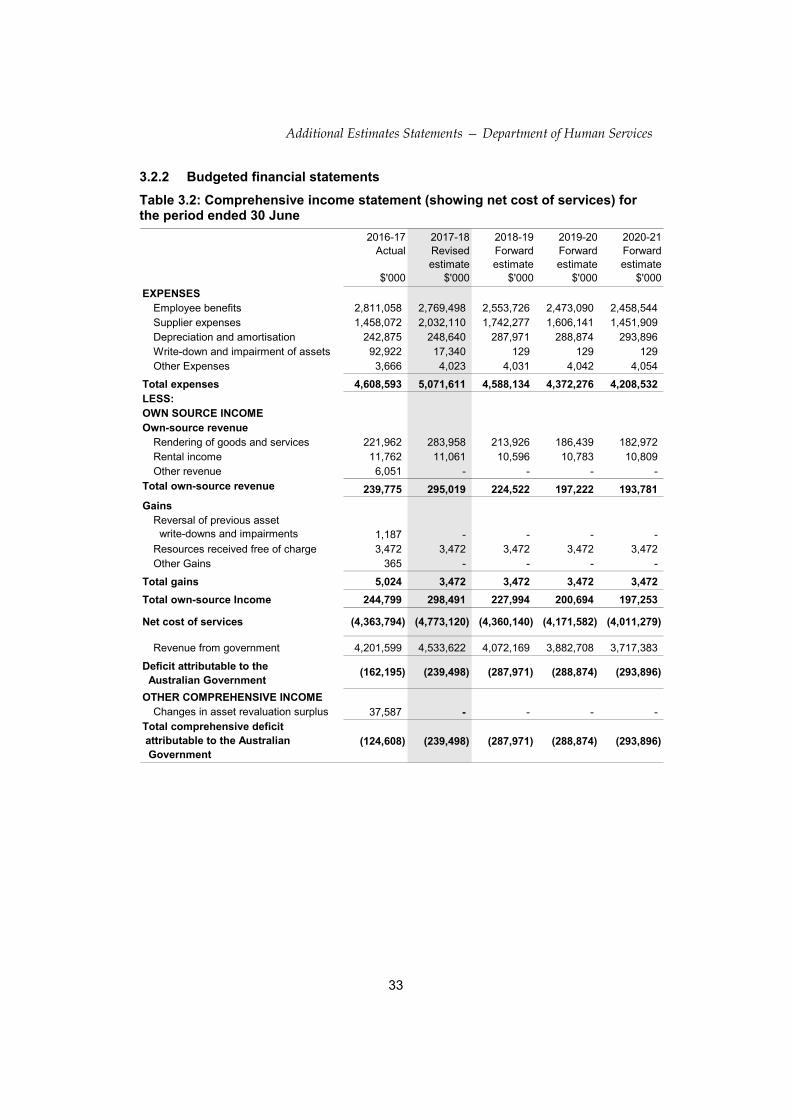
Departmental comprehensive income statement (Table 3.2)
Since the 2017–18 Budget, revenue from government in 2017-18 has increased by $34.8 million.
Since Budget, estimates of own-source income have increased by $79.3 million mainly reflecting changes in revenue from service agreements with other entities including the Australian Digital Health Agency, the Departments of Health and Veterans’ Affairs; and the National Disability Insurance Agency.
Total expenses in 2017–18 have increased by $84.1 million since the 2017-18 Budget, mainly reflecting the impact of measures, other variations and own source income as noted above, and reduced depreciation expense following a revision of the useful lives of assets and impairments.
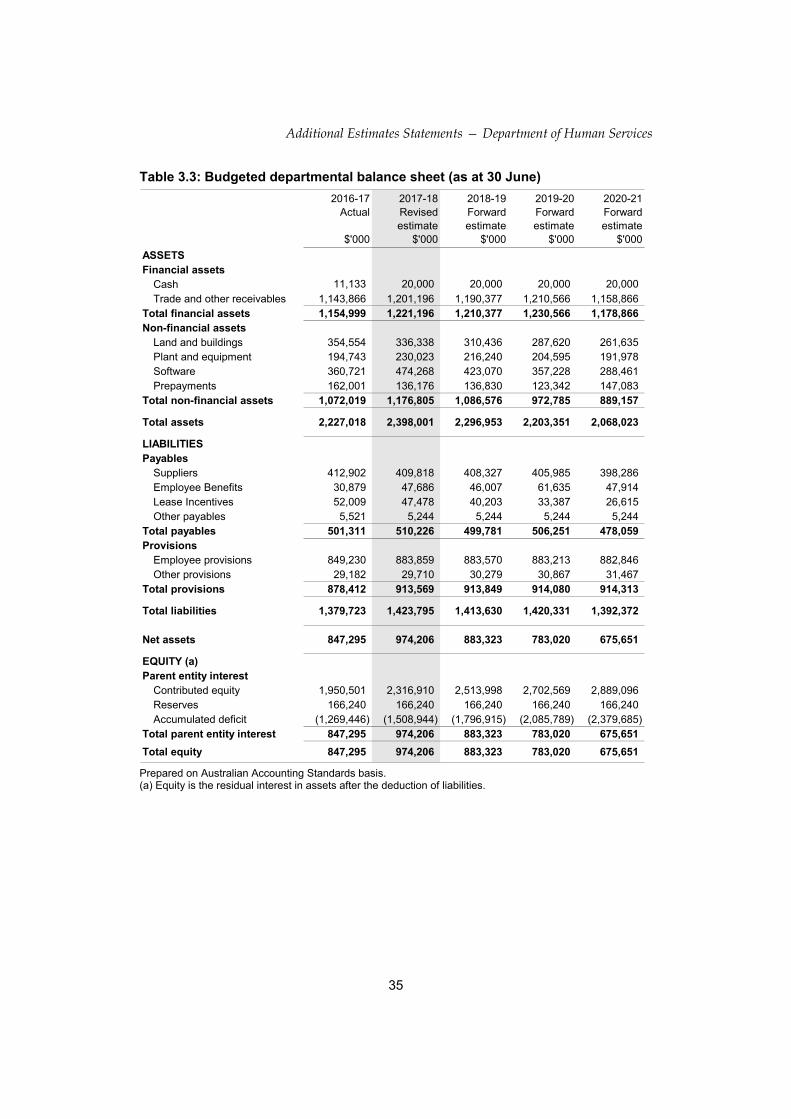
Departmental balance sheet (Table 3.3)
The budgeted net asset position at 30 June 2018 has increased by $141.0 million since the 2017-18 Budget to $974.2 million. The revised estimates take into account the 2016–17 operating result and the flow on effect of the audited financial accounts as at 30 June 2017.
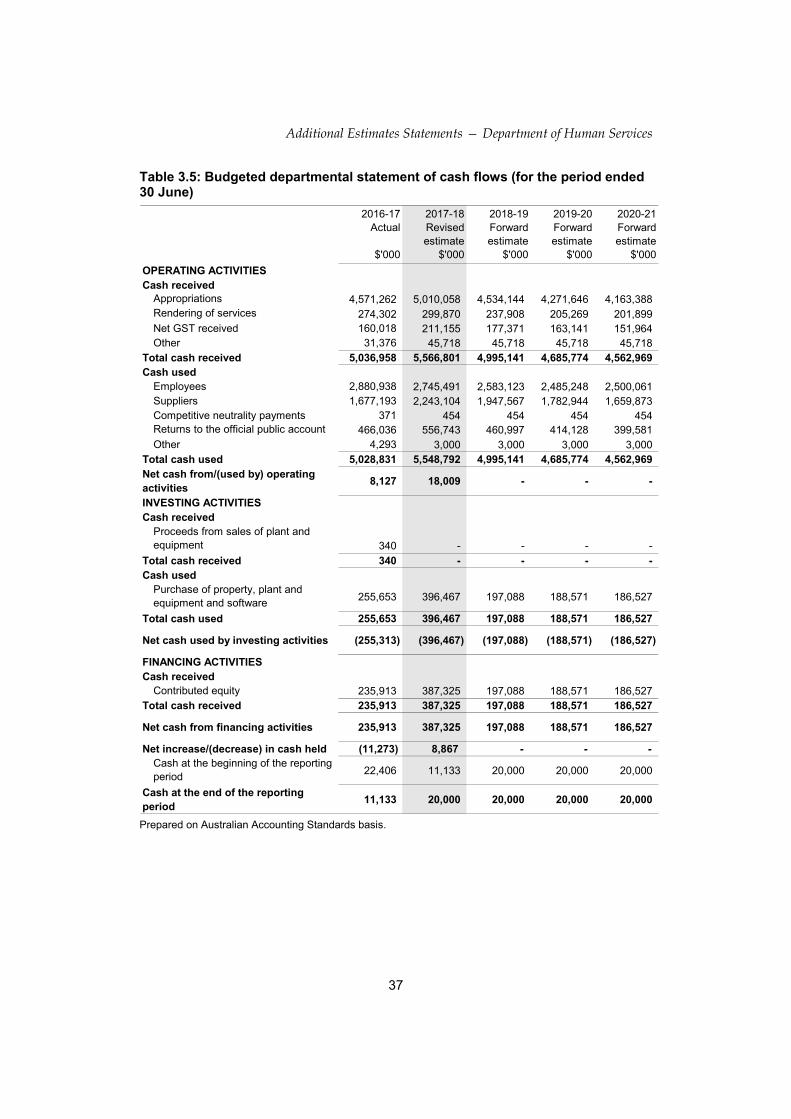
Departmental statement of cash flows (Table 3.5)
Since the 2017-18 Budget, departmental cash receipts and payments have been affected by changes in changes in appropriation; own source revenue; expenses and equity injections.
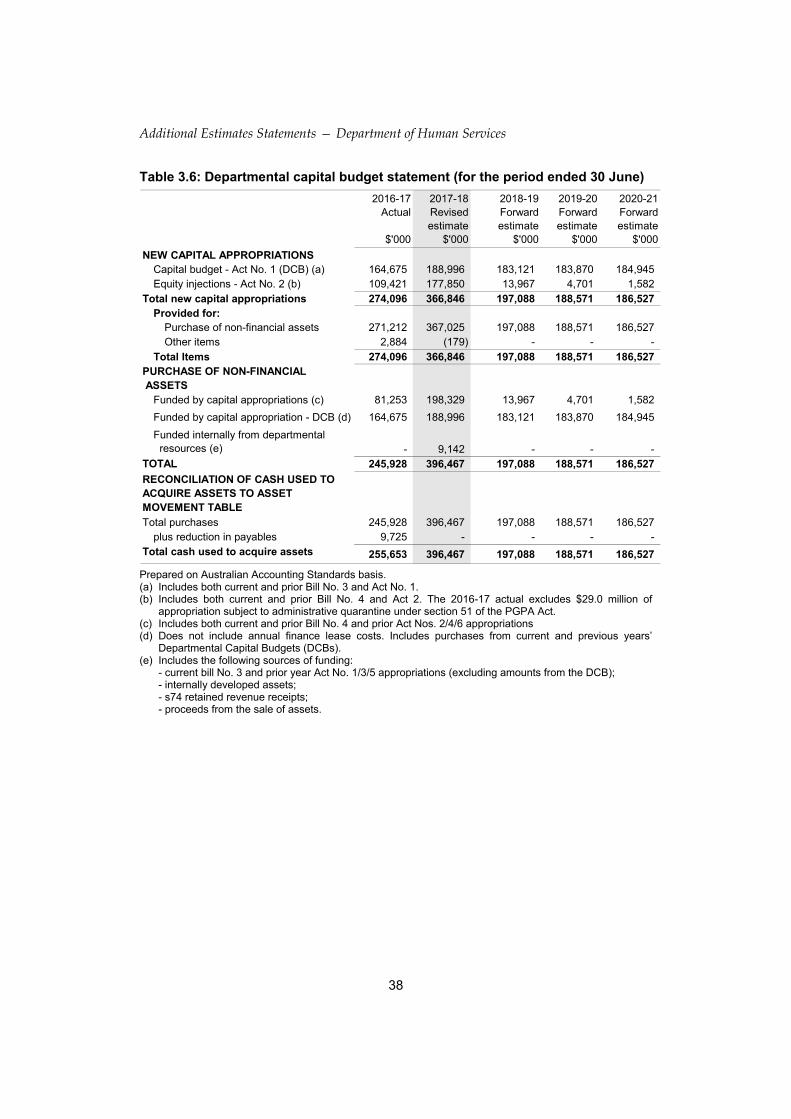
Departmental Capital Budget Statement (Table 3.6)
Since the 2017-18 Budget, equity injection funding has increased by $15.9 million to $177.9 million, through new measures ($14.7 million) and other variations ($1.2 million).
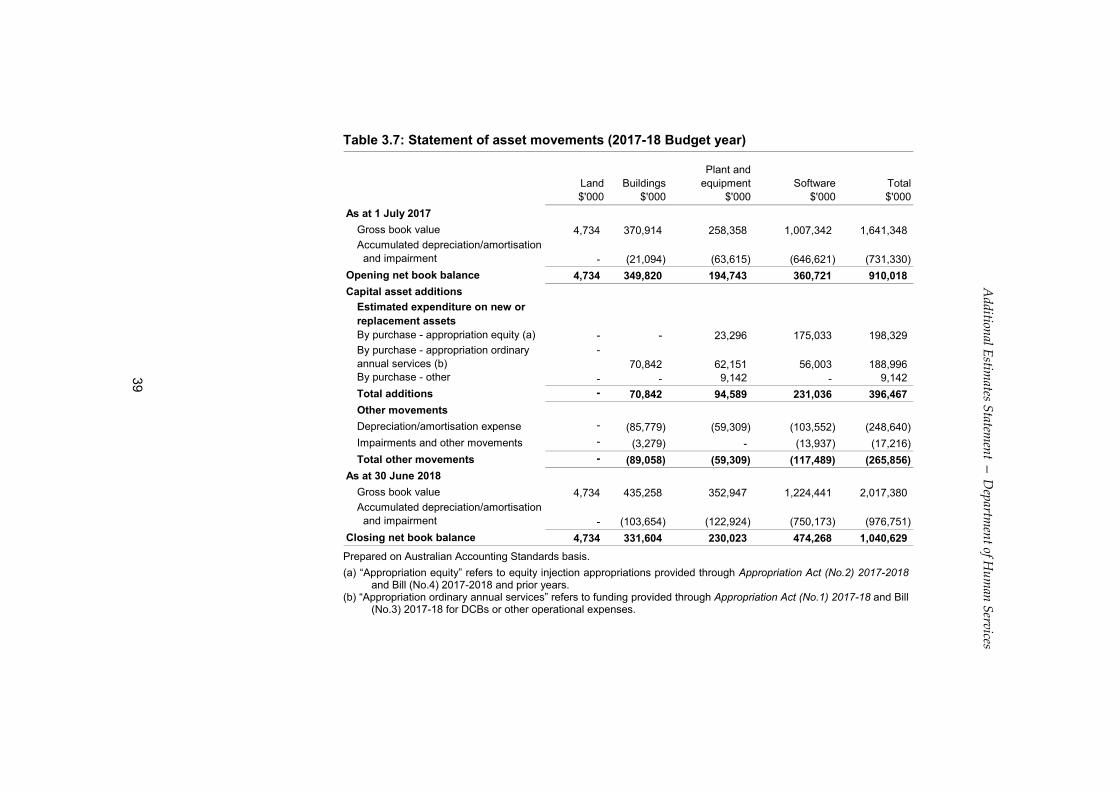
Statement of departmental asset movements (Table 3.7)
The estimated net book value of land, buildings, property plant and equipment and intangible assets as at 30 June 2018 has decreased by $32.1 million since the 2017-18 Budget. This mainly reflects actual 2016–17 closing balances being $81.1 million lower than estimated at Budget plus impairments and other movements in 2017-18 of $17.2 million; offset by increased capital purchases of $45.4 million; and a reduction of $20.9 million in 2017-18 depreciation expense.
Additional Estimates Statements — Department of Human Services
32
3.2.1 Analysis of budgeted financial statements (continued)
Schedule of administered activity
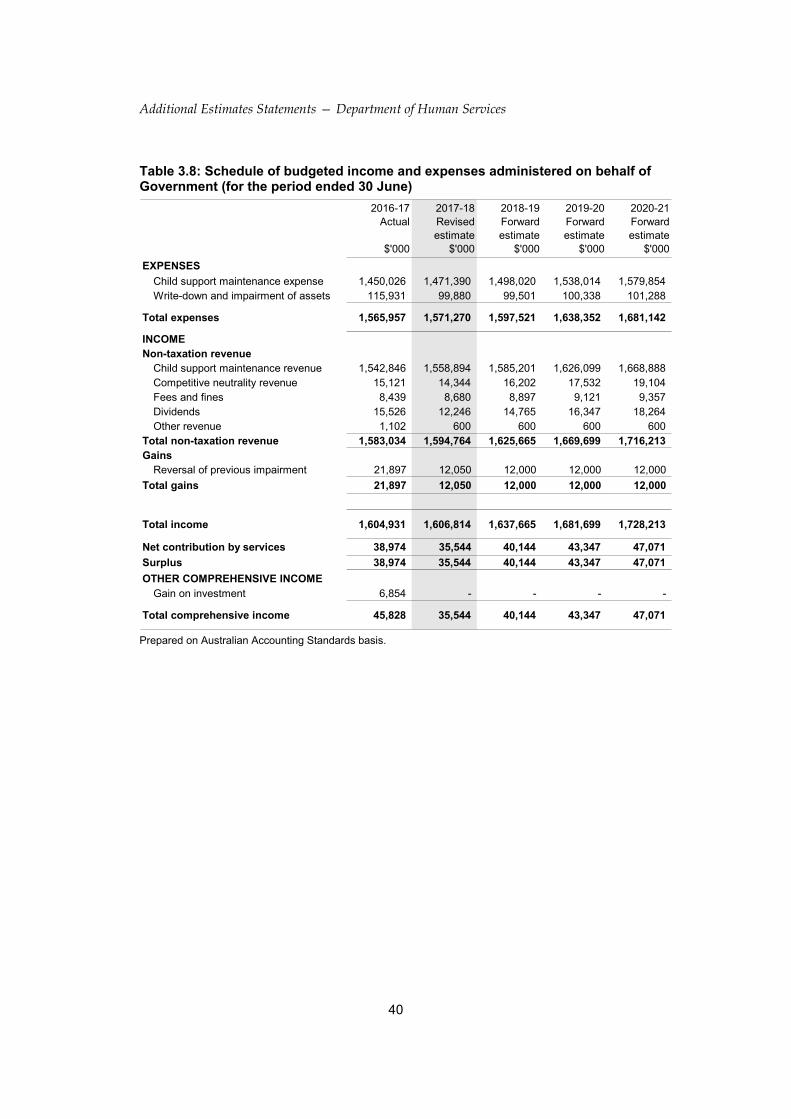
Administered income and expenses (Table 3.8)
Since the 2017-18 Budget, administered non taxation revenue has decreased by $15.8 million (mainly reflecting a decrease of $14.0 million in Child Support maintenance revenue). The revenue reduction is mostly offset by gains of $12.1 million for reversal of previous impairment of Child Support maintenance revenue.
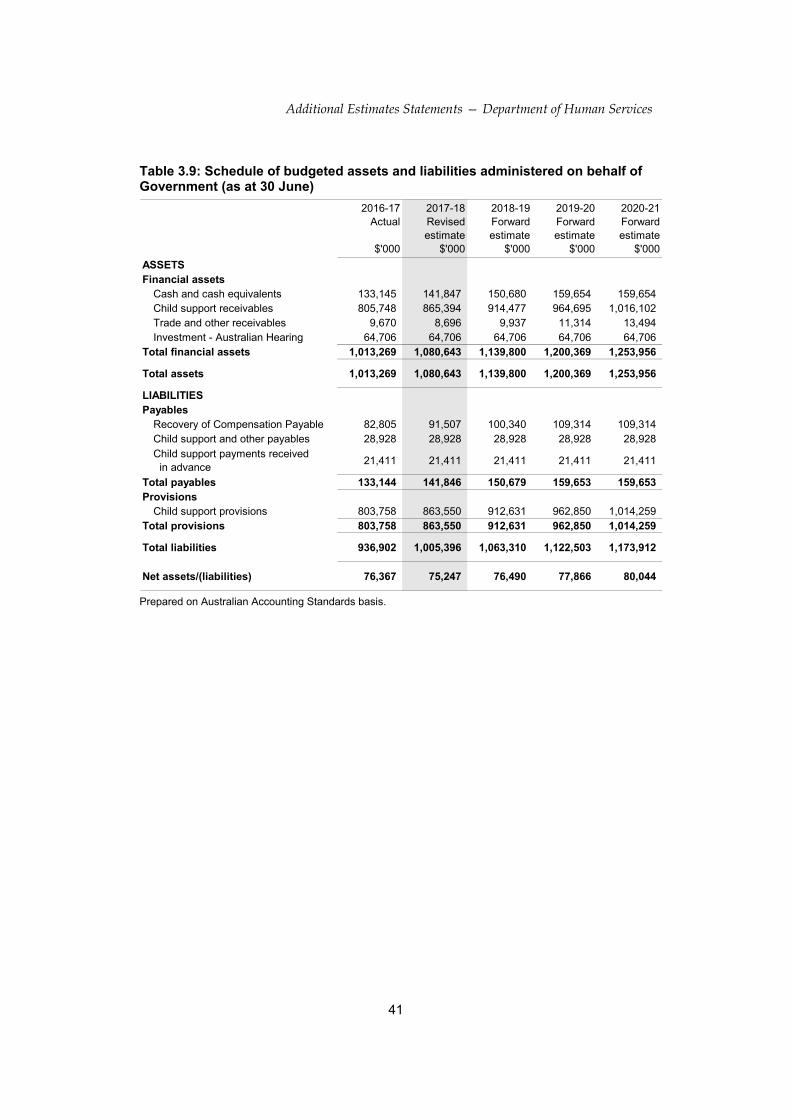
Administered assets and liabilities (Table 3.9) Since the 2017-18 Budget, the estimated closing asset balances for 2017–18 have increased by $115.4 million, mainly due to the inclusion of special account balances following a change in the financial reporting rules under the PGPA Act, offset by a decrease of $31.1 million in child support receivables. Liabilities have increased by $65.7 million due to the inclusion of Compensation Recovery special account payables, offset by a reduction in Child Support provisions.
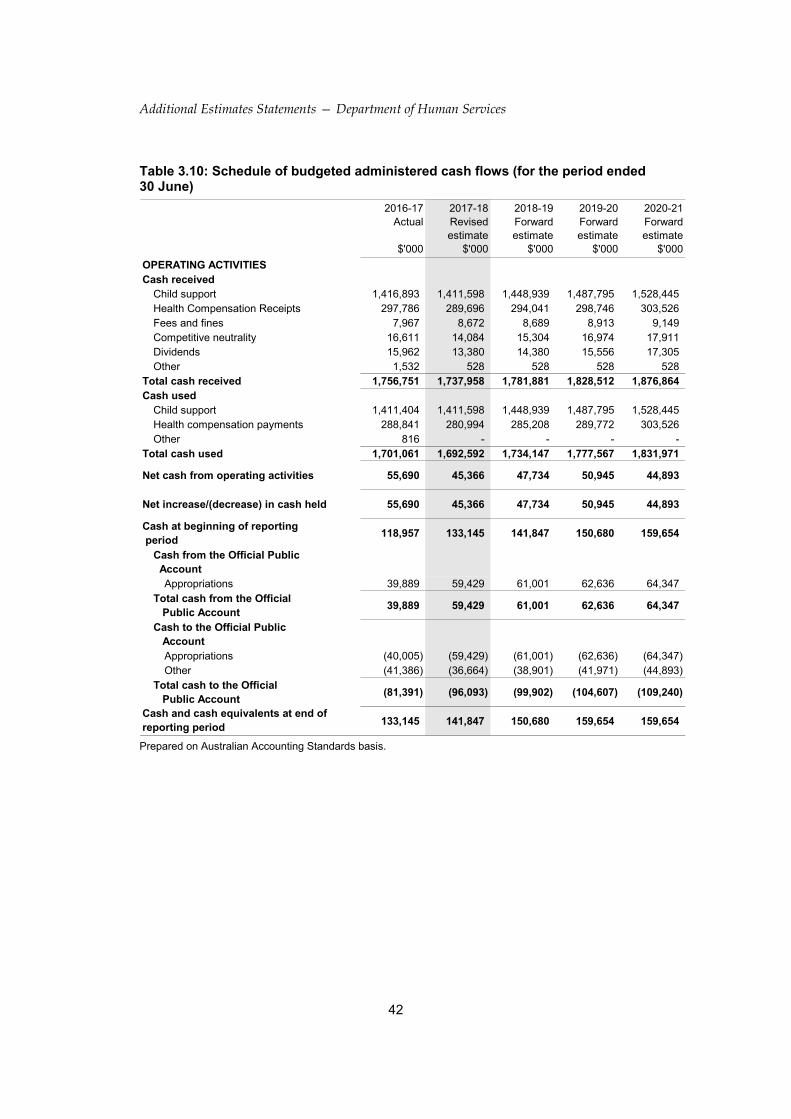
Administered statement of cash flows (Table 3.10)
Changes in administered cash flows and cash balances since the 2017-18 Budget mainly reflect the inclusion of Compensation recovery payments and receipts and changes in child support receipts and payments.
Additional Estimates Statements — Department of Human Services
33
3.2.2 Budgeted financial statements
Table 3.2: Comprehensive income statement (showing net cost of services) for the period ended 30 June
2016-17Actual
$'000
2017-18Revisedestimate
$'000
2018-19Forwardestimate
$'000
2019-20Forwardestimate
$'000
2020-21Forwardestimate
$'000
EXPENSESEmployee benefits 2,811,058 2,769,498 2,553,726 2,473,090 2,458,544 Supplier expenses 1,458,072 2,032,110 1,742,277 1,606,141 1,451,909 Depreciation and amortisation 242,875 248,640 287,971 288,874 293,896 Write-down and impairment of assets 92,922 17,340 129 129 129 Other Expenses 3,666 4,023 4,031 4,042 4,054
Total expenses 4,608,593 5,071,611 4,588,134 4,372,276 4,208,532 LESS: OWN SOURCE INCOMEOwn-source revenue
Rendering of goods and services 221,962 283,958 213,926 186,439 182,972 Rental income 11,762 11,061 10,596 10,783 10,809 Other revenue 6,051 - - - -
Total own-source revenue 239,775 295,019 224,522 197,222 193,781
GainsReversal of previous asset write-downs and impairments 1,187 - - - - Resources received free of charge 3,472 3,472 3,472 3,472 3,472 Other Gains 365 - - - -
Total gains 5,024 3,472 3,472 3,472 3,472
Total own-source Income 244,799 298,491 227,994 200,694 197,253
Net cost of services (4,363,794) (4,773,120) (4,360,140) (4,171,582) (4,011,279)
Revenue from government 4,201,599 4,533,622 4,072,169 3,882,708 3,717,383
Deficit attributable to the Australian Government
(162,195) (239,498) (287,971) (288,874) (293,896)
OTHER COMPREHENSIVE INCOMEChanges in asset revaluation surplus 37,587 - - - -
Total comprehensive deficit attributable to the Australian Government
(124,608) (239,498) (287,971) (288,874) (293,896)
Additional Estimates Statements — Department of Human Services
34
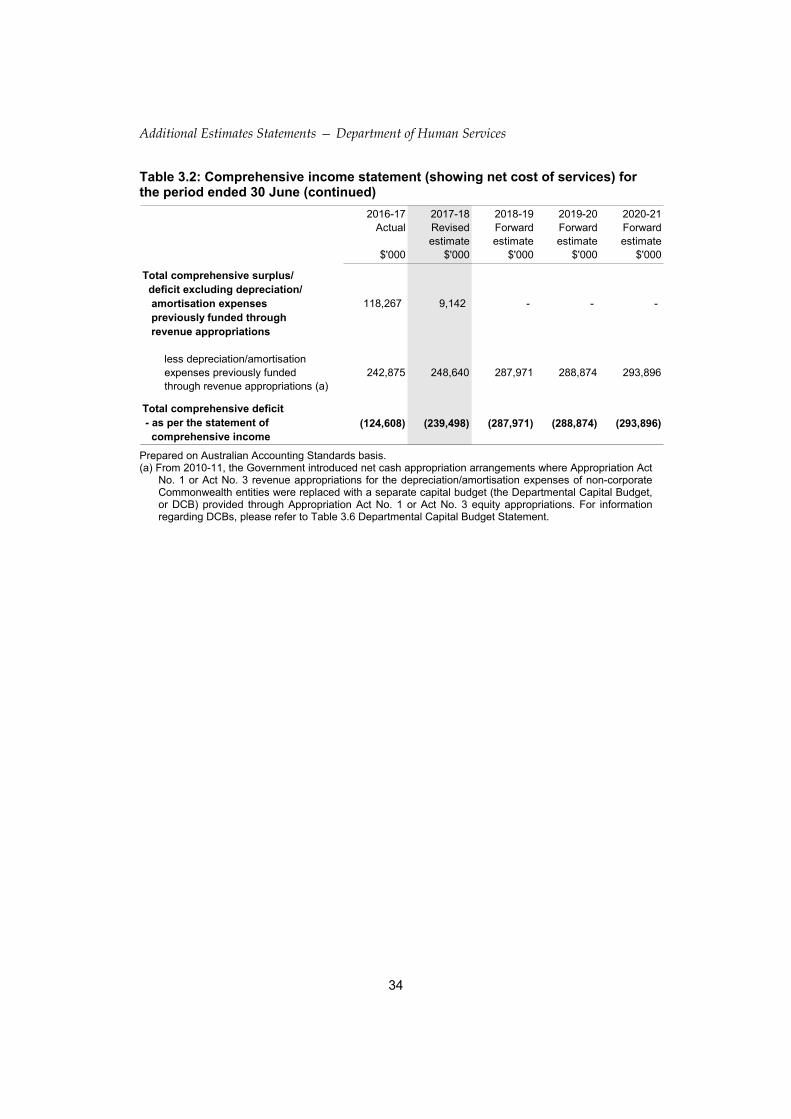
Table 3.2: Comprehensive income statement (showing net cost of services) for the period ended 30 June (continued)
2016-17Actual
$'000
2017-18Revisedestimate
$'000
2018-19Forwardestimate
$'000
2019-20Forwardestimate
$'000
2020-21Forwardestimate
$'000
Total comprehensive surplus/ deficit excluding depreciation/ amortisation expenses previously funded through revenue appropriations
118,267 9,142 - - -
less depreciation/amortisationexpenses previously fundedthrough revenue appropriations (a)
242,875 248,640 287,971 288,874 293,896
Total comprehensive deficit - as per the statement of comprehensive income
(124,608) (239,498) (287,971) (288,874) (293,896)
Prepared on Australian Accounting Standards basis. (a) From 2010-11, the Government introduced net cash appropriation arrangements where Appropriation Act
No. 1 or Act No. 3 revenue appropriations for the depreciation/amortisation expenses of non-corporate Commonwealth entities were replaced with a separate capital budget (the Departmental Capital Budget, or DCB) provided through Appropriation Act No. 1 or Act No. 3 equity appropriations. For information regarding DCBs, please refer to Table 3.6 Departmental Capital Budget Statement.
Additional Estimates Statements — Department of Human Services
35
Table 3.3: Budgeted departmental balance sheet (as at 30 June)
2016-17Actual
$'000
2017-18Revisedestimate
$'000
2018-19Forwardestimate
$'000
2019-20Forwardestimate
$'000
2020-21Forwardestimate
$'000
ASSETSFinancial assets
Cash 11,133 20,000 20,000 20,000 20,000 Trade and other receivables 1,143,866 1,201,196 1,190,377 1,210,566 1,158,866
Total financial assets 1,154,999 1,221,196 1,210,377 1,230,566 1,178,866 Non-financial assets
Land and buildings 354,554 336,338 310,436 287,620 261,635 Plant and equipment 194,743 230,023 216,240 204,595 191,978 Software 360,721 474,268 423,070 357,228 288,461 Prepayments 162,001 136,176 136,830 123,342 147,083
Total non-financial assets 1,072,019 1,176,805 1,086,576 972,785 889,157
Total assets 2,227,018 2,398,001 2,296,953 2,203,351 2,068,023
LIABILITIESPayables
Suppliers 412,902 409,818 408,327 405,985 398,286 Employee Benefits 30,879 47,686 46,007 61,635 47,914 Lease Incentives 52,009 47,478 40,203 33,387 26,615 Other payables 5,521 5,244 5,244 5,244 5,244
Total payables 501,311 510,226 499,781 506,251 478,059 Provisions
Employee provisions 849,230 883,859 883,570 883,213 882,846 Other provisions 29,182 29,710 30,279 30,867 31,467
Total provisions 878,412 913,569 913,849 914,080 914,313
Total liabilities 1,379,723 1,423,795 1,413,630 1,420,331 1,392,372
Net assets 847,295 974,206 883,323 783,020 675,651
EQUITY (a)Parent entity interest
Contributed equity 1,950,501 2,316,910 2,513,998 2,702,569 2,889,096 Reserves 166,240 166,240 166,240 166,240 166,240 Accumulated deficit (1,269,446) (1,508,944) (1,796,915) (2,085,789) (2,379,685)
Total parent entity interest 847,295 974,206 883,323 783,020 675,651
Total equity 847,295 974,206 883,323 783,020 675,651
Prepared on Australian Accounting Standards basis. (a) Equity is the residual interest in assets after the deduction of liabilities.
Additional Estimates Statements — Department of Human Services
36
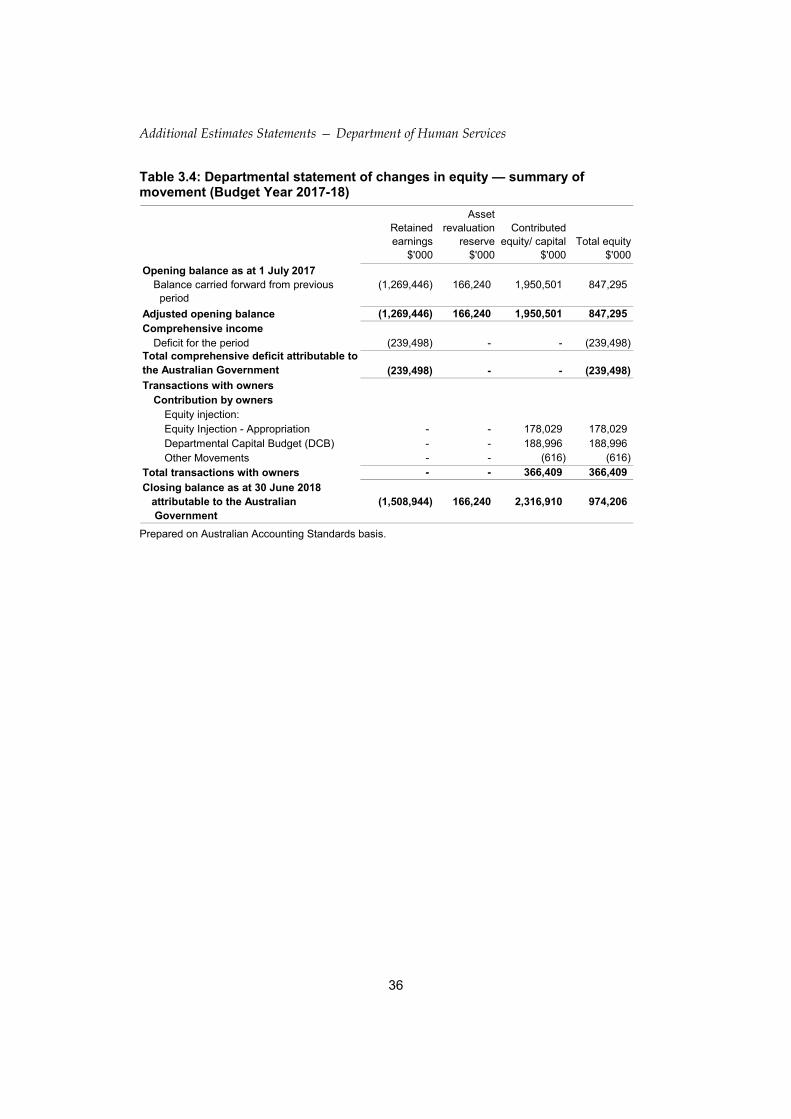
Table 3.4: Departmental statement of changes in equity — summary of movement (Budget Year 2017-18)
Retained earnings
$'000
Asset revaluation
reserve$'000
Contributed equity/ capital
$'000Total equity
$'000
Opening balance as at 1 July 2017Balance carried forward from previous period
(1,269,446) 166,240 1,950,501 847,295
Adjusted opening balance (1,269,446) 166,240 1,950,501 847,295 Comprehensive income
Deficit for the period (239,498) - - (239,498) Total comprehensive deficit attributable to the Australian Government (239,498) - - (239,498) Transactions with owners
Contribution by ownersEquity injection:Equity Injection - Appropriation - - 178,029 178,029 Departmental Capital Budget (DCB) - - 188,996 188,996 Other Movements - - (616) (616)
Total transactions with owners - - 366,409 366,409
Closing balance as at 30 June 2018 attributable to the Australian Government
(1,508,944) 166,240 2,316,910 974,206
Prepared on Australian Accounting Standards basis.
Additional Estimates Statements — Department of Human Services
37
Table 3.5: Budgeted departmental statement of cash flows (for the period ended 30 June)
2016-17Actual
$'000
2017-18Revisedestimate
$'000
2018-19Forwardestimate
$'000
2019-20Forwardestimate
$'000
2020-21Forwardestimate
$'000
OPERATING ACTIVITIESCash received
Appropriations 4,571,262 5,010,058 4,534,144 4,271,646 4,163,388 Rendering of services 274,302 299,870 237,908 205,269 201,899 Net GST received 160,018 211,155 177,371 163,141 151,964 Other 31,376 45,718 45,718 45,718 45,718
Total cash received 5,036,958 5,566,801 4,995,141 4,685,774 4,562,969 Cash used
Employees 2,880,938 2,745,491 2,583,123 2,485,248 2,500,061 Suppliers 1,677,193 2,243,104 1,947,567 1,782,944 1,659,873 Competitive neutrality payments 371 454 454 454 454 Returns to the official public account 466,036 556,743 460,997 414,128 399,581 Other 4,293 3,000 3,000 3,000 3,000
Total cash used 5,028,831 5,548,792 4,995,141 4,685,774 4,562,969 Net cash from/(used by) operating activities
8,127 18,009 - - -
INVESTING ACTIVITIESCash received
Proceeds from sales of plant and equipment 340 - - - -
Total cash received 340 - - - - Cash used
Purchase of property, plant and equipment and software
255,653 396,467 197,088 188,571 186,527
Total cash used 255,653 396,467 197,088 188,571 186,527
Net cash used by investing activities (255,313) (396,467) (197,088) (188,571) (186,527)
FINANCING ACTIVITIESCash received
Contributed equity 235,913 387,325 197,088 188,571 186,527 Total cash received 235,913 387,325 197,088 188,571 186,527
Net cash from financing activities 235,913 387,325 197,088 188,571 186,527
Net increase/(decrease) in cash held (11,273) 8,867 - - - Cash at the beginning of the reporting period
22,406 11,133 20,000 20,000 20,000
Cash at the end of the reporting period
11,133 20,000 20,000 20,000 20,000
Prepared on Australian Accounting Standards basis.
Additional Estimates Statements — Department of Human Services
38
Table 3.6: Departmental capital budget statement (for the period ended 30 June)
2016-17Actual
$'000
2017-18Revisedestimate
$'000
2018-19Forwardestimate
$'000
2019-20Forwardestimate
$'000
2020-21Forwardestimate
$'000
NEW CAPITAL APPROPRIATIONSCapital budget - Act No. 1 (DCB) (a) 164,675 188,996 183,121 183,870 184,945 Equity injections - Act No. 2 (b) 109,421 177,850 13,967 4,701 1,582
Total new capital appropriations 274,096 366,846 197,088 188,571 186,527 Provided for:
Purchase of non-financial assets 271,212 367,025 197,088 188,571 186,527 Other items 2,884 (179) - - -
Total Items 274,096 366,846 197,088 188,571 186,527 PURCHASE OF NON-FINANCIAL ASSETS
Funded by capital appropriations (c) 81,253 198,329 13,967 4,701 1,582
Funded by capital appropriation - DCB (d) 164,675 188,996 183,121 183,870 184,945
Funded internally from departmental resources (e) - 9,142 - - -
TOTAL 245,928 396,467 197,088 188,571 186,527
RECONCILIATION OF CASH USED TO ACQUIRE ASSETS TO ASSET MOVEMENT TABLE
Total purchases 245,928 396,467 197,088 188,571 186,527 plus reduction in payables 9,725 - - - -
Total cash used to acquire assets 255,653 396,467 197,088 188,571 186,527
Prepared on Australian Accounting Standards basis. (a) Includes both current and prior Bill No. 3 and Act No. 1. (b) Includes both current and prior Bill No. 4 and Act 2. The 2016-17 actual excludes $29.0 million of
appropriation subject to administrative quarantine under section 51 of the PGPA Act. (c) Includes both current and prior Bill No. 4 and prior Act Nos. 2/4/6 appropriations (d) Does not include annual finance lease costs. Includes purchases from current and previous years’
Departmental Capital Budgets (DCBs). (e) Includes the following sources of funding: - current bill No. 3 and prior year Act No. 1/3/5 appropriations (excluding amounts from the DCB); - internally developed assets; - s74 retained revenue receipts; - proceeds from the sale of assets.
39
Additional E
stimates Statem
ent — D
epartment of H
uman Services
Table 3.7: Statement of asset movements (2017-18 Budget year)
Land$'000
Buildings$'000
Plant and equipment
$'000Software
$'000Total$'000
As at 1 July 2017
Gross book value 4,734 370,914 258,358 1,007,342 1,641,348 Accumulated depreciation/amortisation and impairment - (21,094) (63,615) (646,621) (731,330)
Opening net book balance 4,734 349,820 194,743 360,721 910,018
Capital asset additions
Estimated expenditure on new or replacement assetsBy purchase - appropriation equity (a) - - 23,296 175,033 198,329 By purchase - appropriation ordinary annual services (b)
- 70,842 62,151 56,003 188,996
By purchase - other - - 9,142 - 9,142
Total additions - 70,842 94,589 231,036 396,467
Other movements
Depreciation/amortisation expense - (85,779) (59,309) (103,552) (248,640)
Impairments and other movements - (3,279) - (13,937) (17,216)
Total other movements - (89,058) (59,309) (117,489) (265,856)
As at 30 June 2018
Gross book value 4,734 435,258 352,947 1,224,441 2,017,380 Accumulated depreciation/amortisation and impairment - (103,654) (122,924) (750,173) (976,751)
Closing net book balance 4,734 331,604 230,023 474,268 1,040,629
Prepared on Australian Accounting Standards basis.
(a) “Appropriation equity” refers to equity injection appropriations provided through Appropriation Act (No.2) 2017-2018 and Bill (No.4) 2017-2018 and prior years.
(b) “Appropriation ordinary annual services” refers to funding provided through Appropriation Act (No.1) 2017-18 and Bill (No.3) 2017-18 for DCBs or other operational expenses.
Additional Estimates Statements — Department of Human Services
40
Table 3.8: Schedule of budgeted income and expenses administered on behalf of Government (for the period ended 30 June)
2016-17Actual
$'000
2017-18Revisedestimate
$'000
2018-19Forwardestimate
$'000
2019-20Forwardestimate
$'000
2020-21Forwardestimate
$'000
EXPENSES
Child support maintenance expense 1,450,026 1,471,390 1,498,020 1,538,014 1,579,854 Write-down and impairment of assets 115,931 99,880 99,501 100,338 101,288
Total expenses 1,565,957 1,571,270 1,597,521 1,638,352 1,681,142
INCOMENon-taxation revenue
Child support maintenance revenue 1,542,846 1,558,894 1,585,201 1,626,099 1,668,888 Competitive neutrality revenue 15,121 14,344 16,202 17,532 19,104 Fees and fines 8,439 8,680 8,897 9,121 9,357 Dividends 15,526 12,246 14,765 16,347 18,264 Other revenue 1,102 600 600 600 600
Total non-taxation revenue 1,583,034 1,594,764 1,625,665 1,669,699 1,716,213 Gains
Reversal of previous impairment 21,897 12,050 12,000 12,000 12,000
Total gains 21,897 12,050 12,000 12,000 12,000
Total income 1,604,931 1,606,814 1,637,665 1,681,699 1,728,213
Net contribution by services 38,974 35,544 40,144 43,347 47,071
Surplus 38,974 35,544 40,144 43,347 47,071
OTHER COMPREHENSIVE INCOMEGain on investment 6,854 - - - -
Total comprehensive income 45,828 35,544 40,144 43,347 47,071
Prepared on Australian Accounting Standards basis.
Additional Estimates Statements — Department of Human Services
41
Table 3.9: Schedule of budgeted assets and liabilities administered on behalf of Government (as at 30 June)
2016-17Actual
$'000
2017-18Revisedestimate
$'000
2018-19Forwardestimate
$'000
2019-20Forwardestimate
$'000
2020-21Forwardestimate
$'000
ASSETSFinancial assets
Cash and cash equivalents 133,145 141,847 150,680 159,654 159,654 Child support receivables 805,748 865,394 914,477 964,695 1,016,102 Trade and other receivables 9,670 8,696 9,937 11,314 13,494 Investment - Australian Hearing 64,706 64,706 64,706 64,706 64,706
Total financial assets 1,013,269 1,080,643 1,139,800 1,200,369 1,253,956
Total assets 1,013,269 1,080,643 1,139,800 1,200,369 1,253,956
LIABILITIESPayables
Recovery of Compensation Payable 82,805 91,507 100,340 109,314 109,314 Child support and other payables 28,928 28,928 28,928 28,928 28,928 Child support payments received in advance
21,411 21,411 21,411 21,411 21,411
Total payables 133,144 141,846 150,679 159,653 159,653 Provisions
Child support provisions 803,758 863,550 912,631 962,850 1,014,259 Total provisions 803,758 863,550 912,631 962,850 1,014,259
Total liabilities 936,902 1,005,396 1,063,310 1,122,503 1,173,912
Net assets/(liabilities) 76,367 75,247 76,490 77,866 80,044
Prepared on Australian Accounting Standards basis.
Additional Estimates Statements — Department of Human Services
42
Table 3.10: Schedule of budgeted administered cash flows (for the period ended 30 June)
2016-17Actual
$'000
2017-18Revisedestimate
$'000
2018-19Forwardestimate
$'000
2019-20Forwardestimate
$'000
2020-21Forwardestimate
$'000
OPERATING ACTIVITIESCash received
Child support 1,416,893 1,411,598 1,448,939 1,487,795 1,528,445Health Compensation Receipts 297,786 289,696 294,041 298,746 303,526Fees and fines 7,967 8,672 8,689 8,913 9,149Competitive neutrality 16,611 14,084 15,304 16,974 17,911Dividends 15,962 13,380 14,380 15,556 17,305Other 1,532 528 528 528 528
Total cash received 1,756,751 1,737,958 1,781,881 1,828,512 1,876,864Cash used
Child support 1,411,404 1,411,598 1,448,939 1,487,795 1,528,445Health compensation payments 288,841 280,994 285,208 289,772 303,526Other 816 - - - -
Total cash used 1,701,061 1,692,592 1,734,147 1,777,567 1,831,971
Net cash from operating activities 55,690 45,366 47,734 50,945 44,893
Net increase/(decrease) in cash held 55,690 45,366 47,734 50,945 44,893
Cash at beginning of reporting period
118,957 133,145 141,847 150,680 159,654
Cash from the Official Public Account
Appropriations 39,889 59,429 61,001 62,636 64,347Total cash from the Official Public Account
39,889 59,429 61,001 62,636 64,347
Cash to the Official Public Account
Appropriations (40,005) (59,429) (61,001) (62,636) (64,347)Other (41,386) (36,664) (38,901) (41,971) (44,893)
Total cash to the Official Public Account
(81,391) (96,093) (99,902) (104,607) (109,240)
Cash and cash equivalents at end of reporting period
133,145 141,847 150,680 159,654 159,654
Prepared on Australian Accounting Standards basis.
Additional Estimates Statements — Department of Human Services
43
Table 3.11: Schedule of administered capital budget (for the period ended 30 June) The Department does not have an administered capital budget.
Table 3.12: Statement of administered asset movements (2017-18 Budget year) The Department does not administer any non-financial assets on behalf of Government.

45
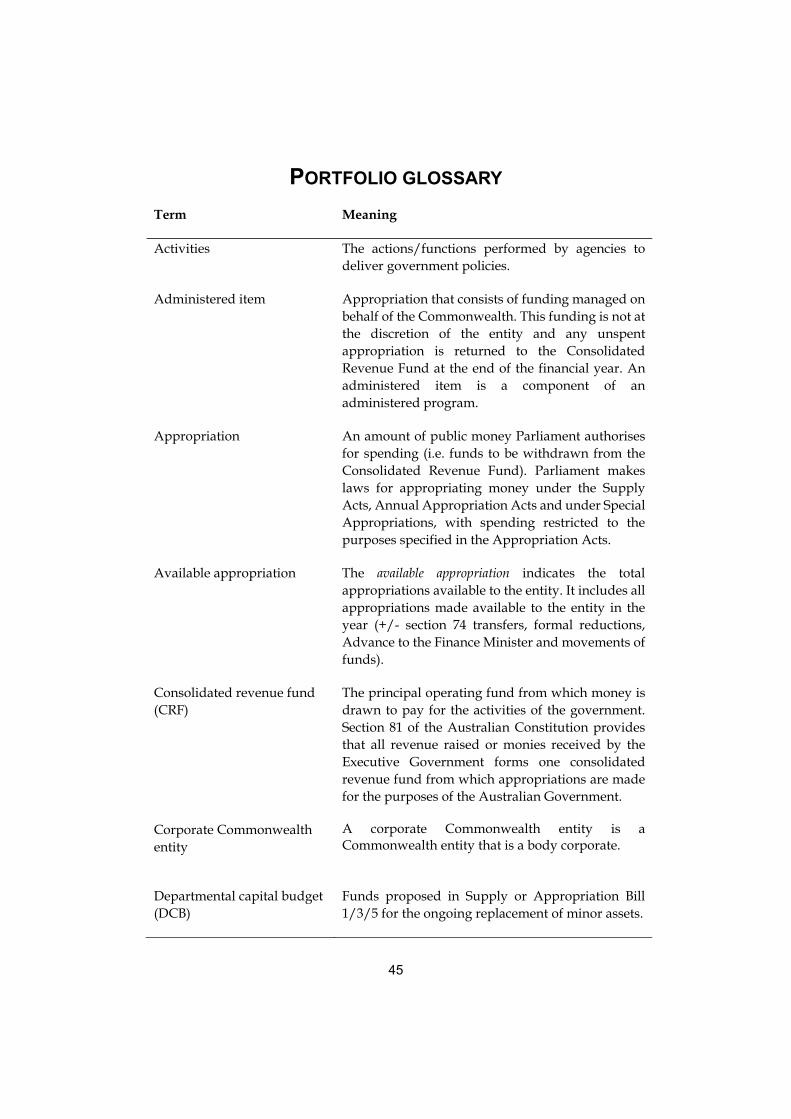
PORTFOLIO GLOSSARY
Term Meaning
Activities The actions/functions performed by agencies to deliver government policies.
Administered item Appropriation that consists of funding managed on behalf of the Commonwealth. This funding is not at the discretion of the entity and any unspent appropriation is returned to the Consolidated Revenue Fund at the end of the financial year. An administered item is a component of an administered program.
Appropriation An amount of public money Parliament authorises for spending (i.e. funds to be withdrawn from the Consolidated Revenue Fund). Parliament makes laws for appropriating money under the Supply Acts, Annual Appropriation Acts and under Special Appropriations, with spending restricted to the purposes specified in the Appropriation Acts.
Available appropriation The available appropriation indicates the total appropriations available to the entity. It includes all appropriations made available to the entity in the year (+/- section 74 transfers, formal reductions, Advance to the Finance Minister and movements of funds).
Consolidated revenue fund (CRF)
The principal operating fund from which money is drawn to pay for the activities of the government. Section 81 of the Australian Constitution provides that all revenue raised or monies received by the Executive Government forms one consolidated revenue fund from which appropriations are made for the purposes of the Australian Government.
Corporate Commonwealth entity
A corporate Commonwealth entity is a Commonwealth entity that is a body corporate.
Departmental capital budget (DCB)
Funds proposed in Supply or Appropriation Bill 1/3/5 for the ongoing replacement of minor assets.
Glossary
46
Term Meaning
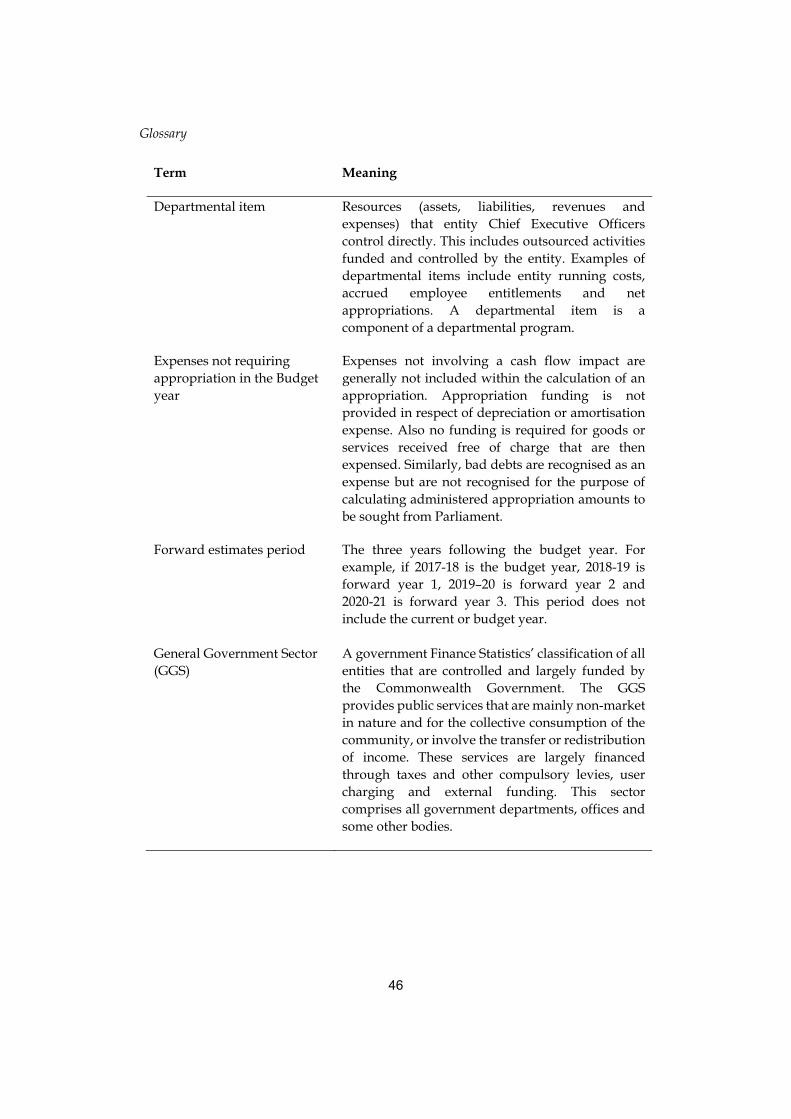
Departmental item
Resources (assets, liabilities, revenues and expenses) that entity Chief Executive Officers control directly. This includes outsourced activities funded and controlled by the entity. Examples of departmental items include entity running costs, accrued employee entitlements and net appropriations. A departmental item is a component of a departmental program.
Expenses not requiring appropriation in the Budget year
Expenses not involving a cash flow impact are generally not included within the calculation of an appropriation. Appropriation funding is not provided in respect of depreciation or amortisation expense. Also no funding is required for goods or services received free of charge that are then expensed. Similarly, bad debts are recognised as an expense but are not recognised for the purpose of calculating administered appropriation amounts to be sought from Parliament.
Forward estimates period The three years following the budget year. For example, if 2017-18 is the budget year, 2018-19 is forward year 1, 2019–20 is forward year 2 and 2020-21 is forward year 3. This period does not include the current or budget year.
General Government Sector (GGS)
A government Finance Statistics’ classification of all entities that are controlled and largely funded by the Commonwealth Government. The GGS provides public services that are mainly non-market in nature and for the collective consumption of the community, or involve the transfer or redistribution of income. These services are largely financed through taxes and other compulsory levies, user charging and external funding. This sector comprises all government departments, offices and some other bodies.
Glossary
47
Term Meaning
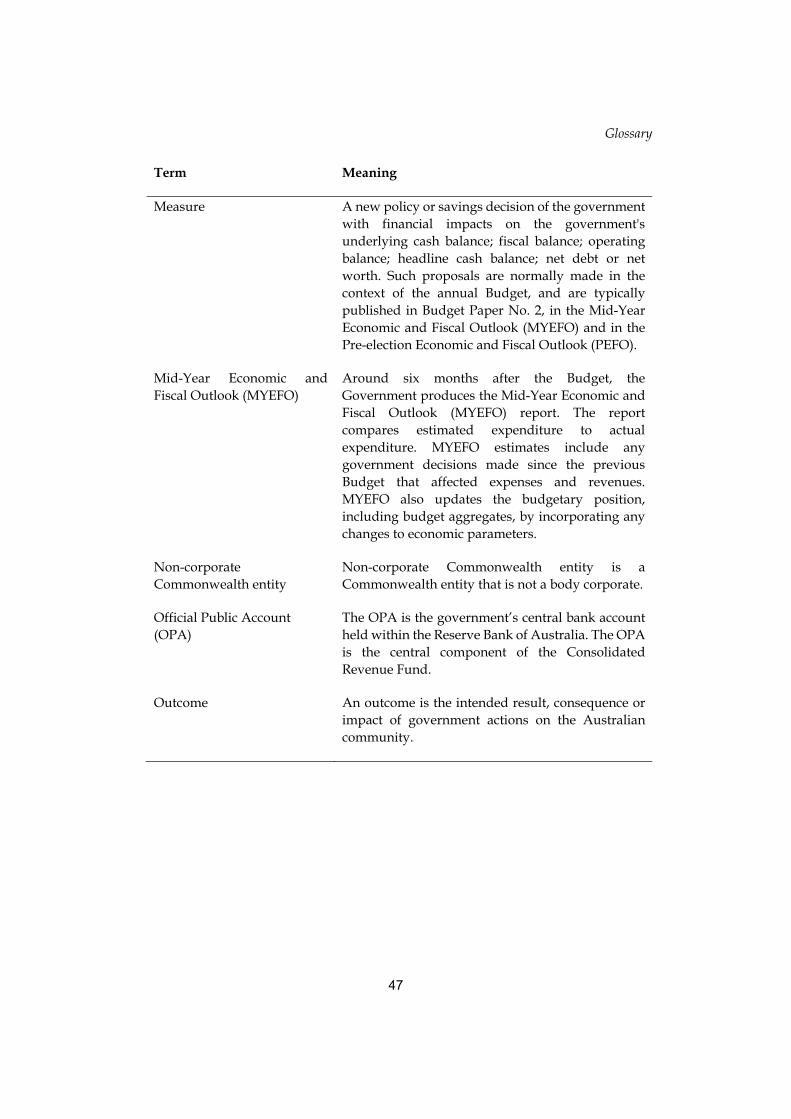
Measure A new policy or savings decision of the government with financial impacts on the government's underlying cash balance; fiscal balance; operating balance; headline cash balance; net debt or net worth. Such proposals are normally made in the context of the annual Budget, and are typically published in Budget Paper No. 2, in the Mid-Year Economic and Fiscal Outlook (MYEFO) and in the Pre-election Economic and Fiscal Outlook (PEFO).
Mid-Year Economic and Fiscal Outlook (MYEFO)
Around six months after the Budget, the Government produces the Mid-Year Economic and Fiscal Outlook (MYEFO) report. The report compares estimated expenditure to actual expenditure. MYEFO estimates include any government decisions made since the previous Budget that affected expenses and revenues. MYEFO also updates the budgetary position, including budget aggregates, by incorporating any changes to economic parameters.
Non-corporate Commonwealth entity
Non-corporate Commonwealth entity is a Commonwealth entity that is not a body corporate.
Official Public Account (OPA)
The OPA is the government’s central bank account held within the Reserve Bank of Australia. The OPA is the central component of the Consolidated Revenue Fund.
Outcome An outcome is the intended result, consequence or impact of government actions on the Australian community.
Glossary
48
Term Meaning
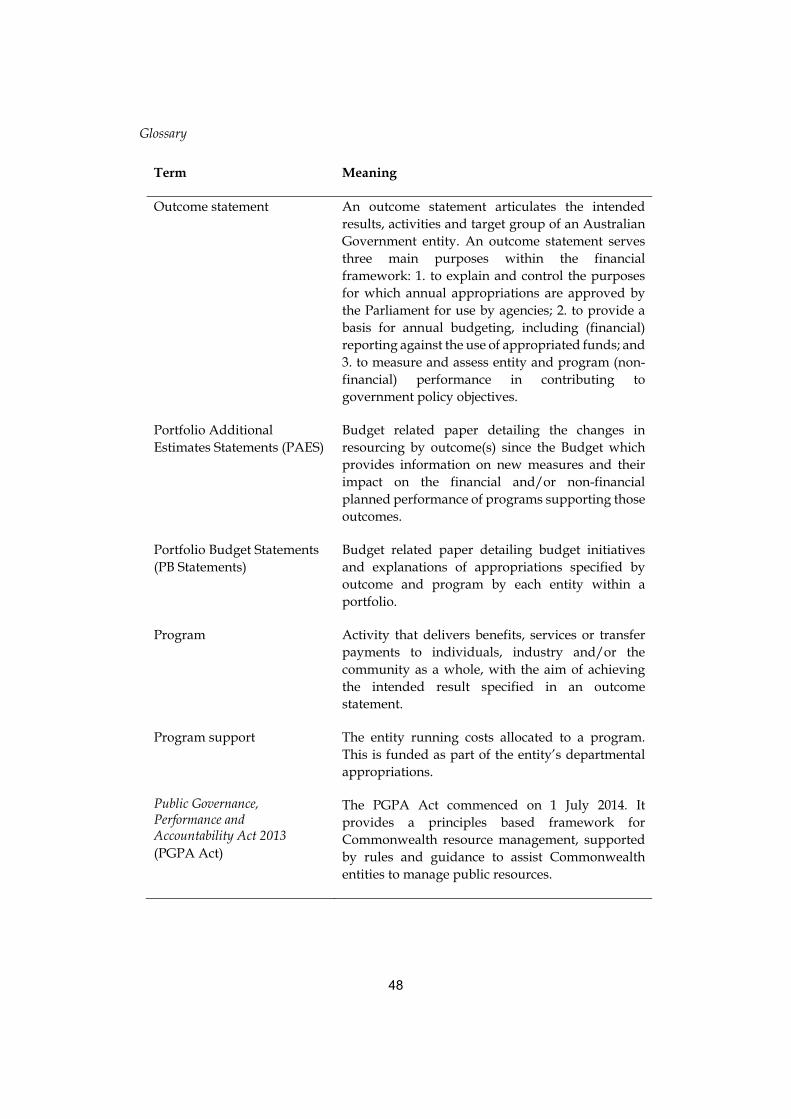
Outcome statement An outcome statement articulates the intended results, activities and target group of an Australian Government entity. An outcome statement serves three main purposes within the financial framework: 1. to explain and control the purposes for which annual appropriations are approved by the Parliament for use by agencies; 2. to provide a basis for annual budgeting, including (financial) reporting against the use of appropriated funds; and 3. to measure and assess entity and program (non-financial) performance in contributing to government policy objectives.
Portfolio Additional Estimates Statements (PAES)
Budget related paper detailing the changes in resourcing by outcome(s) since the Budget which provides information on new measures and their impact on the financial and/or non-financial planned performance of programs supporting those outcomes.
Portfolio Budget Statements (PB Statements)
Budget related paper detailing budget initiatives and explanations of appropriations specified by outcome and program by each entity within a portfolio.
Program Activity that delivers benefits, services or transfer payments to individuals, industry and/or the community as a whole, with the aim of achieving the intended result specified in an outcome statement.
Program support The entity running costs allocated to a program. This is funded as part of the entity’s departmental appropriations.
Public Governance, Performance and Accountability Act 2013 (PGPA Act)
The PGPA Act commenced on 1 July 2014. It provides a principles based framework for Commonwealth resource management, supported by rules and guidance to assist Commonwealth entities to manage public resources.
Glossary
49
Term Meaning
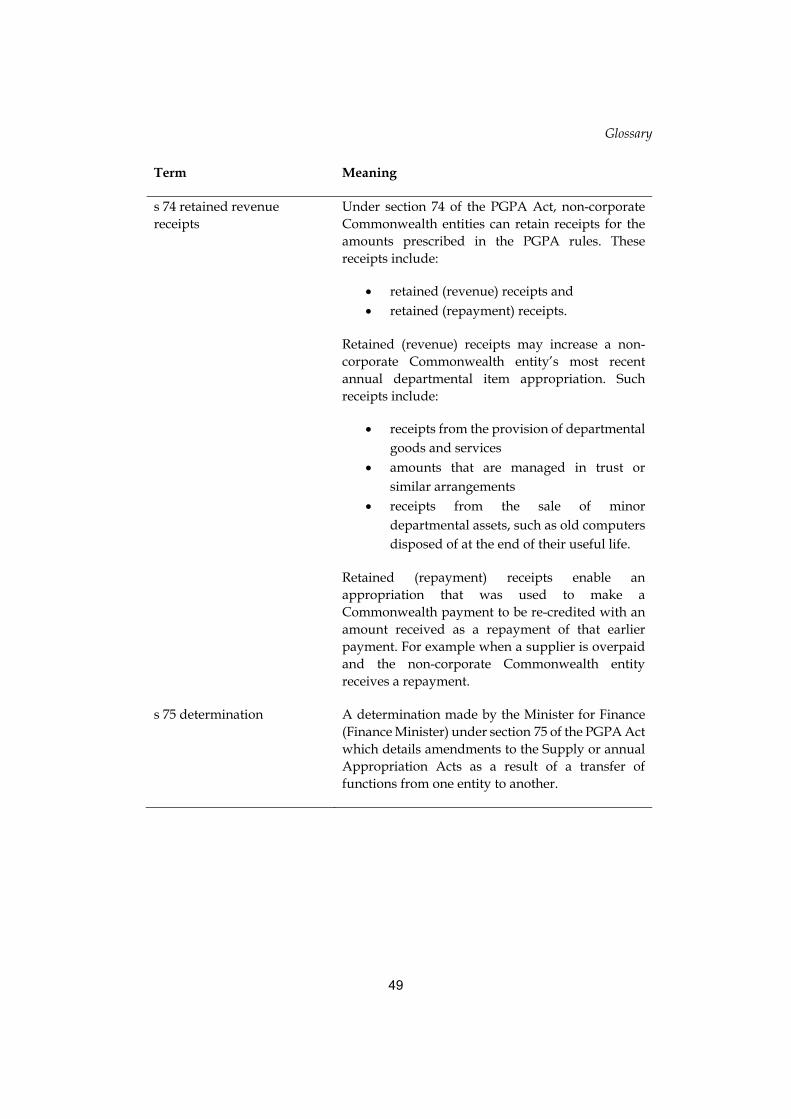
s 74 retained revenue receipts
Under section 74 of the PGPA Act, non-corporate Commonwealth entities can retain receipts for the amounts prescribed in the PGPA rules. These receipts include:
retained (revenue) receipts and retained (repayment) receipts.
Retained (revenue) receipts may increase a non-corporate Commonwealth entity’s most recent annual departmental item appropriation. Such receipts include:
receipts from the provision of departmental goods and services
amounts that are managed in trust or similar arrangements
receipts from the sale of minor departmental assets, such as old computers disposed of at the end of their useful life.
Retained (repayment) receipts enable an appropriation that was used to make a Commonwealth payment to be re-credited with an amount received as a repayment of that earlier payment. For example when a supplier is overpaid and the non-corporate Commonwealth entity receives a repayment.
s 75 determination A determination made by the Minister for Finance (Finance Minister) under section 75 of the PGPA Act which details amendments to the Supply or annual Appropriation Acts as a result of a transfer of functions from one entity to another.
Glossary
50
Term Meaning
Supply Act When applicable, the Supply Act appropriations are broadly equivalent to 5/12ths of the estimated appropriations, excluding Budget measures. In some cases, the appropriations also provide for a few entities that may have disproportionately high estimated expenditure early in the financial year. The balance of the appropriations including Budget measures for that year will be in the Appropriation Acts (No.1) and (No. 2).