Embed Size (px)
Citation preview
M. Dahlbom Winter 2015 1
Positron Emission Tomography - PET
Positron Emission Tomography - PET
Positron Emission Tomography
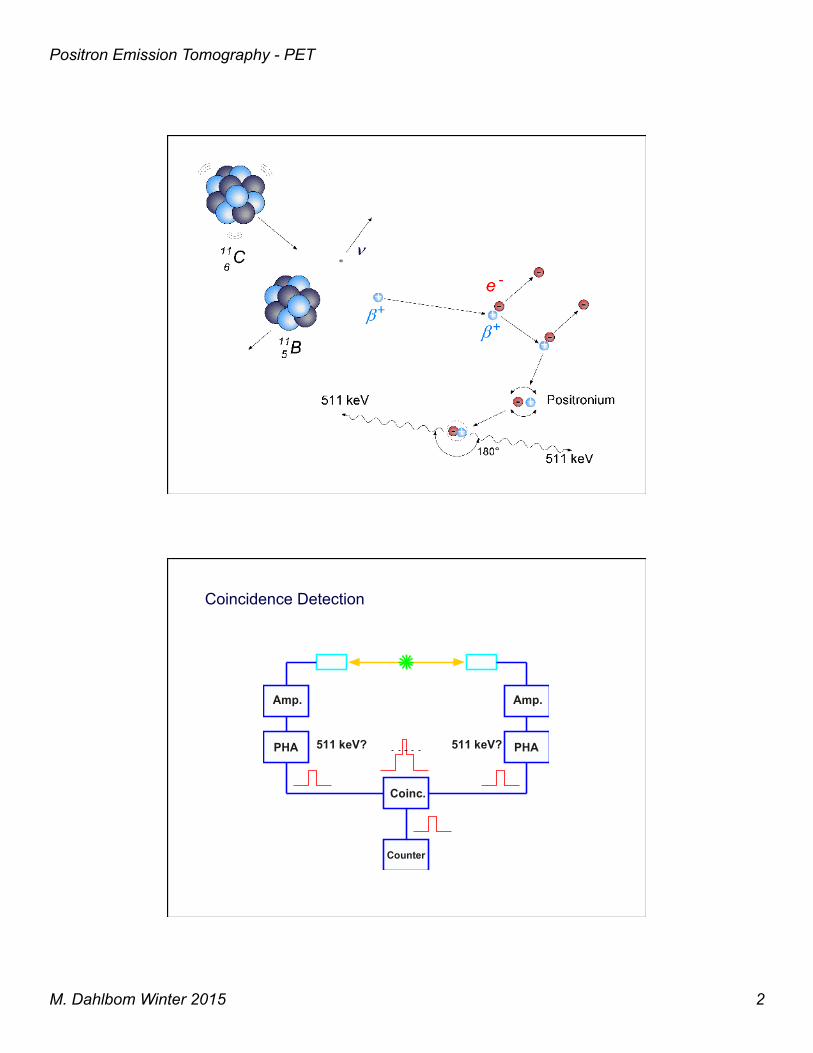
Positron Emission Tomography (PET): Coincidence detection of annihilation radiation from positron-emitting isotopes followed by tomographic reconstruction of 3-D activity distribution. Some unique features of PET:
• Use of “electronic collimation” instead of lead collimation. • Higher efficiency than SPECT • Uniform resolution • Accurate attenuation correction • “Absolute” Quantification • Use of short-lived biologically active radio-pharmaceuticals:
11C-glucose 13N-ammonia 15O-water 18FDG 18FDOPA
M. Dahlbom Winter 2015 2
Positron Emission Tomography - PET
Amp.
PHA
Amp.
PHA
Coinc.
511 keV? 511 keV?
Counter
Coincidence Detection
M. Dahlbom Winter 2015 3
Positron Emission Tomography - PET
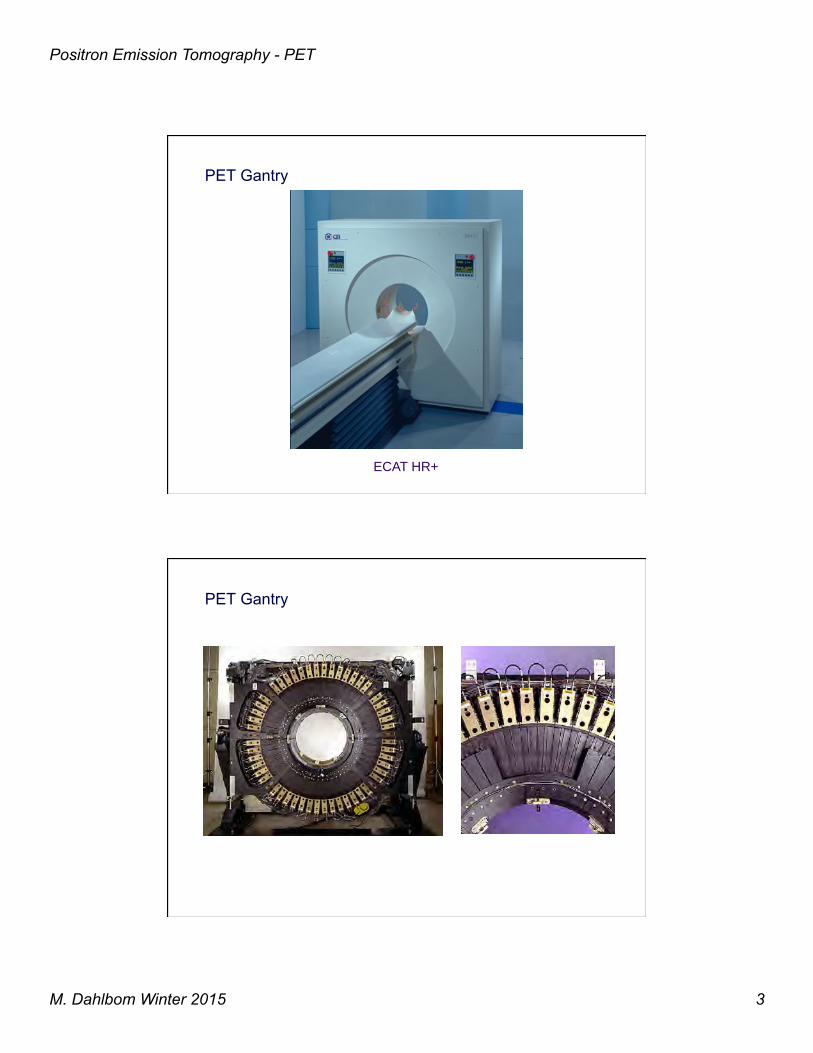
PET Gantry
ECAT HR+!
PET Gantry
M. Dahlbom Winter 2015 4
Positron Emission Tomography - PET
Bernard Bendriem, Ph.D.
Vice-President, R&D
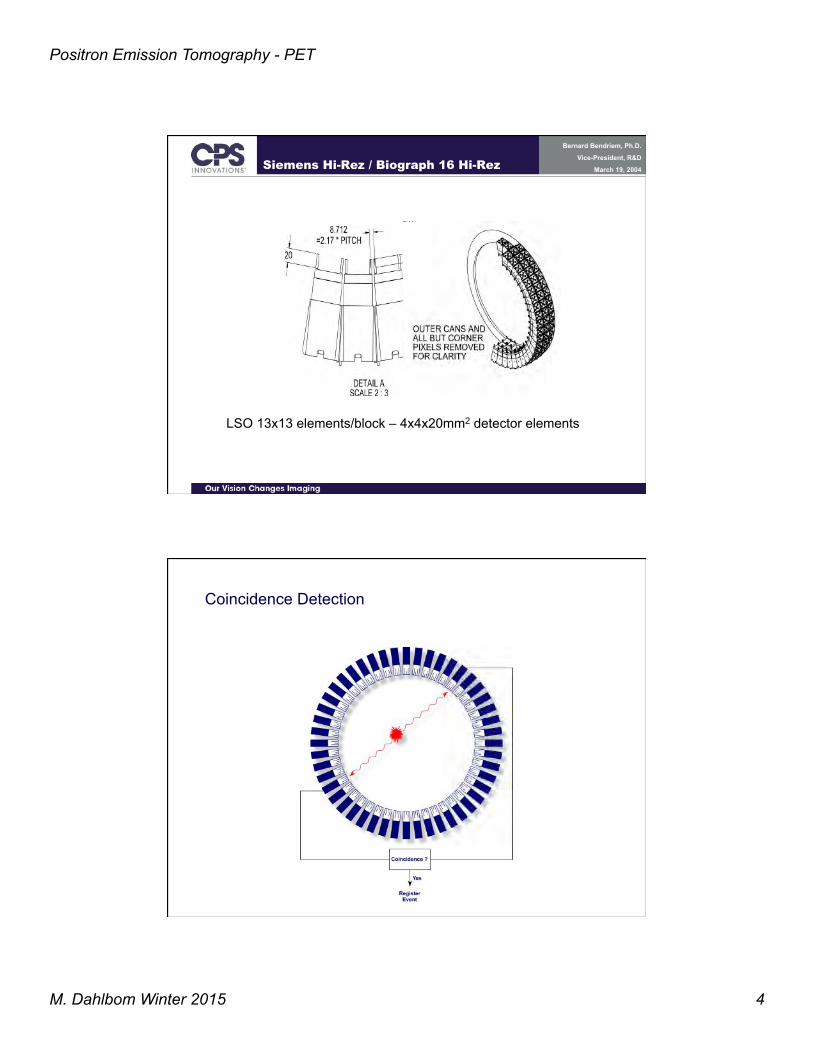
March 19, 2004 Siemens Hi-Rez / Biograph 16 Hi-Rez
LSO 13x13 elements/block – 4x4x20mm2 detector elements
Coincidence Detection
M. Dahlbom Winter 2015 5
Positron Emission Tomography - PET
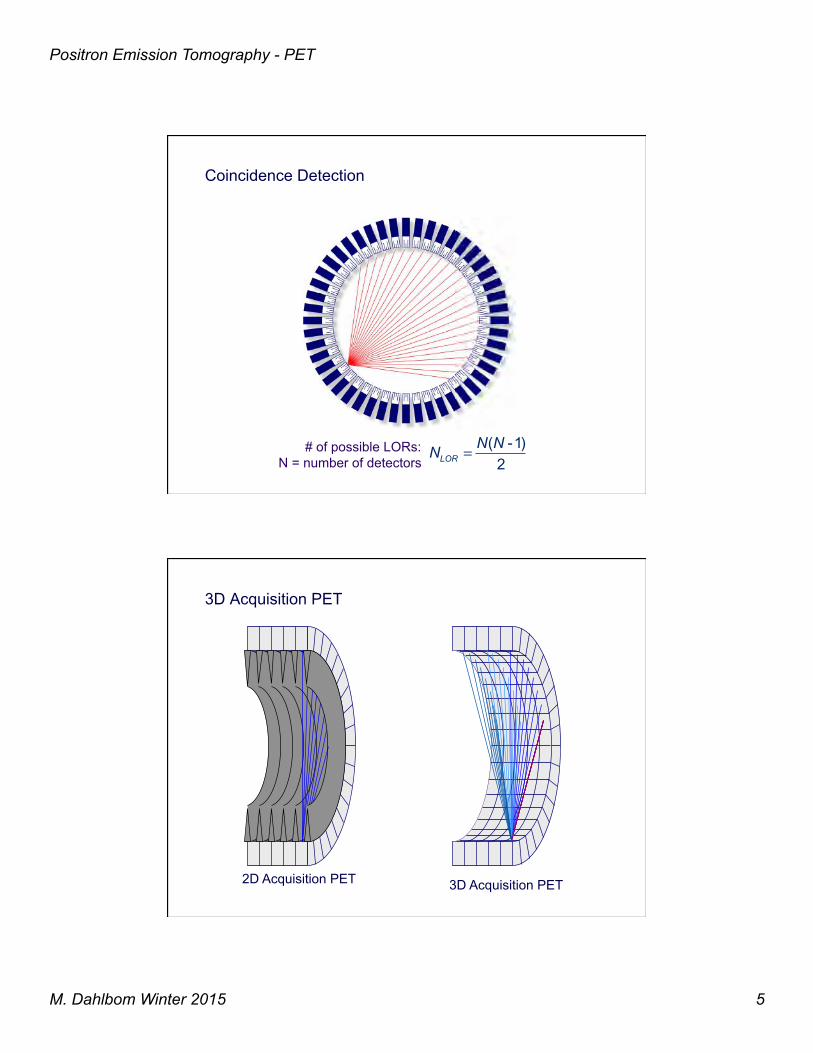
Coincidence Detection
# of possible LORs: N = number of detectors
( -1)2LOR
N NN =
3D Acquisition PET
3D Acquisition PET 2D Acquisition PET
M. Dahlbom Winter 2015 6
Positron Emission Tomography - PET
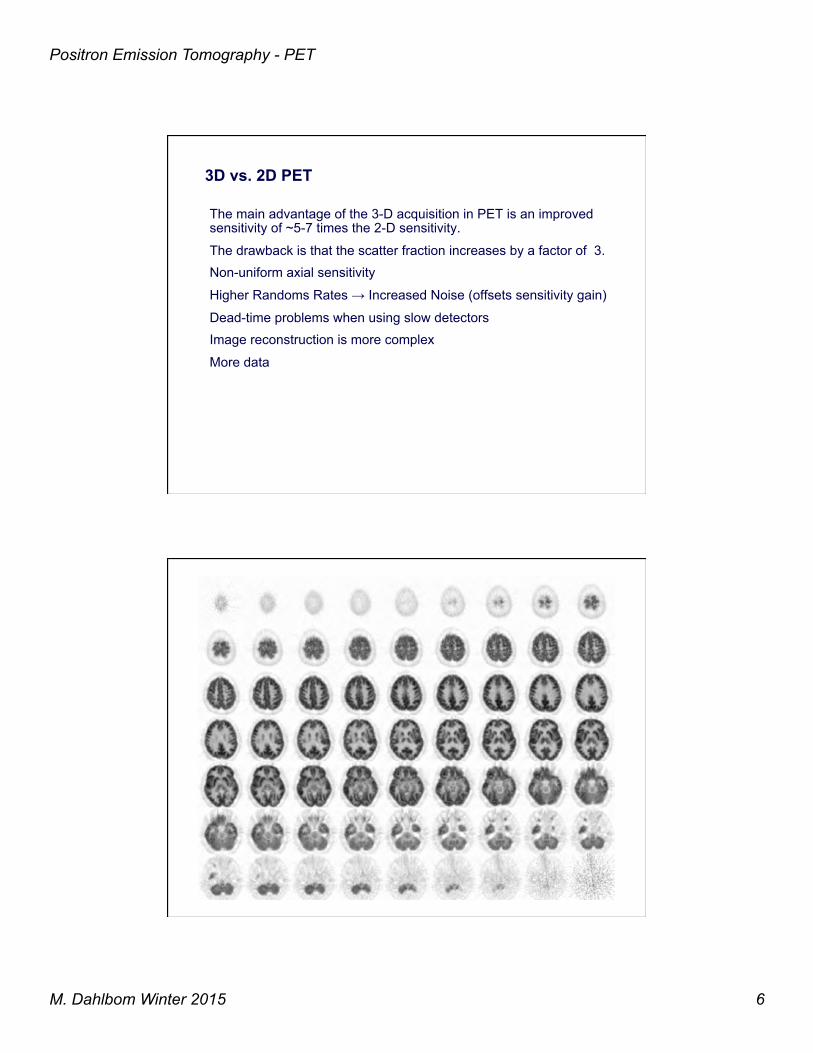
3D vs. 2D PET
The main advantage of the 3-D acquisition in PET is an improved sensitivity of ~5-7 times the 2-D sensitivity.
The drawback is that the scatter fraction increases by a factor of 3. Non-uniform axial sensitivity
Higher Randoms Rates → Increased Noise (offsets sensitivity gain)
Dead-time problems when using slow detectors Image reconstruction is more complex
More data
M. Dahlbom Winter 2015 7
Positron Emission Tomography - PET
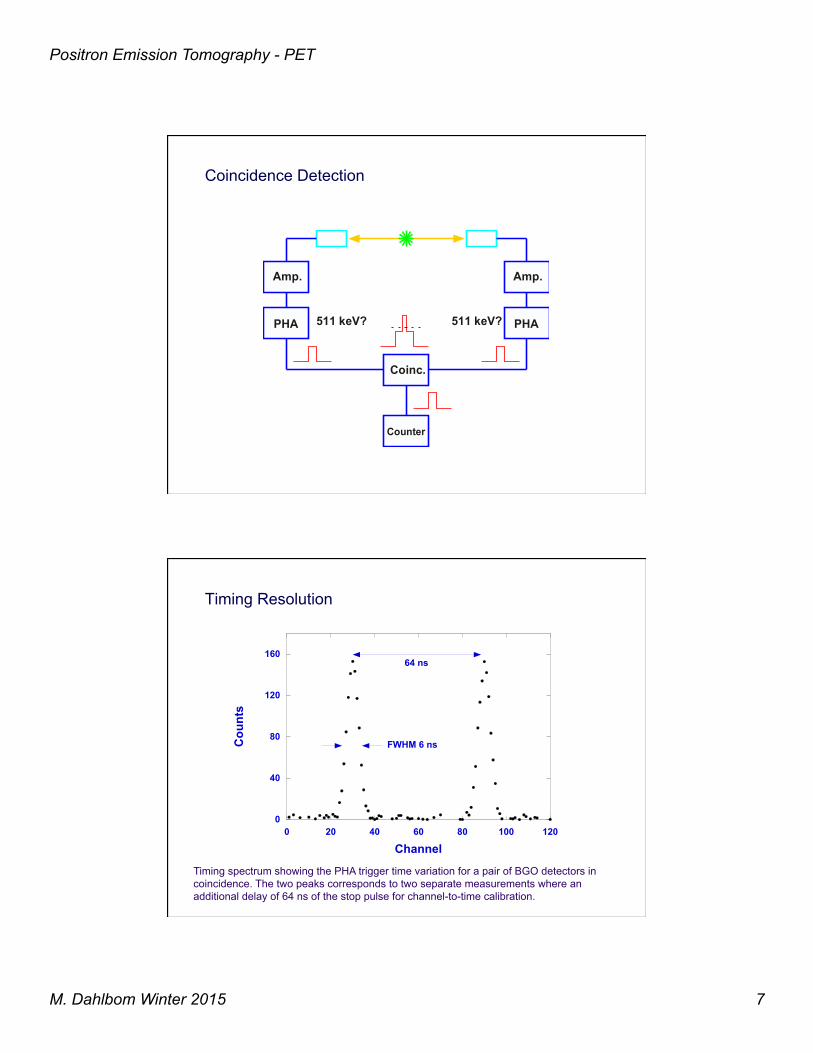
Coincidence Detection
Amp.
PHA
Amp.
PHA
Coinc.
511 keV? 511 keV?
Counter
Timing Resolution
Timing spectrum showing the PHA trigger time variation for a pair of BGO detectors in coincidence. The two peaks corresponds to two separate measurements where an additional delay of 64 ns of the stop pulse for channel-to-time calibration.
0
40
80
120
160
0 20 40 60 80 100 120
Cou
nts
Channel
FWHM 6 ns
64 ns
M. Dahlbom Winter 2015 8
Positron Emission Tomography - PET
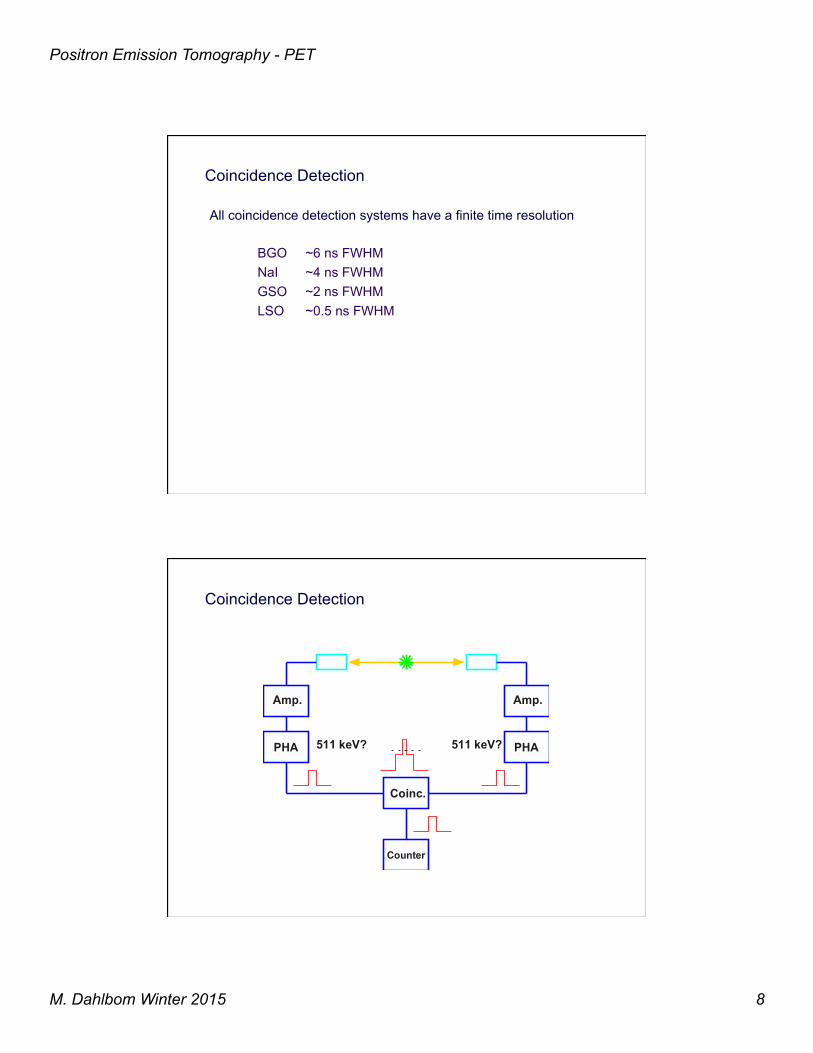
Coincidence Detection
All coincidence detection systems have a finite time resolution
BGO ~6 ns FWHM NaI ~4 ns FWHM GSO ~2 ns FWHM LSO ~0.5 ns FWHM
Coincidence Detection
Amp.
PHA
Amp.
PHA
Coinc.
511 keV? 511 keV?
Counter
M. Dahlbom Winter 2015 9
Positron Emission Tomography - PET
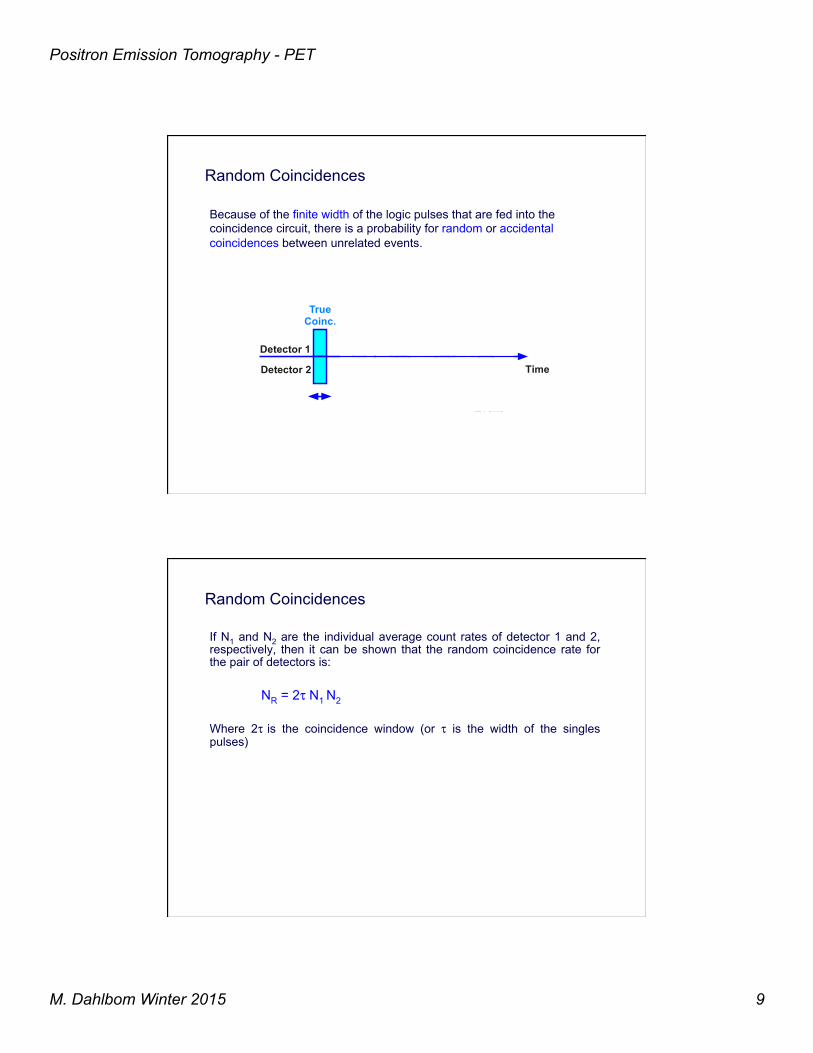
Random Coincidences
Because of the finite width of the logic pulses that are fed into the coincidence circuit, there is a probability for random or accidental coincidences between unrelated events.
t TrueCoinc.
Detector 1
Detector 2 Time
TrueCoinc.
SingleEvent
RandomCoinc.
SingleEvent
Random Coincidences
If N1 and N2 are the individual average count rates of detector 1 and 2, respectively, then it can be shown that the random coincidence rate for the pair of detectors is:
NR = 2τ N1 N2 Where 2τ is the coincidence window (or τ is the width of the singles pulses)
M. Dahlbom Winter 2015 10
Positron Emission Tomography - PET
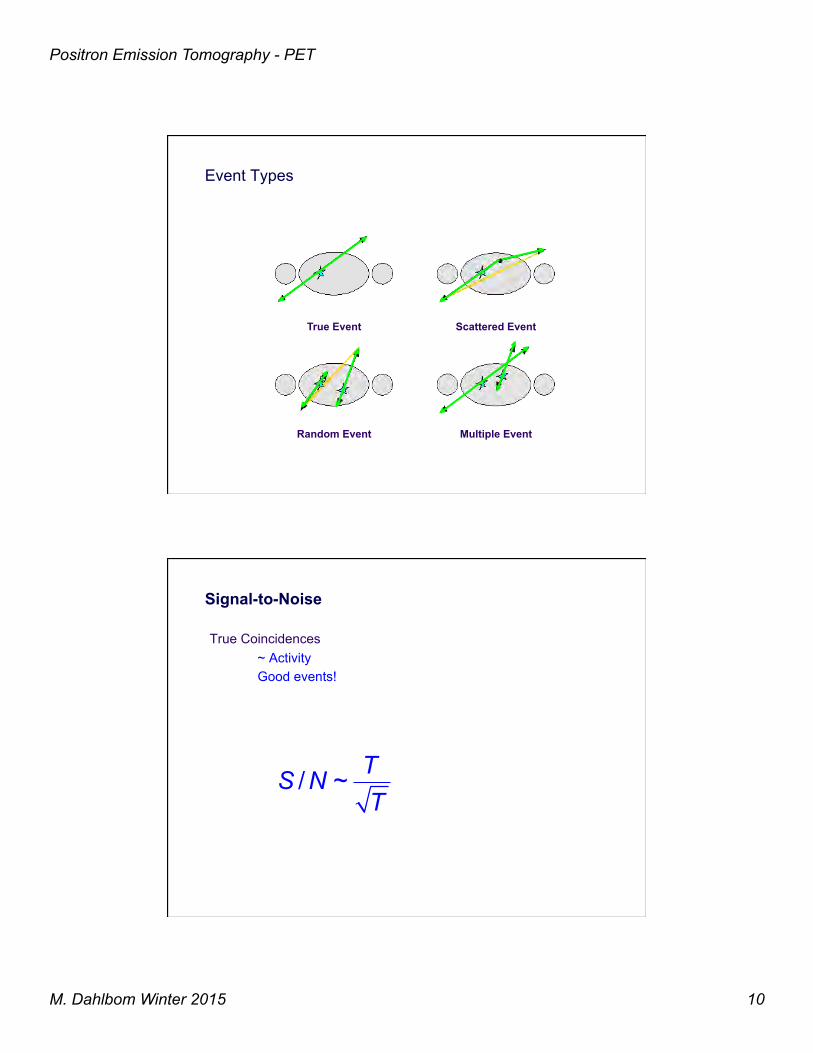
Event Types
True Event Scattered Event
Random Event Multiple Event
True Coincidences ~ Activity Good events!
Signal-to-Noise
/ ~ TS NT
M. Dahlbom Winter 2015 11
Positron Emission Tomography - PET
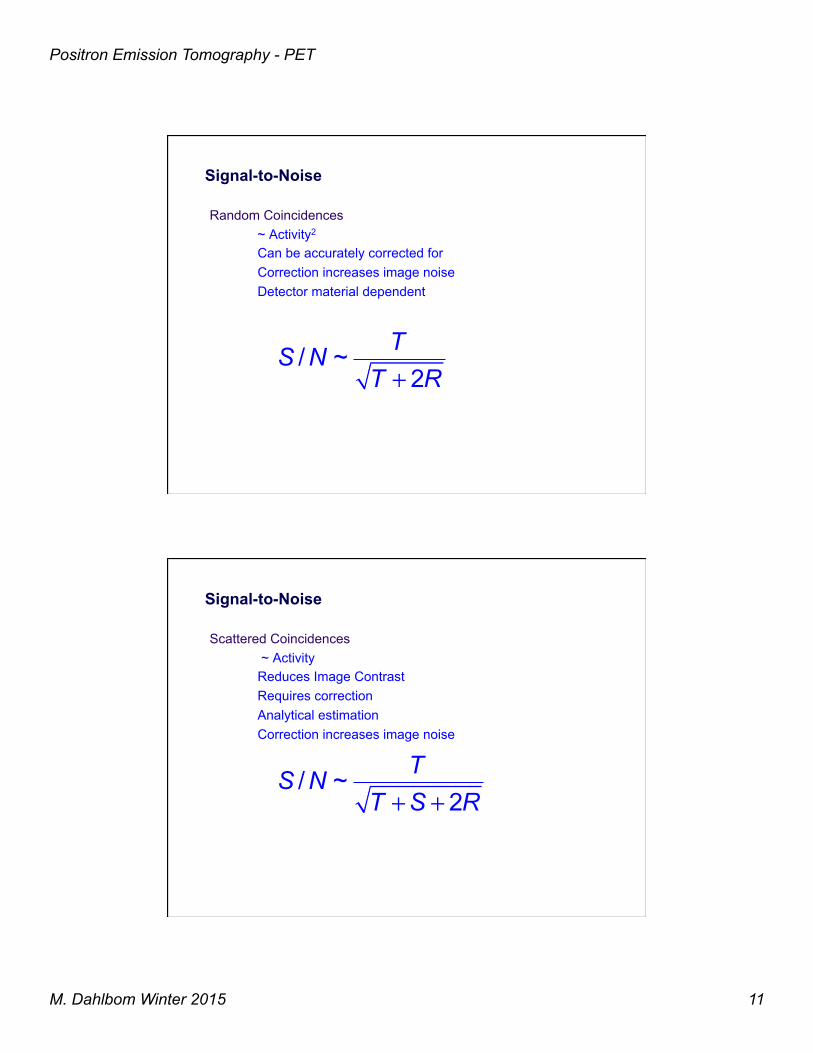
Signal-to-Noise
Random Coincidences ~ Activity2 Can be accurately corrected for Correction increases image noise Detector material dependent
/ ~2
TS NT R+
Signal-to-Noise
Scattered Coincidences ~ Activity Reduces Image Contrast Requires correction Analytical estimation Correction increases image noise
/ ~2
TS NT S R+ +
M. Dahlbom Winter 2015 12
Positron Emission Tomography - PET
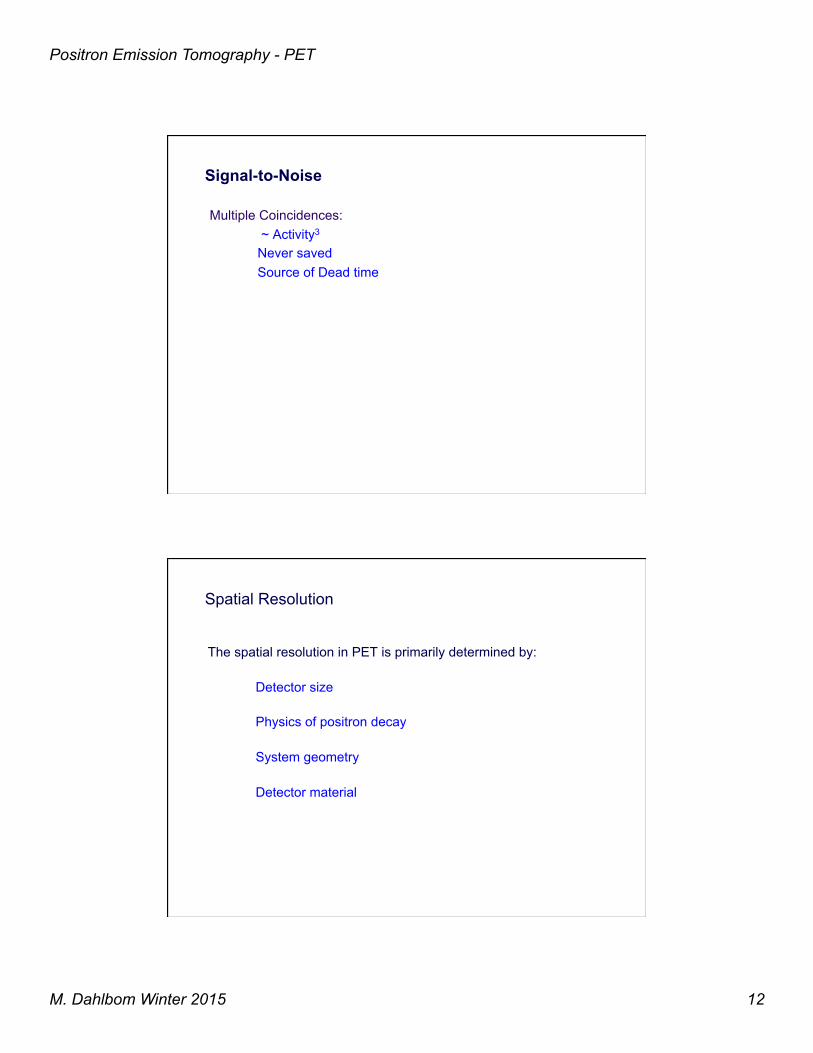
Signal-to-Noise
Multiple Coincidences: ~ Activity3 Never saved Source of Dead time
Spatial Resolution
The spatial resolution in PET is primarily determined by:
Detector size
Physics of positron decay
System geometry
Detector material
M. Dahlbom Winter 2015 13
Positron Emission Tomography - PET
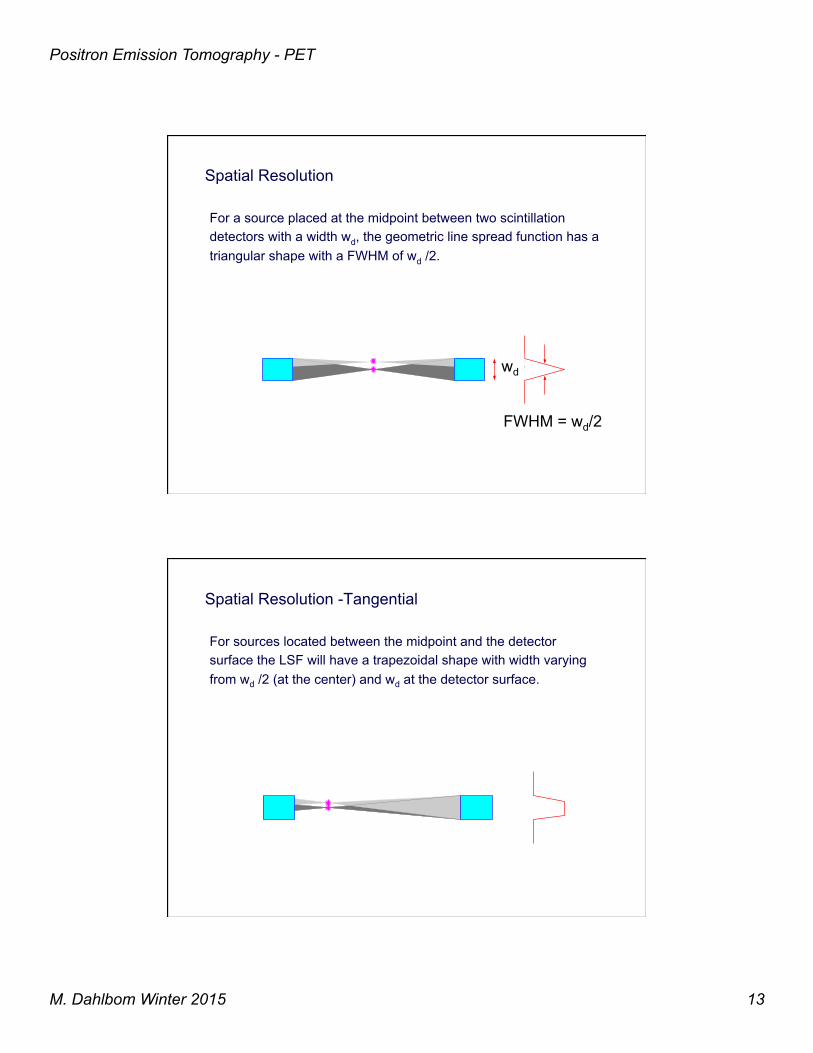
Spatial Resolution
For a source placed at the midpoint between two scintillation detectors with a width wd, the geometric line spread function has a triangular shape with a FWHM of wd /2.
wd2
FWHM=
wdwd
FWHM = wd/2
Spatial Resolution -Tangential
For sources located between the midpoint and the detector surface the LSF will have a trapezoidal shape with width varying from wd /2 (at the center) and wd at the detector surface.
M. Dahlbom Winter 2015 14
Positron Emission Tomography - PET
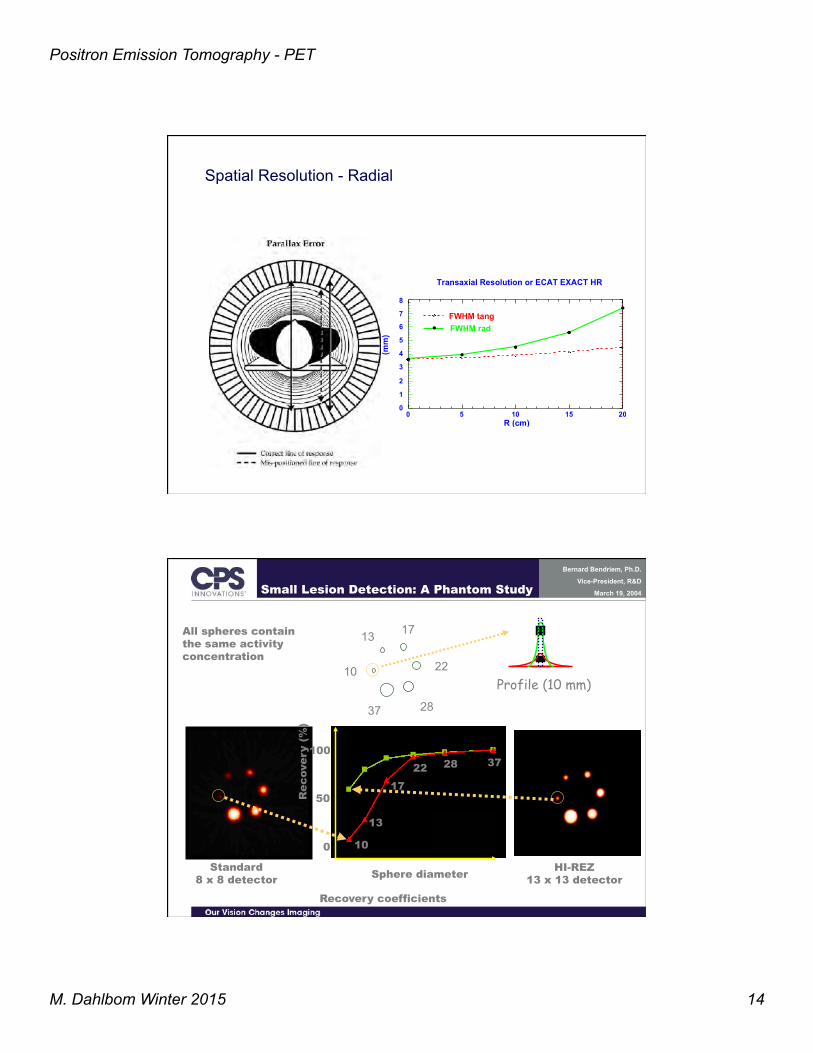
Spatial Resolution - Radial
Radial
R=0
Axial section Tangential
0
1
2
3
4
5
6
7
8
0 5 10 15 20
FWHM tangFWHM rad
FWHM
(mm)
R (cm)
Transaxial Resolution or ECAT EXACT HR
Bernard Bendriem, Ph.D.
Vice-President, R&D
March 19, 2004 Small Lesion Detection: A Phantom Study
10
37 28
22
17 13
Standard 8 x 8 detector
HI-REZ 13 x 13 detector
All spheres contain the same activity concentration
Profile (10 mm)
Sphere diameter
Rec
over
y (%
)
100
50
0 10
37 28 22 17
13
Recovery coefficients
M. Dahlbom Winter 2015 15
Positron Emission Tomography - PET
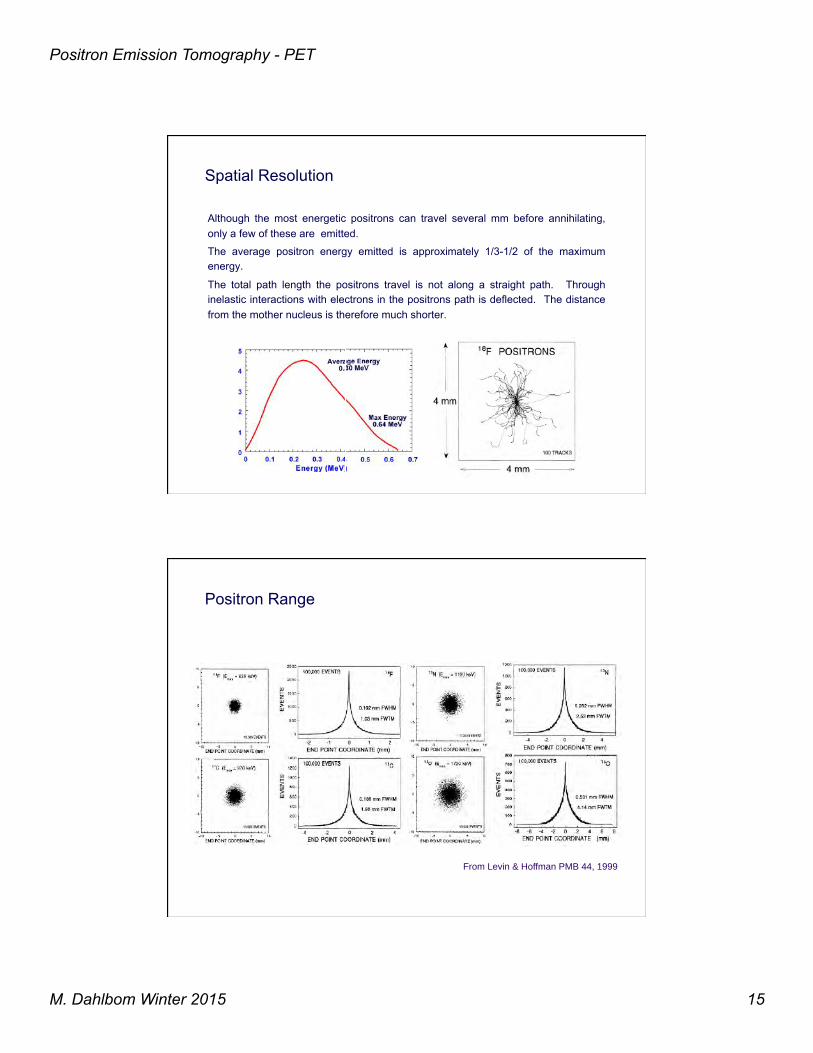
Although the most energetic positrons can travel several mm before annihilating, only a few of these are emitted.
The average positron energy emitted is approximately 1/3-1/2 of the maximum energy.
The total path length the positrons travel is not along a straight path. Through inelastic interactions with electrons in the positrons path is deflected. The distance from the mother nucleus is therefore much shorter.
Spatial Resolution
Positron Range
From Levin & Hoffman PMB 44, 1999 !
M. Dahlbom Winter 2015 16
Positron Emission Tomography - PET
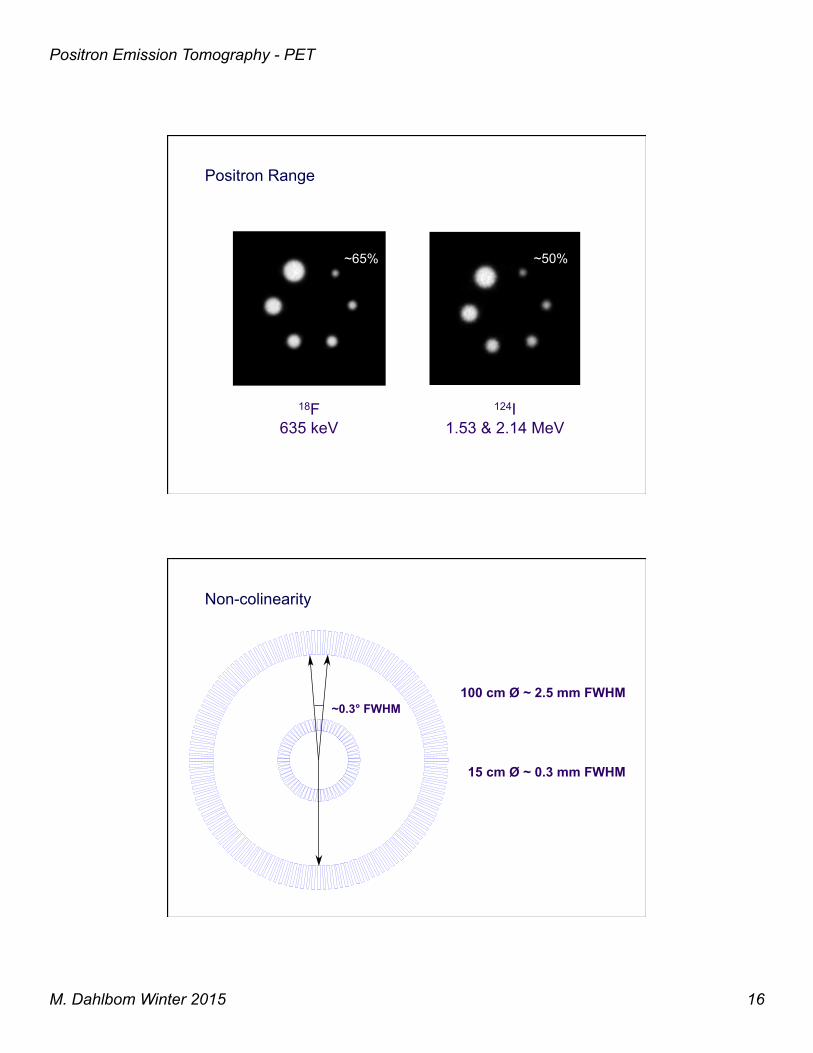
Positron Range
18F 635 keV
124I 1.53 & 2.14 MeV
~65% ~50%
~0.3° FWHM 100 cm Ø ~ 2.5 mm FWHM
15 cm Ø ~ 0.3 mm FWHM
Non-colinearity
M. Dahlbom Winter 2015 17
Positron Emission Tomography - PET
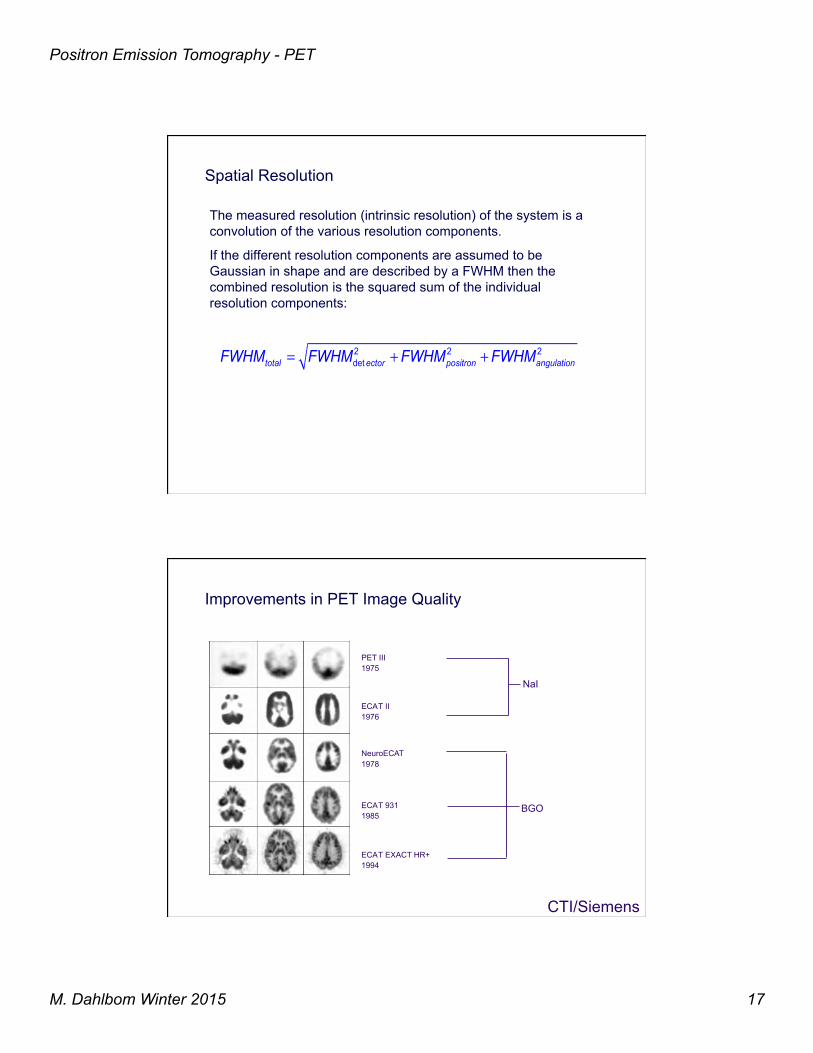
Spatial Resolution
The measured resolution (intrinsic resolution) of the system is a convolution of the various resolution components.
If the different resolution components are assumed to be Gaussian in shape and are described by a FWHM then the combined resolution is the squared sum of the individual resolution components:
2 2 2dettotal ector positron angulationFWHM FWHM FWHM FWHM= + +
ECA T II 1976
PET III 1975
NeuroECAT 1978
ECA T 931 1985
ECA T EXACT HR+ 1994
NaI
BGO
Improvements in PET Image Quality
CTI/Siemens
M. Dahlbom Winter 2015 18
Positron Emission Tomography - PET
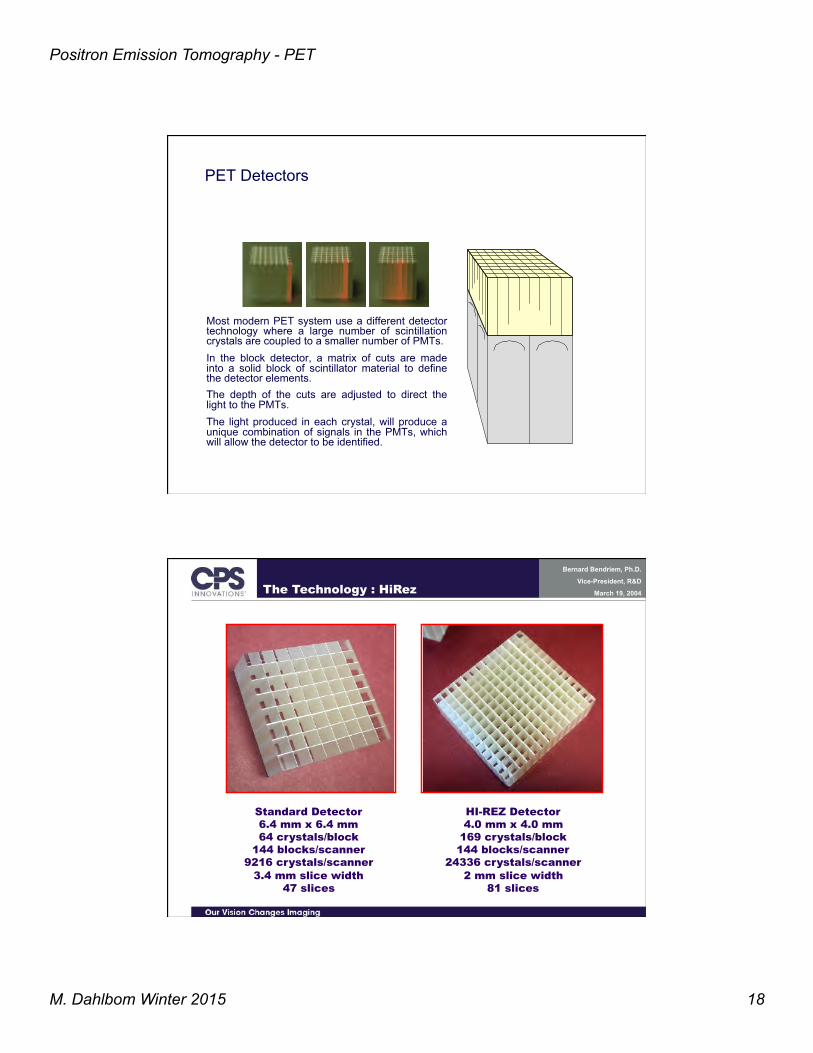
PET Detectors
Most modern PET system use a different detector technology where a large number of scintillation crystals are coupled to a smaller number of PMTs. In the block detector, a matrix of cuts are made into a solid block of scintillator material to define the detector elements. The depth of the cuts are adjusted to direct the light to the PMTs. The light produced in each crystal, will produce a unique combination of signals in the PMTs, which will allow the detector to be identified.
Bernard Bendriem, Ph.D.
Vice-President, R&D
March 19, 2004
Standard Detector 6.4 mm x 6.4 mm 64 crystals/block
144 blocks/scanner 9216 crystals/scanner
3.4 mm slice width 47 slices
HI-REZ Detector 4.0 mm x 4.0 mm
169 crystals/block 144 blocks/scanner
24336 crystals/scanner 2 mm slice width
81 slices
The Technology : HiRez
M. Dahlbom Winter 2015 19
Positron Emission Tomography - PET
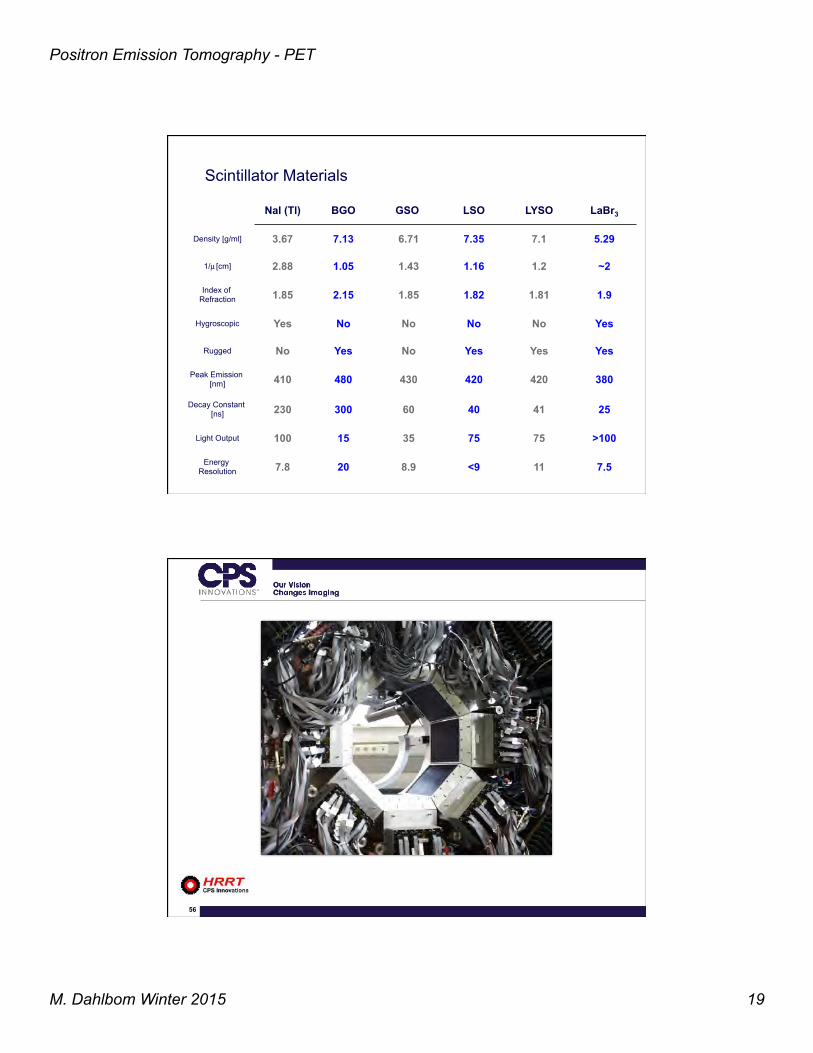
NaI (Tl) BGO GSO LSO LYSO LaBr3
Density [g/ml] 3.67 7.13 6.71 7.35 7.1 5.29
1/µ [cm] 2.88 1.05 1.43 1.16 1.2 ~2
Index of Refraction 1.85 2.15 1.85 1.82 1.81 1.9
Hygroscopic Yes No No No No Yes
Rugged No Yes No Yes Yes Yes
Peak Emission [nm] 410 480 430 420 420 380
Decay Constant [ns] 230 300 60 40 41 25
Light Output 100 15 35 75 75 >100
Energy Resolution 7.8 20 8.9 <9 11 7.5
Scintillator Materials
56 Presentation Title Goes In This Area
M. Dahlbom Winter 2015 20
Positron Emission Tomography - PET
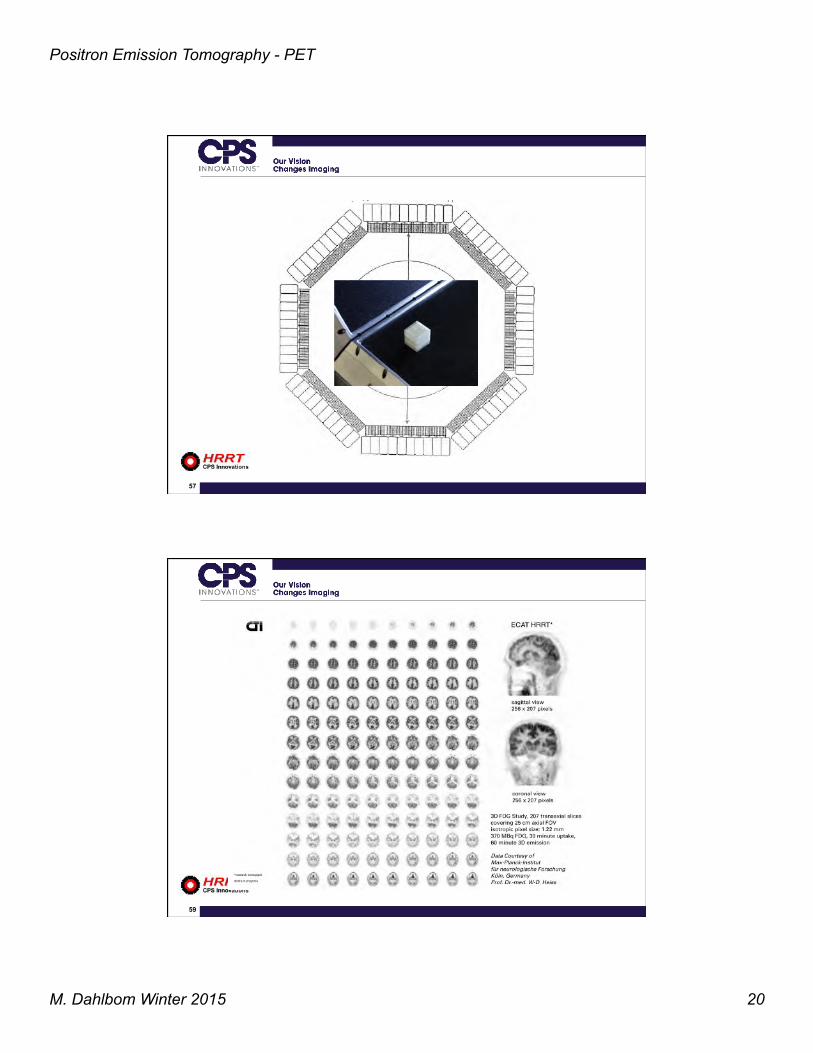
57 Presentation Title Goes In This Area
59 Presentation Title Goes In This Area
M. Dahlbom Winter 2015 21
Positron Emission Tomography - PET
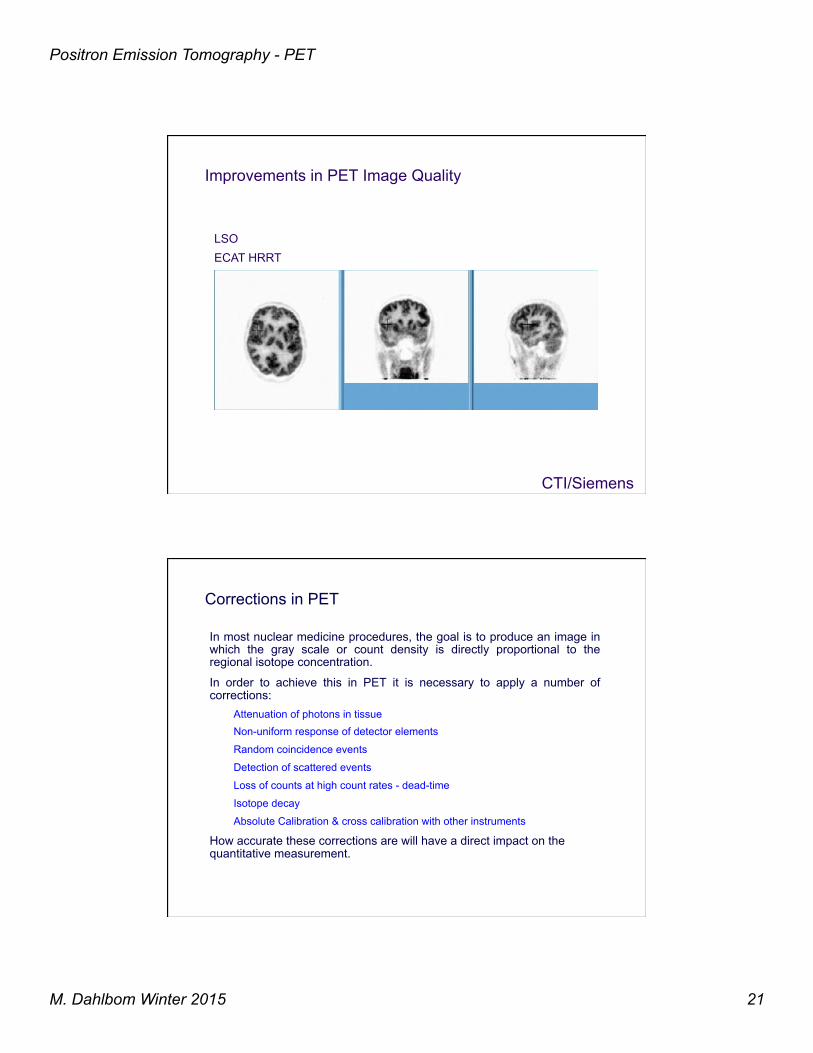
LSO
Improvements in PET Image Quality
ECAT HRRT
CTI/Siemens
Corrections in PET
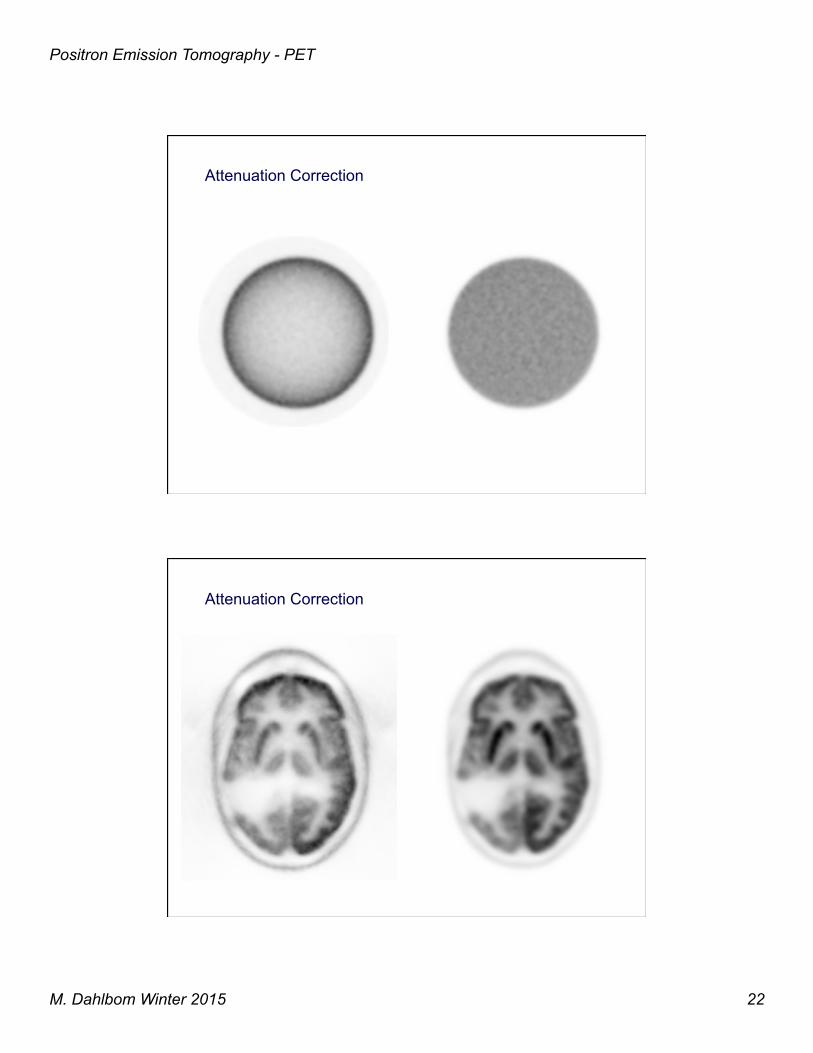
In most nuclear medicine procedures, the goal is to produce an image in which the gray scale or count density is directly proportional to the regional isotope concentration.
In order to achieve this in PET it is necessary to apply a number of corrections:
Attenuation of photons in tissue Non-uniform response of detector elements
Random coincidence events
Detection of scattered events
Loss of counts at high count rates - dead-time
Isotope decay
Absolute Calibration & cross calibration with other instruments
How accurate these corrections are will have a direct impact on the quantitative measurement.
M. Dahlbom Winter 2015 22
Positron Emission Tomography - PET
Attenuation Correction
Attenuation Correction
M. Dahlbom Winter 2015 23
Positron Emission Tomography - PET
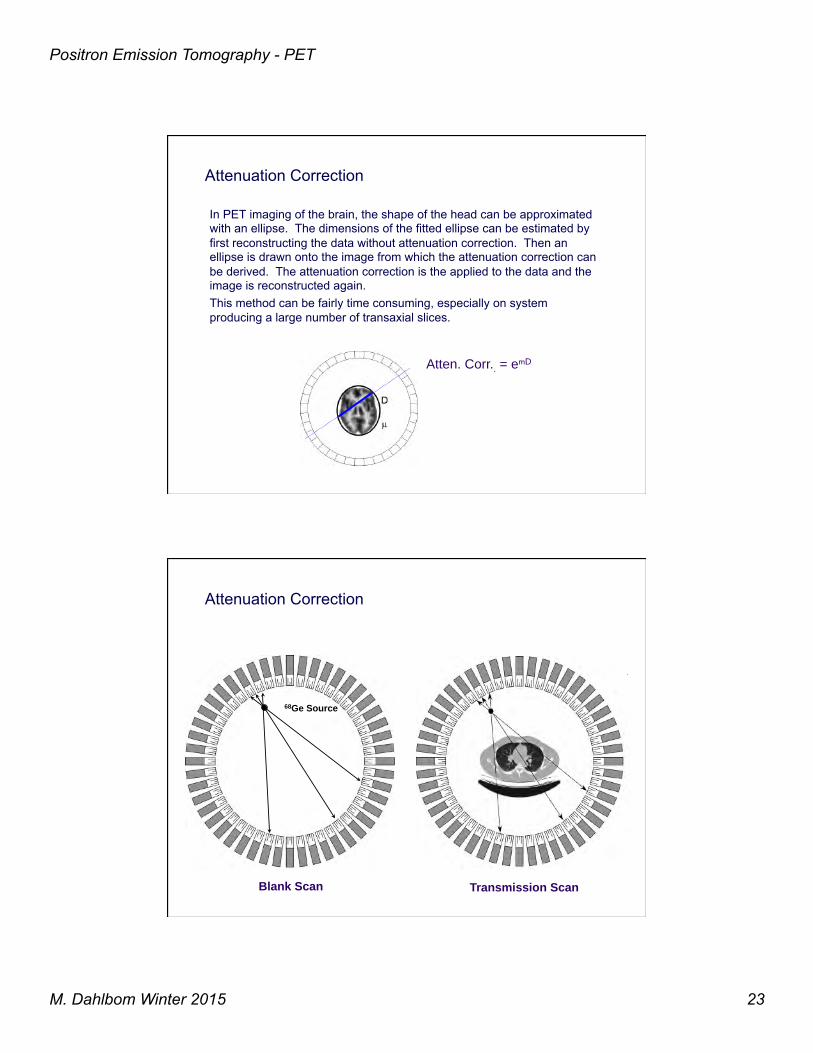
Attenuation Correction
In PET imaging of the brain, the shape of the head can be approximated with an ellipse. The dimensions of the fitted ellipse can be estimated by first reconstructing the data without attenuation correction. Then an ellipse is drawn onto the image from which the attenuation correction can be derived. The attenuation correction is the applied to the data and the image is reconstructed again. This method can be fairly time consuming, especially on system producing a large number of transaxial slices.
Atten. Corr.. = emD !
Attenuation Correction
Blank Scan! Transmission Scan!
68Ge Source!
M. Dahlbom Winter 2015 24
Positron Emission Tomography - PET
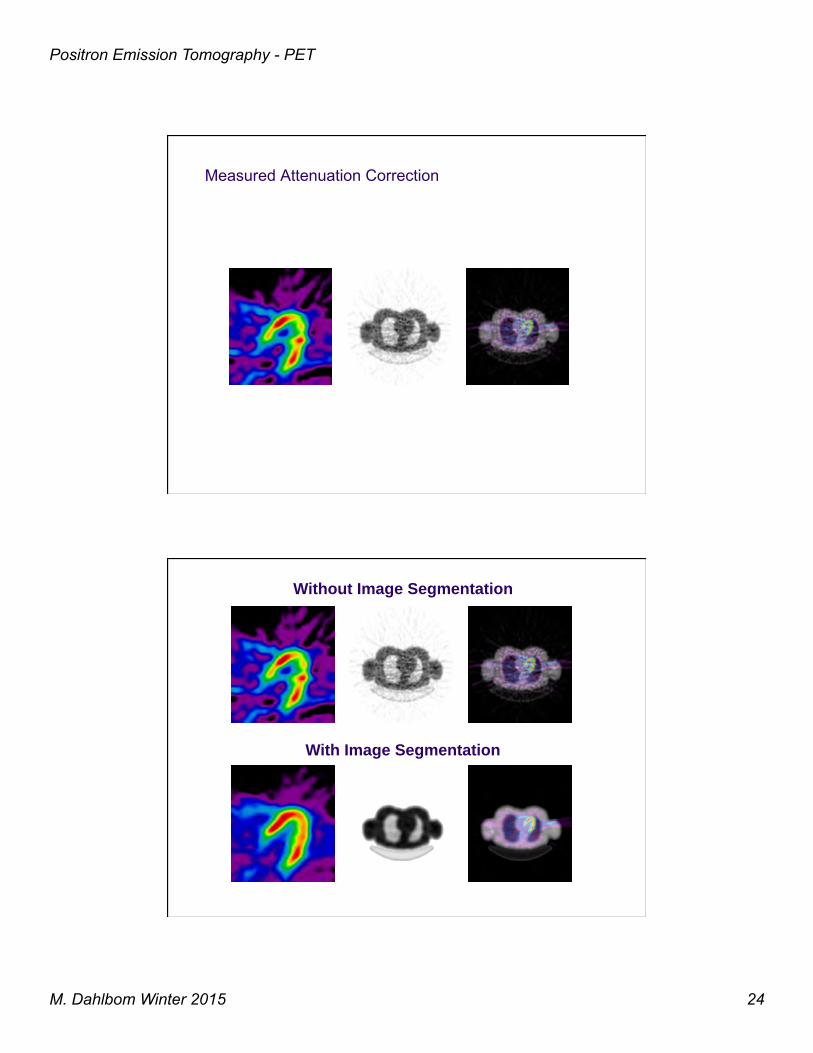
Measured Attenuation Correction
Without Image Segmentation!
With Image Segmentation!
M. Dahlbom Winter 2015 25
Positron Emission Tomography - PET
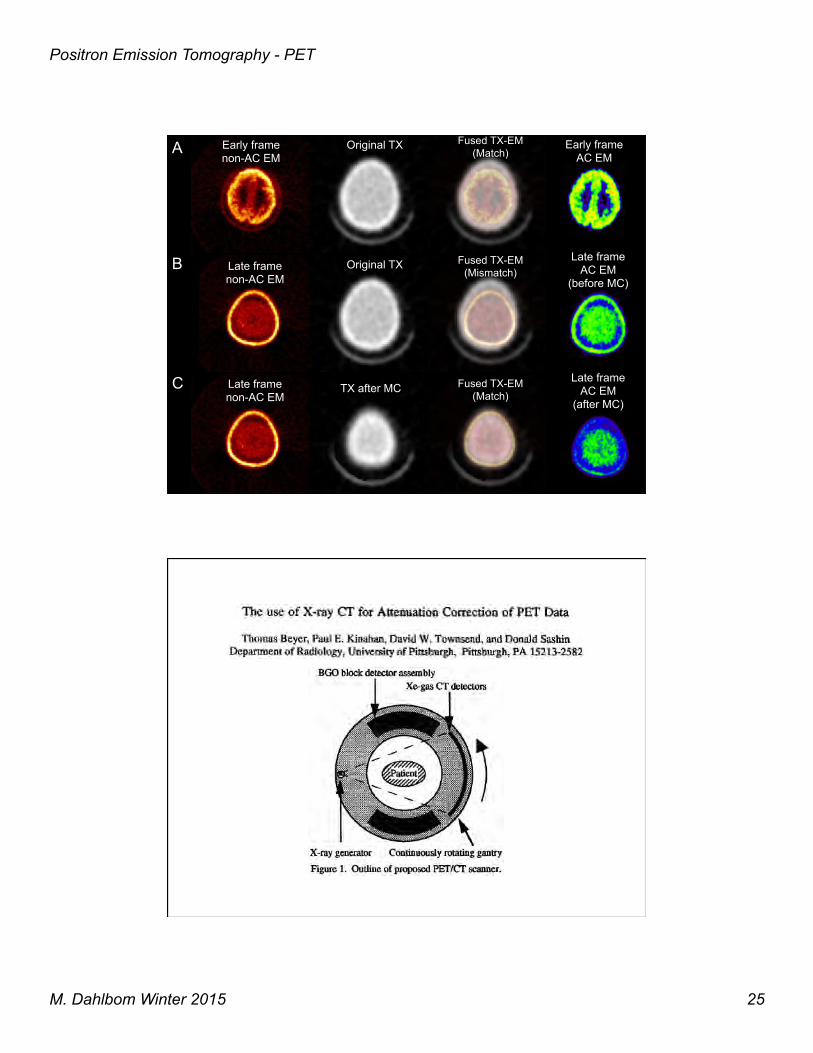
A Early frame non-AC EM
Fused TX-EM (Match)
Original TX Early frame AC EM
C TX after MC Fused TX-EM (Match)
Late frame non-AC EM
Late frame AC EM
(after MC)
B Late frame non-AC EM
Original TX Fused TX-EM (Mismatch)
Late frame AC EM
(before MC)
M. Dahlbom Winter 2015 26
Positron Emission Tomography - PET
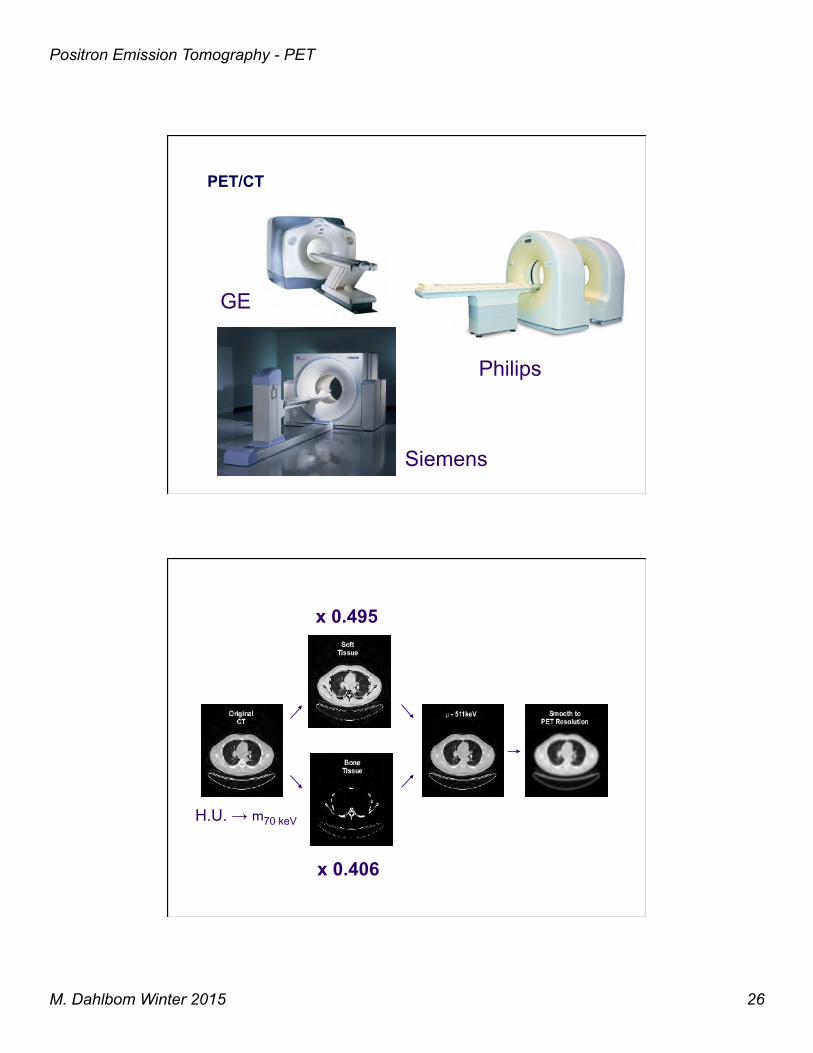
PET/CT
Philips
Siemens
GE
x 0.495
x 0.406
H.U. → m70 keV
M. Dahlbom Winter 2015 27
Positron Emission Tomography - PET
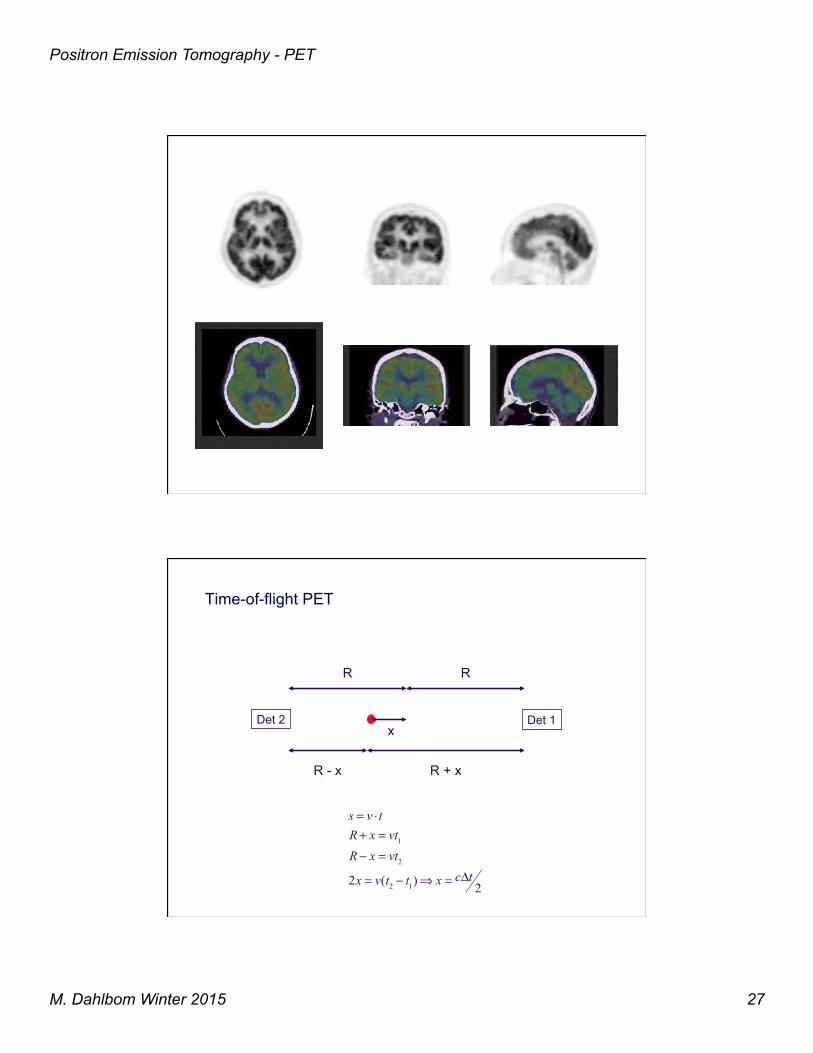
Time-of-flight PET
x
R R
R - x R + x
Det 2 Det 1
s = v ⋅ tR + x = vt1R − x = vt2
2x = v(t2 − t1)⇒ x = cΔt2
M. Dahlbom Winter 2015 28
Positron Emission Tomography - PET
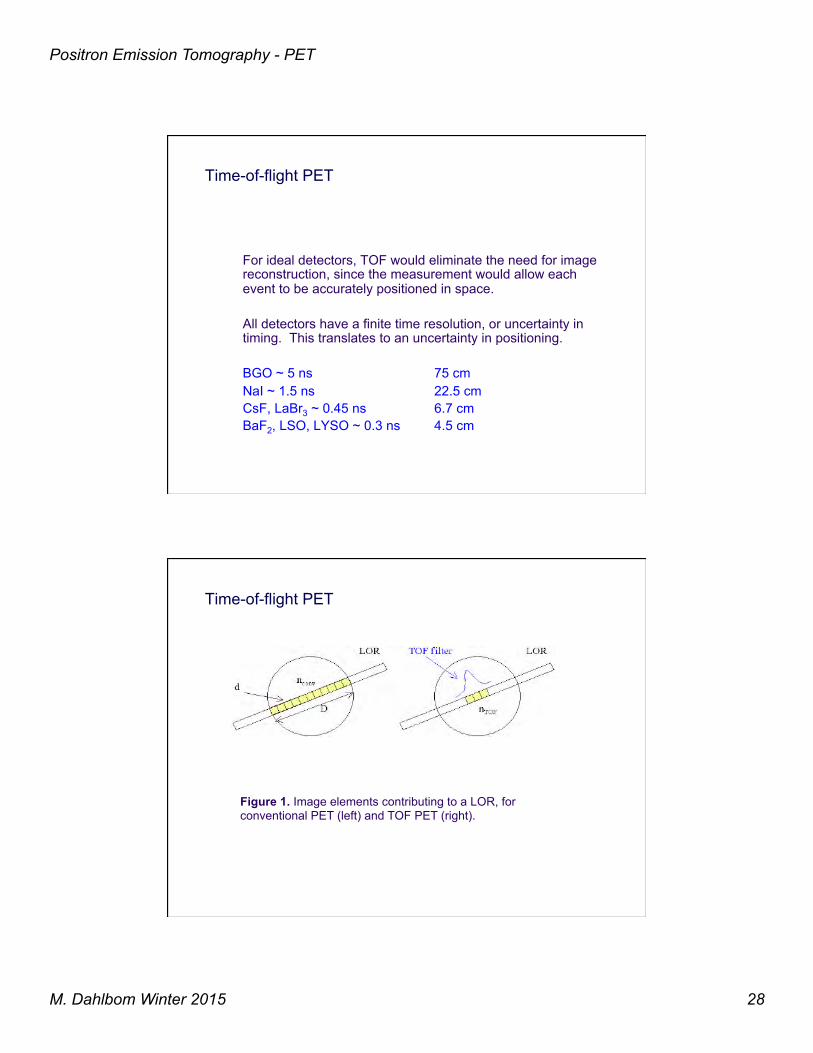
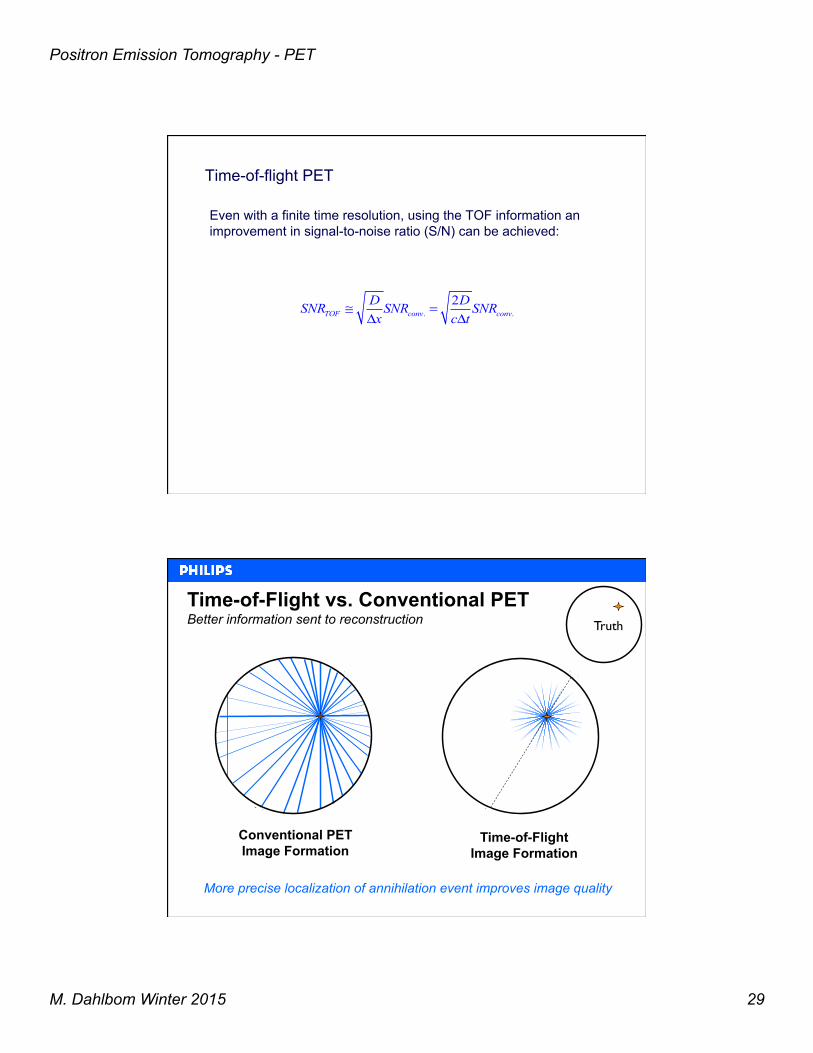
Time-of-flight PET
For ideal detectors, TOF would eliminate the need for image reconstruction, since the measurement would allow each event to be accurately positioned in space. All detectors have a finite time resolution, or uncertainty in timing. This translates to an uncertainty in positioning. BGO ~ 5 ns 75 cm NaI ~ 1.5 ns 22.5 cm CsF, LaBr3 ~ 0.45 ns 6.7 cm BaF2, LSO, LYSO ~ 0.3 ns 4.5 cm
Time-of-flight PET
Figure 1. Image elements contributing to a LOR, for conventional PET (left) and TOF PET (right).
M. Dahlbom Winter 2015 29
Positron Emission Tomography - PET
Time-of-flight PET
Even with a finite time resolution, using the TOF information an improvement in signal-to-noise ratio (S/N) can be achieved:
. .2≅ =
Δ ΔTOF conv convD DSNR SNR SNRx c t
Conventional PET Image Formation
Time-of-Flight Image Formation
More precise localization of annihilation event improves image quality
Truth
Time-of-Flight vs. Conventional PET Better information sent to reconstruction
M. Dahlbom Winter 2015 30
Positron Emission Tomography - PET
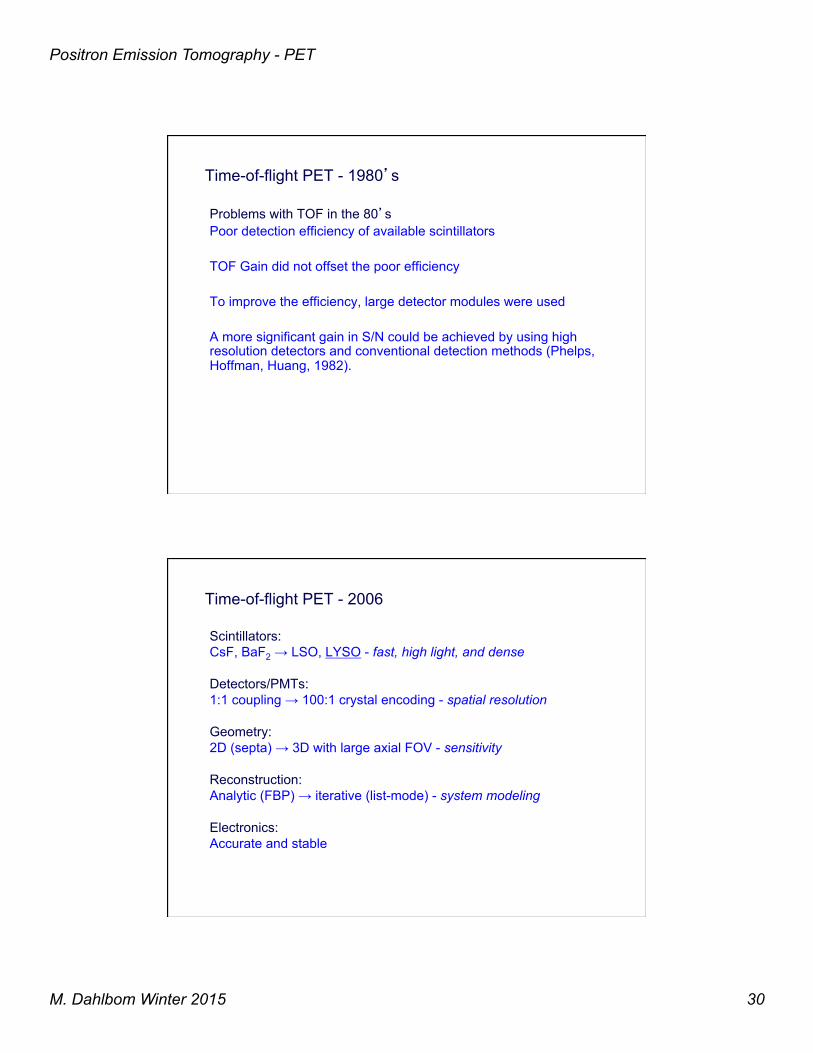
Time-of-flight PET - 1980’s
Problems with TOF in the 80’s Poor detection efficiency of available scintillators TOF Gain did not offset the poor efficiency To improve the efficiency, large detector modules were used A more significant gain in S/N could be achieved by using high resolution detectors and conventional detection methods (Phelps, Hoffman, Huang, 1982).
Time-of-flight PET - 2006
Scintillators: CsF, BaF2 → LSO, LYSO - fast, high light, and dense Detectors/PMTs: 1:1 coupling → 100:1 crystal encoding - spatial resolution Geometry: 2D (septa) → 3D with large axial FOV - sensitivity Reconstruction: Analytic (FBP) → iterative (list-mode) - system modeling Electronics: Accurate and stable
M. Dahlbom Winter 2015 31
Positron Emission Tomography - PET
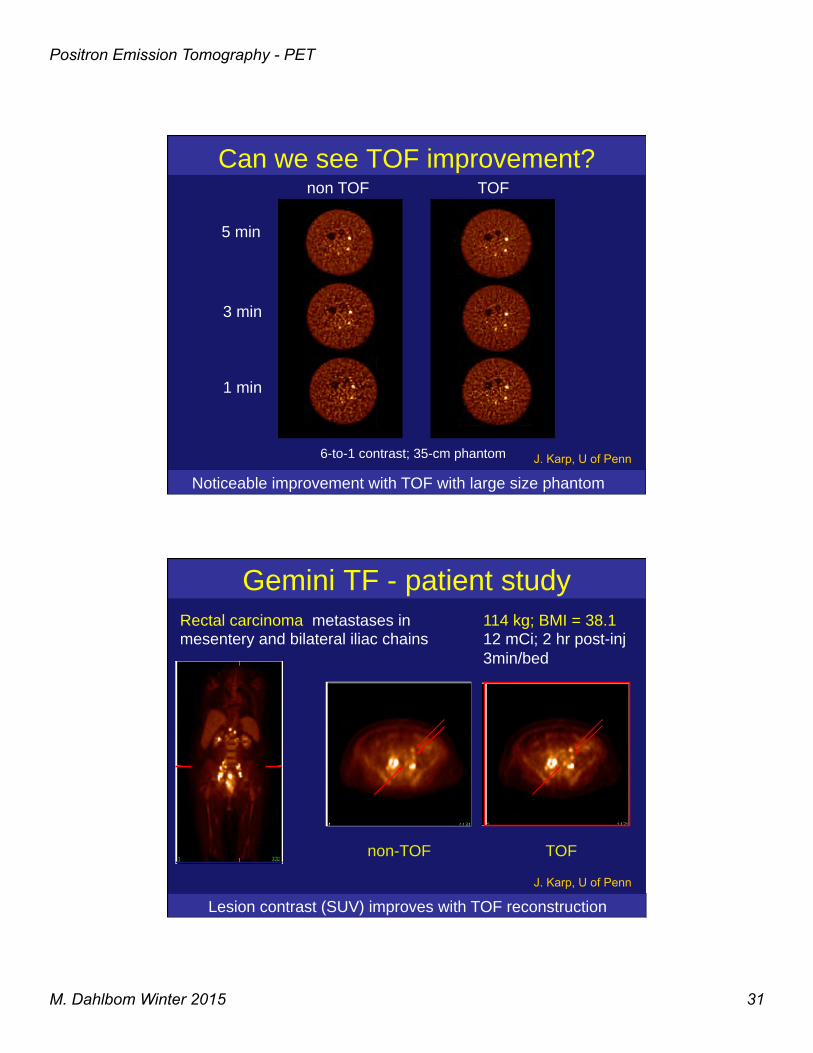
Can we see TOF improvement?
Noticeable improvement with TOF with large size phantom!
1 min!
non TOF! TOF!
3 min!
6-to-1 contrast; 35-cm phantom!
5 min!
J. Karp, U of Penn
non-TOF!
Gemini TF - patient study!Rectal carcinoma, metastases in !mesentery and bilateral iliac chains!
114 kg; BMI = 38.1!12 mCi; 2 hr post-inj!3min/bed !
TOF!
Lesion contrast (SUV) improves with TOF reconstruction!J. Karp, U of Penn
M. Dahlbom Winter 2015 32
Positron Emission Tomography - PET
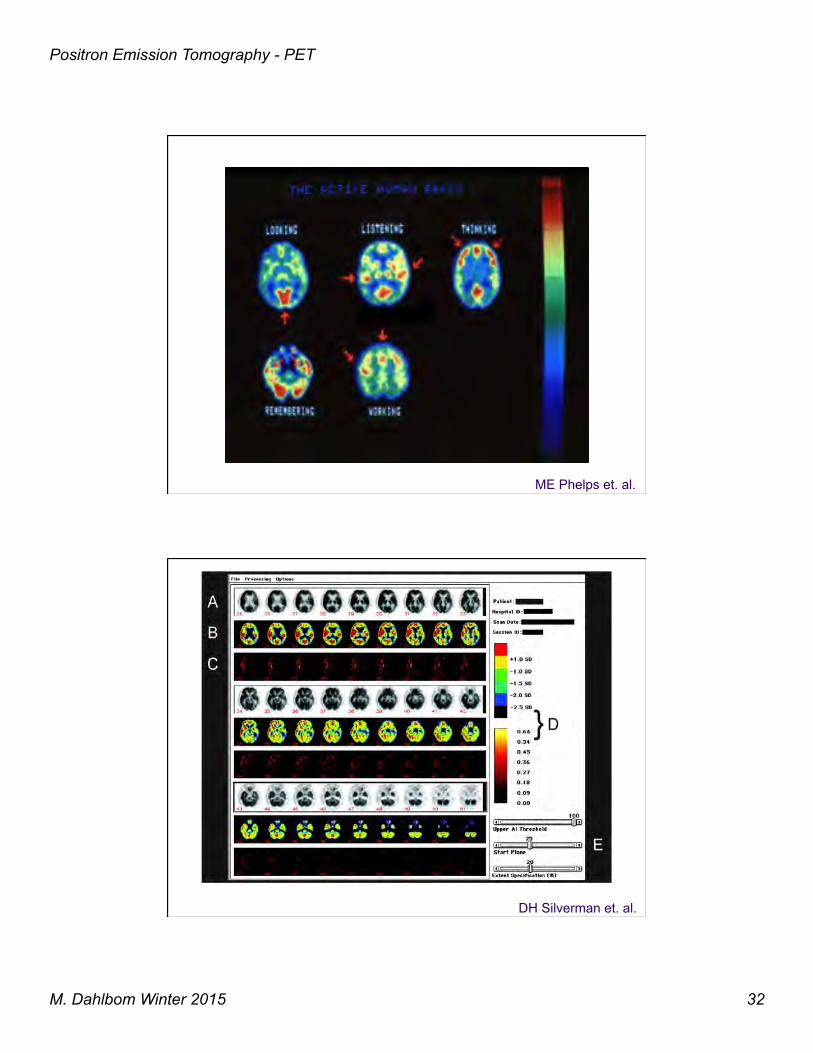
ME Phelps et. al.
DH Silverman et. al.
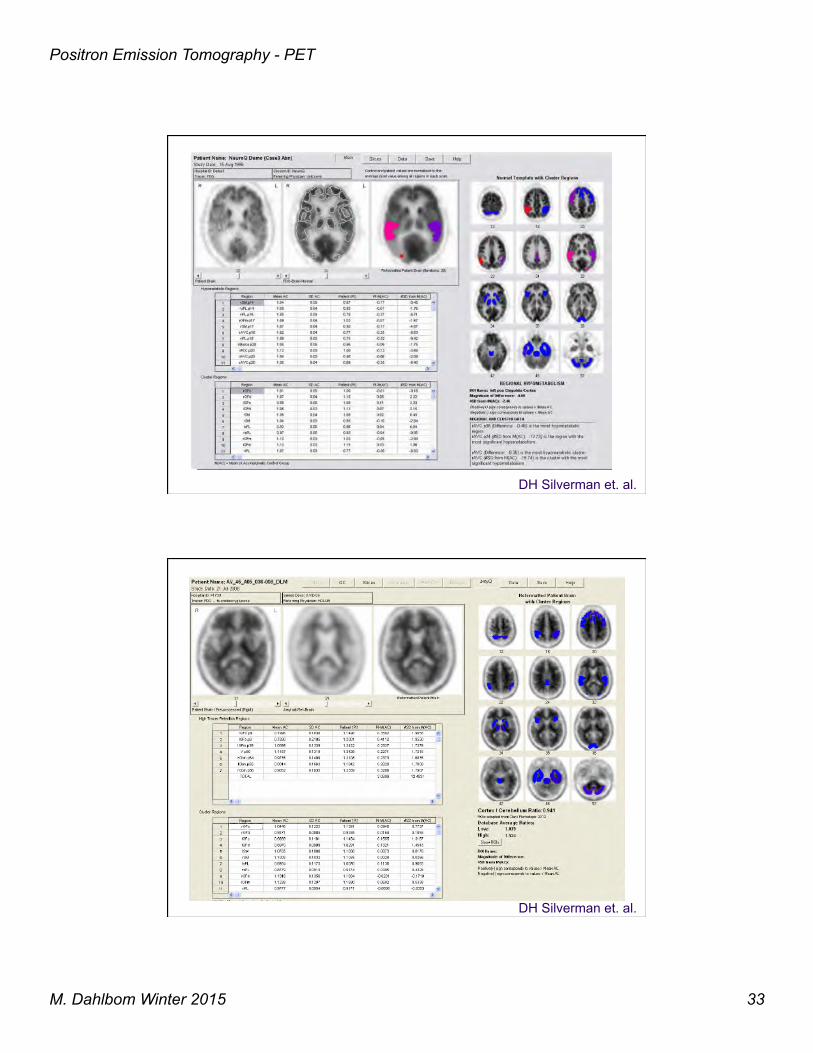
M. Dahlbom Winter 2015 33
Positron Emission Tomography - PET
DH Silverman et. al.
DH Silverman et. al.
M. Dahlbom Winter 2015 34
Positron Emission Tomography - PET
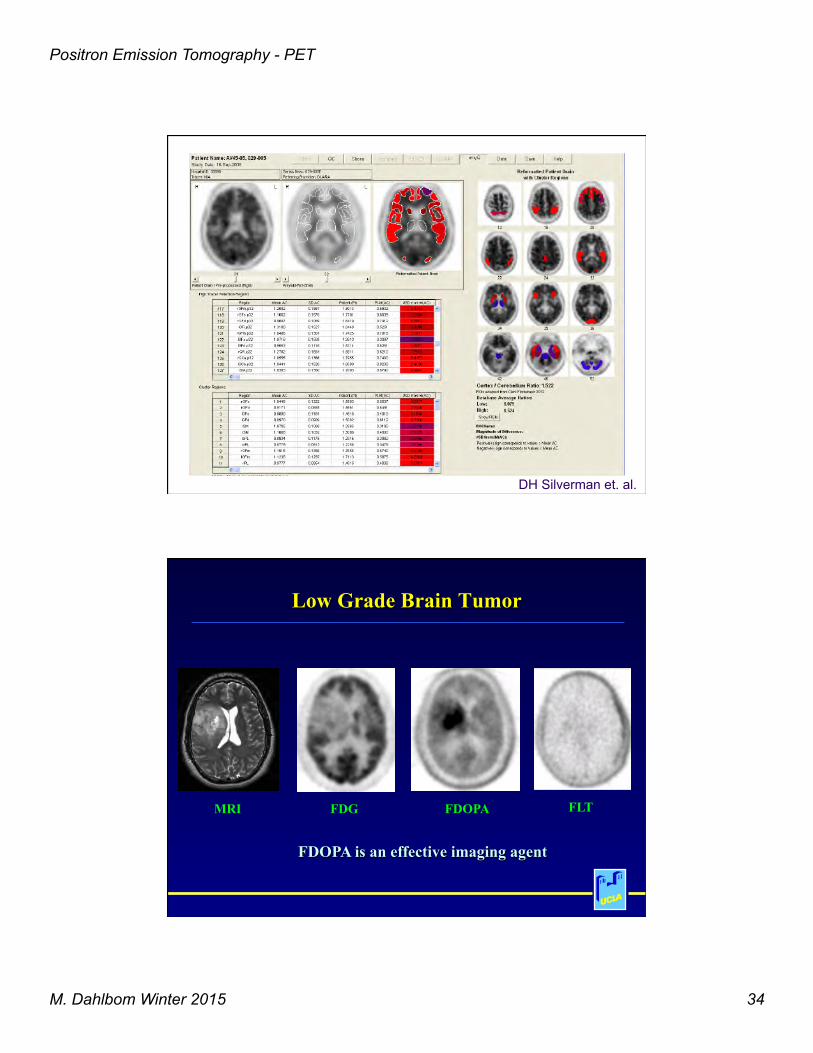
DH Silverman et. al.
FDOPA is an effective imaging agent
MRI FDG FDOPA FLT
Low Grade Brain Tumor
M. Dahlbom Winter 2015 35
Positron Emission Tomography - PET
0.0
0.5
1.0
1.5
2.0
2.5
3.0
0 20 40 60 80
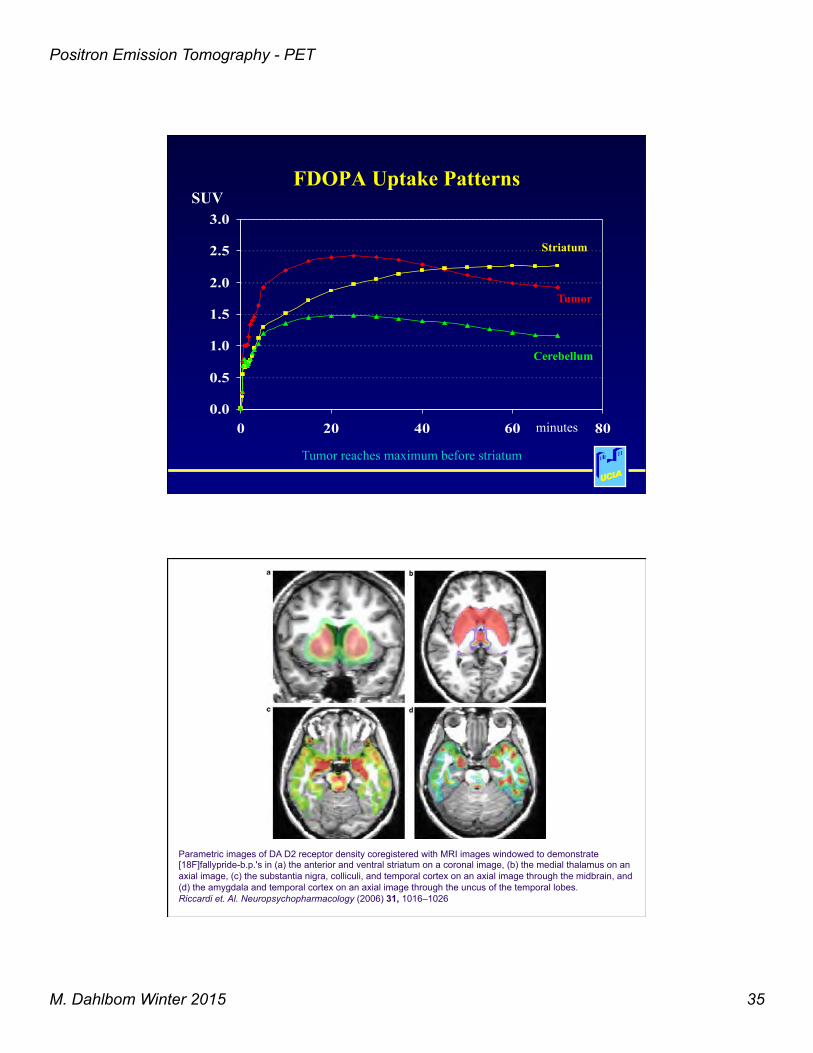
FDOPA Uptake Patterns
Tumor
Cerebellum
Striatum
Tumor reaches maximum before striatum
minutes
SUV
Parametric images of DA D2 receptor density coregistered with MRI images windowed to demonstrate [18F]fallypride-b.p.'s in (a) the anterior and ventral striatum on a coronal image, (b) the medial thalamus on an axial image, (c) the substantia nigra, colliculi, and temporal cortex on an axial image through the midbrain, and (d) the amygdala and temporal cortex on an axial image through the uncus of the temporal lobes. Riccardi et. Al. Neuropsychopharmacology (2006) 31, 1016–1026
M. Dahlbom Winter 2015 36
Positron Emission Tomography - PET
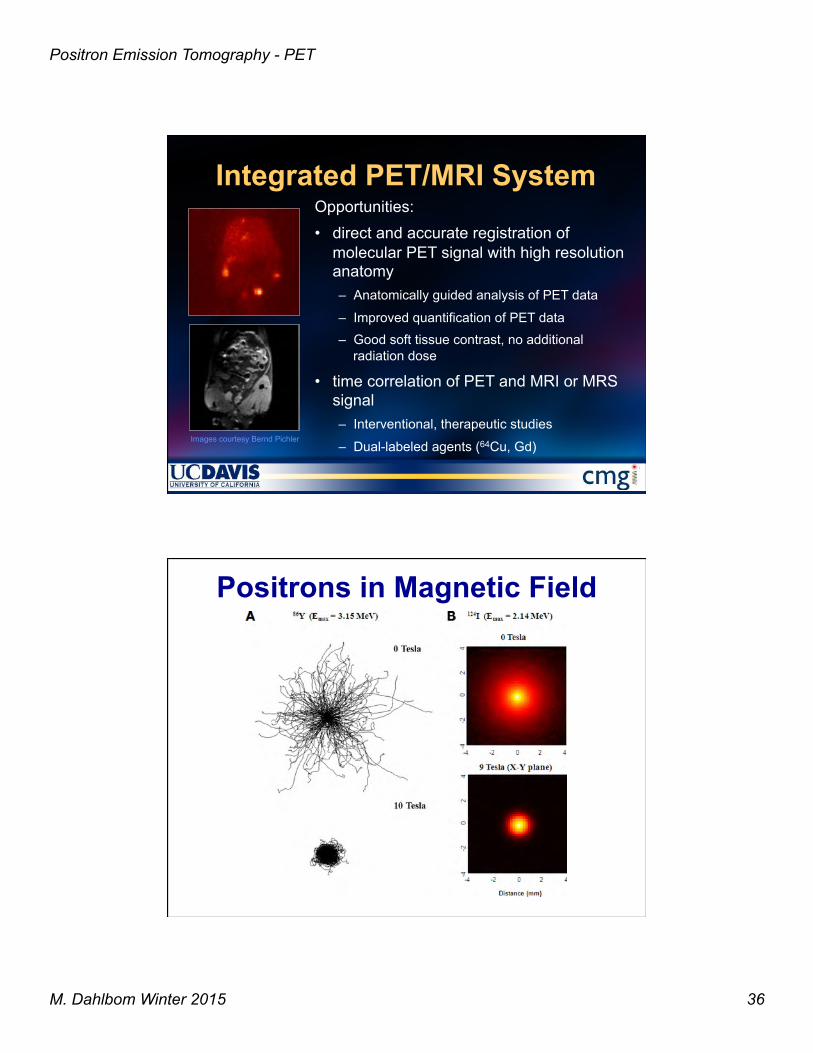
Integrated PET/MRI System Opportunities: • direct and accurate registration of
molecular PET signal with high resolution anatomy – Anatomically guided analysis of PET data
– Improved quantification of PET data – Good soft tissue contrast, no additional
radiation dose
• time correlation of PET and MRI or MRS signal – Interventional, therapeutic studies
– Dual-labeled agents (64Cu, Gd) Images courtesy Bernd Pichler
Positrons in Magnetic Field
M. Dahlbom Winter 2015 37
Positron Emission Tomography - PET
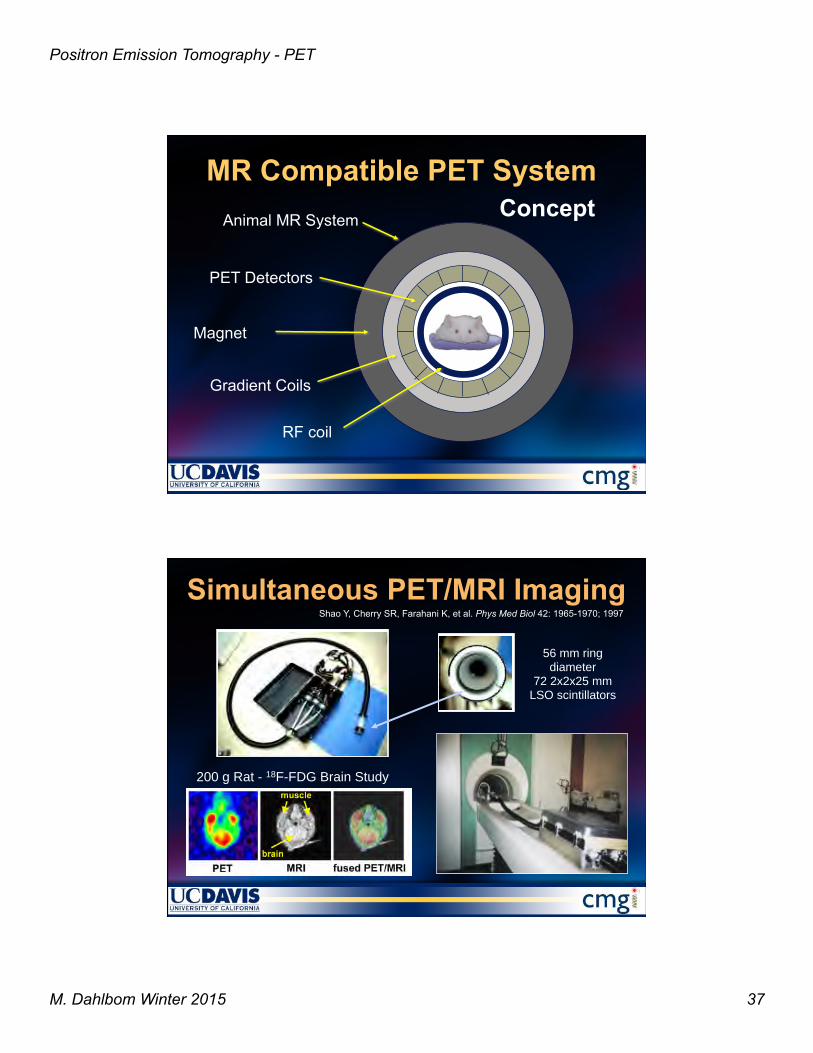
MR Compatible PET System Concept
RF coil
PET Detectors
Animal MR System
Magnet
Gradient Coils
Simultaneous PET/MRI Imaging
56 mm ring !diameter!
72 2x2x25 mm !LSO scintillators!
200 g Rat - 18F-FDG Brain Study!
Shao Y, Cherry SR, Farahani K, et al. Phys Med Biol 42: 1965-1970; 1997
M. Dahlbom Winter 2015 38
Positron Emission Tomography - PET
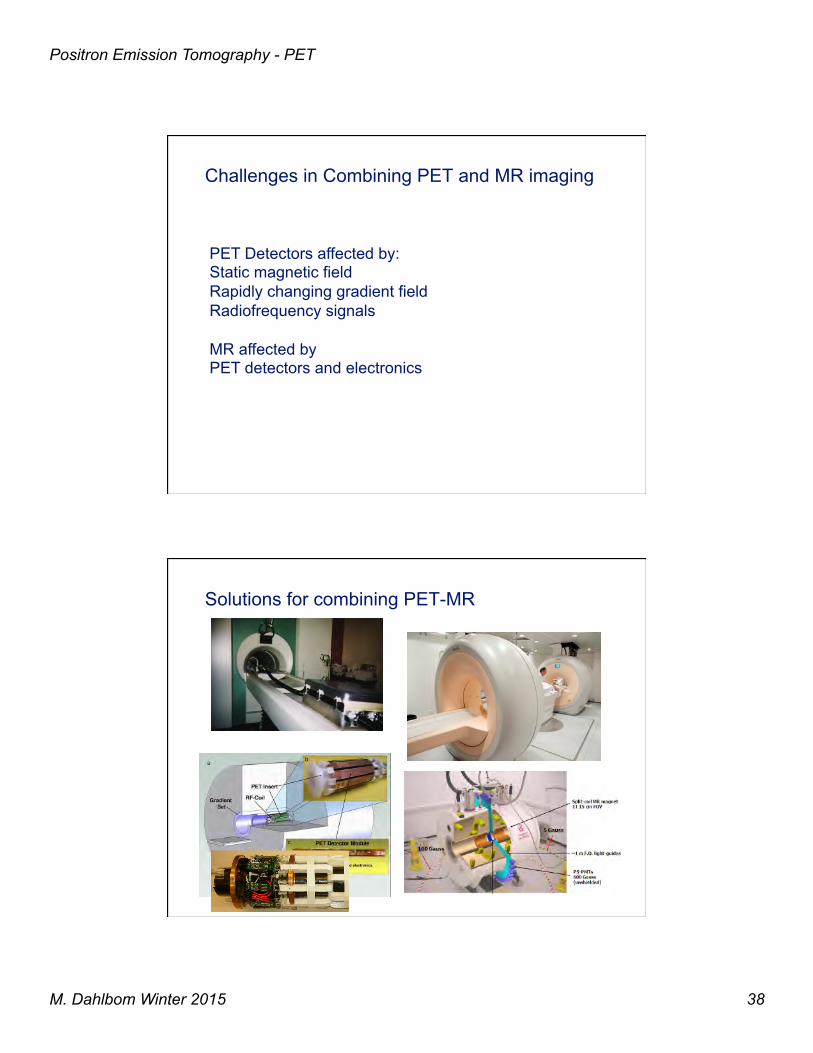
Challenges in Combining PET and MR imaging
PET Detectors affected by: Static magnetic field Rapidly changing gradient field Radiofrequency signals MR affected by PET detectors and electronics
Solutions for combining PET-MR
M. Dahlbom Winter 2015 39
Positron Emission Tomography - PET
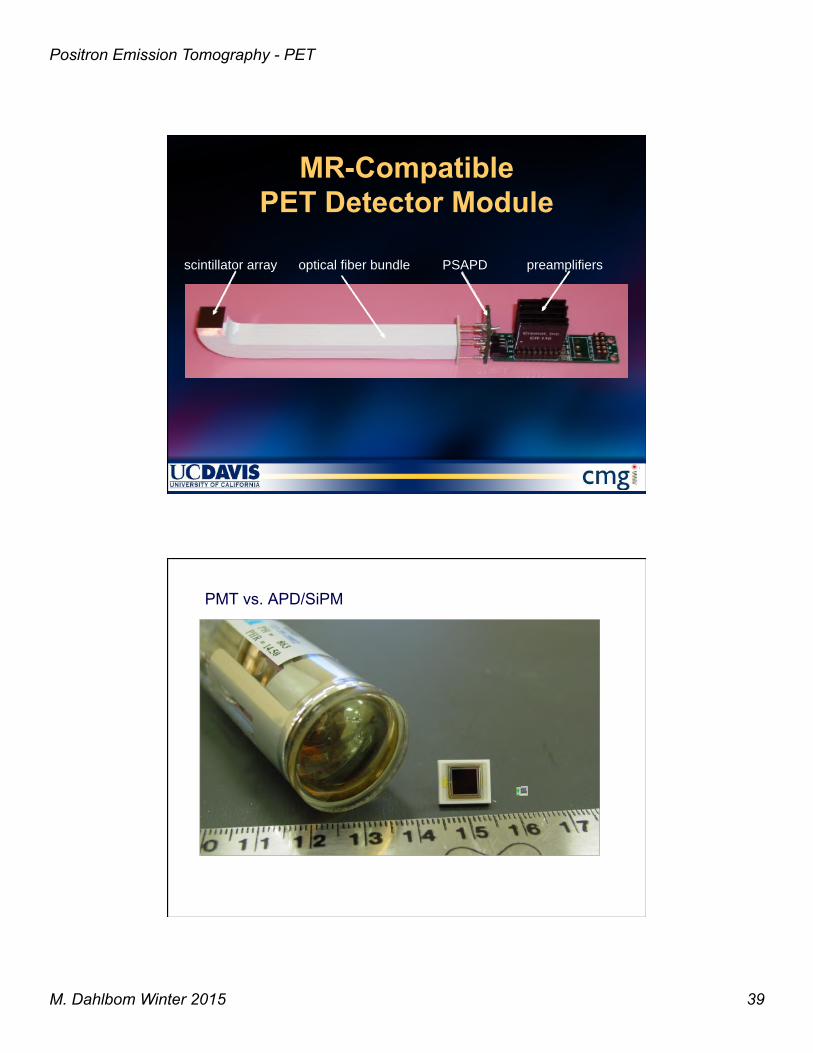
MR-Compatible PET Detector Module
preamplifiers!optical fiber bundle! PSAPD!scintillator array!
PMT vs. APD/SiPM
M. Dahlbom Winter 2015 40
Positron Emission Tomography - PET
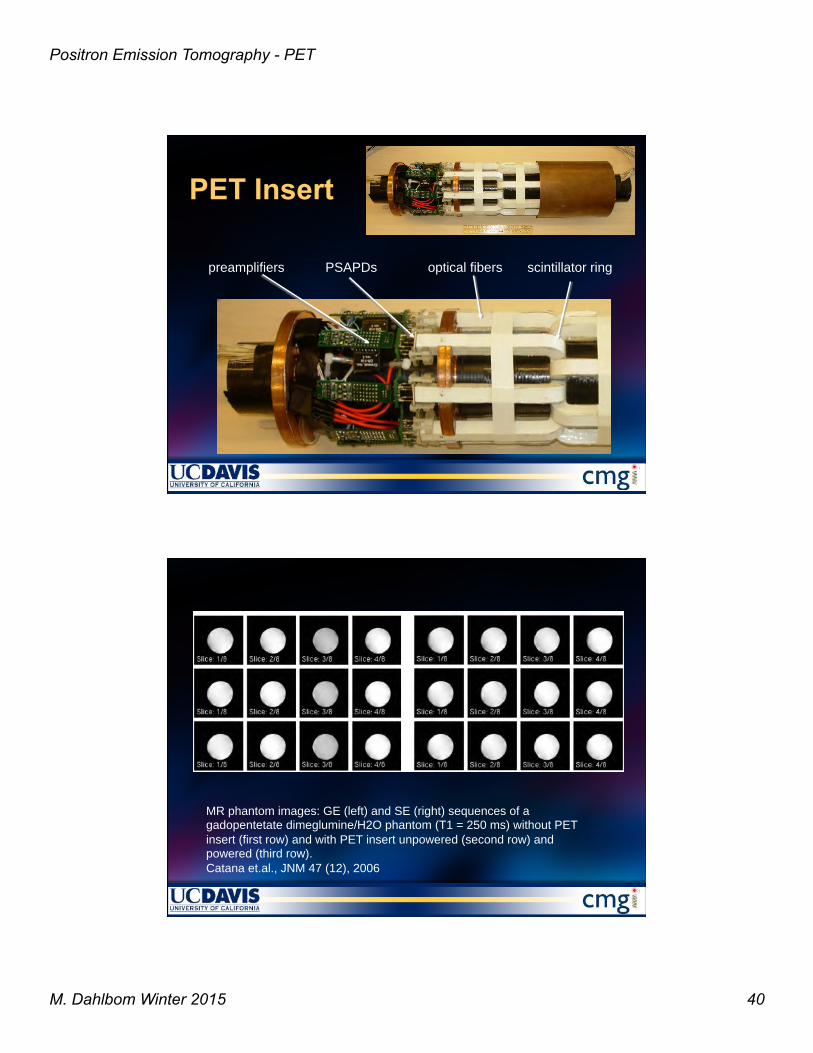
PET Insert
scintillator ring!optical fibers!PSAPDs!preamplifiers!
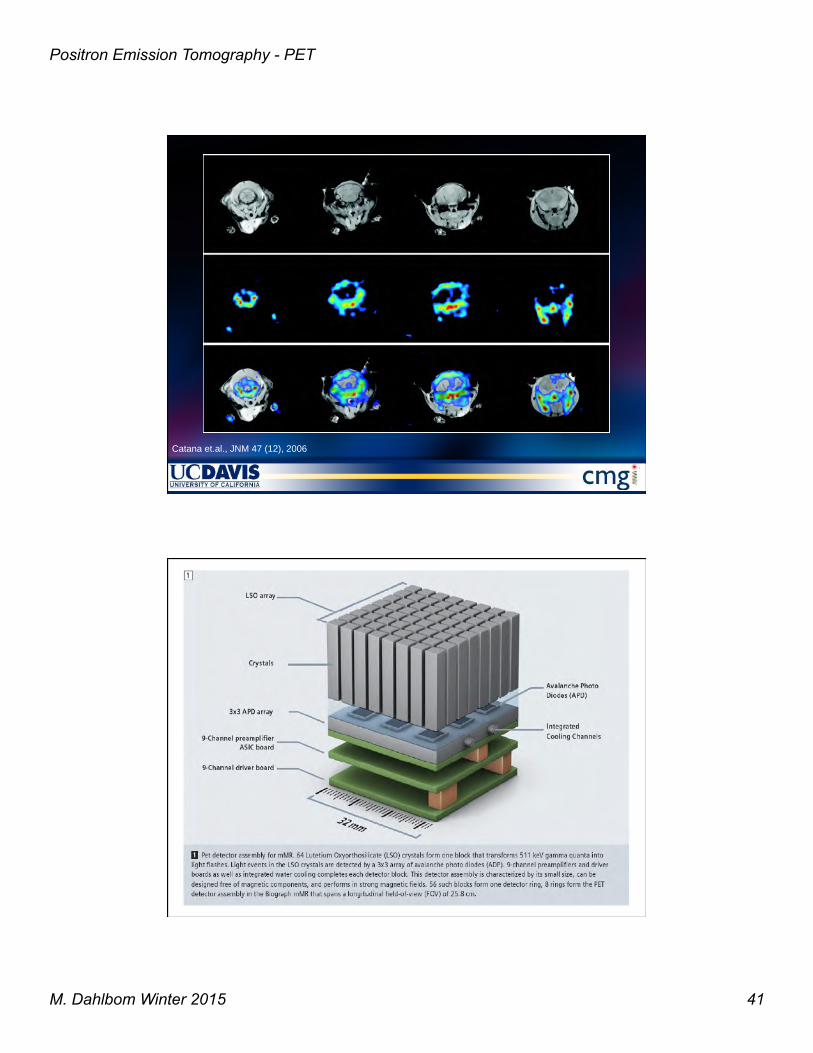
MR phantom images: GE (left) and SE (right) sequences of a gadopentetate dimeglumine/H2O phantom (T1 = 250 ms) without PET insert (first row) and with PET insert unpowered (second row) and powered (third row). !Catana et.al., JNM 47 (12), 2006!
M. Dahlbom Winter 2015 41
Positron Emission Tomography - PET
Catana et.al., JNM 47 (12), 2006!
M. Dahlbom Winter 2015 42
Positron Emission Tomography - PET
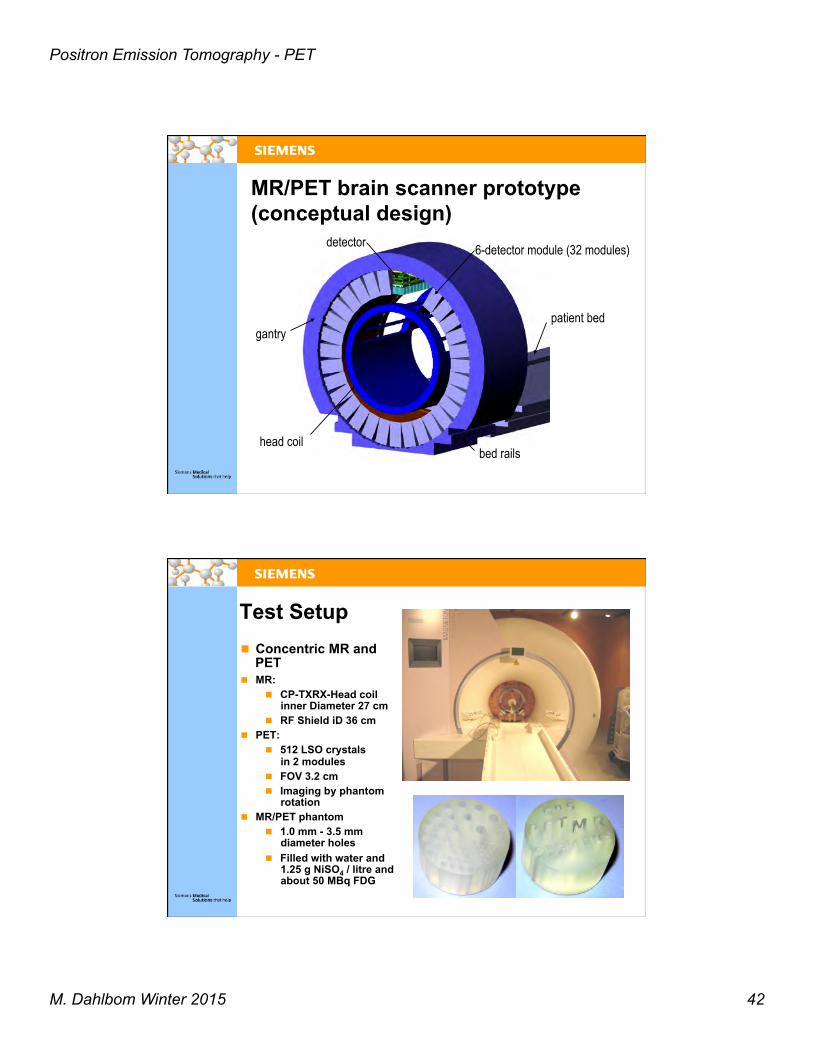
MR/PET brain scanner prototype (conceptual design)
6-detector module (32 modules) detector
gantry
head coil bed rails
patient bed
Test Setup n Concentric MR and
PET n MR:
n CP-TXRX-Head coil inner Diameter 27 cm
n RF Shield iD 36 cm n PET:
n 512 LSO crystals in 2 modules
n FOV 3.2 cm n Imaging by phantom
rotation n MR/PET phantom
n 1.0 mm - 3.5 mm diameter holes
n Filled with water and 1.25 g NiSO4 / litre and about 50 MBq FDG
M. Dahlbom Winter 2015 43
Positron Emission Tomography - PET
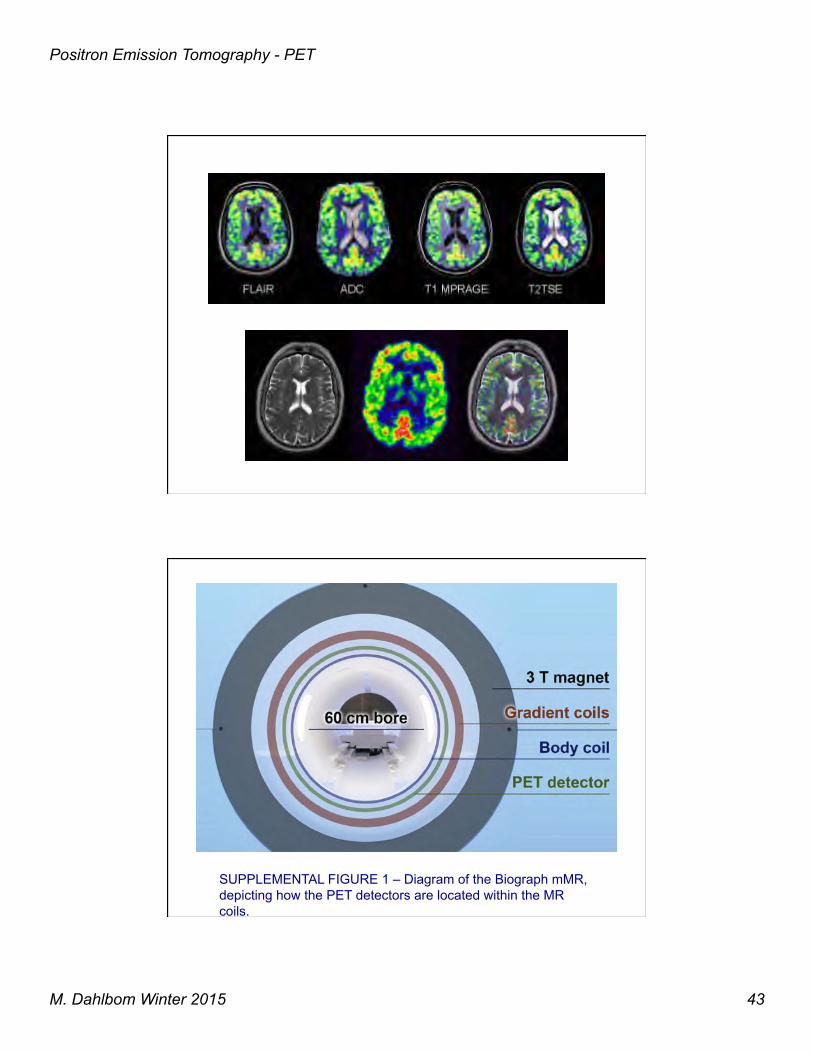
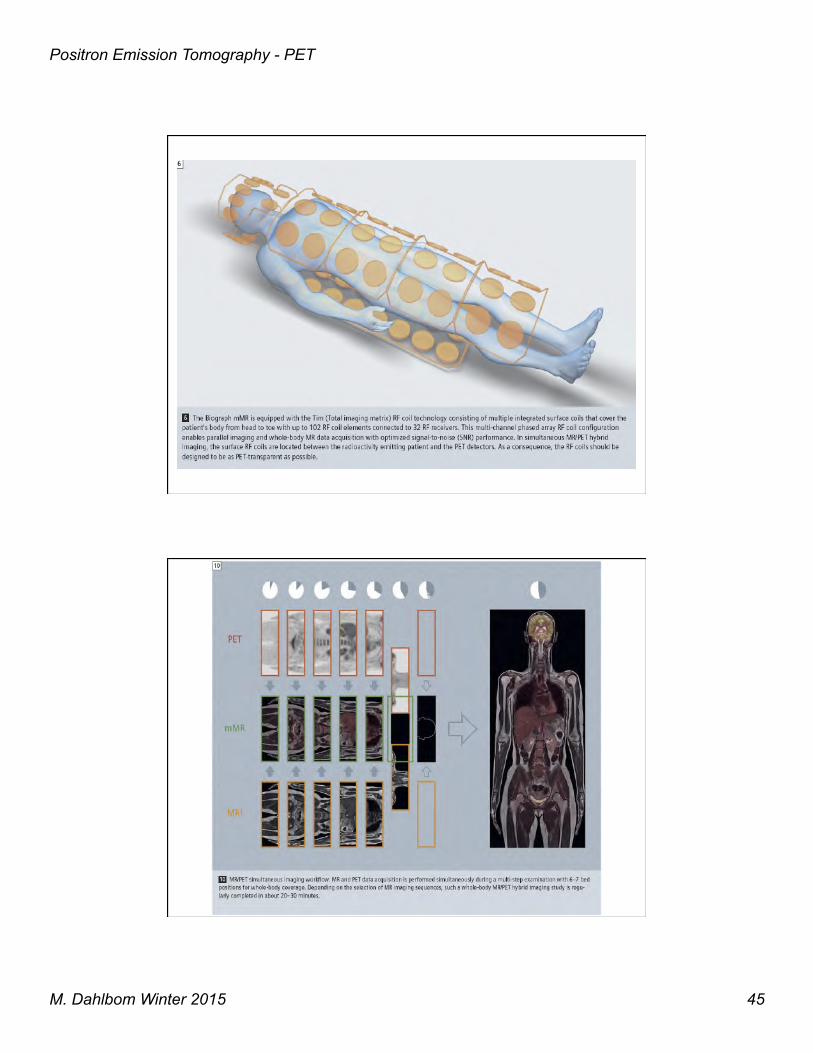
SUPPLEMENTAL FIGURE 1 – Diagram of the Biograph mMR, depicting how the PET detectors are located within the MR coils.
M. Dahlbom Winter 2015 44
Positron Emission Tomography - PET
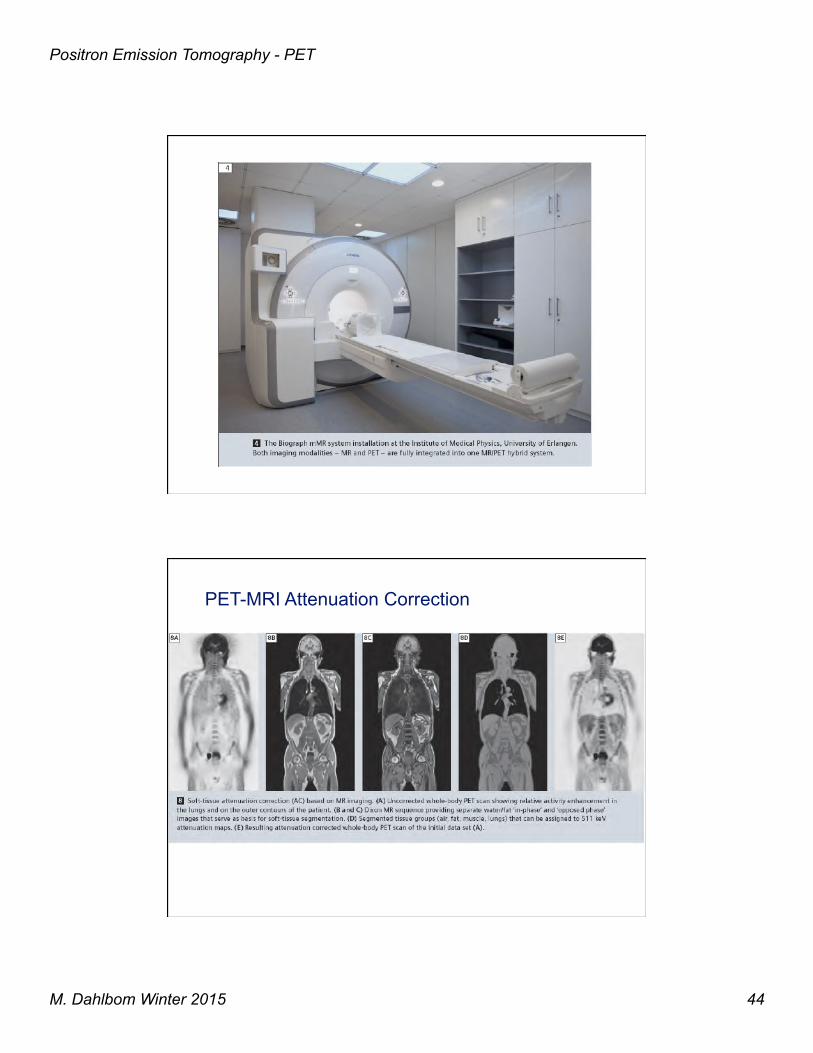
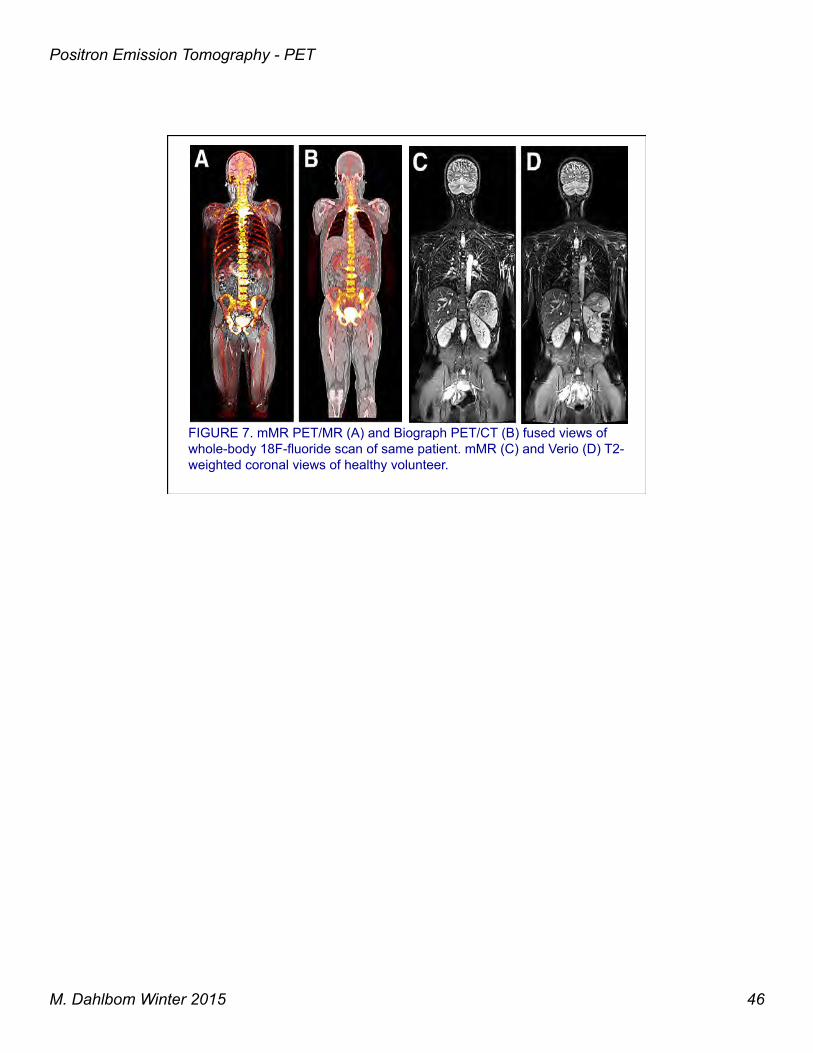
PET-MRI Attenuation Correction
M. Dahlbom Winter 2015 45
Positron Emission Tomography - PET
M. Dahlbom Winter 2015 46
Positron Emission Tomography - PET
FIGURE 7. mMR PET/MR (A) and Biograph PET/CT (B) fused views of whole-body 18F-fluoride scan of same patient. mMR (C) and Verio (D) T2-weighted coronal views of healthy volunteer.


![PET/ CT [Positron Emission Tomography]](https://img.pdfslide.net/doc/110x75/56d6bf451a28ab30169592f3/pet-ct-positron-emission-tomography.jpg)