Embed Size (px)
Citation preview
plants
Article
Post-Anthesis Water-Stressed Barley Maintains GrainSpecific Weight Through Altered Grain Compositionand Plant Architecture
Aaron Hoyle 1 , Maree Brennan 1 , Logan Rees 2, Gail E. Jackson 2 and Stephen P. Hoad 1,*1 Scotland’s Rural College (SRUC), Edinburgh Campus, King’s Buildings, West Mains Road, Edinburgh,
Scotland EH9 3JG, UK2 The University of Edinburgh, Crew Building, King’s Buildings, Alexander Crum Brown Road, Edinburgh,
Scotland EH9 3FE, UK; [email protected] (G.E.J.)* Correspondence: [email protected]
Received: 8 October 2020; Accepted: 11 November 2020; Published: 13 November 2020�����������������
Abstract: Specific weight (SW) is a long-established measure used as a malting quality specificationin barley, with an increased SW thought to result in a higher malt output. Specific weight is a productof individual grain density as determined by grain composition and structure, and grain packingefficiency in a container as determined by grain dimensions. We investigated the effect of moderatebut prolonged post-anthesis water stress on barley plant and grain development using pots ofcultivars with a known range of SWs to explore how altering plant growth influence SW. Water stresswas expected to influence these grain characteristics through decreased photosynthetic capacity.We demonstrated that SW was maintained under water stress conditions through compensatorymechanisms such as increased tiller mortality which preserved grain physical parameters on themain shoots. However, water stress significantly affected plant development by reducing not only earnumber and yield, but also grain filling duration, plant biomass and ear length. Grain compositionwas also altered, with water-stressed plants having reduced carbon:nitrogen. Therefore, although SWcan be conserved under water-stressed conditions, grain composition and plant development arealtered, producing smaller harvests with higher grain nitrogen content. This would result in bulks ofmalting barley having different malt outputs despite having the same SW.
Keywords: barley (Hordeum vulgare L.); grain size; specific weight; water stress
1. Introduction
Barley (Hordeum vulgare L.) is an important cereal crop worldwide. In 2017 a total of 147 milliontonnes were harvested globally and in the UK 7 million tonnes were harvested from 1.2 millionhectares [1]. The majority of this is grown for feed and malting. In the UK, it is largely springbarley that is grown for malting, and it is required to attain certain grain quality specifications andif these are achieved a premium is paid compared with barley destined for feed. One of thesequality specifications is specific weight (SW), a measure of the weight of grain per unit volume, andis measured in kilograms per hectolitre (kg hL−1). Specific weight is an established measure usedthroughout the cereal sector when grading quality. A high SW is thought to be indicative of higherquality grain which is associated with a high starch content, enhanced malt quality and/or maltingefficiency [2]. Therefore, minimum SWs are specified in a contract between farmers and end users.Consequently, farmers often strive to select cultivars with an inherently high SW and employ agronomictechniques such as cultivar selection and fertiliser regimes to keep SW high.
Specific weight is a complex quality trait determined by two components: grain density (GD) andpacking efficiency (PE) of the grain [3]. There is limited information concerning the grain parameters
Plants 2020, 9, 1564; doi:10.3390/plants9111564 www.mdpi.com/journal/plants
Plants 2020, 9, 1564 2 of 15
which determine these components. It is hypothesised that grain composition and internal structureinfluence GD, and grain size and morphology determine PE. Grain size is homogenized to some extentbefore malting, by passing grain through sieves with known slot sizes, to reduce inefficiencies causedby different sized grains malting at different rates. By weight, barley grains are composed of 60 to 80%starch, 9 to 13% protein, 10 to 15% water and 1 to 2% lipids [4]. It is these constituents that are thoughtto influence GD, and they are known to have impacts on the malting process and product yield. It isnot only the absolute amount of these constituents that is thought to be important in malting but alsothe composition or fine structures of these molecules. For example, both the composition of starchin terms of the proportion of the polymers amylose and amylopectin, and ratios of A and B starchgranules, impact the fermentable sugars produced in the malting process [5].
Previous work has shown that within a cultivar if grains are graded by GD, there is no relationshipbetween starch concentration and GD [6]. Despite starch concentration not correlating with GD,there is evidence that starch composition may influence GD with the proportion of starch B granulespositively correlating with GD [6]. Furthermore, higher density grains have an increased nitrogen(N) concentration, and this has been shown to explain nearly 50% of the observed variation inGD. An excessively high N concentration is undesirable for many malting uses [6]. This highlightsthe potential role of N concentration in increasing GD and consequently SW. Furthermore longer,deeper grains have a reduced PE, resulting in a reduced SW for these larger grains [3].
The yield of the barley crop is the weight of grains per area of crop harvested, and this is stronglycorrelated with grain number rather than grain size [7]. Spring barley, often used for malting, has onlytwo rows of grains per ear, whereas winter barley has six rows of grains per ear, and the yields of springbarley are, therefore, typically lower than winter barley. Row-type is genetically determined, but cropmanagement and environment may affect the number of ears and tillers (secondary shoots) whichinfluence barley yield [7]. Other environmental conditions influence grain characteristics themselves,as the following examples show. High night time temperature after anthesis reduced grain weight andthe duration of grain filling in barley [8]. Shading of barley was found to reduce the rate of grain filling,but not affect the duration of grain filling [9]. Grain weight and yield was reduced by a combination ofpost-anthesis water deficit and heat stress [10]. Post-anthesis water stress has been shown to decreasegrain width, but not grain length, indicating that a reduction in grain filling affects grain width morethan length [11]. Prolonged water stress throughout the grain filling period reduces the length of grainfilling and yield [12]. Increased tiller mortality has been shown to be a significant contributor to thereduction in yield in water-stressed plants through reducing total grain number [12]. These stressesare likely to influence grain development and consequently the PE of the grain.
Alongside physical characteristics, chemical and biochemical processes are also impacted bywater stress. Grain starch concentration has been shown to be lower under water-stressed conditions,negatively influencing yield [13]. Water deficit has also been shown to influence starch accumulation,composition, ultrastructure and functionality [14]. Barley starch composition is thought to be moreresilient to water stress than other cereals, with changes only noticeable after a more severe stress [14].Therefore, water stress is likely to change grain composition and, consequently, GD. In general waterdeficit throughout cereal development tends to result in a higher proportion of A-type starch granules;however, the timing of the stress alters its effects, making predictions of the stress effect on maltingquality difficult [15].
In order to enhance our current understanding of how changing plant growth and grain parametersinfluence SW, a stress known to have relevant physiological consequences to grain composition,water stress, was used as a tool to impose changes in plant development. The effect of water stresson SW has not been studied before, and the understanding the mechanisms through which SW isachieved under changing environmental conditions is especially relevant due to climate change.Furthermore, quantifying the outcome of water stress on both components of SW and cultivars withvarying SWs is necessary to understand how changes in SW relate to grain quality for differentmarkets. The aims of this study were to investigate the effect of moderate but prolonged water
Plants 2020, 9, 1564 3 of 15
stress during grain filling on the grain quality measure SW, and the mechanisms influencing thismeasure. This was achieved by the following objectives: (i) to establish how water stress modifies plantdevelopment, yield components and grain composition which impact on SW, (ii) to evaluate changes inSW according to its components and traits which affect them and (iii) investigate associations betweengrain parameters and the components of SW.
2. Results
2.1. Quantification of Water Stress and Plant Development
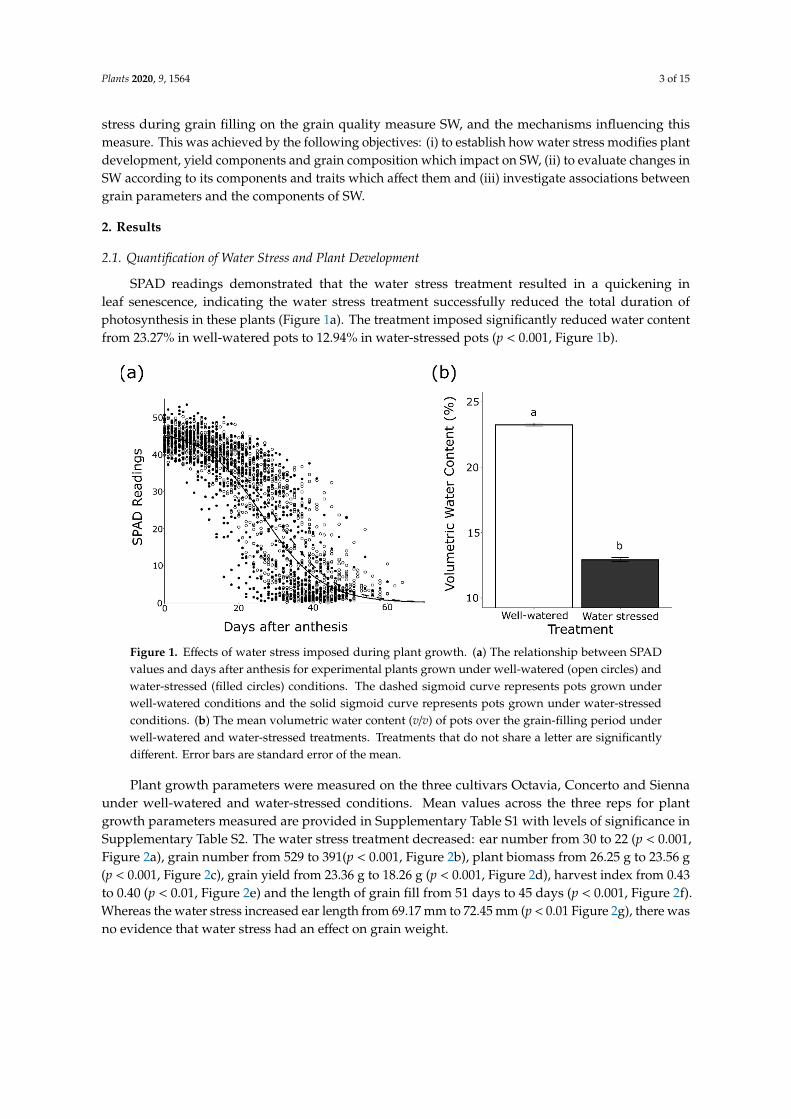
SPAD readings demonstrated that the water stress treatment resulted in a quickening inleaf senescence, indicating the water stress treatment successfully reduced the total duration ofphotosynthesis in these plants (Figure 1a). The treatment imposed significantly reduced water contentfrom 23.27% in well-watered pots to 12.94% in water-stressed pots (p < 0.001, Figure 1b).
Plants 2020, 9, x FOR PEER REVIEW 3 of 15
cultivars with varying SWs is necessary to understand how changes in SW relate to grain quality for different markets. The aims of this study were to investigate the effect of moderate but prolonged water stress during grain filling on the grain quality measure SW, and the mechanisms influencing this measure. This was achieved by the following objectives: (i) to establish how water stress modifies plant development, yield components and grain composition which impact on SW, (ii) to evaluate changes in SW according to its components and traits which affect them and iii) investigate associations between grain parameters and the components of SW.
2. Results
2.1. Quantification of Water Stress and Plant Development
SPAD readings demonstrated that the water stress treatment resulted in a quickening in leaf senescence, indicating the water stress treatment successfully reduced the total duration of photosynthesis in these plants (Figure 1a). The treatment imposed significantly reduced water content from 23.27% in well-watered pots to 12.94% in water-stressed pots (p < 0.001, Figure 1b).
Figure 1. Effects of water stress imposed during plant growth. (a) The relationship between SPAD values and days after anthesis for experimental plants grown under well-watered (open circles) and water-stressed (filled circles) conditions. The dashed sigmoid curve represents pots grown under well-watered conditions and the solid sigmoid curve represents pots grown under water-stressed conditions. (b) The mean volumetric water content (v/v) of pots over the grain-filling period under well-watered and water-stressed treatments. Treatments that do not share a letter are significantly different. Error bars are standard error of the mean.
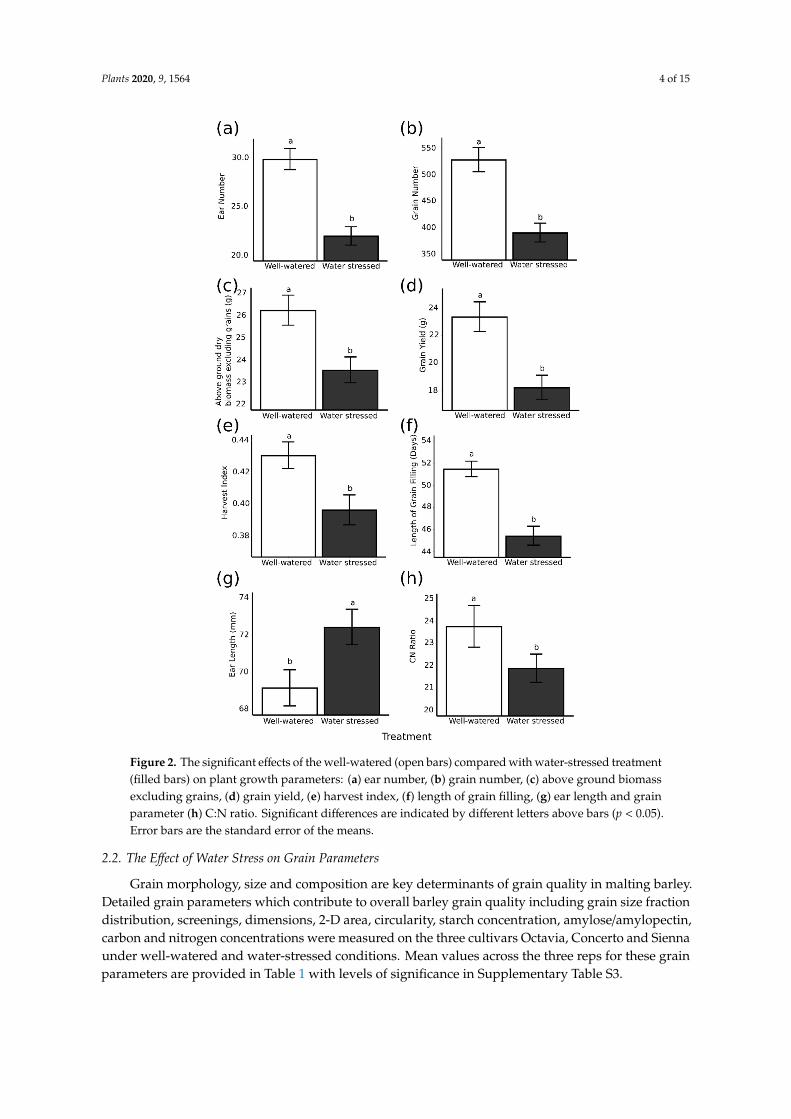
Plant growth parameters were measured on the three cultivars Octavia, Concerto and Sienna under well-watered and water-stressed conditions. Mean values across the three reps for plant growth parameters measured are provided in Supplementary Table S1 with levels of significance in Supplementary Table S2. The water stress treatment decreased: ear number from 30 to 22 (p < 0.001, Figure 2a), grain number from 529 to 391(p < 0.001, Figure 2b), plant biomass from 26.25 g to 23.56 g (p < 0.001, Figure 2c), grain yield from 23.36 g to 18.26 g (p < 0.001, Figure 2d), harvest index from 0.43 to 0.40 (p < 0.01, Figure 2e) and the length of grain fill from 51 days to 45 days (p < 0.001, Figure 2f). Whereas the water stress increased ear length from 69.17 mm to 72.45 mm (p < 0.01 Figure 2g), there was no evidence that water stress had an effect on grain weight.
Figure 1. Effects of water stress imposed during plant growth. (a) The relationship between SPADvalues and days after anthesis for experimental plants grown under well-watered (open circles) andwater-stressed (filled circles) conditions. The dashed sigmoid curve represents pots grown underwell-watered conditions and the solid sigmoid curve represents pots grown under water-stressedconditions. (b) The mean volumetric water content (v/v) of pots over the grain-filling period underwell-watered and water-stressed treatments. Treatments that do not share a letter are significantlydifferent. Error bars are standard error of the mean.
Plant growth parameters were measured on the three cultivars Octavia, Concerto and Siennaunder well-watered and water-stressed conditions. Mean values across the three reps for plantgrowth parameters measured are provided in Supplementary Table S1 with levels of significance inSupplementary Table S2. The water stress treatment decreased: ear number from 30 to 22 (p < 0.001,Figure 2a), grain number from 529 to 391(p < 0.001, Figure 2b), plant biomass from 26.25 g to 23.56 g(p < 0.001, Figure 2c), grain yield from 23.36 g to 18.26 g (p < 0.001, Figure 2d), harvest index from 0.43to 0.40 (p < 0.01, Figure 2e) and the length of grain fill from 51 days to 45 days (p < 0.001, Figure 2f).Whereas the water stress increased ear length from 69.17 mm to 72.45 mm (p < 0.01 Figure 2g), there wasno evidence that water stress had an effect on grain weight.
Plants 2020, 9, 1564 4 of 15Plants 2020, 9, x FOR PEER REVIEW 4 of 15
Figure 2. The significant effects of the well-watered (open bars) compared with water-stressed treatment (filled bars) on plant growth parameters: (a) ear number, (b) grain number, (c) above ground biomass excluding grains, (d) grain yield, (e) harvest index, (f) length of grain filling, (g) ear length and grain parameter (h) C:N ratio. Significant differences are indicated by different letters above bars (p < 0.05). Error bars are the standard error of the means.
2.2. The Effect of Water Stress on Grain Parameters
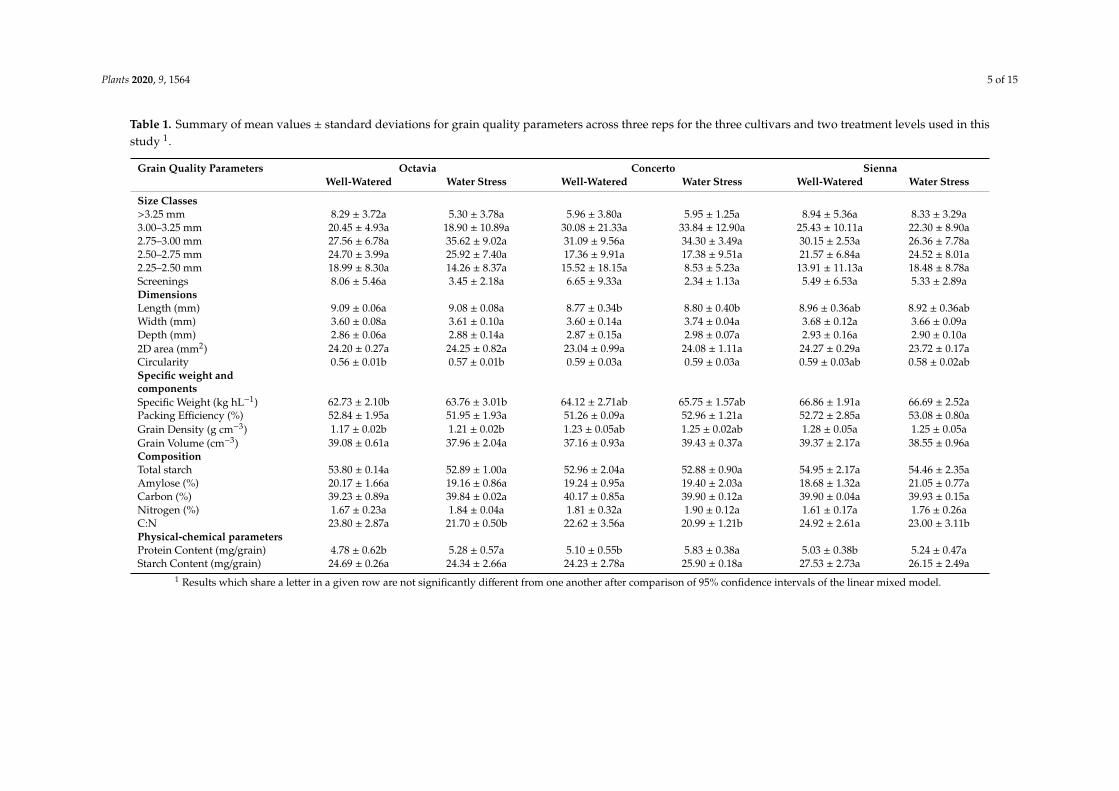
Grain morphology, size and composition are key determinants of grain quality in malting barley. Detailed grain parameters which contribute to overall barley grain quality including grain size fraction distribution, screenings, dimensions, 2-D area, circularity, starch concentration, amylose/amylopectin, carbon and nitrogen concentrations were measured on the three cultivars Octavia, Concerto and Sienna under well-watered and water-stressed conditions. Mean values across the three reps for these grain parameters are provided in Table 1 with levels of significance in Supplementary Table S3.
Figure 2. The significant effects of the well-watered (open bars) compared with water-stressed treatment(filled bars) on plant growth parameters: (a) ear number, (b) grain number, (c) above ground biomassexcluding grains, (d) grain yield, (e) harvest index, (f) length of grain filling, (g) ear length and grainparameter (h) C:N ratio. Significant differences are indicated by different letters above bars (p < 0.05).Error bars are the standard error of the means.
2.2. The Effect of Water Stress on Grain Parameters
Grain morphology, size and composition are key determinants of grain quality in malting barley.Detailed grain parameters which contribute to overall barley grain quality including grain size fractiondistribution, screenings, dimensions, 2-D area, circularity, starch concentration, amylose/amylopectin,carbon and nitrogen concentrations were measured on the three cultivars Octavia, Concerto and Siennaunder well-watered and water-stressed conditions. Mean values across the three reps for these grainparameters are provided in Table 1 with levels of significance in Supplementary Table S3.
Plants 2020, 9, 1564 5 of 15
Table 1. Summary of mean values ± standard deviations for grain quality parameters across three reps for the three cultivars and two treatment levels used in thisstudy 1.
Grain Quality Parameters Octavia Concerto SiennaWell-Watered Water Stress Well-Watered Water Stress Well-Watered Water Stress
Size Classes>3.25 mm 8.29 ± 3.72a 5.30 ± 3.78a 5.96 ± 3.80a 5.95 ± 1.25a 8.94 ± 5.36a 8.33 ± 3.29a3.00–3.25 mm 20.45 ± 4.93a 18.90 ± 10.89a 30.08 ± 21.33a 33.84 ± 12.90a 25.43 ± 10.11a 22.30 ± 8.90a2.75–3.00 mm 27.56 ± 6.78a 35.62 ± 9.02a 31.09 ± 9.56a 34.30 ± 3.49a 30.15 ± 2.53a 26.36 ± 7.78a2.50–2.75 mm 24.70 ± 3.99a 25.92 ± 7.40a 17.36 ± 9.91a 17.38 ± 9.51a 21.57 ± 6.84a 24.52 ± 8.01a2.25–2.50 mm 18.99 ± 8.30a 14.26 ± 8.37a 15.52 ± 18.15a 8.53 ± 5.23a 13.91 ± 11.13a 18.48 ± 8.78aScreenings 8.06 ± 5.46a 3.45 ± 2.18a 6.65 ± 9.33a 2.34 ± 1.13a 5.49 ± 6.53a 5.33 ± 2.89aDimensionsLength (mm) 9.09 ± 0.06a 9.08 ± 0.08a 8.77 ± 0.34b 8.80 ± 0.40b 8.96 ± 0.36ab 8.92 ± 0.36abWidth (mm) 3.60 ± 0.08a 3.61 ± 0.10a 3.60 ± 0.14a 3.74 ± 0.04a 3.68 ± 0.12a 3.66 ± 0.09aDepth (mm) 2.86 ± 0.06a 2.88 ± 0.14a 2.87 ± 0.15a 2.98 ± 0.07a 2.93 ± 0.16a 2.90 ± 0.10a2D area (mm2) 24.20 ± 0.27a 24.25 ± 0.82a 23.04 ± 0.99a 24.08 ± 1.11a 24.27 ± 0.29a 23.72 ± 0.17aCircularity 0.56 ± 0.01b 0.57 ± 0.01b 0.59 ± 0.03a 0.59 ± 0.03a 0.59 ± 0.03ab 0.58 ± 0.02abSpecific weight andcomponentsSpecific Weight (kg hL−1) 62.73 ± 2.10b 63.76 ± 3.01b 64.12 ± 2.71ab 65.75 ± 1.57ab 66.86 ± 1.91a 66.69 ± 2.52aPacking Efficiency (%) 52.84 ± 1.95a 51.95 ± 1.93a 51.26 ± 0.09a 52.96 ± 1.21a 52.72 ± 2.85a 53.08 ± 0.80aGrain Density (g cm−3) 1.17 ± 0.02b 1.21 ± 0.02b 1.23 ± 0.05ab 1.25 ± 0.02ab 1.28 ± 0.05a 1.25 ± 0.05aGrain Volume (cm−3) 39.08 ± 0.61a 37.96 ± 2.04a 37.16 ± 0.93a 39.43 ± 0.37a 39.37 ± 2.17a 38.55 ± 0.96aCompositionTotal starch 53.80 ± 0.14a 52.89 ± 1.00a 52.96 ± 2.04a 52.88 ± 0.90a 54.95 ± 2.17a 54.46 ± 2.35aAmylose (%) 20.17 ± 1.66a 19.16 ± 0.86a 19.24 ± 0.95a 19.40 ± 2.03a 18.68 ± 1.32a 21.05 ± 0.77aCarbon (%) 39.23 ± 0.89a 39.84 ± 0.02a 40.17 ± 0.85a 39.90 ± 0.12a 39.90 ± 0.04a 39.93 ± 0.15aNitrogen (%) 1.67 ± 0.23a 1.84 ± 0.04a 1.81 ± 0.32a 1.90 ± 0.12a 1.61 ± 0.17a 1.76 ± 0.26aC:N 23.80 ± 2.87a 21.70 ± 0.50b 22.62 ± 3.56a 20.99 ± 1.21b 24.92 ± 2.61a 23.00 ± 3.11bPhysical-chemical parametersProtein Content (mg/grain) 4.78 ± 0.62b 5.28 ± 0.57a 5.10 ± 0.55b 5.83 ± 0.38a 5.03 ± 0.38b 5.24 ± 0.47aStarch Content (mg/grain) 24.69 ± 0.26a 24.34 ± 2.66a 24.23 ± 2.78a 25.90 ± 0.18a 27.53 ± 2.73a 26.15 ± 2.49a
1 Results which share a letter in a given row are not significantly different from one another after comparison of 95% confidence intervals of the linear mixed model.
Plants 2020, 9, 1564 6 of 15
Figure 2 shows that water stress had a significant effect on the ratio of carbon to nitrogen,as shown in Figure 2h. However, a post-hoc multiple comparison test could not distinguish betweenN concentration in well-watered (1.70%) and water-stressed (1.83%) grain. Well-watered plants didhowever have a significantly higher (p < 0.05, Figure 2h) carbon to nitrogen ratio with a ratio of 23.78to a ratio of 21.90 for water-stressed grains. Starch and protein content per grain were also calculated;protein content varied significantly with treatment, but starch content did not. Well-watered pots hada significantly lower protein content per grain (p < 0.05) of 4.97 mg/grain compared to 5.45 mg/grain inwater-stressed pots.
Grains which are large, uniform and bold are preferred for malting due to their beneficialcharacteristics, such as high starch concentration and high germination rate. Water stress did not havea significant effect on many grain parameters including size classes, despite drastically affecting overallgrain yield. Grain length, grain width and grain depth also remained unchanged as a result of thewater stress.
Specific weight and its components GD and PE were also measured. Neither SW nor its componentswere significantly affected as a result of the water stress, this is not surprising with the lack of differencesobserved in the other grain parameters which contribute to this measure.
2.3. The Effect of Cultivar on Grain Parameters
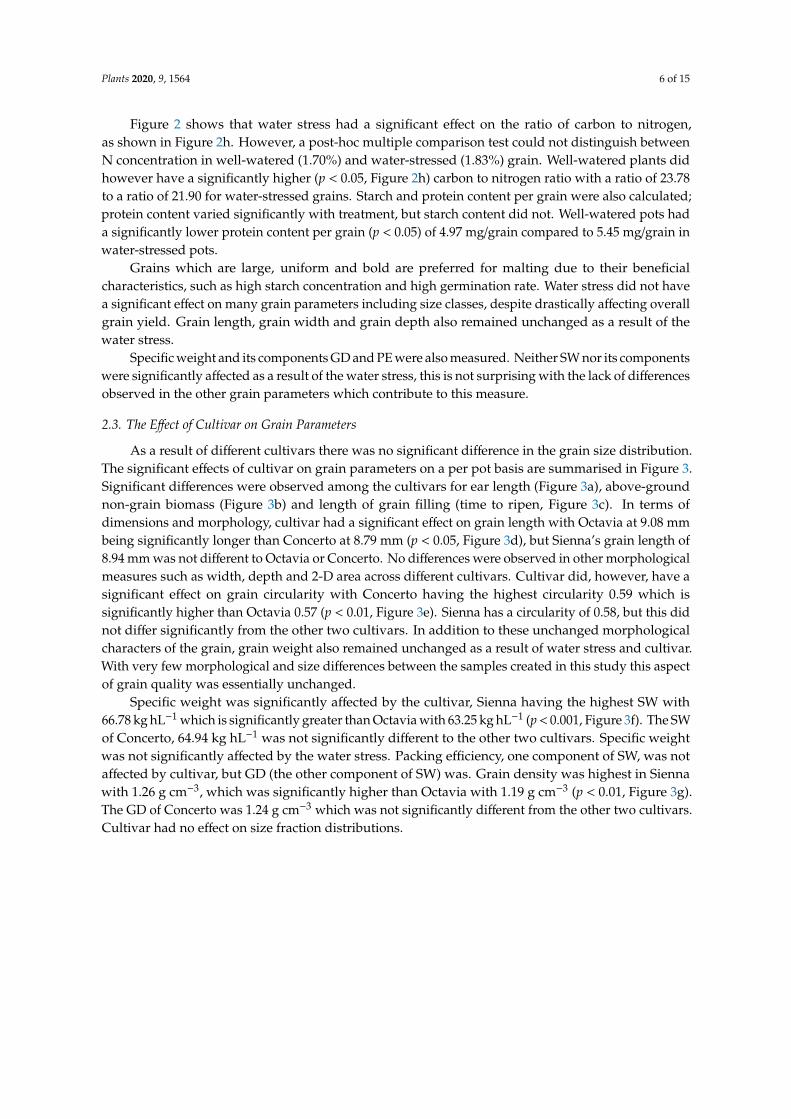
As a result of different cultivars there was no significant difference in the grain size distribution.The significant effects of cultivar on grain parameters on a per pot basis are summarised in Figure 3.Significant differences were observed among the cultivars for ear length (Figure 3a), above-groundnon-grain biomass (Figure 3b) and length of grain filling (time to ripen, Figure 3c). In terms ofdimensions and morphology, cultivar had a significant effect on grain length with Octavia at 9.08 mmbeing significantly longer than Concerto at 8.79 mm (p < 0.05, Figure 3d), but Sienna’s grain length of8.94 mm was not different to Octavia or Concerto. No differences were observed in other morphologicalmeasures such as width, depth and 2-D area across different cultivars. Cultivar did, however, have asignificant effect on grain circularity with Concerto having the highest circularity 0.59 which issignificantly higher than Octavia 0.57 (p < 0.01, Figure 3e). Sienna has a circularity of 0.58, but this didnot differ significantly from the other two cultivars. In addition to these unchanged morphologicalcharacters of the grain, grain weight also remained unchanged as a result of water stress and cultivar.With very few morphological and size differences between the samples created in this study this aspectof grain quality was essentially unchanged.
Specific weight was significantly affected by the cultivar, Sienna having the highest SW with66.78 kg hL−1 which is significantly greater than Octavia with 63.25 kg hL−1 (p < 0.001, Figure 3f). The SWof Concerto, 64.94 kg hL−1 was not significantly different to the other two cultivars. Specific weightwas not significantly affected by the water stress. Packing efficiency, one component of SW, was notaffected by cultivar, but GD (the other component of SW) was. Grain density was highest in Siennawith 1.26 g cm−3, which was significantly higher than Octavia with 1.19 g cm−3 (p < 0.01, Figure 3g).The GD of Concerto was 1.24 g cm−3 which was not significantly different from the other two cultivars.Cultivar had no effect on size fraction distributions.
Plants 2020, 9, 1564 7 of 15Plants 2020, 9, x FOR PEER REVIEW 7 of 15
Figure 3. The significant effects of cultivar on plant growth parameters (a) ear length, (b) above ground dry biomass excluding grains, (c) length of grain filling and grain parameters: (d) grain length, (e) circularity, (f) SW and (g) GD. Significant differences are indicated by different letters above bars (p < 0.05). Bars are the standard error of the means.
2.4. Correlations with Components of Specific Weight
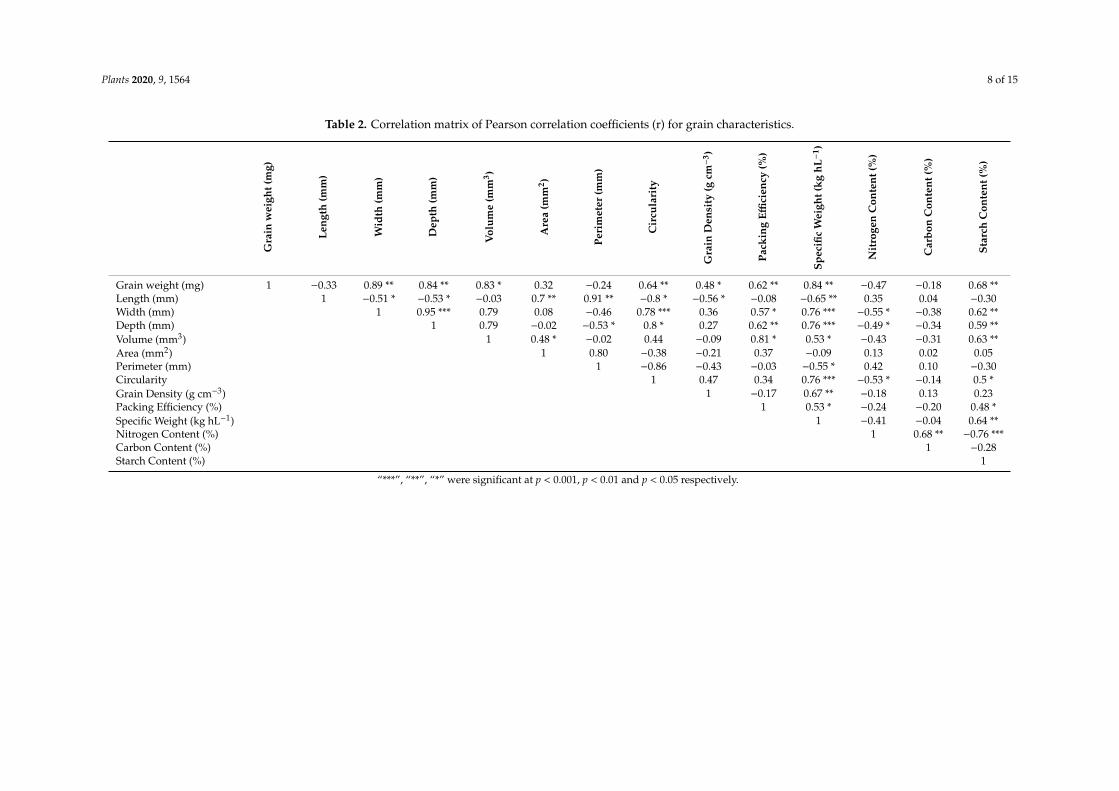
The significance of correlations between grain parameters were analysed and a matrix of the Pearson correlation coefficients (r) is provided in Table 2 and the corresponding p-values are in Supplementary Table S4. Grain weight was shown to be strongly positively correlated with width (r = 0.89, p < 0.01) and depth (r = 0.84, p < 0.01) but not length. Grain length was negatively correlated with grain dimensions width (r = −0.51, p < 0.05) and depth (r = −0.53, p < 0.05). Grain width and depth are highly positively correlated with each other (r = 0.95, p < 0.001). This demonstrates that grain width and depth are tightly correlated with each other, but grain length is not correlated with either. Grain 2-D area is positively correlated with length (r = 0.7, p < 0.01) and has a slightly weaker but still positive correlation with volume (r = 0.48, p < 0.05), but with neither width nor depth. Grain perimeter was positively correlated with length (r = 0.91, p < 0.01) and negatively so with depth (r = −0.53, p < 0.05). The strong positive correlation between circularity and grain weight (r = 0.64, p < 0.01) highlights that “plumper” grains weigh more. Longer grains tend to be less dense (r = −0.56, p < 0.05), this could be a result of the husk not filling entirely at the extremity of the grain.
Figure 3. The significant effects of cultivar on plant growth parameters (a) ear length, (b) aboveground dry biomass excluding grains, (c) length of grain filling and grain parameters: (d) grain length,(e) circularity, (f) SW and (g) GD. Significant differences are indicated by different letters above bars(p < 0.05). Bars are the standard error of the means.
2.4. Correlations with Components of Specific Weight
The significance of correlations between grain parameters were analysed and a matrix of thePearson correlation coefficients (r) is provided in Table 2 and the corresponding p-values are inSupplementary Table S4. Grain weight was shown to be strongly positively correlated with width(r = 0.89, p < 0.01) and depth (r = 0.84, p < 0.01) but not length. Grain length was negatively correlatedwith grain dimensions width (r = −0.51, p < 0.05) and depth (r = −0.53, p < 0.05). Grain width anddepth are highly positively correlated with each other (r = 0.95, p < 0.001). This demonstrates that grainwidth and depth are tightly correlated with each other, but grain length is not correlated with either.Grain 2-D area is positively correlated with length (r = 0.7, p < 0.01) and has a slightly weaker but stillpositive correlation with volume (r = 0.48, p < 0.05), but with neither width nor depth. Grain perimeterwas positively correlated with length (r = 0.91, p < 0.01) and negatively so with depth (r = −0.53,p < 0.05). The strong positive correlation between circularity and grain weight (r = 0.64, p < 0.01)highlights that “plumper” grains weigh more. Longer grains tend to be less dense (r = −0.56, p < 0.05),this could be a result of the husk not filling entirely at the extremity of the grain.
Plants 2020, 9, 1564 8 of 15
Table 2. Correlation matrix of Pearson correlation coefficients (r) for grain characteristics.
Gra
inw
eigh
t(m
g)
Leng
th(m
m)
Wid
th(m
m)
Dep
th(m
m)
Vol
ume
(mm
3 )
Are
a(m
m2 )
Peri
met
er(m
m)
Cir
cula
rity
Gra
inD
ensi
ty(g
cm−
3 )
Pack
ing
Effici
ency
(%)
Spec
ific
Wei
ght(
kghL−
1 )
Nit
roge
nC
onte
nt(%
)
Car
bon
Con
tent
(%)
Star
chC
onte
nt(%
)
Grain weight (mg) 1 −0.33 0.89 ** 0.84 ** 0.83 * 0.32 −0.24 0.64 ** 0.48 * 0.62 ** 0.84 ** −0.47 −0.18 0.68 **Length (mm) 1 −0.51 * −0.53 * −0.03 0.7 ** 0.91 ** −0.8 * −0.56 * −0.08 −0.65 ** 0.35 0.04 −0.30Width (mm) 1 0.95 *** 0.79 0.08 −0.46 0.78 *** 0.36 0.57 * 0.76 *** −0.55 * −0.38 0.62 **Depth (mm) 1 0.79 −0.02 −0.53 * 0.8 * 0.27 0.62 ** 0.76 *** −0.49 * −0.34 0.59 **Volume (mm3) 1 0.48 * −0.02 0.44 −0.09 0.81 * 0.53 * −0.43 −0.31 0.63 **Area (mm2) 1 0.80 −0.38 −0.21 0.37 −0.09 0.13 0.02 0.05Perimeter (mm) 1 −0.86 −0.43 −0.03 −0.55 * 0.42 0.10 −0.30Circularity 1 0.47 0.34 0.76 *** −0.53 * −0.14 0.5 *Grain Density (g cm−3) 1 −0.17 0.67 ** −0.18 0.13 0.23Packing Efficiency (%) 1 0.53 * −0.24 −0.20 0.48 *Specific Weight (kg hL−1) 1 −0.41 −0.04 0.64 **Nitrogen Content (%) 1 0.68 ** −0.76 ***Carbon Content (%) 1 −0.28Starch Content (%) 1
“***”, “**”, “*” were significant at p < 0.001, p < 0.01 and p < 0.05 respectively.
Plants 2020, 9, 1564 9 of 15
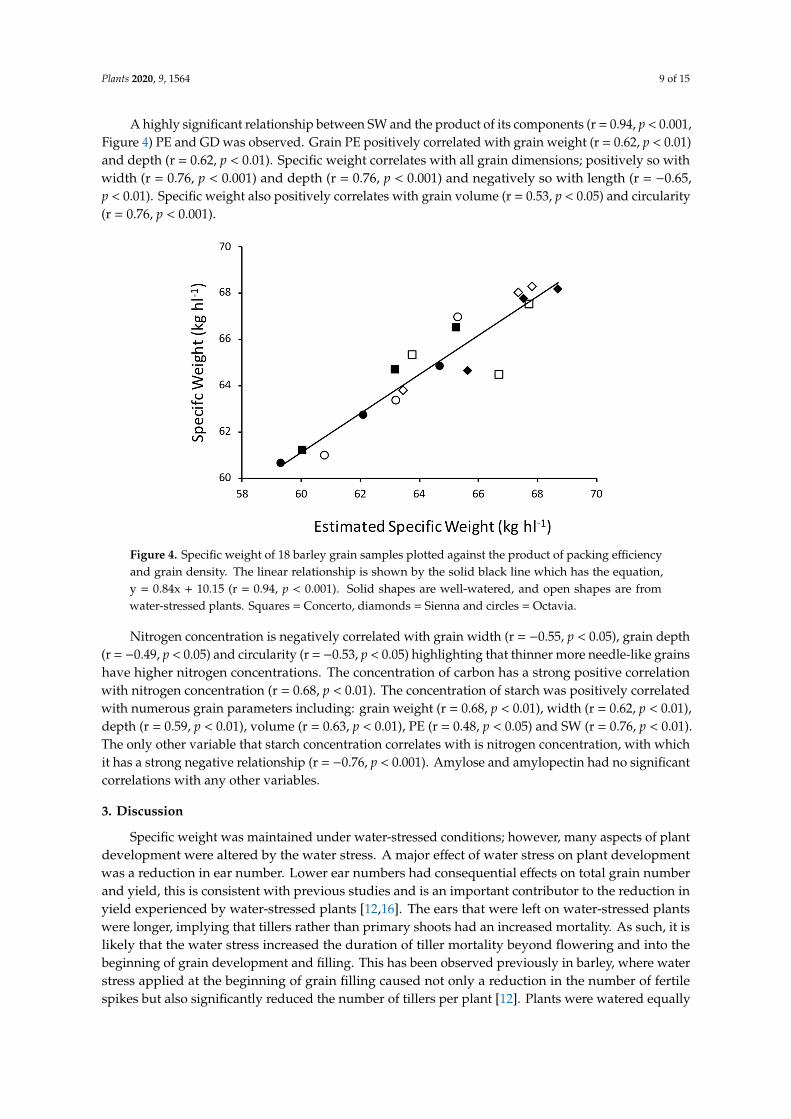
A highly significant relationship between SW and the product of its components (r = 0.94, p < 0.001,Figure 4) PE and GD was observed. Grain PE positively correlated with grain weight (r = 0.62, p < 0.01)and depth (r = 0.62, p < 0.01). Specific weight correlates with all grain dimensions; positively so withwidth (r = 0.76, p < 0.001) and depth (r = 0.76, p < 0.001) and negatively so with length (r = −0.65,p < 0.01). Specific weight also positively correlates with grain volume (r = 0.53, p < 0.05) and circularity(r = 0.76, p < 0.001).
Plants 2020, 9, x FOR PEER REVIEW 9 of 15
Plants 2020, 9, x; doi: FOR PEER REVIEW www.mdpi.com/journal/plants
A highly significant relationship between SW and the product of its components (r = 0.94, p < 0.001, Figure 4) PE and GD was observed. Grain PE positively correlated with grain weight (r = 0.62, p < 0.01) and depth (r = 0.62, p < 0.01). Specific weight correlates with all grain dimensions; positively so with width (r = 0.76, p < 0.001) and depth (r = 0.76, p < 0.001) and negatively so with length (r = −0.65, p < 0.01). Specific weight also positively correlates with grain volume (r = 0.53, p < 0.05) and circularity (r = 0.76, p < 0.001).
Figure 4. Specific weight of 18 barley grain samples plotted against the product of packing efficiency and grain density. The linear relationship is shown by the solid black line which has the equation, y = 0.84x + 10.15 (r = 0.94, p < 0.001). Solid shapes are well-watered, and open shapes are from water-stressed plants. Squares = Concerto, diamonds = Sienna and circles = Octavia.
Nitrogen concentration is negatively correlated with grain width (r = −0.55, p < 0.05), grain depth (r = −0.49, p < 0.05) and circularity (r = −0.53, p < 0.05) highlighting that thinner more needle-like grains have higher nitrogen concentrations. The concentration of carbon has a strong positive correlation with nitrogen concentration (r = 0.68, p < 0.01). The concentration of starch was positively correlated with numerous grain parameters including: grain weight (r = 0.68, p < 0.01), width (r = 0.62, p < 0.01), depth (r = 0.59, p < 0.01), volume (r = 0.63, p < 0.01), PE (r = 0.48, p < 0.05) and SW (r = 0.76, p < 0.01). The only other variable that starch concentration correlates with is nitrogen concentration, with which it has a strong negative relationship (r = −0.76, p < 0.001). Amylose and amylopectin had no significant correlations with any other variables.
3. Discussion
Specific weight was maintained under water-stressed conditions; however, many aspects of plant development were altered by the water stress. A major effect of water stress on plant development was a reduction in ear number. Lower ear numbers had consequential effects on total grain number and yield, this is consistent with previous studies and is an important contributor to the reduction in yield experienced by water-stressed plants [12,16]. The ears that were left on water-stressed plants were longer, implying that tillers rather than primary shoots had an increased mortality. As such, it is likely that the water stress increased the duration of tiller mortality beyond flowering and into the beginning of grain development and filling. This has been observed previously in barley, where water stress applied at the beginning of grain filling caused not only a reduction in the number of fertile spikes but also significantly reduced the number of tillers per plant [12]. Plants were watered equally until anthesis, so this reduction in ear number but increase in ear length demonstrates a post-anthesis compensatory mechanism where tillers are aborted under water-stressed conditions.
Figure 4. Specific weight of 18 barley grain samples plotted against the product of packing efficiencyand grain density. The linear relationship is shown by the solid black line which has the equation,y = 0.84x + 10.15 (r = 0.94, p < 0.001). Solid shapes are well-watered, and open shapes are fromwater-stressed plants. Squares = Concerto, diamonds = Sienna and circles = Octavia.
Nitrogen concentration is negatively correlated with grain width (r = −0.55, p < 0.05), grain depth(r = −0.49, p < 0.05) and circularity (r = −0.53, p < 0.05) highlighting that thinner more needle-like grainshave higher nitrogen concentrations. The concentration of carbon has a strong positive correlationwith nitrogen concentration (r = 0.68, p < 0.01). The concentration of starch was positively correlatedwith numerous grain parameters including: grain weight (r = 0.68, p < 0.01), width (r = 0.62, p < 0.01),depth (r = 0.59, p < 0.01), volume (r = 0.63, p < 0.01), PE (r = 0.48, p < 0.05) and SW (r = 0.76, p < 0.01).The only other variable that starch concentration correlates with is nitrogen concentration, with whichit has a strong negative relationship (r = −0.76, p < 0.001). Amylose and amylopectin had no significantcorrelations with any other variables.
3. Discussion
Specific weight was maintained under water-stressed conditions; however, many aspects of plantdevelopment were altered by the water stress. A major effect of water stress on plant developmentwas a reduction in ear number. Lower ear numbers had consequential effects on total grain numberand yield, this is consistent with previous studies and is an important contributor to the reduction inyield experienced by water-stressed plants [12,16]. The ears that were left on water-stressed plantswere longer, implying that tillers rather than primary shoots had an increased mortality. As such, it islikely that the water stress increased the duration of tiller mortality beyond flowering and into thebeginning of grain development and filling. This has been observed previously in barley, where waterstress applied at the beginning of grain filling caused not only a reduction in the number of fertilespikes but also significantly reduced the number of tillers per plant [12]. Plants were watered equally
Plants 2020, 9, 1564 10 of 15
until anthesis, so this reduction in ear number but increase in ear length demonstrates a post-anthesiscompensatory mechanism where tillers are aborted under water-stressed conditions.
Such a mechanism could allow plants to maintain a higher proportion of grains with highergrain weight when reduced photoassimilates are available under stressed conditions as a resultof compromised photosynthesis. This response would be beneficial for plant progeny with morecarbohydrates being available to fewer plant embryos instead of spreading resources more thinlyacross many embryos. Water stress also resulted in a shortening of the grain filling duration by sixdays and a reduction in above ground biomass; both are expected effects of water stress on cerealdevelopment [12,17]. That the mean grain weight was found not to be affected by water stress inthe present study despite the shortened length of grain filling was likely due to the larger numberof secondary tillers in the non-stressed plants containing smaller grains and lowering the averagegrain weight, rather than an increase in grain filling rate of the water-stressed plants. Yield and aboveground biomass did not decrease by the same proportions because water stress reduced harvest index,demonstrating a reduction in reproductive efficiency as a result of stress. Similarly, harvest indexhas been shown to be lowered in rice when subject to a shading treatment, although unlike waterdeficit the shade treatment lengthened the grain filling period highlighting the contrasting effects ondevelopment of different stresses [18]. A restricted water supply is known to cause osmotic stress inplant cells and consequently cell damage contributing to premature leaf senescence, whereas plantsunder shaded conditions receive less photosynthetically active radiation reducing plant growth and therate of grain filling. In field conditions water stress is often accompanied by a heat stress, although aheat stress was not applied in this study others have demonstrated the extreme negative impact ofthis stress combination at grain filling on spring barley yields [19]. Additionally, the timing of thisstress has been shown to affect both spring barley yield and malt quality. When spring barley plantsare subjected to these stresses yield and quality are affected to a more significant degree than whenstresses are implemented at heading stages, in comparison to the vegetative growth stages [20].
Alongside water stress, different cultivars also resulted in significant differences in plantdevelopment. Cultivars varied in ear length, biomass and the length of grain fill. Although studyingplant development is important to understand the effects of water stress and cultivar, it is the way inwhich development changes grain parameters that is of most importance to enhance the understandingof SW. Grain morphology was influenced by cultivar but not treatment with Octavia having longer,less circular grains in comparison to Concerto. The existence of a cultivar effect on grain morphology isconsistent across different cereal species, demonstrating the genetic basis of grain dimensions, which iscontrolled by multiple genes, known as quantitative trait loci (QTLs) [21]. The SWs of cultivars followedthe same rank order as parent material, highlighting the strong and consistent genetic influence onSW. Quantitative trait loci have been detected which are associated with grain size in barley, and withone of the components of SW being PE which is highly influenced by grain dimensions, it is likelythat there are QTLs in barley which partly control SW [22]. Therefore, with SW remaining a breedingtarget, research into discovering these related QTLs would provide a useful molecular genetic basisfor improving this measure of grain quality. The same rank order was exhibited by GD for the threecultivars, this and how GD correlates more strongly with SW than PE suggests that GD may contributemore proportionally to SW. Previous work has shown that GD contributed to 48.5% of the variation inSW and PE to 36.5% further highlighting a slight dominance in GD over PE in determining SW [3].
Alongside plant development water stress also influenced grain composition with a reduction inthe C:N, and an increase in N content and protein content per grain. Grain composition is thought tobe impacted by environmental conditions to a greater extent than morphology; despite this, QTLs havebeen identified for grain protein concentration. With nitrogen concentration known to significantlyaffect GD it is likely these QTLs are also related to SW, which could contribute to molecular breeding.Furthermore this work has emphasised that grain morphology and composition are related so shouldbe discussed in tandem [23]. Strong correlations between starch concentration and grain width,depth and volume indicate that either starch accumulation in grains can result in these plumper grains,
Plants 2020, 9, 1564 11 of 15
or plumper grains facilitate an enhanced storage of photoassimilates. Numerous genes have beenidentified in rice which are associated with grain shape: GRAIN SIZE 3 is a QTL for rice grain lengthand weight, GRAIN WIDTH 2 and GRAIN WIDTH 8 are QTLs for width and weight [21].
Mean grain weight was not affected by the water stress treatment. Although this was anunexpected result, it can be explained by the ways in which stress altered plant ear number per plantand grains per ear (sink capacity) and a plant’s ability to accumulate photoassimilates (source capacity).Despite having reduced source capacity, the water-stressed plants maintained mean grain weight in asmaller sink capacity or a reduced total grain number. Previous studies on cereals have shown thatdespite a reduced grain filling period as a result of water stress, the rate of grain filling can also beenhanced through increased remobilization of stem carbohydrates [24]. In other studies when waterstress was imposed pre-anthesis grain yield, number and weight were reduced and total sink can belimited [25,26]. These studies indicate timing is crucial in determining how stress to the plant impactson grain quality. Interestingly, maintenance of green-leaf area or “stay-green” traits have been shownto buffer grain quality against the detrimental effects of water stress [27].
The multifaceted nature of how many grain parameters influence SW is apparent in this analysiswith SW significantly correlating with 10 different grain parameters. The results reinforced previousstudies which have shown how SW is determined by changes in PE and GD, with a very strongrelationship between the product of these and SW which is maintained across well-watered andwater-stressed conditions [3]. It is clear from these pot trials that plants have a range of mechanismsthat allow them to maintain high grain viability in the face of stress, and it would be very interesting todetermine if, and to what extent, these mechanisms are deployed under water-stressed conditions inthe field. A new finding was that wider and deeper grains have a higher PE, indicating plumper grainscan pack more efficiently, this has previously been associated with SW but not PE [28]. A negativecorrelation between GD and grain length needs further investigation though it could be a result of longgrains with a greater storage capacity being less filled with starch. This would be consistent with thepositive correlation between grain width, depth and starch concentration. Furthermore, long grains inwhich the caryopsis was not extended to the full distal end of the husk would negatively contribute toGD. The traditional opinion that SW is associated with an increased starch concentration in the grain issupported by this study.
4. Materials and Methods
4.1. Plant Material and Growth
The three spring malting barley cultivars (Octavia, Concerto and Sienna) used in this study wereselected due to their different SWs. According to the Agriculture and Horticulture DevelopmentBoard’s (AHDB’s) recommended list 2016; Octavia is a low SW cultivar, Concerto intermediate andSienna high, with reported SWs of 66.7, 68.8 and 70.7 kg hL−1, respectively. Seed was sourced from theAHDB and had been grown in the 2016 Recommended List trial in Docking, Norfolk, UK, under naturalrainfall conditions. Experimental plants were grown under glasshouse conditions at Scotland’s RuralCollege, Edinburgh, from November 2016 to June 2017, in triplicate experiments as described below.The three experiments were sown on 21st November 2016, 18th January 2017 and 1st March 2017,respectively. From November until the end of April, plants were grown in a heated glasshouse(min temperature 16 ◦C). When natural daylight hours were insufficient light was supplementedartificially using 400 W sodium lights to give 16 h days with a photosynthetically active radiationat plant ear level of 150 µmol−2 s−1 at the plant ear level. From 1st May plants were moved into anunheated glasshouse with no supplementary light. Seven grains of each cultivar were sown intoeach of 10 separate 5 L pots and grown in Levington’s Advance M3 High Nutrient Potting compostcontaining ratios of 204 N, 104 p and 339 K (Levington Horticulture, Ipswich, UK). Any seeds that hadnot germinated within five days were replaced to ensure a density of seven plants per pot. Pot densitywas approximately six pots per square metre; therefore, plant density was ~42 plants per square metre.
Plants 2020, 9, 1564 12 of 15
For each cultivar five of these pots were randomly allocated to a water stress treatment and five to awell-watered control treatment for each cultivar. There were, therefore, 30 pots in total. The five potsper treatment were expected to yield sufficient grain for one measurement of SW using a scaled downmethod comparable to industry standards [3]. A complete randomized block design with five blockswas used, with each cultivar: treatment combination represented once in each block and randomlyassigned a position. The experiment was conducted three times in order to obtain replication with potorder randomly re-assigned in each block for each repetition.
4.2. Water Stress Treatment
All plants were grown under the same non-stressed conditions and watered daily until half ofthe main shoots in a pot reached anthesis, defined as growth stage 61 [29]. At this point pots werewatered to field capacity and allowed to drain overnight and after which differential treatments wereapplied. Following anthesis, soil moisture readings were taken at least 6 days a week using a SM150dielectric soil moisture sensor (Delta-T Devices Ltd.) with an attached HH150 hand moisture meter.Soil moistures were recorded as electrical conductivity (mV) from an average of three readings per potand the manufacturers calibration used to equate this to volumetric water content. If a daily readingfor volumetric water content was below 21% for well-watered pot, or below 10% for a water-stressedpot, water was added to increase soil moisture above these threshold values. In addition, at least everythree days chlorophyll readings were taken using a SPAD-502 chlorophyll meter (Minolta, Japan),which measures the difference between transmittance through the leaf of red (650 nm) and infrared(940 nm) light. Readings were taken a third of the way up the penultimate leaf away from the mainstem, described as leaf 2 [7]. For each pot the average of three readings from three labelled leaves wasrecorded. The experiment proceeded in this way until maximum grain dry weight had been reachedfor at least half of the main shoots in a pot [30]. At this point all watering was stopped and plants wereallowed to dry out prior to harvest.
4.3. Plant Growth Measurements
Plants were hand threshed and numerous measurements taken per pot. These were grain weight(±0.0001 g), ear number per pot, ear length (±1 mm), grain number per pot, grain number per ear,spike fertility, which is measured as a proportion of total florets to grains, days of grain fill, plant aboveground biomass (±0.01 g) and grain yield (±0.0001 g). Grain moisture per pot was estimated by dryingtwo centrally located grains in an ear from each pot in an oven at 130 ◦C for 20 h and calculating thepercentage weight loss from wet to dry. To enable harvest index to be calculated, shoots were dried at70 ◦C for 48 h and weighed to give dry shoot biomass. Harvest index was then calculated as the ratioof harvested dry grain to total above ground shoot dry biomass.
4.4. Grain Sampling
Grain from each treatment and cultivar combination in each of the five blocks was pooled to givegrain samples large enough to make SW measurements. Grain samples were cleaned by screening overa slotted 2.25 mm sieve with 19.05 mm long slots. SW was measured on this pooled grain using a scaleddown published method which corresponds to the industry standard method [3]. Briefly, a 25 mLmeasuring cylinder of known total volume (39.16 mL) was filled with grain, and levelled using astraight edge, allowing calculation of weight per volume and conversion to the standard SW unit kghL−1. The packing efficiency was calculated as the proportion of space in this cylinder occupied bygrain. The mean grain number from three-cylinder re-fills was calculated, followed by multiplyingthis value by mean grain volume (see below), giving the packing efficiency. For further analysis to beconducted on grain samples from each cultivar and treatment combination a representative sample ofgrain was obtained by sequentially sieving each sample into size fractions using a stack of slotted 3.25,3.00, 2.75 and 2.50 mm sieves, with 19.05 mm long slots. The weight of grain retained by each sievefraction: extra-large (>3.25 mm), large (3.25 to 3.00 mm), medium (3.00 to 2.75 mm), small (2.75 to
Plants 2020, 9, 1564 13 of 15
2.50 mm) and extra small (2.50 to 2.25 mm) was weighed (accuracy ± 0.01 g). Three 100-grain sampleswere weighed from each fraction to estimate the mean grain weight in each fraction. This was used toestimate the total number of grains in each fraction, and a number proportional to the total number ofgrains from each fraction were chosen at random to give two separate 100-grain samples with grainsizes representative of the original bulk.
4.5. Grain Morphometrics and Specific Weight Components
In the first 100-grain sample, each grain was weighed, and the grain dimensions length, width anddepth were measured using a hand-held digital caliper (±0.01 mm). These grains were placedonto an Epson Expression 836XL flatbed scanner alongside a ruler for scale. The 2-D area of thegrains was estimated through image analysis in ImageJ [31]. Circularity was calculated in ImageJ as4π(area/perimeter2). A value of 1.0 represents a perfect circle, the closer to 0.0 the more the shaperepresents an elongated polygon. Grain volume was measured on this grain sample using Archimedes’principle with the weight of water being displaced by a grain being equal to the volume of grain.Each grain was weighed (±0.0001 g) then submerged in a beaker of water on the balance using a0.5 mm × 25 mm hypodermic needle to submerge the grain.
4.6. Compositional Analysis
The second 100-grain sample was milled into a fine powder using a ball mill (Mixer Mill MM200, Retsch, Germany). A FLASH 2000 Organic Elemental Analyzer (Thermo Scientific) was usedto determine the proportion of carbon and nitrogen in the grain, usually referred to as the carbonand nitrogen concentration. Nitrogen is converted to protein by multiplying by the factor 6.25.The concentration of starch and the ratio of amylose and amylopectin were measured using Megazymekits as previously described [30,32].
4.7. Data Analysis
All data were analysed in the open-source R software using version 3.4.1 [33]. Linear mixed-effectsmodel (LMM) analysis was used via the restricted maximum likelihood algorithm (REML) in the“lme4” package [34]. An LMM was fitted for each measured trait in the experiment, listed as plant/grainparameters in Table 1. Cultivar, water stress treatment and their interaction were fixed effects, and thereplicate number of the experiment was the random effect. Model fits were compared by likelihoodratio tests using the analysis of variance (ANOVA) function on hierarchical models, and non-significantvariables (α = 0.05) were dropped sequentially until a minimally adequate model was reached for eachparameter. The “emmeans” package was then used to calculate 95% confidence intervals to determinesignificant differences among samples [35]. Only the explanatory variables required by the minimallyadequate model were tested; therefore, letters of significance are the same within either treatment orcultivar in the cases where the interaction term was not significant, and only one of the individualexplanatory variables was significant.
5. Conclusions
Barley SW can be maintained in response to water stress by compensatory response mechanisms.However, despite SW being maintained, this does not necessarily mean the grain from water-stressedplants is of the same quality. This was demonstrated by the decrease C:N and increased N concentrationin grains from water-stressed plants, despite there being no difference in SW. The observed increase in Nconcentration from 1.70 to 1.83% under water-stressed conditions is appreciable in the malting industry.For example, according to the Maltsters Association of Great Britain this increase would result in thisgrain being rejected for the brewing industry with targets set of 1.60 to 1.75%. Therefore, this work hascontinued to highlight the complexity of SW and its use as a malting quality criterion.
Plants 2020, 9, 1564 14 of 15
Supplementary Materials: The following are available online at http://www.mdpi.com/2223-7747/9/11/1564/s1,Table S1: Summary of mean values ± standard deviations for plant growth parameters soil moisture acrossthree reps for the three cultivars and two treatment levels used in this study; Table S2: Statistical analyses of theimpact of drought and cultivar on grain characteristics using mixed models with rep as a random effect; Table S3:Statistical analyses of the impact of drought and cultivar on grain characteristics using mixed models with rep as arandom effect; Table S4: p-values associated with the correlation matrix in Table 2.
Author Contributions: Conceptualization, A.H., S.P.H., M.B. and G.E.J.; methodology, A.H. and L.R.; formalanalysis, A.H.; writing—original draft preparation, A.H.; writing—review and editing, A.H., M.B., G.E.J. andS.P.H. All authors have read and agreed to the published version of the manuscript.
Funding: This research was funded by the Agriculture and Horticulture Development Board (AHDB 21130047).Further funding was also gratefully received from the Scottish Government’s Rural and Environmental Scienceand Analytical Services (RESAS) division.
Acknowledgments: The authors thank Colin Crawford of Scotland’s Rural College for assisting with the organicelement analysis.
Conflicts of Interest: The authors declare no conflict of interest.
References
1. FAOSTAT Food and Agriculture Organization of the United Nations. Available online: http://www.fao.org/
faostat/en/#data (accessed on 8 September 2020).2. Hoyle, A.; Brennan, M.; Pitts, N.; Jackson, G.E.; Hoad, S. Relationship between specific weight of spring
barley and malt quality. J. Cereal Sci. 2020, 95, 103006. [CrossRef]3. Hoyle, A.; Brennan, M.; Jackson, G.; Hoad, S. Specific weight of barley grains is determined by traits affecting
packing efficiency and by grain density. J. Sci. Food Agric. 2019, 99, 2548–2555. [CrossRef] [PubMed]4. Asare, E.K.; Jaiswal, S.; Maley, J.; Båga, M.; Sammynaiken, R.; Rossnagel, B.G.; Chibbar, R.N. Barley grain
constituents, starch composition, and structure affect starch in vitro enzymatic hydrolysis. J. Agric. Food Chem.2011, 59, 4743–4754. [CrossRef] [PubMed]
5. Wenwen, Y.; Tao, K.; Gidley, M.J.; Fox, G.P.; Gilbert, R.G. Molecular brewing: Molecular structural effectsinvolved in barley malting and mashing. Carbohydr. Polym. 2019, 206, 583–592. [CrossRef]
6. Hoyle, A.; Brennan, M.; Jackson, G.E.; Hoad, S. Increased grain density of spring barley (Hordeum vulgare L.)is associated with an increase in grain nitrogen. J. Cereal Sci. 2019, 89, 102797. [CrossRef]
7. AHDB Barley Growth Guide 2015. Available online: https://ahdb.org.uk/barleygg (accessed on 8 September 2020).8. García, G.A.; Serrago, R.A.; Dreccer, M.F.; Miralles, D.J. Post-anthesis warm nights reduce grain weight in
field-grown wheat and barley. Field Crops Res. 2016, 195, 50–59. [CrossRef]9. Kennedy, S.P.; Lynch, J.P.; Spink, J.; Bingham, I.J. Grain number and grain filling of two-row malting barley
in response to variation in post-anthesis radiation: Analysis by grain position on the ear and its implicationsfor yield improvement and quality. Field Crops Res. 2018, 225, 74–82. [CrossRef]
10. Macnicol, P.K.; Jacobsen, J.V.; Keys, M.M.; Stuart, I.M. Effects of heat and water stress on malt quality andgrain parameters of schooner barley grown in cabinets. J. Cereal Sci. 1993, 18, 61–68. [CrossRef]
11. Afshari-Behbahanizadeh, S.; Akbari, G.A.; Shahbazi, M.; Alahdadi, I.; Farahani, L.; Tabatabaee, S.A.;Ganji, M. Qualitative and Physical Properties of Barley Grains under Terminal Drought Stress Conditions.Available online: http://ir.jkuat.ac.ke/handle/123456789/1294 (accessed on 8 September 2020).
12. Samarah, N.H. Effects of drought stress on growth and yield of barley. Agron. Sustain. Dev. 2005, 25, 145–149.[CrossRef]
13. Thitisaksakul, M.; Jiménez, R.C.; Arias, M.C.; Beckles, D.M. Effects of environmental factors on cereal starchbiosynthesis and composition. J. Cereal Sci. 2012, 56, 67–80. [CrossRef]
14. Beckles, D.M.; Thitisaksakul, M. How environmental stress affects starch composition and functionality incereal endosperm. Starch 2014, 66, 58–71. [CrossRef]
15. He, J.-F.; Goyal, R.; Laroche, A.; Zhao, M.-L.; Lu, Z.-X. Water stress during grain development affects starchsynthesis, composition and physicochemical properties in triticale. J. Cereal Sci. 2012, 56, 552–560. [CrossRef]
16. González, A.; Martín, I.; Ayerbe, L. Barley yield in water-stress conditions. F. Crop. Res. 1999, 62, 23–34.[CrossRef]
Plants 2020, 9, 1564 15 of 15
17. Gooding, M.J.; Ellis, R.H.; Shewry, P.R.; Schofield, J.D. Effects of restricted water availability and increasedtemperature on the grain filling, drying and quality of winter wheat. J. Cereal Sci. 2003, 37, 295–309.[CrossRef]
18. Liu, K.; Yang, R.; Lu, J.; Wang, X.; Lu, B.; Tian, X.; Zhang, Y. Radiation use efficiency and source-sink changesof super hybrid rice under shade stress during grain-filling stage. Agron. J. 2019, 111, 1788–1798. [CrossRef]
19. Mahalingam, R. Phenotypic, physiological and malt quality analyses of US barley varieties subjected to shortperiods of heat and drought stress. J. Cereal Sci. 2017, 76, 199–205. [CrossRef]
20. Mahalingam, R.; Bregitzer, P. Impact on physiology and malting quality of barley exposed to heat, droughtand their combination during different growth stages under controlled environment. Physiol. Plant. 2019,165, 277–289. [CrossRef]
21. Huang, R.; Jiang, L.; Zheng, J.; Wang, T.; Wang, H.; Huang, Y.; Hong, Z. Genetic bases of rice grain shape: Somany genes, so little known. Trends Plant Sci. 2013, 18, 218–226. [CrossRef]
22. Walker, C.K.; Ford, R.; Muñoz-Amatriaín, M.; Panozzo, J.F. The detection of QTLs in barley associatedwith endosperm hardness, grain density, grain size and malting quality using rapid phenotyping tools.Theor. Appl. Genet. 2013, 126, 2533–2551. [CrossRef]
23. Mather, D.E.; Tinker, N.A.; LaBerge, D.E.; Edney, M.; Jones, B.L.; Rossnagel, B.G.; Legge, W.G.; Briggs, K.G.;Irvine, R.G.; Falk, D.E.; et al. Regions of the Genome That Affect Grain and Malt Quality in a North AmericanTwo-Row Barley Cross. Crop Sci. 1997, 37, 544–554. [CrossRef]
24. Zhang, J.; Sui, X.; Li, B.; Su, B.; Li, J.; Zhou, D. An improved water-use efficiency for winter wheat grownunder reduced irrigation. Field Crops Res. 1998, 59, 91–98. [CrossRef]
25. Al-Ajlouni, Z.; Al-Abdallat, A.; Al-Ghzawi, A.; Ayad, J.; Abu Elenein, J.; Al-Quraan, N.; Baenziger, P. Impactof pre-anthesis water deficit on yield and yield components in barley (Hordeum vulgare L.) plants grownunder controlled conditions. Agronomy 2016, 6, 33. [CrossRef]
26. Millet, E. Relationships between grain weight and the size of floret cavity in the wheat spike. Ann. Bot. 1986,58, 417–423. [CrossRef]
27. Gous, P.W.; Hasjim, J.; Franckowiak, J.; Fox, G.P.; Gilbert, R.G. Barley genotype expressing “stay-green”-likecharacteristics maintains starch quality of the grain during water stress condition. J. Cereal Sci. 2013,58, 414–419. [CrossRef]
28. Atkinson, M.D.; Kettlewell, P.S.; Poulton, P.R.; Hollins, P.D. Grain quality in the Broadbalk wheat experimentand the winter North Atlantic oscillation. J. Agric. Sci. 2008, 146, 541–549. [CrossRef]
29. Tottman, D.R.; Broad, H. The decimal code for the growth stages of cereals, with illustrations. Ann. Appl. Bot.1987, 110, 441–454. [CrossRef]
30. Gibson, T.S.; Solah, V.A.; McCleary, B.V. A procedure to measure amylose in cereal starches and flours withconcanavalin A. J. Cereal Sci. 1997, 25, 111–119. [CrossRef]
31. Abràmoff, M.D.; Magalhães, P.J.; Ram, S.J. Image processing with ImageJ. Biophotonics Int. 2004, 11, 36–42.32. Mccleary, B.V.; Gibson, T.S.; Mugford, D.C.; Lukow, O.; Jackson, D.S.; Rabe, E.; Patel, N.; Williams, P.C.;
Gelroth, J.; Camire, M.E.; et al. Measurement of total starch in cereal products by amyloglucosidase-α-amylasemethod: Collaborative study. J. AOAC Int. 1997, 80, 571–579. [CrossRef]
33. R Development Core Team. R: A Language and Environment for Statistical Computing 2008. Available online:https://www.r-project.org/ (accessed on 8 September 2020).
34. Bates, D.; Maechler, M.; Bolker, B.; Walker, S. Fitting linear mixed-effects models using lme4. J. Stat. Softw.2015, 67, 1–48. [CrossRef]
35. Lenth, R.V. Emmeans: Estimated marginal means, aka least-squares means. R Packag. Version 2018, 1.1, 3.
Publisher’s Note: MDPI stays neutral with regard to jurisdictional claims in published maps and institutionalaffiliations.
© 2020 by the authors. Licensee MDPI, Basel, Switzerland. This article is an open accessarticle distributed under the terms and conditions of the Creative Commons Attribution(CC BY) license (http://creativecommons.org/licenses/by/4.0/).