Embed Size (px)
Citation preview

Singapore International Energy Week29 Oct 2020
Power system and recent trends in wind energy development
in VietnamNgo To Nhien
Executive DirectorVietnam Initiative for Energy Transition

Content
2
OVERVIEW OF VIETNAM’S POWER SECTOR
PROSPECT OF OFFSHORE WIND POWER

Vietnam’s Power mix – a transition underway
18,516
7,152
1,501 325
19,907
84 269 237 572 2018
19,804
7,152
1,501 325
20,382
4,439
371244
572 2019 Coal
Gas turbine
Oil
Diesel and other
Hydro
Solar
Wind
Biomass and other
Import
Installed capacity by source (MW)
3Source: NLCD report, Sep. 2020

System overview
4
2020 2025 2030 Total installed capacity [MW] 60.090 116.699 169.498 Share of coal and (LNG) CCGT 47,2% 46,0% 51,3% Share of hydropower and pump storages 29,6% 18,4% 14,5% Share of wind 1,7% 10,0% 10,8% Share of solar PV 12,8% 17,4% 14,9% Others 8,8% 8,2% 8,5%
2020 2025 2030 Total load demand [MW] 44.244 68.367 100.215 Load demand from the North 17.698 27.347 40.086 Load demand from the Central 4.424 6.837 10.022 Load demand from the South 22.122 34.184 50.108
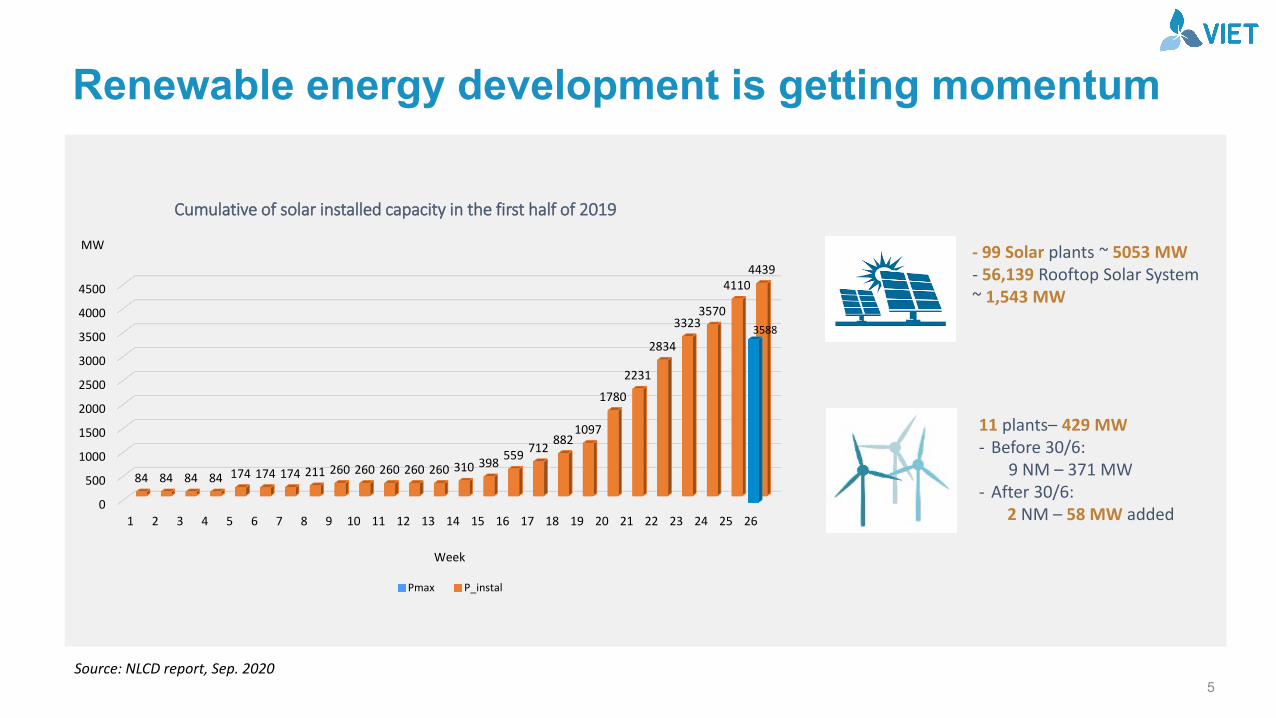
Renewable energy development is getting momentum
0
500
1000
1500
2000
2500
3000
3500
4000
4500
1 2 3 4 5 6 7 8 9 10 11 12 13 14 15 16 17 18 19 20 21 22 23 24 25 26
3588
84 84 84 84 174 174 174 211 260 260 260 260 260 310 398 559 712 8821097
1780
2231
2834
33233570
41104439
MW
Week
Cumulative of solar installed capacity in the first half of 2019
Pmax P_instal
- 99 Solar plants ~ 5053 MW- 56,139 Rooftop Solar System ~ 1,543 MW
11 plants– 429 MW- Before 30/6:
9 NM – 371 MW - After 30/6:
2 NM – 58 MW added
Source: NLCD report, Sep. 20205
6
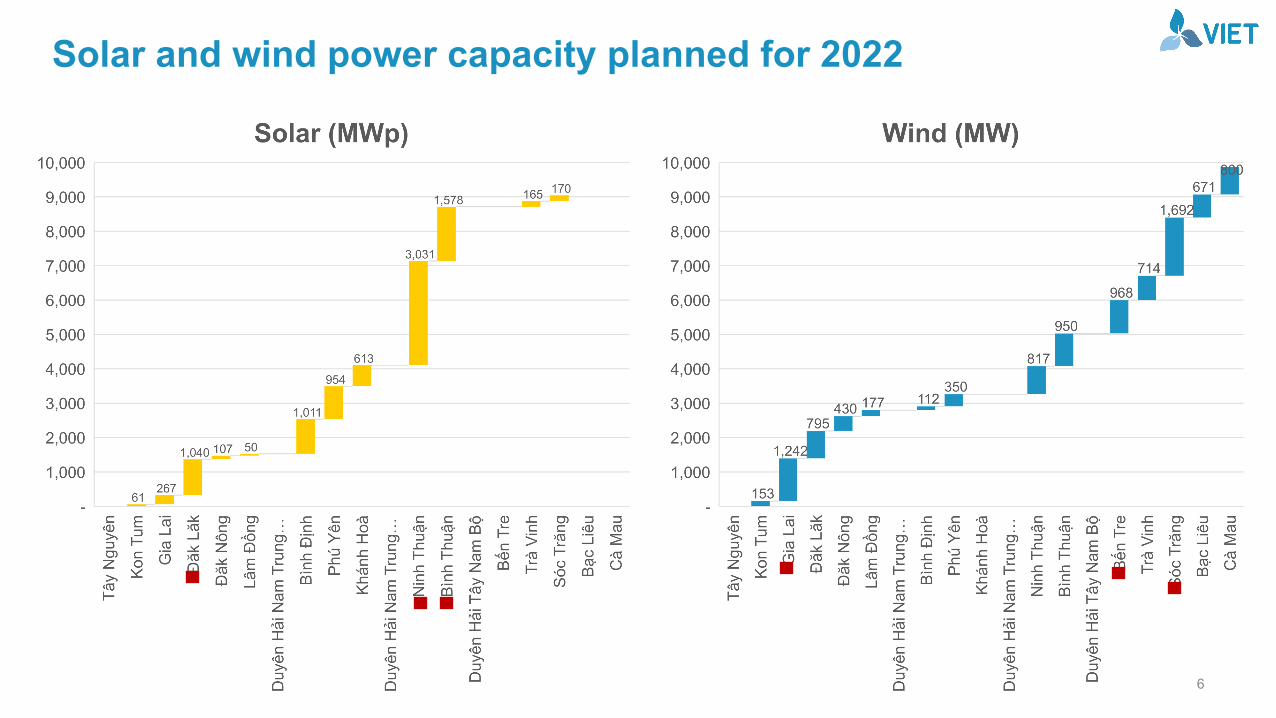
Solar and wind power capacity planned for 2022

Wind and solar power projects in operation Wind and solar power project included in the PDP
7Source: VIET 2020

Rooftop solar (RTS) market development 2019-2020
56,139 1,543.2
-
200.0
400.0
600.0
800.0
1,000.0
1,200.0
1,400.0
1,600.0
1,800.0
0
10000
20000
30000
40000
50000
60000
Inst
alle
d Ca
paci
ty (M
Wp)
Num
ber o
f sys
tem
s
Development of the Rooftop Solar Systems and Installed Capacity in Viet Nam
Number of systems Installed Capacity (MWp)
Source: VEPG Factsheet on Rooftop Solar Development September 2020, data: EVN
September 2020:• 1,543 MW• 56.139 systems
8

Supporting policies for RE development
9
2011FIT for Wind7.8 $c/kWh
2014FIT for biomass ($c/kWh)
CHP: 5.8 Dedicated plant: 7.35-7.55Waste incineration: 10.5
Landfill gas: 7.28
2017FIT for solar 9.35 $c/kWh
2018FIT 2 wind ($c/kWh)
Onshore 8.5Offshore 9.8
2020FIT 2 solar($c/kWh)
Ground: 7.09Floating: 7.69Rooftop: 8.38
2020FIT 2 for biomass
($c/kWh)CHP: 7.03
Non-CHP plant: 8.47

2020 2021 2022 2023
Sea Ports Development Plan to 2030, vision 2050
Power Development Plan 8 to 2030, vision 2045
National Energy Plan to2030, vision 2050
DPPA Pilot
2025
Development of Competitive Power Market
Retail market to be operated
Auctioning scheme for Solar energy
Wholesale market officially operated
Development of Vietnam Energy Information System
Renewable Energy Law
Revise Electricity Law
New FIT wind
New grid I&O mechanism
2024
RPS, Emission Trading System?
2019
Upcoming policy
EIA Offshore wind

Prospect of Offshore Wind Power
11

Offshore Wind Potential• Potential [1]
• 261 GW fixed • 214 GW floating
• Possible zoning[2] – Table 3
12[1] ESMAP - Energy Sector Management Assistance Program, “Going Global - Expanding Offshore Wind to Emerging Markets,” 2019.[2] V. Q. Doan et al., “Usability and challenges of offshore wind energy in Vietnam revealed by the regional climate model simulation,” Sci. Online Lett. Atmos., 2019.
Current 2025 20230
Onshore existing 500kV substations
Avg. max loading [%]
New onshore 500kV substations
Residual cap. [MW]
New onshore 500kV substations
Residual cap. [MW]
Zone 1Quang Ninh, Pho Noi, Dong Anh, Hiep Hoa, Thuong Tin
78Bac Giang, Bac Ninh, Hai Phong
4,032Gia Loc, Long Bien
5,382
Zone 2 Da Nang, Doc Soi, Thach My 33 3,003 Binh Dinh 3,228
Zone 3Song May, Tan Uyen, Chon Thanh
51 Long Thanh 3,335Dong Nai 2, Binh Duong 1
5,135
Zone 4 Cau Bong, Phu Lam, Nha Be 62Duc Hoa, Long An
3,743Thot Not, Cu Chi
5,318

Roadmap to reach 10GW of Offshore wind
13
Source: Integrating Offshore Wind in Vietnam Power System – A technical-economic assessment. VIET 2020
Zone Trans. Tech. 2023 2024 2025 2026 2027 2028 2029 2030 Total
1 VSC-HVDC 600 600 600 600 600 3,000
3 Point-to-point HVACVSC-HVDC 600 1200 1200 600 600 4,200
4 VSC-HVDC 600 600 600 600 600 3,000
Total 600 1,800 1,800 1,200 1,200 1,200 1,200 1,200 10,200
Unit: MW

Constraints for OSW development
• Protected area/ essential habitats (R)• Vulnerable marine species (value of biodiversity) (A)• Birds and bats (A)
Environmental• Oil-related activities (R)• Energy and communication infrastructures (A)• Aquaculture (A)• Commercial fishing grounds (R)• Sea landscape and tourisms (A)• Historical and cultural heritages (R)
Social
• Marine traffic (R)• Air traffic (A)• Military exercise area (R)
Technical
14

14 OSW projects has been proposed
~ 28 GW
15

Conclusion• In the next 10 years, renewable energy will continue to explode in Vietnam, mainly from
offshore wind energy;
• However, there are some issues to keep in mind:• RE development needs to be develop synchronously between supply and transmission system,
major challenges in balancing systems and increasing transmission infrastructure cost cause by concentrating RE projects in some areas
• Investing in upgrading the transmission grid should be carefully consideration It is recommended to optimize the regional supply-demand balance, minimize inter-regional transmission
• The purchase price of RE electricity can be close to the international market by apply auction mechanism. should define specific roadmap to accelerate the development of the RE market
• The Government of Vietnam should proactively announce the national renewable energy development target for the next 10 yearsMarket need specific signals, form a domestic supply supporting industries create job opportunities
create real value from the process of energy transition for Vietnam.
16

Thank you for your attention!
• 7 Floor, 18 Ly Thuong Kiet Str. | Hanoi |100000
• T : +84.243.204.5554 | M: +84.945.336.677 |
• [email protected] | VIETSE.VN | Facebook | LinkeIn
17