Embed Size (px)
Citation preview

Predicting Car-Pool Demand
Ride Sharing to Work: An Attitudinal Analysis Abraham D. Horowitz, General Motors Research Laboratories Jagdish N. Sheth, University of Illinois
A mathematical model of ride sharing was proposed and tested by using data collected in the Chicago area in 1975. The purpose of the model development was to determine how perceived advantages and disadvantages of ride sharing determine behavioral predispositions toward it. The main conclusions are that (a) demographic and travel characteristics are poor indicators and predictors of the choice between driving alone and ride sharing; (b) the study of attitudes toward ride sharing and driving alone provides answers that are relevant to the question of how to develop ride-sharing strategies; (c) with the exception of individuals having a relatively high socioeconomic status, appeals based on public-interest issues of energy, traffic, and air quality have little chance of changing attitudes toward ride sharing; (d) perceptions of drivers toward time loss and the characteristics of convenience and reliability of ride sharing would need to change before their travel behavior would change and perceptions of economic advantages have a minor role in the determination of behavioral predisposition toward ride sharing; and (e) to override negative perceptions about ride sharing, campaigns should address its positive aspects related to the use of travel time and its convenience and reliability.
The literature on ride sharing, which has developed mainly as a consequence of the energy shortage of 1973-1974, is concerned with the travel characteristics of car poolers ( 10), with ride-sharing matching (_; ~ 15, 20), with the study of incentives for inducing people to share a ride (!, 16, 23), and with clinical-social aspects (!, !).
Studies on ride-sharing matching and incentives a.re based on the presumptions that solo drivers can be induced to car pool by offering them direct incentives (for example, parking and traffic pl'iorities) or that driving alone might be discouraged by, for example, increasing the cost of gasoline. Effective promotion of ride sharing requires a direct knowledge of how it is viewed both by commuters who drive alone and by those who share a ride to work.
Attitudes toward i·ide s haring have been studied by Alan M. Voorhees and Associates (22), by CarnegieMellon University ( 5), and by Dueker and Levin (8) . The Voorhees and Associates and Carnegie-Mellon studies showed that there are significant differences in attitudes toward ride sharing between solo drivers and car poolers. However, the structure of attitudes was not studied in depth, nor was there any attempt to identify homogeneous subgroups that might differ in their attitudes. Dueker and Levin examined the way in which the desirability of ride sharing varies as a function of the sex of a rider and whether or not the rider is a prior acquaintance.
Horowitz (11) has developed a theoretical framework for the measurement of attitudes toward ride sharing and driving alone and presented mathematical models relating modal choice to the perceived advantages and disadvantages of ride sharing and to other attitudinal and socioeconomic characteristics. This paper reports the results of testing this framework by a marketingresearch survey.
The survey was conducted in 1975 among residents of the Chicago metropolitan area who were contacted
through their employers. The main resons for choosing Chicago as the site of the data collection was that it has a wide variety of businesses, both in terms of their type and size and in terms of their locations (city and suburban), and a variety of public transit services.
The personnel departments of 43 firms, chosen randomly from a large list of companies that employ at leas t 100 people, were contacted. Cooperation was gqod, and 34 of the 43 (80 percent) agreed to participate in the survey. About 60 percent of these firms are manufacturing companies, and the others are distributors, insurance companies, and other types of organizations. The personnel departments were asked to contact approximately equal numbers of car poolers, solo drivers, and public-transit users, and request them to answer a selfadministered mail-back questionnaire that was hand delivered. 'I\vo thousand questionnaires were distributed, and 1020 were returned. After eliminating those questionnaires having a large amount of missing data, 822 questionnaires from 323 car poolers, 382 solo drivers, and 117 public transit users remained for analysis.
Because, in this sample, almost all car poolers owned at least one automobile while 75 percent of transit users did not, it was assumed that automobile ownership is a necessary condition for sharing a ride to work. For this reason, only data relating to car poolers and solo drivers were analyzed.
The method of contacting commuters through their employers, a method that is seldom used in transportation research, has certain advantages over traditional methods of data collection. The rate of return is relatively high (about 50 percent) as compared to mail surveys, and the cost for data collection is smaller than that required for home interviews.
Throughout this paper, the two basic modes of travel to work will be called drive alone and ride sharing and the two types of commuters solo drivers and car poolers respectively. The concept of ride sharing is restricted in the present study to the use of privately owned automobiles.
Three types of information were collected through the questionnaires: The first two are socioeconomic and travel characteristics, and the third is attitudinal data with respect to both ride sharing and driving alone.
A few words are desirable to describe the theoretical approach that guided the formulation of the attitudinal questions. There is a consensus amollg attitude researchers (9, 19, 21) th.:1.t attitudes consist of one or more of three elen1ents:(a) cognitive evaluations or beliefs, (b) affect llike-dislike emotive tendency), and (c) behavioral intention.
1. Cognitive Evaluations: It is hypothesized that an individual has a set of evaluative beliefs about the ridesharing and drive-alone modes of travel to work with respect to such factors as cost, time saving, and convenience. Ten such ath·ibutes (expensive, comfortable,
1

2
pleasant, reliable, saves time, convenient, safe from c-rime, energy consuming, traffic problems, and pollution) were eliclted through info1·mal interviews conducted individually with a few car poolers and solo drivers. Cognitive evaluations of these attributes were measured on a seven-point scale from very low to very high.
2. Affect: This represents the positive or negative emotional predisposition toward an object and is presumed to be unidimensional, although it is possible that there is a complex cognitive structure underlying it. A measure of the affect toward ride sharing was obtained from the replies to the question "All things considered, which 1:1laleu11ml best describes how you like the idea of you being a member of a car pool?'' The possible replies were like (ex1:1·emely, moderately, or slightly), neither like nor dislike, and dislike (slightly, moderately, or extl'emely).
3. !ntentio!!: Ride-sharin.~ intention refers to the stated plan of an individual to car pool and was measured by the replies to the question "How likely are you to join a car pool within the next two or three months?" The possible replies were definitely will, very likely, somewhat likely, cannot say, somewhat unlikely, very unlikely, and definitely will not. Intention is also hypothesized to be related to the cognitive profile of evaluations. It is a qualified expression of behavior: Given a span of time when behavior is likely to be manifested, the individual estimates at the beginnhig of the period of time whether or not he 01· she would behave in a certain manner. Because the shorter the period of time between intention and behavior, the more valicl is the .intention (21), the time span was limited to the next two or three months. (A theoretical structure of the relation between the cognitive evaluations, affect, and intention will be given later in this paper.)
RESULTS
Demographic and Travel Characteristics
A multivariate analysis of variance (MANOVA) test using Wilks lambda c1·itcria (17) performed on 13 demographic variables showed that solo drivers diller significantly from car poolers [ F = 5.8, degrees of freedom (df) = 13;691, p < 0.001, multivariate-explained variance = 9.8 percent]. [Detailed univariate descriptions have been given by Ilorowitz and Sliet11 (12).)
The socioeconomic variabiethat discriminates most strongly between the two groups is the size of the automobile owned: Car poolers own larger automobiles than do solo drivers. Other discriminant variables, although weaker, indicate that cai· poolers have worked longer at their present places of employment, are married rather than single, and have lived longer at their present residence. They are somewhat older and have larger families. The following variables do not discriminate between tl1e two groups : (a) number of pe1·sons in household with driver's license, (b) number of automobiles owned, (c) age of the automobile that is used for the work trip, (d) sex, (e) income, (f) professional status, and (g) education.
Thus, when compared with those who drive alone in their private automobile, the typical car pooler in the Chicago area has a larger family and a larger car, has lived a longer time at his or her present residence, and has been working longer at the same place of employment. In short, the car pooler may be somewhat later in his or her life cycle than is the solo driver.
A MANOVA test using Wilks lambda criteria performed on seven travel characteristics, as reported by respondents in the survey, also showed that s olo drivers differ significantly from car poolers (F = 22.2, df =
7;697, p < 0.001, multivariate-explained variance = 13.5 percent). The trip-to-work characteristics that disc1·iminate between the two groups are (a) total travel cost for driving al.one, (b) gasoline cost for driving alone, (c) travel time, (ct) travel time of cru· _poolers if they drove alone, and (e) distance to work. While the car pooler driving alone to work would require an average of 32.3 min, the solo driver needs only 26.5 min. The corresponding average distances from home to work are 26.1and17.9 km (16.3 and 11.2 miles). A car pooler spends an average of 34.3 min traveling to work. The characteristics that do not discriminate between the two groups are (a) distance to the nearest publictransportation station (5.9 km (3.7 miles)] and (b) walking time from parking area to work (approximately 3 minL
A few comments are in order: First, a discriminant n.nu.lysia pcrfvrmed ori both the dei11og1~aµhic auU irav~i characteristics showed that only 61. 7 percent of the 70 5 commuters were correctly classified by the discriminant function. Since pure chance should give a correctly classified proportion of 50 percent, it follows that the demographic and travel cha.racteristics add in only 11. 7 percent of the cases, whlch is a small and negligible pro-po ·tion. In summary, the multivariate-explained variance and (not independently) the results of the discriminant analyses indicate that demographic and travel characteristics are poor indicators of whether a commuter to work drives alone or shares a ride.
Second, solo drivers and car-pooling groups are better distinguished from each other by travel characteristics than by socioeconomic characteristics. That the socioeconomic variable that best distinguishes between the two groups is automobile size is consistent with the declining role of socioeconomic va1·iables in the explanation and prediction of consumer choice among the l'elatively affluent, middle-class population (14, 24).
Finally, the results are partiallj111cOnsistent with the Voorhees and Associates study (22) of commuters on the Hollywood Freeway in the Los Angeles area. The only statistically significant discriminant variables the present study and the Voorhees study have in common are distance to work and travel time. The Voorhees study, in contrast to the present one, found that car poolers tend to be somewha younger than are solo drivers . This discrepancy between the two studies may be attributed to the small number of car poolers (108) in the Voorhees study and to the different locations of the two studies. (It will be shown later, however, that attitudinal differences between car poolers and solo drivers are similar in the two studies and are pe1·haps more universal than are demographic and travel characteristics.)
Ride-Sharing Cognitive Profile
Of the 10 attributes of the cognitive-evaluation profiles, only the safe-from-crime one was found not to differentiate the two groups or to correlate with any of the other attributes. Figure 1 shows the means of the ride-snaring cognitive profile of the 9 remaining attributes for solo drivers and car poolers. Each attribute was rated on a semantic scale from one to seven where one meant very low, seven ve1·y high, and four was the neutral ground. A multivariate test performed on the whole vector of 9 attributes showed that the two groups of respondents differ significantly (F "' 30.6, df = 9;695, p s 0.001, multivariate-explained va1·iance : 28.4 percent).
The univariate tests lead to the following observations: First, solo drivers differ significantly from car poolers in their evaluation of ride sharing with respect to convenience, reliability, pleasure, comfort, a11d lime (for each of these attributes, p < 0 .001), but do not differ in

their evaluation of ride sharing with respect to cost, energy, traffic problems, and air pollution.
Regardless of whether the differences between the two ride-s haring attitudi nal profiles r eflect the cause of commuting behavior or the result of it (dissonance phenomena l, the results s how the importance of the soft variables, such as convenience and reliability, and the perception of value of time in the perception of driving alone and car pooling.
Second, on the average, solo drivers tend to evaluate car pooling on all nine attributes at or just below the middle ground. This implies that solo drivers have a neutral position of ride sharing and a slight tendency to perceive it as inconvenient or not reliable. If solo drivers had a clearly negative attribute profile toward ride sharing, it might not be easy to change their position but, from a generally neutral position, a change in attitude might be achieved by advertisement and promotional means. [For a discussion of the relation between neutral attitudes and attitudinal change, see Howard and Sheth (13) .]
Third, on the average, car poolers evaluate ride sharing as being clearly convenient, reliable, pleasant, comforatble, and economical. To a lesser extent, they perceive ride sharing as time saving and low in creating traffic problems and pollution. In this context, the ridesharing cognitions of car poolers and solo drivers measured by Voor hees and Associates (22, Figure 12), were compatible with those obtained here despite the differences between the scales used in the two studies. The largest differences between car poolers and solo drivers were found by Voorhees in two semantic scales related to dependence on others.
An additional measure of attitudinal differences between the two groups of respondents based on the car pooling attributes has been obtained through a discriminant analysis. The discriminant function correctly classified 73.6 percent of the respondents; i.e., 23.6 percent in addition to the 50 percent that would be expected to be classified correctly by random assignments to groups, or about twice the discrimination beyond random that was achieved by the socioeconomic and travel characteristics.
Drive-Alone Cognitive Profile
The same nine attributes were also rated in the context of the drive-alone mode. The raw means are shown in Figure 2. A multivariate test performed on the vector of nine attributes showed that the two groups differ significantly, but to a lesser degree than in the case of the ride-sharing evaluation (F = 10.4, df = 9;695, ~ ,;; 0,001, multivariate-explained variance = 11.8 percent}.
An inspection of the individual means and the univariate tests leads to two principal observations. First, both groups of commuters perceive the drive-alone-towork mode as being high on the qualitative attributes of convenience, reliability, comfort, and time saving. Second, solo drivers are more positive toward their own mode of transportation than car poolers are toward driving alone. This difference is statistically significant for all attributes (p < 0.001), with the exception of t he public-cost attributes of energy, traffic, and air pollution.
These results suggest that, regardless of whether attitudes determine behavior or vice versa, cost is related to the choice between driving alone and ride sharing, but conside rations of energy use, traffic, and pollution are uot. (Attention will be given later to the ques tion of how cost considerations differ from considerations of time, convenience , and such, in the determination of the choice between the modes .l
Affect Towar d Ride Sharing a nd Intention to Share a Ride
3
Figure 3 shows the distribution of affect toward ride sharing for the solo drivers and the car poolers.
There is no need for statistical tests to show that the two groups are significantly differentiated by the affect measure. Solo drivers are divided along the continuum from like extremely to dislike extremely, with about 20 percent being neutral, but almost all car poolers are positive toward ride sharing.
Figure 4 shows the car-pooling-intention distribution for solo drivers. About 9 percent of the 376 solo drivers who answered the question stated a positive intention. Intention is a noncommitment behavior and may be grossly exaggerated, and so it can be assumed that less than 9 percent of the solo drivers surveyed intend to car pool regularly. However, the relation between the affect and intention measures and those of the cognitive perceptions could contribute to understanding the process through which modal choice is determined.
Differences Between Ride-Sharing and Drive-Alone Cognitive Profiles
The attribute evaluations were measured with respect to ride sharing and separately for the drive-alone mode. To obtain a more comprehensive grasp of the ridesharing cognition and to relate it to both the affective and the intentional components when the drive-alone mode serves as a baseline, the difference between the drive-alone and ride-sharing evaluations was used as a measure of evaluation on each attribute. This difference was computed by subtracting the individual measures shown in Figure 1 from those in Figure 2 and will be denoted by 61, i = 1, ... ' 9' where 61 = xi,drive-alonc - xi,ridcsharing and x1 mode is the evaluation of the attribute i on the corresponding mode. The null hypothesis that the 51 values are not different from zero has been rejected for both solo drivers and car poolers for all attributes (p < 0.001) with the exception of pleasant in the car-poolers group.
The 61 values were, on the average, positive. That is, driving alone is perceived by a commuter, regardless of his or her actual mode of travel, as being more convenient, reliable, ... , expensive, energy consuming, and such, than is ride sharing. This result warrants classification of 'the attributes into two groups: negative ride-sharing cognitions (51' i = 1, ... , 5 for convenient, r eliable, pleasant , comt:o1·table and saves time respectively) and positive ride-sha r ing cognitions (51' i = 6, ... , 9 for expensive, energy consmitlng, traffic problems, and pollution respectively). The pr ofiles that determine the 61 values, which are extracted from Figures 1 and 2, are shown in Figures 5 and 6 for solo drivers and car poolers respectively.
Another reason for the organization of the attributes into two groups arises from the results of factor analyses performed on the 61 , i = 1, ... , 9 measures for each group of commuters. These analyses showed that two factors emerged and that they match the negative and positive cognitions. The factor that included the negative cognitions was labeled time-convenience and denoted T, and the factor that included the positive cognitions was labeled private and public cost and denoted C. These factors are summarized below.
Factor Attribute
T (time-convenience) 1 Convenient 2 Reliable 3 Pleasant 4 Comfortable 5 Saves time

4
Factor Attribute
C (private and public costs) 6 Expensive 7 Energy consuming 8 Traffic problems 9 Pollution
Figure 1. Cognitive evaluations of ride sharing.
I VERY LOW l 2 3 4 5 6 7 VERY HIGH I I I I I I I
- CONVENIENT ,., , '• "• RELIABLE
; I PLEASANT ~
I §;\? .i J COMFORTABLE ;;;: !
~ <[ i :z: ~ v ,.. SAVES TIME 0 . "' EXPENSIVE
' ENERGY CONSUMI
l u
NG II MS TRAFFIC PROBLE
~
---- CARPOOLERS (N=323) ""'""""'"'SOLO DRIVERS (N=382)
POLLUTION
Figure 2. Cognitive evaluatio11s of drive aio11e.
l VERY LOW
----• CARPOOLERS (N=323) 11111111111111111111 SOLO DRIVERS (N=382)
4 7 VERY HIGH
I CONVENIENT --
J'f :=
/. .. .• ,- i:. ....
l .L ,,,'_j "" -· ,
RELIABLE
PLEASANT
COMFORTABLE
SAVES TIME
EXPENS ! l!E
I
.: ENERGY CONSUMING
The output from the factor analyses are two factor scores for each individual, one for each factor. A factor score is a weighted average of the 01-measures of the corresponding factor.
MODELS RELATING COGNITION FACTORS TO AFFECT AND INTENTION
Research in both social psychology and consumer psychology has indicated that there is a linear additive relation between evaluations (cognition) and affect and intention (9, 21). This implies that positive and negative evaluationscompensate for one another. Recently, however, several workers have expressed concern that a linear additive pr esumption may be a serious limitation to understanding attitudinal structure (7, 18).
Horowitz (11) has suggested an attitudinal ride-sharing model that allows for a noncompensatory relation: "Is it possible that evaluations interact among themselves so that a negative evaluation can reduce the intention to car pool regardless of the magnitude of the positive evaluation?"
To describe the model, assume that each individual is rated as either high or low on each of the two factors, according to whether his or her respective factor scores are higher or lower than the average score. The continuum could be divided into more than two parts, but this is sufficient for model testing. Then, each group (car poolers and solo drivers) will be segmented into four subgroups according to the combination of the two factors, as shown in Figure 7.
Consideration of the meaning of the two factors in relation to ride sharing and solo driving leads to the following interpretation of the cells. Cell [ 1, 2) includes those individuals who are more positive than the average toward ride sharing along both factors, cell [2, 1) includes those individuals who are negative toward ride sharing on both factors, and the other two cells include the obvious combinations of positive and negative factors scores.
By following the notation introduced above and taking the position that affect is determined by the factors T and C, a linear-interactive model for affect is
(i)
':. .. II where
fl TRAFFIC PROBLEMS
POLLUTION
Figure 3. Affect toward ride sharing.
LIKE EXTREMELY
LIKE MODERATELY
LIKE SLIGHTLY
NEITHER LI KE NOR DISLIKE
DISLIKE SLIGHTLY
---- CARPOOLERS (N=321) 111111111111111 SOLO DRIVERS ( N=382)
llUlll l ll
IUltUI ........ 11111111 11111111 -........ ......... -· ........ n1uu1 iUlllU 1111111 --Ullllll Ullltl II
DISLIKE • MODERATELY lltlltU
DISLIKE .. EXTREMELY lllllllt
0
1111111 1111111
11111111 11111111 1111111
10 15 20 25
PERCENT
30 35 40 45
=individual k's a;(fect toward ridesharing, where his or her T-factor score is i (low, high) and his or her C-factor score is j (low, high),
Figure 4. Intention to car pool for solo drivers.
DEFrnITEL Y ~ !HLL
VERY LIKELY ._ r1 =1176
SOMEWHAT ..... LIKELY
CANNOT .._ SAY
SOMEWHAT --UNLIKELY
VERY UNLIKELY
DEFINITELY IHLL NOT
0 10 20 30 40 50 60
PERCErlT

µ =mean affect over all four cells, T1 = contribution of factor T to affect at level i, CJ = contribution of factor C to affect at level j,
'YIJ =interaction between T1 and CJ levels, and fiJk =individual k's error in cell [i, j].
An ordinary 2 x 2 analysis of variance (ANOV A) can be used to test the model. The use of the ANOVA depends on the statistical assumption that the fiJk are independent random variables normally distributed with constant variance. In the present application of ANOVA, these statistical assumptions are not a problem because the number of observations is relatively large. Use of the ANOVA requires independence between observations. Hence, it is necessary that different individuals belong in different cells. This assumption is clearly satisfied in the present design. The ANOVA allows simple, powerful tests for each of the T1 , CJ, and YtJ terms separately.
A similar model can be written for intention, i.e.,
(2)
5
where 11 Jk denotes individual k's intention to share a ride and the other terms are analogous to those in the affect model but refer to intention.
Test of Affect Model
Each respondent of the survey was assigned to one of the four cells according to his or her T and C-factor scores.
Figure 8 shows the affect means for each cell for solo drivers and car poolers separately and has two main results. First, the time-convenience factor, i.e, whether a respondent is categorized as low or high on T, is related to his or her affect to a larger extent than is the Cfactor. This is seen by a comparison of the slopes of the lines and the distances between the lines for the car poolers and solo drivers. Second, that the lines are nonparallel suggests an interaction between the factors, especially for solo drivers.
Table 1 summarizes the test of the ANOVA model. The contributions of T and C are significant for both grol-1.ps, but the F-1·atios for Tare markedly higher than those for C. The internction term (T x C) is significant
Figure 5. Cognitions: solo drivers. NEGATIVE COGNITIONS SOLO DRIVERS (N=382)
I VERY LOW 1 2 3 4 5 6 7 VERY HIGH I I I I
61 I - CONVENIENT
" I
l b2 .- RELIABLE I ..
63 PLEASANT I I -
_j 64 ·- COMFORTABLE
I I l
' 65
\ SAVES TIME
RIDE SHARING DRIVE ALONE
POSITIVE COGNITIONS SOLO DRIVERS (N=382)
VERY LOW 2 3 4
iiQ1:E1ii ' RIDESHARING DRIVE ALONE
VERY HIGH
EXPENSIVE
ENERGY CONSUMING
TRAFFIC PROBLEMS
POLLUTION
Figure 6. Cognitions: car poolers. NEGATIVE COGNITIONS CARPOOLERS (N=323)
l VERY LOW 2 4 5 VERY HIGH
---.---- CONVENIENT
RELIABLE
-->-- PLEASANT
--+-- COMFORTABLE
__....,_ _ __.__ SAVES TIME
RIDESHARING DRIVE ALONE
POSITIVE COGNITIONS CARPOOLERS (N=323)
VERY LOW 4 6
:~,ij± (' t---t--- i--<IJ+-i-68 ·.
,_____, _ ___._..,._
RIDESHARING DRIVE ALONE
VERY HIGH
EXPENSIVE
ENERGY CONSUMING
TRAFF! C PROBLEMS
POLLUTION
6
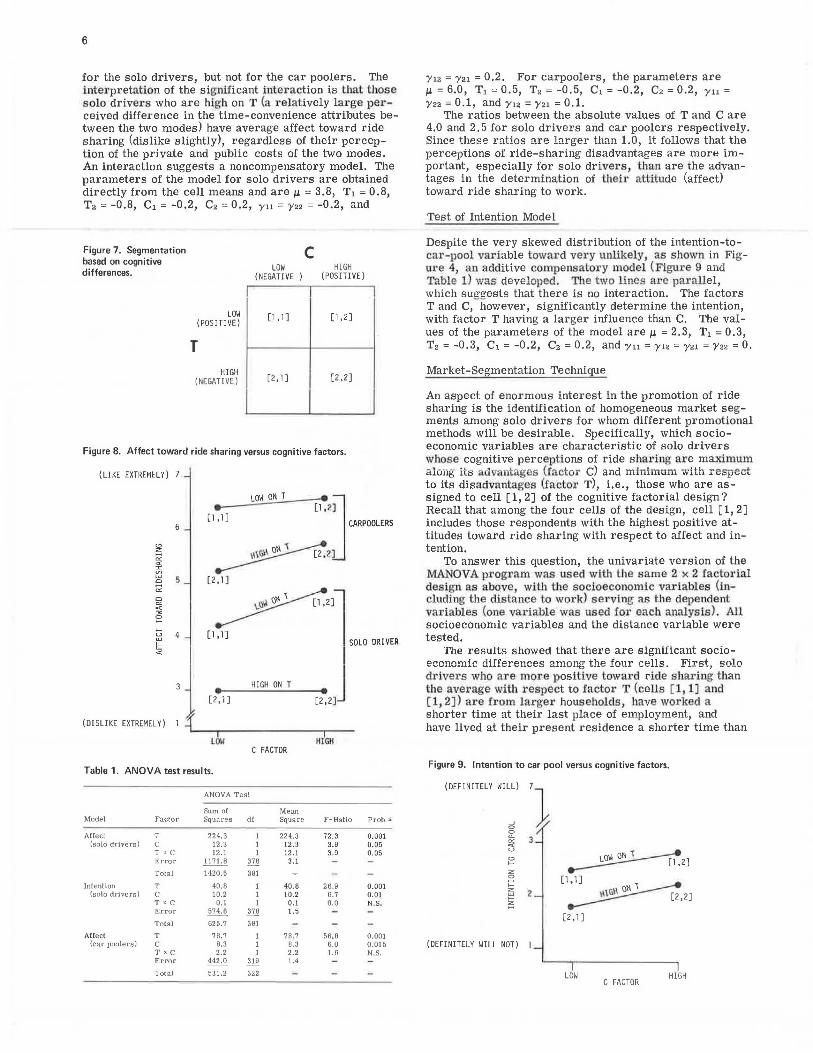
for the solo drivers, but not for the car poolers. The interpretation of the significant interaction is that tllose solo drivers who are high on T (a relatively large perceived difference in the time-convenience attributes between the two modes) have average affect toward ride sharing (dislike slightly), regardless of their perception of the private and public costs of the two modes. An interaction suggests a noncompensatory model. The parameters of the model for solo drivers are obtained directly from the cell means and areµ = 3.8, T1 = 0.8, T2 = -0.8, C1 = -0.2, C2 = 0.2, y11 = y22 = -0.2, and
Figure 7. Segmentation based on cognitive differences.
LOW (POSITIVE)
T
HIGH (NEGATI VE)
c LOW HI GH
(NEGATIVE (POSITIVE)
[l,l] [l,2]
[2, l] [2 ,2]
Figure 8. Affect toward ride sharing versus cognitive factors.
(LI KE EXTREMELY) 7
LOW ON T .. ] • [l ,2]
[ l 'l J CARPOOLERS
~2] [2' l]
"' ~ °" "' ~ 5 c
~" °" c
°" « 3 0 f-
f-u
SOLO DRIVER [l 'l]
""' tt «
HIGH ON T
[2' l] [2 ,2]
(DISLIKE EXTREMELY) l ~ I
HfGH LOW C FACTOR
Table 1. ANOVA test results.
ANOVA Test
Sum of Mean Model Factor Squares di Squa re F-Ratio Prob :i
Affect T 224.3 I 22 4.3 72.3 0.001 (solo drivers) c 12.3 1 12.3 3.9 0.05
T x C 12.1 1 12.1 3.9 0.05 Error 1171.8 37B 3.1
Total 1420.5 381
Intention T 40.8 1 40.8 26.9 0.001 (solo drivers) c 10.2 1 10.2 6.7 0.01
T xC 0.1 1 0.1 0.0 N.S. Error 574.6 378 1.5
Total 625.7 381
Affect T 78.7 1 78.7 56,8 0.001 (car poolers) c 8.3 1 8.3 6. 0 0.015
T x c 2.2 1 2.2 1 .6 N.S. Error 442 .0 1!.ll_ 1.4
Total 531.2 322
'}'12 = y21 = 0.2. For carpoolers, the parameters are µ = 6.0, T1 = 0.5, T2 = -0.5, C1 = -0.2, C2 = 0.2, yu = Y22 = 0.1, and Y12 = y21 = 0.1.
The ratios between the absolute values of T and C are 4.0 and 2. 5 for solo drivers and car poolers respectively. Since these ratios are larger than 1.0, it follows that the perceptions of ride-sharing disadvantages are more important, especially for solo drivers, than are the advantages in the determination of their attitude (affect) toward ride sharing to work.
Test of Intention Model
Despite the very skewed distribution of the intention-tocar- pool variable toward ve1·y unlikely, as shown in Figui·e 4, au additive compensatory model (Figure 9 and Table 1) was developed. The two lines ru·e pa1·allel, which suggests that there is no interaction. The factors T and C, however, significantly determine the intention, with factor T having a larger influence than C. The values of the parameters of the model are µ = 2.3, T1 = 0.3, T2 = -0.3, C1 = -0.2, C2 = 0.2, and yu = y12 = y21 = Y22 = 0.
Market-Segmentation Technique
An aspect of enormous interest in the promotion of ride sharing is the identification of homogeneous market segments among solo drivers for whom different promotional methods will be desirable. Specifically, which socioeconomic variables are characteristic of solo drivers whose cognitive perceptions of ride sharing are maximum alo1ig its ~ldvantages {factor C) and minimum ·~vith respect to its disadvantages (factor T), i.e., those who are assigned to cell [ 1, 2] of the cognitive factorial design? Recall that among the four cells of the design, cell [ 1, 2] includes those respondents with the highest positive attitudes toward ride sharing with respect to affect and intention.
To answer this question, the univariate version of the MANOVA program was used with the same 2 x 2 factorial design as above, with the socioeconomic variables (including the distance to work) serving as the dependent val'iables (one variable was used for each analysis). All socioeconomic variables and the distance variable were tested.
The results showed that there are significant socioeconomic differences among the four cells. First, solo drivers who are more positive toward ride sharing than the average with respect to factor T (cells [ 1, 1] and [1, 2J) are Irom lai·ger households, have worked a shorter time at their last place of employment, and have lived at their present residence a shorter time than
Figure 9. Intention to car pool versus cognitive factors.
(DEFINITELY WILL)
~2] [l, 1] 1
~,2] 2
(2, l J
(DEFINITELY WILL NOT) l
LOW HIGH C FACTOR

the other solo drivers. Second, those solo drivers who are more positive toward ride sharing with respect to factor C (cells [l, 2) and [2, 2J) typically live farther from their work, are males from households with more driver's licenses, and have higher educations, incomes, and occu1>ation levels than the other solo drivers.
The picture of the ride-sharing ta1·get market, i.e., cell [ 1, 2), that emerges is one that includes employed individuals who have high socioeconomic status, as measured by education, income, and occupation; are from relatively large households; and have worked and lived at their last places of employment and residence respectively for a shorter time than the other solo drivers. These types of individuals are sensitive to the private and public costs of solo driving. A ride-sha1•ing promotional campaign could address this segment of the population with issues related to both factors T and C, but the optimal strategy toward other types of commuters, the large majority of solo d1·ivers, should be concentrated on issues related to the time-convenience factor.
CONCLUSIONS
1. For individuals who travel to work by private automobile, demographic and travel characteristics are poor indicators and predictors of the choice between driving alone and ride sharing.
2. The study of attitudes toward ride sharing and driving alone can provide results that relate to the question of how to develop ride-sharing strategies.
3. Solo drivers generally have a neutral attitude toward ride sharing, and a change in attitude might be achieved by proper promotional techniques.
4. With the exception of individuals having a relatively high socioeconomic status, appeals based on public-interest issues of energy, traffic, and air quality have little chance of changing attitudes toward ride sharing.
5. The perce1>tion of drivers toward time loss and the characteristics of convenience and reliability about ride sharing would have to change before their travel behavior would change. Perceptions of economic advantages have only minor roles in the determination of behavioral predispositions toward ride sharing.
6. To override negative perceptions toward time loss, convenience, and reliability about ride sharing, campaigns should emphasize positive aspects related to those characteristics that are unknown to the general public: The time spent for travel t o work in a car pool as a passenger can be used for l'eading, sleeping, relaxing, or any other i·ecreational activity that does not requil'e much space and equipment. This type of approach towa1·d the use of travel time has a good chance of success because of the increasing public awareness of the benefits of relaxation. Careful study is required to find ways to promote these ideas among both solo drivers and car poolers. A major component in the perceived inconvenience of car pooling is the difficulty of establishing contact with potential pool mates. These difficulties could be overcome by assistance in taking the initiative to form car pools and organization of car poolers on a face-to-face basis at U1e place of work. Ride-sharing promotion could use information about the longevity of car pools and the satisfaction of car poolers with the punctuality (reliability) of their pool mates.
REFERENCES
1. B. Barkow. Car Pooling, the Worm's Eye View. Paper presented at the Annual Convention of the American Psychological Association, Washington, D.C., 1976.
7
2. M. E. Ben-Akiva and T. J. Atherton. ChoiceModel Predictions of Car-Pool Demand: Methods and Results. Paper presented at the Annual Convention of the American Psychological Association, Washington, D. C., 1976.
3. W. L. Berry. On the Economic Incentives for Commuter Car Pooling. Graduate School of Business Administration, Harvard Univ., Cambridge, Mass., PhD thesis, 1975.
4. D. P. Blankenship. utilizing Focus Group Dynamics to Ascertain Rules for Social Interaction for Car Poolers. Orange County Transit District, Santa Ana, Calif., 1975.
5. An Evaluation of the SPRPC Car-Pool Public-Transit Program. School of Urban and Public Affairs, Carnegie-Mellon Univ.; Southwestern Pennsylvania Regional Planning Commission, Pittsburgh, 1975.
6. F. W. Davis and others. Ride Sharing and the Knoxville Commuter. Office of Environmental Affairs, U.S. Department of Transportation, Rept. TCUT-1-75, 1975.
7. G. S. Day. Evaluating Models of Attitude Structures. Journal of Marketing Research, Vol. 9, 1972, pp. 279-286.
8. K. J. Dueker and I. P. Levin. Car Pooling: Attitudes and Participation. Paper presented at the Annual Convention of the American Psychological Association, Washington, D. C., 1976.
9. M. Fishbein. Attitude and the Prediction of Behavior. In Readings in Attitude-Theory Measurement (M. Fishbein, edJ, Wiley, New York, 1967.
10. R. Herman and T. Lam. Car Pools at a Large Suburban Technical Center. Transportation Engineering Journal, Vol. 101, 1975, pp. 311-319.
11. A. D. Horowitz. An Attitudinal Model of CarPooling Behavior. General Motors Research Laboratories, Res. Publ. GMR-1969, Aug. 1975.
12. A. D. Horowitz and J. N. Sheth. Ride Sharing to Work: A Psychosocial Analysis, General Motors Research Laboratories, Res. Publ. GMR-2216, Jan. 1977.
13. J. A. Howard and J. N. Sheth. The Theory of Buyer Behavior. Wiley, New York, 1969.
14. G. Katona. Psychological Economics. Elsevier, New York, 1975.
15. D. C. Kendall. Car Pooling: Status and Potential. Transportation Systems Center, U.S. Department of Transportation, Cambridge, Mass., Final Rept. DOT-TSC-OST-75-23, June 1975,
16. J. B. Margolin and M. R. Misch. Incentives and Disincentives to Ride Sharing. Paper presented at the Annual Convention of the American Psychological Association, Washington, D.C., 1976.
17. D. F. Morrison. Multivariate Statistical Analysis. McGraw-Hill, New York, 1967.
18. P. S. Raju and J. N. Sheth. Nonlinear, Noncompensatory Relationships in Attitude Research. College of Commerce and Business Administration, Univ. of Illinois, Working Paper 176, April 1974.
19. M. J. Rosenberg. A Structural Theory of Attitude Dynamics. Public Opinion Quarterly, Vol. 24, 1960, pp. 319-340.
20. S. Rosenbloom and N. J. Shelton. Car-Pool and Bus Matching Program for the University of Texas at Austin. Graduate Program in Community and Regional Planning, Univ. of Texas at Austin, Res. Rept. 11, Sept. 1974.
21. J. N. Sheth. A Field Study of Attitude Structure and the Attitude-Behavior Relationship. In Models of Buyer Behavior (J. N. Sheth, ed.J, Harper and Row, New York, 1974.
22. A Study of Techniques to Increase Commuter-

8
Vehicle Occupancy on the Hollywood Freeway. Alan M. Voorhees and Associates, Nov. 1973.
23. A. M. Zerega and R. B. Ross. Application of Conjoint Measurement Techniques in Evaluating Car-Pooling Policies. Paper presented at the An-
nual Convention of the American Psychological Association, Washington, D.C., 1976.
24. D. Yankelovich. New Criteria for Market Segmentation. Harvard Business Review, Vol. 42, 1964, pp. 83-90.
Priority Lanes on Urban Radial Freeways: An Economic-Simulation Model Kenneth A. Small, Department of Economics and Transportation Program,
Princeton University
A simulation of the effects of opening a priority lane on a commuteroriented freeway is carried out by combining a simple deterministic queuing model of traffic flow with a disaggregate model of modal choice. This pennits i'teretive determination of a supply-demand equilibri1Jm and a precise definition of the resulting benefi ts within the framework of cost-benefit analysis. By varying the assumptions para· metrically , illustrative results for a wide variety of cases are obtained. The benefits are substantial for those cases where initial congestion is heavy. Th& combination of the rigorously letived o!Jje1:tive lu11ct ion and the model of modal choice constitutes a proposed methodology for analyzing highway management policies that could be adapted for use in more detailed engineering studies of particular facilities. The results given here, although derived from a highly simplified model of traffic flow over a peak period, suggest the results that can be expected from such applications.
Our understanding of priority-lane operations and carpooling behavior has grown rapidly in recent years because of the urgent need for public-policy guidelines . Sop his ticated h'affic-flow models (10, 13 14) 11ow pern1it detailed investigation of patterns oITr fili.c f low under various circumstances. A flurry of activity among demand modelers has produced a number of disaggregate modal-choice models that predict the response of voluntary car pooling to various incentives (Ben-Akiva and Atherton, in a paper in this Record).
Each of these sides of the analysis depends on the other: Traffic-flow models make predictions that are contingent on the volume and mix of traffic, and forecasts from demand models must take as given the costs and levels of service encountered by the users of each mode. The use of either procedure alone may be valid only within an unknown and possibly narrow range of conditions.
Therefore, the need is for an integrated model that determines levels of service and levels of demand simultaneously. Such a model consists conceptually of nothing more than that most basic tool of microeconomic analysis, the supply-demand equilibrium. The demand side is provided by the demand-forecasting model, which predicts the quantities of var ious types of highway s ervices that individuals will choose, given their prices in terms of monetary cost and level of service. The traffic-flow model and the cost information determine the price that must be paid by us ers to obtain a certain volume of peakhour highway services and tbus constitute the supply side of the equilibrium.
This paper describes such a model and demonstrates its usefulness by analyzing the impact of a priority lane on an idealized i·adial freeway subject to peak- period congestion by commuters. The model and res ults are described more fully by Small (12).
A secondary pu1·pos e is to sliOW that the incorporation of a disaggregate de mand model fa cilitat es a clear and theoretically rigorous definition of user benefits that is
consistent with accepted principles of cost-benefit analysis and to calculate these benefits for the policies considered to form some generalizations about the desirability of priority lanes as public policy.
The model focuses on the supply of and demand for the services of a section of radial freeway during the morning and afternoon peak commuting periods. Congestion is explicitly modeled only on the freeway section itself. All characteristics of the access and distribution networks are assumed to remain constant and <inter the model as determinants of demand for the freeway study section.
SUPPLY MODEL
The idealized highway section to b e considered is a 10-km (6-mile) length of freeway with no e ntrance or exit ramps t hat is used only by commuter s . All access to t his linehaul section is at one end and all egress is at the other, with the direction reversing from morning to evening. The collection of commuters at the access end and their distribution at the egress end take place on a variety of roads that may include extens ions of the st udy section. [Access and egress are described in a disaggregate manner in the next section of the paper; this section describes traffic flow and cost assumptions for the 10-km (6-mile) section itself.)
Traffic flow on this line-haul section is described by assuming a uniform speed of Sn km/ h (0.62S0 mph), except for the delay caused by deterministic queuing behind a a single botUeneck of capacity C vehicles / h. That is, if t1 is the time of day at which traffic volwne [D(t)] entering the freeway first exceeds C, then travel time (T) (in minutes) over the section for a vehicle entering at a later time t, providing the queue does not dissipate prior to t, is
T(t) = (600/S0 ) + (60/C) f t [D(t ') - C) dt ,, (1)
In terms of queuing theory, the integral gives the queue length in vehicles, and (60 / C) is the service time in minutes.
This model has been used by May and Keller (9) to analyze the San Francisco-Oakland Bay Bridge. To apply it to the typical radial freeway may seem a bit more tenuous, but it duplicates remarkably well the actual travel times observed during the aft er noon rush hour on an 18-km (11-mile) section of 1-80 on the eastern side of San Francisco Bay. This study used the results of an origin-destination study to compute net demands at 15-min intervals for a particular three-lane subsection that appears to be the chief bottleneck (!_, pp. 8 and B-2).